


Languages
Pages
Legal

U.S. GEOLOGICAL SURVEY
Water-Resources Investigations Report
Water Quality in Alluvial Aquifers of theSouthern Rocky Mountains PhysiographicProvince, Upper Colorado River Basin,Colorado, 1997
By Lori E. Apodaca and Jeffrey B. Bails
Denver, Colorado2000
99 –4222
U.S. DEPARTMENT OF THE INTERIORBRUCE BABBITT, Secretary
U.S. GEOLOGICAL SURVEY
Charles G. Groat, Director
The use of firm, trade, and brand names in this report is for identification purposes only and doesnot constitute endorsement by the U.S. Geological Survey.
For additional information write to: Copies of this report can be purchased
U.S. Geological SurveyInformation ServicesBox 25286Federal CenterDenver, CO 80225
from:
District ChiefU.S. Geological SurveyBox 25046, Mail Stop 415Denver Federal CenterDenver, CO 80225–0046
III
The mission of the U.S. Geological Survey (USGS) is to assess the quantity and quality of the earthresources of the Nation and to provide information that will assist resource managers and policymakers atFederal, State, and local levels in making sound decisions. Assessment of water-quality conditions and trends isan important part of this overall mission.
One of the greatest challenges faced by water-resources scientists is acquiring reliable information thatwill guide the use and protection of the Nation’s water resources. That challenge is being addressed by Federal,State, interstate, and local water-resource agencies and by many academic institutions. These organizations arecollecting water-quality data for a host of purposes that include: compliance with permits and water-supplystandards; development of remediation plans for a specific contamination problem; operational decisions onindustrial, wastewater, or water-supply facilities; and research on factors that affect water quality. An additionalneed for water-quality information is to provide a basis on which regional and national policy decisions can bebased. Wise decisions must be based on sound information. As a society we need to know whether certain typesof water-quality problems are isolated or ubiquitous, whether there are significant differences in conditionsamong regions, whether the conditions are changing over time, and why these conditions change from place toplace and over time. The information can be used to help determine the efficacy of existing water-quality policiesand to help analysts determine the need for and likely consequences of new policies.
To address these needs, the Congress appropriated funds in 1986 for the USGS to begin a pilot program inseven project areas to develop and refine the National Water-Quality Assessment (NAWQA) Program. In 1991,the USGS began full implementation of the program. The NAWQA Program builds upon an existing base ofwater-quality studies of the USGS, as well as those of other Federal, State, and local agencies. The objectives ofthe NAWQA Program are to:
•Describe current water-quality conditions for a large part of the Nation’s freshwater streams, rivers,and aquifers.
•Describe how water quality is changing over time.•Improve understanding of the primary natural and human factors that affect water-quality conditions.
This information will help support the development and evaluation of management, regulatory, and monitoringdecisions by other Federal, State, and local agencies to protect, use, and enhance water resources.
The goals of the NAWQA Program are being achieved through ongoing and proposed investigations of 59of the Nation’s most important river basins and aquifer systems, which are referred to as study units. These studyunits are distributed throughout the Nation and cover a diversity of hydrogeologic settings. More than two-thirdsof the Nation’s freshwater use occurs within the 59 study units, and more than two-thirds of the people served bypublic water-supply systems live within their boundaries.
National synthesis of data analysis, based on aggregation of comparable information obtained from thestudy units, is a major component of the program. This effort focuses on selected water-quality topics usingnationally consistent information. Comparative studies will explain differences and similarities in observedwater-quality conditions among study areas and will identify changes and trends and their causes. The first topicsaddressed by the national synthesis are pesticides, nutrients, volatile organic compounds, and aquatic biology.Discussions on these and other water-quality topics will be published in periodic summaries of the quality of theNation’s ground and surface water as the information becomes available.
This report is an element of the comprehensive body of information developed as part of the NAWQAProgram. The program depends heavily on the advice, cooperation, and information from many Federal, State,interstate, Tribal, and local agencies and the public. The assistance and suggestions of all are greatly appreciated.
FOREWORD
Robert M. HirschChief Hydrologist
CONTENTS V
CONTENTS
Foreword ................................................................................................................................................................................ IIIAbstract.................................................................................................................................................................................. 1Introduction............................................................................................................................................................................ 2
Purpose and Scope ....................................................................................................................................................... 2Acknowledgments ....................................................................................................................................................... 2
Description of Study Unit ...................................................................................................................................................... 3Study Design and Methods .................................................................................................................................................... 4
Well Selection .............................................................................................................................................................. 4Well Description .......................................................................................................................................................... 6Sample Collection and Analysis .................................................................................................................................. 6Water-Quality Standards and Health Advisories ......................................................................................................... 8Statistical Methods....................................................................................................................................................... 8
Quality-Control Samples and Quality Assurance of the Data ............................................................................................... 8Ground-Water Quality ........................................................................................................................................................... 14
Field Parameters .......................................................................................................................................................... 14Major Ions.................................................................................................................................................................... 17Nutrients and Dissolved Organic Carbon .................................................................................................................... 18Trace Elements and Radon .......................................................................................................................................... 20Pesticides ..................................................................................................................................................................... 21Volatile Organic Compounds....................................................................................................................................... 22Bacteria and Methylene Blue Active Substances ........................................................................................................ 23
Summary................................................................................................................................................................................ 23References Cited .................................................................................................................................................................... 24Appendix................................................................................................................................................................................ 27
FIGURES
1. Map showing location of the Upper Colorado River Basin study unit and physiographic provinces ...................... 32. Map of alluvial deposits and sampling-site locations in the Southern Rocky Mountains physiographic province.. 53. Boxplots showing distribution of (A) chloride, (B) sulfate, (C) dissolved-solids, and (D) nitrate concentrations
by land-use/land-cover classifications for the drinking-water wells ........................................................................ 184. Map showing dissolved-solids concentrations for sites sampled in the Southern Rocky Mountains
physiographic province ............................................................................................................................................. 195. Trilinear diagrams showing major-ion composition of ground-water samples collected in the Southern
Rocky Mountains physiographic province................................................................................................................ 206. Graphs showing distribution of (A) iron and (B) manganese concentrations by land-use/land-cover
classifications for the drinking-water wells............................................................................................................... 217. Map showing radon concentrations for sites sampled in the Southern Rocky Mountains physiographic province . 22
TABLES
1. Information for ground-water sites sampled in the Southern Rocky Mountains physiographic province,1997 ......................................................................................................................................................................... 7
2. Summary statistics for constituents detected in the blank quality-control samples and in the environmentalsamples .................................................................................................................................................................... 9
3. Summary statistics of replicate- and field-spike quality-control samples .............................................................. 104. Percent recoveries and median concentrations for individual constituents in the pesticide and volatile organic
compound field spikes ............................................................................................................................................. 115. Summary statistics for water-quality properties and constituents analyzed or measured for all sites sampled
in the Southern Rocky Mountains physiographic province .................................................................................... 15
VI CONTENTS
CONVERSION FACTORS
Multiply By To obtain
foot (ft) 0.3048 metergallon (gal) 3.78 liter
gallon per minute (gal/min) 0.06308 liter per secondinch per year (in/yr) 25.4 millimeter per year
picocuries per liter (pCi/L) 0.3125 tritium units (TU)pound (lb) 0.4536 kilogram
pound per square inch (lb/in2) 6.895 kilopascal
square mile (mi2) 2.59 square kilometer
Degree Celsius (°C) may be converted to degree Fahrenheit (°F) by using the following equation:°F = 9/5 (°C) + 32.
Degree Fahrenheit (°F) may be converted to degree Celsius (°C) by using the following equation:°C = 5/9 (°F –32).
ADDITIONAL ABBREVIATIONS:
cols/100 mL colonies per 100 millilitersDOC dissolved organic carbonDWA drinking water advisoryHA health advisoryL literMCL maximum contaminant levelMCLG maximum contaminant level goalMBAS methylene blue active substancesµS/cm microsiemens per centimeter at 25 degrees Celsiusmg/L milligram per litermL milliliterµg/L microgram per literNTU nephelometric turbidity unitµm micrometerPMCL proposed maximum contaminant levelSMCL secondary maximum contaminant levelVOC volatile organic compoundas N as quantified as measured nitrogenas P as quantified as measured phosphorus
Abstract 1
Water Quality in Alluvial Aquifers of theSouthern Rocky Mountains Physiographic Province,Upper Colorado River Basin, Colorado, 1997By Lori E. Apodaca and Jeffrey B. Bails
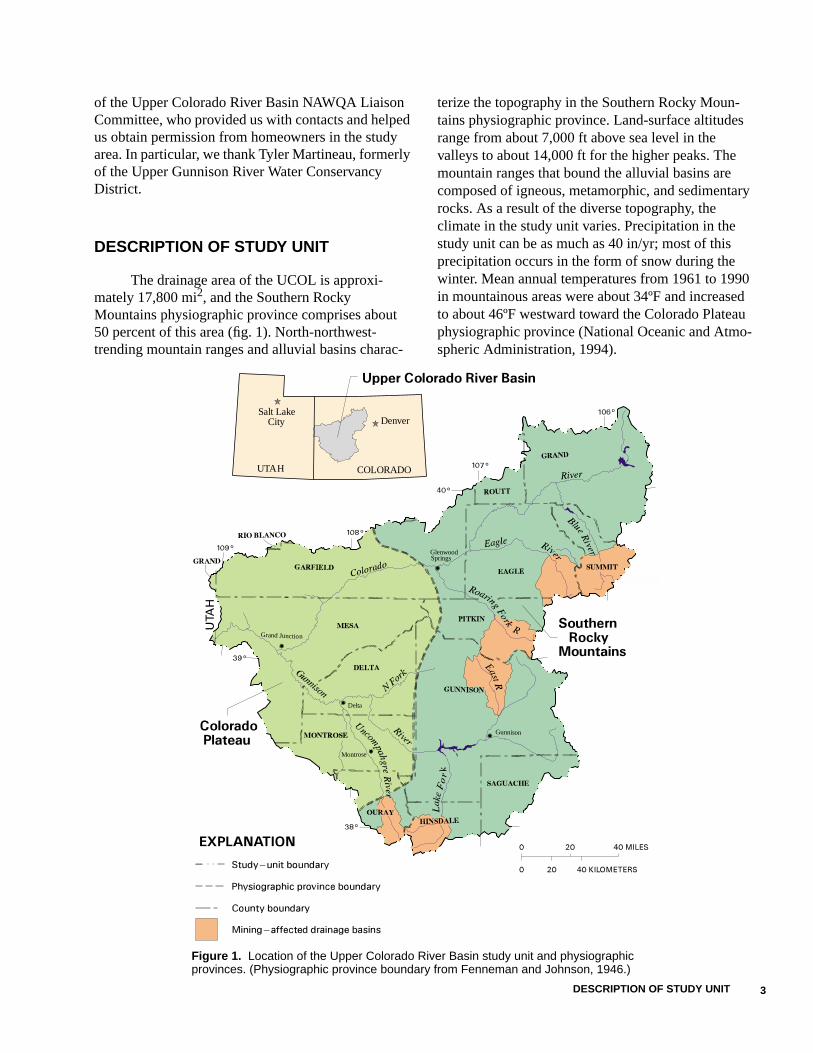
ABSTRACT
Water-quality samples were collected in thesummer of 1997 from 45 sites (43 wells and 2springs) in selected alluvial aquifers throughoutthe Southern Rocky Mountains physiographicprovince of the Upper Colorado River Basin studyunit as part of the U.S. Geological SurveyNational Water-Quality Assessment Program. Theobjective of this study was to assess the water-quality conditions in selected alluvial aquifers inthe Southern Rocky Mountains physiographicprovince. Alluvial aquifers are productive aqui-fers in the Southern Rocky Mountains physio-graphic province and provide for easily developedwells. Water-quality samples were collected fromareas where ground water is used predominantlyfor domestic or public water supply. Twenty-threeof the 45 sites sampled were located in or nearmining districts. No statistical differences wereobserved between the mining sites and sites notassociated with mining activities for the majorityof the constituents analyzed. Water samples wereanalyzed for major ions, nutrients, dissolvedorganic carbon, trace elements, radon-222, pesti-cides, volatile organic compounds, bacteria, andmethylene blue active substances. In addition,field parameters consisting of water temperature,specific conductance, dissolved oxygen, pH,turbidity, and alkalinity were measured at allsites.
Specific conductance for the ground-watersites ranged from 57 to 6,650 microsiemens percentimeter and had higher concentrations
measured in areas such as the northwestern part ofthe study unit. Dissolved oxygen ranged from 0.1to 6.0 mg/L (milligrams per liter) and had amedian concentration of 2.9 mg/L. The pH fieldvalues ranged from 6.1 to 8.1; about 4 percent ofthe sites (2 of 45) had pH values outside the rangeof 6.5 to 8.5 and so did not meet the U.S. Environ-mental Protection Agency secondary maximumcontaminant level standard for drinking water.About 5 percent (2 of 43) of the samples exceededthe U.S. Environmental Protection Agencyrecommended turbidity value of 5 nephelometricturbidity units; one of these samples was from amonitoring well.
The U.S. Environmental Protection Agencysecondary maximum contaminant levels fordissolved solids, sulfate, iron, and manganesewere exceeded at some of the sites. Higherdissolved-solids concentrations were detectedwhere sedimentary rocks are exposed, such as inthe northwestern part of the Southern RockyMountains physiographic province. The dominantwater compositions for the sites sampled arecalcium, magnesium, and bicarbonate. However,sites in areas where sedimentary rocks areexposed and sites located in or near mining areasshow more sulfate-dominated waters. Nutrientconcentrations were less than the U.S. Environ-mental Protection Agency drinking-water stan-dards. Only one site had a nitrate concentrationgreater than 3.0 mg/L, a level indicating possibleinfluence from human activities. No significantdifferences among land-use/land-cover classifica-tions (forest, rangeland, and urban) for drinking-
2 Water Quality in Alluvial Aquifers of the Southern Rocky Mountains Physiographic Province, Upper Colorado River Basin,Colorado, 1997
water wells (42 sites) were identified fordissolved-solids, sulfate, nitrate, iron or manga-nese concentrations. Radon concentrations werehigher in parts of the study unit where Precam-brian rocks are exposed. All radon concentrationsin ground water exceeded the previous U.S. Envi-ronmental Protection Agency proposed maximumcontaminant level for drinking water, which hasbeen withdrawn pending further review.
Pesticide detections were at concentrationsbelow the reporting limits and were too few toallow for comparison of the data. Eight volatileorganic compounds were detected at six sites; allconcentrations complied with U.S. EnvironmentalProtection Agency drinking-water standards.Total coliform bacteria were detected at six sites,but no Escherichia coli (E. coli) was detected.Methylene blue active substances were detected atthree sites at concentrations just above thereporting limit. Overall, the water quality in theSouthern Rocky Mountains physiographic prov-ince is suitable for most uses, but natural andhuman factors affect the water quality.
INTRODUCTION
In 1991, the U.S. Geological Survey (USGS)began full implementation of the National Water-Quality Assessment (NAWQA) Program. The UpperColorado River Basin (UCOL) was one of the 59 studyunits selected for assessing the status and trends inwater quality and relating these to the natural andhuman factors that can affect the water quality(Gilliom and others, 1995). One component of theNAWQA ground-water sampling efforts is the study-unit survey. This survey is designed to assess the waterquality in major aquifer systems by sampling pre-existing wells and analyzing for a wide variety ofchemical constituents. In assessing the ground-water-quality conditions in the UCOL study unit, the impor-tant aquifers for present and future uses were identi-fied. Alluvial aquifers were selected in the SouthernRocky Mountains physiographic province becauseground water is an important drinking-water resourcein this physiographic province. Alluvial aquifers in theUCOL study unit are productive and are presentthroughout most of the valleys in the Southern Rocky
Mountains physiographic province. Forty-five ground-water sampling sites were randomly selected in thestudy unit: 29 preexisting wells in alluvial aquifers in avariety of land uses (which includes sites in or nearmining districts), 14 preexisting wells in alluvial aqui-fers selected specifically in or near mining districtsthroughout the Southern Rocky Mountains physio-graphic province, and 2 springs. Historical ground-water-quality data are limited in this area; therefore,the data collected from this study help to establishbaseline conditions of the ground-water quality inselected areas and can be used for future comparisons.
Purpose and Scope
This report presents data on ground-water-quality conditions in selected alluvial aquifers in theSouthern Rocky Mountains physiographic province ofthe UCOL study unit. The purpose of this study was toassess the ground-water quality in a major aquifersystem in the Upper Colorado River Basin bysampling preexisting wells in a single geologic unit.Ground water in alluvial aquifers was sampled inAugust and September 1997 throughout the SouthernRocky Mountains physiographic province in order toassess water-quality conditions and relate the findingsto natural and human factors that may be affecting theconcentrations. Samples from 45 ground-water sites(preexisting wells and springs) in alluvial aquiferswithin the Southern Rocky Mountains physiographicprovince were analyzed for 10 major ions, 6 nutrients,dissolved organic carbon (DOC), 18 trace elements,radon-222, 47 pesticides, 86 volatile organiccompounds (VOC's), bacteria (total coliform andEsherichia coli), and methylene blue active substances(MBAS). Thirteen of the sites located in or nearmining districts were not sampled for pesticides andVOC’s. In addition to these constituents, field parame-ters consisting of water temperature, specific conduc-tance, dissolved oxygen, pH, turbidity, and alkalinitywere measured.
Acknowledgments
The authors thank the many homeowners andpublic organizations that allowed the USGS to sampletheir wells. Without their cooperation, this studywould not have been possible. We also thank members
3DESCRIPTION OF STUDY UNIT
Grand Junction
Delta
Gunnison
Montrose
SpringsGlenwood
UTAH COLORADO
Salt Lake City Denver
of the Upper Colorado River Basin NAWQA LiaisonCommittee, who provided us with contacts and helpedus obtain permission from homeowners in the studyarea. In particular, we thank Tyler Martineau, formerlyof the Upper Gunnison River Water ConservancyDistrict.
DESCRIPTION OF STUDY UNIT
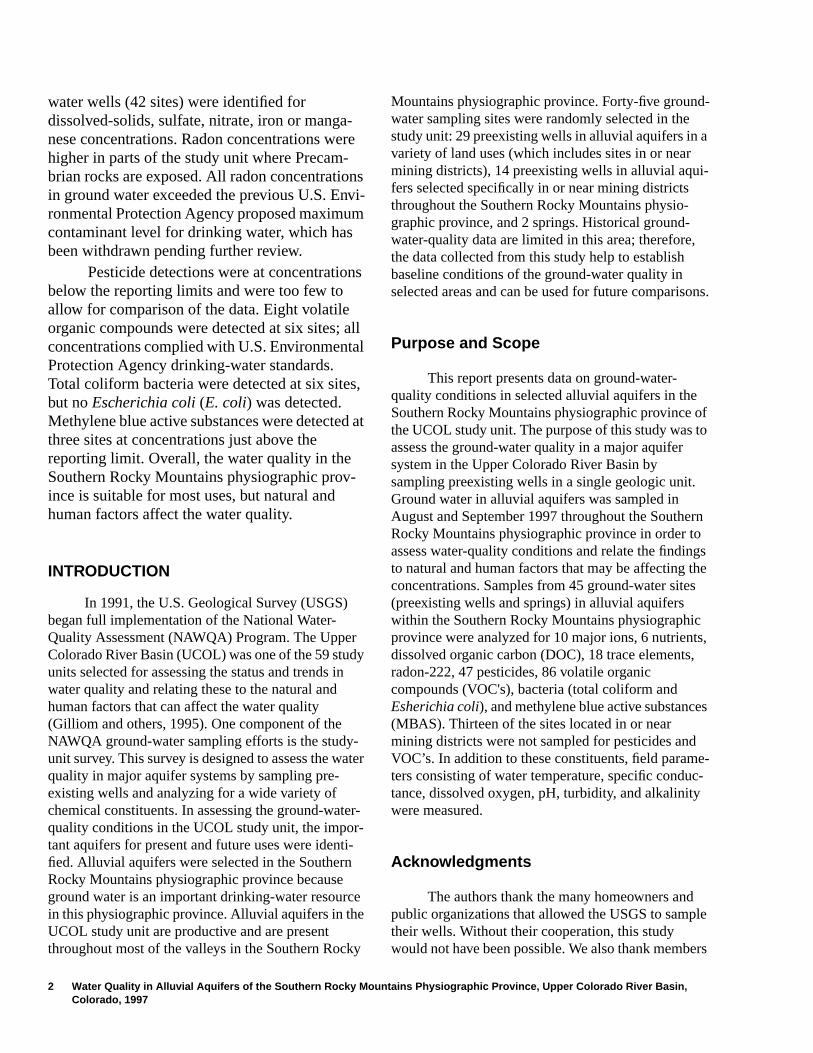
The drainage area of the UCOL is approxi-mately 17,800 mi2, and the Southern RockyMountains physiographic province comprises about50 percent of this area (fig. 1). North-northwest-trending mountain ranges and alluvial basins charac-
terize the topography in the Southern Rocky Moun-tains physiographic province. Land-surface altitudesrange from about 7,000 ft above sea level in thevalleys to about 14,000 ft for the higher peaks. Themountain ranges that bound the alluvial basins arecomposed of igneous, metamorphic, and sedimentaryrocks. As a result of the diverse topography, theclimate in the study unit varies. Precipitation in thestudy unit can be as much as 40 in/yr; most of thisprecipitation occurs in the form of snow during thewinter. Mean annual temperatures from 1961 to 1990in mountainous areas were about 34ºF and increasedto about 46ºF westward toward the Colorado Plateauphysiographic province (National Oceanic and Atmo-spheric Administration, 1994).
Figure 1. Location of the Upper Colorado River Basin study unit and physiographicprovinces. (Physiographic province boundary from Fenneman and Johnson, 1946.)
4 Water Quality in Alluvial Aquifers of the Southern Rocky Mountains Physiographic Province, Upper Colorado River Basin,Colorado, 1997
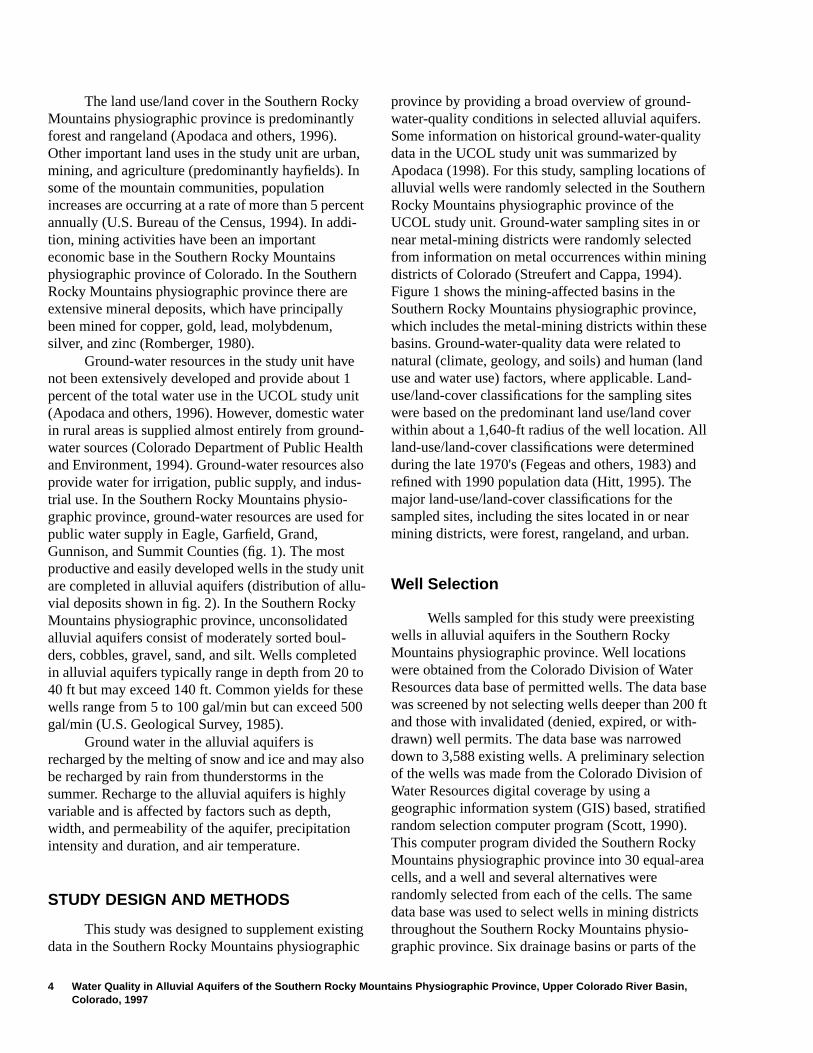
The land use/land cover in the Southern RockyMountains physiographic province is predominantlyforest and rangeland (Apodaca and others, 1996).Other important land uses in the study unit are urban,mining, and agriculture (predominantly hayfields). Insome of the mountain communities, populationincreases are occurring at a rate of more than 5 percentannually (U.S. Bureau of the Census, 1994). In addi-tion, mining activities have been an importanteconomic base in the Southern Rocky Mountainsphysiographic province of Colorado. In the SouthernRocky Mountains physiographic province there areextensive mineral deposits, which have principallybeen mined for copper, gold, lead, molybdenum,silver, and zinc (Romberger, 1980).
Ground-water resources in the study unit havenot been extensively developed and provide about 1percent of the total water use in the UCOL study unit(Apodaca and others, 1996). However, domestic waterin rural areas is supplied almost entirely from ground-water sources (Colorado Department of Public Healthand Environment, 1994). Ground-water resources alsoprovide water for irrigation, public supply, and indus-trial use. In the Southern Rocky Mountains physio-graphic province, ground-water resources are used forpublic water supply in Eagle, Garfield, Grand,Gunnison, and Summit Counties (fig. 1). The mostproductive and easily developed wells in the study unitare completed in alluvial aquifers (distribution of allu-vial deposits shown in fig. 2). In the Southern RockyMountains physiographic province, unconsolidatedalluvial aquifers consist of moderately sorted boul-ders, cobbles, gravel, sand, and silt. Wells completedin alluvial aquifers typically range in depth from 20 to40 ft but may exceed 140 ft. Common yields for thesewells range from 5 to 100 gal/min but can exceed 500gal/min (U.S. Geological Survey, 1985).
Ground water in the alluvial aquifers isrecharged by the melting of snow and ice and may alsobe recharged by rain from thunderstorms in thesummer. Recharge to the alluvial aquifers is highlyvariable and is affected by factors such as depth,width, and permeability of the aquifer, precipitationintensity and duration, and air temperature.
STUDY DESIGN AND METHODS
This study was designed to supplement existingdata in the Southern Rocky Mountains physiographic
province by providing a broad overview of ground-water-quality conditions in selected alluvial aquifers.Some information on historical ground-water-qualitydata in the UCOL study unit was summarized byApodaca (1998). For this study, sampling locations ofalluvial wells were randomly selected in the SouthernRocky Mountains physiographic province of theUCOL study unit. Ground-water sampling sites in ornear metal-mining districts were randomly selectedfrom information on metal occurrences within miningdistricts of Colorado (Streufert and Cappa, 1994).Figure 1 shows the mining-affected basins in theSouthern Rocky Mountains physiographic province,which includes the metal-mining districts within thesebasins. Ground-water-quality data were related tonatural (climate, geology, and soils) and human (landuse and water use) factors, where applicable. Land-use/land-cover classifications for the sampling siteswere based on the predominant land use/land coverwithin about a 1,640-ft radius of the well location. Allland-use/land-cover classifications were determinedduring the late 1970's (Fegeas and others, 1983) andrefined with 1990 population data (Hitt, 1995). Themajor land-use/land-cover classifications for thesampled sites, including the sites located in or nearmining districts, were forest, rangeland, and urban.
Well Selection
Wells sampled for this study were preexistingwells in alluvial aquifers in the Southern RockyMountains physiographic province. Well locationswere obtained from the Colorado Division of WaterResources data base of permitted wells. The data basewas screened by not selecting wells deeper than 200 ftand those with invalidated (denied, expired, or with-drawn) well permits. The data base was narroweddown to 3,588 existing wells. A preliminary selectionof the wells was made from the Colorado Division ofWater Resources digital coverage by using ageographic information system (GIS) based, stratifiedrandom selection computer program (Scott, 1990).This computer program divided the Southern RockyMountains physiographic province into 30 equal-areacells, and a well and several alternatives wererandomly selected from each of the cells. The samedata base was used to select wells in mining districtsthroughout the Southern Rocky Mountains physio-graphic province. Six drainage basins or parts of the
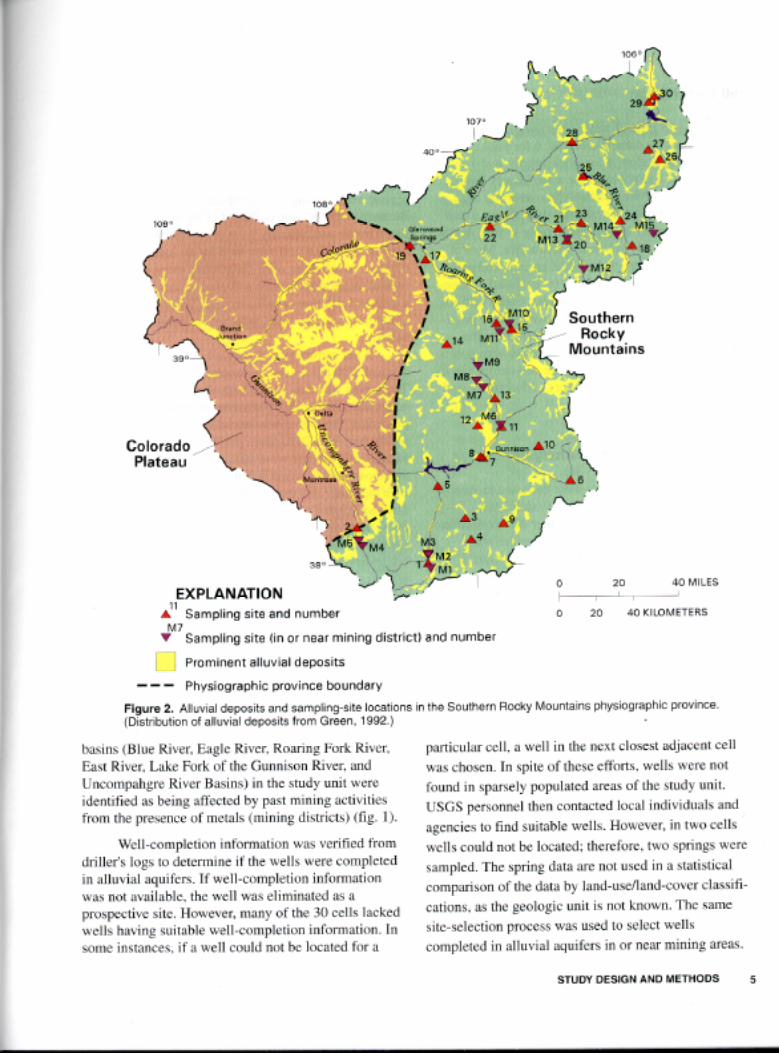
Sampling site and number
?‘Sampling site Iin or near mining district) and number
~ Prominent alluvial deposits
- - - Physiographic province boundary
Figure 2. Alluvial deposits and sampling-site locations m the Southern Rocky MOU~KN~S physiographic PrOVinGe. (Distribution of alluwal deposits from Green, 1992.)
Wcll-completion information was verified from driller’s log5 to determine if the wells were completed in alluvial aquifers. If well-completion information was not available, the well was eliminattxl as a probpectivc site. However, many of the 30 ccll~ lacked wells having suitable well-completion information. In some instances. if a well could not bc located for a
6 Water Quality in Alluvial Aquifers of the Southern Rocky Mountains Physiographic Province, Upper Colorado River Basin,Colorado, 1997
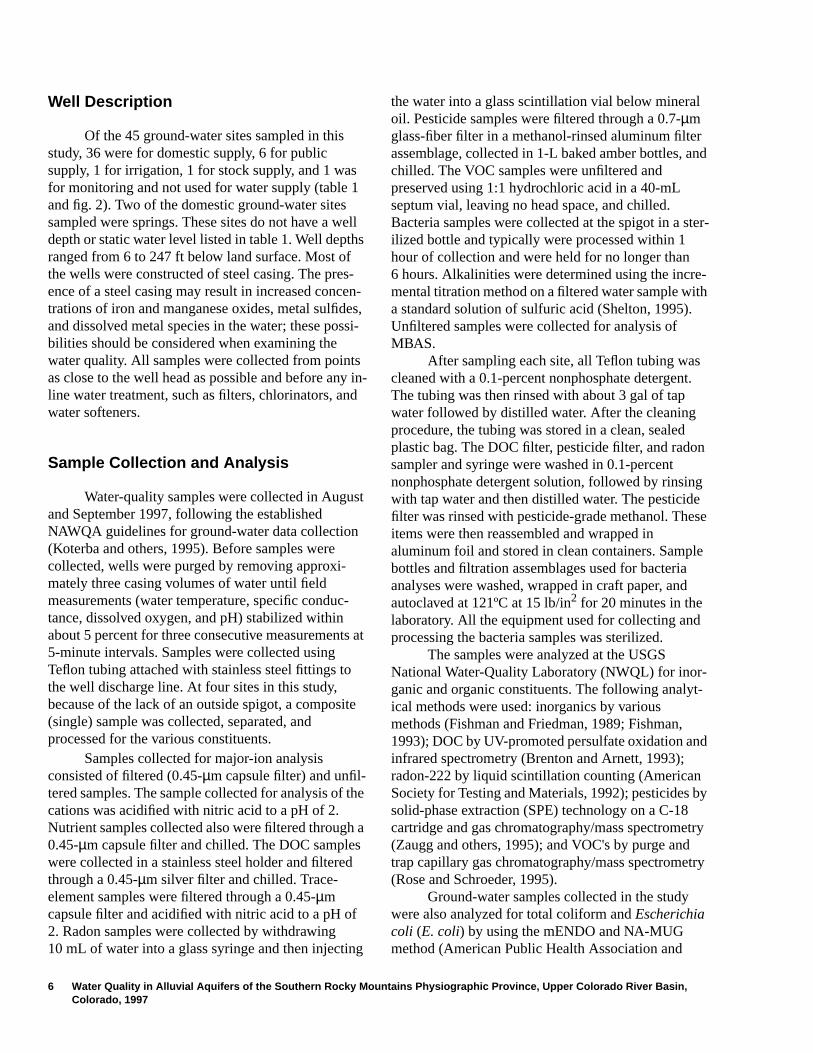
Well Description
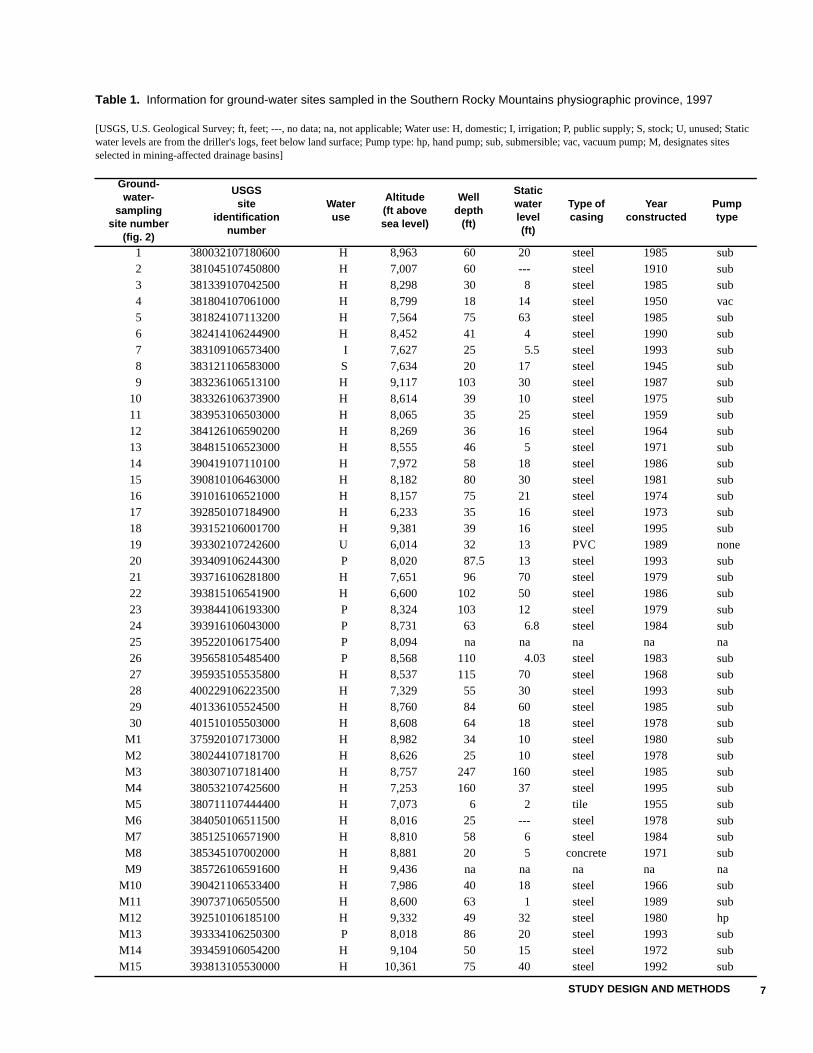
Of the 45 ground-water sites sampled in thisstudy, 36 were for domestic supply, 6 for publicsupply, 1 for irrigation, 1 for stock supply, and 1 wasfor monitoring and not used for water supply (table 1and fig. 2). Two of the domestic ground-water sitessampled were springs. These sites do not have a welldepth or static water level listed in table 1. Well depthsranged from 6 to 247 ft below land surface. Most ofthe wells were constructed of steel casing. The pres-ence of a steel casing may result in increased concen-trations of iron and manganese oxides, metal sulfides,and dissolved metal species in the water; these possi-bilities should be considered when examining thewater quality. All samples were collected from pointsas close to the well head as possible and before any in-line water treatment, such as filters, chlorinators, andwater softeners.
Sample Collection and Analysis
Water-quality samples were collected in Augustand September 1997, following the establishedNAWQA guidelines for ground-water data collection(Koterba and others, 1995). Before samples werecollected, wells were purged by removing approxi-mately three casing volumes of water until fieldmeasurements (water temperature, specific conduc-tance, dissolved oxygen, and pH) stabilized withinabout 5 percent for three consecutive measurements at5-minute intervals. Samples were collected usingTeflon tubing attached with stainless steel fittings tothe well discharge line. At four sites in this study,because of the lack of an outside spigot, a composite(single) sample was collected, separated, andprocessed for the various constituents.
Samples collected for major-ion analysisconsisted of filtered (0.45-µm capsule filter) and unfil-tered samples. The sample collected for analysis of thecations was acidified with nitric acid to a pH of 2.Nutrient samples collected also were filtered through a0.45-µm capsule filter and chilled. The DOC sampleswere collected in a stainless steel holder and filteredthrough a 0.45-µm silver filter and chilled. Trace-element samples were filtered through a 0.45-µmcapsule filter and acidified with nitric acid to a pH of2. Radon samples were collected by withdrawing10 mL of water into a glass syringe and then injecting
the water into a glass scintillation vial below mineraloil. Pesticide samples were filtered through a 0.7-µmglass-fiber filter in a methanol-rinsed aluminum filterassemblage, collected in 1-L baked amber bottles, andchilled. The VOC samples were unfiltered andpreserved using 1:1 hydrochloric acid in a 40-mLseptum vial, leaving no head space, and chilled.Bacteria samples were collected at the spigot in a ster-ilized bottle and typically were processed within 1hour of collection and were held for no longer than6 hours. Alkalinities were determined using the incre-mental titration method on a filtered water sample witha standard solution of sulfuric acid (Shelton, 1995).Unfiltered samples were collected for analysis ofMBAS.
After sampling each site, all Teflon tubing wascleaned with a 0.1-percent nonphosphate detergent.The tubing was then rinsed with about 3 gal of tapwater followed by distilled water. After the cleaningprocedure, the tubing was stored in a clean, sealedplastic bag. The DOC filter, pesticide filter, and radonsampler and syringe were washed in 0.1-percentnonphosphate detergent solution, followed by rinsingwith tap water and then distilled water. The pesticidefilter was rinsed with pesticide-grade methanol. Theseitems were then reassembled and wrapped inaluminum foil and stored in clean containers. Samplebottles and filtration assemblages used for bacteriaanalyses were washed, wrapped in craft paper, andautoclaved at 121ºC at 15 lb/in2 for 20 minutes in thelaboratory. All the equipment used for collecting andprocessing the bacteria samples was sterilized.
The samples were analyzed at the USGSNational Water-Quality Laboratory (NWQL) for inor-ganic and organic constituents. The following analyt-ical methods were used: inorganics by variousmethods (Fishman and Friedman, 1989; Fishman,1993); DOC by UV-promoted persulfate oxidation andinfrared spectrometry (Brenton and Arnett, 1993);radon-222 by liquid scintillation counting (AmericanSociety for Testing and Materials, 1992); pesticides bysolid-phase extraction (SPE) technology on a C-18cartridge and gas chromatography/mass spectrometry(Zaugg and others, 1995); and VOC's by purge andtrap capillary gas chromatography/mass spectrometry(Rose and Schroeder, 1995).
Ground-water samples collected in the studywere also analyzed for total coliform and Escherichiacoli (E. coli) by using the mENDO and NA-MUGmethod (American Public Health Association and
STUDY DESIGN AND METHODS 7
Table 1. Information for ground-water sites sampled in the Southern Rocky Mountains physiographic province, 1997
[USGS, U.S. Geological Survey; ft, feet; ---, no data; na, not applicable; Water use: H, domestic; I, irrigation; P, public supply; S, stock; U, unused; Staticwater levels are from the driller's logs, feet below land surface; Pump type: hp, hand pump; sub, submersible; vac, vacuum pump; M, designates sitesselected in mining-affected drainage basins]
Ground-water-
samplingsite number
(fig. 2)
USGSsite
identificationnumber
Wateruse
Altitude(ft abovesea level)
Welldepth
(ft)
Staticwaterlevel(ft)
Type ofcasing
Yearconstructed
Pumptype
1 380032107180600 H 8,963 60 20 steel 1985 sub 2 381045107450800 H 7,007 60 --- steel 1910 sub 3 381339107042500 H 8,298 30 8 steel 1985 sub 4 381804107061000 H 8,799 18 14 steel 1950 vac 5 381824107113200 H 7,564 75 63 steel 1985 sub 6 382414106244900 H 8,452 41 4 steel 1990 sub 7 383109106573400 I 7,627 25 5.5 steel 1993 sub 8 383121106583000 S 7,634 20 17 steel 1945 sub 9 383236106513100 H 9,117 103 30 steel 1987 sub10 383326106373900 H 8,614 39 10 steel 1975 sub11 383953106503000 H 8,065 35 25 steel 1959 sub12 384126106590200 H 8,269 36 16 steel 1964 sub13 384815106523000 H 8,555 46 5 steel 1971 sub14 390419107110100 H 7,972 58 18 steel 1986 sub15 390810106463000 H 8,182 80 30 steel 1981 sub16 391016106521000 H 8,157 75 21 steel 1974 sub17 392850107184900 H 6,233 35 16 steel 1973 sub18 393152106001700 H 9,381 39 16 steel 1995 sub19 393302107242600 U 6,014 32 13 PVC 1989 none20 393409106244300 P 8,020 87.5 13 steel 1993 sub21 393716106281800 H 7,651 96 70 steel 1979 sub22 393815106541900 H 6,600 102 50 steel 1986 sub23 393844106193300 P 8,324 103 12 steel 1979 sub24 393916106043000 P 8,731 63 6.8 steel 1984 sub25 395220106175400 P 8,094 na na na na na26 395658105485400 P 8,568 110 4.03 steel 1983 sub27 395935105535800 H 8,537 115 70 steel 1968 sub28 400229106223500 H 7,329 55 30 steel 1993 sub29 401336105524500 H 8,760 84 60 steel 1985 sub30 401510105503000 H 8,608 64 18 steel 1978 sub
M1 375920107173000 H 8,982 34 10 steel 1980 subM2 380244107181700 H 8,626 25 10 steel 1978 subM3 380307107181400 H 8,757 247 160 steel 1985 subM4 380532107425600 H 7,253 160 37 steel 1995 subM5 380711107444400 H 7,073 6 2 tile 1955 subM6 384050106511500 H 8,016 25 --- steel 1978 subM7 385125106571900 H 8,810 58 6 steel 1984 subM8 385345107002000 H 8,881 20 5 concrete 1971 subM9 385726106591600 H 9,436 na na na na na
M10 390421106533400 H 7,986 40 18 steel 1966 subM11 390737106505500 H 8,600 63 1 steel 1989 subM12 392510106185100 H 9,332 49 32 steel 1980 hpM13 393334106250300 P 8,018 86 20 steel 1993 subM14 393459106054200 H 9,104 50 15 steel 1972 subM15 393813105530000 H 10,361 75 40 steel 1992 sub
8 Water Quality in Alluvial Aquifers of the Southern Rocky Mountains Physiographic Province, Upper Colorado River Basin,Colorado, 1997
others, 1992, p. 9–54 to 9–58; Britton and Greeson,1989, p. 13–16; U.S. Environmental ProtectionAgency, 1991). This method allows all positive totalcoliform membranes to be transferred to an NA-MUGplate in order to determine if colonies are positive forE. coli. Unfiltered samples were analyzed for MBASas described by Burkhardt and others (1995).Appendix 1 includes the water-quality data for allparameters and constituents measured or analyzed.
Water-Quality Standards and HealthAdvisories
The ground-water-quality data for all ground-water sites were compared to current (1999) USEPAdrinking-water standards. Drinking-water standardsinclude the primary (MCL), secondary (SMCL), andproposed (PMCL) USEPA maximum contaminantlevels established for drinking water; maximumcontaminant level goals (MCLG); drinking-wateradvisory (DWA); action level (AL); and health advi-sory (HA) standards (U.S. Environmental ProtectionAgency, 1996). The USEPA drinking-water standardsare defined as the permissible level of a contaminant inwater as delivered to users of a public water system.MCL’s are health related and legally enforceable,whereas SMCL’s apply to the esthetic qualities ofwater and are recommended nonenforceable levels.PMCL’s are proposed levels that are not currentlyenforceable. MCLG's are nonenforceable levels of adrinking-water contaminant and are intended forprotection against adverse human health effects.DWA’s are intended to protect against taste and odorproblems. AL’s are considered the lowest level towhich water systems can reasonably be required tocontrol a contaminant should it occur in drinkingwater. The USEPA HA's used in this report are definedas the concentration of a contaminant in drinkingwater that is expected to cause adverse, but noncarci-nogenic, effects over a lifetime of typical exposure.The typical exposure assumes that a 154-pound adultdrinks about 0.5 gal of such water per day for 70 years(U.S. Environmental Protection Agency, 1996).
Statistical Methods
In this report, water-quality properties andconstituents are represented statistically or graphically.
Water-quality data were analyzed using nonparametricstatistical methods. Nonparametric methods were usedbecause they are not strongly influenced by outliers,require few assumptions about the statistical proper-ties of a data set, and are suitable for use with smalldata sets.
Boxplots were used to display variability in adata set. Boxplots (for example, fig. 3) graphicallyrepresent the median, or 50th percentile (the line in thebox), the interquartile range (the part of the box repre-senting the range between the 25th and 75th percen-tile), and the 10th and 90th percentiles (the lines to theboundary points of the boxplot). If analytical valuesfall outside the 10th and 90th percentile (outliers), theyare represented as circles above and below thesepercentile values on the boxplots. However, data setswith fewer than 10 analyses are represented as indi-vidual points on the boxplots, and a median value forthe data set is represented by a line in those plots.
The Kruskal-Wallis test, a nonparametric test(Helsel and Hirsch, 1992), was used to determinewhether all groups are identical or whether some tendto produce observations different in value than theothers. When comparing only two groups, the Mann-Whitney test, another nonparametric test, was used todetermine whether one group tends to produce largerobservations than the second group. These nonpara-metric tests, which are like a rank-sum test, may beused to determine the general equivalence of groups ofdata. For attained significance levels (p-values) of lessthan 0.05, the tests are considered to show significantdifferences.
QUALITY-CONTROL SAMPLES ANDQUALITY ASSURANCE OF THE DATA
In addition to the environmental ground-watersamples, quality-control samples were collected toevaluate bias and variability in the environmental data.Samples used to test for bias were field equipmentblanks and spiked samples. Variability was tested byobtaining replicate samples. For this study, 7 fieldequipment blanks (blank samples), 6 replicates, and8 field-spike samples were collected. Blank sampleswere collected to test for bias from the introduction ofcontamination into the environmental samples in anystage of the sample collection and analysis processincluding decontamination procedures of the fieldequipment, field and laboratory protocols, and other
9QUALITY-CONTROL SAMPLES AND QUALITY ASSURANCE OF THE DATA
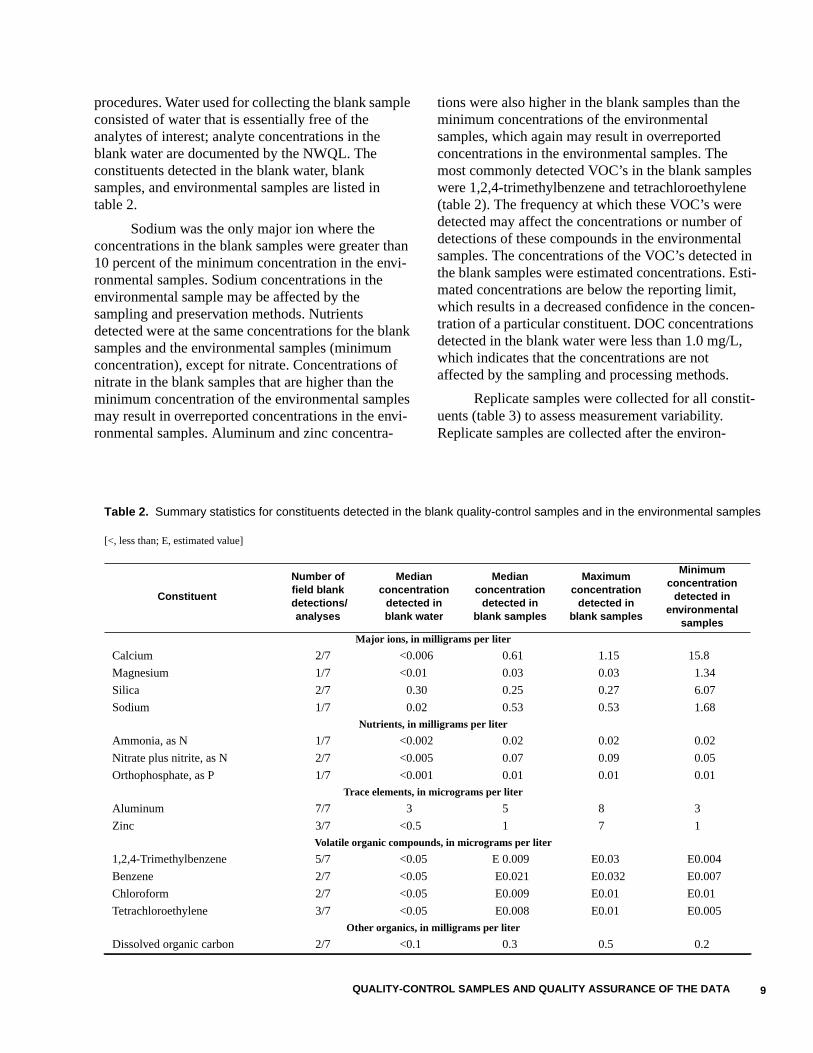
procedures. Water used for collecting the blank sampleconsisted of water that is essentially free of theanalytes of interest; analyte concentrations in theblank water are documented by the NWQL. Theconstituents detected in the blank water, blanksamples, and environmental samples are listed intable 2.
Sodium was the only major ion where theconcentrations in the blank samples were greater than10 percent of the minimum concentration in the envi-ronmental samples. Sodium concentrations in theenvironmental sample may be affected by thesampling and preservation methods. Nutrientsdetected were at the same concentrations for the blanksamples and the environmental samples (minimumconcentration), except for nitrate. Concentrations ofnitrate in the blank samples that are higher than theminimum concentration of the environmental samplesmay result in overreported concentrations in the envi-ronmental samples. Aluminum and zinc concentra-
tions were also higher in the blank samples than theminimum concentrations of the environmentalsamples, which again may result in overreportedconcentrations in the environmental samples. Themost commonly detected VOC’s in the blank sampleswere 1,2,4-trimethylbenzene and tetrachloroethylene(table 2). The frequency at which these VOC’s weredetected may affect the concentrations or number ofdetections of these compounds in the environmentalsamples. The concentrations of the VOC’s detected inthe blank samples were estimated concentrations. Esti-mated concentrations are below the reporting limit,which results in a decreased confidence in the concen-tration of a particular constituent. DOC concentrationsdetected in the blank water were less than 1.0 mg/L,which indicates that the concentrations are notaffected by the sampling and processing methods.
Replicate samples were collected for all constit-uents (table 3) to assess measurement variability.Replicate samples are collected after the environ-
Table 2. Summary statistics for constituents detected in the blank quality-control samples and in the environmental samples
[<, less than; E, estimated value]
Constituent
Number offield blank
detections/analyses
Medianconcentration
detected inblank water
Medianconcentration
detected inblank samples
Maximumconcentration
detected inblank samples
Minimumconcentration
detected inenvironmental
samples
Major ions, in milligrams per liter
Calcium 2/7 <0.006 0.61 1.15 15.8
Magnesium 1/7 <0.01 0.03 0.03 1.34
Silica 2/7 0.30 0.25 0.27 6.07
Sodium 1/7 0.02 0.53 0.53 1.68Nutrients, in milligrams per liter
Ammonia, as N 1/7 <0.002 0.02 0.02 0.02
Nitrate plus nitrite, as N 2/7 <0.005 0.07 0.09 0.05
Orthophosphate, as P 1/7 <0.001 0.01 0.01 0.01Trace elements, in micrograms per liter
Aluminum 7/7 3 5 8 3
Zinc 3/7 <0.5 1 7 1Volatile organic compounds, in micrograms per liter
1,2,4-Trimethylbenzene 5/7 <0.05 E 0.009 E0.03 E0.004
Benzene 2/7 <0.05 E0.021 E0.032 E0.007
Chloroform 2/7 <0.05 E0.009 E0.01 E0.01
Tetrachloroethylene 3/7 <0.05 E0.008 E0.01 E0.005Other organics, in milligrams per liter
Dissolved organic carbon 2/7 <0.1 0.3 0.5 0.2

10 Water Quality in Alluvial Aquifers of the Southern Rocky Mountains Physiographic Province, Upper Colorado River Basin,Colorado, 1997
mental samples by following the same sampling andpreservation procedures. The percent differencebetween the initial sample and replicate sample couldindicate problems with the sampling or analyticalprocedures or possible changes in the chemicalcomposition of the water being sampled. The percentdifference for most constituents was relatively small(median values less than 1.5 percent) and generallyless than 5 percent for most of the constituentsdetected in a particular sample. A high percent differ-ence of greater than 5 percent occurred when onesample had a low concentration and the other was atthe reporting limit or was not detected. No qualifica-tions were made to the environmental data based onreplicate quality-control data.
Field-spike and field-spike-replicate sampleswere collected for pesticides and VOC's to determinethe bias and variability resulting from interactionsbetween the analytes of interest and the ground-waterchemistry. Spike solutions are composed of knownquantities of either pesticides or VOC’s, which wereadded to the environmental and replicate samples.Table 3 shows the field-spike recoveries for pesticidesand VOC’s in percent and in relative percent differ-ence between replicate spike samples. Surrogates,
compounds that behave similarly to the analytes, werealso added to every pesticide and VOC environmentaland quality-control sample.
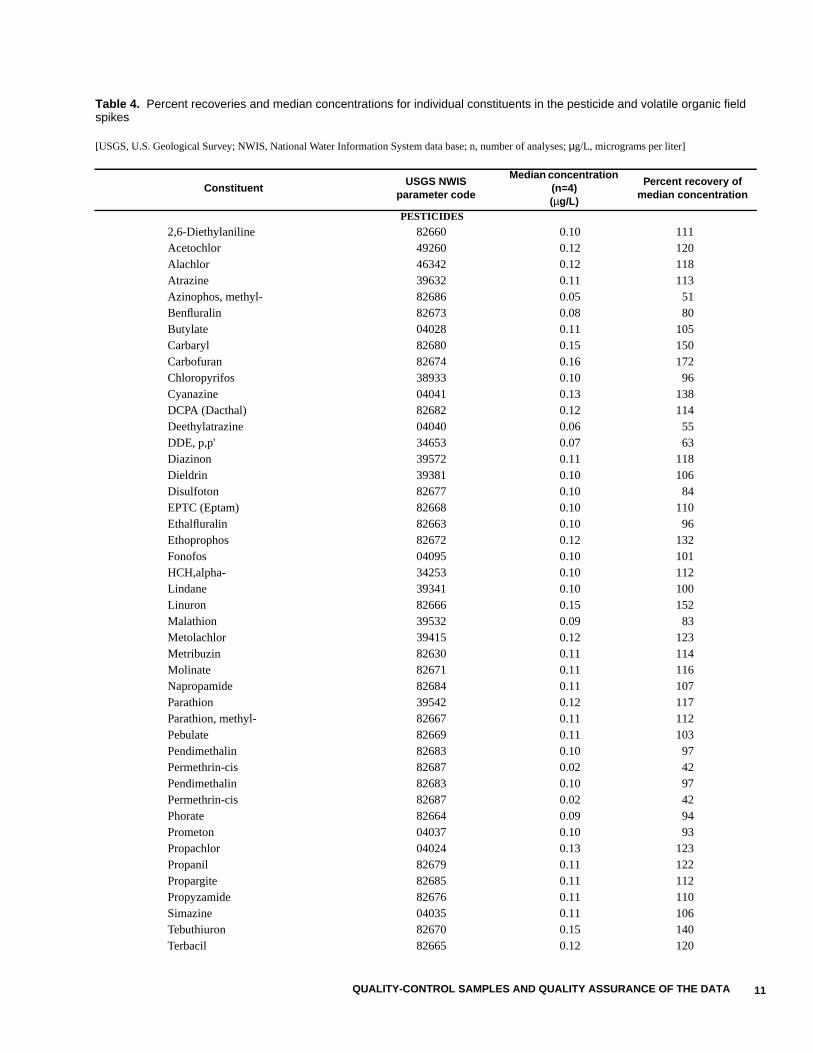
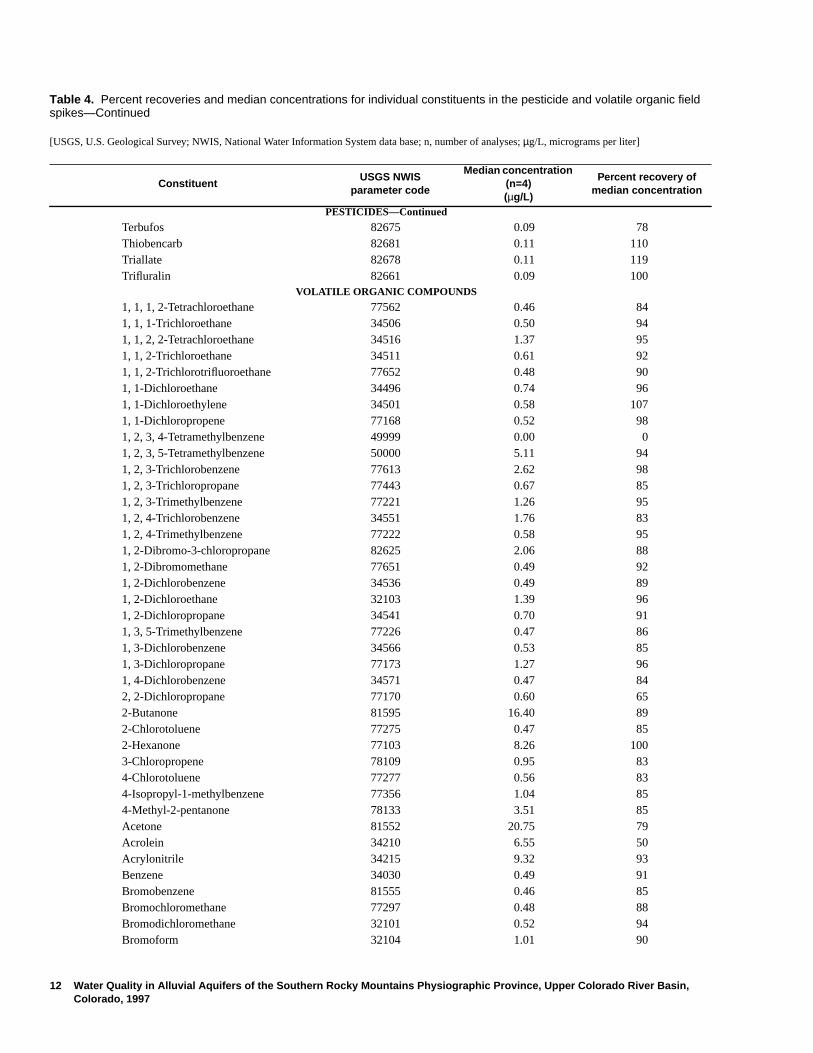
Median concentrations and median percentrecoveries for all pesticides and VOC’s present in thefield spikes are listed in table 4. For pesticides, thepercent recoveries were higher than the VOC’s andhad a median concentration of 108 percent for allpesticide constituents (table 3). Only one pesticideconstituent had a percent recovery of less than 50percent: permethrin-cis (42 percent) (table 4). Thepercent recoveries for VOC’s were generally less than100 percent and had a median percent recovery of 89.6percent for all constituents (table 3). Of the 86 VOC’sanalyzed, only two VOC’s had a percent recovery ofless than 50 percent: 1,2,3,4-tetramethylbenzene(0 percent) and ethyl methacrylate (49 percent) (table4). Relative percent difference in the field spikes wasgenerally less than 10 for all constituents analyzed inthe pesticide and VOC spikes. For this study, the rela-tive percent differences in the field spikes of less than10 are considered acceptable results.
Results of the surrogate recoveries for pesticidesand VOC’s for all environmental and quality-controlsamples show that VOC surrogate recoveries ranged
Table 3. Summary statistics of replicate- and field-spike quality-control samples
[SH, U.S. Geological Survey National Water Quality Laboratory schedule; relative percent difference is defined as[(sample 1 – sample 2)/(sample1 + sample 2/2)] × 100]
ConstituentNumber ofcompari-
sonsMinimum Median Maximum
Environmental sample replication (relative percent difference)
Major ions 60 0.00 1.38 48.5
Nutrients 36 0.00 0.00 98.3
Trace elements 108 0.00 0.00 71.4
Radon 6 0.68 8.47 15.7
Dissolved organic carbon 6 0.00 9.45 31.6
Pesticides SH-2001 235 0.00 0.00 84.4
Volatile organic compounds 425 0.00 0.00 161
Field-spike recoveries (in percent)
Pesticides SH-2001 188 0.00 108 220
Volatile organic compounds 340 34.4 89.6 285
Field-spike replication (relative percent difference)
Pesticides SH-2001 94 0.00 3.16 12.1
Volatile organic compounds 170 0.00 6.54 21.8
QUALITY-CONTROL SAMPLES AND QUALITY ASSURANCE OF THE DATA 11
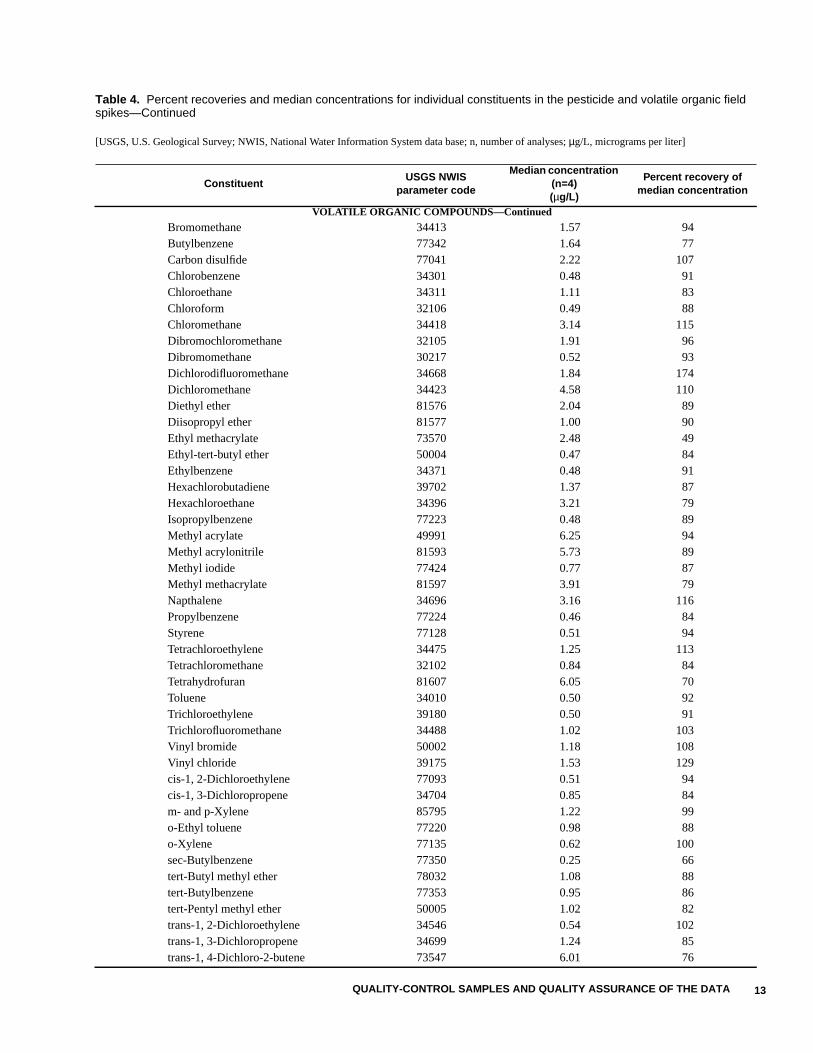
Table 4. Percent recoveries and median concentrations for individual constituents in the pesticide and volatile organic fieldspikes
[USGS, U.S. Geological Survey; NWIS, National Water Information System data base; n, number of analyses; µg/L, micrograms per liter]
ConstituentUSGS NWIS
parameter code
Median concentration(n=4)(µg/L)
Percent recovery ofmedian concentration
PESTICIDES
2,6-Diethylaniline 82660 0.10 111Acetochlor 49260 0.12 120Alachlor 46342 0.12 118Atrazine 39632 0.11 113Azinophos, methyl- 82686 0.05 51Benfluralin 82673 0.08 80Butylate 04028 0.11 105Carbaryl 82680 0.15 150Carbofuran 82674 0.16 172Chloropyrifos 38933 0.10 96Cyanazine 04041 0.13 138DCPA (Dacthal) 82682 0.12 114Deethylatrazine 04040 0.06 55DDE, p,p' 34653 0.07 63Diazinon 39572 0.11 118Dieldrin 39381 0.10 106Disulfoton 82677 0.10 84EPTC (Eptam) 82668 0.10 110Ethalfluralin 82663 0.10 96Ethoprophos 82672 0.12 132Fonofos 04095 0.10 101HCH,alpha- 34253 0.10 112Lindane 39341 0.10 100Linuron 82666 0.15 152Malathion 39532 0.09 83Metolachlor 39415 0.12 123Metribuzin 82630 0.11 114Molinate 82671 0.11 116Napropamide 82684 0.11 107Parathion 39542 0.12 117Parathion, methyl- 82667 0.11 112Pebulate 82669 0.11 103Pendimethalin 82683 0.10 97Permethrin-cis 82687 0.02 42Pendimethalin 82683 0.10 97Permethrin-cis 82687 0.02 42Phorate 82664 0.09 94Prometon 04037 0.10 93Propachlor 04024 0.13 123Propanil 82679 0.11 122Propargite 82685 0.11 112Propyzamide 82676 0.11 110Simazine 04035 0.11 106Tebuthiuron 82670 0.15 140Terbacil 82665 0.12 120
12 Water Quality in Alluvial Aquifers of the Southern Rocky Mountains Physiographic Province, Upper Colorado River Basin,Colorado, 1997
PESTICIDES—Continued
Terbufos 82675 0.09 78Thiobencarb 82681 0.11 110Triallate 82678 0.11 119Trifluralin 82661 0.09 100
VOLATILE ORGANIC COMPOUNDS
1, 1, 1, 2-Tetrachloroethane 77562 0.46 841, 1, 1-Trichloroethane 34506 0.50 941, 1, 2, 2-Tetrachloroethane 34516 1.37 951, 1, 2-Trichloroethane 34511 0.61 921, 1, 2-Trichlorotrifluoroethane 77652 0.48 901, 1-Dichloroethane 34496 0.74 961, 1-Dichloroethylene 34501 0.58 1071, 1-Dichloropropene 77168 0.52 981, 2, 3, 4-Tetramethylbenzene 49999 0.00 01, 2, 3, 5-Tetramethylbenzene 50000 5.11 941, 2, 3-Trichlorobenzene 77613 2.62 981, 2, 3-Trichloropropane 77443 0.67 851, 2, 3-Trimethylbenzene 77221 1.26 951, 2, 4-Trichlorobenzene 34551 1.76 831, 2, 4-Trimethylbenzene 77222 0.58 951, 2-Dibromo-3-chloropropane 82625 2.06 881, 2-Dibromomethane 77651 0.49 921, 2-Dichlorobenzene 34536 0.49 891, 2-Dichloroethane 32103 1.39 961, 2-Dichloropropane 34541 0.70 911, 3, 5-Trimethylbenzene 77226 0.47 861, 3-Dichlorobenzene 34566 0.53 851, 3-Dichloropropane 77173 1.27 961, 4-Dichlorobenzene 34571 0.47 842, 2-Dichloropropane 77170 0.60 652-Butanone 81595 16.40 892-Chlorotoluene 77275 0.47 852-Hexanone 77103 8.26 1003-Chloropropene 78109 0.95 834-Chlorotoluene 77277 0.56 834-Isopropyl-1-methylbenzene 77356 1.04 854-Methyl-2-pentanone 78133 3.51 85Acetone 81552 20.75 79Acrolein 34210 6.55 50Acrylonitrile 34215 9.32 93Benzene 34030 0.49 91Bromobenzene 81555 0.46 85Bromochloromethane 77297 0.48 88Bromodichloromethane 32101 0.52 94Bromoform 32104 1.01 90
Table 4. Percent recoveries and median concentrations for individual constituents in the pesticide and volatile organic fieldspikes—Continued
[USGS, U.S. Geological Survey; NWIS, National Water Information System data base; n, number of analyses; µg/L, micrograms per liter]
ConstituentUSGS NWIS
parameter code
Median concentration(n=4)(µg/L)
Percent recovery ofmedian concentration
QUALITY-CONTROL SAMPLES AND QUALITY ASSURANCE OF THE DATA 13
VOLATILE ORGANIC COMPOUNDS—Continued
Bromomethane 34413 1.57 94Butylbenzene 77342 1.64 77Carbon disulfide 77041 2.22 107Chlorobenzene 34301 0.48 91Chloroethane 34311 1.11 83Chloroform 32106 0.49 88Chloromethane 34418 3.14 115Dibromochloromethane 32105 1.91 96Dibromomethane 30217 0.52 93Dichlorodifluoromethane 34668 1.84 174Dichloromethane 34423 4.58 110Diethyl ether 81576 2.04 89Diisopropyl ether 81577 1.00 90Ethyl methacrylate 73570 2.48 49Ethyl-tert-butyl ether 50004 0.47 84Ethylbenzene 34371 0.48 91Hexachlorobutadiene 39702 1.37 87Hexachloroethane 34396 3.21 79Isopropylbenzene 77223 0.48 89Methyl acrylate 49991 6.25 94Methyl acrylonitrile 81593 5.73 89Methyl iodide 77424 0.77 87Methyl methacrylate 81597 3.91 79Napthalene 34696 3.16 116Propylbenzene 77224 0.46 84Styrene 77128 0.51 94Tetrachloroethylene 34475 1.25 113Tetrachloromethane 32102 0.84 84Tetrahydrofuran 81607 6.05 70Toluene 34010 0.50 92Trichloroethylene 39180 0.50 91Trichlorofluoromethane 34488 1.02 103Vinyl bromide 50002 1.18 108Vinyl chloride 39175 1.53 129cis-1, 2-Dichloroethylene 77093 0.51 94cis-1, 3-Dichloropropene 34704 0.85 84m- and p-Xylene 85795 1.22 99o-Ethyl toluene 77220 0.98 88o-Xylene 77135 0.62 100sec-Butylbenzene 77350 0.25 66tert-Butyl methyl ether 78032 1.08 88tert-Butylbenzene 77353 0.95 86tert-Pentyl methyl ether 50005 1.02 82trans-1, 2-Dichloroethylene 34546 0.54 102trans-1, 3-Dichloropropene 34699 1.24 85trans-1, 4-Dichloro-2-butene 73547 6.01 76
Table 4. Percent recoveries and median concentrations for individual constituents in the pesticide and volatile organic fieldspikes—Continued
[USGS, U.S. Geological Survey; NWIS, National Water Information System data base; n, number of analyses; µg/L, micrograms per liter]
ConstituentUSGS NWIS
parameter code
Median concentration(n=4)(µg/L)
Percent recovery ofmedian concentration
14 Water Quality in Alluvial Aquifers of the Southern Rocky Mountains Physiographic Province, Upper Colorado River Basin,Colorado, 1997
from about 95 to 103 percent and that pesticide surro-gate recoveries were more variable. Surrogaterecovery rates for pesticides ranged from about 87 to118 percent. No qualifications were made to theenvironmental data based on the spike or surrogaterecoveries. However, relatively low recoveries of acompound can indicate that its presence and concen-tration may be underreported.
The major-ion data were quality assured byexamining the differences between the total-cation andtotal-anion charge balance. Differences between total-cation and total-anion charge balance for all 45 envi-ronmental samples were less than 10 percent. About 7percent of the samples (3 of 45) had a differencebetween the cation and anion charge balance of greaterthan 2 percent. Either very low dissolved constituents(such that some constituents are near the reportinglimit) or high dissolved constituents (such that a highconcentration of a particular constituent is present) canaccount for large percentage differences in the cationand anion charge balance for the three sites. A differ-ence between the total-cation and the total-anionconcentrations of less than 10 percent is consideredacceptable for this study.
GROUND-WATER QUALITY
Many natural and human factors can affectground-water quality. Natural factors affectingground-water quality include the source of therecharge water, the weathering and dissolution ofminerals from various geologic units, cation-anionexchange with aquifer minerals, and the mixing ofwaters from different sources. Human factors thataffect water quality may include the introduction ofnutrients and synthetic organic compounds because ofleaching into the ground water of fertilizers and pesti-cides, which are applied on the surface (U.S. Geolog-ical Survey, 1999). Also, areas of intense irrigationmay affect the amount of dissolved solids present inthe ground water. Trace elements in ground water mayoccur naturally from the dissolution of minerals ormay be related to mining activities, urban develop-ment, application of pesticides, or burning of fossilfuels. Bacteria in ground water may be an indication ofthe sanitary quality of the water (Myers and Sylvester,1997). The presence of methylene blue activesubstances in ground water may be an indication of
contamination from wastewater (Field and others,1992).
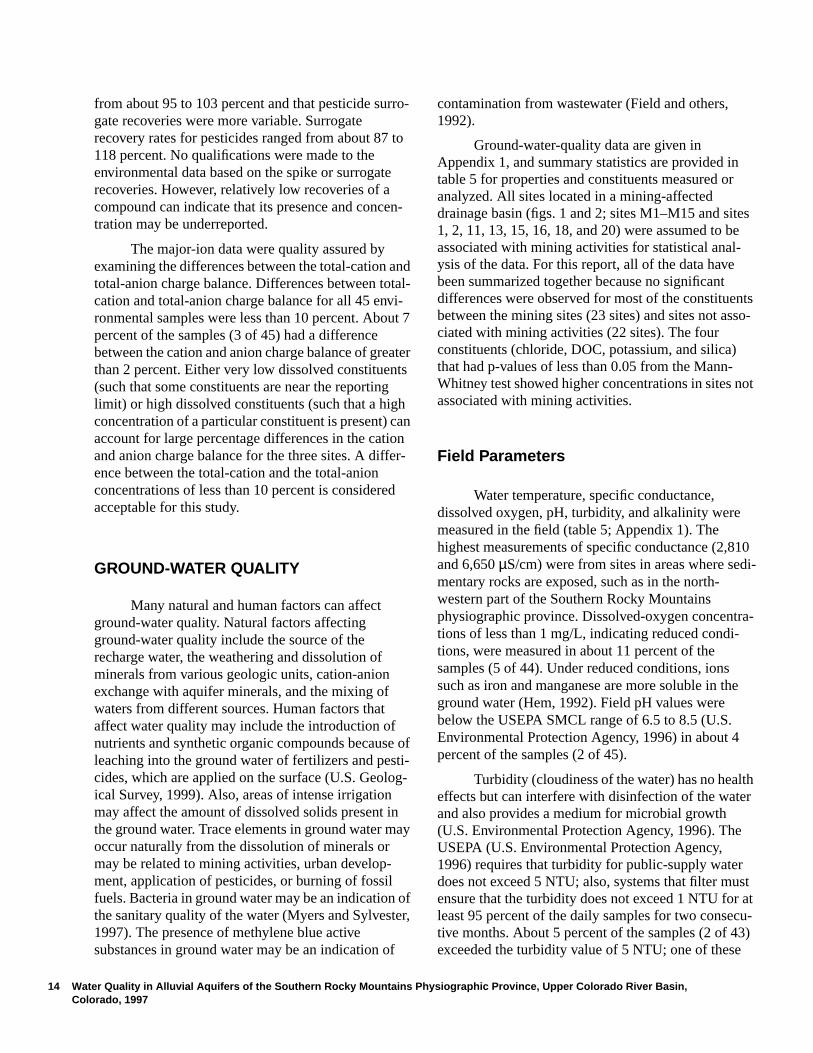
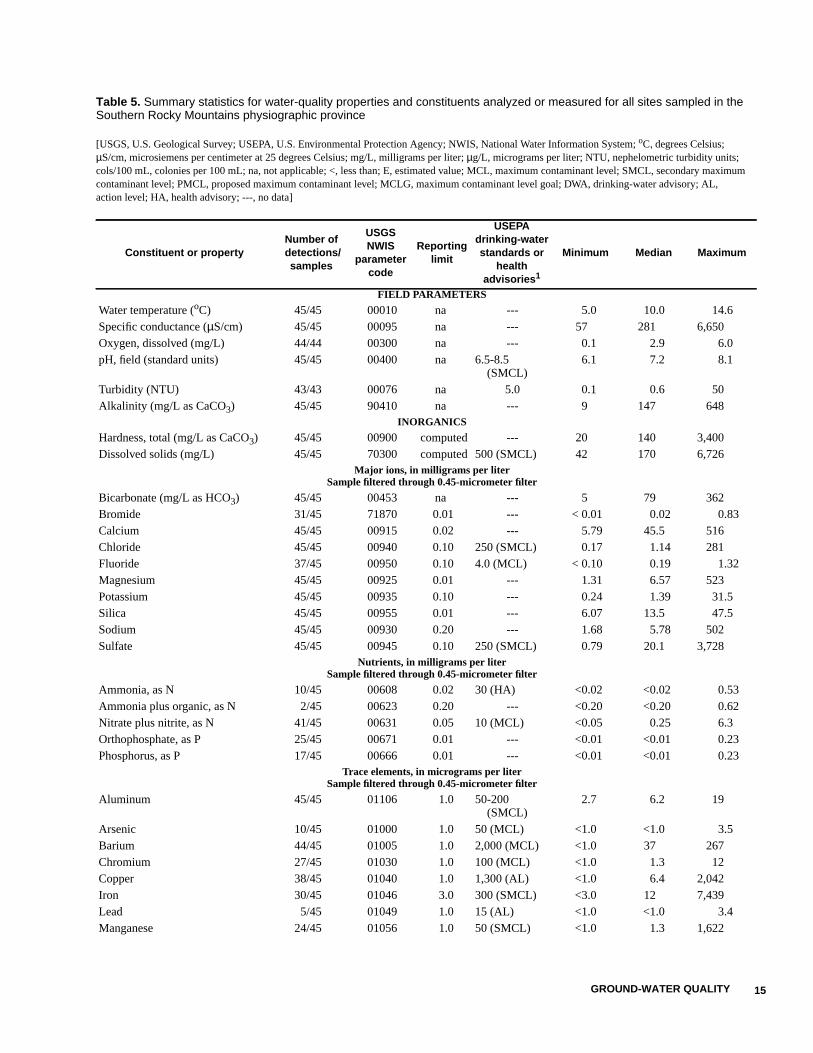
Ground-water-quality data are given inAppendix 1, and summary statistics are provided intable 5 for properties and constituents measured oranalyzed. All sites located in a mining-affecteddrainage basin (figs. 1 and 2; sites M1–M15 and sites1, 2, 11, 13, 15, 16, 18, and 20) were assumed to beassociated with mining activities for statistical anal-ysis of the data. For this report, all of the data havebeen summarized together because no significantdifferences were observed for most of the constituentsbetween the mining sites (23 sites) and sites not asso-ciated with mining activities (22 sites). The fourconstituents (chloride, DOC, potassium, and silica)that had p-values of less than 0.05 from the Mann-Whitney test showed higher concentrations in sites notassociated with mining activities.
Field Parameters
Water temperature, specific conductance,dissolved oxygen, pH, turbidity, and alkalinity weremeasured in the field (table 5; Appendix 1). Thehighest measurements of specific conductance (2,810and 6,650 µS/cm) were from sites in areas where sedi-mentary rocks are exposed, such as in the north-western part of the Southern Rocky Mountainsphysiographic province. Dissolved-oxygen concentra-tions of less than 1 mg/L, indicating reduced condi-tions, were measured in about 11 percent of thesamples (5 of 44). Under reduced conditions, ionssuch as iron and manganese are more soluble in theground water (Hem, 1992). Field pH values werebelow the USEPA SMCL range of 6.5 to 8.5 (U.S.Environmental Protection Agency, 1996) in about 4percent of the samples (2 of 45).
Turbidity (cloudiness of the water) has no healtheffects but can interfere with disinfection of the waterand also provides a medium for microbial growth(U.S. Environmental Protection Agency, 1996). TheUSEPA (U.S. Environmental Protection Agency,1996) requires that turbidity for public-supply waterdoes not exceed 5 NTU; also, systems that filter mustensure that the turbidity does not exceed 1 NTU for atleast 95 percent of the daily samples for two consecu-tive months. About 5 percent of the samples (2 of 43)exceeded the turbidity value of 5 NTU; one of these
GROUND-WATER QUALITY 15
Table 5. Summary statistics for water-quality properties and constituents analyzed or measured for all sites sampled in theSouthern Rocky Mountains physiographic province
[USGS, U.S. Geological Survey; USEPA, U.S. Environmental Protection Agency; NWIS, National Water Information System; oC, degrees Celsius;µS/cm, microsiemens per centimeter at 25 degrees Celsius; mg/L, milligrams per liter; µg/L, micrograms per liter; NTU, nephelometric turbidity units;cols/100 mL, colonies per 100 mL; na, not applicable; <, less than; E, estimated value; MCL, maximum contaminant level; SMCL, secondary maximumcontaminant level; PMCL, proposed maximum contaminant level; MCLG, maximum contaminant level goal; DWA, drinking-water advisory; AL,action level; HA, health advisory; ---, no data]
Constituent or propertyNumber of detections/
samples
USGSNWIS
parametercode
Reportinglimit
USEPAdrinking-waterstandards or
healthadvisories1
Minimum Median Maximum
FIELD PARAMETERS
Water temperature (oC) 45/45 00010 na --- 5.0 10.0 14.6Specific conductance (µS/cm) 45/45 00095 na --- 57 281 6,650Oxygen, dissolved (mg/L) 44/44 00300 na --- 0.1 2.9 6.0pH, field (standard units) 45/45 00400 na 6.5-8.5
(SMCL)6.1 7.2 8.1
Turbidity (NTU) 43/43 00076 na 5.0 0.1 0.6 50Alkalinity (mg/L as CaCO3) 45/45 90410 na --- 9 147 648
INORGANICS
Hardness, total (mg/L as CaCO3) 45/45 00900 computed --- 20 140 3,400Dissolved solids (mg/L) 45/45 70300 computed 500 (SMCL) 42 170 6,726
Major ions, in milligrams per literSample filtered through 0.45-micrometer filter
Bicarbonate (mg/L as HCO3) 45/45 00453 na --- 5 79 362Bromide 31/45 71870 0.01 --- < 0.01 0.02 0.83Calcium 45/45 00915 0.02 --- 5.79 45.5 516Chloride 45/45 00940 0.10 250 (SMCL) 0.17 1.14 281Fluoride 37/45 00950 0.10 4.0 (MCL) < 0.10 0.19 1.32Magnesium 45/45 00925 0.01 --- 1.31 6.57 523Potassium 45/45 00935 0.10 --- 0.24 1.39 31.5Silica 45/45 00955 0.01 --- 6.07 13.5 47.5Sodium 45/45 00930 0.20 --- 1.68 5.78 502Sulfate 45/45 00945 0.10 250 (SMCL) 0.79 20.1 3,728
Nutrients, in milligrams per literSample filtered through 0.45-micrometer filter
Ammonia, as N 10/45 00608 0.02 30 (HA) <0.02 <0.02 0.53Ammonia plus organic, as N 2/45 00623 0.20 --- <0.20 <0.20 0.62Nitrate plus nitrite, as N 41/45 00631 0.05 10 (MCL) <0.05 0.25 6.3Orthophosphate, as P 25/45 00671 0.01 --- <0.01 <0.01 0.23Phosphorus, as P 17/45 00666 0.01 --- <0.01 <0.01 0.23
Trace elements, in micrograms per literSample filtered through 0.45-micrometer filter
Aluminum 45/45 01106 1.0 50-200(SMCL)
2.7 6.2 19
Arsenic 10/45 01000 1.0 50 (MCL) <1.0 <1.0 3.5Barium 44/45 01005 1.0 2,000 (MCL) <1.0 37 267Chromium 27/45 01030 1.0 100 (MCL) <1.0 1.3 12Copper 38/45 01040 1.0 1,300 (AL) <1.0 6.4 2,042Iron 30/45 01046 3.0 300 (SMCL) <3.0 12 7,439Lead 5/45 01049 1.0 15 (AL) <1.0 <1.0 3.4Manganese 24/45 01056 1.0 50 (SMCL) <1.0 1.3 1,622
16 Water Quality in Alluvial Aquifers of the Southern Rocky Mountains Physiographic Province, Upper Colorado River Basin,Colorado, 1997
Trace elements, in micrograms per literSample filtered through 0.45-micrometer filter—Continued
Molybdenum 22/45 01060 1.0 --- <1.0 <1.0 16Nickel 13/45 01065 1.0 100 (MCL) <1.0 <1.0 41Selenium 6/45 01145 1.0 50 (MCL) <1.0 <1.0 11Uranium 22/45 22703 1.0 20 (PMCL) <1.0 <1.0 34Zinc 44/45 01090 1.0 5,000 (SCML) <1.0 24 1,272
Radionuclides, in picocuries per liter
Radon-222 45/45 82303 26 --- 305 1,102 4,030ORGANICS
Dissolved organic carbon (mg/L) 45/45 00681 0.1 --- 0.2 0.6 8.7Pesticides, in micrograms per liter
Sample filtered through 0.7-micrometer filter
Deethylatrazine 1/32 04040 0.002 --- <0.002 <0.002 E0.004Prometon 1/32 04037 0.018 100 (HA) E0.003 <0.018 <0.018
Volatile organic compounds, in micrograms per liter
1, 1, 1-Trichloroethane 6/32 34506 0.032 200 (MCL) E0.010 <0.032 0.951, 2, 4-Trimethylbenzene 13/32 77222 0.056 --- E0.004 <0.056 0.1981, 3-Dichlorobenzene 2/32 34566 0.054 600 (HA) E0.008 <0.054 0.1002-Butanone 1/32 81595 1.650 --- <1.650 <1.650 1.680Acetone 1/32 81552 4.900 --- <4.904 <4.904 <5.000Benzene 5/32 34030 0.032 5.0 (MCL) E0.007 <0.032 <0.032Carbon disulfide 5/32 77041 0.080 --- E0.010 <0.080 <0.080Chloroform 2/32 32106 0.052 100 (MCL) E0.010 <0.052 <0.052Chloromethane 3/32 34418 0.254 3.0 (HA) E0.010 <0.254 <0.254Dichlorodifluoromethane 1/32 34668 0.096 1,000 (HA) <0.096 <0.096 E0.100Methyl tert-butyl ether 2/32 78032 0.112 20-40 (DWA) <0.112 <0.112 1.47Styrene 1/32 77128 0.042 100 (MCL) E0.010 <0.042 <0.042Tetrachloroethylene 15/32 34475 0.038 5.0 (MCL) E0.005 <0.038 0.117Tetrachloromethane 1/32 32102 0.088 5.0 (MCL) E0.020 <0.088 <0.088Tetrahydrofuran 3/32 81607 1.150 --- E0.100 <1.148 11.30Toluene 4/32 34010 0.038 1,000 (MCL) E0.004 <0.038 E0.060Trichloroethylene 3/32 39180 0.038 5.0 (MCL) E0.008 <0.038 0.177m- and p-Xylene 1/32 85795 0.064 --- E0.030 <0.064 <0.064o-Xylene 1/32 77135 0.064 --- E0.020 <0.064 <0.064
OTHER CONSTITUENTS
Coliforms, total, m-ENDO medium(cols/100 mL)
45/45 31501 0 0 (MCLG) <1 <1 60
Methylene blue active substances(mg/L)
45/45 38260 0.02 --- <0.02 <0.02 0.04
1U.S. Environmental Protection Agency, 1996.
Table 5. Summary statistics for water-quality properties and constituents analyzed or measured for all sites sampled in theSouthern Rocky Mountains physiographic province
[USGS, U.S. Geological Survey; USEPA, U.S. Environmental Protection Agency; NWIS, National Water Information System; oC, degrees Celsius;µS/cm, microsiemens per centimeter at 25 degrees Celsius; mg/L, milligrams per liter; µg/L, micrograms per liter; NTU, nephelometric turbidity units;cols/100 mL, colonies per 100 mL; na, not applicable; <, less than; E, estimated value; MCL, maximum contaminant level; SMCL, secondary maximumcontaminant level; PMCL, proposed maximum contaminant level; MCLG, maximum contaminant level goal; DWA, drinking-water advisory; AL,action level; HA, health advisory; ---, no data]
Constituent or propertyNumber of
detections/samples
USGSNWIS
parametercode
Reportinglimit
USEPAdrinking-waterstandards or
healthadvisories1
Minimum Median Maximum
17GROUND-WATER QUALITY
samples was from the monitoring well (site 19;Appendix 1).
Major Ions
Water samples were analyzed for the followingmajor ions: bicarbonate, bromide, calcium, chloride,fluoride, magnesium, potassium, silica, sodium, andsulfate (Appendix 1). Summary statistics for the majorions and USEPA drinking-water standards are listed intable 5. The highest median concentrations in groundwater for this study were for bicarbonate, followed bycalcium, sulfate, silica, magnesium, sodium, potas-sium, and chloride.
Bicarbonate occurs naturally in ground waterand is typically a dominant anion. Calcium is a majorcomponent of solutes in most natural waters (Hem,1992). Calcium concentrations generally were greaterthan most of the other major ions. Calcium in groundwater generally is a result of the dissolution ofcarbonate minerals such as calcite and dolomite andalso may be related to the dissolution of silicateminerals. Calcium in drinking water has no healtheffects but contributes to the hardness of water. Thetwo sites (sites 19 and 22) that had a total hardness ofgreater than 1,000 mg/L also had the highest calciumconcentrations.
Sulfate in ground water can result from theoxidation of sulfide minerals in igneous and sedimen-tary rocks and evaporites (Hem, 1992). The SMCL forsulfate of 250 mg/L (U.S. Environmental ProtectionAgency, 1996) was exceeded at about 9 percent of thesites (4 of 45). Silica in ground water generally is fromthe weathering of quartz, which is a major mineralfound in igneous rocks and sandstones.
Magnesium is a common element in groundwater. Magnesium is a major constituent of ferromag-nesian minerals in igneous rocks or in metamorphicrocks as alteration products of ferromagnesianminerals. Magnesium also is present in sedimentaryrocks such as dolomite. The median concentration formagnesium was less than that of calcium, by a factorof seven (table 5). Magnesium and calcium havesimilar effects on the hardness of the water.
Sources of sodium are from natural deposits,road salt, or water softeners. Potassium is slightly lesscommon than sodium in igneous rocks but more abun-dant than sodium in all sedimentary rocks (Hem,1992). Chloride is present in natural water, but gener-
ally at low concentrations, and also may be presentbecause of human activities. Chloride concentrationsgreater than 250 mg/L may make drinking water tastesalty. At one site (site 19; appendix 1), the chlorideconcentration exceeded the USEPA SMCL standard of250 mg/L (U.S. Environmental Protection Agency,1996).
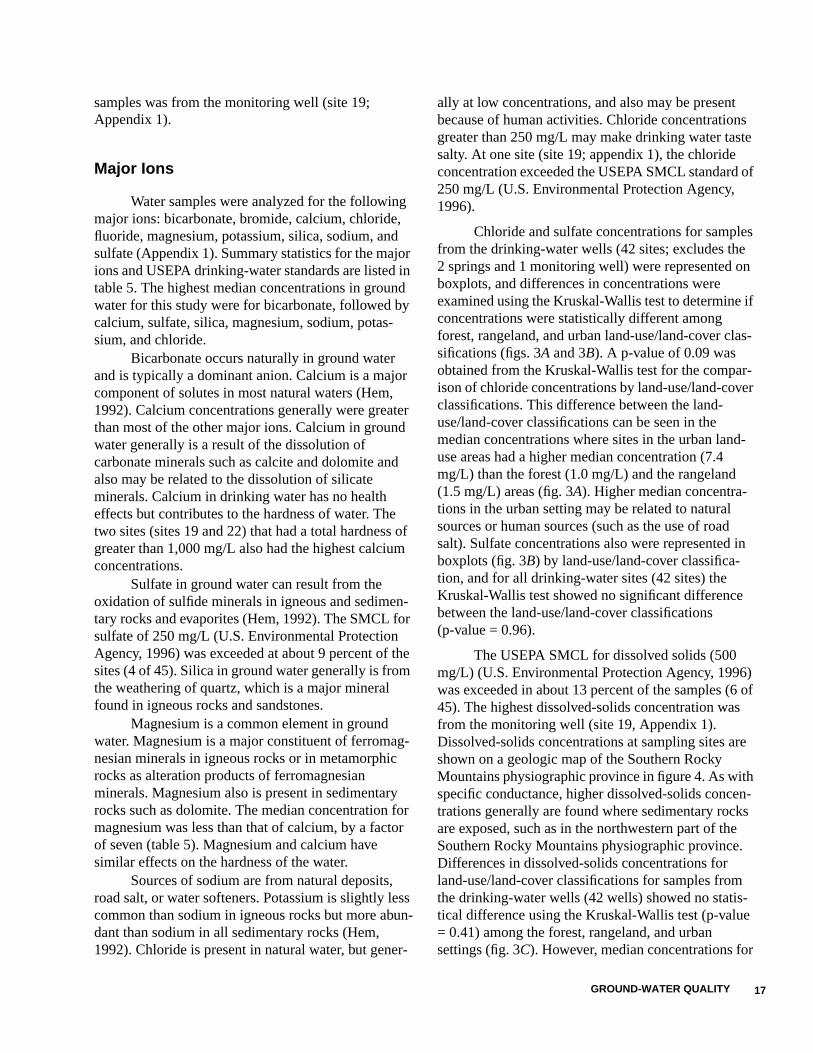
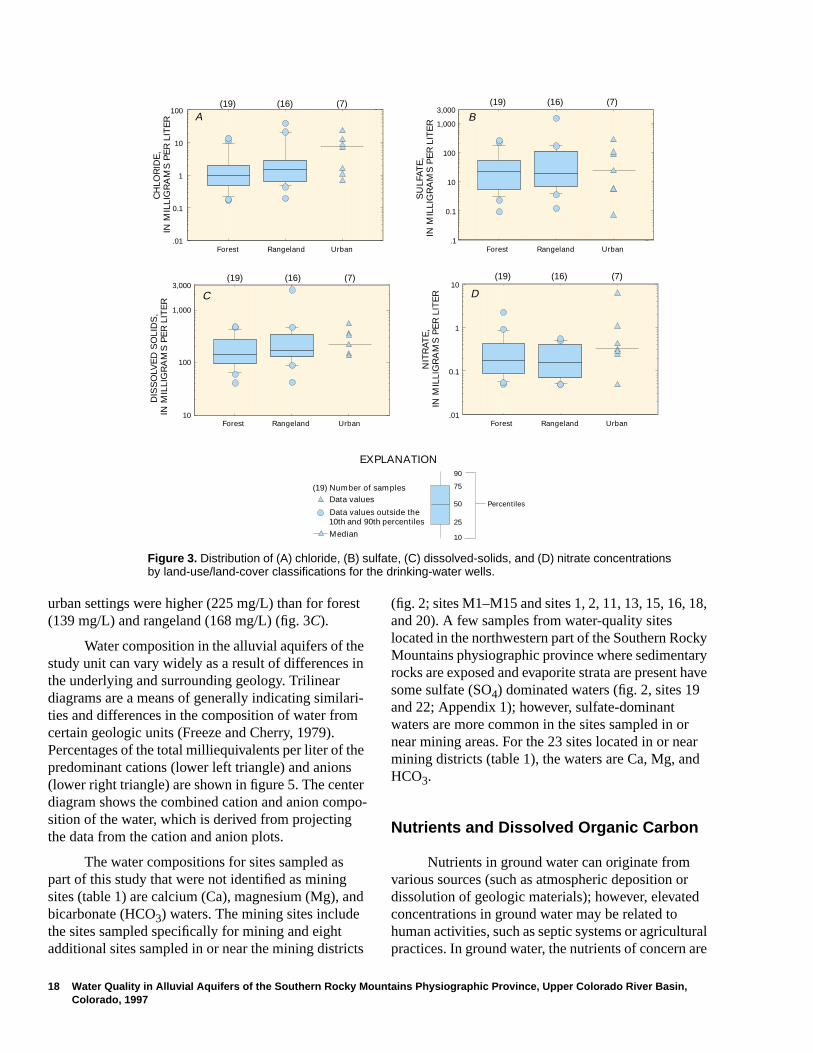
Chloride and sulfate concentrations for samplesfrom the drinking-water wells (42 sites; excludes the2 springs and 1 monitoring well) were represented onboxplots, and differences in concentrations wereexamined using the Kruskal-Wallis test to determine ifconcentrations were statistically different amongforest, rangeland, and urban land-use/land-cover clas-sifications (figs. 3A and 3B). A p-value of 0.09 wasobtained from the Kruskal-Wallis test for the compar-ison of chloride concentrations by land-use/land-coverclassifications. This difference between the land-use/land-cover classifications can be seen in themedian concentrations where sites in the urban land-use areas had a higher median concentration (7.4mg/L) than the forest (1.0 mg/L) and the rangeland(1.5 mg/L) areas (fig. 3A). Higher median concentra-tions in the urban setting may be related to naturalsources or human sources (such as the use of roadsalt). Sulfate concentrations also were represented inboxplots (fig. 3B) by land-use/land-cover classifica-tion, and for all drinking-water sites (42 sites) theKruskal-Wallis test showed no significant differencebetween the land-use/land-cover classifications(p-value = 0.96).
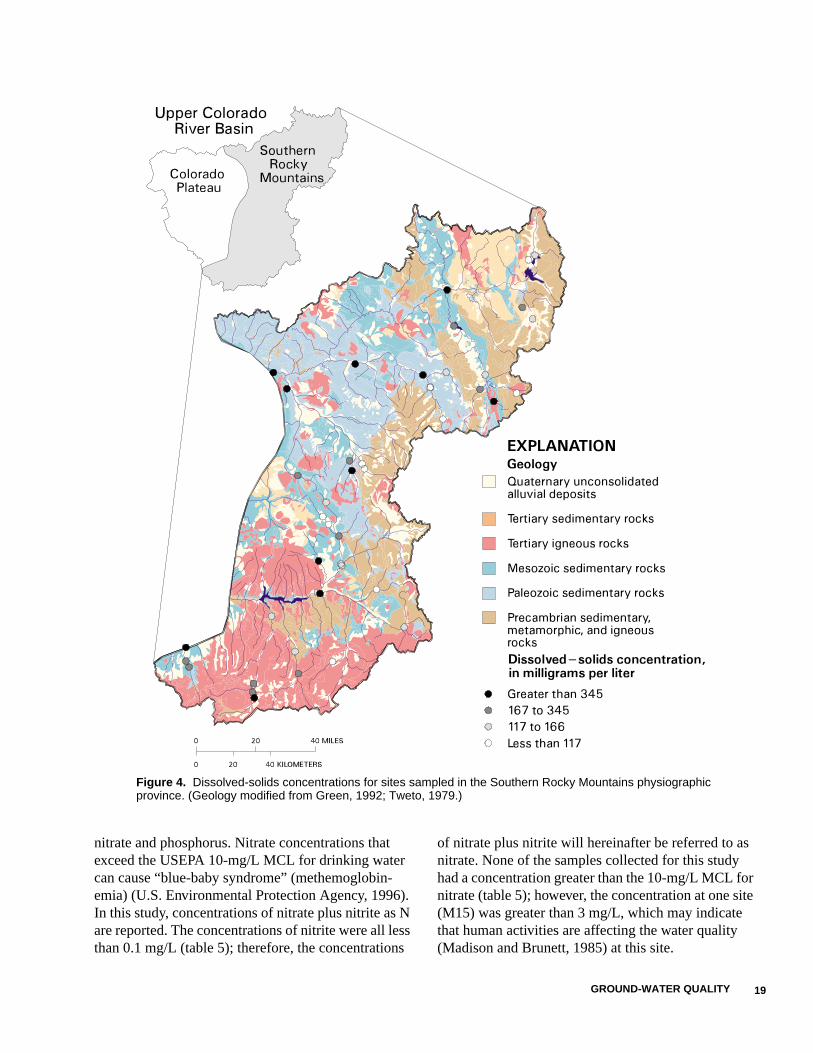
The USEPA SMCL for dissolved solids (500mg/L) (U.S. Environmental Protection Agency, 1996)was exceeded in about 13 percent of the samples (6 of45). The highest dissolved-solids concentration wasfrom the monitoring well (site 19, Appendix 1).Dissolved-solids concentrations at sampling sites areshown on a geologic map of the Southern RockyMountains physiographic province in figure 4. As withspecific conductance, higher dissolved-solids concen-trations generally are found where sedimentary rocksare exposed, such as in the northwestern part of theSouthern Rocky Mountains physiographic province.Differences in dissolved-solids concentrations forland-use/land-cover classifications for samples fromthe drinking-water wells (42 wells) showed no statis-tical difference using the Kruskal-Wallis test (p-value= 0.41) among the forest, rangeland, and urbansettings (fig. 3C). However, median concentrations for
18 Water Quality in Alluvial Aquifers of the Southern Rocky Mountains Physiographic Province, Upper Colorado River Basin,Colorado, 1997
(19) (16) (7)
0.1
B
EXPLANATION
(19) Number of samples
Data values outside the10th and 90th percentiles
Data values
Median
90
75
50
25
10
Percentiles
Forest Rangeland Urban
(19) (16) (7)
DIS
SO
LVE
D S
OLI
DS
,IN
MIL
LIG
RA
MS
PE
R L
ITE
R C
10
100
1,000
3,000
SU
LFAT
E,
IN M
ILLI
GR
AM
S P
ER
LIT
ER
Forest Rangeland Urban.1
10
100
1,000
3,000
.01
0.1
1
10
Forest Rangeland UrbanN
ITR
ATE
,IN
MIL
LIG
RA
MS
PE
R L
ITE
R
(19) (16) (7)
D
.01
0.1
1
10
100
Forest Rangeland Urban
CH
LOR
IDE
,IN
MIL
LIG
RA
MS
PE
R L
ITE
R
(19) (16) (7)
A
urban settings were higher (225 mg/L) than for forest(139 mg/L) and rangeland (168 mg/L) (fig. 3C).
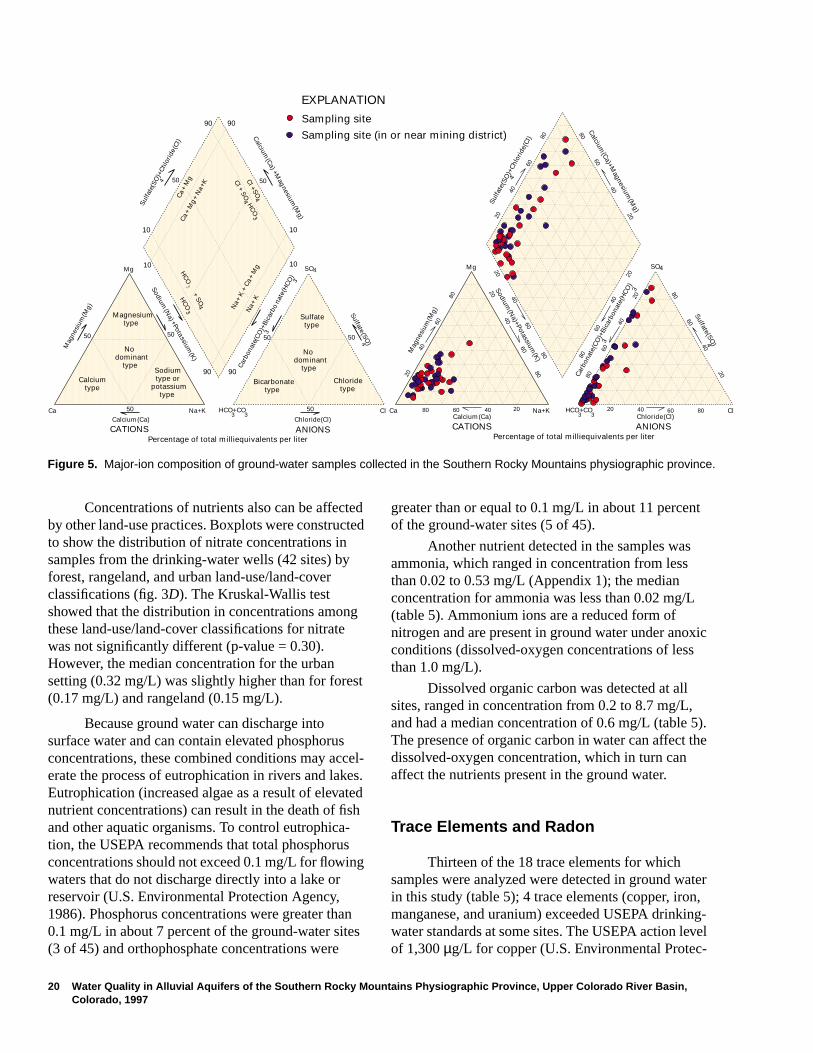
Water composition in the alluvial aquifers of thestudy unit can vary widely as a result of differences inthe underlying and surrounding geology. Trilineardiagrams are a means of generally indicating similari-ties and differences in the composition of water fromcertain geologic units (Freeze and Cherry, 1979).Percentages of the total milliequivalents per liter of thepredominant cations (lower left triangle) and anions(lower right triangle) are shown in figure 5. The centerdiagram shows the combined cation and anion compo-sition of the water, which is derived from projectingthe data from the cation and anion plots.
The water compositions for sites sampled aspart of this study that were not identified as miningsites (table 1) are calcium (Ca), magnesium (Mg), andbicarbonate (HCO3) waters. The mining sites includethe sites sampled specifically for mining and eightadditional sites sampled in or near the mining districts
(fig. 2; sites M1–M15 and sites 1, 2, 11, 13, 15, 16, 18,and 20). A few samples from water-quality siteslocated in the northwestern part of the Southern RockyMountains physiographic province where sedimentaryrocks are exposed and evaporite strata are present havesome sulfate (SO4) dominated waters (fig. 2, sites 19and 22; Appendix 1); however, sulfate-dominantwaters are more common in the sites sampled in ornear mining areas. For the 23 sites located in or nearmining districts (table 1), the waters are Ca, Mg, andHCO3.
Nutrients and Dissolved Organic Carbon
Nutrients in ground water can originate fromvarious sources (such as atmospheric deposition ordissolution of geologic materials); however, elevatedconcentrations in ground water may be related tohuman activities, such as septic systems or agriculturalpractices. In ground water, the nutrients of concern are
Figure 3. Distribution of (A) chloride, (B) sulfate, (C) dissolved-solids, and (D) nitrate concentrationsby land-use/land-cover classifications for the drinking-water wells.
19GROUND-WATER QUALITY
nitrate and phosphorus. Nitrate concentrations thatexceed the USEPA 10-mg/L MCL for drinking watercan cause “blue-baby syndrome” (methemoglobin-emia) (U.S. Environmental Protection Agency, 1996).In this study, concentrations of nitrate plus nitrite as Nare reported. The concentrations of nitrite were all lessthan 0.1 mg/L (table 5); therefore, the concentrations
of nitrate plus nitrite will hereinafter be referred to asnitrate. None of the samples collected for this studyhad a concentration greater than the 10-mg/L MCL fornitrate (table 5); however, the concentration at one site(M15) was greater than 3 mg/L, which may indicatethat human activities are affecting the water quality(Madison and Brunett, 1985) at this site.
Figure 4. Dissolved-solids concentrations for sites sampled in the Southern Rocky Mountains physiographicprovince. (Geology modified from Green, 1992; Tweto, 1979.)
20 Water Quality in Alluvial Aquifers of the Southern Rocky Mountains Physiographic Province, Upper Colorado River Basin,Colorado, 1997
ANIONSPercentage of total milliequivalents per liter
Chloride(Cl)Calcium(Ca)
Sulfate(SO)4
ClNa+KCa
Mg SO4
Calcium(Ca)+M
agnesium(M
g)
Sulfa
te(S
O)+
Chlo
ride(
Cl)
4
Mag
nesi
um(M
g)
Carb
onat
e(CO
)+Bi
carb
onat
e(H
CO)
3
3Sodium(N
a)+Potassium(K)
80
80
8080
8080
80
80
8080
6060
60
60
60
60
60
60
60
60
CATIONS
40
40 40
40
40
40
40
40
4040
20
2020
2020
20
20
20
20
20
ANIONSPercentage of total milliequivalents per liter
HCO+CO3 3
HCO+CO3 3
Chloride(Cl)Calcium(Ca)
Sulfate (SO)4
ClNa+KCa
Mg SO4
Calcium(Ca) +M
agnesium(M
g)
Sulfa
te(S
O)+
Chlo
ride(
Cl)
4
Mag
nesi
um(M
g)
Carb
onat
e(CO
)+Bi
carb
ona
te(H
CO)
3
3
Sodium (N
a) +Potassium(K)
CATIONS
Ca+
Mg
Ca+
Mg
+N
a+K Cl +SO
4
HCO
3 Na+
K
HCO
+SO
3
4
Cl +SO
HCO
4
3
Na+
K+
Ca+
Mg
50
50
50
5050
5050
50
10
1010
10
9090
9090
Nodominant
type
Calciumtype
Sodiumtype or
potassiumtype
Sulfatetype
Nodominant
type
Bicarbonatetype
Chloridetype
Magnesiumtype
EXPLANATION
Sampling site
Sampling site (in or near mining district)
Concentrations of nutrients also can be affectedby other land-use practices. Boxplots were constructedto show the distribution of nitrate concentrations insamples from the drinking-water wells (42 sites) byforest, rangeland, and urban land-use/land-coverclassifications (fig. 3D). The Kruskal-Wallis testshowed that the distribution in concentrations amongthese land-use/land-cover classifications for nitratewas not significantly different (p-value = 0.30).However, the median concentration for the urbansetting (0.32 mg/L) was slightly higher than for forest(0.17 mg/L) and rangeland (0.15 mg/L).
Because ground water can discharge intosurface water and can contain elevated phosphorusconcentrations, these combined conditions may accel-erate the process of eutrophication in rivers and lakes.Eutrophication (increased algae as a result of elevatednutrient concentrations) can result in the death of fishand other aquatic organisms. To control eutrophica-tion, the USEPA recommends that total phosphorusconcentrations should not exceed 0.1 mg/L for flowingwaters that do not discharge directly into a lake orreservoir (U.S. Environmental Protection Agency,1986). Phosphorus concentrations were greater than0.1 mg/L in about 7 percent of the ground-water sites(3 of 45) and orthophosphate concentrations were
greater than or equal to 0.1 mg/L in about 11 percentof the ground-water sites (5 of 45).
Another nutrient detected in the samples wasammonia, which ranged in concentration from lessthan 0.02 to 0.53 mg/L (Appendix 1); the medianconcentration for ammonia was less than 0.02 mg/L(table 5). Ammonium ions are a reduced form ofnitrogen and are present in ground water under anoxicconditions (dissolved-oxygen concentrations of lessthan 1.0 mg/L).
Dissolved organic carbon was detected at allsites, ranged in concentration from 0.2 to 8.7 mg/L,and had a median concentration of 0.6 mg/L (table 5).The presence of organic carbon in water can affect thedissolved-oxygen concentration, which in turn canaffect the nutrients present in the ground water.
Trace Elements and Radon
Thirteen of the 18 trace elements for whichsamples were analyzed were detected in ground waterin this study (table 5); 4 trace elements (copper, iron,manganese, and uranium) exceeded USEPA drinking-water standards at some sites. The USEPA action levelof 1,300 µg/L for copper (U.S. Environmental Protec-
Figure 5. Major-ion composition of ground-water samples collected in the Southern Rocky Mountains physiographic province.
GROUND-WATER QUALITY 21
EXPLANATION
(19) Number of samples
Data values outside the10th and 90th percentiles
Data values
Median
90
75
50
25
10
Percentiles
0.1
1
10
100
1,000
3,000
Forest Rangeland Urban
MA
NG
AN
ES
E,
IN M
ICR
OG
RA
MS
PE
R L
ITE
R
(19) (16) (7)
B
1
10
100
1,000
10,000
Forest Rangeland Urban
IRO
N,
IN M
ICR
OG
RA
MS
PE
R L
ITE
R
(19) (16) (7)
A
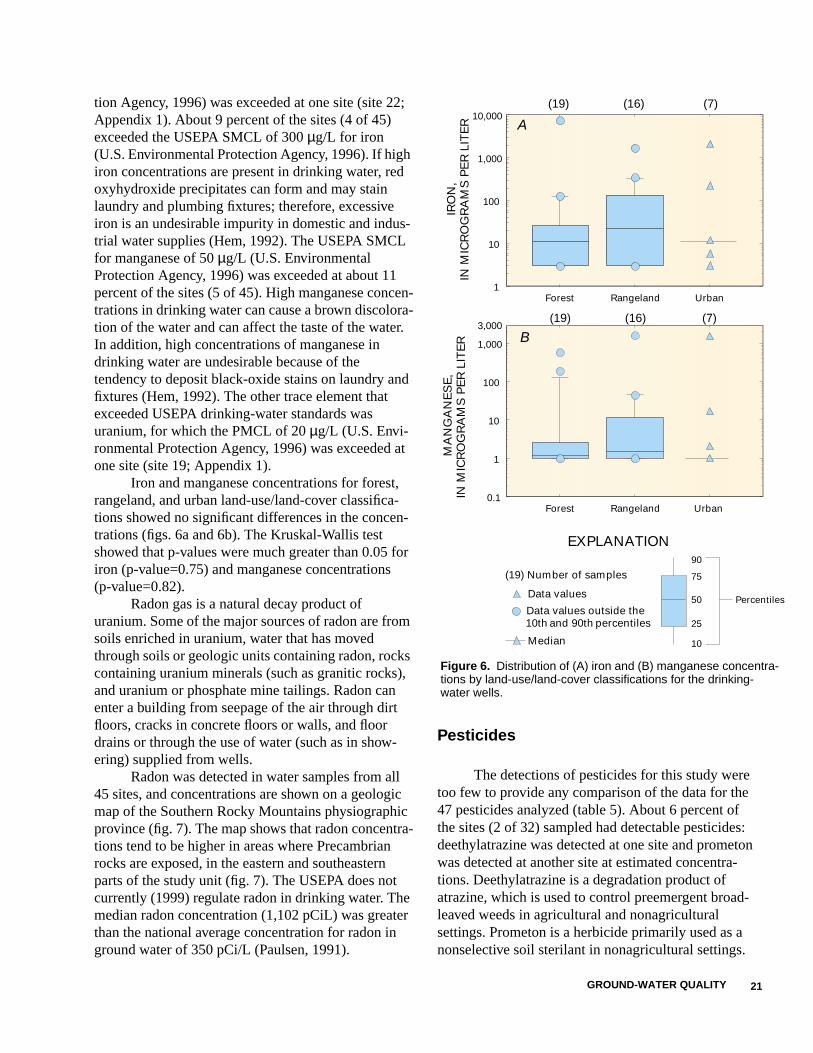
tion Agency, 1996) was exceeded at one site (site 22;Appendix 1). About 9 percent of the sites (4 of 45)exceeded the USEPA SMCL of 300 µg/L for iron(U.S. Environmental Protection Agency, 1996). If highiron concentrations are present in drinking water, redoxyhydroxide precipitates can form and may stainlaundry and plumbing fixtures; therefore, excessiveiron is an undesirable impurity in domestic and indus-trial water supplies (Hem, 1992). The USEPA SMCLfor manganese of 50 µg/L (U.S. EnvironmentalProtection Agency, 1996) was exceeded at about 11percent of the sites (5 of 45). High manganese concen-trations in drinking water can cause a brown discolora-tion of the water and can affect the taste of the water.In addition, high concentrations of manganese indrinking water are undesirable because of thetendency to deposit black-oxide stains on laundry andfixtures (Hem, 1992). The other trace element thatexceeded USEPA drinking-water standards wasuranium, for which the PMCL of 20 µg/L (U.S. Envi-ronmental Protection Agency, 1996) was exceeded atone site (site 19; Appendix 1).
Iron and manganese concentrations for forest,rangeland, and urban land-use/land-cover classifica-tions showed no significant differences in the concen-trations (figs. 6a and 6b). The Kruskal-Wallis testshowed that p-values were much greater than 0.05 foriron (p-value=0.75) and manganese concentrations(p-value=0.82).
Radon gas is a natural decay product ofuranium. Some of the major sources of radon are fromsoils enriched in uranium, water that has movedthrough soils or geologic units containing radon, rockscontaining uranium minerals (such as granitic rocks),and uranium or phosphate mine tailings. Radon canenter a building from seepage of the air through dirtfloors, cracks in concrete floors or walls, and floordrains or through the use of water (such as in show-ering) supplied from wells.
Radon was detected in water samples from all45 sites, and concentrations are shown on a geologicmap of the Southern Rocky Mountains physiographicprovince (fig. 7). The map shows that radon concentra-tions tend to be higher in areas where Precambrianrocks are exposed, in the eastern and southeasternparts of the study unit (fig. 7). The USEPA does notcurrently (1999) regulate radon in drinking water. Themedian radon concentration (1,102 pCiL) was greaterthan the national average concentration for radon inground water of 350 pCi/L (Paulsen, 1991).
Pesticides
The detections of pesticides for this study weretoo few to provide any comparison of the data for the47 pesticides analyzed (table 5). About 6 percent ofthe sites (2 of 32) sampled had detectable pesticides:deethylatrazine was detected at one site and prometonwas detected at another site at estimated concentra-tions. Deethylatrazine is a degradation product ofatrazine, which is used to control preemergent broad-leaved weeds in agricultural and nonagriculturalsettings. Prometon is a herbicide primarily used as anonselective soil sterilant in nonagricultural settings.
Figure 6. Distribution of (A) iron and (B) manganese concentra-tions by land-use/land-cover classifications for the drinking-water wells.
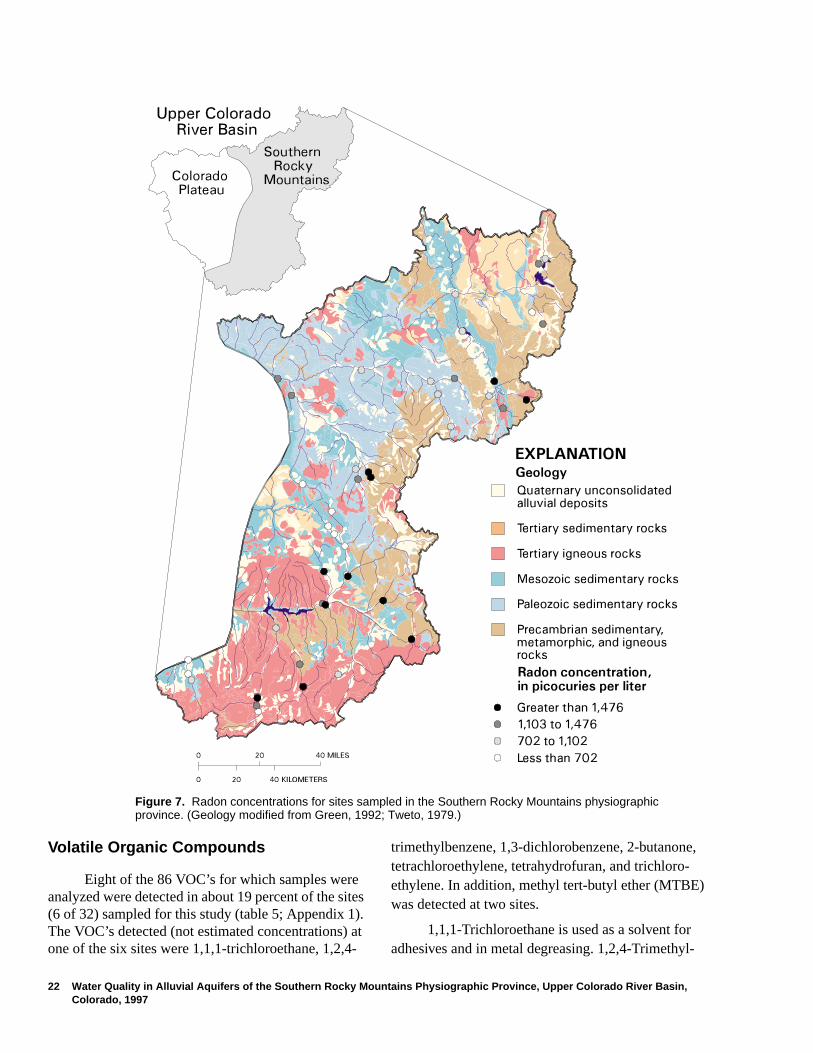
22 Water Quality in Alluvial Aquifers of the Southern Rocky Mountains Physiographic Province, Upper Colorado River Basin,Colorado, 1997
Volatile Organic Compounds
Eight of the 86 VOC’s for which samples wereanalyzed were detected in about 19 percent of the sites(6 of 32) sampled for this study (table 5; Appendix 1).The VOC’s detected (not estimated concentrations) atone of the six sites were 1,1,1-trichloroethane, 1,2,4-
trimethylbenzene, 1,3-dichlorobenzene, 2-butanone,tetrachloroethylene, tetrahydrofuran, and trichloro-ethylene. In addition, methyl tert-butyl ether (MTBE)was detected at two sites.
1,1,1-Trichloroethane is used as a solvent foradhesives and in metal degreasing. 1,2,4-Trimethyl-
Figure 7. Radon concentrations for sites sampled in the Southern Rocky Mountains physiographicprovince. (Geology modified from Green, 1992; Tweto, 1979.)
23SUMMARY
benzene is in petroleum by-products. 1,3-Dichloro-benzene is present in fumigants and insecticides.2-Butanone, which is also known as methyethylketone, is used as a solvent for adhesives and is also inpaints, varnishes, and lacquers. Tetrachloroethylene ispresent in solvents for adhesives and also is a by-product of dry cleaning. Tetrahydrofuran can be usedas a solvent for adhesives, is used in the process ofcreating polyvinyl chloride (PVC), and is also presentin glues used for joining plumbing fixtures. Trichloro-ethylene is used as a metal degreaser. Detections forthese 7 VOC’s were within drinking-water standards.
The concentrations measured for MTBE werebelow the USEPA DWA standard (table 5). MTBE isan organic compound added to gasoline to increase theoctane and reduce the carbon monoxide emissions.MTBE has been detected in shallow urban wellsthroughout the United States (Squillace and others,1996). Volatile organic compounds were mostcommonly detected in rangeland and urban settings(67 percent [6 of 9] of the detected compounds werefound associated with rangeland and urban land uses).The results for rangeland in the Southern RockyMountains physiographic province reflect in part theresidential development, which is predominantly inrural settings.
Bacteria and Methylene Blue ActiveSubstances
Samples from the 45 sites were analyzed fortotal coliform bacteria. Total coliform bacteria areanalyzed because these bacteria may be an indicator ofpathogenic bacteria (Myers and Sylvester, 1997).Coliform bacteria are present in wastewater and alsoare present naturally in the soils. At about 13 percentof the sites sampled (6 of 45), total coliform bacteriawere detected. For all sites, total coliform bacteriacounts ranged from less than 1 to 60 cols/100 mL.Samples that had detectable bacteria were alsoanalyzed for E. coli; however, E. coli (an indication offecal contamination) was not detected in any of thesamples. A count of 1 col/100 mL of total coliformbacteria in water exceeds the USEPA MCLG drinking-water standard (U.S. Environmental ProtectionAgency, 1996).
Samples also were analyzed for MBAS, whichcan be an indicator of contamination by wastewater.The MBAS analysis tests for the presence of anionic
sulfate- and sulfonate-based surfactants (Burkhardtand others, 1995) that are present in soaps and deter-gents. MBAS concentrations ranged from less than thereporting limit of 0.02 to 0.04 mg/L, of which 7percent (3 of 45) were above the reporting limit. Thelow concentrations make it difficult to determine ifthere is possible contamination from wastewater (suchas from individual septic disposal systems). Otherconstituents (such as nutrients and bacteria) that maybe an indication of contamination from wastewateralso need to be examined in order to determine if thepossibility exists for contamination.
SUMMARY
In 1997, 45 ground-water sites were sampled inthe Upper Colorado River Basin of Colorado to assessthe ground-water-quality conditions in a major aquifersystem for parts of the Southern Rocky Mountainsphysiographic province. Selected preexisting wellswere sampled in alluvial aquifers because the alluvialaquifers generally are productive aquifers and wellsare easily developed in these aquifers. Of the 45 sitessampled, two were springs and one was a monitoringwell not used for a water supply. Some of the 45 sitessampled also were located in or near mining districts.However, statistical differences were not observedbetween samples from the mining sites and those fromsites not associated with mining activities for most ofthe constituents analyzed; therefore, all sites wereanalyzed together.
Specific conductance for the ground-water sitesranged from 57 to 6,650 µS/cm. The highest concen-trations of specific conductance were from siteslocated in the northwestern part of the study unit.Dissolved-oxygen concentrations ranged from 0.1 to6.0 mg/L and had a median concentration of 2.9 mg/L.The pH values ranged from 6.1 to 8.1; about 4 percentof the sites (2 of 45) were below the SMCL range,which ranges from 6.5 to 8.5. About 5 percent (2 of43 samples) of the samples exceeded the U.S. Envi-ronmental Protection Agency recommended turbidityvalue of 5 NTU; one of the two samples was from themonitoring well.
Dissolved-solids concentrations were higherwhere sedimentary rocks are exposed, such asin the northwestern part of the Southern RockyMountains physiographic province. Dissolved-solidsconcentrations were not significantly different
24 Water Quality in Alluvial Aquifers of the Southern Rocky Mountains Physiographic Province, Upper Colorado River Basin,Colorado, 1997
(Kruskal-Wallis test; p-value = 0.41) among land-use/land-cover classifications (forest, rangeland, andurban) in the drinking-water wells (42 sites) sampledin this study. Water compositions for most of the siteswere calcium, magnesium, and bicarbonate waters;however, sulfate-dominant waters were identified insites located in areas of exposed sedimentary rocksand in or near mining districts in the basin. Sulfateconcentrations exceeded the U.S. EnvironmentalProtection Agency SMCL drinking-water standard atabout 9 percent of the sites (4 of 45).
Nutrient concentrations for sites sampled as partof this study were within drinking-water standards.Only one site had a nitrate concentration greater than3.0 mg/L, indicating a possible influence from humanactivities. Nitrate concentrations were not significantlydifferent (Kruskal-Wallis test; p-value = 0.30) amongland-use/land-cover classifications in the drinking-water wells (42 sites).
The trace elements that most often did not meetdrinking-water standards were iron and manganese.The SMCL for iron was exceeded at about 9 percent (4of 45) of the sites, and the SMCL for manganese wasexceeded at 11 percent (5 of 45) of the sites. Iron andmanganese concentrations in the drinking-water wells(42 sites) were not significantly different among theland-use/land-cover classifications (forest, rangeland,and urban). Radon concentrations were higher in theeastern and southeastern parts of the study unit wherePrecambrian rocks are exposed. All samples exceededthe USEPA PMCL of 300 pCi/L for radon, a standardwhich has been withdrawn by the USEPA and iscurrently under review. Radon is a natural decayproduct of uranium, and the presence of radon in wateris related to the soils and hydrologic units throughwhich the water travels.
Pesticides were detected at concentrationsbelow the reporting limits, and concentrations weretoo few to allow for comparisons of the data. However,8 VOC’s were detected at about 19 percent of thesites (6 of 32). Concentrations for all VOC’s detectedwere less than the USEPA drinking-water standards.The majority of the VOC’s detected were in rangelandclassification, which reflects the residential develop-ment in rural settings of the Southern Rocky Moun-tains physiographic province.
At about 13 percent of the sites sampled (6 of45), total coliform bacteria were detected, but no E.coli was detected. The USEPA has a MCLG of zerobacteria (0 cols/100 mL) for drinking water. Meth-
ylene blue active substances (MBAS) were analyzedand detected at about 7 percent of the sites (3 of 45).The MBAS concentrations were just above thereporting limit of 0.2 mg/L. These low concentrationsmake it difficult to determine if the data show contam-ination from human factors.
Overall, the water from the sites sampled in thealluvial aquifers throughout the Southern RockyMountains physiographic province is suitable for mostuses. Exceedances of the USEPA SMCL’s fordissolved solids, sulfate, iron, and manganese areprobably a function of the surrounding geology andmay be influenced by the low dissolved oxygen atsome sites. Radon, which occurs naturally, wasdetected in all the samples at concentrations greaterthan 300 pCi/L. The presence of nitrate at one site at aconcentration above 3.0 mg/L and the detections ofVOC’s and MBAS at other sites may indicate someeffects of human activities on the water quality.
REFERENCES CITED
American Public Health Association, American WaterWorks Association, and Water Pollution ControlFederation, 1992, Standard methods for the analysis ofwater and wastewater (18th ed.): Washington, D.C.,American Public Health Association [variously pagi-nated].
American Society for Testing and Materials, 1992, Annualbook of ASTM standards, Section 11, Water and Envi-ronmental Technology: Philadelphia, v. 11.02, [pagina-tion unknown].
Apodaca, L.E., 1998, Analysis of ground-water-quality dataof the Upper Colorado River Basin, water years 1972–92: U.S. Geological Survey Water-Resources Investi-gations Report 97–4240, 31 p.
Apodaca, L.E., Driver, N.E., Stephens, V.C., and Spahr,N.E., 1996, Environmental setting and implications onwater quality, Upper Colorado River Basin, Coloradoand Utah: U.S. Geological Survey Water-ResourcesInvestigations Report 95–4263, 33 p.
Brenton, R.W., and Arnett, T.L., 1993, Methods of analysisby the U.S. Geological Survey National Water-QualityLaboratory—Determination of dissolved organiccarbon by UV-promoted persulfate oxidation andinfrared spectrometry: U.S. Geological Survey Open-File Report 92–480, 12 p.
25REFERENCES CITED
Britton, L.J., and Greeson, P.E., eds., 1989, Methods forcollection and analysis of aquatic biological andmicrobiological samples: U.S. Geological SurveyTechniques of Water-Resources Investigations, book 5,chap. A4, 363 p.
Burkhardt, M.R., Cinotto, P.J., Frahm, G.W., Woodworth,M.T., and Pritt, J.W., 1995, Methods of analysis by theU.S. Geological Survey National Water Quality Labo-ratory—Determination of methylene blue activesubstances by spectrophotometry: U.S. GeologicalSurvey Open-File Report 95–189, 16 p.
Colorado Department of Public Health and Environment,1994, Water quality in Colorado: Denver, ColoradoWater Quality Control Division, 141 p.
Fegeas, R.G., Claire, R.W., Guptil, S.C., Anderson, K.E.,and Hallam, C.A., 1983, U.S. Geological Surveydigital cartographic data standards—Land use and landcover digital data: U.S. Geological Survey Circular895–E, 21 p.
Fenneman, N.M., and Johnson, D.W., 1946, Map of phys-ical divisions of the United States: U.S. GeologicalSurvey, scale 1:7,000.000.
Field, J.A., Leenheer, J.A., Thorn, K.A., Barber, L.B., II,Rostad, Colleen, Macalady, D.L., and Daniel, S.R.,1992, Identification of persistent anionic surfactant-derived chemicals in sewage effluent and groundwater:Journal of Contaminant Hydrology, v. 9, p. 55–78.
Fishman, M.J., 1993, Methods of analysis by the U.S.Geological Survey National Water Quality Labora-tory—Determination of inorganic and organic constit-uents in water and fluvial sediments: U.S. GeologicalSurvey Open-File Report 93–125, 217 p.
Fishman, M.J., and Friedman, L.C., eds., 1989, Methods fordetermination of inorganic substances in water andfluvial sediments: U.S. Geological Survey Techniquesof Water-Resources Investigations, book 5, chap. A1,545 p.
Freeze, R.A., and Cherry, J.A., 1979, Groundwater: Engle-wood Cliffs, N.J., Prentice-Hall Inc., 604 p.
Gilliom, R.J., Alley, W.M., and Gurtz, M.E., 1995, Designof the National Water-Quality AssessmentProgram—Occurrence and distribution of water-quality conditions: U.S. Geological Survey Circular1112, 33 p.
Green, G.N., 1992, The digital geological map of Coloradoin Arc/Info format: Denver, U.S. Geological Survey(revised April 12, 1995), Open-File Report 0507, scale1:500,000.
Helsel, D.R., and Hirsch, R.M., 1992, Statistical methods inwater resources: Amsterdam, The Netherlands,Elsevier, 522 p.
Hem, J.D., 1992, Study and interpretation of the chemicalcharacteristics of natural water: U.S. GeologicalSurvey Water-Supply Paper 2254, 263 p.
Hitt, K.J., 1995, Refining 1970's land-use data with 1990population data to indicate new residential develop-ment: U.S. Geological Survey Water-Resources Inves-tigations Report 94–4250, 15 p.
Koterba, M.T., Wilde, F.D., and Lapham, W.W., 1995,Ground-water data-collection protocols and proceduresfor the National Water-Quality Assessment program—Collection and documentation of water-qualitysamples and related data: U.S. Geological SurveyOpen-File Report 95–399, 113 p.
Madison, R.J., and Brunett, J.O., 1985, Overview of theoccurrence of nitrate in ground water of the UnitedStates, in National water summary 1984—Hydrologicevents, selected water-quality trends, and ground-waterresources: U.S. Geological Survey Water-Supply Paper2275, p. 93–105.
Myers, D.N., and Sylvester, M.A., 1997, Fecal indicatorbacteria: U.S. Geological Survey-Techniques of Water-Resources Investigations, book 9, chap. A7, 38 p.
National Oceanic and Atmospheric Administration, 1994,Climatological data annual summary Colorado 1994:U.S. Department of Commerce, v. 99, no. 13, 36 p.
Paulsen, R.T., 1991, Radionuclides in ground water, rockand soil, and indoor air of the Northeastern UnitedStates and Southeastern Canada—A literature reviewand summary of data, in Gunderson, L.C.S., andWanty, R.B., eds., Field studies of radon in rocks, soils,and water: U.S. Geological Survey Bulletin 1971, p.195–225.
Romberger, S.B., 1980, Metallic mineral resources of Colo-rado, in Kent, H.C., and Porter, K.W., eds., Coloradogeology: Denver, Colorado, Rocky Mountain Associa-tion of Geologists, p. 225–236.
Rose, D.L., and Schroeder, M.P., 1995, Methods of analysisby the U.S. Geological Survey National Water QualityLaboratory—Determination of volatile organiccompounds in water by purge and trap capillary gaschromatography/mass spectrometry: U.S. GeologicalSurvey Open-File Report 94–708, 26 p.
Scott, J.C., 1990, Computerized stratified random site-selec-tion approaches for design of a ground-water-qualitysampling network: U.S. Geological Survey Water-Resources Investigations Report 90–4101, 109 p.
Shelton, L.R., 1995, Field guide for collecting andprocessing stream-water samples for the NationalWater-Quality Assessment program: U.S. GeologicalSurvey Open-File Report 94–455, 42 p.
Squillace, P.J., Zogorski, J.S., Wilbur, W.G., and Price, C.V.,1996, Preliminary assessment of the occurrence andpossible sources of MTBE in groundwater in theUnited States, 1993–1994: Environmental Science andTechnology, v. 30, no. 5, p. 1721–1730.
26 Water Quality in Alluvial Aquifers of the Southern Rocky Mountains Physiographic Province, Upper Colorado River Basin,Colorado, 1997
Streufert, R.K., and Cappa, J.A., 1994, Location map anddescriptions of metal occurrences in Colorado withnotes on economic potential: Colorado GeologicalSurvey Division of Minerals and Geology Departmentof Natural Resources, Map Series 28, scale 1:500,000,p. 33.
Tweto, Ogden, comp., 1979, Geologic map of Colorado:U.S. Geological Survey State Geologic Map, scale1:500,000 (reprinted).
U.S. Bureau of the Census, 1994, 1994 Census of popula-tion and housing: Washington D.C., data on CD-ROM,www.census.gov/population/www/censusdata/pop-hc.html (accessed 02/25/00).
U.S. Environmental Protection Agency, 1986, Qualitycriteria for water 1986: Washington, D.C., U.S. Envi-ronmental Protection Agency Report 440/5–86–001,Office of Water, [variously paginated].
U.S. Environmental Protection Agency, 1991, Test methodsfor Escherichia coli in drinking water—EC mediumwith mug tube procedure and nutrient agar with mugmembrane filter procedure: Cincinnati, Ohio, U.S.
Environmental Protection Agency, EPA–600/4–85/076, 24 p.
U.S. Environmental Protection Agency, 1996, Drinkingwater regulations and health advisories: Washington,D.C., U.S. Environmental Protection Agency Report822–B–96–002, Office of Water, [paginationunknown].
U.S. Geological Survey, 1985, National water summary1984—Hydrologic events, selected water-qualitytrends, and ground-water resources: U.S. GeologicalSurvey Water-Supply Paper 2275, p. 153–160.
U.S. Geological Survey, 1999, The quality of our Nation’swaters—Nutrients and pesticides: U.S. GeologicalSurvey Circular 1225, 82 p.
Zaugg, S.D., Sandstrom, M.W., Smith, S.G., and Fehlberg,K.M., 1995, Methods of analysis by the U.S. Geolog-ical Survey National Water Quality Laboratory—Determination of pesticides in water by C–18 solid-phase extraction and capillary column gas chromatog-raphy/mass spectrometry with selected-ion moni-toring: U.S. Geological Survey Open-File Report 95–181, 60 p.
APPENDIX
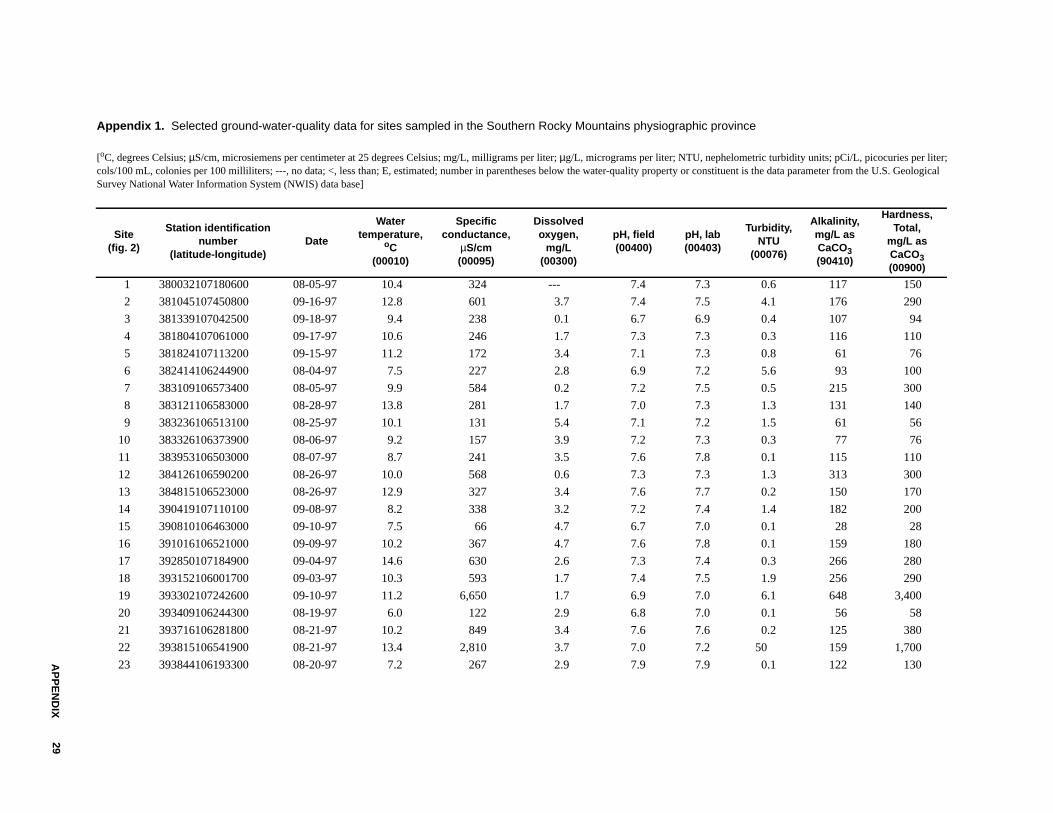
AP
PE
ND
IX29
Appendix 1. Selected ground-water-quality data for sites sampled in the Southern Rocky Mountains physiographic province
[oC, degrees Celsius; µS/cm, microsiemens per centimeter at 25 degrees Celsius; mg/L, milligrams per liter; µg/L, micrograms per liter; NTU, nephelometric turbidity units; pCi/L, picocuries per liter;cols/100 mL, colonies per 100 milliliters; ---, no data; <, less than; E, estimated; number in parentheses below the water-quality property or constituent is the data parameter from the U.S. GeologicalSurvey National Water Information System (NWIS) data base]
Site(fig. 2)
Station identificationnumber
(latitude-longitude)Date
Watertemperature,
oC(00010)
Specificconductance,
µS/cm(00095)
Dissolvedoxygen,
mg/L(00300)
pH, field(00400)
pH, lab(00403)
Turbidity,NTU
(00076)
Alkalinity,mg/L asCaCO3(90410)
Hardness,Total,
mg/L asCaCO3(00900)
1 380032107180600 08-05-97 10.4 324 --- 7.4 7.3 0.6 117 150
2 381045107450800 09-16-97 12.8 601 3.7 7.4 7.5 4.1 176 290
3 381339107042500 09-18-97 9.4 238 0.1 6.7 6.9 0.4 107 94
4 381804107061000 09-17-97 10.6 246 1.7 7.3 7.3 0.3 116 110
5 381824107113200 09-15-97 11.2 172 3.4 7.1 7.3 0.8 61 76
6 382414106244900 08-04-97 7.5 227 2.8 6.9 7.2 5.6 93 100
7 383109106573400 08-05-97 9.9 584 0.2 7.2 7.5 0.5 215 300
8 383121106583000 08-28-97 13.8 281 1.7 7.0 7.3 1.3 131 140
9 383236106513100 08-25-97 10.1 131 5.4 7.1 7.2 1.5 61 56
10 383326106373900 08-06-97 9.2 157 3.9 7.2 7.3 0.3 77 76
11 383953106503000 08-07-97 8.7 241 3.5 7.6 7.8 0.1 115 110
12 384126106590200 08-26-97 10.0 568 0.6 7.3 7.3 1.3 313 300
13 384815106523000 08-26-97 12.9 327 3.4 7.6 7.7 0.2 150 170
14 390419107110100 09-08-97 8.2 338 3.2 7.2 7.4 1.4 182 200
15 390810106463000 09-10-97 7.5 66 4.7 6.7 7.0 0.1 28 28
16 391016106521000 09-09-97 10.2 367 4.7 7.6 7.8 0.1 159 180
17 392850107184900 09-04-97 14.6 630 2.6 7.3 7.4 0.3 266 280
18 393152106001700 09-03-97 10.3 593 1.7 7.4 7.5 1.9 256 290
19 393302107242600 09-10-97 11.2 6,650 1.7 6.9 7.0 6.1 648 3,400
20 393409106244300 08-19-97 6.0 122 2.9 6.8 7.0 0.1 56 58
21 393716106281800 08-21-97 10.2 849 3.4 7.6 7.6 0.2 125 380
22 393815106541900 08-21-97 13.4 2,810 3.7 7.0 7.2 50 159 1,700
23 393844106193300 08-20-97 7.2 267 2.9 7.9 7.9 0.1 122 130
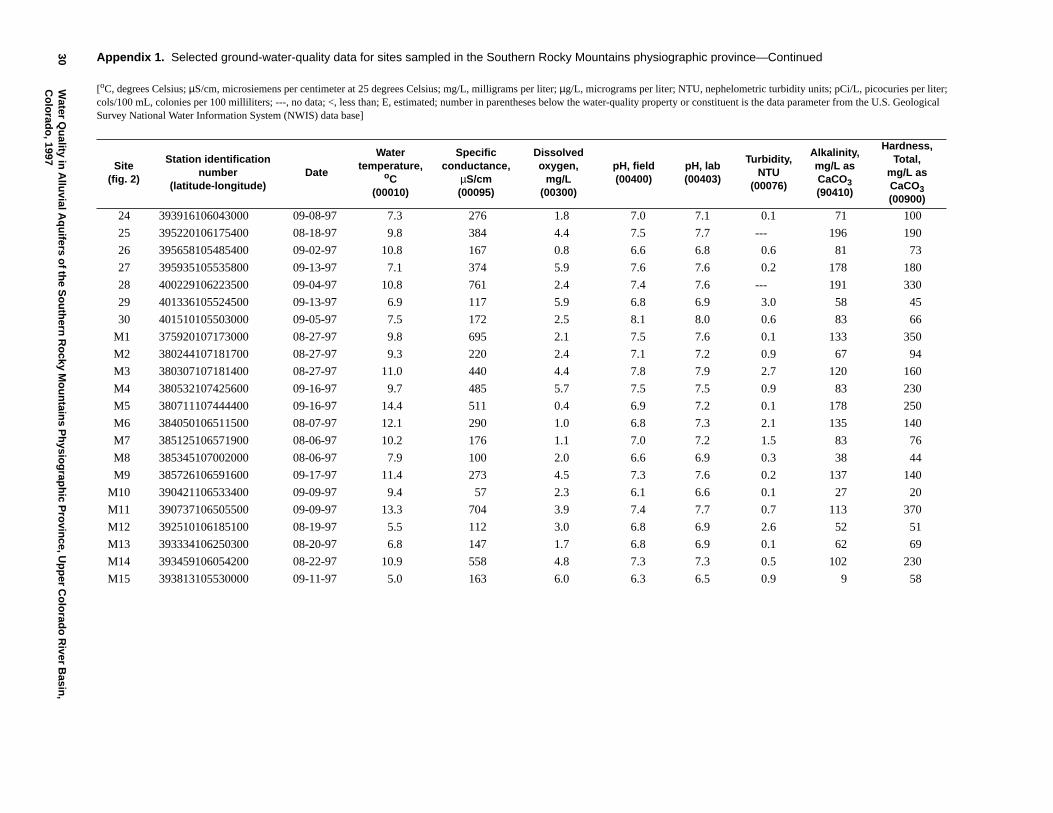
30W
aterQ
uality
inA
lluvialA
qu
iferso
fthe
So
uth
ernR
ocky
Mo
un
tains
Ph
ysiog
raph
icP
rovin
ce,Up
per
Co
lorad
oR
iverB
asin,
Co
lorad
o, 1997
Site(fig. 2)
Station identificationnumber
(latitude-longitude)Date
Watertemperature,
oC(00010)
Specificconductance,
µS/cm(00095)
Dissolvedoxygen,
mg/L(00300)
pH, field(00400)
pH, lab(00403)
Turbidity,NTU
(00076)
Alkalinity,mg/L asCaCO3(90410)
Hardness,Total,
mg/L asCaCO3(00900)
24 393916106043000 09-08-97 7.3 276 1.8 7.0 7.1 0.1 71 100
25 395220106175400 08-18-97 9.8 384 4.4 7.5 7.7 --- 196 190
26 395658105485400 09-02-97 10.8 167 0.8 6.6 6.8 0.6 81 73
27 395935105535800 09-13-97 7.1 374 5.9 7.6 7.6 0.2 178 180
28 400229106223500 09-04-97 10.8 761 2.4 7.4 7.6 --- 191 330
29 401336105524500 09-13-97 6.9 117 5.9 6.8 6.9 3.0 58 45
30 401510105503000 09-05-97 7.5 172 2.5 8.1 8.0 0.6 83 66
M1 375920107173000 08-27-97 9.8 695 2.1 7.5 7.6 0.1 133 350
M2 380244107181700 08-27-97 9.3 220 2.4 7.1 7.2 0.9 67 94
M3 380307107181400 08-27-97 11.0 440 4.4 7.8 7.9 2.7 120 160
M4 380532107425600 09-16-97 9.7 485 5.7 7.5 7.5 0.9 83 230
M5 380711107444400 09-16-97 14.4 511 0.4 6.9 7.2 0.1 178 250
M6 384050106511500 08-07-97 12.1 290 1.0 6.8 7.3 2.1 135 140
M7 385125106571900 08-06-97 10.2 176 1.1 7.0 7.2 1.5 83 76
M8 385345107002000 08-06-97 7.9 100 2.0 6.6 6.9 0.3 38 44
M9 385726106591600 09-17-97 11.4 273 4.5 7.3 7.6 0.2 137 140
M10 390421106533400 09-09-97 9.4 57 2.3 6.1 6.6 0.1 27 20
M11 390737106505500 09-09-97 13.3 704 3.9 7.4 7.7 0.7 113 370
M12 392510106185100 08-19-97 5.5 112 3.0 6.8 6.9 2.6 52 51
M13 393334106250300 08-20-97 6.8 147 1.7 6.8 6.9 0.1 62 69
M14 393459106054200 08-22-97 10.9 558 4.8 7.3 7.3 0.5 102 230
M15 393813105530000 09-11-97 5.0 163 6.0 6.3 6.5 0.9 9 58
Appendix 1. Selected ground-water-quality data for sites sampled in the Southern Rocky Mountains physiographic province—Continued
[oC, degrees Celsius; µS/cm, microsiemens per centimeter at 25 degrees Celsius; mg/L, milligrams per liter; µg/L, micrograms per liter; NTU, nephelometric turbidity units; pCi/L, picocuries per liter;cols/100 mL, colonies per 100 milliliters; ---, no data; <, less than; E, estimated; number in parentheses below the water-quality property or constituent is the data parameter from the U.S. GeologicalSurvey National Water Information System (NWIS) data base]
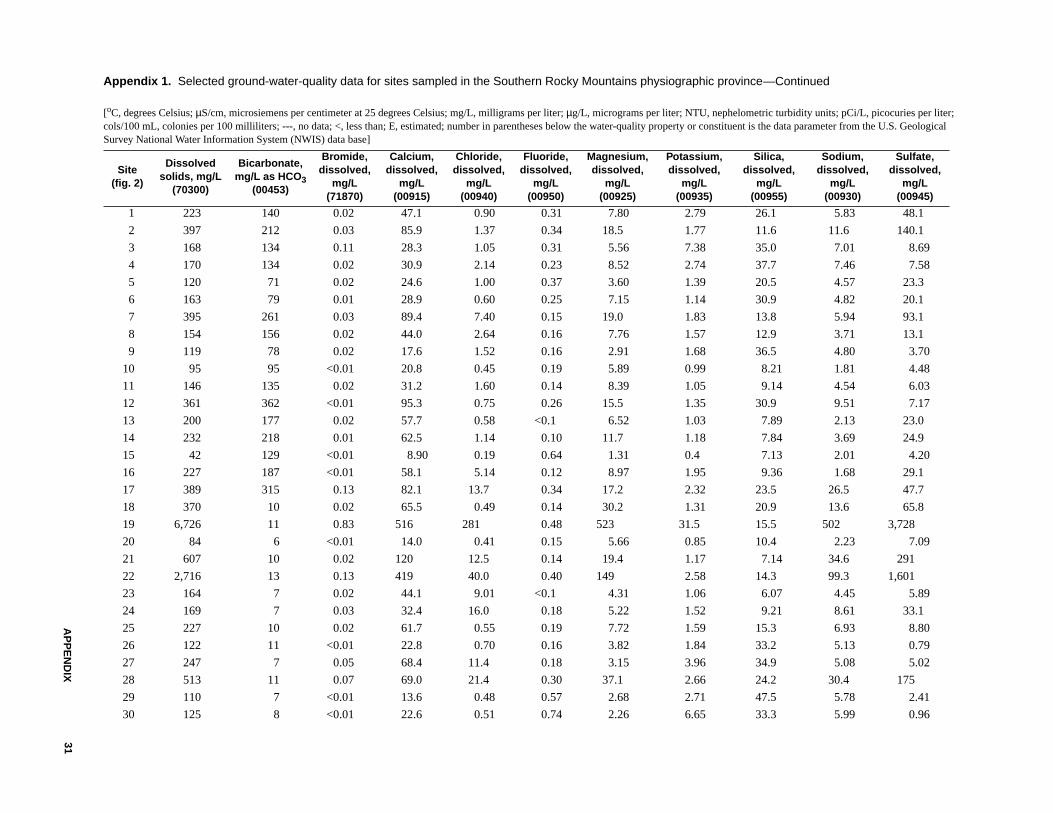
AP
PE
ND
IX31
Appendix 1. Selected ground-water-quality data for sites sampled in the Southern Rocky Mountains physiographic province
[oC, degrees Celsius; µS/cm, microsiemens per centimeter at 25 degrees Celsius; mg/L, milligrams per liter; µg/L, micrograms per liter; NTU, nephelometric turbidity units; pCi/L, picocuries per liter;cols/100 mL, colonies per 100 milliliters; ---, no data; <, less than; E, estimated; number in parentheses below the water-quality property or constituent is the data parameter from the U.S. GeologicalSurvey National Water Information System (NWIS) data base]
Site(fig. 2)
Dissolvedsolids, mg/L
(70300)
Bicarbonate,mg/L as HCO3
(00453)
Bromide,dissolved,
mg/L(71870)
Calcium,dissolved,
mg/L(00915)
Chloride,dissolved,
mg/L(00940)
Fluoride,dissolved,
mg/L(00950)
Magnesium,dissolved,
mg/L(00925)
Potassium,dissolved,
mg/L(00935)
Silica,dissolved,
mg/L(00955)
Sodium,dissolved,
mg/L(00930)
Sulfate,dissolved,
mg/L(00945)
1 223 140 0.02 47.1 0.90 0.31 7.80 2.79 26.1 5.83 48.1
2 397 212 0.03 85.9 1.37 0.34 18.5 1.77 11.6 11.6 140.1
3 168 134 0.11 28.3 1.05 0.31 5.56 7.38 35.0 7.01 8.69
4 170 134 0.02 30.9 2.14 0.23 8.52 2.74 37.7 7.46 7.58
5 120 71 0.02 24.6 1.00 0.37 3.60 1.39 20.5 4.57 23.3
6 163 79 0.01 28.9 0.60 0.25 7.15 1.14 30.9 4.82 20.1
7 395 261 0.03 89.4 7.40 0.15 19.0 1.83 13.8 5.94 93.1
8 154 156 0.02 44.0 2.64 0.16 7.76 1.57 12.9 3.71 13.1
9 119 78 0.02 17.6 1.52 0.16 2.91 1.68 36.5 4.80 3.70
10 95 95 <0.01 20.8 0.45 0.19 5.89 0.99 8.21 1.81 4.48
11 146 135 0.02 31.2 1.60 0.14 8.39 1.05 9.14 4.54 6.03
12 361 362 <0.01 95.3 0.75 0.26 15.5 1.35 30.9 9.51 7.17
13 200 177 0.02 57.7 0.58 <0.1 6.52 1.03 7.89 2.13 23.0
14 232 218 0.01 62.5 1.14 0.10 11.7 1.18 7.84 3.69 24.9
15 42 129 <0.01 8.90 0.19 0.64 1.31 0.4 7.13 2.01 4.20
16 227 187 <0.01 58.1 5.14 0.12 8.97 1.95 9.36 1.68 29.1
17 389 315 0.13 82.1 13.7 0.34 17.2 2.32 23.5 26.5 47.7
18 370 10 0.02 65.5 0.49 0.14 30.2 1.31 20.9 13.6 65.8
19 6,726 11 0.83 516 281 0.48 523 31.5 15.5 502 3,728
20 84 6 <0.01 14.0 0.41 0.15 5.66 0.85 10.4 2.23 7.09
21 607 10 0.02 120 12.5 0.14 19.4 1.17 7.14 34.6 291
22 2,716 13 0.13 419 40.0 0.40 149 2.58 14.3 99.3 1,601
23 164 7 0.02 44.1 9.01 <0.1 4.31 1.06 6.07 4.45 5.89
24 169 7 0.03 32.4 16.0 0.18 5.22 1.52 9.21 8.61 33.1
25 227 10 0.02 61.7 0.55 0.19 7.72 1.59 15.3 6.93 8.80
26 122 11 <0.01 22.8 0.70 0.16 3.82 1.84 33.2 5.13 0.79
27 247 7 0.05 68.4 11.4 0.18 3.15 3.96 34.9 5.08 5.02
28 513 11 0.07 69.0 21.4 0.30 37.1 2.66 24.2 30.4 175
29 110 7 <0.01 13.6 0.48 0.57 2.68 2.71 47.5 5.78 2.41
30 125 8 <0.01 22.6 0.51 0.74 2.26 6.65 33.3 5.99 0.96
—Continued
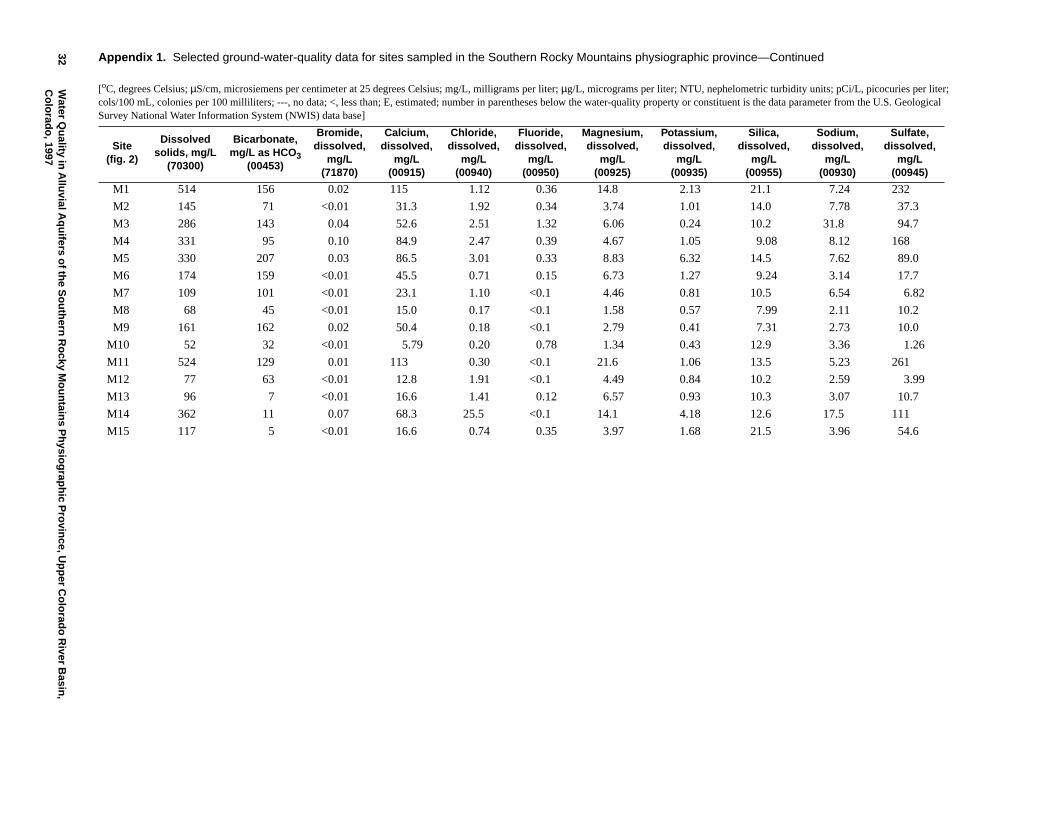
32W
aterQ
uality
inA
lluvialA
qu
iferso
fthe
So
uth
ernR
ocky
Mo
un
tains
Ph
ysiog
raph
icP
rovin
ce,Up
per
Co
lorad
oR
iverB
asin,
Co
lorad
o, 1997
Site(fig. 2)
Dissolvedsolids, mg/L
(70300)
Bicarbonate,mg/L as HCO3
(00453)
Bromide,dissolved,
mg/L(71870)
Calcium,dissolved,
mg/L(00915)
Chloride,dissolved,
mg/L(00940)
Fluoride,dissolved,
mg/L(00950)
Magnesium,dissolved,
mg/L(00925)
Potassium,dissolved,
mg/L(00935)
Silica,dissolved,
mg/L(00955)
Sodium,dissolved,
mg/L(00930)
Sulfate,dissolved,
mg/L(00945)
M1 514 156 0.02 115 1.12 0.36 14.8 2.13 21.1 7.24 232
M2 145 71 <0.01 31.3 1.92 0.34 3.74 1.01 14.0 7.78 37.3
M3 286 143 0.04 52.6 2.51 1.32 6.06 0.24 10.2 31.8 94.7
M4 331 95 0.10 84.9 2.47 0.39 4.67 1.05 9.08 8.12 168
M5 330 207 0.03 86.5 3.01 0.33 8.83 6.32 14.5 7.62 89.0
M6 174 159 <0.01 45.5 0.71 0.15 6.73 1.27 9.24 3.14 17.7
M7 109 101 <0.01 23.1 1.10 <0.1 4.46 0.81 10.5 6.54 6.82
M8 68 45 <0.01 15.0 0.17 <0.1 1.58 0.57 7.99 2.11 10.2
M9 161 162 0.02 50.4 0.18 <0.1 2.79 0.41 7.31 2.73 10.0
M10 52 32 <0.01 5.79 0.20 0.78 1.34 0.43 12.9 3.36 1.26
M11 524 129 0.01 113 0.30 <0.1 21.6 1.06 13.5 5.23 261
M12 77 63 <0.01 12.8 1.91 <0.1 4.49 0.84 10.2 2.59 3.99
M13 96 7 <0.01 16.6 1.41 0.12 6.57 0.93 10.3 3.07 10.7
M14 362 11 0.07 68.3 25.5 <0.1 14.1 4.18 12.6 17.5 111
M15 117 5 <0.01 16.6 0.74 0.35 3.97 1.68 21.5 3.96 54.6
Appendix 1. Selected ground-water-quality data for sites sampled in the Southern Rocky Mountains physiographic province—Continued
[oC, degrees Celsius; µS/cm, microsiemens per centimeter at 25 degrees Celsius; mg/L, milligrams per liter; µg/L, micrograms per liter; NTU, nephelometric turbidity units; pCi/L, picocuries per liter;cols/100 mL, colonies per 100 milliliters; ---, no data; <, less than; E, estimated; number in parentheses below the water-quality property or constituent is the data parameter from the U.S. GeologicalSurvey National Water Information System (NWIS) data base]
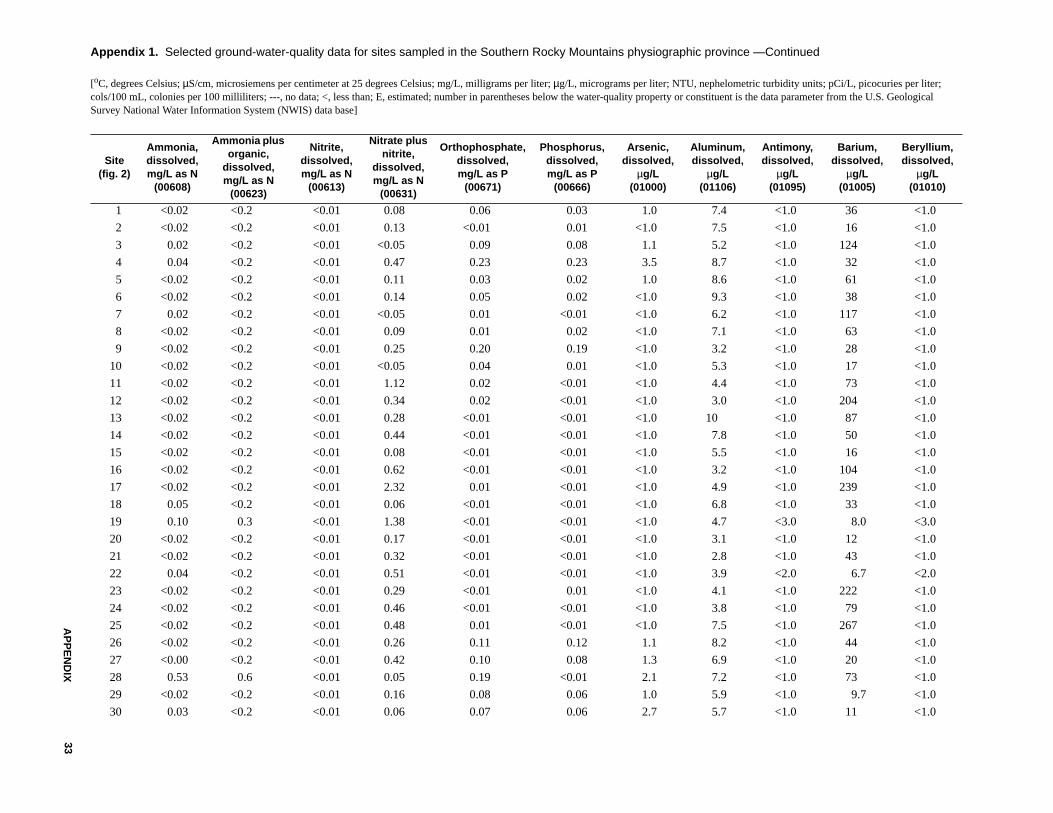
AP
PE
ND
IX33
Appendix 1. Selected ground-water-quality data for sites sampled in the Southern Rocky Mountains physiographic province
[oC, degrees Celsius; µS/cm, microsiemens per centimeter at 25 degrees Celsius; mg/L, milligrams per liter; µg/L, micrograms per liter; NTU, nephelometric turbidity units; pCi/L, picocuries per liter;cols/100 mL, colonies per 100 milliliters; ---, no data; <, less than; E, estimated; number in parentheses below the water-quality property or constituent is the data parameter from the U.S. GeologicalSurvey National Water Information System (NWIS) data base]
Site(fig. 2)
Ammonia,dissolved,mg/L as N
(00608)
Ammonia plusorganic,
dissolved,mg/L as N
(00623)
Nitrite,dissolved,mg/L as N
(00613)
Nitrate plusnitrite,
dissolved,mg/L as N
(00631)
Orthophosphate,dissolved,mg/L as P
(00671)
Phosphorus,dissolved,mg/L as P
(00666)
Arsenic,dissolved,
µg/L(01000)
Aluminum,dissolved,
µg/L(01106)
Antimony,dissolved,
µg/L(01095)
Barium,dissolved,
µg/L(01005)
Beryllium,dissolved,
µg/L(01010)
1 <0.02 <0.2 <0.01 0.08 0.06 0.03 1.0 7.4 <1.0 36 <1.0
2 <0.02 <0.2 <0.01 0.13 <0.01 0.01 <1.0 7.5 <1.0 16 <1.0
3 0.02 <0.2 <0.01 <0.05 0.09 0.08 1.1 5.2 <1.0 124 <1.0
4 0.04 <0.2 <0.01 0.47 0.23 0.23 3.5 8.7 <1.0 32 <1.0
5 <0.02 <0.2 <0.01 0.11 0.03 0.02 1.0 8.6 <1.0 61 <1.0
6 <0.02 <0.2 <0.01 0.14 0.05 0.02 <1.0 9.3 <1.0 38 <1.0
7 0.02 <0.2 <0.01 <0.05 0.01 <0.01 <1.0 6.2 <1.0 117 <1.0
8 <0.02 <0.2 <0.01 0.09 0.01 0.02 <1.0 7.1 <1.0 63 <1.0
9 <0.02 <0.2 <0.01 0.25 0.20 0.19 <1.0 3.2 <1.0 28 <1.0
10 <0.02 <0.2 <0.01 <0.05 0.04 0.01 <1.0 5.3 <1.0 17 <1.0
11 <0.02 <0.2 <0.01 1.12 0.02 <0.01 <1.0 4.4 <1.0 73 <1.0
12 <0.02 <0.2 <0.01 0.34 0.02 <0.01 <1.0 3.0 <1.0 204 <1.0
13 <0.02 <0.2 <0.01 0.28 <0.01 <0.01 <1.0 10 <1.0 87 <1.0
14 <0.02 <0.2 <0.01 0.44 <0.01 <0.01 <1.0 7.8 <1.0 50 <1.0
15 <0.02 <0.2 <0.01 0.08 <0.01 <0.01 <1.0 5.5 <1.0 16 <1.0
16 <0.02 <0.2 <0.01 0.62 <0.01 <0.01 <1.0 3.2 <1.0 104 <1.0
17 <0.02 <0.2 <0.01 2.32 0.01 <0.01 <1.0 4.9 <1.0 239 <1.0
18 0.05 <0.2 <0.01 0.06 <0.01 <0.01 <1.0 6.8 <1.0 33 <1.0
19 0.10 0.3 <0.01 1.38 <0.01 <0.01 <1.0 4.7 <3.0 8.0 <3.0
20 <0.02 <0.2 <0.01 0.17 <0.01 <0.01 <1.0 3.1 <1.0 12 <1.0
21 <0.02 <0.2 <0.01 0.32 <0.01 <0.01 <1.0 2.8 <1.0 43 <1.0
22 0.04 <0.2 <0.01 0.51 <0.01 <0.01 <1.0 3.9 <2.0 6.7 <2.0
23 <0.02 <0.2 <0.01 0.29 <0.01 0.01 <1.0 4.1 <1.0 222 <1.0
24 <0.02 <0.2 <0.01 0.46 <0.01 <0.01 <1.0 3.8 <1.0 79 <1.0
25 <0.02 <0.2 <0.01 0.48 0.01 <0.01 <1.0 7.5 <1.0 267 <1.0
26 <0.02 <0.2 <0.01 0.26 0.11 0.12 1.1 8.2 <1.0 44 <1.0
27 <0.00 <0.2 <0.01 0.42 0.10 0.08 1.3 6.9 <1.0 20 <1.0
28 0.53 0.6 <0.01 0.05 0.19 <0.01 2.1 7.2 <1.0 73 <1.0
29 <0.02 <0.2 <0.01 0.16 0.08 0.06 1.0 5.9 <1.0 9.7 <1.0
30 0.03 <0.2 <0.01 0.06 0.07 0.06 2.7 5.7 <1.0 11 <1.0
—Continued
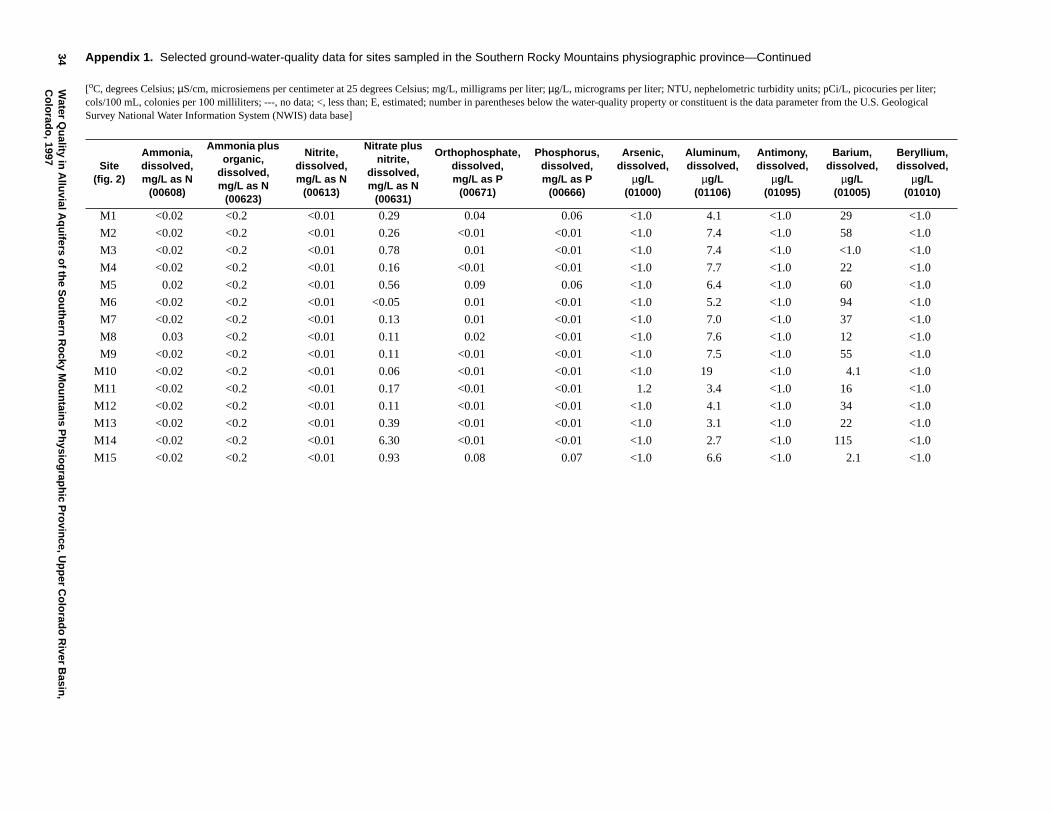
34W
aterQ
uality
inA
lluvialA
qu
iferso
fthe
So
uth
ernR
ocky
Mo
un
tains
Ph
ysiog
raph
icP
rovin
ce,Up
per
Co
lorad
oR
iverB
asin,
Co
lorad
o, 1997
Site(fig. 2)
Ammonia,dissolved,mg/L as N
(00608)
Ammonia plusorganic,
dissolved,mg/L as N
(00623)
Nitrite,dissolved,mg/L as N
(00613)
Nitrate plusnitrite,
dissolved,mg/L as N
(00631)
Orthophosphate,dissolved,mg/L as P
(00671)
Phosphorus,dissolved,mg/L as P
(00666)
Arsenic,dissolved,
µg/L(01000)
Aluminum,dissolved,
µg/L(01106)
Antimony,dissolved,
µg/L(01095)
Barium,dissolved,
µg/L(01005)
Beryllium,dissolved,
µg/L(01010)
M1 <0.02 <0.2 <0.01 0.29 0.04 0.06 <1.0 4.1 <1.0 29 <1.0
M2 <0.02 <0.2 <0.01 0.26 <0.01 <0.01 <1.0 7.4 <1.0 58 <1.0
M3 <0.02 <0.2 <0.01 0.78 0.01 <0.01 <1.0 7.4 <1.0 <1.0 <1.0
M4 <0.02 <0.2 <0.01 0.16 <0.01 <0.01 <1.0 7.7 <1.0 22 <1.0
M5 0.02 <0.2 <0.01 0.56 0.09 0.06 <1.0 6.4 <1.0 60 <1.0
M6 <0.02 <0.2 <0.01 <0.05 0.01 <0.01 <1.0 5.2 <1.0 94 <1.0
M7 <0.02 <0.2 <0.01 0.13 0.01 <0.01 <1.0 7.0 <1.0 37 <1.0
M8 0.03 <0.2 <0.01 0.11 0.02 <0.01 <1.0 7.6 <1.0 12 <1.0
M9 <0.02 <0.2 <0.01 0.11 <0.01 <0.01 <1.0 7.5 <1.0 55 <1.0
M10 <0.02 <0.2 <0.01 0.06 <0.01 <0.01 <1.0 19 <1.0 4.1 <1.0
M11 <0.02 <0.2 <0.01 0.17 <0.01 <0.01 1.2 3.4 <1.0 16 <1.0
M12 <0.02 <0.2 <0.01 0.11 <0.01 <0.01 <1.0 4.1 <1.0 34 <1.0
M13 <0.02 <0.2 <0.01 0.39 <0.01 <0.01 <1.0 3.1 <1.0 22 <1.0
M14 <0.02 <0.2 <0.01 6.30 <0.01 <0.01 <1.0 2.7 <1.0 115 <1.0
M15 <0.02 <0.2 <0.01 0.93 0.08 0.07 <1.0 6.6 <1.0 2.1 <1.0
Appendix 1. Selected ground-water-quality data for sites sampled in the Southern Rocky Mountains physiographic province—Continued
[oC, degrees Celsius; µS/cm, microsiemens per centimeter at 25 degrees Celsius; mg/L, milligrams per liter; µg/L, micrograms per liter; NTU, nephelometric turbidity units; pCi/L, picocuries per liter;cols/100 mL, colonies per 100 milliliters; ---, no data; <, less than; E, estimated; number in parentheses below the water-quality property or constituent is the data parameter from the U.S. GeologicalSurvey National Water Information System (NWIS) data base]
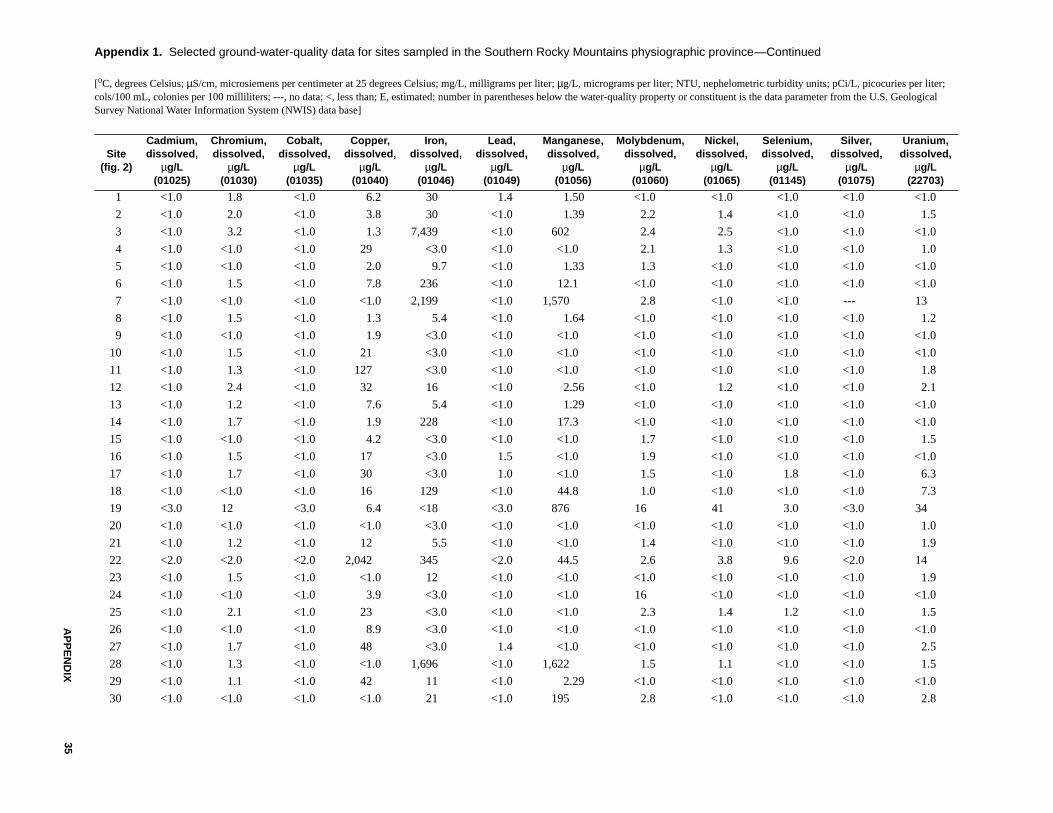
AP
PE
ND
IX35
Appendix 1. Selected ground-water-quality data for sites sampled in the Southern Rocky Mountains physiographic province
[oC, degrees Celsius; µS/cm, microsiemens per centimeter at 25 degrees Celsius; mg/L, milligrams per liter; µg/L, micrograms per liter; NTU, nephelometric turbidity units; pCi/L, picocuries per liter;cols/100 mL, colonies per 100 milliliters; ---, no data; <, less than; E, estimated; number in parentheses below the water-quality property or constituent is the data parameter from the U.S. GeologicalSurvey National Water Information System (NWIS) data base]
Site(fig. 2)
Cadmium,dissolved,
µg/L(01025)
Chromium,dissolved,
µg/L(01030)
Cobalt,dissolved,
µg/L(01035)
Copper,dissolved,
µg/L(01040)
Iron,dissolved,
µg/L(01046)
Lead,dissolved,
µg/L(01049)
Manganese,dissolved,
µg/L(01056)
Molybdenum,dissolved,
µg/L(01060)
Nickel,dissolved,
µg/L(01065)
Selenium,dissolved,
µg/L(01145)
Silver,dissolved,
µg/L(01075)
Uranium,dissolved,
µg/L(22703)
1 <1.0 1.8 <1.0 6.2 30 1.4 1.50 <1.0 <1.0 <1.0 <1.0 <1.0
2 <1.0 2.0 <1.0 3.8 30 <1.0 1.39 2.2 1.4 <1.0 <1.0 1.5
3 <1.0 3.2 <1.0 1.3 7,439 <1.0 602 2.4 2.5 <1.0 <1.0 <1.0
4 <1.0 <1.0 <1.0 29 <3.0 <1.0 <1.0 2.1 1.3 <1.0 <1.0 1.0
5 <1.0 <1.0 <1.0 2.0 9.7 <1.0 1.33 1.3 <1.0 <1.0 <1.0 <1.0
6 <1.0 1.5 <1.0 7.8 236 <1.0 12.1 <1.0 <1.0 <1.0 <1.0 <1.0
7 <1.0 <1.0 <1.0 <1.0 2,199 <1.0 1,570 2.8 <1.0 <1.0 --- 13
8 <1.0 1.5 <1.0 1.3 5.4 <1.0 1.64 <1.0 <1.0 <1.0 <1.0 1.2
9 <1.0 <1.0 <1.0 1.9 <3.0 <1.0 <1.0 <1.0 <1.0 <1.0 <1.0 <1.0
10 <1.0 1.5 <1.0 21 <3.0 <1.0 <1.0 <1.0 <1.0 <1.0 <1.0 <1.0
11 <1.0 1.3 <1.0 127 <3.0 <1.0 <1.0 <1.0 <1.0 <1.0 <1.0 1.8
12 <1.0 2.4 <1.0 32 16 <1.0 2.56 <1.0 1.2 <1.0 <1.0 2.1
13 <1.0 1.2 <1.0 7.6 5.4 <1.0 1.29 <1.0 <1.0 <1.0 <1.0 <1.0
14 <1.0 1.7 <1.0 1.9 228 <1.0 17.3 <1.0 <1.0 <1.0 <1.0 <1.0
15 <1.0 <1.0 <1.0 4.2 <3.0 <1.0 <1.0 1.7 <1.0 <1.0 <1.0 1.5
16 <1.0 1.5 <1.0 17 <3.0 1.5 <1.0 1.9 <1.0 <1.0 <1.0 <1.0
17 <1.0 1.7 <1.0 30 <3.0 1.0 <1.0 1.5 <1.0 1.8 <1.0 6.3
18 <1.0 <1.0 <1.0 16 129 <1.0 44.8 1.0 <1.0 <1.0 <1.0 7.3
19 <3.0 12 <3.0 6.4 <18 <3.0 876 16 41 3.0 <3.0 34
20 <1.0 <1.0 <1.0 <1.0 <3.0 <1.0 <1.0 <1.0 <1.0 <1.0 <1.0 1.0
21 <1.0 1.2 <1.0 12 5.5 <1.0 <1.0 1.4 <1.0 <1.0 <1.0 1.9
22 <2.0 <2.0 <2.0 2,042 345 <2.0 44.5 2.6 3.8 9.6 <2.0 14
23 <1.0 1.5 <1.0 <1.0 12 <1.0 <1.0 <1.0 <1.0 <1.0 <1.0 1.9
24 <1.0 <1.0 <1.0 3.9 <3.0 <1.0 <1.0 16 <1.0 <1.0 <1.0 <1.0
25 <1.0 2.1 <1.0 23 <3.0 <1.0 <1.0 2.3 1.4 1.2 <1.0 1.5
26 <1.0 <1.0 <1.0 8.9 <3.0 <1.0 <1.0 <1.0 <1.0 <1.0 <1.0 <1.0
27 <1.0 1.7 <1.0 48 <3.0 1.4 <1.0 <1.0 <1.0 <1.0 <1.0 2.5
28 <1.0 1.3 <1.0 <1.0 1,696 <1.0 1,622 1.5 1.1 <1.0 <1.0 1.5
29 <1.0 1.1 <1.0 42 11 <1.0 2.29 <1.0 <1.0 <1.0 <1.0 <1.0
30 <1.0 <1.0 <1.0 <1.0 21 <1.0 195 2.8 <1.0 <1.0 <1.0 2.8
—Continued
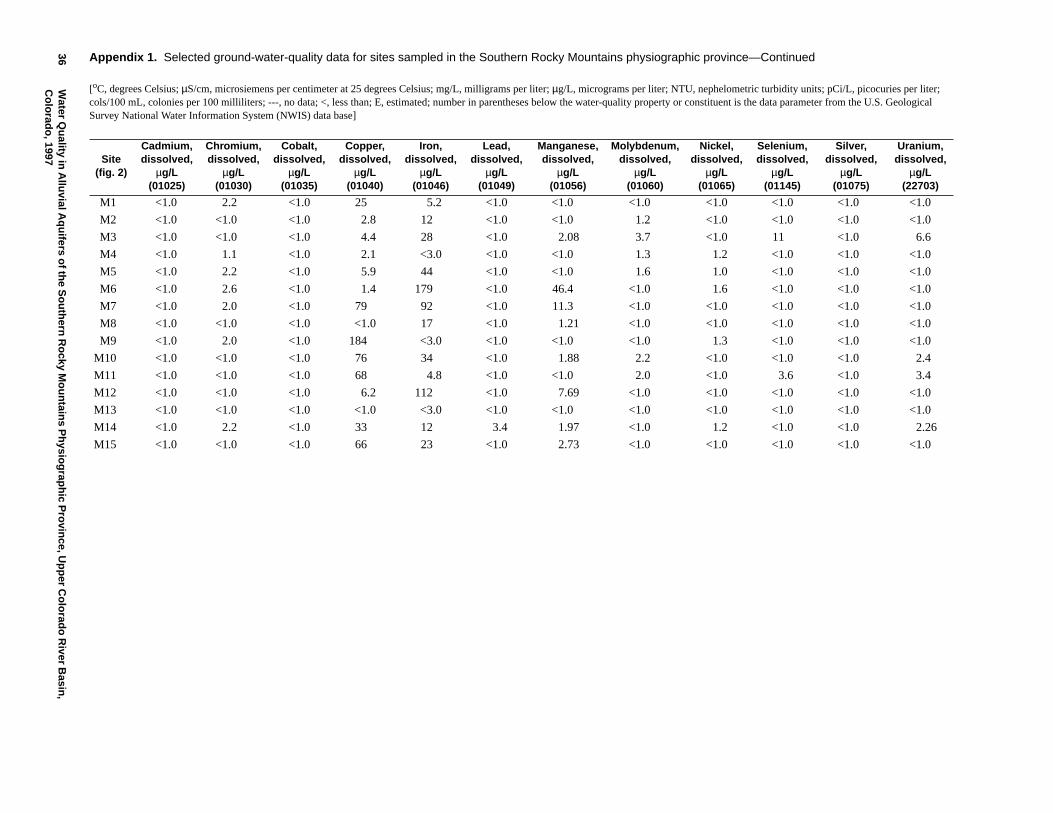
36W
aterQ
uality
inA
lluvialA
qu
iferso
fthe
So
uth
ernR
ocky
Mo
un
tains
Ph
ysiog
raph
icP
rovin
ce,Up
per
Co
lorad
oR
iverB
asin,
Co
lorad
o, 1997 Site
(fig. 2)
Cadmium,dissolved,
µg/L(01025)
Chromium,dissolved,
µg/L(01030)
Cobalt,dissolved,
µg/L(01035)
Copper,dissolved,
µg/L(01040)
Iron,dissolved,
µg/L(01046)
Lead,dissolved,
µg/L(01049)
Manganese,dissolved,
µg/L(01056)
Molybdenum,dissolved,
µg/L(01060)
Nickel,dissolved,
µg/L(01065)
Selenium,dissolved,
µg/L(01145)
Silver,dissolved,
µg/L(01075)
Uranium,dissolved,
µg/L(22703)
M1 <1.0 2.2 <1.0 25 5.2 <1.0 <1.0 <1.0 <1.0 <1.0 <1.0 <1.0
M2 <1.0 <1.0 <1.0 2.8 12 <1.0 <1.0 1.2 <1.0 <1.0 <1.0 <1.0
M3 <1.0 <1.0 <1.0 4.4 28 <1.0 2.08 3.7 <1.0 11 <1.0 6.6
M4 <1.0 1.1 <1.0 2.1 <3.0 <1.0 <1.0 1.3 1.2 <1.0 <1.0 <1.0
M5 <1.0 2.2 <1.0 5.9 44 <1.0 <1.0 1.6 1.0 <1.0 <1.0 <1.0
M6 <1.0 2.6 <1.0 1.4 179 <1.0 46.4 <1.0 1.6 <1.0 <1.0 <1.0
M7 <1.0 2.0 <1.0 79 92 <1.0 11.3 <1.0 <1.0 <1.0 <1.0 <1.0
M8 <1.0 <1.0 <1.0 <1.0 17 <1.0 1.21 <1.0 <1.0 <1.0 <1.0 <1.0
M9 <1.0 2.0 <1.0 184 <3.0 <1.0 <1.0 <1.0 1.3 <1.0 <1.0 <1.0
M10 <1.0 <1.0 <1.0 76 34 <1.0 1.88 2.2 <1.0 <1.0 <1.0 2.4
M11 <1.0 <1.0 <1.0 68 4.8 <1.0 <1.0 2.0 <1.0 3.6 <1.0 3.4
M12 <1.0 <1.0 <1.0 6.2 112 <1.0 7.69 <1.0 <1.0 <1.0 <1.0 <1.0
M13 <1.0 <1.0 <1.0 <1.0 <3.0 <1.0 <1.0 <1.0 <1.0 <1.0 <1.0 <1.0
M14 <1.0 2.2 <1.0 33 12 3.4 1.97 <1.0 1.2 <1.0 <1.0 2.26
M15 <1.0 <1.0 <1.0 66 23 <1.0 2.73 <1.0 <1.0 <1.0 <1.0 <1.0
Appendix 1. Selected ground-water-quality data for sites sampled in the Southern Rocky Mountains physiographic province—Continued
[oC, degrees Celsius; µS/cm, microsiemens per centimeter at 25 degrees Celsius; mg/L, milligrams per liter; µg/L, micrograms per liter; NTU, nephelometric turbidity units; pCi/L, picocuries per liter;cols/100 mL, colonies per 100 milliliters; ---, no data; <, less than; E, estimated; number in parentheses below the water-quality property or constituent is the data parameter from the U.S. GeologicalSurvey National Water Information System (NWIS) data base]
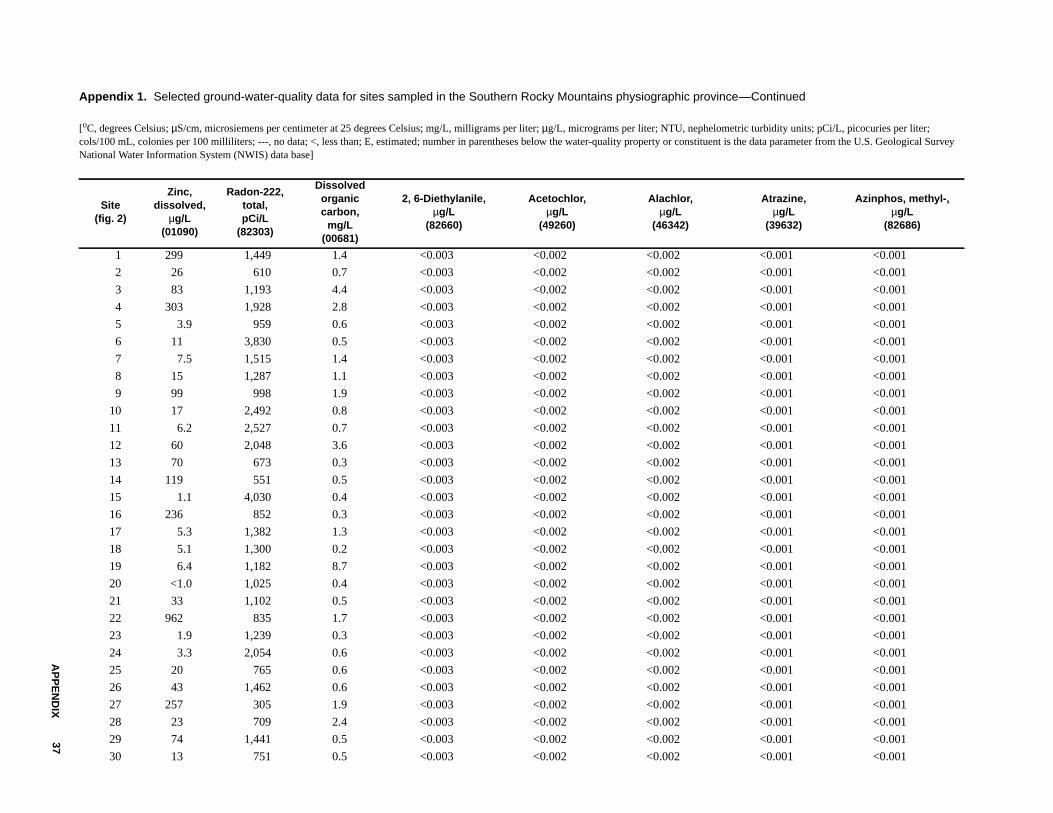
AP
PE
ND
IX37
Appendix 1. Selected ground-water-quality data for sites sampled in the Southern Rocky Mountains physiographic province
[oC, degrees Celsius; µS/cm, microsiemens per centimeter at 25 degrees Celsius; mg/L, milligrams per liter; µg/L, micrograms per liter; NTU, nephelometric turbidity units; pCi/L, picocuries per liter;cols/100 mL, colonies per 100 milliliters; ---, no data; <, less than; E, estimated; number in parentheses below the water-quality property or constituent is the data parameter from the U.S. Geological SurveyNational Water Information System (NWIS) data base]
Site(fig. 2)
Zinc,dissolved,
µg/L(01090)
Radon-222,total,pCi/L
(82303)
Dissolvedorganiccarbon,
mg/L(00681)
2, 6-Diethylanile,µg/L
(82660)
Acetochlor,µg/L
(49260)
Alachlor,µg/L
(46342)
Atrazine,µg/L
(39632)
Azinphos, methyl-,µg/L
(82686)
1 299 1,449 1.4 <0.003 <0.002 <0.002 <0.001 <0.001
2 26 610 0.7 <0.003 <0.002 <0.002 <0.001 <0.001
3 83 1,193 4.4 <0.003 <0.002 <0.002 <0.001 <0.001
4 303 1,928 2.8 <0.003 <0.002 <0.002 <0.001 <0.001
5 3.9 959 0.6 <0.003 <0.002 <0.002 <0.001 <0.001
6 11 3,830 0.5 <0.003 <0.002 <0.002 <0.001 <0.001
7 7.5 1,515 1.4 <0.003 <0.002 <0.002 <0.001 <0.001
8 15 1,287 1.1 <0.003 <0.002 <0.002 <0.001 <0.001
9 99 998 1.9 <0.003 <0.002 <0.002 <0.001 <0.001
10 17 2,492 0.8 <0.003 <0.002 <0.002 <0.001 <0.001
11 6.2 2,527 0.7 <0.003 <0.002 <0.002 <0.001 <0.001
12 60 2,048 3.6 <0.003 <0.002 <0.002 <0.001 <0.001
13 70 673 0.3 <0.003 <0.002 <0.002 <0.001 <0.001
14 119 551 0.5 <0.003 <0.002 <0.002 <0.001 <0.001
15 1.1 4,030 0.4 <0.003 <0.002 <0.002 <0.001 <0.001
16 236 852 0.3 <0.003 <0.002 <0.002 <0.001 <0.001
17 5.3 1,382 1.3 <0.003 <0.002 <0.002 <0.001 <0.001
18 5.1 1,300 0.2 <0.003 <0.002 <0.002 <0.001 <0.001
19 6.4 1,182 8.7 <0.003 <0.002 <0.002 <0.001 <0.001
20 <1.0 1,025 0.4 <0.003 <0.002 <0.002 <0.001 <0.001
21 33 1,102 0.5 <0.003 <0.002 <0.002 <0.001 <0.001
22 962 835 1.7 <0.003 <0.002 <0.002 <0.001 <0.001
23 1.9 1,239 0.3 <0.003 <0.002 <0.002 <0.001 <0.001
24 3.3 2,054 0.6 <0.003 <0.002 <0.002 <0.001 <0.001
25 20 765 0.6 <0.003 <0.002 <0.002 <0.001 <0.001
26 43 1,462 0.6 <0.003 <0.002 <0.002 <0.001 <0.001
27 257 305 1.9 <0.003 <0.002 <0.002 <0.001 <0.001
28 23 709 2.4 <0.003 <0.002 <0.002 <0.001 <0.001
29 74 1,441 0.5 <0.003 <0.002 <0.002 <0.001 <0.001
30 13 751 0.5 <0.003 <0.002 <0.002 <0.001 <0.001
—Continued
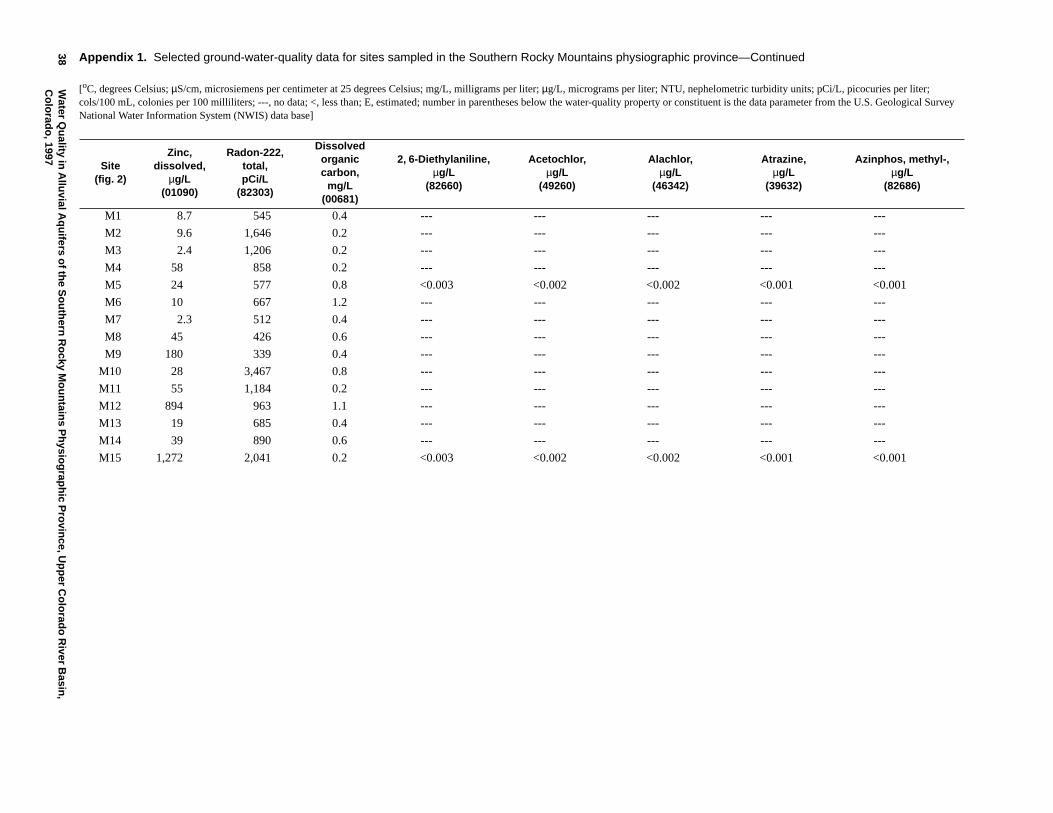
38W
aterQ
uality
inA
lluvialA
qu
iferso
fthe
So
uth
ernR
ocky
Mo
un
tains
Ph
ysiog
raph
icP
rovin
ce,Up
per
Co
lorad
oR
iverB
asin,
Co
lorad
o, 1997
Site(fig. 2)
Zinc,dissolved,
µg/L(01090)
Radon-222,total,pCi/L
(82303)
Dissolvedorganiccarbon,
mg/L(00681)
2, 6-Diethylaniline,µg/L
(82660)
Acetochlor,µg/L
(49260)
Alachlor,µg/L
(46342)
Atrazine,µg/L
(39632)
Azinphos, methyl-,µg/L
(82686)
M1 8.7 545 0.4 --- --- --- --- ---
M2 9.6 1,646 0.2 --- --- --- --- ---
M3 2.4 1,206 0.2 --- --- --- --- ---
M4 58 858 0.2 --- --- --- --- ---
M5 24 577 0.8 <0.003 <0.002 <0.002 <0.001 <0.001
M6 10 667 1.2 --- --- --- --- ---
M7 2.3 512 0.4 --- --- --- --- ---
M8 45 426 0.6 --- --- --- --- ---
M9 180 339 0.4 --- --- --- --- ---
M10 28 3,467 0.8 --- --- --- --- ---
M11 55 1,184 0.2 --- --- --- --- ---
M12 894 963 1.1 --- --- --- --- ---
M13 19 685 0.4 --- --- --- --- ---
M14 39 890 0.6 --- --- --- --- ---
M15 1,272 2,041 0.2 <0.003 <0.002 <0.002 <0.001 <0.001
Appendix 1. Selected ground-water-quality data for sites sampled in the Southern Rocky Mountains physiographic province—Continued
[oC, degrees Celsius; µS/cm, microsiemens per centimeter at 25 degrees Celsius; mg/L, milligrams per liter; µg/L, micrograms per liter; NTU, nephelometric turbidity units; pCi/L, picocuries per liter;cols/100 mL, colonies per 100 milliliters; ---, no data; <, less than; E, estimated; number in parentheses below the water-quality property or constituent is the data parameter from the U.S. Geological SurveyNational Water Information System (NWIS) data base]
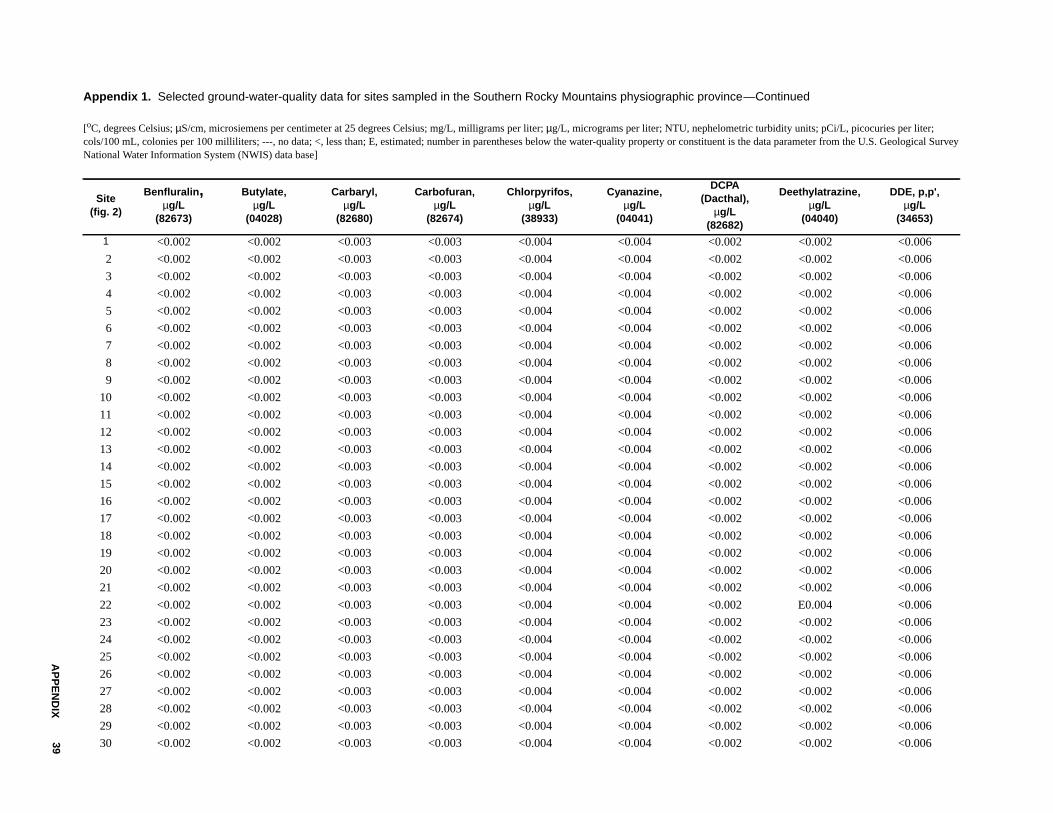
AP
PE
ND
IX39
Appendix 1. Selected ground-water-quality data for sites sampled in the Southern Rocky Mountains physiographic province
[oC, degrees Celsius; µS/cm, microsiemens per centimeter at 25 degrees Celsius; mg/L, milligrams per liter; µg/L, micrograms per liter; NTU, nephelometric turbidity units; pCi/L, picocuries per liter;cols/100 mL, colonies per 100 milliliters; ---, no data; <, less than; E, estimated; number in parentheses below the water-quality property or constituent is the data parameter from the U.S. Geological SurveyNational Water Information System (NWIS) data base]
Site(fig. 2)
Benfluralin,µg/L
(82673)
Butylate,µg/L
(04028)
Carbaryl,µg/L
(82680)
Carbofuran,µg/L
(82674)
Chlorpyrifos,µg/L
(38933)
Cyanazine,µg/L
(04041)
DCPA(Dacthal),
µg/L(82682)
Deethylatrazine,µg/L
(04040)
DDE, p,p',µg/L
(34653)
1 <0.002 <0.002 <0.003 <0.003 <0.004 <0.004 <0.002 <0.002 <0.006
2 <0.002 <0.002 <0.003 <0.003 <0.004 <0.004 <0.002 <0.002 <0.006
3 <0.002 <0.002 <0.003 <0.003 <0.004 <0.004 <0.002 <0.002 <0.006
4 <0.002 <0.002 <0.003 <0.003 <0.004 <0.004 <0.002 <0.002 <0.006
5 <0.002 <0.002 <0.003 <0.003 <0.004 <0.004 <0.002 <0.002 <0.006
6 <0.002 <0.002 <0.003 <0.003 <0.004 <0.004 <0.002 <0.002 <0.006
7 <0.002 <0.002 <0.003 <0.003 <0.004 <0.004 <0.002 <0.002 <0.006
8 <0.002 <0.002 <0.003 <0.003 <0.004 <0.004 <0.002 <0.002 <0.006
9 <0.002 <0.002 <0.003 <0.003 <0.004 <0.004 <0.002 <0.002 <0.006
10 <0.002 <0.002 <0.003 <0.003 <0.004 <0.004 <0.002 <0.002 <0.006
11 <0.002 <0.002 <0.003 <0.003 <0.004 <0.004 <0.002 <0.002 <0.006
12 <0.002 <0.002 <0.003 <0.003 <0.004 <0.004 <0.002 <0.002 <0.006
13 <0.002 <0.002 <0.003 <0.003 <0.004 <0.004 <0.002 <0.002 <0.006
14 <0.002 <0.002 <0.003 <0.003 <0.004 <0.004 <0.002 <0.002 <0.006
15 <0.002 <0.002 <0.003 <0.003 <0.004 <0.004 <0.002 <0.002 <0.006
16 <0.002 <0.002 <0.003 <0.003 <0.004 <0.004 <0.002 <0.002 <0.006
17 <0.002 <0.002 <0.003 <0.003 <0.004 <0.004 <0.002 <0.002 <0.006
18 <0.002 <0.002 <0.003 <0.003 <0.004 <0.004 <0.002 <0.002 <0.006
19 <0.002 <0.002 <0.003 <0.003 <0.004 <0.004 <0.002 <0.002 <0.006
20 <0.002 <0.002 <0.003 <0.003 <0.004 <0.004 <0.002 <0.002 <0.006
21 <0.002 <0.002 <0.003 <0.003 <0.004 <0.004 <0.002 <0.002 <0.006
22 <0.002 <0.002 <0.003 <0.003 <0.004 <0.004 <0.002 E0.004 <0.006
23 <0.002 <0.002 <0.003 <0.003 <0.004 <0.004 <0.002 <0.002 <0.006
24 <0.002 <0.002 <0.003 <0.003 <0.004 <0.004 <0.002 <0.002 <0.006
25 <0.002 <0.002 <0.003 <0.003 <0.004 <0.004 <0.002 <0.002 <0.006
26 <0.002 <0.002 <0.003 <0.003 <0.004 <0.004 <0.002 <0.002 <0.006
27 <0.002 <0.002 <0.003 <0.003 <0.004 <0.004 <0.002 <0.002 <0.006
28 <0.002 <0.002 <0.003 <0.003 <0.004 <0.004 <0.002 <0.002 <0.006
29 <0.002 <0.002 <0.003 <0.003 <0.004 <0.004 <0.002 <0.002 <0.006
30 <0.002 <0.002 <0.003 <0.003 <0.004 <0.004 <0.002 <0.002 <0.006
—Continued
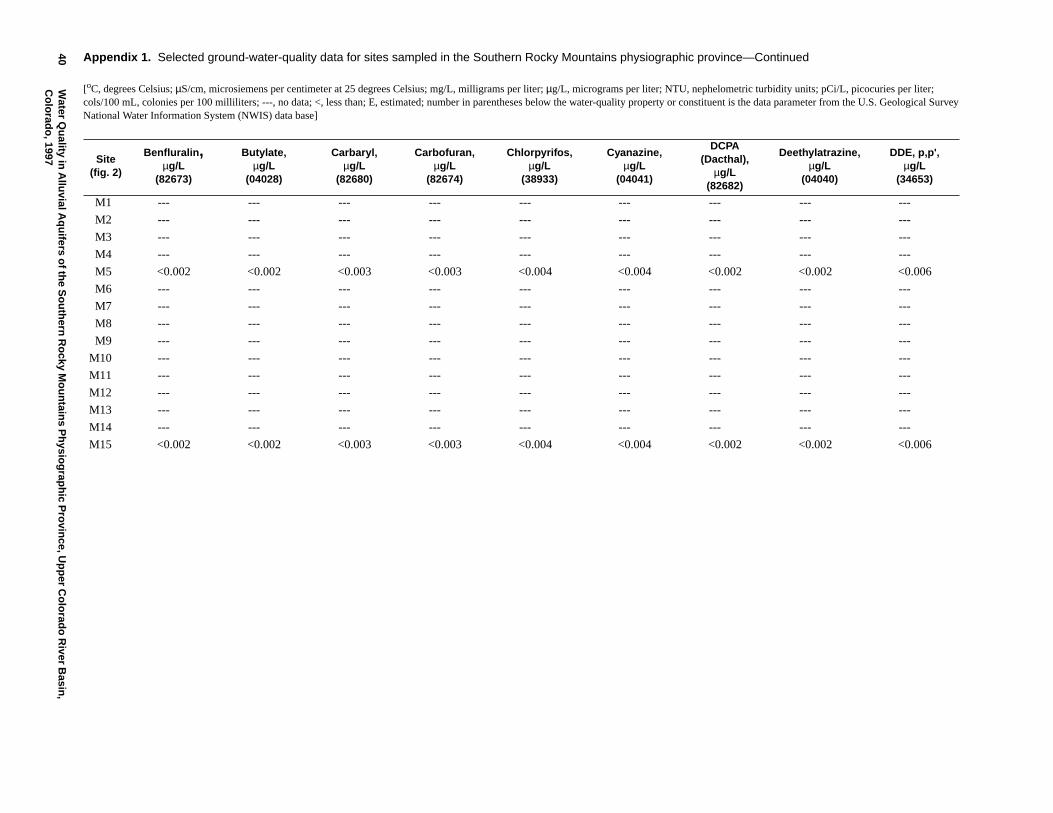
40W
aterQ
uality
inA
lluvialA
qu
iferso
fthe
So
uth
ernR
ocky
Mo
un
tains
Ph
ysiog
raph
icP
rovin
ce,Up
per
Co
lorad
oR
iverB
asin,
Co
lorad
o, 1997 Site
(fig. 2)
Benfluralin,µg/L
(82673)
Butylate,µg/L
(04028)
Carbaryl,µg/L
(82680)
Carbofuran,µg/L
(82674)
Chlorpyrifos,µg/L
(38933)
Cyanazine,µg/L
(04041)
DCPA(Dacthal),
µg/L(82682)
Deethylatrazine,µg/L
(04040)
DDE, p,p',µg/L
(34653)
M1 --- --- --- --- --- --- --- --- ---
M2 --- --- --- --- --- --- --- --- ---
M3 --- --- --- --- --- --- --- --- ---
M4 --- --- --- --- --- --- --- --- ---
M5 <0.002 <0.002 <0.003 <0.003 <0.004 <0.004 <0.002 <0.002 <0.006
M6 --- --- --- --- --- --- --- --- ---
M7 --- --- --- --- --- --- --- --- ---
M8 --- --- --- --- --- --- --- --- ---
M9 --- --- --- --- --- --- --- --- ---
M10 --- --- --- --- --- --- --- --- ---
M11 --- --- --- --- --- --- --- --- ---
M12 --- --- --- --- --- --- --- --- ---
M13 --- --- --- --- --- --- --- --- ---
M14 --- --- --- --- --- --- --- --- ---
M15 <0.002 <0.002 <0.003 <0.003 <0.004 <0.004 <0.002 <0.002 <0.006
Appendix 1. Selected ground-water-quality data for sites sampled in the Southern Rocky Mountains physiographic province—Continued
[oC, degrees Celsius; µS/cm, microsiemens per centimeter at 25 degrees Celsius; mg/L, milligrams per liter; µg/L, micrograms per liter; NTU, nephelometric turbidity units; pCi/L, picocuries per liter;cols/100 mL, colonies per 100 milliliters; ---, no data; <, less than; E, estimated; number in parentheses below the water-quality property or constituent is the data parameter from the U.S. Geological SurveyNational Water Information System (NWIS) data base]
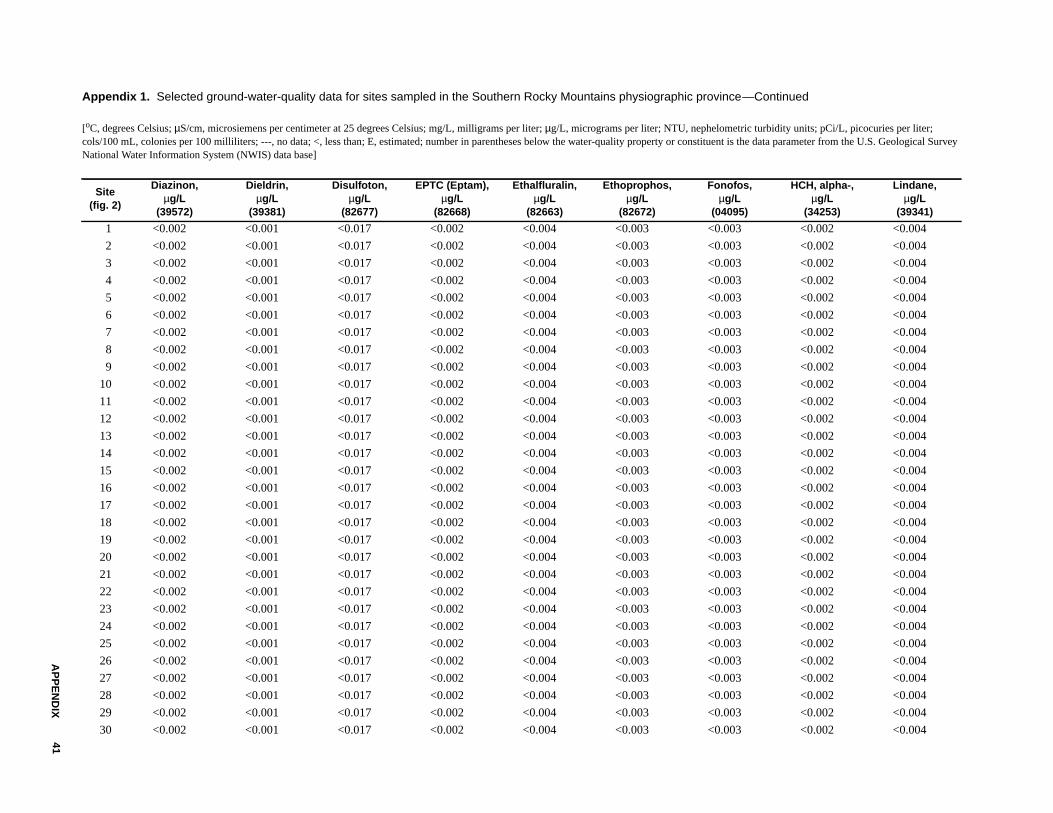
AP
PE
ND
IX41
Appendix 1. Selected ground-water-quality data for sites sampled in the Southern Rocky Mountains physiographic province
[oC, degrees Celsius; µS/cm, microsiemens per centimeter at 25 degrees Celsius; mg/L, milligrams per liter; µg/L, micrograms per liter; NTU, nephelometric turbidity units; pCi/L, picocuries per liter;cols/100 mL, colonies per 100 milliliters; ---, no data; <, less than; E, estimated; number in parentheses below the water-quality property or constituent is the data parameter from the U.S. Geological SurveyNational Water Information System (NWIS) data base]
Site(fig. 2)
Diazinon,µg/L
(39572)
Dieldrin,µg/L
(39381)
Disulfoton,µg/L
(82677)
EPTC (Eptam),µg/L
(82668)
Ethalfluralin,µg/L
(82663)
Ethoprophos,µg/L
(82672)
Fonofos,µg/L
(04095)
HCH, alpha-,µg/L
(34253)
Lindane,µg/L
(39341)
1 <0.002 <0.001 <0.017 <0.002 <0.004 <0.003 <0.003 <0.002 <0.004
2 <0.002 <0.001 <0.017 <0.002 <0.004 <0.003 <0.003 <0.002 <0.004
3 <0.002 <0.001 <0.017 <0.002 <0.004 <0.003 <0.003 <0.002 <0.004
4 <0.002 <0.001 <0.017 <0.002 <0.004 <0.003 <0.003 <0.002 <0.004
5 <0.002 <0.001 <0.017 <0.002 <0.004 <0.003 <0.003 <0.002 <0.004
6 <0.002 <0.001 <0.017 <0.002 <0.004 <0.003 <0.003 <0.002 <0.004
7 <0.002 <0.001 <0.017 <0.002 <0.004 <0.003 <0.003 <0.002 <0.004
8 <0.002 <0.001 <0.017 <0.002 <0.004 <0.003 <0.003 <0.002 <0.004
9 <0.002 <0.001 <0.017 <0.002 <0.004 <0.003 <0.003 <0.002 <0.004
10 <0.002 <0.001 <0.017 <0.002 <0.004 <0.003 <0.003 <0.002 <0.004
11 <0.002 <0.001 <0.017 <0.002 <0.004 <0.003 <0.003 <0.002 <0.004
12 <0.002 <0.001 <0.017 <0.002 <0.004 <0.003 <0.003 <0.002 <0.004
13 <0.002 <0.001 <0.017 <0.002 <0.004 <0.003 <0.003 <0.002 <0.004
14 <0.002 <0.001 <0.017 <0.002 <0.004 <0.003 <0.003 <0.002 <0.004
15 <0.002 <0.001 <0.017 <0.002 <0.004 <0.003 <0.003 <0.002 <0.004
16 <0.002 <0.001 <0.017 <0.002 <0.004 <0.003 <0.003 <0.002 <0.004
17 <0.002 <0.001 <0.017 <0.002 <0.004 <0.003 <0.003 <0.002 <0.004
18 <0.002 <0.001 <0.017 <0.002 <0.004 <0.003 <0.003 <0.002 <0.004
19 <0.002 <0.001 <0.017 <0.002 <0.004 <0.003 <0.003 <0.002 <0.004
20 <0.002 <0.001 <0.017 <0.002 <0.004 <0.003 <0.003 <0.002 <0.004
21 <0.002 <0.001 <0.017 <0.002 <0.004 <0.003 <0.003 <0.002 <0.004
22 <0.002 <0.001 <0.017 <0.002 <0.004 <0.003 <0.003 <0.002 <0.004
23 <0.002 <0.001 <0.017 <0.002 <0.004 <0.003 <0.003 <0.002 <0.004
24 <0.002 <0.001 <0.017 <0.002 <0.004 <0.003 <0.003 <0.002 <0.004
25 <0.002 <0.001 <0.017 <0.002 <0.004 <0.003 <0.003 <0.002 <0.004
26 <0.002 <0.001 <0.017 <0.002 <0.004 <0.003 <0.003 <0.002 <0.004
27 <0.002 <0.001 <0.017 <0.002 <0.004 <0.003 <0.003 <0.002 <0.004
28 <0.002 <0.001 <0.017 <0.002 <0.004 <0.003 <0.003 <0.002 <0.004
29 <0.002 <0.001 <0.017 <0.002 <0.004 <0.003 <0.003 <0.002 <0.004
30 <0.002 <0.001 <0.017 <0.002 <0.004 <0.003 <0.003 <0.002 <0.004
—Continued
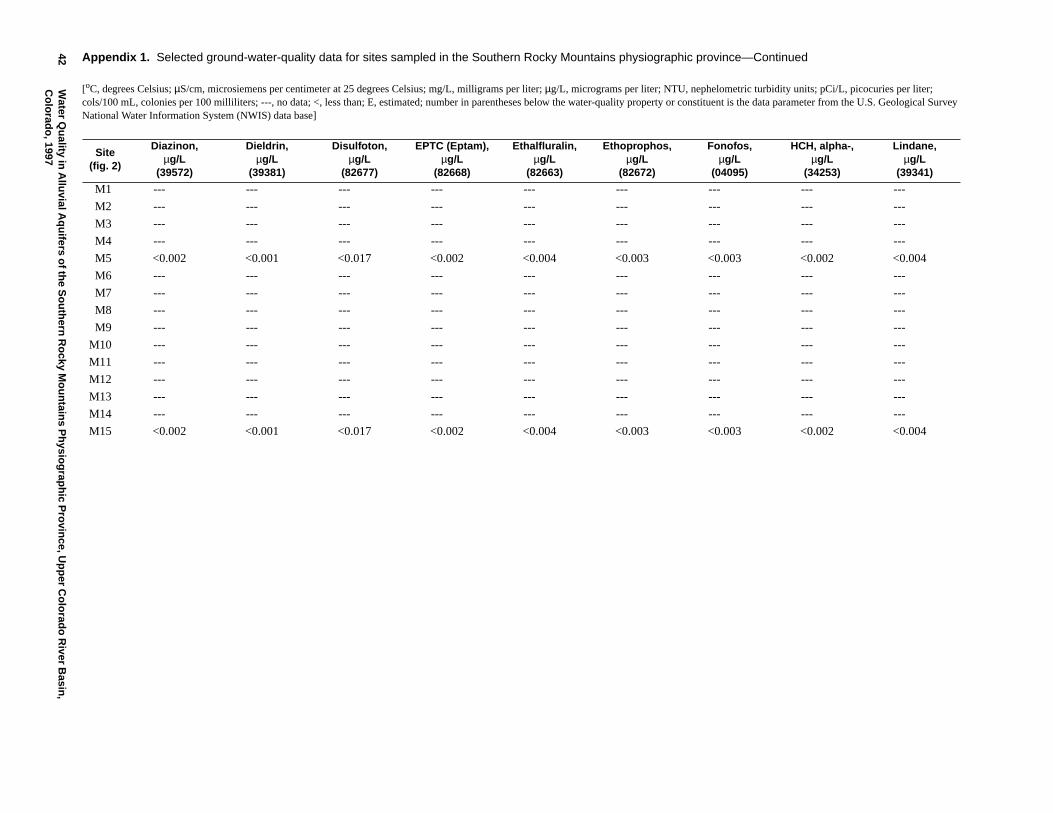
42W
aterQ
uality
inA
lluvialA
qu
iferso
fthe
So
uth
ernR
ocky
Mo
un
tains
Ph
ysiog
raph
icP
rovin
ce,Up
per
Co
lorad
oR
iverB
asin,
Co
lorad
o, 1997 Site
(fig. 2)
Diazinon,µg/L
(39572)
Dieldrin,µg/L
(39381)
Disulfoton,µg/L
(82677)
EPTC (Eptam),µg/L
(82668)
Ethalfluralin,µg/L
(82663)
Ethoprophos,µg/L
(82672)
Fonofos,µg/L
(04095)
HCH, alpha-,µg/L
(34253)
Lindane,µg/L
(39341)
M1 --- --- --- --- --- --- --- --- ---
M2 --- --- --- --- --- --- --- --- ---
M3 --- --- --- --- --- --- --- --- ---
M4 --- --- --- --- --- --- --- --- ---
M5 <0.002 <0.001 <0.017 <0.002 <0.004 <0.003 <0.003 <0.002 <0.004
M6 --- --- --- --- --- --- --- --- ---
M7 --- --- --- --- --- --- --- --- ---
M8 --- --- --- --- --- --- --- --- ---
M9 --- --- --- --- --- --- --- --- ---
M10 --- --- --- --- --- --- --- --- ---
M11 --- --- --- --- --- --- --- --- ---
M12 --- --- --- --- --- --- --- --- ---
M13 --- --- --- --- --- --- --- --- ---
M14 --- --- --- --- --- --- --- --- ---
M15 <0.002 <0.001 <0.017 <0.002 <0.004 <0.003 <0.003 <0.002 <0.004
Appendix 1. Selected ground-water-quality data for sites sampled in the Southern Rocky Mountains physiographic province—Continued
[oC, degrees Celsius; µS/cm, microsiemens per centimeter at 25 degrees Celsius; mg/L, milligrams per liter; µg/L, micrograms per liter; NTU, nephelometric turbidity units; pCi/L, picocuries per liter;cols/100 mL, colonies per 100 milliliters; ---, no data; <, less than; E, estimated; number in parentheses below the water-quality property or constituent is the data parameter from the U.S. Geological SurveyNational Water Information System (NWIS) data base]
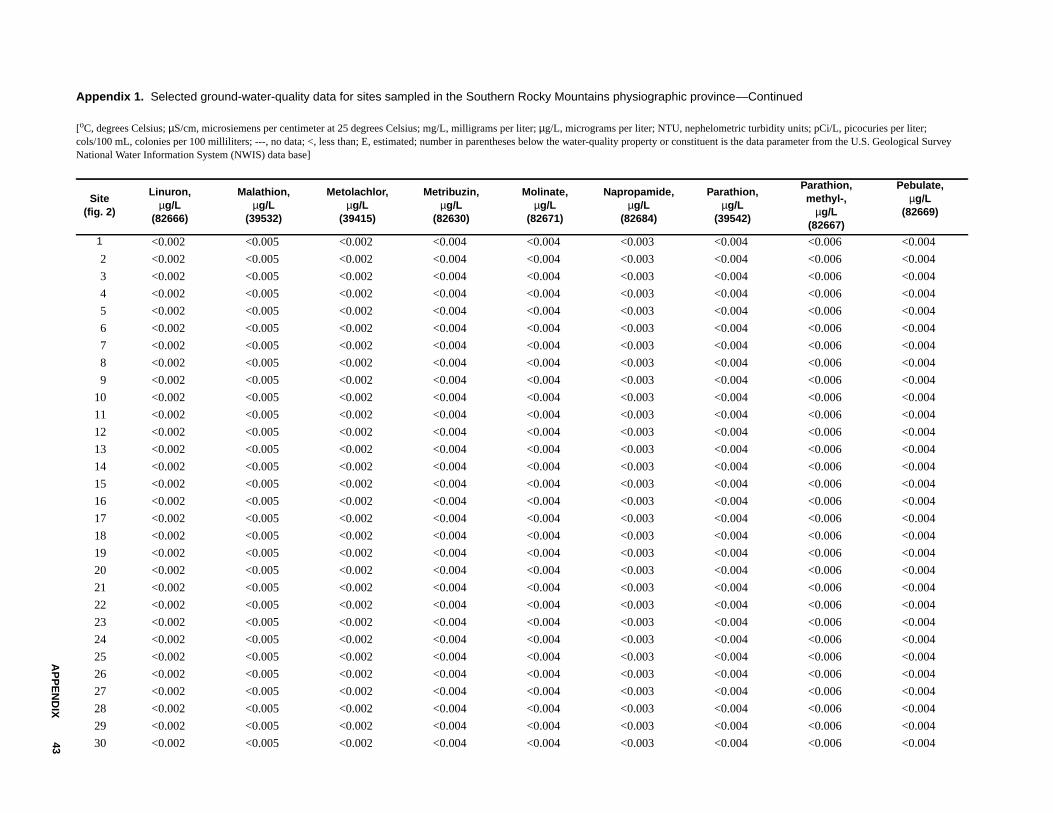
AP
PE
ND
IX43
Appendix 1. Selected ground-water-quality data for sites sampled in the Southern Rocky Mountains physiographic province
[oC, degrees Celsius; µS/cm, microsiemens per centimeter at 25 degrees Celsius; mg/L, milligrams per liter; µg/L, micrograms per liter; NTU, nephelometric turbidity units; pCi/L, picocuries per liter;cols/100 mL, colonies per 100 milliliters; ---, no data; <, less than; E, estimated; number in parentheses below the water-quality property or constituent is the data parameter from the U.S. Geological SurveyNational Water Information System (NWIS) data base]
Site(fig. 2)
Linuron,µg/L
(82666)
Malathion,µg/L
(39532)
Metolachlor,µg/L
(39415)
Metribuzin,µg/L
(82630)
Molinate,µg/L
(82671)
Napropamide,µg/L
(82684)
Parathion,µg/L
(39542)
Parathion,methyl-,
µg/L(82667)
Pebulate,µg/L
(82669)
1 <0.002 <0.005 <0.002 <0.004 <0.004 <0.003 <0.004 <0.006 <0.004
2 <0.002 <0.005 <0.002 <0.004 <0.004 <0.003 <0.004 <0.006 <0.004
3 <0.002 <0.005 <0.002 <0.004 <0.004 <0.003 <0.004 <0.006 <0.004
4 <0.002 <0.005 <0.002 <0.004 <0.004 <0.003 <0.004 <0.006 <0.004
5 <0.002 <0.005 <0.002 <0.004 <0.004 <0.003 <0.004 <0.006 <0.004
6 <0.002 <0.005 <0.002 <0.004 <0.004 <0.003 <0.004 <0.006 <0.004
7 <0.002 <0.005 <0.002 <0.004 <0.004 <0.003 <0.004 <0.006 <0.004
8 <0.002 <0.005 <0.002 <0.004 <0.004 <0.003 <0.004 <0.006 <0.004
9 <0.002 <0.005 <0.002 <0.004 <0.004 <0.003 <0.004 <0.006 <0.004
10 <0.002 <0.005 <0.002 <0.004 <0.004 <0.003 <0.004 <0.006 <0.004
11 <0.002 <0.005 <0.002 <0.004 <0.004 <0.003 <0.004 <0.006 <0.004
12 <0.002 <0.005 <0.002 <0.004 <0.004 <0.003 <0.004 <0.006 <0.004
13 <0.002 <0.005 <0.002 <0.004 <0.004 <0.003 <0.004 <0.006 <0.004
14 <0.002 <0.005 <0.002 <0.004 <0.004 <0.003 <0.004 <0.006 <0.004
15 <0.002 <0.005 <0.002 <0.004 <0.004 <0.003 <0.004 <0.006 <0.004
16 <0.002 <0.005 <0.002 <0.004 <0.004 <0.003 <0.004 <0.006 <0.004
17 <0.002 <0.005 <0.002 <0.004 <0.004 <0.003 <0.004 <0.006 <0.004
18 <0.002 <0.005 <0.002 <0.004 <0.004 <0.003 <0.004 <0.006 <0.004
19 <0.002 <0.005 <0.002 <0.004 <0.004 <0.003 <0.004 <0.006 <0.004
20 <0.002 <0.005 <0.002 <0.004 <0.004 <0.003 <0.004 <0.006 <0.004
21 <0.002 <0.005 <0.002 <0.004 <0.004 <0.003 <0.004 <0.006 <0.004
22 <0.002 <0.005 <0.002 <0.004 <0.004 <0.003 <0.004 <0.006 <0.004
23 <0.002 <0.005 <0.002 <0.004 <0.004 <0.003 <0.004 <0.006 <0.004
24 <0.002 <0.005 <0.002 <0.004 <0.004 <0.003 <0.004 <0.006 <0.004
25 <0.002 <0.005 <0.002 <0.004 <0.004 <0.003 <0.004 <0.006 <0.004
26 <0.002 <0.005 <0.002 <0.004 <0.004 <0.003 <0.004 <0.006 <0.004
27 <0.002 <0.005 <0.002 <0.004 <0.004 <0.003 <0.004 <0.006 <0.004
28 <0.002 <0.005 <0.002 <0.004 <0.004 <0.003 <0.004 <0.006 <0.004
29 <0.002 <0.005 <0.002 <0.004 <0.004 <0.003 <0.004 <0.006 <0.004
30 <0.002 <0.005 <0.002 <0.004 <0.004 <0.003 <0.004 <0.006 <0.004
—Continued
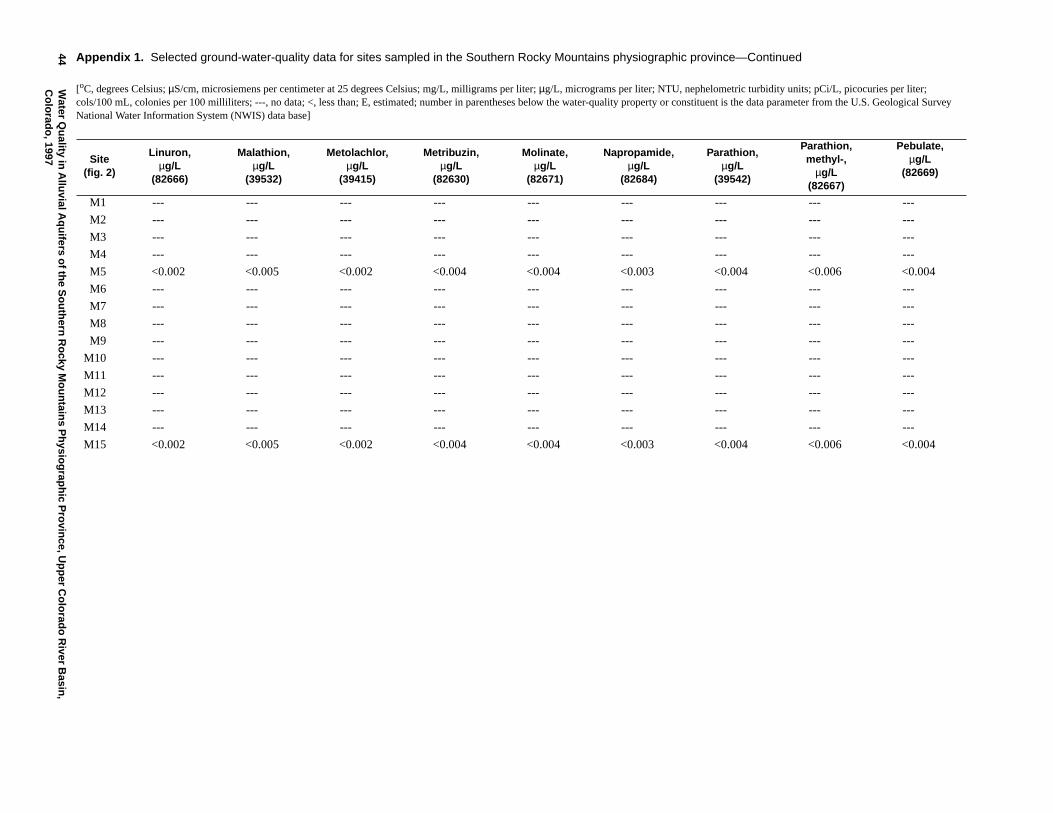
44W
aterQ
uality
inA
lluvialA
qu
iferso
fthe
So
uth
ernR
ocky
Mo
un
tains
Ph
ysiog
raph
icP
rovin
ce,Up
per
Co
lorad
oR
iverB
asin,
Co
lorad
o, 1997 Site
(fig. 2)
Linuron,µg/L
(82666)
Malathion,µg/L
(39532)
Metolachlor,µg/L
(39415)
Metribuzin,µg/L
(82630)
Molinate,µg/L
(82671)
Napropamide,µg/L
(82684)
Parathion,µg/L
(39542)
Parathion,methyl-,
µg/L(82667)
Pebulate,µg/L
(82669)
M1 --- --- --- --- --- --- --- --- ---
M2 --- --- --- --- --- --- --- --- ---
M3 --- --- --- --- --- --- --- --- ---
M4 --- --- --- --- --- --- --- --- ---
M5 <0.002 <0.005 <0.002 <0.004 <0.004 <0.003 <0.004 <0.006 <0.004
M6 --- --- --- --- --- --- --- --- ---
M7 --- --- --- --- --- --- --- --- ---
M8 --- --- --- --- --- --- --- --- ---
M9 --- --- --- --- --- --- --- --- ---
M10 --- --- --- --- --- --- --- --- ---
M11 --- --- --- --- --- --- --- --- ---
M12 --- --- --- --- --- --- --- --- ---
M13 --- --- --- --- --- --- --- --- ---
M14 --- --- --- --- --- --- --- --- ---
M15 <0.002 <0.005 <0.002 <0.004 <0.004 <0.003 <0.004 <0.006 <0.004
Appendix 1. Selected ground-water-quality data for sites sampled in the Southern Rocky Mountains physiographic province—Continued
[oC, degrees Celsius; µS/cm, microsiemens per centimeter at 25 degrees Celsius; mg/L, milligrams per liter; µg/L, micrograms per liter; NTU, nephelometric turbidity units; pCi/L, picocuries per liter;cols/100 mL, colonies per 100 milliliters; ---, no data; <, less than; E, estimated; number in parentheses below the water-quality property or constituent is the data parameter from the U.S. Geological SurveyNational Water Information System (NWIS) data base]
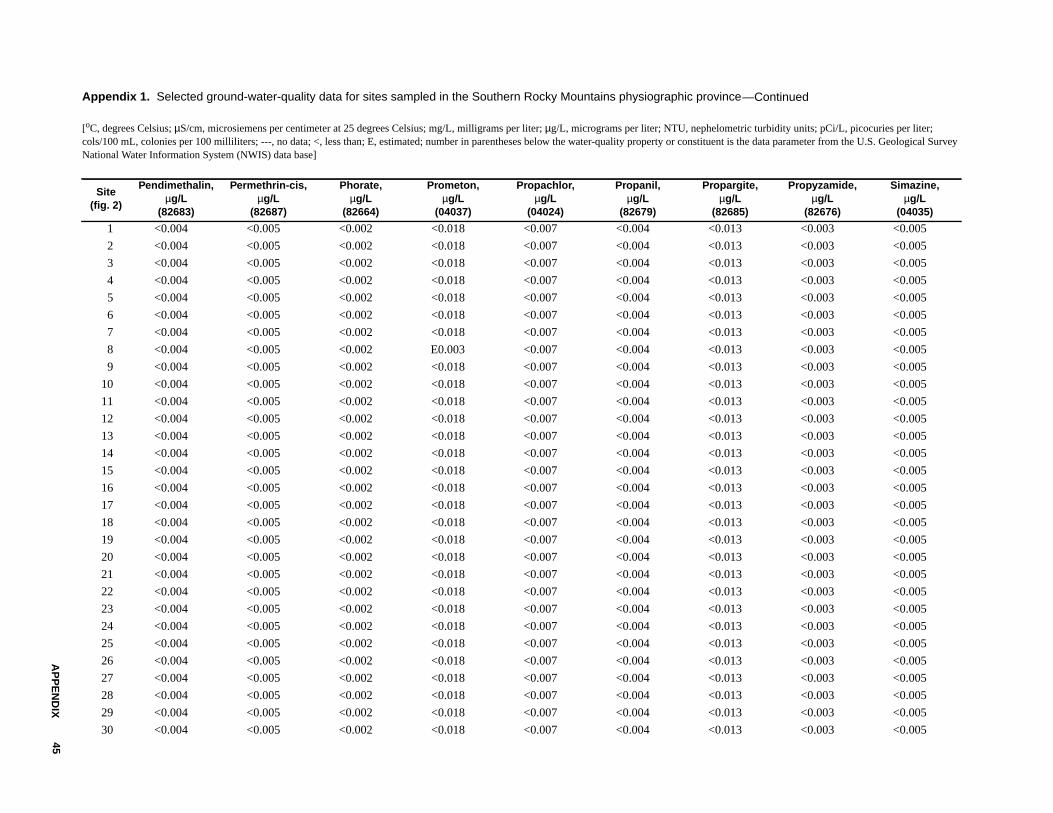
AP
PE
ND
IX45
Appendix 1. Selected ground-water-quality data for sites sampled in the Southern Rocky Mountains physiographic province
[oC, degrees Celsius; µS/cm, microsiemens per centimeter at 25 degrees Celsius; mg/L, milligrams per liter; µg/L, micrograms per liter; NTU, nephelometric turbidity units; pCi/L, picocuries per liter;cols/100 mL, colonies per 100 milliliters; ---, no data; <, less than; E, estimated; number in parentheses below the water-quality property or constituent is the data parameter from the U.S. Geological SurveyNational Water Information System (NWIS) data base]
Site(fig. 2)
Pendimethalin,µg/L
(82683)
Permethrin-cis,µg/L
(82687)
Phorate,µg/L
(82664)
Prometon,µg/L
(04037)
Propachlor,µg/L
(04024)
Propanil,µg/L
(82679)
Propargite,µg/L
(82685)
Propyzamide,µg/L
(82676)
Simazine,µg/L
(04035)
1 <0.004 <0.005 <0.002 <0.018 <0.007 <0.004 <0.013 <0.003 <0.005
2 <0.004 <0.005 <0.002 <0.018 <0.007 <0.004 <0.013 <0.003 <0.005
3 <0.004 <0.005 <0.002 <0.018 <0.007 <0.004 <0.013 <0.003 <0.005
4 <0.004 <0.005 <0.002 <0.018 <0.007 <0.004 <0.013 <0.003 <0.005
5 <0.004 <0.005 <0.002 <0.018 <0.007 <0.004 <0.013 <0.003 <0.005
6 <0.004 <0.005 <0.002 <0.018 <0.007 <0.004 <0.013 <0.003 <0.005
7 <0.004 <0.005 <0.002 <0.018 <0.007 <0.004 <0.013 <0.003 <0.005
8 <0.004 <0.005 <0.002 E0.003 <0.007 <0.004 <0.013 <0.003 <0.005
9 <0.004 <0.005 <0.002 <0.018 <0.007 <0.004 <0.013 <0.003 <0.005
10 <0.004 <0.005 <0.002 <0.018 <0.007 <0.004 <0.013 <0.003 <0.005
11 <0.004 <0.005 <0.002 <0.018 <0.007 <0.004 <0.013 <0.003 <0.005
12 <0.004 <0.005 <0.002 <0.018 <0.007 <0.004 <0.013 <0.003 <0.005
13 <0.004 <0.005 <0.002 <0.018 <0.007 <0.004 <0.013 <0.003 <0.005
14 <0.004 <0.005 <0.002 <0.018 <0.007 <0.004 <0.013 <0.003 <0.005
15 <0.004 <0.005 <0.002 <0.018 <0.007 <0.004 <0.013 <0.003 <0.005
16 <0.004 <0.005 <0.002 <0.018 <0.007 <0.004 <0.013 <0.003 <0.005
17 <0.004 <0.005 <0.002 <0.018 <0.007 <0.004 <0.013 <0.003 <0.005
18 <0.004 <0.005 <0.002 <0.018 <0.007 <0.004 <0.013 <0.003 <0.005
19 <0.004 <0.005 <0.002 <0.018 <0.007 <0.004 <0.013 <0.003 <0.005
20 <0.004 <0.005 <0.002 <0.018 <0.007 <0.004 <0.013 <0.003 <0.005
21 <0.004 <0.005 <0.002 <0.018 <0.007 <0.004 <0.013 <0.003 <0.005
22 <0.004 <0.005 <0.002 <0.018 <0.007 <0.004 <0.013 <0.003 <0.005
23 <0.004 <0.005 <0.002 <0.018 <0.007 <0.004 <0.013 <0.003 <0.005
24 <0.004 <0.005 <0.002 <0.018 <0.007 <0.004 <0.013 <0.003 <0.005
25 <0.004 <0.005 <0.002 <0.018 <0.007 <0.004 <0.013 <0.003 <0.005
26 <0.004 <0.005 <0.002 <0.018 <0.007 <0.004 <0.013 <0.003 <0.005
27 <0.004 <0.005 <0.002 <0.018 <0.007 <0.004 <0.013 <0.003 <0.005
28 <0.004 <0.005 <0.002 <0.018 <0.007 <0.004 <0.013 <0.003 <0.005
29 <0.004 <0.005 <0.002 <0.018 <0.007 <0.004 <0.013 <0.003 <0.005
30 <0.004 <0.005 <0.002 <0.018 <0.007 <0.004 <0.013 <0.003 <0.005
—Continued
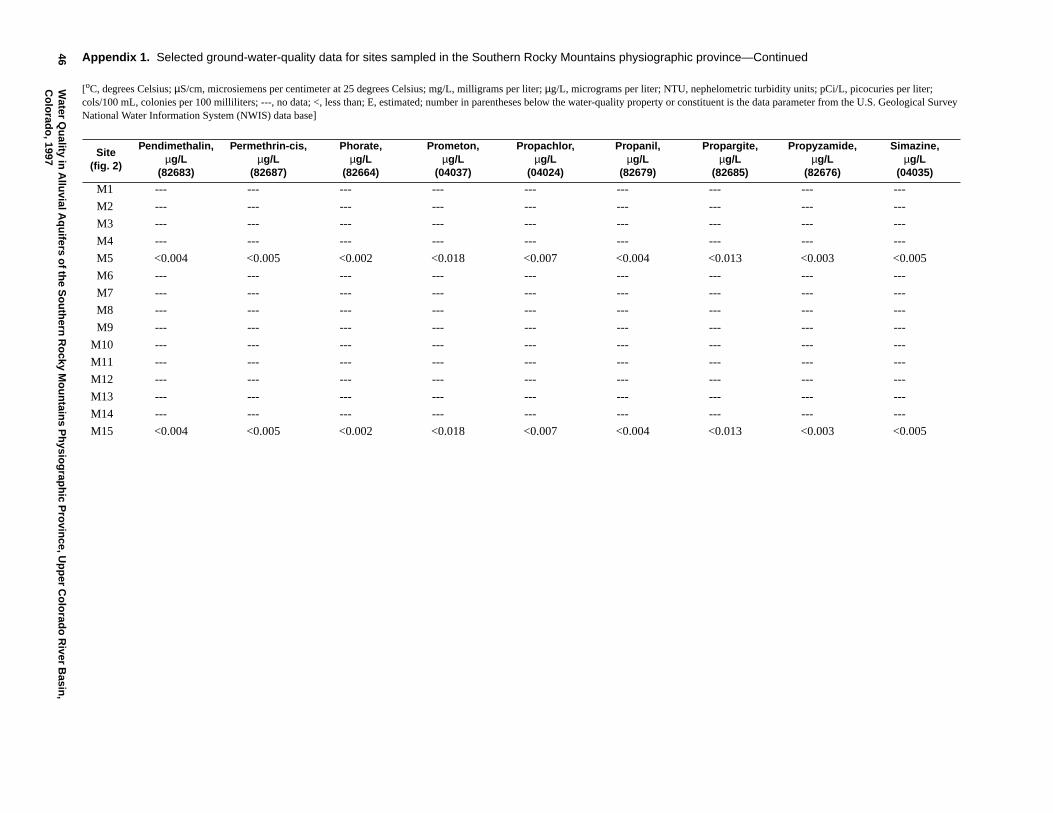
46W
aterQ
uality
inA
lluvialA
qu
iferso
fthe
So
uth
ernR
ocky
Mo
un
tains
Ph
ysiog
raph
icP
rovin
ce,Up
per
Co
lorad
oR
iverB
asin,
Co
lorad
o, 1997 Site
(fig. 2)
Pendimethalin,µg/L
(82683)
Permethrin-cis,µg/L
(82687)
Phorate,µg/L
(82664)
Prometon,µg/L
(04037)
Propachlor,µg/L
(04024)
Propanil,µg/L
(82679)
Propargite,µg/L
(82685)
Propyzamide,µg/L
(82676)
Simazine,µg/L
(04035)
M1 --- --- --- --- --- --- --- --- ---
M2 --- --- --- --- --- --- --- --- ---
M3 --- --- --- --- --- --- --- --- ---
M4 --- --- --- --- --- --- --- --- ---
M5 <0.004 <0.005 <0.002 <0.018 <0.007 <0.004 <0.013 <0.003 <0.005
M6 --- --- --- --- --- --- --- --- ---
M7 --- --- --- --- --- --- --- --- ---
M8 --- --- --- --- --- --- --- --- ---
M9 --- --- --- --- --- --- --- --- ---
M10 --- --- --- --- --- --- --- --- ---
M11 --- --- --- --- --- --- --- --- ---
M12 --- --- --- --- --- --- --- --- ---
M13 --- --- --- --- --- --- --- --- ---
M14 --- --- --- --- --- --- --- --- ---
M15 <0.004 <0.005 <0.002 <0.018 <0.007 <0.004 <0.013 <0.003 <0.005
Appendix 1. Selected ground-water-quality data for sites sampled in the Southern Rocky Mountains physiographic province—Continued
[oC, degrees Celsius; µS/cm, microsiemens per centimeter at 25 degrees Celsius; mg/L, milligrams per liter; µg/L, micrograms per liter; NTU, nephelometric turbidity units; pCi/L, picocuries per liter;cols/100 mL, colonies per 100 milliliters; ---, no data; <, less than; E, estimated; number in parentheses below the water-quality property or constituent is the data parameter from the U.S. Geological SurveyNational Water Information System (NWIS) data base]
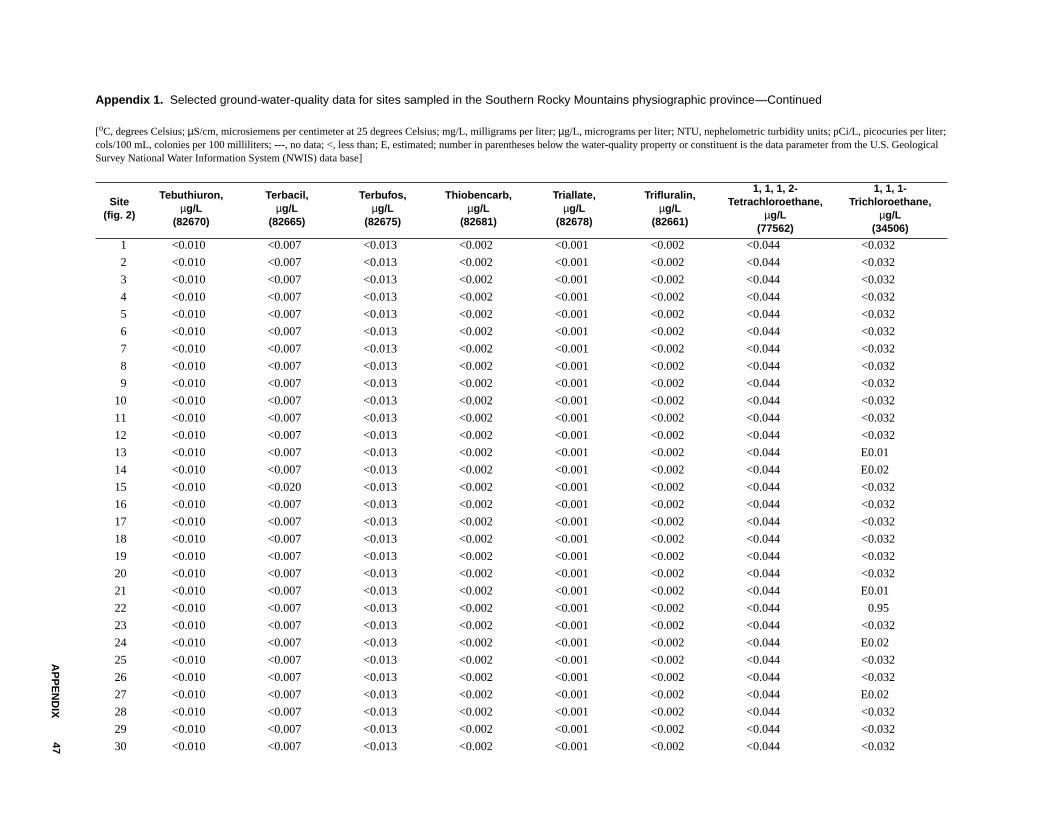
AP
PE
ND
IX47
Appendix 1. Selected ground-water-quality data for sites sampled in the Southern Rocky Mountains physiographic province
[oC, degrees Celsius; µS/cm, microsiemens per centimeter at 25 degrees Celsius; mg/L, milligrams per liter; µg/L, micrograms per liter; NTU, nephelometric turbidity units; pCi/L, picocuries per liter;cols/100 mL, colonies per 100 milliliters; ---, no data; <, less than; E, estimated; number in parentheses below the water-quality property or constituent is the data parameter from the U.S. GeologicalSurvey National Water Information System (NWIS) data base]
Site(fig. 2)
Tebuthiuron,µg/L
(82670)
Terbacil,µg/L
(82665)
Terbufos,µg/L
(82675)
Thiobencarb,µg/L
(82681)
Triallate,µg/L
(82678)
Trifluralin,µg/L
(82661)
1, 1, 1, 2-Tetrachloroethane,
µg/L(77562)
1, 1, 1-Trichloroethane,
µg/L(34506)
1 <0.010 <0.007 <0.013 <0.002 <0.001 <0.002 <0.044 <0.032
2 <0.010 <0.007 <0.013 <0.002 <0.001 <0.002 <0.044 <0.032
3 <0.010 <0.007 <0.013 <0.002 <0.001 <0.002 <0.044 <0.032
4 <0.010 <0.007 <0.013 <0.002 <0.001 <0.002 <0.044 <0.032
5 <0.010 <0.007 <0.013 <0.002 <0.001 <0.002 <0.044 <0.032
6 <0.010 <0.007 <0.013 <0.002 <0.001 <0.002 <0.044 <0.032
7 <0.010 <0.007 <0.013 <0.002 <0.001 <0.002 <0.044 <0.032
8 <0.010 <0.007 <0.013 <0.002 <0.001 <0.002 <0.044 <0.032
9 <0.010 <0.007 <0.013 <0.002 <0.001 <0.002 <0.044 <0.032
10 <0.010 <0.007 <0.013 <0.002 <0.001 <0.002 <0.044 <0.032
11 <0.010 <0.007 <0.013 <0.002 <0.001 <0.002 <0.044 <0.032
12 <0.010 <0.007 <0.013 <0.002 <0.001 <0.002 <0.044 <0.032
13 <0.010 <0.007 <0.013 <0.002 <0.001 <0.002 <0.044 E0.01
14 <0.010 <0.007 <0.013 <0.002 <0.001 <0.002 <0.044 E0.02
15 <0.010 <0.020 <0.013 <0.002 <0.001 <0.002 <0.044 <0.032
16 <0.010 <0.007 <0.013 <0.002 <0.001 <0.002 <0.044 <0.032
17 <0.010 <0.007 <0.013 <0.002 <0.001 <0.002 <0.044 <0.032
18 <0.010 <0.007 <0.013 <0.002 <0.001 <0.002 <0.044 <0.032
19 <0.010 <0.007 <0.013 <0.002 <0.001 <0.002 <0.044 <0.032
20 <0.010 <0.007 <0.013 <0.002 <0.001 <0.002 <0.044 <0.032
21 <0.010 <0.007 <0.013 <0.002 <0.001 <0.002 <0.044 E0.01
22 <0.010 <0.007 <0.013 <0.002 <0.001 <0.002 <0.044 0.95
23 <0.010 <0.007 <0.013 <0.002 <0.001 <0.002 <0.044 <0.032
24 <0.010 <0.007 <0.013 <0.002 <0.001 <0.002 <0.044 E0.02
25 <0.010 <0.007 <0.013 <0.002 <0.001 <0.002 <0.044 <0.032
26 <0.010 <0.007 <0.013 <0.002 <0.001 <0.002 <0.044 <0.032
27 <0.010 <0.007 <0.013 <0.002 <0.001 <0.002 <0.044 E0.02
28 <0.010 <0.007 <0.013 <0.002 <0.001 <0.002 <0.044 <0.032
29 <0.010 <0.007 <0.013 <0.002 <0.001 <0.002 <0.044 <0.032
30 <0.010 <0.007 <0.013 <0.002 <0.001 <0.002 <0.044 <0.032
—Continued
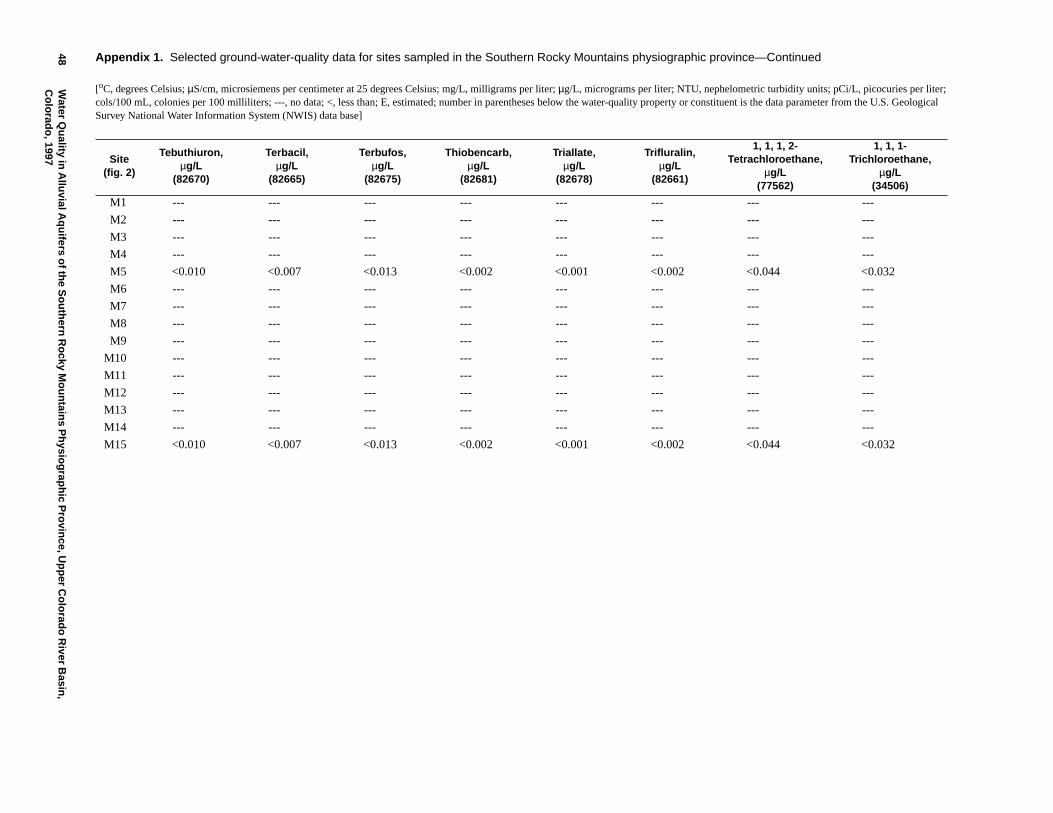
48W
aterQ
uality
inA
lluvialA
qu
iferso
fthe
So
uth
ernR
ocky
Mo
un
tains
Ph
ysiog
raph
icP
rovin
ce,Up
per
Co
lorad
oR
iverB
asin,
Co
lorad
o, 1997 Site
(fig. 2)
Tebuthiuron,µg/L
(82670)
Terbacil,µg/L
(82665)
Terbufos,µg/L
(82675)
Thiobencarb,µg/L
(82681)
Triallate,µg/L
(82678)
Trifluralin,µg/L
(82661)
1, 1, 1, 2-Tetrachloroethane,
µg/L(77562)
1, 1, 1-Trichloroethane,
µg/L(34506)
M1 --- --- --- --- --- --- --- ---
M2 --- --- --- --- --- --- --- ---
M3 --- --- --- --- --- --- --- ---
M4 --- --- --- --- --- --- --- ---
M5 <0.010 <0.007 <0.013 <0.002 <0.001 <0.002 <0.044 <0.032
M6 --- --- --- --- --- --- --- ---
M7 --- --- --- --- --- --- --- ---
M8 --- --- --- --- --- --- --- ---
M9 --- --- --- --- --- --- --- ---
M10 --- --- --- --- --- --- --- ---
M11 --- --- --- --- --- --- --- ---
M12 --- --- --- --- --- --- --- ---
M13 --- --- --- --- --- --- --- ---
M14 --- --- --- --- --- --- --- ---
M15 <0.010 <0.007 <0.013 <0.002 <0.001 <0.002 <0.044 <0.032
Appendix 1. Selected ground-water-quality data for sites sampled in the Southern Rocky Mountains physiographic province—Continued
[oC, degrees Celsius; µS/cm, microsiemens per centimeter at 25 degrees Celsius; mg/L, milligrams per liter; µg/L, micrograms per liter; NTU, nephelometric turbidity units; pCi/L, picocuries per liter;cols/100 mL, colonies per 100 milliliters; ---, no data; <, less than; E, estimated; number in parentheses below the water-quality property or constituent is the data parameter from the U.S. GeologicalSurvey National Water Information System (NWIS) data base]
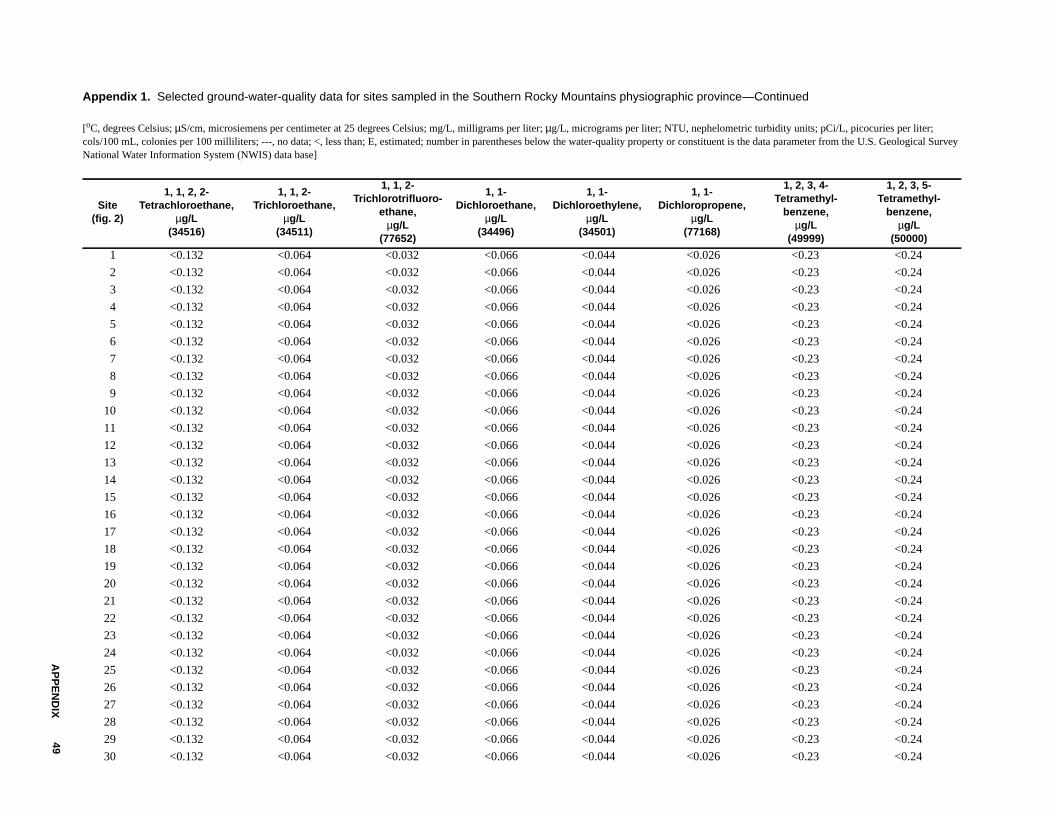
AP
PE
ND
IX49
Appendix 1. Selected ground-water-quality data for sites sampled in the Southern Rocky Mountains physiographic province
[oC, degrees Celsius; µS/cm, microsiemens per centimeter at 25 degrees Celsius; mg/L, milligrams per liter; µg/L, micrograms per liter; NTU, nephelometric turbidity units; pCi/L, picocuries per liter;cols/100 mL, colonies per 100 milliliters; ---, no data; <, less than; E, estimated; number in parentheses below the water-quality property or constituent is the data parameter from the U.S. Geological SurveyNational Water Information System (NWIS) data base]
Site(fig. 2)
1, 1, 2, 2-Tetrachloroethane,
µg/L(34516)
1, 1, 2-Trichloroethane,
µg/L(34511)
1, 1, 2-Trichlorotrifluoro-
ethane,µg/L
(77652)
1, 1-Dichloroethane,
µg/L(34496)
1, 1-Dichloroethylene,
µg/L(34501)
1, 1-Dichloropropene,
µg/L(77168)
1, 2, 3, 4-Tetramethyl-
benzene,µg/L
(49999)
1, 2, 3, 5-Tetramethyl-
benzene,µg/L
(50000)
1 <0.132 <0.064 <0.032 <0.066 <0.044 <0.026 <0.23 <0.24
2 <0.132 <0.064 <0.032 <0.066 <0.044 <0.026 <0.23 <0.24
3 <0.132 <0.064 <0.032 <0.066 <0.044 <0.026 <0.23 <0.24
4 <0.132 <0.064 <0.032 <0.066 <0.044 <0.026 <0.23 <0.24
5 <0.132 <0.064 <0.032 <0.066 <0.044 <0.026 <0.23 <0.24
6 <0.132 <0.064 <0.032 <0.066 <0.044 <0.026 <0.23 <0.24
7 <0.132 <0.064 <0.032 <0.066 <0.044 <0.026 <0.23 <0.24
8 <0.132 <0.064 <0.032 <0.066 <0.044 <0.026 <0.23 <0.24
9 <0.132 <0.064 <0.032 <0.066 <0.044 <0.026 <0.23 <0.24
10 <0.132 <0.064 <0.032 <0.066 <0.044 <0.026 <0.23 <0.24
11 <0.132 <0.064 <0.032 <0.066 <0.044 <0.026 <0.23 <0.24
12 <0.132 <0.064 <0.032 <0.066 <0.044 <0.026 <0.23 <0.24
13 <0.132 <0.064 <0.032 <0.066 <0.044 <0.026 <0.23 <0.24
14 <0.132 <0.064 <0.032 <0.066 <0.044 <0.026 <0.23 <0.24
15 <0.132 <0.064 <0.032 <0.066 <0.044 <0.026 <0.23 <0.24
16 <0.132 <0.064 <0.032 <0.066 <0.044 <0.026 <0.23 <0.24
17 <0.132 <0.064 <0.032 <0.066 <0.044 <0.026 <0.23 <0.24
18 <0.132 <0.064 <0.032 <0.066 <0.044 <0.026 <0.23 <0.24
19 <0.132 <0.064 <0.032 <0.066 <0.044 <0.026 <0.23 <0.24
20 <0.132 <0.064 <0.032 <0.066 <0.044 <0.026 <0.23 <0.24
21 <0.132 <0.064 <0.032 <0.066 <0.044 <0.026 <0.23 <0.24
22 <0.132 <0.064 <0.032 <0.066 <0.044 <0.026 <0.23 <0.24
23 <0.132 <0.064 <0.032 <0.066 <0.044 <0.026 <0.23 <0.24
24 <0.132 <0.064 <0.032 <0.066 <0.044 <0.026 <0.23 <0.24
25 <0.132 <0.064 <0.032 <0.066 <0.044 <0.026 <0.23 <0.24
26 <0.132 <0.064 <0.032 <0.066 <0.044 <0.026 <0.23 <0.24
27 <0.132 <0.064 <0.032 <0.066 <0.044 <0.026 <0.23 <0.24
28 <0.132 <0.064 <0.032 <0.066 <0.044 <0.026 <0.23 <0.24
29 <0.132 <0.064 <0.032 <0.066 <0.044 <0.026 <0.23 <0.24
30 <0.132 <0.064 <0.032 <0.066 <0.044 <0.026 <0.23 <0.24
—Continued
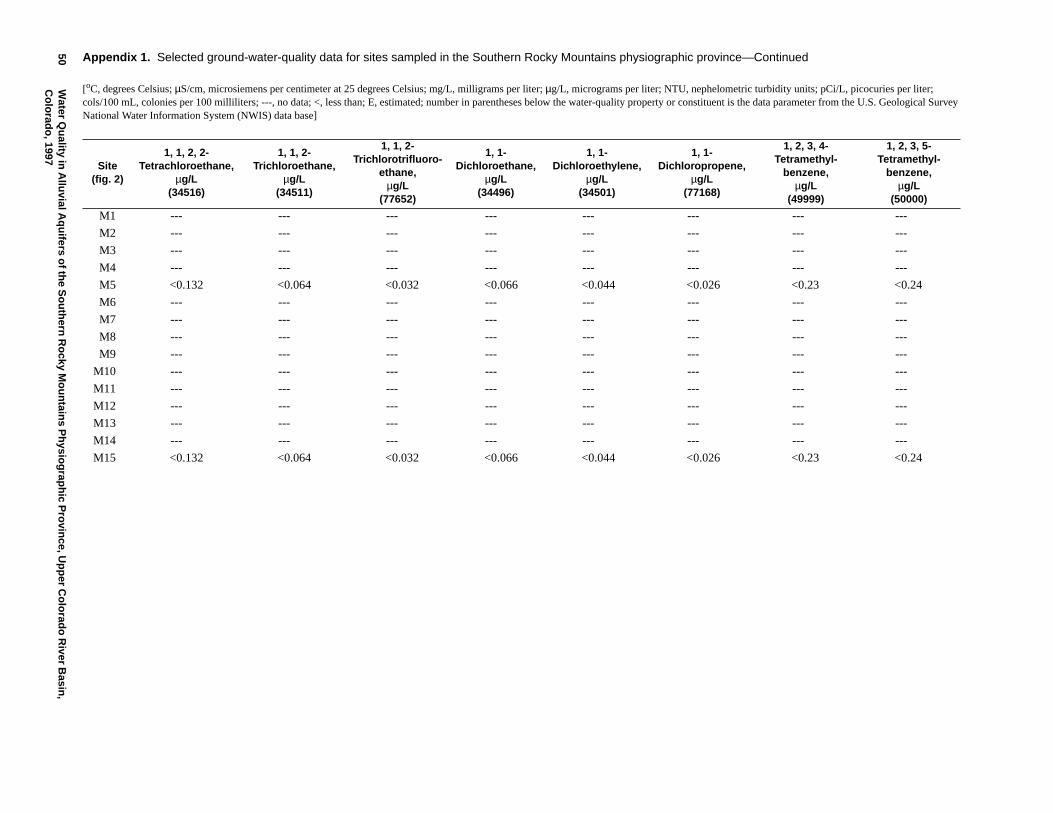
50W
aterQ
uality
inA
lluvialA
qu
iferso
fthe
So
uth
ernR
ocky
Mo
un
tains
Ph
ysiog
raph
icP
rovin
ce,Up
per
Co
lorad
oR
iverB
asin,
Co
lorad
o, 1997
Site(fig. 2)
1, 1, 2, 2-Tetrachloroethane,
µg/L(34516)
1, 1, 2-Trichloroethane,
µg/L(34511)
1, 1, 2-Trichlorotrifluoro-
ethane,µg/L
(77652)
1, 1-Dichloroethane,
µg/L(34496)
1, 1-Dichloroethylene,
µg/L(34501)
1, 1-Dichloropropene,
µg/L(77168)
1, 2, 3, 4-Tetramethyl-
benzene,µg/L
(49999)
1, 2, 3, 5-Tetramethyl-
benzene,µg/L
(50000)
M1 --- --- --- --- --- --- --- ---
M2 --- --- --- --- --- --- --- ---
M3 --- --- --- --- --- --- --- ---
M4 --- --- --- --- --- --- --- ---
M5 <0.132 <0.064 <0.032 <0.066 <0.044 <0.026 <0.23 <0.24
M6 --- --- --- --- --- --- --- ---
M7 --- --- --- --- --- --- --- ---
M8 --- --- --- --- --- --- --- ---
M9 --- --- --- --- --- --- --- ---
M10 --- --- --- --- --- --- --- ---
M11 --- --- --- --- --- --- --- ---
M12 --- --- --- --- --- --- --- ---
M13 --- --- --- --- --- --- --- ---
M14 --- --- --- --- --- --- --- ---
M15 <0.132 <0.064 <0.032 <0.066 <0.044 <0.026 <0.23 <0.24
Appendix 1. Selected ground-water-quality data for sites sampled in the Southern Rocky Mountains physiographic province—Continued
[oC, degrees Celsius; µS/cm, microsiemens per centimeter at 25 degrees Celsius; mg/L, milligrams per liter; µg/L, micrograms per liter; NTU, nephelometric turbidity units; pCi/L, picocuries per liter;cols/100 mL, colonies per 100 milliliters; ---, no data; <, less than; E, estimated; number in parentheses below the water-quality property or constituent is the data parameter from the U.S. Geological SurveyNational Water Information System (NWIS) data base]
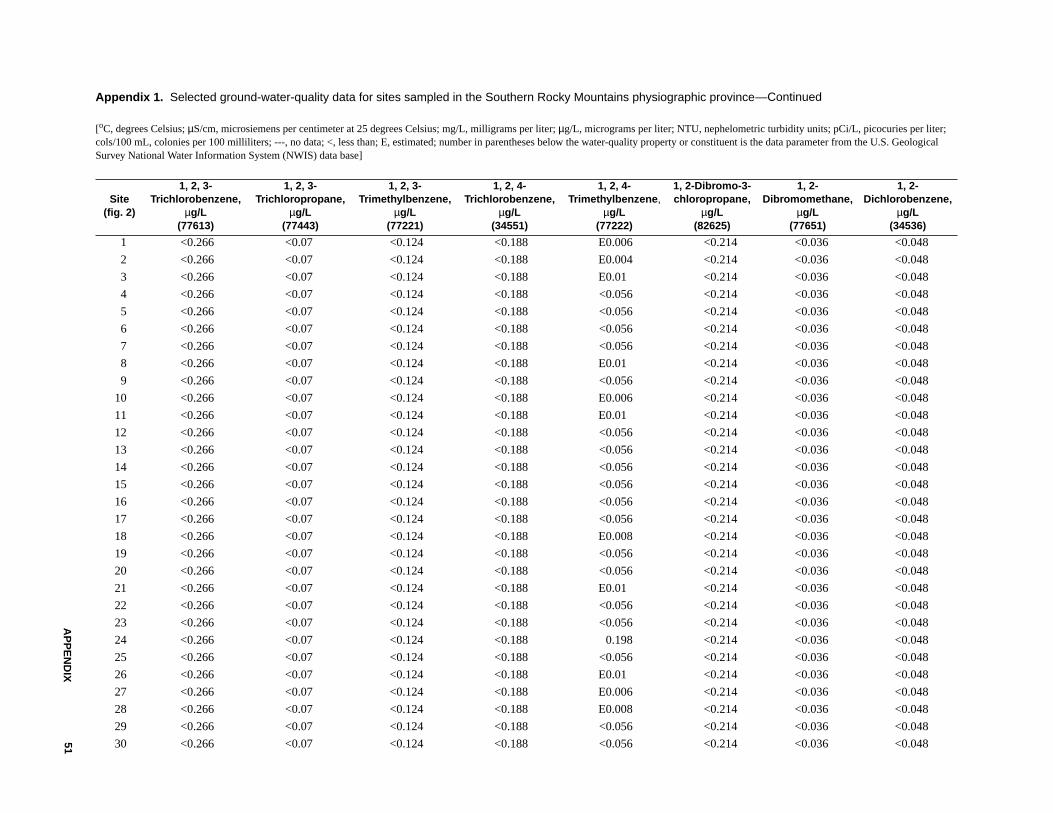
AP
PE
ND
IX51
Appendix 1. Selected ground-water-quality data for sites sampled in the Southern Rocky Mountains physiographic province
[oC, degrees Celsius; µS/cm, microsiemens per centimeter at 25 degrees Celsius; mg/L, milligrams per liter; µg/L, micrograms per liter; NTU, nephelometric turbidity units; pCi/L, picocuries per liter;cols/100 mL, colonies per 100 milliliters; ---, no data; <, less than; E, estimated; number in parentheses below the water-quality property or constituent is the data parameter from the U.S. GeologicalSurvey National Water Information System (NWIS) data base]
Site(fig. 2)
1, 2, 3-Trichlorobenzene,
µg/L(77613)
1, 2, 3-Trichloropropane,
µg/L(77443)
1, 2, 3-Trimethylbenzene,
µg/L(77221)
1, 2, 4-Trichlorobenzene,
µg/L(34551)
1, 2, 4-Trimethylbenzene,
µg/L(77222)
1, 2-Dibromo-3-chloropropane,
µg/L(82625)
1, 2-Dibromomethane,
µg/L(77651)
1, 2-Dichlorobenzene,
µg/L(34536)
1 <0.266 <0.07 <0.124 <0.188 E0.006 <0.214 <0.036 <0.048
2 <0.266 <0.07 <0.124 <0.188 E0.004 <0.214 <0.036 <0.048
3 <0.266 <0.07 <0.124 <0.188 E0.01 <0.214 <0.036 <0.048
4 <0.266 <0.07 <0.124 <0.188 <0.056 <0.214 <0.036 <0.048
5 <0.266 <0.07 <0.124 <0.188 <0.056 <0.214 <0.036 <0.048
6 <0.266 <0.07 <0.124 <0.188 <0.056 <0.214 <0.036 <0.048
7 <0.266 <0.07 <0.124 <0.188 <0.056 <0.214 <0.036 <0.048
8 <0.266 <0.07 <0.124 <0.188 E0.01 <0.214 <0.036 <0.048
9 <0.266 <0.07 <0.124 <0.188 <0.056 <0.214 <0.036 <0.048
10 <0.266 <0.07 <0.124 <0.188 E0.006 <0.214 <0.036 <0.048
11 <0.266 <0.07 <0.124 <0.188 E0.01 <0.214 <0.036 <0.048
12 <0.266 <0.07 <0.124 <0.188 <0.056 <0.214 <0.036 <0.048
13 <0.266 <0.07 <0.124 <0.188 <0.056 <0.214 <0.036 <0.048
14 <0.266 <0.07 <0.124 <0.188 <0.056 <0.214 <0.036 <0.048
15 <0.266 <0.07 <0.124 <0.188 <0.056 <0.214 <0.036 <0.048
16 <0.266 <0.07 <0.124 <0.188 <0.056 <0.214 <0.036 <0.048
17 <0.266 <0.07 <0.124 <0.188 <0.056 <0.214 <0.036 <0.048
18 <0.266 <0.07 <0.124 <0.188 E0.008 <0.214 <0.036 <0.048
19 <0.266 <0.07 <0.124 <0.188 <0.056 <0.214 <0.036 <0.048
20 <0.266 <0.07 <0.124 <0.188 <0.056 <0.214 <0.036 <0.048
21 <0.266 <0.07 <0.124 <0.188 E0.01 <0.214 <0.036 <0.048
22 <0.266 <0.07 <0.124 <0.188 <0.056 <0.214 <0.036 <0.048
23 <0.266 <0.07 <0.124 <0.188 <0.056 <0.214 <0.036 <0.048
24 <0.266 <0.07 <0.124 <0.188 0.198 <0.214 <0.036 <0.048
25 <0.266 <0.07 <0.124 <0.188 <0.056 <0.214 <0.036 <0.048
26 <0.266 <0.07 <0.124 <0.188 E0.01 <0.214 <0.036 <0.048
27 <0.266 <0.07 <0.124 <0.188 E0.006 <0.214 <0.036 <0.048
28 <0.266 <0.07 <0.124 <0.188 E0.008 <0.214 <0.036 <0.048
29 <0.266 <0.07 <0.124 <0.188 <0.056 <0.214 <0.036 <0.048
30 <0.266 <0.07 <0.124 <0.188 <0.056 <0.214 <0.036 <0.048
—Continued
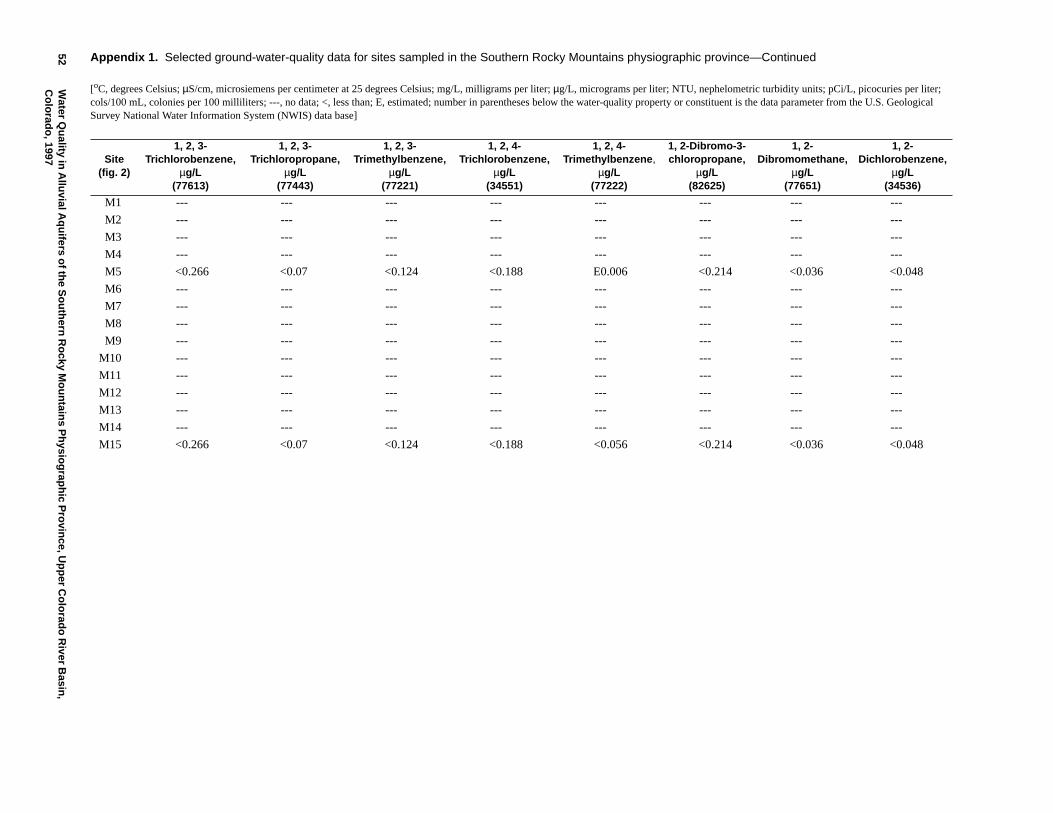
52W
aterQ
uality
inA
lluvialA
qu
iferso
fthe
So
uth
ernR
ocky
Mo
un
tains
Ph
ysiog
raph
icP
rovin
ce,Up
per
Co
lorad
oR
iverB
asin,
Co
lorad
o, 1997 Site
(fig. 2)
1, 2, 3-Trichlorobenzene,
µg/L(77613)
1, 2, 3-Trichloropropane,
µg/L(77443)
1, 2, 3-Trimethylbenzene,
µg/L(77221)
1, 2, 4-Trichlorobenzene,
µg/L(34551)
1, 2, 4-Trimethylbenzene,
µg/L(77222)
1, 2-Dibromo-3-chloropropane,
µg/L(82625)
1, 2-Dibromomethane,
µg/L(77651)
1, 2-Dichlorobenzene,
µg/L(34536)
M1 --- --- --- --- --- --- --- ---
M2 --- --- --- --- --- --- --- ---
M3 --- --- --- --- --- --- --- ---
M4 --- --- --- --- --- --- --- ---
M5 <0.266 <0.07 <0.124 <0.188 E0.006 <0.214 <0.036 <0.048
M6 --- --- --- --- --- --- --- ---
M7 --- --- --- --- --- --- --- ---
M8 --- --- --- --- --- --- --- ---
M9 --- --- --- --- --- --- --- ---
M10 --- --- --- --- --- --- --- ---
M11 --- --- --- --- --- --- --- ---
M12 --- --- --- --- --- --- --- ---
M13 --- --- --- --- --- --- --- ---
M14 --- --- --- --- --- --- --- ---
M15 <0.266 <0.07 <0.124 <0.188 <0.056 <0.214 <0.036 <0.048
Appendix 1. Selected ground-water-quality data for sites sampled in the Southern Rocky Mountains physiographic province—Continued
[oC, degrees Celsius; µS/cm, microsiemens per centimeter at 25 degrees Celsius; mg/L, milligrams per liter; µg/L, micrograms per liter; NTU, nephelometric turbidity units; pCi/L, picocuries per liter;cols/100 mL, colonies per 100 milliliters; ---, no data; <, less than; E, estimated; number in parentheses below the water-quality property or constituent is the data parameter from the U.S. GeologicalSurvey National Water Information System (NWIS) data base]
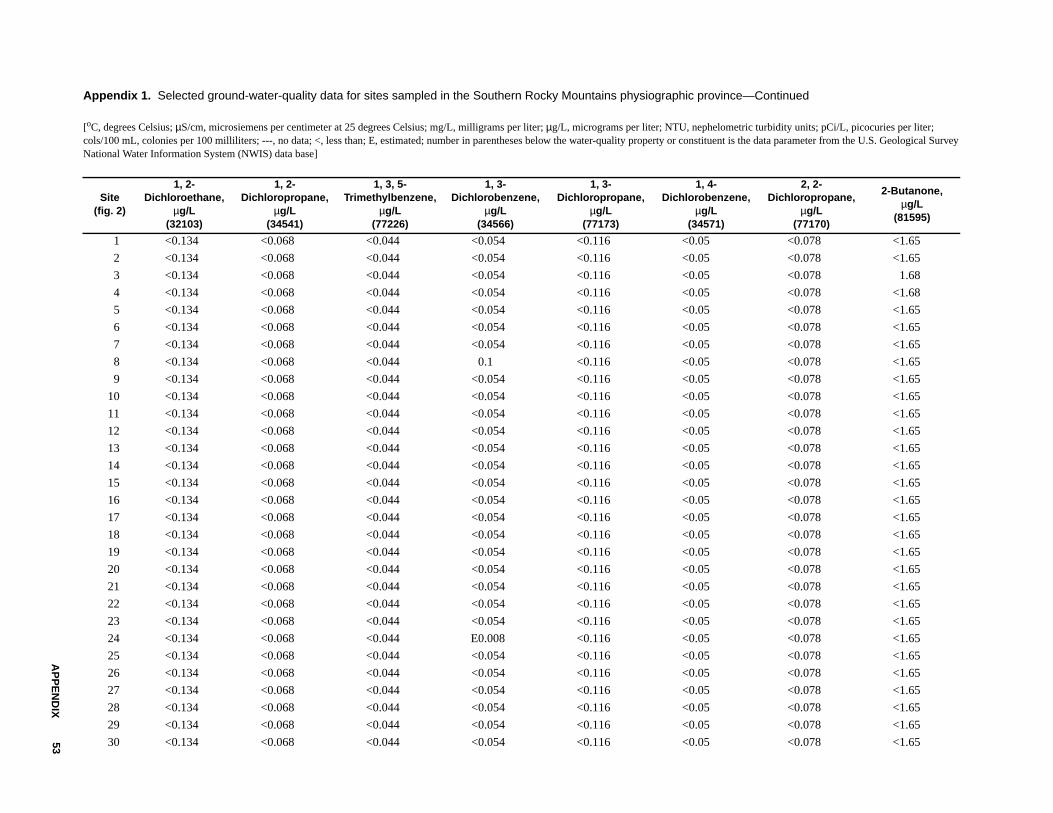
AP
PE
ND
IX53
Appendix 1. Selected ground-water-quality data for sites sampled in the Southern Rocky Mountains physiographic province
[oC, degrees Celsius; µS/cm, microsiemens per centimeter at 25 degrees Celsius; mg/L, milligrams per liter; µg/L, micrograms per liter; NTU, nephelometric turbidity units; pCi/L, picocuries per liter;cols/100 mL, colonies per 100 milliliters; ---, no data; <, less than; E, estimated; number in parentheses below the water-quality property or constituent is the data parameter from the U.S. Geological SurveyNational Water Information System (NWIS) data base]
Site(fig. 2)
1, 2-Dichloroethane,
µg/L(32103)
1, 2-Dichloropropane,
µg/L(34541)
1, 3, 5-Trimethylbenzene,
µg/L(77226)
1, 3-Dichlorobenzene,
µg/L(34566)
1, 3-Dichloropropane,
µg/L(77173)
1, 4-Dichlorobenzene,
µg/L(34571)
2, 2-Dichloropropane,
µg/L(77170)
2-Butanone,µg/L
(81595)
1 <0.134 <0.068 <0.044 <0.054 <0.116 <0.05 <0.078 <1.65
2 <0.134 <0.068 <0.044 <0.054 <0.116 <0.05 <0.078 <1.65
3 <0.134 <0.068 <0.044 <0.054 <0.116 <0.05 <0.078 1.68
4 <0.134 <0.068 <0.044 <0.054 <0.116 <0.05 <0.078 <1.68
5 <0.134 <0.068 <0.044 <0.054 <0.116 <0.05 <0.078 <1.65
6 <0.134 <0.068 <0.044 <0.054 <0.116 <0.05 <0.078 <1.65
7 <0.134 <0.068 <0.044 <0.054 <0.116 <0.05 <0.078 <1.65
8 <0.134 <0.068 <0.044 0.1 <0.116 <0.05 <0.078 <1.65
9 <0.134 <0.068 <0.044 <0.054 <0.116 <0.05 <0.078 <1.65
10 <0.134 <0.068 <0.044 <0.054 <0.116 <0.05 <0.078 <1.65
11 <0.134 <0.068 <0.044 <0.054 <0.116 <0.05 <0.078 <1.65
12 <0.134 <0.068 <0.044 <0.054 <0.116 <0.05 <0.078 <1.65
13 <0.134 <0.068 <0.044 <0.054 <0.116 <0.05 <0.078 <1.65
14 <0.134 <0.068 <0.044 <0.054 <0.116 <0.05 <0.078 <1.65
15 <0.134 <0.068 <0.044 <0.054 <0.116 <0.05 <0.078 <1.65
16 <0.134 <0.068 <0.044 <0.054 <0.116 <0.05 <0.078 <1.65
17 <0.134 <0.068 <0.044 <0.054 <0.116 <0.05 <0.078 <1.65
18 <0.134 <0.068 <0.044 <0.054 <0.116 <0.05 <0.078 <1.65
19 <0.134 <0.068 <0.044 <0.054 <0.116 <0.05 <0.078 <1.65
20 <0.134 <0.068 <0.044 <0.054 <0.116 <0.05 <0.078 <1.65
21 <0.134 <0.068 <0.044 <0.054 <0.116 <0.05 <0.078 <1.65
22 <0.134 <0.068 <0.044 <0.054 <0.116 <0.05 <0.078 <1.65
23 <0.134 <0.068 <0.044 <0.054 <0.116 <0.05 <0.078 <1.65
24 <0.134 <0.068 <0.044 E0.008 <0.116 <0.05 <0.078 <1.65
25 <0.134 <0.068 <0.044 <0.054 <0.116 <0.05 <0.078 <1.65
26 <0.134 <0.068 <0.044 <0.054 <0.116 <0.05 <0.078 <1.65
27 <0.134 <0.068 <0.044 <0.054 <0.116 <0.05 <0.078 <1.65
28 <0.134 <0.068 <0.044 <0.054 <0.116 <0.05 <0.078 <1.65
29 <0.134 <0.068 <0.044 <0.054 <0.116 <0.05 <0.078 <1.65
30 <0.134 <0.068 <0.044 <0.054 <0.116 <0.05 <0.078 <1.65
—Continued
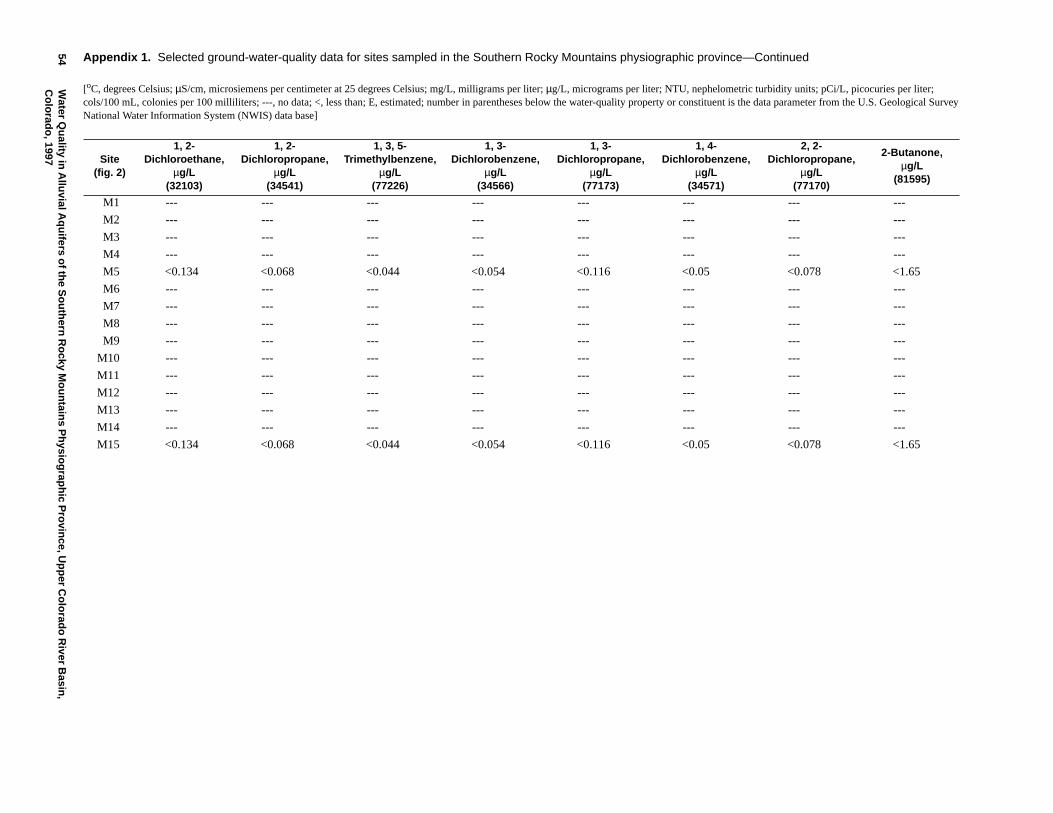
54W
aterQ
uality
inA
lluvialA
qu
iferso
fthe
So
uth
ernR
ocky
Mo
un
tains
Ph
ysiog
raph
icP
rovin
ce,Up
per
Co
lorad
oR
iverB
asin,
Co
lorad
o, 1997 Site
(fig. 2)
1, 2-Dichloroethane,
µg/L(32103)
1, 2-Dichloropropane,
µg/L(34541)
1, 3, 5-Trimethylbenzene,
µg/L(77226)
1, 3-Dichlorobenzene,
µg/L(34566)
1, 3-Dichloropropane,
µg/L(77173)
1, 4-Dichlorobenzene,
µg/L(34571)
2, 2-Dichloropropane,
µg/L(77170)
2-Butanone,µg/L
(81595)
M1 --- --- --- --- --- --- --- ---
M2 --- --- --- --- --- --- --- ---
M3 --- --- --- --- --- --- --- ---
M4 --- --- --- --- --- --- --- ---
M5 <0.134 <0.068 <0.044 <0.054 <0.116 <0.05 <0.078 <1.65
M6 --- --- --- --- --- --- --- ---
M7 --- --- --- --- --- --- --- ---
M8 --- --- --- --- --- --- --- ---
M9 --- --- --- --- --- --- --- ---
M10 --- --- --- --- --- --- --- ---
M11 --- --- --- --- --- --- --- ---
M12 --- --- --- --- --- --- --- ---
M13 --- --- --- --- --- --- --- ---
M14 --- --- --- --- --- --- --- ---
M15 <0.134 <0.068 <0.044 <0.054 <0.116 <0.05 <0.078 <1.65
Appendix 1. Selected ground-water-quality data for sites sampled in the Southern Rocky Mountains physiographic province—Continued
[oC, degrees Celsius; µS/cm, microsiemens per centimeter at 25 degrees Celsius; mg/L, milligrams per liter; µg/L, micrograms per liter; NTU, nephelometric turbidity units; pCi/L, picocuries per liter;cols/100 mL, colonies per 100 milliliters; ---, no data; <, less than; E, estimated; number in parentheses below the water-quality property or constituent is the data parameter from the U.S. Geological SurveyNational Water Information System (NWIS) data base]
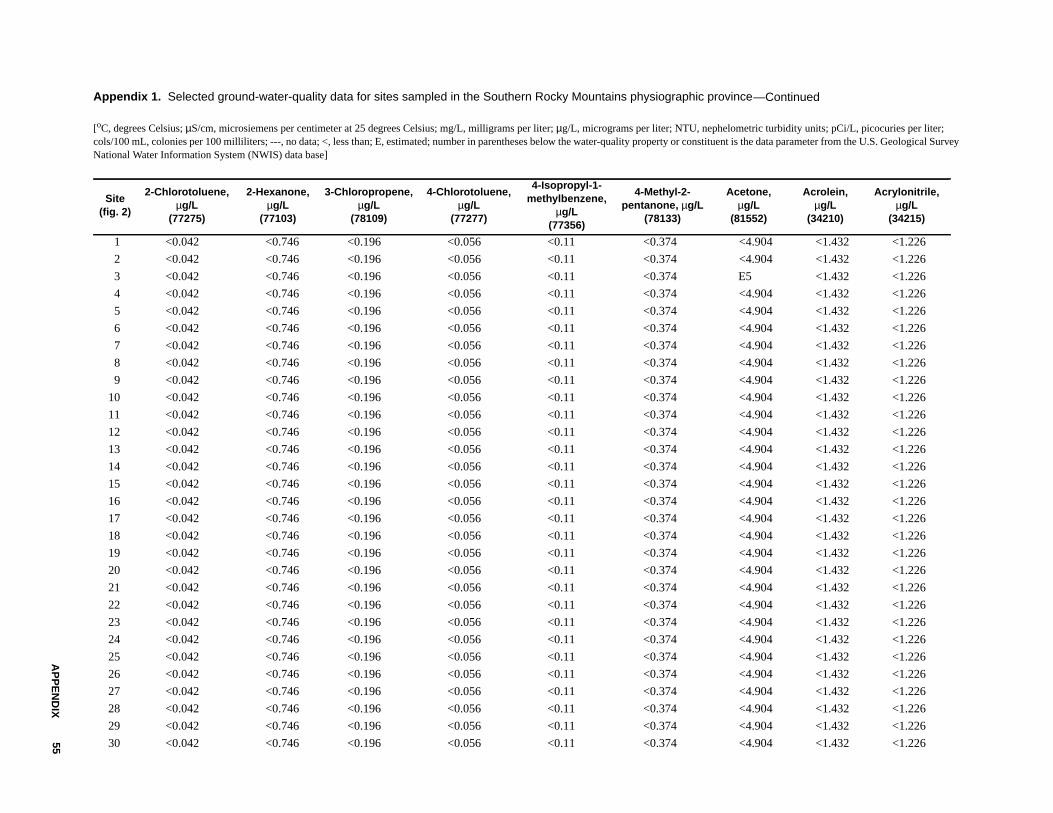
AP
PE
ND
IX55
Appendix 1. Selected ground-water-quality data for sites sampled in the Southern Rocky Mountains physiographic province
[oC, degrees Celsius; µS/cm, microsiemens per centimeter at 25 degrees Celsius; mg/L, milligrams per liter; µg/L, micrograms per liter; NTU, nephelometric turbidity units; pCi/L, picocuries per liter;cols/100 mL, colonies per 100 milliliters; ---, no data; <, less than; E, estimated; number in parentheses below the water-quality property or constituent is the data parameter from the U.S. Geological SurveyNational Water Information System (NWIS) data base]
Site(fig. 2)
2-Chlorotoluene,µg/L
(77275)
2-Hexanone,µg/L
(77103)
3-Chloropropene,µg/L
(78109)
4-Chlorotoluene,µg/L
(77277)
4-Isopropyl-1-methylbenzene,
µg/L(77356)
4-Methyl-2-pentanone, µg/L
(78133)
Acetone,µg/L
(81552)
Acrolein,µg/L
(34210)
Acrylonitrile,µg/L
(34215)
1 <0.042 <0.746 <0.196 <0.056 <0.11 <0.374 <4.904 <1.432 <1.226
2 <0.042 <0.746 <0.196 <0.056 <0.11 <0.374 <4.904 <1.432 <1.226
3 <0.042 <0.746 <0.196 <0.056 <0.11 <0.374 E5 <1.432 <1.226
4 <0.042 <0.746 <0.196 <0.056 <0.11 <0.374 <4.904 <1.432 <1.226
5 <0.042 <0.746 <0.196 <0.056 <0.11 <0.374 <4.904 <1.432 <1.226
6 <0.042 <0.746 <0.196 <0.056 <0.11 <0.374 <4.904 <1.432 <1.226
7 <0.042 <0.746 <0.196 <0.056 <0.11 <0.374 <4.904 <1.432 <1.226
8 <0.042 <0.746 <0.196 <0.056 <0.11 <0.374 <4.904 <1.432 <1.226
9 <0.042 <0.746 <0.196 <0.056 <0.11 <0.374 <4.904 <1.432 <1.226
10 <0.042 <0.746 <0.196 <0.056 <0.11 <0.374 <4.904 <1.432 <1.226
11 <0.042 <0.746 <0.196 <0.056 <0.11 <0.374 <4.904 <1.432 <1.226
12 <0.042 <0.746 <0.196 <0.056 <0.11 <0.374 <4.904 <1.432 <1.226
13 <0.042 <0.746 <0.196 <0.056 <0.11 <0.374 <4.904 <1.432 <1.226
14 <0.042 <0.746 <0.196 <0.056 <0.11 <0.374 <4.904 <1.432 <1.226
15 <0.042 <0.746 <0.196 <0.056 <0.11 <0.374 <4.904 <1.432 <1.226
16 <0.042 <0.746 <0.196 <0.056 <0.11 <0.374 <4.904 <1.432 <1.226
17 <0.042 <0.746 <0.196 <0.056 <0.11 <0.374 <4.904 <1.432 <1.226
18 <0.042 <0.746 <0.196 <0.056 <0.11 <0.374 <4.904 <1.432 <1.226
19 <0.042 <0.746 <0.196 <0.056 <0.11 <0.374 <4.904 <1.432 <1.226
20 <0.042 <0.746 <0.196 <0.056 <0.11 <0.374 <4.904 <1.432 <1.226
21 <0.042 <0.746 <0.196 <0.056 <0.11 <0.374 <4.904 <1.432 <1.226
22 <0.042 <0.746 <0.196 <0.056 <0.11 <0.374 <4.904 <1.432 <1.226
23 <0.042 <0.746 <0.196 <0.056 <0.11 <0.374 <4.904 <1.432 <1.226
24 <0.042 <0.746 <0.196 <0.056 <0.11 <0.374 <4.904 <1.432 <1.226
25 <0.042 <0.746 <0.196 <0.056 <0.11 <0.374 <4.904 <1.432 <1.226
26 <0.042 <0.746 <0.196 <0.056 <0.11 <0.374 <4.904 <1.432 <1.226
27 <0.042 <0.746 <0.196 <0.056 <0.11 <0.374 <4.904 <1.432 <1.226
28 <0.042 <0.746 <0.196 <0.056 <0.11 <0.374 <4.904 <1.432 <1.226
29 <0.042 <0.746 <0.196 <0.056 <0.11 <0.374 <4.904 <1.432 <1.226
30 <0.042 <0.746 <0.196 <0.056 <0.11 <0.374 <4.904 <1.432 <1.226
—Continued
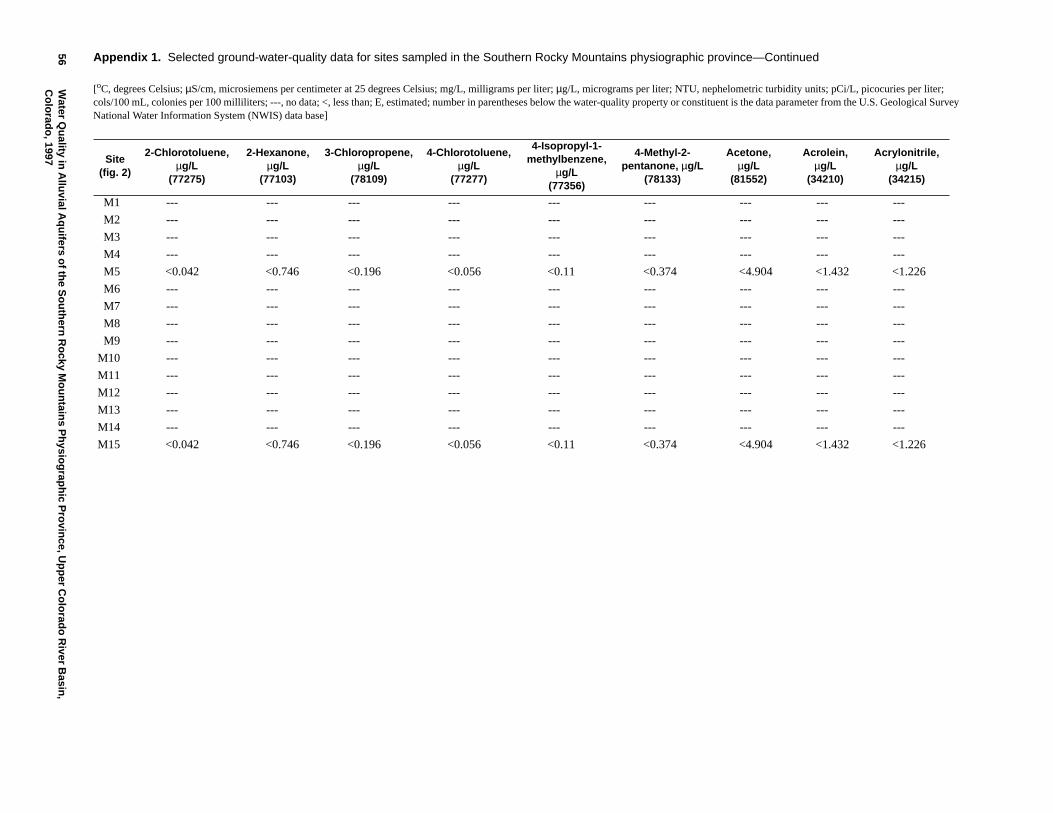
56W
aterQ
uality
inA
lluvialA
qu
iferso
fthe
So
uth
ernR
ocky
Mo
un
tains
Ph
ysiog
raph
icP
rovin
ce,Up
per
Co
lorad
oR
iverB
asin,
Co
lorad
o, 1997 Site
(fig. 2)
2-Chlorotoluene,µg/L
(77275)
2-Hexanone,µg/L
(77103)
3-Chloropropene,µg/L
(78109)
4-Chlorotoluene,µg/L
(77277)
4-Isopropyl-1-methylbenzene,
µg/L(77356)
4-Methyl-2-pentanone, µg/L
(78133)
Acetone,µg/L
(81552)
Acrolein,µg/L
(34210)
Acrylonitrile,µg/L
(34215)
M1 --- --- --- --- --- --- --- --- ---
M2 --- --- --- --- --- --- --- --- ---
M3 --- --- --- --- --- --- --- --- ---
M4 --- --- --- --- --- --- --- --- ---
M5 <0.042 <0.746 <0.196 <0.056 <0.11 <0.374 <4.904 <1.432 <1.226
M6 --- --- --- --- --- --- --- --- ---
M7 --- --- --- --- --- --- --- --- ---
M8 --- --- --- --- --- --- --- --- ---
M9 --- --- --- --- --- --- --- --- ---
M10 --- --- --- --- --- --- --- --- ---
M11 --- --- --- --- --- --- --- --- ---
M12 --- --- --- --- --- --- --- --- ---
M13 --- --- --- --- --- --- --- --- ---
M14 --- --- --- --- --- --- --- --- ---
M15 <0.042 <0.746 <0.196 <0.056 <0.11 <0.374 <4.904 <1.432 <1.226
Appendix 1. Selected ground-water-quality data for sites sampled in the Southern Rocky Mountains physiographic province—Continued
[oC, degrees Celsius; µS/cm, microsiemens per centimeter at 25 degrees Celsius; mg/L, milligrams per liter; µg/L, micrograms per liter; NTU, nephelometric turbidity units; pCi/L, picocuries per liter;cols/100 mL, colonies per 100 milliliters; ---, no data; <, less than; E, estimated; number in parentheses below the water-quality property or constituent is the data parameter from the U.S. Geological SurveyNational Water Information System (NWIS) data base]
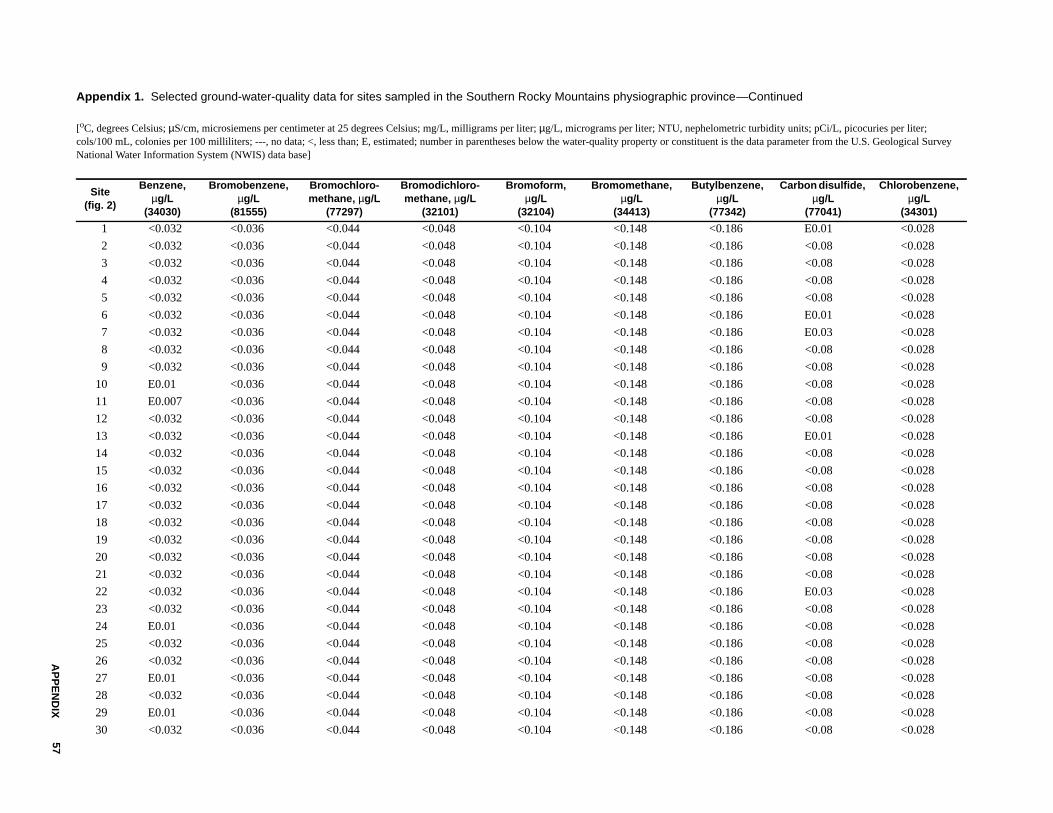
AP
PE
ND
IX57
Appendix 1. Selected ground-water-quality data for sites sampled in the Southern Rocky Mountains physiographic province
[oC, degrees Celsius; µS/cm, microsiemens per centimeter at 25 degrees Celsius; mg/L, milligrams per liter; µg/L, micrograms per liter; NTU, nephelometric turbidity units; pCi/L, picocuries per liter;cols/100 mL, colonies per 100 milliliters; ---, no data; <, less than; E, estimated; number in parentheses below the water-quality property or constituent is the data parameter from the U.S. Geological SurveyNational Water Information System (NWIS) data base]
Site(fig. 2)
Benzene,µg/L
(34030)
Bromobenzene,µg/L
(81555)
Bromochloro-methane, µg/L
(77297)
Bromodichloro-methane, µg/L
(32101)
Bromoform,µg/L
(32104)
Bromomethane,µg/L
(34413)
Butylbenzene,µg/L
(77342)
Carbon disulfide,µg/L
(77041)
Chlorobenzene,µg/L
(34301)
1 <0.032 <0.036 <0.044 <0.048 <0.104 <0.148 <0.186 E0.01 <0.028
2 <0.032 <0.036 <0.044 <0.048 <0.104 <0.148 <0.186 <0.08 <0.028
3 <0.032 <0.036 <0.044 <0.048 <0.104 <0.148 <0.186 <0.08 <0.028
4 <0.032 <0.036 <0.044 <0.048 <0.104 <0.148 <0.186 <0.08 <0.028
5 <0.032 <0.036 <0.044 <0.048 <0.104 <0.148 <0.186 <0.08 <0.028
6 <0.032 <0.036 <0.044 <0.048 <0.104 <0.148 <0.186 E0.01 <0.028
7 <0.032 <0.036 <0.044 <0.048 <0.104 <0.148 <0.186 E0.03 <0.028
8 <0.032 <0.036 <0.044 <0.048 <0.104 <0.148 <0.186 <0.08 <0.028
9 <0.032 <0.036 <0.044 <0.048 <0.104 <0.148 <0.186 <0.08 <0.028
10 E0.01 <0.036 <0.044 <0.048 <0.104 <0.148 <0.186 <0.08 <0.028
11 E0.007 <0.036 <0.044 <0.048 <0.104 <0.148 <0.186 <0.08 <0.028
12 <0.032 <0.036 <0.044 <0.048 <0.104 <0.148 <0.186 <0.08 <0.028
13 <0.032 <0.036 <0.044 <0.048 <0.104 <0.148 <0.186 E0.01 <0.028
14 <0.032 <0.036 <0.044 <0.048 <0.104 <0.148 <0.186 <0.08 <0.028
15 <0.032 <0.036 <0.044 <0.048 <0.104 <0.148 <0.186 <0.08 <0.028
16 <0.032 <0.036 <0.044 <0.048 <0.104 <0.148 <0.186 <0.08 <0.028
17 <0.032 <0.036 <0.044 <0.048 <0.104 <0.148 <0.186 <0.08 <0.028
18 <0.032 <0.036 <0.044 <0.048 <0.104 <0.148 <0.186 <0.08 <0.028
19 <0.032 <0.036 <0.044 <0.048 <0.104 <0.148 <0.186 <0.08 <0.028
20 <0.032 <0.036 <0.044 <0.048 <0.104 <0.148 <0.186 <0.08 <0.028
21 <0.032 <0.036 <0.044 <0.048 <0.104 <0.148 <0.186 <0.08 <0.028
22 <0.032 <0.036 <0.044 <0.048 <0.104 <0.148 <0.186 E0.03 <0.028
23 <0.032 <0.036 <0.044 <0.048 <0.104 <0.148 <0.186 <0.08 <0.028
24 E0.01 <0.036 <0.044 <0.048 <0.104 <0.148 <0.186 <0.08 <0.028
25 <0.032 <0.036 <0.044 <0.048 <0.104 <0.148 <0.186 <0.08 <0.028
26 <0.032 <0.036 <0.044 <0.048 <0.104 <0.148 <0.186 <0.08 <0.028
27 E0.01 <0.036 <0.044 <0.048 <0.104 <0.148 <0.186 <0.08 <0.028
28 <0.032 <0.036 <0.044 <0.048 <0.104 <0.148 <0.186 <0.08 <0.028
29 E0.01 <0.036 <0.044 <0.048 <0.104 <0.148 <0.186 <0.08 <0.028
30 <0.032 <0.036 <0.044 <0.048 <0.104 <0.148 <0.186 <0.08 <0.028
—Continued
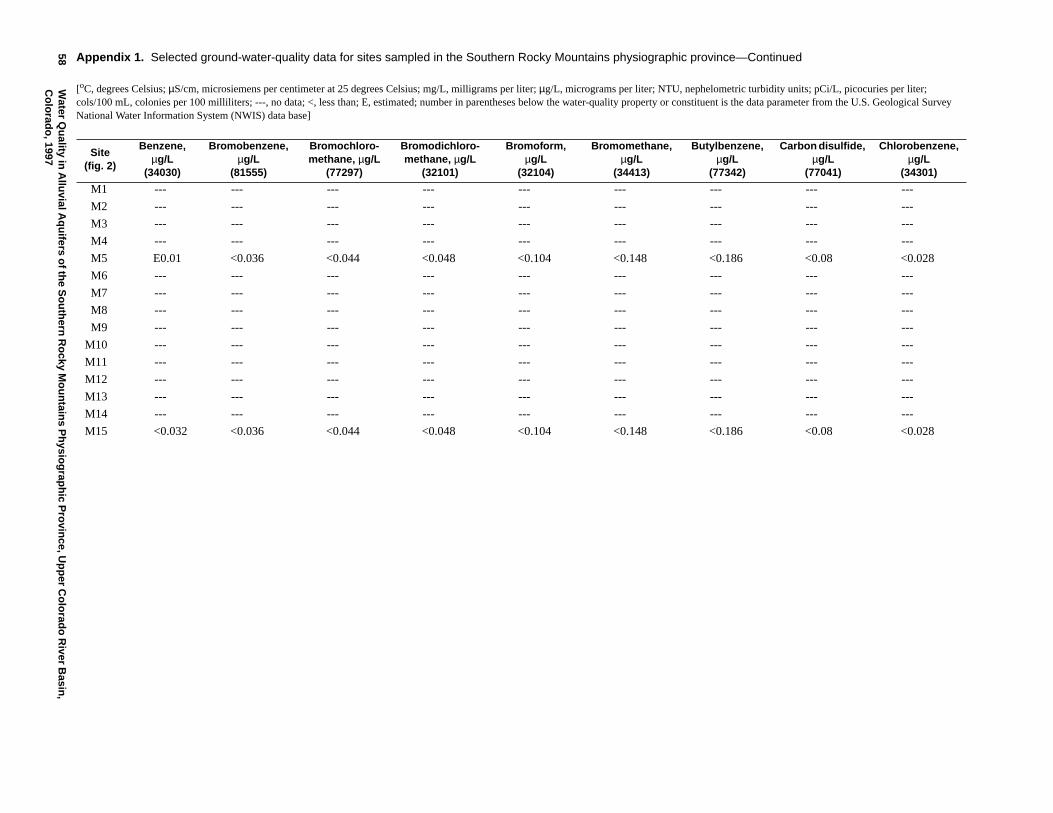
58W
aterQ
uality
inA
lluvialA
qu
iferso
fthe
So
uth
ernR
ocky
Mo
un
tains
Ph
ysiog
raph
icP
rovin
ce,Up
per
Co
lorad
oR
iverB
asin,
Co
lorad
o, 1997 Site
(fig. 2)
Benzene,µg/L
(34030)
Bromobenzene,µg/L
(81555)
Bromochloro-methane, µg/L
(77297)
Bromodichloro-methane, µg/L
(32101)
Bromoform,µg/L
(32104)
Bromomethane,µg/L
(34413)
Butylbenzene,µg/L
(77342)
Carbon disulfide,µg/L
(77041)
Chlorobenzene,µg/L
(34301)
M1 --- --- --- --- --- --- --- --- ---
M2 --- --- --- --- --- --- --- --- ---
M3 --- --- --- --- --- --- --- --- ---
M4 --- --- --- --- --- --- --- --- ---
M5 E0.01 <0.036 <0.044 <0.048 <0.104 <0.148 <0.186 <0.08 <0.028
M6 --- --- --- --- --- --- --- --- ---
M7 --- --- --- --- --- --- --- --- ---
M8 --- --- --- --- --- --- --- --- ---
M9 --- --- --- --- --- --- --- --- ---
M10 --- --- --- --- --- --- --- --- ---
M11 --- --- --- --- --- --- --- --- ---
M12 --- --- --- --- --- --- --- --- ---
M13 --- --- --- --- --- --- --- --- ---
M14 --- --- --- --- --- --- --- --- ---
M15 <0.032 <0.036 <0.044 <0.048 <0.104 <0.148 <0.186 <0.08 <0.028
Appendix 1. Selected ground-water-quality data for sites sampled in the Southern Rocky Mountains physiographic province—Continued
[oC, degrees Celsius; µS/cm, microsiemens per centimeter at 25 degrees Celsius; mg/L, milligrams per liter; µg/L, micrograms per liter; NTU, nephelometric turbidity units; pCi/L, picocuries per liter;cols/100 mL, colonies per 100 milliliters; ---, no data; <, less than; E, estimated; number in parentheses below the water-quality property or constituent is the data parameter from the U.S. Geological SurveyNational Water Information System (NWIS) data base]
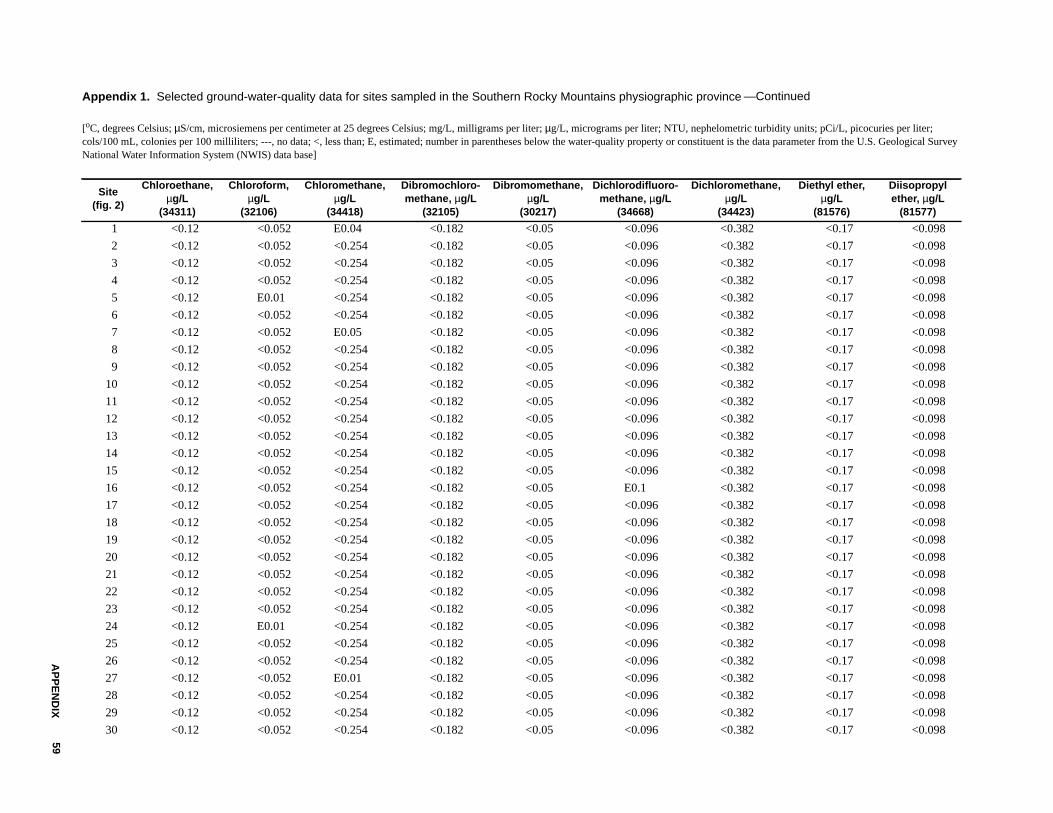
AP
PE
ND
IX59
Appendix 1. Selected ground-water-quality data for sites sampled in the Southern Rocky Mountains physiographic province
[oC, degrees Celsius; µS/cm, microsiemens per centimeter at 25 degrees Celsius; mg/L, milligrams per liter; µg/L, micrograms per liter; NTU, nephelometric turbidity units; pCi/L, picocuries per liter;cols/100 mL, colonies per 100 milliliters; ---, no data; <, less than; E, estimated; number in parentheses below the water-quality property or constituent is the data parameter from the U.S. Geological SurveyNational Water Information System (NWIS) data base]
Site(fig. 2)
Chloroethane,µg/L
(34311)
Chloroform,µg/L
(32106)
Chloromethane,µg/L
(34418)
Dibromochloro-methane, µg/L
(32105)
Dibromomethane,µg/L
(30217)
Dichlorodifluoro-methane, µg/L
(34668)
Dichloromethane,µg/L
(34423)
Diethyl ether,µg/L
(81576)
Diisopropylether, µg/L
(81577)
1 <0.12 <0.052 E0.04 <0.182 <0.05 <0.096 <0.382 <0.17 <0.098
2 <0.12 <0.052 <0.254 <0.182 <0.05 <0.096 <0.382 <0.17 <0.098
3 <0.12 <0.052 <0.254 <0.182 <0.05 <0.096 <0.382 <0.17 <0.098
4 <0.12 <0.052 <0.254 <0.182 <0.05 <0.096 <0.382 <0.17 <0.098
5 <0.12 E0.01 <0.254 <0.182 <0.05 <0.096 <0.382 <0.17 <0.098
6 <0.12 <0.052 <0.254 <0.182 <0.05 <0.096 <0.382 <0.17 <0.098
7 <0.12 <0.052 E0.05 <0.182 <0.05 <0.096 <0.382 <0.17 <0.098
8 <0.12 <0.052 <0.254 <0.182 <0.05 <0.096 <0.382 <0.17 <0.098
9 <0.12 <0.052 <0.254 <0.182 <0.05 <0.096 <0.382 <0.17 <0.098
10 <0.12 <0.052 <0.254 <0.182 <0.05 <0.096 <0.382 <0.17 <0.098
11 <0.12 <0.052 <0.254 <0.182 <0.05 <0.096 <0.382 <0.17 <0.098
12 <0.12 <0.052 <0.254 <0.182 <0.05 <0.096 <0.382 <0.17 <0.098
13 <0.12 <0.052 <0.254 <0.182 <0.05 <0.096 <0.382 <0.17 <0.098
14 <0.12 <0.052 <0.254 <0.182 <0.05 <0.096 <0.382 <0.17 <0.098
15 <0.12 <0.052 <0.254 <0.182 <0.05 <0.096 <0.382 <0.17 <0.098
16 <0.12 <0.052 <0.254 <0.182 <0.05 E0.1 <0.382 <0.17 <0.098
17 <0.12 <0.052 <0.254 <0.182 <0.05 <0.096 <0.382 <0.17 <0.098
18 <0.12 <0.052 <0.254 <0.182 <0.05 <0.096 <0.382 <0.17 <0.098
19 <0.12 <0.052 <0.254 <0.182 <0.05 <0.096 <0.382 <0.17 <0.098
20 <0.12 <0.052 <0.254 <0.182 <0.05 <0.096 <0.382 <0.17 <0.098
21 <0.12 <0.052 <0.254 <0.182 <0.05 <0.096 <0.382 <0.17 <0.098
22 <0.12 <0.052 <0.254 <0.182 <0.05 <0.096 <0.382 <0.17 <0.098
23 <0.12 <0.052 <0.254 <0.182 <0.05 <0.096 <0.382 <0.17 <0.098
24 <0.12 E0.01 <0.254 <0.182 <0.05 <0.096 <0.382 <0.17 <0.098
25 <0.12 <0.052 <0.254 <0.182 <0.05 <0.096 <0.382 <0.17 <0.098
26 <0.12 <0.052 <0.254 <0.182 <0.05 <0.096 <0.382 <0.17 <0.098
27 <0.12 <0.052 E0.01 <0.182 <0.05 <0.096 <0.382 <0.17 <0.098
28 <0.12 <0.052 <0.254 <0.182 <0.05 <0.096 <0.382 <0.17 <0.098
29 <0.12 <0.052 <0.254 <0.182 <0.05 <0.096 <0.382 <0.17 <0.098
30 <0.12 <0.052 <0.254 <0.182 <0.05 <0.096 <0.382 <0.17 <0.098
—Continued
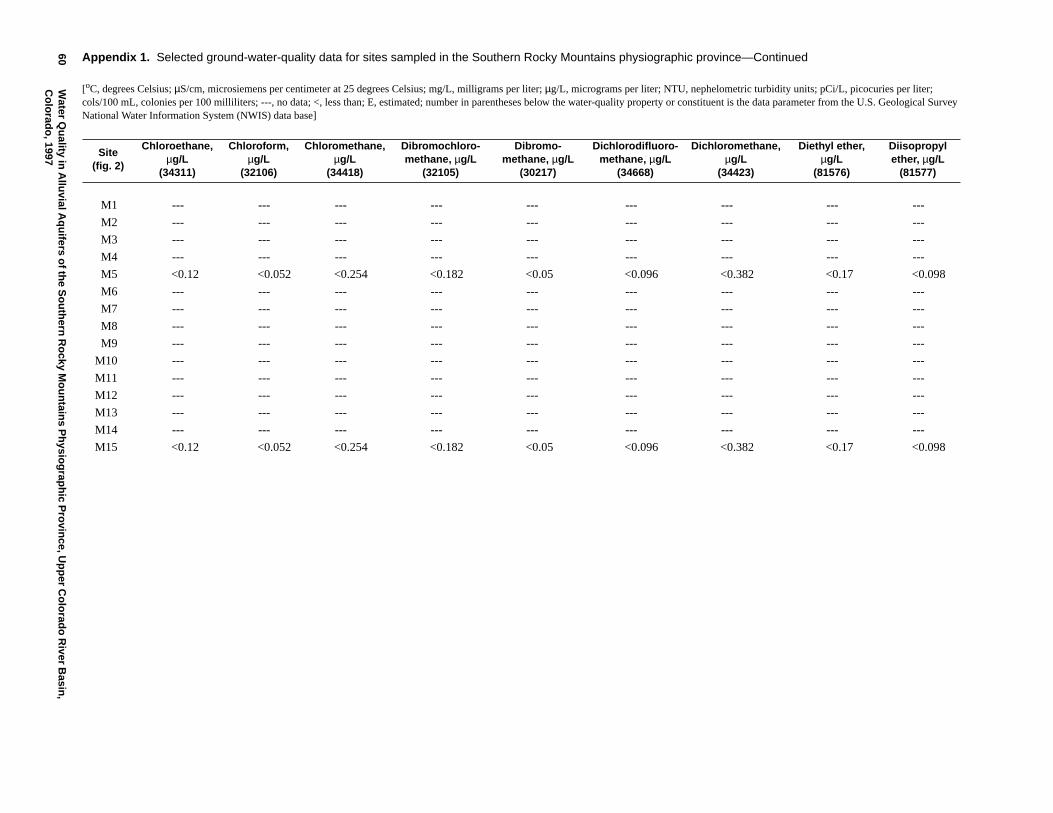
60W
aterQ
uality
inA
lluvialA
qu
iferso
fthe
So
uth
ernR
ocky
Mo
un
tains
Ph
ysiog
raph
icP
rovin
ce,Up
per
Co
lorad
oR
iverB
asin,
Co
lorad
o, 1997 Site
(fig. 2)
Chloroethane,µg/L
(34311)
Chloroform,µg/L
(32106)
Chloromethane,µg/L
(34418)
Dibromochloro-methane, µg/L
(32105)
Dibromo-methane, µg/L
(30217)
Dichlorodifluoro-methane, µg/L
(34668)
Dichloromethane,µg/L
(34423)
Diethyl ether,µg/L
(81576)
Diisopropylether, µg/L
(81577)
M1 --- --- --- --- --- --- --- --- ---
M2 --- --- --- --- --- --- --- --- ---
M3 --- --- --- --- --- --- --- --- ---
M4 --- --- --- --- --- --- --- --- ---
M5 <0.12 <0.052 <0.254 <0.182 <0.05 <0.096 <0.382 <0.17 <0.098
M6 --- --- --- --- --- --- --- --- ---
M7 --- --- --- --- --- --- --- --- ---
M8 --- --- --- --- --- --- --- --- ---
M9 --- --- --- --- --- --- --- --- ---
M10 --- --- --- --- --- --- --- --- ---
M11 --- --- --- --- --- --- --- --- ---
M12 --- --- --- --- --- --- --- --- ---
M13 --- --- --- --- --- --- --- --- ---
M14 --- --- --- --- --- --- --- --- ---
M15 <0.12 <0.052 <0.254 <0.182 <0.05 <0.096 <0.382 <0.17 <0.098
Appendix 1. Selected ground-water-quality data for sites sampled in the Southern Rocky Mountains physiographic province—Continued
[oC, degrees Celsius; µS/cm, microsiemens per centimeter at 25 degrees Celsius; mg/L, milligrams per liter; µg/L, micrograms per liter; NTU, nephelometric turbidity units; pCi/L, picocuries per liter;cols/100 mL, colonies per 100 milliliters; ---, no data; <, less than; E, estimated; number in parentheses below the water-quality property or constituent is the data parameter from the U.S. Geological SurveyNational Water Information System (NWIS) data base]
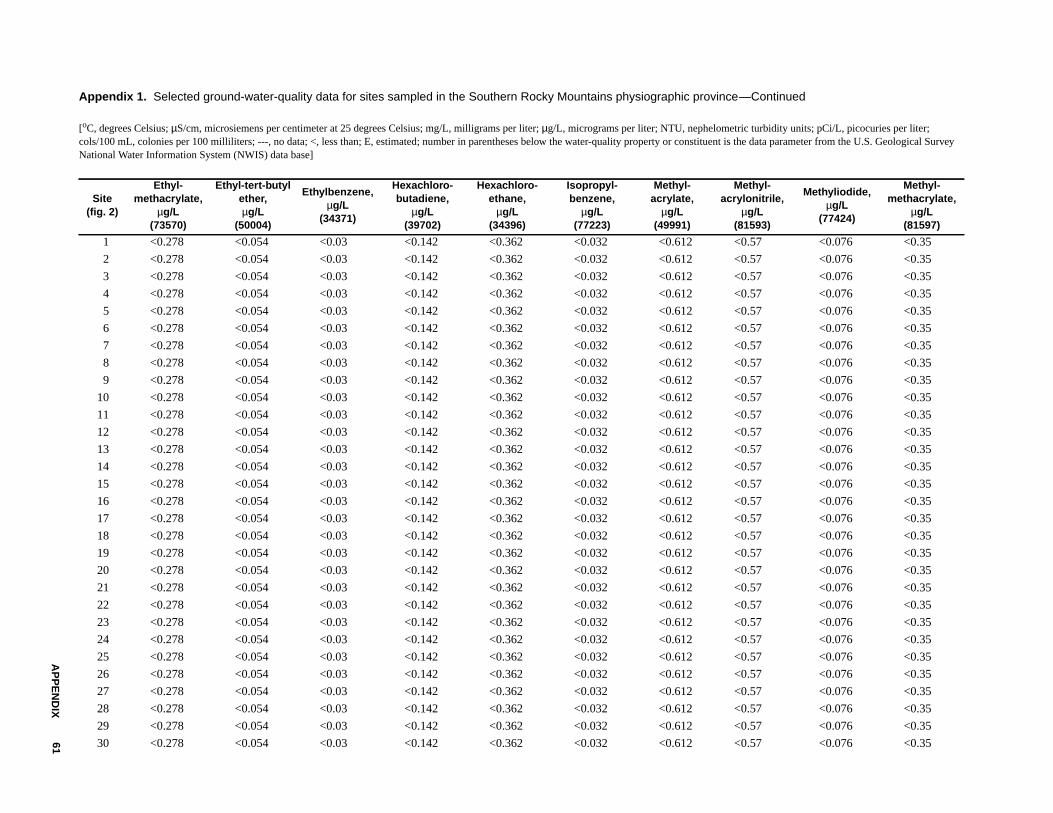
AP
PE
ND
IX61
Appendix 1. Selected ground-water-quality data for sites sampled in the Southern Rocky Mountains physiographic province
[oC, degrees Celsius; µS/cm, microsiemens per centimeter at 25 degrees Celsius; mg/L, milligrams per liter; µg/L, micrograms per liter; NTU, nephelometric turbidity units; pCi/L, picocuries per liter;cols/100 mL, colonies per 100 milliliters; ---, no data; <, less than; E, estimated; number in parentheses below the water-quality property or constituent is the data parameter from the U.S. Geological SurveyNational Water Information System (NWIS) data base]
Site(fig. 2)
Ethyl-methacrylate,
µg/L(73570)
Ethyl-tert-butylether,µg/L
(50004)
Ethylbenzene,µg/L
(34371)
Hexachloro-butadiene,
µg/L(39702)
Hexachloro-ethane,
µg/L(34396)
Isopropyl-benzene,
µg/L(77223)
Methyl-acrylate,
µg/L(49991)
Methyl-acrylonitrile,
µg/L(81593)
Methyliodide,µg/L
(77424)
Methyl-methacrylate,
µg/L(81597)
1 <0.278 <0.054 <0.03 <0.142 <0.362 <0.032 <0.612 <0.57 <0.076 <0.35
2 <0.278 <0.054 <0.03 <0.142 <0.362 <0.032 <0.612 <0.57 <0.076 <0.35
3 <0.278 <0.054 <0.03 <0.142 <0.362 <0.032 <0.612 <0.57 <0.076 <0.35
4 <0.278 <0.054 <0.03 <0.142 <0.362 <0.032 <0.612 <0.57 <0.076 <0.35
5 <0.278 <0.054 <0.03 <0.142 <0.362 <0.032 <0.612 <0.57 <0.076 <0.35
6 <0.278 <0.054 <0.03 <0.142 <0.362 <0.032 <0.612 <0.57 <0.076 <0.35
7 <0.278 <0.054 <0.03 <0.142 <0.362 <0.032 <0.612 <0.57 <0.076 <0.35
8 <0.278 <0.054 <0.03 <0.142 <0.362 <0.032 <0.612 <0.57 <0.076 <0.35
9 <0.278 <0.054 <0.03 <0.142 <0.362 <0.032 <0.612 <0.57 <0.076 <0.35
10 <0.278 <0.054 <0.03 <0.142 <0.362 <0.032 <0.612 <0.57 <0.076 <0.35
11 <0.278 <0.054 <0.03 <0.142 <0.362 <0.032 <0.612 <0.57 <0.076 <0.35
12 <0.278 <0.054 <0.03 <0.142 <0.362 <0.032 <0.612 <0.57 <0.076 <0.35
13 <0.278 <0.054 <0.03 <0.142 <0.362 <0.032 <0.612 <0.57 <0.076 <0.35
14 <0.278 <0.054 <0.03 <0.142 <0.362 <0.032 <0.612 <0.57 <0.076 <0.35
15 <0.278 <0.054 <0.03 <0.142 <0.362 <0.032 <0.612 <0.57 <0.076 <0.35
16 <0.278 <0.054 <0.03 <0.142 <0.362 <0.032 <0.612 <0.57 <0.076 <0.35
17 <0.278 <0.054 <0.03 <0.142 <0.362 <0.032 <0.612 <0.57 <0.076 <0.35
18 <0.278 <0.054 <0.03 <0.142 <0.362 <0.032 <0.612 <0.57 <0.076 <0.35
19 <0.278 <0.054 <0.03 <0.142 <0.362 <0.032 <0.612 <0.57 <0.076 <0.35
20 <0.278 <0.054 <0.03 <0.142 <0.362 <0.032 <0.612 <0.57 <0.076 <0.35
21 <0.278 <0.054 <0.03 <0.142 <0.362 <0.032 <0.612 <0.57 <0.076 <0.35
22 <0.278 <0.054 <0.03 <0.142 <0.362 <0.032 <0.612 <0.57 <0.076 <0.35
23 <0.278 <0.054 <0.03 <0.142 <0.362 <0.032 <0.612 <0.57 <0.076 <0.35
24 <0.278 <0.054 <0.03 <0.142 <0.362 <0.032 <0.612 <0.57 <0.076 <0.35
25 <0.278 <0.054 <0.03 <0.142 <0.362 <0.032 <0.612 <0.57 <0.076 <0.35
26 <0.278 <0.054 <0.03 <0.142 <0.362 <0.032 <0.612 <0.57 <0.076 <0.35
27 <0.278 <0.054 <0.03 <0.142 <0.362 <0.032 <0.612 <0.57 <0.076 <0.35
28 <0.278 <0.054 <0.03 <0.142 <0.362 <0.032 <0.612 <0.57 <0.076 <0.35
29 <0.278 <0.054 <0.03 <0.142 <0.362 <0.032 <0.612 <0.57 <0.076 <0.35
30 <0.278 <0.054 <0.03 <0.142 <0.362 <0.032 <0.612 <0.57 <0.076 <0.35
—Continued
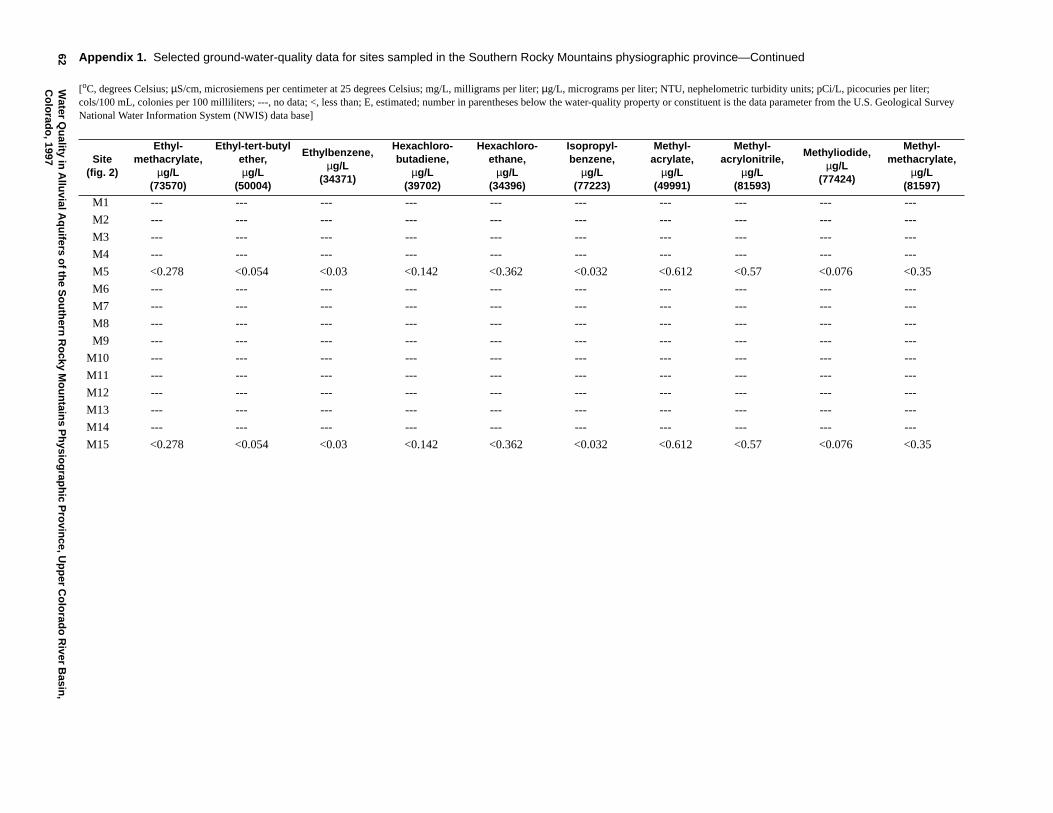
62W
aterQ
uality
inA
lluvialA
qu
iferso
fthe
So
uth
ernR
ocky
Mo
un
tains
Ph
ysiog
raph
icP
rovin
ce,Up
per
Co
lorad
oR
iverB
asin,
Co
lorad
o, 1997 Site
(fig. 2)
Ethyl-methacrylate,
µg/L(73570)
Ethyl-tert-butylether,µg/L
(50004)
Ethylbenzene,µg/L
(34371)
Hexachloro-butadiene,
µg/L(39702)
Hexachloro-ethane,
µg/L(34396)
Isopropyl-benzene,
µg/L(77223)
Methyl-acrylate,
µg/L(49991)
Methyl-acrylonitrile,
µg/L(81593)
Methyliodide,µg/L
(77424)
Methyl-methacrylate,
µg/L(81597)
M1 --- --- --- --- --- --- --- --- --- ---
M2 --- --- --- --- --- --- --- --- --- ---
M3 --- --- --- --- --- --- --- --- --- ---
M4 --- --- --- --- --- --- --- --- --- ---
M5 <0.278 <0.054 <0.03 <0.142 <0.362 <0.032 <0.612 <0.57 <0.076 <0.35
M6 --- --- --- --- --- --- --- --- --- ---
M7 --- --- --- --- --- --- --- --- --- ---
M8 --- --- --- --- --- --- --- --- --- ---
M9 --- --- --- --- --- --- --- --- --- ---
M10 --- --- --- --- --- --- --- --- --- ---
M11 --- --- --- --- --- --- --- --- --- ---
M12 --- --- --- --- --- --- --- --- --- ---
M13 --- --- --- --- --- --- --- --- --- ---
M14 --- --- --- --- --- --- --- --- --- ---
M15 <0.278 <0.054 <0.03 <0.142 <0.362 <0.032 <0.612 <0.57 <0.076 <0.35
Appendix 1. Selected ground-water-quality data for sites sampled in the Southern Rocky Mountains physiographic province—Continued
[oC, degrees Celsius; µS/cm, microsiemens per centimeter at 25 degrees Celsius; mg/L, milligrams per liter; µg/L, micrograms per liter; NTU, nephelometric turbidity units; pCi/L, picocuries per liter;cols/100 mL, colonies per 100 milliliters; ---, no data; <, less than; E, estimated; number in parentheses below the water-quality property or constituent is the data parameter from the U.S. Geological SurveyNational Water Information System (NWIS) data base]
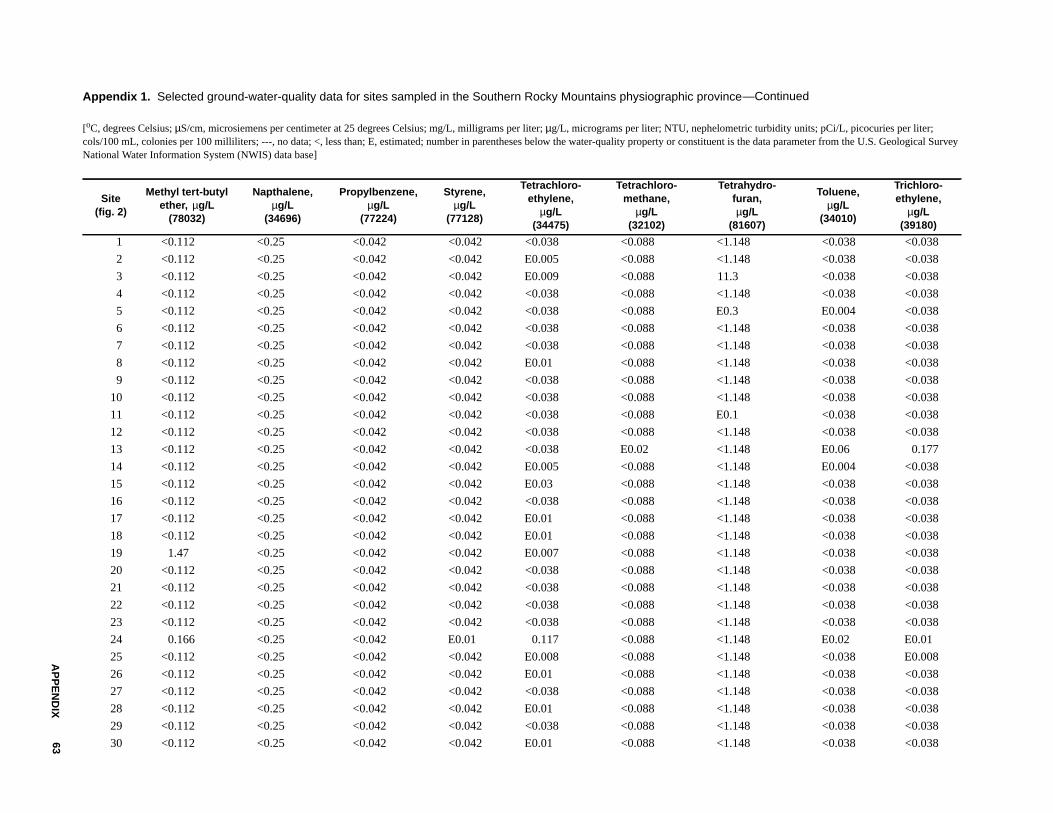
AP
PE
ND
IX63
Appendix 1. Selected ground-water-quality data for sites sampled in the Southern Rocky Mountains physiographic province
[oC, degrees Celsius; µS/cm, microsiemens per centimeter at 25 degrees Celsius; mg/L, milligrams per liter; µg/L, micrograms per liter; NTU, nephelometric turbidity units; pCi/L, picocuries per liter;cols/100 mL, colonies per 100 milliliters; ---, no data; <, less than; E, estimated; number in parentheses below the water-quality property or constituent is the data parameter from the U.S. Geological SurveyNational Water Information System (NWIS) data base]
Site(fig. 2)
Methyl tert-butylether, µg/L
(78032)
Napthalene,µg/L
(34696)
Propylbenzene,µg/L
(77224)
Styrene,µg/L
(77128)
Tetrachloro-ethylene,
µg/L(34475)
Tetrachloro-methane,
µg/L(32102)
Tetrahydro-furan,µg/L
(81607)
Toluene,µg/L
(34010)
Trichloro-ethylene,
µg/L(39180)
1 <0.112 <0.25 <0.042 <0.042 <0.038 <0.088 <1.148 <0.038 <0.038
2 <0.112 <0.25 <0.042 <0.042 E0.005 <0.088 <1.148 <0.038 <0.038
3 <0.112 <0.25 <0.042 <0.042 E0.009 <0.088 11.3 <0.038 <0.038
4 <0.112 <0.25 <0.042 <0.042 <0.038 <0.088 <1.148 <0.038 <0.038
5 <0.112 <0.25 <0.042 <0.042 <0.038 <0.088 E0.3 E0.004 <0.038
6 <0.112 <0.25 <0.042 <0.042 <0.038 <0.088 <1.148 <0.038 <0.038
7 <0.112 <0.25 <0.042 <0.042 <0.038 <0.088 <1.148 <0.038 <0.038
8 <0.112 <0.25 <0.042 <0.042 E0.01 <0.088 <1.148 <0.038 <0.038
9 <0.112 <0.25 <0.042 <0.042 <0.038 <0.088 <1.148 <0.038 <0.038
10 <0.112 <0.25 <0.042 <0.042 <0.038 <0.088 <1.148 <0.038 <0.038
11 <0.112 <0.25 <0.042 <0.042 <0.038 <0.088 E0.1 <0.038 <0.038
12 <0.112 <0.25 <0.042 <0.042 <0.038 <0.088 <1.148 <0.038 <0.038
13 <0.112 <0.25 <0.042 <0.042 <0.038 E0.02 <1.148 E0.06 0.177
14 <0.112 <0.25 <0.042 <0.042 E0.005 <0.088 <1.148 E0.004 <0.038
15 <0.112 <0.25 <0.042 <0.042 E0.03 <0.088 <1.148 <0.038 <0.038
16 <0.112 <0.25 <0.042 <0.042 <0.038 <0.088 <1.148 <0.038 <0.038
17 <0.112 <0.25 <0.042 <0.042 E0.01 <0.088 <1.148 <0.038 <0.038
18 <0.112 <0.25 <0.042 <0.042 E0.01 <0.088 <1.148 <0.038 <0.038
19 1.47 <0.25 <0.042 <0.042 E0.007 <0.088 <1.148 <0.038 <0.038
20 <0.112 <0.25 <0.042 <0.042 <0.038 <0.088 <1.148 <0.038 <0.038
21 <0.112 <0.25 <0.042 <0.042 <0.038 <0.088 <1.148 <0.038 <0.038
22 <0.112 <0.25 <0.042 <0.042 <0.038 <0.088 <1.148 <0.038 <0.038
23 <0.112 <0.25 <0.042 <0.042 <0.038 <0.088 <1.148 <0.038 <0.038
24 0.166 <0.25 <0.042 E0.01 0.117 <0.088 <1.148 E0.02 E0.01
25 <0.112 <0.25 <0.042 <0.042 E0.008 <0.088 <1.148 <0.038 E0.008
26 <0.112 <0.25 <0.042 <0.042 E0.01 <0.088 <1.148 <0.038 <0.038
27 <0.112 <0.25 <0.042 <0.042 <0.038 <0.088 <1.148 <0.038 <0.038
28 <0.112 <0.25 <0.042 <0.042 E0.01 <0.088 <1.148 <0.038 <0.038
29 <0.112 <0.25 <0.042 <0.042 <0.038 <0.088 <1.148 <0.038 <0.038
30 <0.112 <0.25 <0.042 <0.042 E0.01 <0.088 <1.148 <0.038 <0.038
—Continued
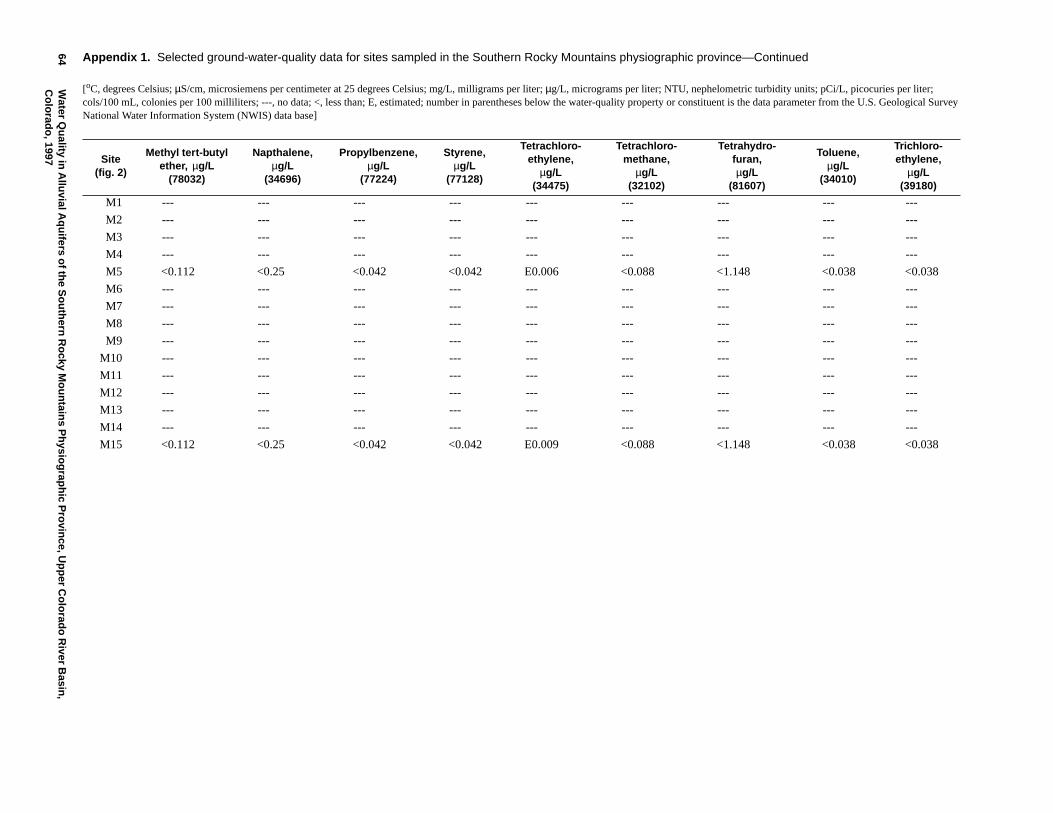
64W
aterQ
uality
inA
lluvialA
qu
iferso
fthe
So
uth
ernR
ocky
Mo
un
tains
Ph
ysiog
raph
icP
rovin
ce,Up
per
Co
lorad
oR
iverB
asin,
Co
lorad
o, 1997 Site
(fig. 2)
Methyl tert-butylether, µg/L
(78032)
Napthalene,µg/L
(34696)
Propylbenzene,µg/L
(77224)
Styrene,µg/L
(77128)
Tetrachloro-ethylene,
µg/L(34475)
Tetrachloro-methane,
µg/L(32102)
Tetrahydro-furan,µg/L
(81607)
Toluene,µg/L
(34010)
Trichloro-ethylene,
µg/L(39180)
M1 --- --- --- --- --- --- --- --- ---
M2 --- --- --- --- --- --- --- --- ---
M3 --- --- --- --- --- --- --- --- ---
M4 --- --- --- --- --- --- --- --- ---
M5 <0.112 <0.25 <0.042 <0.042 E0.006 <0.088 <1.148 <0.038 <0.038
M6 --- --- --- --- --- --- --- --- ---
M7 --- --- --- --- --- --- --- --- ---
M8 --- --- --- --- --- --- --- --- ---
M9 --- --- --- --- --- --- --- --- ---
M10 --- --- --- --- --- --- --- --- ---
M11 --- --- --- --- --- --- --- --- ---
M12 --- --- --- --- --- --- --- --- ---
M13 --- --- --- --- --- --- --- --- ---
M14 --- --- --- --- --- --- --- --- ---
M15 <0.112 <0.25 <0.042 <0.042 E0.009 <0.088 <1.148 <0.038 <0.038
Appendix 1. Selected ground-water-quality data for sites sampled in the Southern Rocky Mountains physiographic province—Continued
[oC, degrees Celsius; µS/cm, microsiemens per centimeter at 25 degrees Celsius; mg/L, milligrams per liter; µg/L, micrograms per liter; NTU, nephelometric turbidity units; pCi/L, picocuries per liter;cols/100 mL, colonies per 100 milliliters; ---, no data; <, less than; E, estimated; number in parentheses below the water-quality property or constituent is the data parameter from the U.S. Geological SurveyNational Water Information System (NWIS) data base]
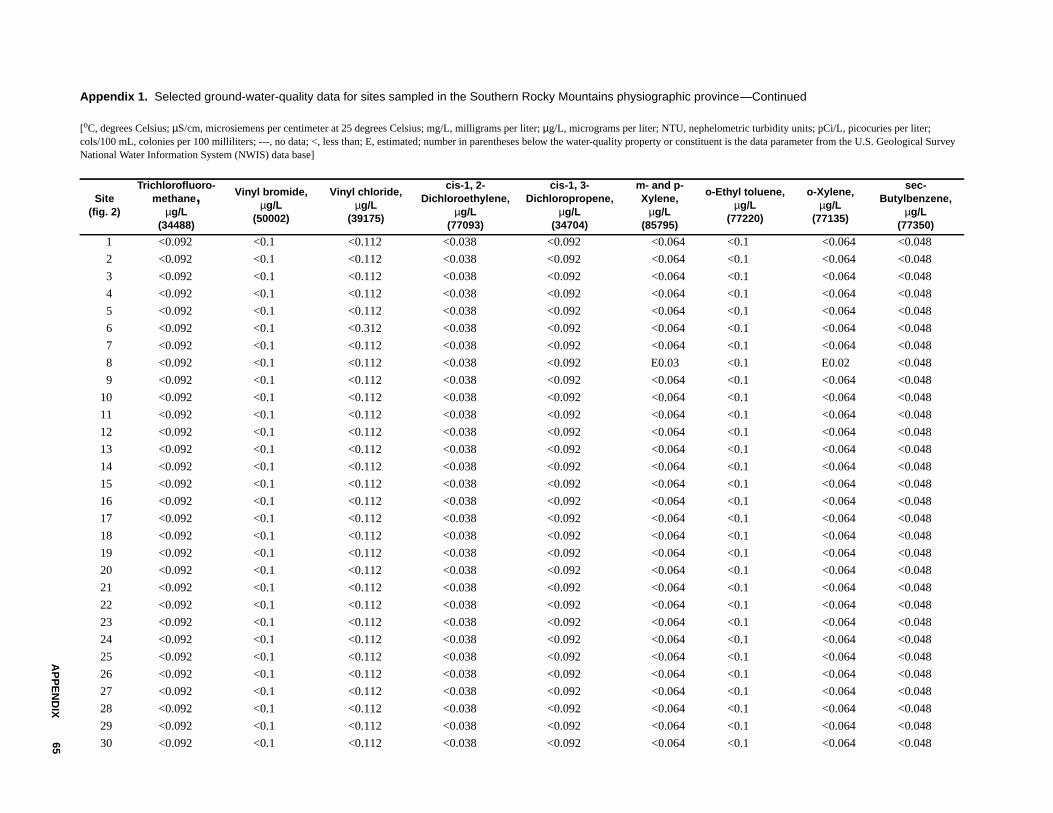
AP
PE
ND
IX65
Appendix 1. Selected ground-water-quality data for sites sampled in the Southern Rocky Mountains physiographic province
[oC, degrees Celsius; µS/cm, microsiemens per centimeter at 25 degrees Celsius; mg/L, milligrams per liter; µg/L, micrograms per liter; NTU, nephelometric turbidity units; pCi/L, picocuries per liter;cols/100 mL, colonies per 100 milliliters; ---, no data; <, less than; E, estimated; number in parentheses below the water-quality property or constituent is the data parameter from the U.S. Geological SurveyNational Water Information System (NWIS) data base]
Site(fig. 2)
Trichlorofluoro-methane,
µg/L(34488)
Vinyl bromide,µg/L
(50002)
Vinyl chloride,µg/L
(39175)
cis-1, 2-Dichloroethylene,
µg/L(77093)
cis-1, 3-Dichloropropene,
µg/L(34704)
m- and p-Xylene,
µg/L(85795)
o-Ethyl toluene,µg/L
(77220)
o-Xylene,µg/L
(77135)
sec-Butylbenzene,
µg/L(77350)
1 <0.092 <0.1 <0.112 <0.038 <0.092 <0.064 <0.1 <0.064 <0.048
2 <0.092 <0.1 <0.112 <0.038 <0.092 <0.064 <0.1 <0.064 <0.048
3 <0.092 <0.1 <0.112 <0.038 <0.092 <0.064 <0.1 <0.064 <0.048
4 <0.092 <0.1 <0.112 <0.038 <0.092 <0.064 <0.1 <0.064 <0.048
5 <0.092 <0.1 <0.112 <0.038 <0.092 <0.064 <0.1 <0.064 <0.048
6 <0.092 <0.1 <0.312 <0.038 <0.092 <0.064 <0.1 <0.064 <0.048
7 <0.092 <0.1 <0.112 <0.038 <0.092 <0.064 <0.1 <0.064 <0.048
8 <0.092 <0.1 <0.112 <0.038 <0.092 E0.03 <0.1 E0.02 <0.048
9 <0.092 <0.1 <0.112 <0.038 <0.092 <0.064 <0.1 <0.064 <0.048
10 <0.092 <0.1 <0.112 <0.038 <0.092 <0.064 <0.1 <0.064 <0.048
11 <0.092 <0.1 <0.112 <0.038 <0.092 <0.064 <0.1 <0.064 <0.048
12 <0.092 <0.1 <0.112 <0.038 <0.092 <0.064 <0.1 <0.064 <0.048
13 <0.092 <0.1 <0.112 <0.038 <0.092 <0.064 <0.1 <0.064 <0.048
14 <0.092 <0.1 <0.112 <0.038 <0.092 <0.064 <0.1 <0.064 <0.048
15 <0.092 <0.1 <0.112 <0.038 <0.092 <0.064 <0.1 <0.064 <0.048
16 <0.092 <0.1 <0.112 <0.038 <0.092 <0.064 <0.1 <0.064 <0.048
17 <0.092 <0.1 <0.112 <0.038 <0.092 <0.064 <0.1 <0.064 <0.048
18 <0.092 <0.1 <0.112 <0.038 <0.092 <0.064 <0.1 <0.064 <0.048
19 <0.092 <0.1 <0.112 <0.038 <0.092 <0.064 <0.1 <0.064 <0.048
20 <0.092 <0.1 <0.112 <0.038 <0.092 <0.064 <0.1 <0.064 <0.048
21 <0.092 <0.1 <0.112 <0.038 <0.092 <0.064 <0.1 <0.064 <0.048
22 <0.092 <0.1 <0.112 <0.038 <0.092 <0.064 <0.1 <0.064 <0.048
23 <0.092 <0.1 <0.112 <0.038 <0.092 <0.064 <0.1 <0.064 <0.048
24 <0.092 <0.1 <0.112 <0.038 <0.092 <0.064 <0.1 <0.064 <0.048
25 <0.092 <0.1 <0.112 <0.038 <0.092 <0.064 <0.1 <0.064 <0.048
26 <0.092 <0.1 <0.112 <0.038 <0.092 <0.064 <0.1 <0.064 <0.048
27 <0.092 <0.1 <0.112 <0.038 <0.092 <0.064 <0.1 <0.064 <0.048
28 <0.092 <0.1 <0.112 <0.038 <0.092 <0.064 <0.1 <0.064 <0.048
29 <0.092 <0.1 <0.112 <0.038 <0.092 <0.064 <0.1 <0.064 <0.048
30 <0.092 <0.1 <0.112 <0.038 <0.092 <0.064 <0.1 <0.064 <0.048
—Continued
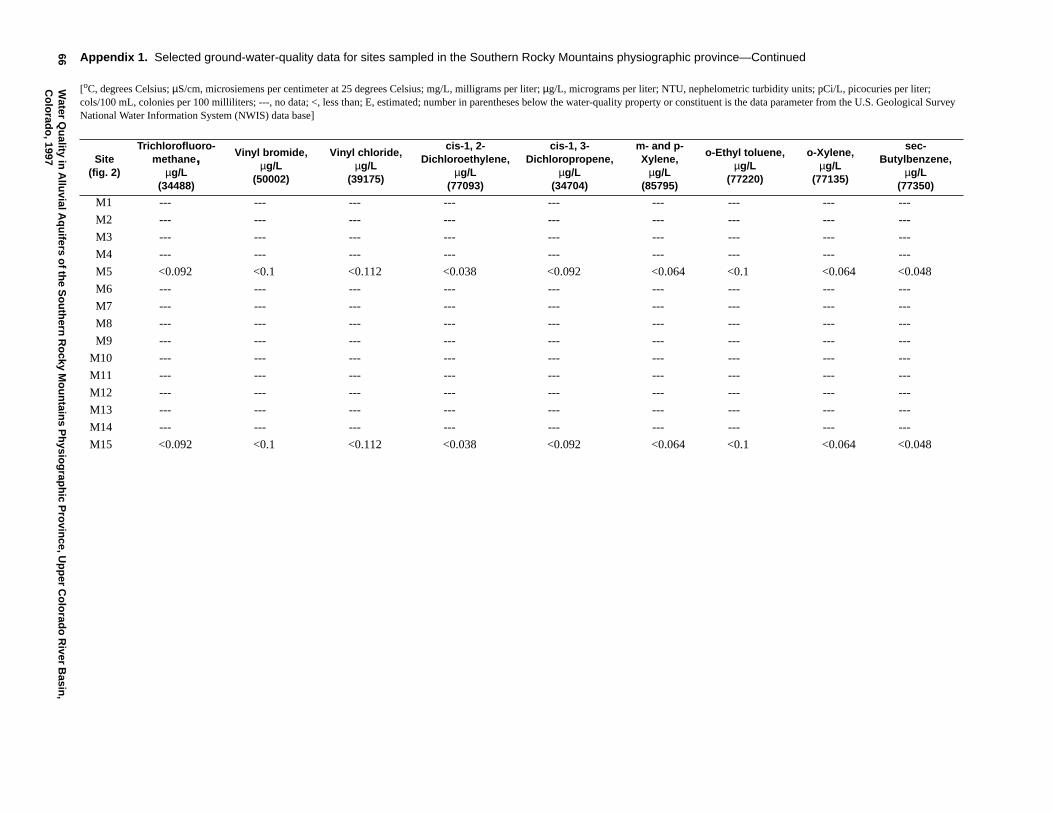
66W
aterQ
uality
inA
lluvialA
qu
iferso
fthe
So
uth
ernR
ocky
Mo
un
tains
Ph
ysiog
raph
icP
rovin
ce,Up
per
Co
lorad
oR
iverB
asin,
Co
lorad
o, 1997 Site
(fig. 2)
Trichlorofluoro-methane,
µg/L(34488)
Vinyl bromide,µg/L
(50002)
Vinyl chloride,µg/L
(39175)
cis-1, 2-Dichloroethylene,
µg/L(77093)
cis-1, 3-Dichloropropene,
µg/L(34704)
m- and p-Xylene,
µg/L(85795)
o-Ethyl toluene,µg/L
(77220)
o-Xylene,µg/L
(77135)
sec-Butylbenzene,
µg/L(77350)
M1 --- --- --- --- --- --- --- --- ---
M2 --- --- --- --- --- --- --- --- ---
M3 --- --- --- --- --- --- --- --- ---
M4 --- --- --- --- --- --- --- --- ---
M5 <0.092 <0.1 <0.112 <0.038 <0.092 <0.064 <0.1 <0.064 <0.048
M6 --- --- --- --- --- --- --- --- ---
M7 --- --- --- --- --- --- --- --- ---
M8 --- --- --- --- --- --- --- --- ---
M9 --- --- --- --- --- --- --- --- ---
M10 --- --- --- --- --- --- --- --- ---
M11 --- --- --- --- --- --- --- --- ---
M12 --- --- --- --- --- --- --- --- ---
M13 --- --- --- --- --- --- --- --- ---
M14 --- --- --- --- --- --- --- --- ---
M15 <0.092 <0.1 <0.112 <0.038 <0.092 <0.064 <0.1 <0.064 <0.048
Appendix 1. Selected ground-water-quality data for sites sampled in the Southern Rocky Mountains physiographic province—Continued
[oC, degrees Celsius; µS/cm, microsiemens per centimeter at 25 degrees Celsius; mg/L, milligrams per liter; µg/L, micrograms per liter; NTU, nephelometric turbidity units; pCi/L, picocuries per liter;cols/100 mL, colonies per 100 milliliters; ---, no data; <, less than; E, estimated; number in parentheses below the water-quality property or constituent is the data parameter from the U.S. Geological SurveyNational Water Information System (NWIS) data base]
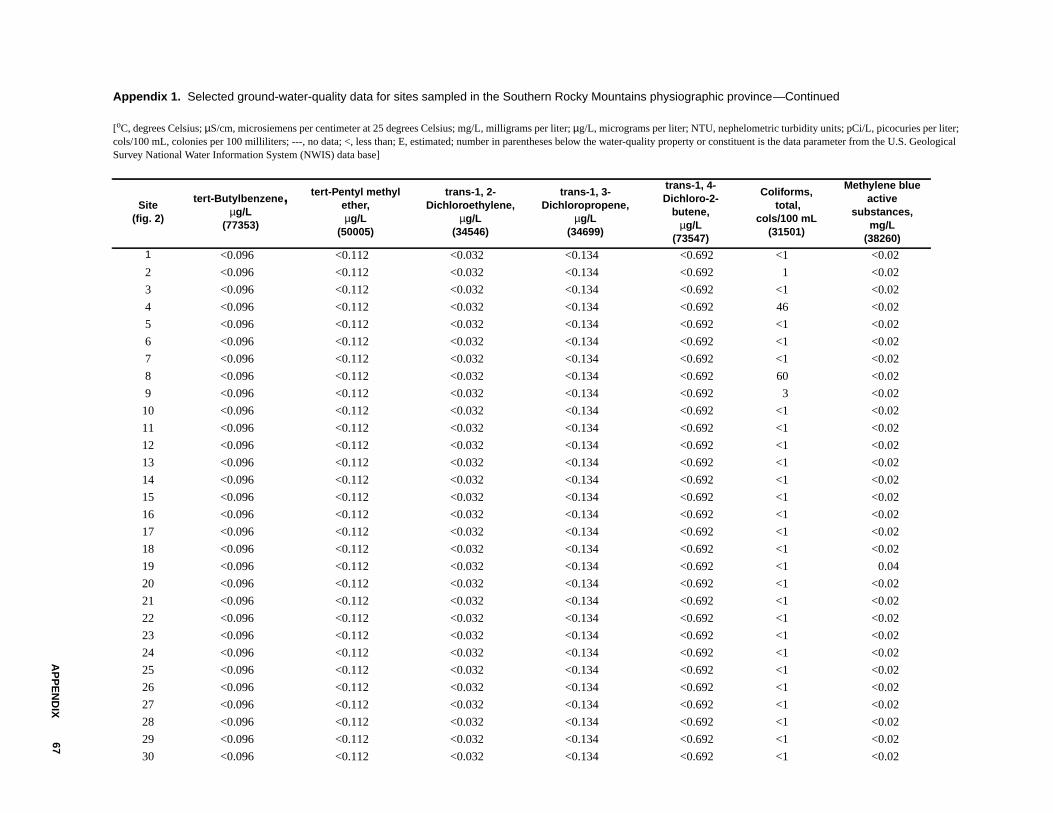
AP
PE
ND
IX67
Appendix 1. Selected ground-water-quality data for sites sampled in the Southern Rocky Mountains physiographic province
[oC, degrees Celsius; µS/cm, microsiemens per centimeter at 25 degrees Celsius; mg/L, milligrams per liter; µg/L, micrograms per liter; NTU, nephelometric turbidity units; pCi/L, picocuries per liter;cols/100 mL, colonies per 100 milliliters; ---, no data; <, less than; E, estimated; number in parentheses below the water-quality property or constituent is the data parameter from the U.S. GeologicalSurvey National Water Information System (NWIS) data base]
Site(fig. 2)
tert-Butylbenzene,µg/L
(77353)
tert-Pentyl methylether,µg/L
(50005)
trans-1, 2-Dichloroethylene,
µg/L(34546)
trans-1, 3-Dichloropropene,
µg/L(34699)
trans-1, 4-Dichloro-2-
butene,µg/L
(73547)
Coliforms, total,
cols/100 mL(31501)
Methylene blueactive
substances,mg/L
(38260)
1 <0.096 <0.112 <0.032 <0.134 <0.692 <1 <0.02
2 <0.096 <0.112 <0.032 <0.134 <0.692 1 <0.02
3 <0.096 <0.112 <0.032 <0.134 <0.692 <1 <0.02
4 <0.096 <0.112 <0.032 <0.134 <0.692 46 <0.02
5 <0.096 <0.112 <0.032 <0.134 <0.692 <1 <0.02
6 <0.096 <0.112 <0.032 <0.134 <0.692 <1 <0.02
7 <0.096 <0.112 <0.032 <0.134 <0.692 <1 <0.02
8 <0.096 <0.112 <0.032 <0.134 <0.692 60 <0.02
9 <0.096 <0.112 <0.032 <0.134 <0.692 3 <0.02
10 <0.096 <0.112 <0.032 <0.134 <0.692 <1 <0.02
11 <0.096 <0.112 <0.032 <0.134 <0.692 <1 <0.02
12 <0.096 <0.112 <0.032 <0.134 <0.692 <1 <0.02
13 <0.096 <0.112 <0.032 <0.134 <0.692 <1 <0.02
14 <0.096 <0.112 <0.032 <0.134 <0.692 <1 <0.02
15 <0.096 <0.112 <0.032 <0.134 <0.692 <1 <0.02
16 <0.096 <0.112 <0.032 <0.134 <0.692 <1 <0.02
17 <0.096 <0.112 <0.032 <0.134 <0.692 <1 <0.02
18 <0.096 <0.112 <0.032 <0.134 <0.692 <1 <0.02
19 <0.096 <0.112 <0.032 <0.134 <0.692 <1 0.04
20 <0.096 <0.112 <0.032 <0.134 <0.692 <1 <0.02
21 <0.096 <0.112 <0.032 <0.134 <0.692 <1 <0.02
22 <0.096 <0.112 <0.032 <0.134 <0.692 <1 <0.02
23 <0.096 <0.112 <0.032 <0.134 <0.692 <1 <0.02
24 <0.096 <0.112 <0.032 <0.134 <0.692 <1 <0.02
25 <0.096 <0.112 <0.032 <0.134 <0.692 <1 <0.02
26 <0.096 <0.112 <0.032 <0.134 <0.692 <1 <0.02
27 <0.096 <0.112 <0.032 <0.134 <0.692 <1 <0.02
28 <0.096 <0.112 <0.032 <0.134 <0.692 <1 <0.02
29 <0.096 <0.112 <0.032 <0.134 <0.692 <1 <0.02
30 <0.096 <0.112 <0.032 <0.134 <0.692 <1 <0.02
—Continued
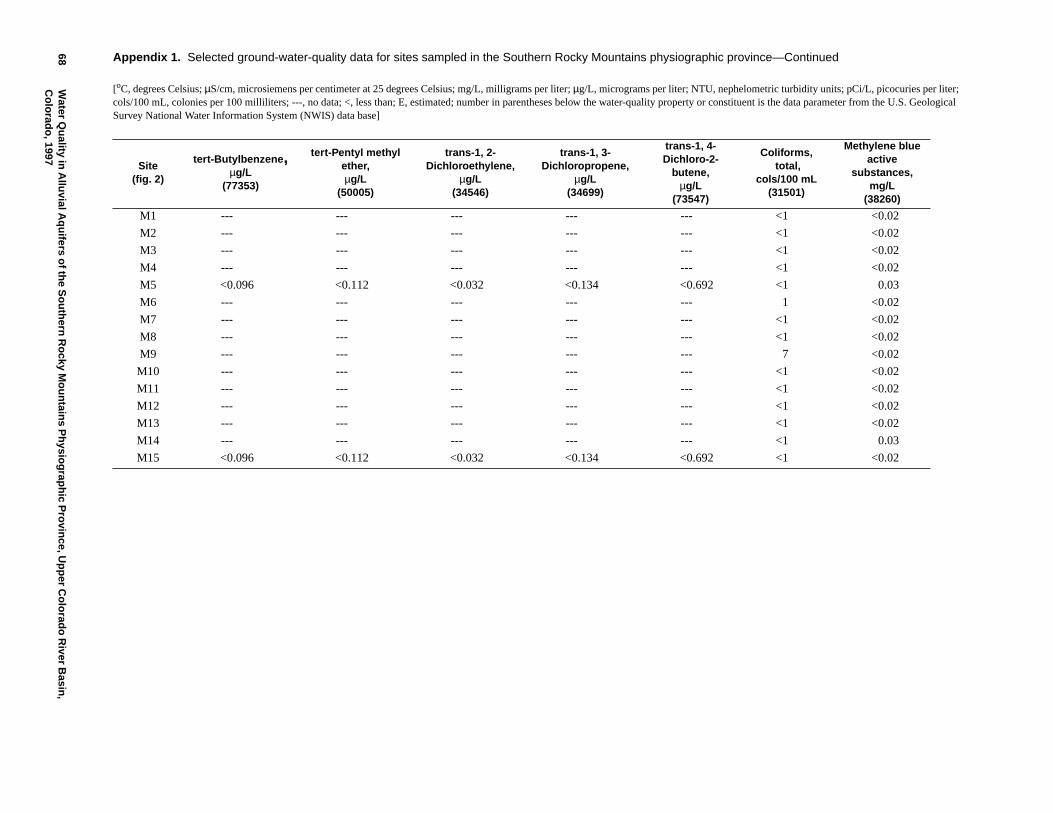
68W
aterQ
uality
inA
lluvialA
qu
iferso
fthe
So
uth
ernR
ocky
Mo
un
tains
Ph
ysiog
raph
icP
rovin
ce,Up
per
Co
lorad
oR
iverB
asin,
Co
lorad
o, 1997
Site(fig. 2)
tert-Butylbenzene,µg/L
(77353)
tert-Pentyl methylether,µg/L
(50005)
trans-1, 2-Dichloroethylene,
µg/L(34546)
trans-1, 3-Dichloropropene,
µg/L(34699)
trans-1, 4-Dichloro-2-
butene,µg/L
(73547)
Coliforms, total,
cols/100 mL(31501)
Methylene blueactive
substances,mg/L
(38260)
M1 --- --- --- --- --- <1 <0.02
M2 --- --- --- --- --- <1 <0.02
M3 --- --- --- --- --- <1 <0.02
M4 --- --- --- --- --- <1 <0.02
M5 <0.096 <0.112 <0.032 <0.134 <0.692 <1 0.03
M6 --- --- --- --- --- 1 <0.02
M7 --- --- --- --- --- <1 <0.02
M8 --- --- --- --- --- <1 <0.02
M9 --- --- --- --- --- 7 <0.02
M10 --- --- --- --- --- <1 <0.02
M11 --- --- --- --- --- <1 <0.02
M12 --- --- --- --- --- <1 <0.02
M13 --- --- --- --- --- <1 <0.02
M14 --- --- --- --- --- <1 0.03
M15 <0.096 <0.112 <0.032 <0.134 <0.692 <1 <0.02
Appendix 1. Selected ground-water-quality data for sites sampled in the Southern Rocky Mountains physiographic province—Continued
[oC, degrees Celsius; µS/cm, microsiemens per centimeter at 25 degrees Celsius; mg/L, milligrams per liter; µg/L, micrograms per liter; NTU, nephelometric turbidity units; pCi/L, picocuries per liter;cols/100 mL, colonies per 100 milliliters; ---, no data; <, less than; E, estimated; number in parentheses below the water-quality property or constituent is the data parameter from the U.S. GeologicalSurvey National Water Information System (NWIS) data base]
Top Related