


Languages
Pages
Legal


FINAL PROJECT REPORT WASHAKIE & WHITES VALLEY AERIAL SURVEY
BOX ELDER COUNTY, UTAH April 15-16, 2017
Submitted to:
Rick Kelson
Utah AGRC
5130 State Office Building
Salt Lake City, UT 84114
Submitted by:
Aero-Graphics, Inc. 40 W. Oakland Avenue Salt Lake City, UT 84115
www.aero-graphics.com

Washakie & Whites Valley Final Project Report 2 Aero-Graphics, Inc.: Geospatial Services
Final Project Report Washakie & Whites Valley
Box Elder County, UT
Table of Contents
1. Overview..........................................................................................................3
2. LiDAR Acquisition – Equipment and Methodology ...........................................4
3. Ground Survey – Equipment and Methodology ...............................................7
4. LiDAR Processing Workflow .............................................................................8
5. Accuracy Testing and Results ...........................................................................10
5.1 Relative Calibration Accuracy Results ........................................................10
5.2 Calibration Control Point Testing ..............................................................11
5.3 Point Cloud Testing ...................................................................................13
5.4 DEM Testing ..............................................................................................13
5.5 Data Density ..............................................................................................16
5.6 Data Density Summary ..............................................................................19
6. Projection, Datums, and Mapping Units ..........................................................20
7. Deliverables .....................................................................................................20
Appendix A – Control Point and QC Check Point Coordinates ...............................21
Base Station and NGS Reference Station Coordinates ....................24
Appendix B – Detailed Accuracy Reports ..............................................................26
Appendix C – Flight Logs .......................................................................................34
Appendix D – SOW and Production Guidance .......................................................35

Washakie & Whites Valley Final Project Report 3 Aero-Graphics, Inc.: Geospatial Services
1. Overview
Aero-Graphics, Inc. was contracted by the State of Utah, Department of Technology Services, Division of Integrated Technology, Automated Geographic Reference Center (AGRC) and partners to acquire, process, and deliver aerial LiDAR data and derivative products that adhere to USGS Quality Level 1 LiDAR specifications. The project areas cover approximately 26.2 square miles and are located in Box Elder County, Utah.
Exhibit 1: Washakie & Whites Valley project boundaries
Washakie & Whites Valley Final Project Report 4 Aero-Graphics, Inc.: Geospatial Services
2. LiDAR Acquisition – Equipment and Methodology
LiDAR acquisition for the Washakie & Whites Valley project was performed on April 15 and 16,
2017, with an Optech ALTM Orion H300 LiDAR sensor. Aero-Graphics flew at an average
altitude of 4,331 ft AGL (above ground level) and made appropriate adjustments to compensate
for topographic relief. The PRF (pulse rate frequency) used for collection was 175 kHz, scan
frequency 76.9 Hz, and scan angle +/- 6° from the nadir position (full scan angle 12°). LiDAR
acquisition was performed with 30% overlap and yielded an average 13 points per square
meter throughout the project areas.
Exhibit 2: Summary of planned flight parameters
Altitude (ft AGL)
Overlap (%)
Speed (kts)
PRF (kHz)
Scan Freq (Hz)
Scan Angle ° (full)
4,331 30 105 175 76.9 12
PPM2 (mean) Post spacing
Cross Track (m) Post Spacing
Down Track (m) Swath Width
(m) # Flightlines
11.68 0.35 0.35 277.48 61
Product Characterization Report
The Orion H300 can send/receive up to 300,000 pulses per second and is capable of receiving
up to four range measurements, including 1st, 2nd, 3rd, and last returns for every pulse sent from
the system. The Orion H300 features roll compensation that adjusts the mirror to maintain the
full scan angle integrity in relation to nadir, even when less than perfect weather conditions
push the sensor off nadir. It is also equipped with a GPS/IMU unit that continually records the
XYZ position and roll, pitch and yaw attitude of the plane throughout the flight. This
information allows us to correct laser return data positions that may have been thrown off by
the plane’s natural movement.
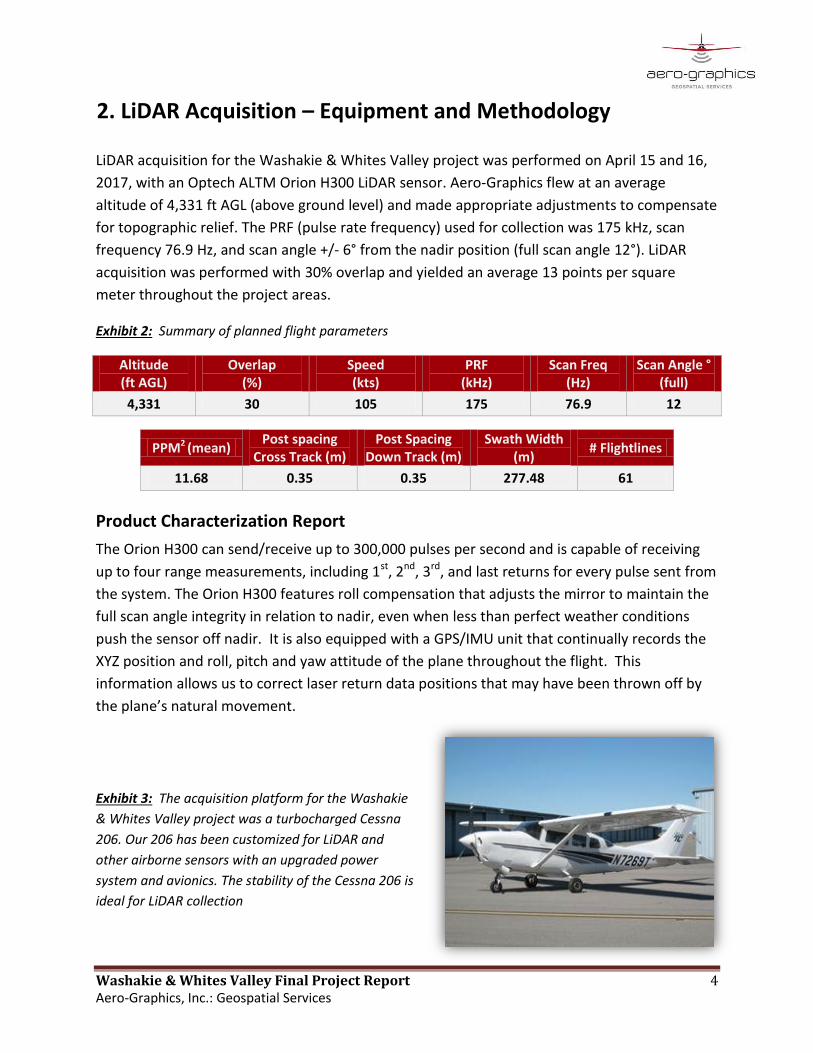
Exhibit 3: The acquisition platform for the Washakie
& Whites Valley project was a turbocharged Cessna
206. Our 206 has been customized for LiDAR and
other airborne sensors with an upgraded power
system and avionics. The stability of the Cessna 206 is
ideal for LiDAR collection

Washakie & Whites Valley Final Project Report 5 Aero-Graphics, Inc.: Geospatial Services
The ALTM Orion H300 LiDAR sensor is equipped
with FMS Planner Flight Management System
Software, which is the latest release from
Optech. Aero-Graphics utilizes FMS Planner to
both plan the flight and guide the airborne
mission while in flight. This smooth transition
from flight planning to aerial operations
eliminates discrepancies between the flight
plan and the actual airborne mission. The use
of FMS Planner helps ensure an accurate and
consistent acquisition mission with real-time
quality assurance while still airborne. The system operator can monitor the point density and
swath during the mission to confirm adequate coverage within the area of interest,
as shown in Exhibit 4.
Exhibit 4: Swath data for the Washakie & Whites Valley project was recorded and viewed real-time by
the system operator.

Washakie & Whites Valley Final Project Report 6 Aero-Graphics, Inc.: Geospatial Services
Exhibit 5: Flight lines symbolized by acquisition date

Washakie & Whites Valley Final Project Report 7 Aero-Graphics, Inc.: Geospatial Services
3. Ground Survey – Equipment and Methodology
Aero-Graphics surveyed 48 ground control points for use in data calibration as well as 146 QC
check points in Vegetated and Non-Vegetated land cover classifications as an independent test
of accuracy for this project. A combination of precise GPS surveying methods, including static
and RTK observations were used to establish the 3D position of ground calibration points and
QC check points. Calibration control point, QC check point, and base station coordinates can be
found in Appendix A. LiDAR positional accuracy results can be found in section 5.
Exhibit 6: Calibration Control Point number 102 (Washakie)
Exhibit 7: Calibration Control Point number 201 (Whites Valley)

Washakie & Whites Valley Final Project Report 8 Aero-Graphics, Inc.: Geospatial Services
4. LiDAR Processing Workflow
a. Absolute Sensor Calibration. Our absolute sensor calibration adjusted for the difference in
roll, pitch, heading, and scale between the raw laser point cloud from the sensor and
surveyed control points on the ground.
b. Kinematic Air Point Processing. Differentially corrected the 1-second airborne GPS
positions with ground base station; combined and refined the GPS positions with 1/200-
second IMU (roll-pitch-yaw) data through development of a smoothed best estimate of
trajectory (SBET).
c. Raw LiDAR Point Processing (Calibration). Combined SBET with raw LiDAR range data;
solved real-world position for each laser point; produced point cloud data by flight strip in
ASPRS v1.4 .LAS format; output in NAD83 (2011) UTM Zone 12, meters.
d. Relative Calibration. Performed relative calibration by correcting for roll, pitch, heading,
and scale discrepancies between adjacent flightlines; tested resulting relative accuracy.
Results presented in Section 5.
e. Vertical Accuracy Assessment. Performed comparative tests that showed Z-differences
between surveyed points and the laser point surface. Results presented in Section 5.
f. Tiling & Long/Short Filtering. Cut data into project-specified tiles and filtered out grossly
long and short returns.
g. Classified LAS Processing. The point classification is performed as described below. The
bare earth surface is then manually reviewed to ensure correct classification on the Class 2
(Ground) points. After the bare-earth surface is finalized, it is then used to generate all
hydro-breaklines through heads-up digitization.
All ground (ASPRS Class 2) LiDAR data inside of the Lake Pond and Double Line Drain hydro-
flattened breaklines were then classified to Water (ASPRS Class 9) using TerraScan macro
functionality. A buffer of 1 meter was also used around each hydro-flattened feature to
classify these ground (ASPRS Class 2) points to Ignored ground (ASPRS Class 10). All Lake
Pond Island and Double Line Drain Island features were checked to ensure that the ground
(ASPRS Class 2) points were reclassified to the correct classification after the automated
classification was completed. All bridge decks were classified to Class 17. All overlap data
was processed through automated functionality provided by TerraScan to classify the
overlapping flight line data to approved classes by USGS. The overlap data was classified
using standard LAS overlap bit. These classes were created through automated processes
only and were not verified for classification accuracy.
All data was manually reviewed and any remaining artifacts removed using functionality
provided by TerraScan and TerraModeler. LP360 was used as a final check of the bare earth

Washakie & Whites Valley Final Project Report 9 Aero-Graphics, Inc.: Geospatial Services
dataset. LP360 was then used to create the deliverable industry-standard LAS files for both
the All Point Cloud Data and the Bare Earth. Aero-Graphics, Inc. proprietary software was
used to perform final statistical analysis of the classes in the LAS files, on a per tile level to
verify final classification metrics and full LAS header information.
Exhibit 8: USGS Version 1.2 minimum point cloud classification scheme used for this project
CLASS # CLASS NAME DESCRIPTION
1 Processed, but unclassified Points that do not fit any other classes
2 Bare earth Bare earth surface
7 Low noise Low points identified below surface
9 Water Points inside of lakes/ponds
10 Ignored ground (near a breakline) Points near breakline features; ignored in DEM creation process
17 Bridge decks Points on bridge decks
18 High noise High points identified above surface
h. Hydro-Flattened Breakline Creation. Class 2 (ground) LiDAR points were used to create a
bare earth surface model. The surface model was then used to heads-up digitize 2D
breaklines of inland streams and rivers with a 100-foot nominal width and inland ponds and
lakes of 2 acres or greater surface area. Elevation values were assigned to all Inland Ponds
and Lakes, Inland Pond and Lake Islands, Inland Stream and River Islands, using LP360
functionality. Elevation values were assigned to all inland streams and rivers using Aero-
Graphics, Inc. proprietary software. All Ground (ASPRS Class 2) LiDAR data inside of the
collected inland breaklines were then classified to Water (ASPRS Class 9) using TerraScan
macro functionality. A buffer of 1 meter was also used around each hydro-flattened
feature. These points were moved from ground (ASPRS Class 2) to Ignored Ground (ASPRS
Class 10).
The breakline files were then translated to ESRI shapefile format using ESRI conversion
tools. Breaklines are reviewed against LiDAR intensity imagery to verify completeness of
capture. All breaklines are then compared to TINs (triangular irregular networks) created
from ground only points prior to water classification. The horizontal placement of
breaklines is compared to terrain features and the breakline elevations are compared to
LiDAR elevations to ensure all breaklines match the LiDAR within acceptable tolerances.
Some deviation is expected between breakline and LiDAR elevations due to monotonicity,
connectivity, and flattening rules that are enforced on the breaklines. Once completeness,
horizontal placement, and vertical variance is reviewed, all breaklines are reviewed for
topological consistency and data integrity using a combination of ESRI ArcMap tools and
proprietary tools.
Washakie & Whites Valley Final Project Report 10 Aero-Graphics, Inc.: Geospatial Services
i. Hydro-Flattened Raster DEM Creation. Class 2 (Ground) LiDAR points in conjunction with
the hydro breaklines were used to create a 0.5 meter hydro-flattened raster DEM. Using
LP360 along with automated scripting routines within ArcMap, an ERDAS Imagine .IMG file
was created for each tile. Each surface is reviewed using ESRI ArcMap and ArcScene to
check for any surface anomalies or incorrect elevations found within the surface.
j. First Return Raster DSM Creation. First return LiDAR points were used to create a 0.5
meter first-return raster DEM. Using LP360 along with automated scripting routines within
ArcMap, an ERDAS Imagine .IMG file was created for each tile. Each surface is reviewed
using ESRI ArcMap and ArcScene to check for any surface anomalies or incorrect elevations
found within the surface.
k. Intensity Image Creation. TerraScan software was used to create the deliverable Intensity
Images. All overlap classes were ignored during this process. This helps to ensure a more
aesthetically pleasing image. The ESRI ArcMap software was then used to verify full project
coverage. TIF/TFW files were then provided as the deliverable for this dataset requirement.
l. Issues. There were no issues to report for this project.
5. Accuracy Testing and Results
5.1 Relative Calibration Accuracy Results
Between-swath relative accuracy is defined as the elevation difference in overlapping areas
between a given set of two adjacent flightlines. The statistics are based on the comparison of
the flightlines and points listed below.
Washakie project area: (24 flightlines, > 382 million points)
Between-swath relative accuracy average of 0.014 meters
Whites Valley project area: (39 flightlines, > 436 million points)
Between-swath relative accuracy average of 0.020 meters
Within-swath relative accuracy is the amount of vertical separation, or “noise,” among a set of
points on open, paved ground that should have the same elevation. The within-swath relative
accuracy average is less than 0.026 foot.

Washakie & Whites Valley Final Project Report 11 Aero-Graphics, Inc.: Geospatial Services
5.2 Calibration Control Point Testing
Calibration Control Point reports were generated as a quality assurance check. Note that the
results are not an independent assessment of the accuracy of the project deliverables, but
rather an additional indication of the overall accuracy of the dataset. The location of each
control point is displayed below. Detailed results are included in Appendix B.
Exhibit 9: Calibration Control Point locations for the Washakie area

Washakie & Whites Valley Final Project Report 12 Aero-Graphics, Inc.: Geospatial Services
Exhibit 10: Calibration Control Point locations for the Whites Valley area

Washakie & Whites Valley Final Project Report 13 Aero-Graphics, Inc.: Geospatial Services
5.3 Point Cloud Testing
The project specifications require that only Non-Vegetated Vertical Accuracy (NVA) be
computed for raw LiDAR point cloud swath files. NVA is defined as the elevation difference
between the LiDAR surface and ground surveyed static points collected in open terrain (bare
soil, sand, rocks, and short grass) as well as urban terrain (asphalt and concrete surfaces). The
NVA for this project was tested with 39 check points in the Washakie area and 30 check points
in the Whites Valley area. These check points were not used in the calibration or post
processing of the LiDAR point cloud data. Elevations from the unclassified LiDAR surface were
measured for the xy location of each check point. Elevations interpolated from the LiDAR
surface were then compared to the elevation values of the surveyed control points.
Raw Non-vegetated Vertical Accuracy (Raw NVA): The tested Raw NVA for this dataset was
found to be 0.020 meters in terms of the RMSEz. The resulting NVA stated as the 95%
confidence level (RMSEz x 1.96) is 0.039 meters. Therefore this dataset meets the required NVA
of 0.196 meters at the 95% confidence level as defined by the National Standards for Spatial
Data Accuracy (NSSDA). Individual point results are included in Appendix B.
5.4 Digital Elevation Model (DEM) Testing
The project specifications require the accuracy of the derived DEM be calculated and reported
in two ways: (1) Non-Vegetated Vertical Accuracy (NVA) calculated at a 95% confidence level
in “bare earth” and “urban” land cover classes and (2) Vegetated Vertical Accuracy (VVA) in all
vegetated land cover classes combined calculated based on the 95th percentile error. The NVA
for this project was tested with 39 check points in the Washakie area and 30 check points in the
Whites Valley area. The VVA was tested with 45 check points in the Washakie area and 32
check points in the Whites Valley area.
The tested Non-Vegetated Vertical Accuracy (NVA) for this dataset captured from the DEM
using bi-linear interpolation to derive the DEM elevations was found to be 0.020 meters in
terms of the RMSEz. The resulting accuracy stated as the 95% confidence level (RMSEz x 1.96) is
0.039 meters. Therefore this dataset meets the required NVA of 0.196 meters at the 95%
confidence level. Individual point results are included in Appendix B.
The tested Vegetated Vertical Accuracy (VVA) for this dataset captured from the DEM using bi-
linear interpolation for all classes was found to be 0.066 meters. Therefore this dataset meets
the required VVA of 0.294 meters based on the 95th percentile error. Individual point results are
included in Appendix B.

Washakie & Whites Valley Final Project Report 14 Aero-Graphics, Inc.: Geospatial Services
Exhibit 11: QC Check Point locations for the Washakie area

Washakie & Whites Valley Final Project Report 15 Aero-Graphics, Inc.: Geospatial Services
Exhibit 12: QC Check Point locations for the Whites Valley area
Washakie & Whites Valley Final Project Report 16 Aero-Graphics, Inc.: Geospatial Services
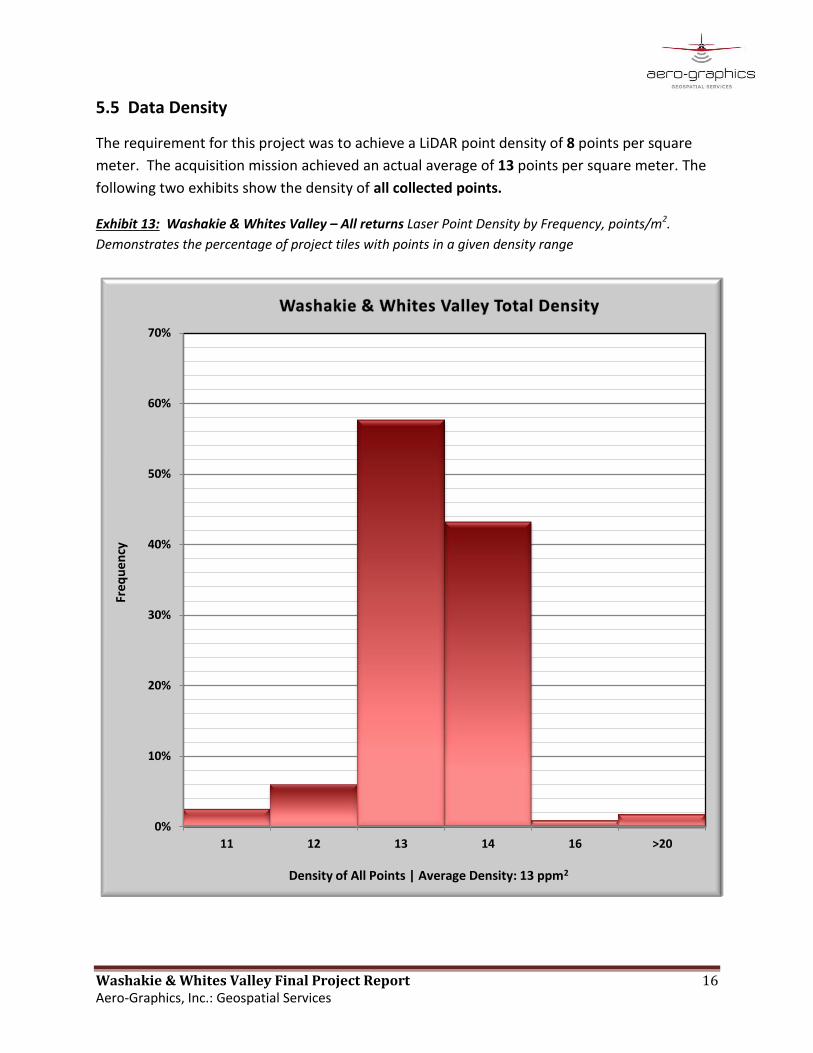
5.5 Data Density
The requirement for this project was to achieve a LiDAR point density of 8 points per square
meter. The acquisition mission achieved an actual average of 13 points per square meter. The
following two exhibits show the density of all collected points. Exhibit 13: Washakie & Whites Valley – All returns Laser Point Density by Frequency, points/m2.
Demonstrates the percentage of project tiles with points in a given density range
0%
10%
20%
30%
40%
50%
60%
70%
11 12 13 14 16 >20
Freq
uen
cy
Density of All Points | Average Density: 13 ppm2
Washakie & Whites Valley Final Project Report 17 Aero-Graphics, Inc.: Geospatial Services
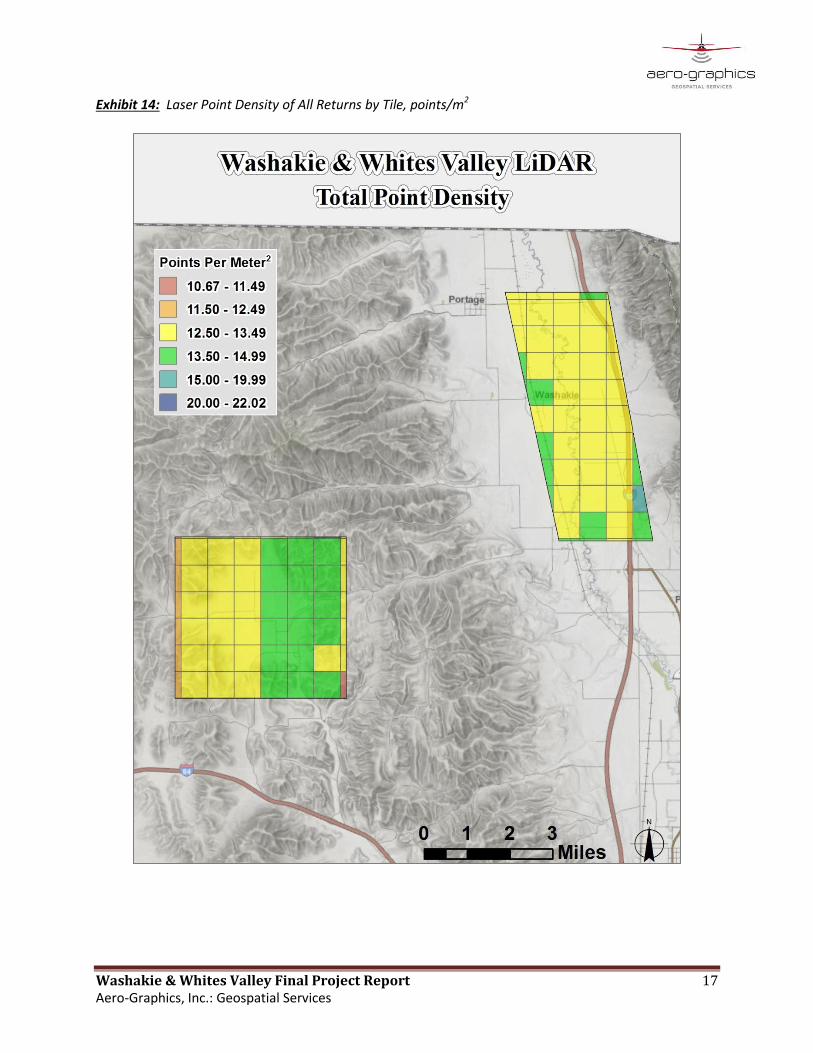
Exhibit 14: Laser Point Density of All Returns by Tile, points/m2
Washakie & Whites Valley Final Project Report 18 Aero-Graphics, Inc.: Geospatial Services
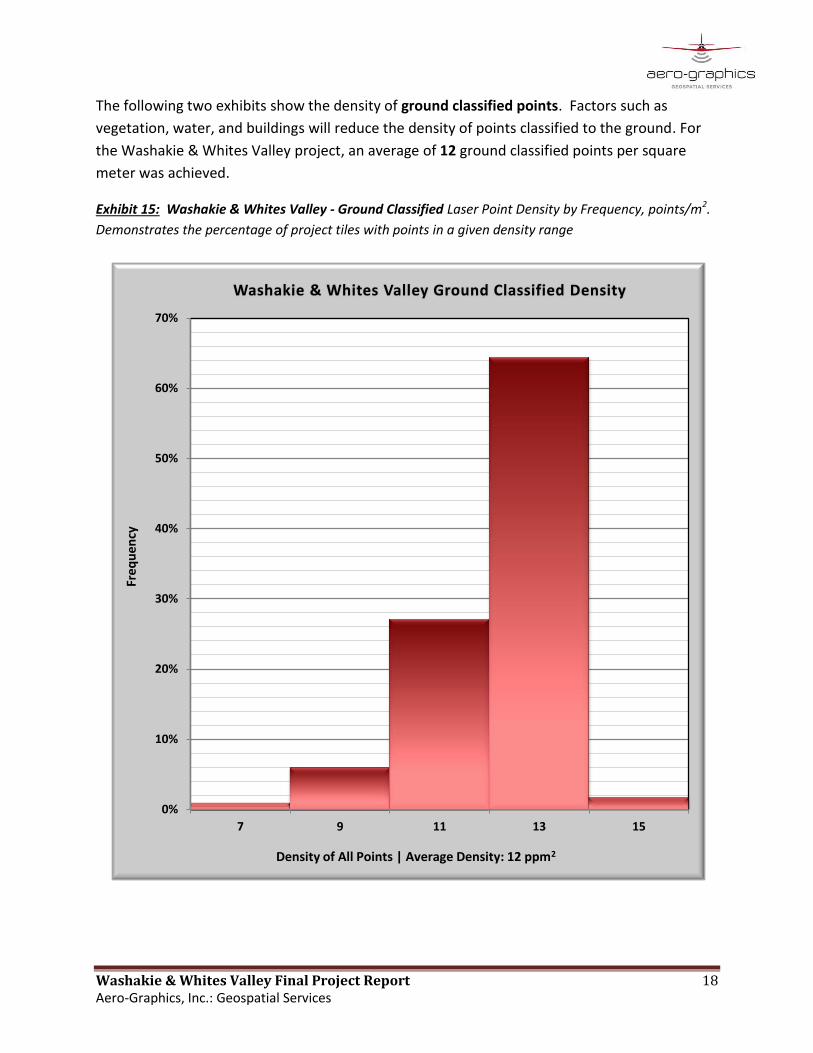
The following two exhibits show the density of ground classified points. Factors such as
vegetation, water, and buildings will reduce the density of points classified to the ground. For
the Washakie & Whites Valley project, an average of 12 ground classified points per square
meter was achieved.
Exhibit 15: Washakie & Whites Valley - Ground Classified Laser Point Density by Frequency, points/m2.
Demonstrates the percentage of project tiles with points in a given density range
0%
10%
20%
30%
40%
50%
60%
70%
7 9 11 13 15
Freq
uen
cy
Density of All Points | Average Density: 12 ppm2

Washakie & Whites Valley Final Project Report 19 Aero-Graphics, Inc.: Geospatial Services
Exhibit 16: Ground Classified Laser Point Density by Tile, points/m2
5.6 Data Density Summary
Washakie & Whites Valley Goal Actual (mean)
Total Point Density: 8 points/m2 13 points/m2
Ground Classified Point Density: ------- 12 points/m2

Washakie & Whites Valley Final Project Report 20 Aero-Graphics, Inc.: Geospatial Services
6. Projection, Datums, and Mapping Units
Projection: UTM Zone 12N
Datum Vertical: NAVD88 (GEOID12B)
Horizontal: NAD83 (2011)
Units: Meters
7. Deliverables
*Tiling for the LiDAR deliverables is based on the U.S. National Grid System. Tile names are
based on the SW corner of the tile. All .LAS tiles are 1,000 meters x 1,000 meters. All other
deliverables are 2,000 meters x 2,000 meters.
LiDAR Point Data: Raw and classified LiDAR point cloud data in LAS v1.4
format
Raster Data:
Bare-earth and first return DEMs with a cell size of 0.5
meters in ERDAS .IMG format
Intensity images at a 0.5 meter resolution in GeoTIFF
format
Vector Data:
Shapefiles containing processing boundary and tile
index
Shapefiles containing all breaklines used for hydro-
flattening
Separate shapefiles for control points and check points
Metadata: FGDC compliant metadata files in XML format
Report of Survey: Technical Project Report including methodology,
accuracy, and results
Washakie & Whites Valley Final Project Report 21 Aero-Graphics, Inc.: Geospatial Services
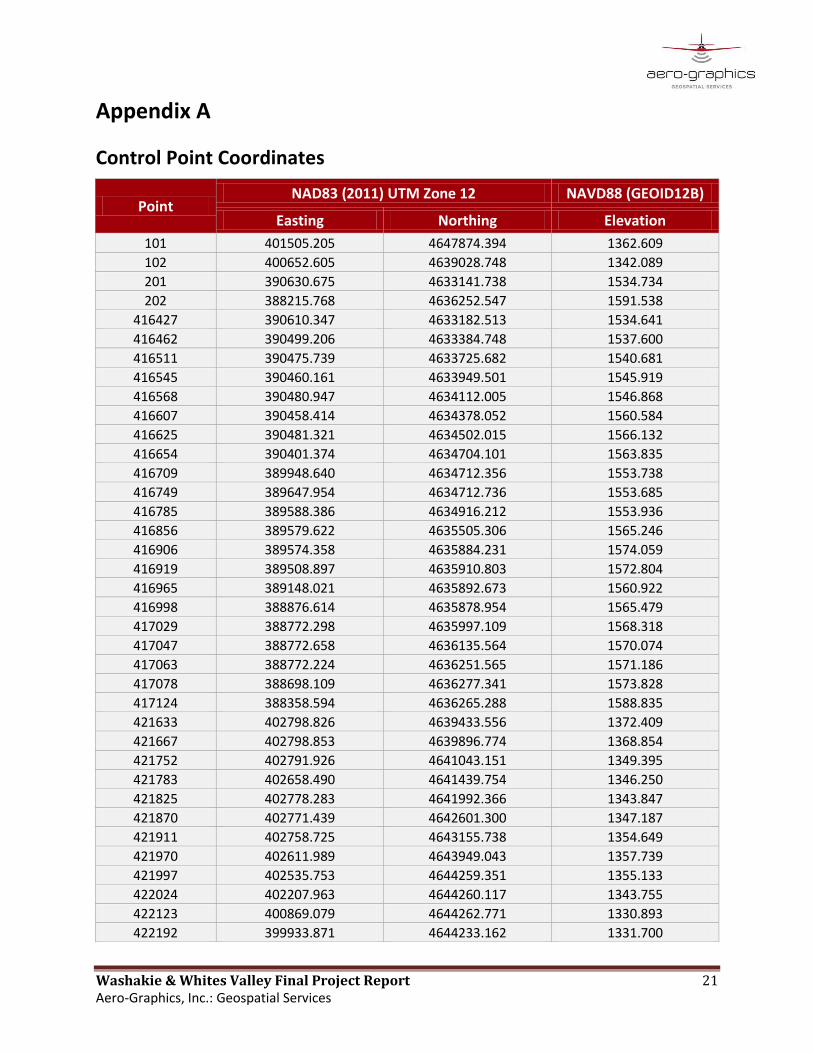
Appendix A
Control Point Coordinates
Point NAD83 (2011) UTM Zone 12 NAVD88 (GEOID12B)
Easting Northing Elevation
101 401505.205 4647874.394 1362.609
102 400652.605 4639028.748 1342.089
201 390630.675 4633141.738 1534.734
202 388215.768 4636252.547 1591.538
416427 390610.347 4633182.513 1534.641
416462 390499.206 4633384.748 1537.600
416511 390475.739 4633725.682 1540.681
416545 390460.161 4633949.501 1545.919
416568 390480.947 4634112.005 1546.868
416607 390458.414 4634378.052 1560.584
416625 390481.321 4634502.015 1566.132
416654 390401.374 4634704.101 1563.835
416709 389948.640 4634712.356 1553.738
416749 389647.954 4634712.736 1553.685
416785 389588.386 4634916.212 1553.936
416856 389579.622 4635505.306 1565.246
416906 389574.358 4635884.231 1574.059
416919 389508.897 4635910.803 1572.804
416965 389148.021 4635892.673 1560.922
416998 388876.614 4635878.954 1565.479
417029 388772.298 4635997.109 1568.318
417047 388772.658 4636135.564 1570.074
417063 388772.224 4636251.565 1571.186
417078 388698.109 4636277.341 1573.828
417124 388358.594 4636265.288 1588.835
421633 402798.826 4639433.556 1372.409
421667 402798.853 4639896.774 1368.854
421752 402791.926 4641043.151 1349.395
421783 402658.490 4641439.754 1346.250
421825 402778.283 4641992.366 1343.847
421870 402771.439 4642601.300 1347.187
421911 402758.725 4643155.738 1354.649
421970 402611.989 4643949.043 1357.739
421997 402535.753 4644259.351 1355.133
422024 402207.963 4644260.117 1343.755
422123 400869.079 4644262.771 1330.893
422192 399933.871 4644233.162 1331.700

Washakie & Whites Valley Final Project Report 22 Aero-Graphics, Inc.: Geospatial Services
QC Check Point Coordinates
Point Easting Northing Elevation
422225 399530.187 4644228.063 1332.590
422320 400587.094 4644240.505 1330.702
422401 401680.540 4644254.934 1336.376
422507 402463.254 4644722.899 1355.733
422566 402214.548 4645484.388 1353.477
422604 402070.294 4645980.433 1353.353
422632 402084.172 4646363.227 1351.953
422657 402081.038 4646698.580 1347.642
422721 401541.185 4647377.040 1343.450
422754 401250.511 4647718.711 1345.245
422785 401165.400 4647880.549 1347.184
Point Type Area NAD83 (2011) UTM Zone 12 NAVD88 (GEOID12B)
Easting Northing Elevation
416481 NVA Whites Valley 390491.098 4633519.204 1538.030
416482 NVA Whites Valley 390490.646 4633526.896 1538.094
416483 NVA Whites Valley 390490.190 4633534.538 1538.175
416484 NVA Whites Valley 390489.750 4633542.149 1538.256
416485 NVA Whites Valley 390489.277 4633549.698 1538.342
416486 NVA Whites Valley 390488.768 4633557.163 1538.417
416487 NVA Whites Valley 390488.247 4633564.583 1538.487
416681 NVA Whites Valley 390171.911 4634708.732 1554.553
416682 NVA Whites Valley 390164.042 4634708.863 1554.516
416683 NVA Whites Valley 390156.409 4634709.053 1554.475
416684 NVA Whites Valley 390148.871 4634709.251 1554.444
416685 NVA Whites Valley 390141.014 4634709.430 1554.425
416686 NVA Whites Valley 390133.026 4634709.574 1554.417
416687 NVA Whites Valley 390125.144 4634709.700 1554.401
416688 NVA Whites Valley 390117.300 4634709.838 1554.398
416721 NVA Whites Valley 389858.084 4634713.470 1553.668
416722 NVA Whites Valley 389850.538 4634713.501 1553.673
416723 NVA Whites Valley 389842.815 4634713.528 1553.680
416724 NVA Whites Valley 389835.058 4634713.612 1553.677
416725 NVA Whites Valley 389827.331 4634713.696 1553.668
416726 NVA Whites Valley 389819.647 4634713.722 1553.666
416727 NVA Whites Valley 389811.981 4634713.724 1553.665
416931 NVA Whites Valley 389410.429 4635904.924 1569.365
416932 NVA Whites Valley 389402.605 4635904.509 1568.843
416933 NVA Whites Valley 389395.027 4635904.140 1568.294
416934 NVA Whites Valley 389387.643 4635903.738 1567.708

Washakie & Whites Valley Final Project Report 23 Aero-Graphics, Inc.: Geospatial Services
Point Type Area Easting Northing Elevation
416935 NVA Whites Valley 389380.422 4635903.271 1567.124
416936 NVA Whites Valley 389373.119 4635902.845 1566.470
416937 NVA Whites Valley 389365.688 4635902.385 1565.796
416938 NVA Whites Valley 389358.238 4635901.936 1565.112
421701 NVA Washakie 402800.374 4640355.870 1361.405
421702 NVA Washakie 402800.229 4640369.391 1361.167
421703 NVA Washakie 402800.151 4640382.939 1360.960
421704 NVA Washakie 402800.040 4640396.485 1360.755
421705 NVA Washakie 402799.969 4640410.036 1360.594
421706 NVA Washakie 402799.931 4640423.565 1360.452
421707 NVA Washakie 402799.867 4640437.085 1360.275
421708 NVA Washakie 402799.770 4640450.595 1360.158
421771 NVA Washakie 402703.555 4641283.673 1347.208
421772 NVA Washakie 402698.724 4641296.320 1347.144
421773 NVA Washakie 402693.905 4641308.952 1347.095
421774 NVA Washakie 402689.119 4641321.567 1347.087
421775 NVA Washakie 402684.417 4641334.165 1347.107
421776 NVA Washakie 402679.878 4641346.825 1347.049
421777 NVA Washakie 402675.550 4641359.629 1346.980
422001 NVA Washakie 402504.563 4644260.368 1354.081
422002 NVA Washakie 402495.830 4644260.284 1353.750
422003 NVA Washakie 402485.903 4644260.232 1353.338
422004 NVA Washakie 402474.736 4644260.254 1352.908
422005 NVA Washakie 402462.496 4644260.314 1352.428
422006 NVA Washakie 402449.421 4644260.363 1351.908
422007 NVA Washakie 402435.925 4644260.416 1351.334
422008 NVA Washakie 402422.232 4644260.450 1350.783
422251 NVA Washakie 399650.268 4644225.377 1332.310
422252 NVA Washakie 399663.738 4644225.469 1332.281
422253 NVA Washakie 399677.216 4644225.636 1332.245
422254 NVA Washakie 399690.702 4644225.853 1332.226
422255 NVA Washakie 399704.198 4644226.046 1332.208
422256 NVA Washakie 399717.722 4644226.245 1332.178
422257 NVA Washakie 399731.277 4644226.444 1332.144
422258 NVA Washakie 399744.850 4644226.558 1332.098
422701 NVA Washakie 401715.876 4647169.773 1347.020
422702 NVA Washakie 401707.107 4647180.257 1346.936
422703 NVA Washakie 401698.331 4647190.781 1346.816
422704 NVA Washakie 401689.526 4647201.353 1346.642
422705 NVA Washakie 401680.692 4647212.011 1346.395
422706 NVA Washakie 401671.836 4647222.737 1346.061
422707 NVA Washakie 401662.968 4647233.506 1345.667
422708 NVA Washakie 401654.110 4647244.250 1345.250

Washakie & Whites Valley Final Project Report 24 Aero-Graphics, Inc.: Geospatial Services
Point Type Area Easting Northing Elevation
482541 VVA Whites Valley 390477.735 4633896.435 1544.638
482542 VVA Whites Valley 390477.244 4633899.373 1544.836
482543 VVA Whites Valley 390476.844 4633902.291 1544.991
482544 VVA Whites Valley 390476.779 4633905.318 1545.147
482545 VVA Whites Valley 390477.011 4633908.437 1545.290
482546 VVA Whites Valley 390477.446 4633911.707 1545.421
482547 VVA Whites Valley 390477.854 4633915.182 1545.566
482548 VVA Whites Valley 390478.258 4633918.658 1545.727
482549 VVA Whites Valley 390478.553 4633922.082 1545.855
482550 VVA Whites Valley 390478.662 4633925.474 1545.964
482551 VVA Whites Valley 390478.644 4633928.752 1546.055
484481 VVA Whites Valley 388397.079 4636245.557 1586.776
484482 VVA Whites Valley 388400.559 4636245.550 1586.617
484483 VVA Whites Valley 388404.124 4636245.541 1586.432
484484 VVA Whites Valley 388407.802 4636245.494 1586.225
484485 VVA Whites Valley 388411.615 4636245.454 1586.027
484486 VVA Whites Valley 388415.542 4636245.412 1585.810
484487 VVA Whites Valley 388419.526 4636245.351 1585.599
484488 VVA Whites Valley 388423.540 4636245.356 1585.396
484489 VVA Whites Valley 388427.600 4636245.338 1585.167
484490 VVA Whites Valley 388431.729 4636245.363 1584.920
484491 VVA Whites Valley 388435.943 4636245.454 1584.667
484651 VVA Whites Valley 388756.699 4635989.658 1568.962
484652 VVA Whites Valley 388756.917 4635986.380 1569.152
484653 VVA Whites Valley 388757.193 4635982.958 1569.292
484654 VVA Whites Valley 388757.492 4635979.579 1569.366
484655 VVA Whites Valley 388757.822 4635976.300 1569.400
484656 VVA Whites Valley 388758.088 4635973.010 1569.430
484657 VVA Whites Valley 388758.324 4635969.664 1569.435
484658 VVA Whites Valley 388758.545 4635966.215 1569.406
484659 VVA Whites Valley 388758.734 4635962.684 1569.366
484660 VVA Whites Valley 388758.927 4635959.111 1569.317
488901 VVA Washakie 400585.696 4639300.560 1339.183
488902 VVA Washakie 400584.823 4639303.659 1339.155
488903 VVA Washakie 400583.960 4639306.816 1339.085
488904 VVA Washakie 400583.109 4639310.011 1339.014
488905 VVA Washakie 400582.273 4639313.200 1338.974
488906 VVA Washakie 400581.488 4639316.186 1338.926
488907 VVA Washakie 400580.726 4639319.014 1338.850
488908 VVA Washakie 400579.929 4639321.749 1338.812
488909 VVA Washakie 400579.110 4639324.527 1338.777
488910 VVA Washakie 400578.426 4639327.286 1338.686
488911 VVA Washakie 400577.732 4639330.206 1338.613

Washakie & Whites Valley Final Project Report 25 Aero-Graphics, Inc.: Geospatial Services
Base Station Coordinates
Point Type Area Easting Northing Elevation
488912 VVA Washakie 400576.988 4639333.151 1338.538
489001 VVA Washakie 400509.263 4639595.455 1336.369
489002 VVA Washakie 400508.621 4639597.970 1336.380
489003 VVA Washakie 400507.815 4639600.908 1336.314
489004 VVA Washakie 400506.907 4639604.223 1336.280
489005 VVA Washakie 400505.941 4639607.839 1336.264
489006 VVA Washakie 400504.997 4639611.645 1336.244
489007 VVA Washakie 400504.126 4639615.499 1336.242
489008 VVA Washakie 400503.238 4639619.262 1336.239
489009 VVA Washakie 400502.311 4639622.946 1336.239
489010 VVA Washakie 400501.375 4639626.588 1336.248
489011 VVA Washakie 400500.476 4639630.126 1336.239
492021 VVA Washakie 401159.542 4647665.328 1341.252
492022 VVA Washakie 401160.572 4647660.621 1341.116
492023 VVA Washakie 401161.678 4647655.648 1341.014
492024 VVA Washakie 401162.808 4647650.359 1340.906
492025 VVA Washakie 401164.091 4647644.803 1340.793
492026 VVA Washakie 401165.442 4647639.085 1340.668
492027 VVA Washakie 401166.815 4647633.200 1340.515
492028 VVA Washakie 401168.184 4647627.251 1340.364
492029 VVA Washakie 401169.548 4647621.328 1340.232
492030 VVA Washakie 401170.908 4647615.435 1340.098
492031 VVA Washakie 401172.215 4647609.546 1339.965
492681 VVA Washakie 401926.152 4646909.490 1347.609
492682 VVA Washakie 401924.072 4646911.886 1347.592
492683 VVA Washakie 401922.029 4646914.280 1347.561
492684 VVA Washakie 401919.950 4646916.688 1347.549
492685 VVA Washakie 401917.883 4646919.146 1347.515
492686 VVA Washakie 401915.826 4646921.650 1347.478
492687 VVA Washakie 401913.758 4646924.094 1347.478
492688 VVA Washakie 401911.744 4646926.372 1347.499
492689 VVA Washakie 401909.785 4646928.605 1347.507
492690 VVA Washakie 401907.831 4646930.859 1347.500
492691 VVA Washakie 401905.826 4646933.170 1347.488
Base Station WGS84
Latitude Longitude Height UTRS 41° 47' 15.86153" -112° 09' 53.51884" 1334.809

Washakie & Whites Valley Final Project Report 26 Aero-Graphics, Inc.: Geospatial Services
NGS Reference Station Coordinates
Appendix B
Calibrated Control Point Report
NGS Tristation/BM NAD83 (2011)
NAVD88 (Geoid12B/OPUS Solution)
Latitude Longitude Elevation (usft) Plymouth 1963 41° 53' 42.86814" -112° 10' 04.12609" 4604.979
Point Easting Northing Known Z Laser Z Dz
101 401505.205 4647874.394 1362.609 1362.63 0.021
102 400652.605 4639028.748 1342.089 1342.12 0.031
201 390630.675 4633141.738 1534.734 1534.75 0.016
202 388215.768 4636252.547 1591.538 1591.54 0.002
421633 402798.826 4639433.556 1372.409 1372.43 0.021
421667 402798.853 4639896.774 1368.854 1368.88 0.026
421752 402791.926 4641043.151 1349.395 1349.43 0.035
421783 402658.49 4641439.754 1346.250 1346.29 0.04
421825 402778.283 4641992.366 1343.847 1343.88 0.033
421870 402771.439 4642601.300 1347.187 1347.21 0.023
421911 402758.725 4643155.738 1354.649 1354.69 0.041
421970 402611.989 4643949.043 1357.739 1357.78 0.041
421997 402535.753 4644259.351 1355.133 1355.15 0.017
422024 402207.963 4644260.117 1343.755 1343.76 0.005
422123 400869.079 4644262.771 1330.893 1330.90 0.007
422192 399933.871 4644233.162 1331.700 1331.70 0
422225 399530.187 4644228.063 1332.590 1332.60 0.01
422320 400587.094 4644240.505 1330.702 1330.68 -0.022
422401 401680.54 4644254.934 1336.376 1336.36 -0.016
422507 402463.254 4644722.899 1355.733 1355.76 0.027
422566 402214.548 4645484.388 1353.477 1353.42 -0.057
422604 402070.294 4645980.433 1353.353 1353.31 -0.043
422632 402084.172 4646363.227 1351.953 1351.89 -0.063
422657 402081.038 4646698.580 1347.642 1347.58 -0.062
422721 401541.185 4647377.040 1343.450 1343.46 0.01
422754 401250.511 4647718.711 1345.245 1345.23 -0.015
422785 401165.4 4647880.549 1347.184 1347.18 -0.004
416427 390610.347 4633182.513 1534.641 1534.65 0.009
416462 390499.206 4633384.748 1537.600 1537.60 0
416511 390475.739 4633725.682 1540.681 1540.70 0.019
416545 390460.161 4633949.501 1545.919 1545.93 0.011

Washakie & Whites Valley Final Project Report 27 Aero-Graphics, Inc.: Geospatial Services
Point Easting Northing Known Z Laser Z Dz
416568 390480.947 4634112.005 1546.868 1546.84 -0.028
416607 390458.414 4634378.052 1560.584 1560.54 -0.044
416625 390481.321 4634502.015 1566.132 1566.11 -0.022
416654 390401.374 4634704.101 1563.835 1563.83 -0.005
416709 389948.64 4634712.356 1553.738 1553.73 -0.008
416749 389647.954 4634712.736 1553.685 1553.69 0.005
416785 389588.386 4634916.212 1553.936 1553.96 0.024
416856 389579.622 4635505.306 1565.246 1565.26 0.014
416906 389574.358 4635884.231 1574.059 1574.07 0.011
416919 389508.897 4635910.803 1572.804 1572.82 0.016
416965 389148.021 4635892.673 1560.922 1560.93 0.008
416998 388876.614 4635878.954 1565.479 1565.49 0.011
417029 388772.298 4635997.109 1568.318 1568.30 -0.018
417047 388772.658 4636135.564 1570.074 1570.08 0.006
417063 388772.224 4636251.565 1571.186 1571.20 0.014
417078 388698.109 4636277.341 1573.828 1573.86 0.032
417124 388358.594 4636265.288 1588.835 1588.84 0.005
Average Dz 0.004
Minimum Dz -0.063
Maximum Dz 0.041
Root Mean Square 0.026
Std. Deviation 0.026

Washakie & Whites Valley Final Project Report 28 Aero-Graphics, Inc.: Geospatial Services
Raw NVA Check Point Report Point Easting Northing Known Z Laser Z Dz
421701 402800.374 4640355.87 1361.405 1361.42 0.015
421702 402800.229 4640369.391 1361.167 1361.19 0.023
421703 402800.151 4640382.939 1360.96 1360.98 0.02
421704 402800.04 4640396.485 1360.755 1360.78 0.025
421705 402799.969 4640410.036 1360.594 1360.61 0.016
421706 402799.931 4640423.565 1360.452 1360.48 0.028
421707 402799.867 4640437.085 1360.275 1360.31 0.035
421708 402799.77 4640450.595 1360.158 1360.19 0.032
421771 402703.555 4641283.673 1347.208 1347.24 0.032
421772 402698.724 4641296.32 1347.144 1347.17 0.026
421773 402693.905 4641308.952 1347.095 1347.12 0.025
421774 402689.119 4641321.567 1347.087 1347.12 0.033
421775 402684.417 4641334.165 1347.107 1347.13 0.023
421776 402679.878 4641346.825 1347.049 1347.07 0.021
421777 402675.55 4641359.629 1346.98 1347.01 0.03
422001 402504.563 4644260.368 1354.081 1354.11 0.029
422002 402495.83 4644260.284 1353.75 1353.78 0.03
422003 402485.903 4644260.232 1353.338 1353.37 0.032
422004 402474.736 4644260.254 1352.908 1352.92 0.012
422005 402462.496 4644260.314 1352.428 1352.46 0.032
422006 402449.421 4644260.363 1351.908 1351.93 0.022
422007 402435.925 4644260.416 1351.334 1351.34 0.006
422008 402422.232 4644260.450 1350.783 1350.79 0.007
422251 399650.268 4644225.377 1332.31 1332.28 -0.03
422252 399663.738 4644225.469 1332.281 1332.24 -0.041
422253 399677.216 4644225.636 1332.245 1332.22 -0.025
422254 399690.702 4644225.853 1332.226 1332.21 -0.016
422255 399704.198 4644226.046 1332.208 1332.19 -0.018
422256 399717.722 4644226.245 1332.178 1332.16 -0.018
422257 399731.277 4644226.444 1332.144 1332.11 -0.034
422258 399744.850 4644226.558 1332.098 1332.08 -0.018
422701 401715.876 4647169.773 1347.020 1347.04 0.02
422702 401707.107 4647180.257 1346.936 1346.97 0.034
422703 401698.331 4647190.781 1346.816 1346.84 0.024
422704 401689.526 4647201.353 1346.642 1346.66 0.018
422705 401680.692 4647212.011 1346.395 1346.41 0.015
422706 401671.836 4647222.737 1346.061 1346.07 0.009
422707 401662.968 4647233.506 1345.667 1345.67 0.003
422708 401654.110 4647244.250 1345.250 1345.26 0.01
416481 390491.098 4633519.204 1538.030 1538.05 0.02
416482 390490.646 4633526.896 1538.094 1538.12 0.026
416483 390490.190 4633534.538 1538.175 1538.19 0.015

Washakie & Whites Valley Final Project Report 29 Aero-Graphics, Inc.: Geospatial Services
Point Easting Northing Known Z Laser Z Dz
416484 390489.750 4633542.149 1538.256 1538.28 0.024
416485 390489.277 4633549.698 1538.342 1538.35 0.008
416486 390488.768 4633557.163 1538.417 1538.41 -0.007
416487 390488.247 4633564.583 1538.487 1538.49 0.003
416681 390171.911 4634708.732 1554.553 1554.58 0.027
416682 390164.042 4634708.863 1554.516 1554.53 0.014
416683 390156.409 4634709.053 1554.475 1554.47 -0.005
416684 390148.871 4634709.251 1554.444 1554.45 0.006
416685 390141.014 4634709.430 1554.425 1554.43 0.005
416686 390133.026 4634709.574 1554.417 1554.42 0.003
416687 390125.144 4634709.700 1554.401 1554.41 0.009
416688 390117.300 4634709.838 1554.398 1554.4 0.002
416721 389858.084 4634713.470 1553.668 1553.67 0.002
416722 389850.538 4634713.501 1553.673 1553.67 -0.003
416723 389842.815 4634713.528 1553.68 1553.67 -0.01
416724 389835.058 4634713.612 1553.677 1553.67 -0.007
416725 389827.331 4634713.696 1553.668 1553.65 -0.018
416726 389819.647 4634713.722 1553.666 1553.66 -0.006
416727 389811.981 4634713.724 1553.665 1553.67 0.005
416931 389410.429 4635904.924 1569.365 1569.37 0.005
416932 389402.605 4635904.509 1568.843 1568.85 0.007
416933 389395.027 4635904.140 1568.294 1568.29 -0.004
416934 389387.643 4635903.738 1567.708 1567.70 -0.008
416935 389380.422 4635903.271 1567.124 1567.11 -0.014
416936 389373.119 4635902.845 1566.470 1566.45 -0.02
416937 389365.688 4635902.385 1565.796 1565.78 -0.016
Average Dz 0.008
Minimum Dz -0.041
Maximum Dz 0.035
Root Mean Square 0.020
Std. Deviation 0.019
95% Confidence Level 0.039

Washakie & Whites Valley Final Project Report 30 Aero-Graphics, Inc.: Geospatial Services
DEM - NVA Check Point Report
Point Easting Northing Known Z Laser Z Dz
416481 390491.098 4633519.204 1538.03 1538.04 0.01
416482 390490.646 4633526.896 1538.094 1538.11 0.016
416483 390490.19 4633534.538 1538.175 1538.19 0.015
416484 390489.75 4633542.149 1538.256 1538.27 0.014
416485 390489.277 4633549.698 1538.342 1538.36 0.018
416486 390488.768 4633557.163 1538.417 1538.42 0.003
416487 390488.247 4633564.583 1538.487 1538.48 -0.007
416681 390171.911 4634708.732 1554.553 1554.58 0.027
416682 390164.042 4634708.863 1554.516 1554.53 0.014
416683 390156.409 4634709.053 1554.475 1554.48 0.005
416684 390148.871 4634709.251 1554.444 1554.45 0.006
416685 390141.014 4634709.43 1554.425 1554.44 0.015
416686 390133.026 4634709.574 1554.417 1554.41 -0.007
416687 390125.144 4634709.7 1554.401 1554.41 0.009
416688 390117.3 4634709.838 1554.398 1554.4 0.002
416721 389858.084 4634713.47 1553.668 1553.66 -0.008
416722 389850.538 4634713.501 1553.673 1553.66 -0.013
416723 389842.815 4634713.528 1553.68 1553.67 -0.01
416724 389835.058 4634713.612 1553.677 1553.67 -0.007
416725 389827.331 4634713.696 1553.668 1553.65 -0.018
416726 389819.647 4634713.722 1553.666 1553.66 -0.006
416727 389811.981 4634713.724 1553.665 1553.67 0.005
416931 389410.429 4635904.924 1569.365 1569.36 -0.005
416932 389402.605 4635904.509 1568.843 1568.84 -0.003
416933 389395.027 4635904.14 1568.294 1568.29 -0.004
416934 389387.643 4635903.738 1567.708 1567.7 -0.008
416935 389380.422 4635903.271 1567.124 1567.12 -0.004
416936 389373.119 4635902.845 1566.47 1566.46 -0.01
416937 389365.688 4635902.385 1565.796 1565.78 -0.016
416938 389358.238 4635901.936 1565.112 1565.11 -0.002
421701 402800.374 4640355.87 1361.405 1361.43 0.025
421702 402800.229 4640369.391 1361.167 1361.19 0.023
421703 402800.151 4640382.939 1360.96 1360.98 0.02
421704 402800.04 4640396.485 1360.755 1360.78 0.025
421705 402799.969 4640410.036 1360.594 1360.61 0.016
421706 402799.931 4640423.565 1360.452 1360.48 0.028
421707 402799.867 4640437.085 1360.275 1360.31 0.035
421708 402799.77 4640450.595 1360.158 1360.19 0.032
421771 402703.555 4641283.673 1347.208 1347.24 0.032
421772 402698.724 4641296.32 1347.144 1347.18 0.036
421773 402693.905 4641308.952 1347.095 1347.12 0.025
421774 402689.119 4641321.567 1347.087 1347.12 0.033

Washakie & Whites Valley Final Project Report 31 Aero-Graphics, Inc.: Geospatial Services
Point Easting Northing Known Z Laser Z Dz
421775 402684.417 4641334.165 1347.107 1347.13 0.023
421776 402679.878 4641346.825 1347.049 1347.08 0.031
421777 402675.55 4641359.629 1346.98 1347 0.02
422001 402504.563 4644260.368 1354.081 1354.12 0.039
422002 402495.83 4644260.284 1353.75 1353.79 0.04
422003 402485.903 4644260.232 1353.338 1353.37 0.032
422004 402474.736 4644260.254 1352.908 1352.92 0.012
422005 402462.496 4644260.314 1352.428 1352.45 0.022
422006 402449.421 4644260.363 1351.908 1351.92 0.012
422007 402435.925 4644260.416 1351.334 1351.34 0.006
422008 402422.232 4644260.45 1350.783 1350.79 0.007
422251 399650.268 4644225.377 1332.31 1332.28 -0.03
422252 399663.738 4644225.469 1332.281 1332.26 -0.021
422253 399677.216 4644225.636 1332.245 1332.22 -0.025
422254 399690.702 4644225.853 1332.226 1332.2 -0.026
422255 399704.198 4644226.046 1332.208 1332.18 -0.028
422256 399717.722 4644226.245 1332.178 1332.16 -0.018
422257 399731.277 4644226.444 1332.144 1332.11 -0.034
422258 399744.85 4644226.558 1332.098 1332.08 -0.018
422701 401715.876 4647169.773 1347.02 1347.04 0.02
422702 401707.107 4647180.257 1346.936 1346.97 0.034
422703 401698.331 4647190.781 1346.816 1346.84 0.024
422704 401689.526 4647201.353 1346.642 1346.66 0.018
422705 401680.692 4647212.011 1346.395 1346.41 0.015
422706 401671.836 4647222.737 1346.061 1346.07 0.009
422707 401662.968 4647233.506 1345.667 1345.67 0.003
422708 401654.11 4647244.25 1345.25 1345.26 0.01
Average Dz 0.008
Minimum Dz -0.034
Maximum Dz 0.040
Root Mean Square 0.021
Std. Deviation 0.019
95% Confidence Level 0.039

Washakie & Whites Valley Final Project Report 32 Aero-Graphics, Inc.: Geospatial Services
DEM - VVA Check Point Report
Point Easting Northing Known Z Laser Z Dz
482541 390477.735 4633896.435 1544.638 1544.67 0.032
482542 390477.244 4633899.373 1544.836 1544.84 0.004
482543 390476.844 4633902.291 1544.991 1544.99 -0.001
482544 390476.779 4633905.318 1545.147 1545.15 0.003
482545 390477.011 4633908.437 1545.29 1545.32 0.03
482546 390477.446 4633911.707 1545.421 1545.44 0.019
482547 390477.854 4633915.182 1545.566 1545.58 0.014
482548 390478.258 4633918.658 1545.727 1545.76 0.033
482549 390478.553 4633922.082 1545.855 1545.88 0.025
482550 390478.662 4633925.474 1545.964 1545.98 0.016
482551 390478.644 4633928.752 1546.055 1546.03 -0.025
484481 388397.079 4636245.557 1586.776 1586.81 0.034
484482 388400.559 4636245.55 1586.617 1586.65 0.033
484483 388404.124 4636245.541 1586.432 1586.46 0.028
484484 388407.802 4636245.494 1586.225 1586.24 0.015
484485 388411.615 4636245.454 1586.027 1586.06 0.033
484486 388415.542 4636245.412 1585.81 1585.85 0.04
484487 388419.526 4636245.351 1585.599 1585.63 0.031
484488 388423.54 4636245.356 1585.396 1585.43 0.034
484489 388427.6 4636245.338 1585.167 1585.21 0.043
484490 388431.729 4636245.363 1584.92 1584.96 0.04
484491 388435.943 4636245.454 1584.667 1584.7 0.033
484651 388756.699 4635989.658 1568.962 1568.99 0.028
484652 388756.917 4635986.38 1569.152 1569.17 0.018
484653 388757.193 4635982.958 1569.292 1569.32 0.028
484654 388757.492 4635979.579 1569.366 1569.39 0.024
484655 388757.822 4635976.3 1569.4 1569.42 0.02
484656 388758.088 4635973.01 1569.43 1569.44 0.01
484657 388758.324 4635969.664 1569.435 1569.45 0.015
484658 388758.545 4635966.215 1569.406 1569.43 0.024
484659 388758.734 4635962.684 1569.366 1569.4 0.034
484660 388758.927 4635959.111 1569.317 1569.34 0.023
488901 400585.696 4639300.56 1339.183 1339.21 0.027
488902 400584.823 4639303.659 1339.155 1339.22 0.065
488903 400583.96 4639306.816 1339.085 1339.1 0.015
488904 400583.109 4639310.011 1339.014 1339.07 0.056
488905 400582.273 4639313.2 1338.974 1339.03 0.056
488906 400581.488 4639316.186 1338.926 1338.99 0.064
488907 400580.726 4639319.014 1338.85 1338.91 0.06
488908 400579.929 4639321.749 1338.812 1338.84 0.028
488909 400579.11 4639324.527 1338.777 1338.8 0.023
488910 400578.426 4639327.286 1338.686 1338.71 0.024

Washakie & Whites Valley Final Project Report 33 Aero-Graphics, Inc.: Geospatial Services
Point Easting Northing Known Z Laser Z Dz
488911 400577.732 4639330.206 1338.613 1338.65 0.037
488912 400576.988 4639333.151 1338.538 1338.58 0.042
489001 400509.263 4639595.455 1336.369 1336.45 0.081
489002 400508.621 4639597.97 1336.38 1336.43 0.05
489003 400507.815 4639600.908 1336.314 1336.35 0.036
489004 400506.907 4639604.223 1336.28 1336.31 0.03
489005 400505.941 4639607.839 1336.264 1336.34 0.076
489006 400504.997 4639611.645 1336.244 1336.26 0.016
489007 400504.126 4639615.499 1336.242 1336.27 0.028
489008 400503.238 4639619.262 1336.239 1336.25 0.011
489009 400502.311 4639622.946 1336.239 1336.25 0.011
489010 400501.375 4639626.588 1336.248 1336.25 0.002
489011 400500.476 4639630.126 1336.239 1336.24 0.001
492021 401159.542 4647665.328 1341.252 1341.28 0.028
492022 401160.572 4647660.621 1341.116 1341.13 0.014
492023 401161.678 4647655.648 1341.014 1341.02 0.006
492024 401162.808 4647650.359 1340.906 1340.93 0.024
492025 401164.091 4647644.803 1340.793 1340.81 0.017
492026 401165.442 4647639.085 1340.668 1340.69 0.022
492027 401166.815 4647633.2 1340.515 1340.53 0.015
492028 401168.184 4647627.251 1340.364 1340.4 0.036
492029 401169.548 4647621.328 1340.232 1340.27 0.038
492030 401170.908 4647615.435 1340.098 1340.14 0.042
492031 401172.215 4647609.546 1339.965 1340.01 0.045
492681 401926.152 4646909.49 1347.609 1347.66 0.051
492682 401924.072 4646911.886 1347.592 1347.64 0.048
492683 401922.029 4646914.28 1347.561 1347.64 0.079
492684 401919.95 4646916.688 1347.549 1347.58 0.031
492685 401917.883 4646919.146 1347.515 1347.57 0.055
492686 401915.826 4646921.65 1347.478 1347.54 0.062
492687 401913.758 4646924.094 1347.478 1347.53 0.052
492688 401911.744 4646926.372 1347.499 1347.55 0.051
492689 401909.785 4646928.605 1347.507 1347.57 0.063
492690 401907.831 4646930.859 1347.5 1347.57 0.07
492691 401905.826 4646933.17 1347.488 1347.52 0.032
Average Dz 0.032
Minimum Dz -0.025
Maximum Dz 0.081
Root Mean Square 0.038
Std. Deviation 0.020
95th Percentile 0.066

Washakie & Whites Valley Final Project Report 34 Aero-Graphics, Inc.: Geospatial Services
Appendix C
Flight Logs
Date: 04/15/2017 Aircraft: N7269T Sensor: 12 SEN 315
Project: Washakie & Whites Valley Job #: 17046
Flight Plan(s): 3699_H300_GSM_Whites_v2.xml
3699_H300_GSM_Washakie_v2.xml
Flight 1 Flight 2
Wheels Up: 0645 1235
Wheels Down: 1145 1415
Begin Tach: 6817.0 6821.3
End Tach: 6821.3 6823.7
Mobilization Tach: 1.2 1.2
Online Tach: 3.3 1.0
Pilot: Begley Operator: Guenther
Notes: Afternoon lift ended up being extremely bumpy and data was no good on the 2nd lift.
Date: 04/16/2017 Aircraft: N7269T Sensor: 12 SEN 315
Project: Washakie & Whites Valley Job #: 17046
Flight Plan(s): 3699_H300_GSM_Washakie_v2.xml
Flight 1 Flight 2
Wheels Up: 0630 N/A
Wheels Down: 1105 N/A
Begin Tach: 6823.7 N/A
End Tach: 6828.4 N/A
Mobilization Tach: 1.95 N/A
Online Tach: 2.75 N/A
Pilot: Begley Operator: Guenther
Notes: No issues to report. Great conditions this morning.

Washakie & Whites Valley Final Project Report 35 Aero-Graphics, Inc.: Geospatial Services
Appendix D
SOW
Scope of Work on Master Agreement # AV2406 Acquisition of Aerial Lidar Elevation Data
Whites Valley & Washakie Areas The State of Utah, Department of Technology Services, Division of Integrated Technology, Automated Geographic Reference Center (AGRC) and partners are contracting with Aero-Graphics, Inc. to acquire, process, and deliver aerial Lidar data and derivative products that meet the specifications described in this Scope of Work, and contracted under Master Agreement #AV2406. This Scope of Work (SOW) identifies the specific acquisition requirements, production specifications and standards, deliverables, and schedule for Lidar data collection and deliverable data products that adhere to the U.S. Geological Survey (USGS) Quality Level 1 (QL1) Lidar specifications for the entire area defined in this agreement. The Lidar data will be acquired in the Spring of 2017 with leaf-off conditions and no snow on the ground. Pricing will be based on the cost submitted in the bid response to Solicitation #WS16020-Stage 2 for Washakie and Whites Valley project areas by Aero-Graphics, Inc.
1. Lidar Data Products The lidar data product must adhere to USGS National Geospatial Program (NGP) Lidar Base Specification Version 1.2 (2014) available at http://pubs.usgs.gov/tm/11b4/. These lidar specifications are required minimum baseline specifications and project deliverables shall meet or exceed USGS QL1, as specified per project area. For any item which is not specifically addressed, the referenced Lidar Base Specification Version 1.2 will be the required specification authority.
2. Project Areas, Performance Period, and Acquisition Modifications
The State of Utah 2017 Lidar Acquisition Project (“Project”) covers portions of Utah shown in
Washakie & Whites Valley - Figure 1.png, and are delineated in Washakie & Whites Valley -
Attachment 1.zip (Whites_Valley.shp and Washakie.shp).
2.1. Project Area
The Project acquisition areas total approximately 26.2 mi2 in northern Utah shown in
Figure 1. Further explanation of the project areas is explained in Section 2.1.1. For the
contracted acquisition areas, the delivered data products must cover at least the spatial
extent (footprint) of the acquisition areas delineated in Attachment 1. Any acquisition
footprints that extend beyond Attachment 1 are acceptable, and if data is acquired
outside these footprints, at least the raw point cloud data shall be provided.

Washakie & Whites Valley Final Project Report 36 Aero-Graphics, Inc.: Geospatial Services
2.1.1. Washakie and Whites Valley
The Washakie area 12.24 mi2 and Whites Valley area 13.89 mi2 total
approximately 26.2 mi2. Lidar acquisition in these areas require QL1
specifications.
Figure 1: Acquisition Areas
2.2. Performance Period
For the areas described in Section 2.1. the acquisition shall be in the Spring of 2017,
maximizing leaf-off conditions, low water levels, and no snow on the ground (such as,
may be encountered during October and/or November and later.
2.3. Acquisition Modifications
Any additions or modifications to the lidar project areas (including areas located outside of Utah), by either the State or the other cooperators, will adhere to the data deliverables, standards, specifications criteria, and inspection process described in this SOW. Any changes after initial contracts are negotiated will be made through the agreed upon contract amendment process.

Washakie & Whites Valley Final Project Report 37 Aero-Graphics, Inc.: Geospatial Services
3. Delivery and Quality Assessment and Acceptance Schedule
The Lidar data acquisition schedule will be agreed to by the State and Aero-Graphics, Inc. based on actual weather and on-the-ground conditions after the contract has been approved. This schedule may include a small initial pilot delivery, selected from within the project areas, to ensure that data meets the specifications and conditions of the contract.
A formal data product delivery schedule will be agreed to by AGRC and Aero-Graphics, Inc. after the contract has been approved and may be modified by changes in the acquisition schedule. Lidar acquisition should be timed to ensure the ground is free of snow, ice and standing water, rivers are free of ice and are at a stage of low flow, and lakes and reservoirs are close to the lowest levels of the year. Leaf-off vegetation conditions are preferred and lidar penetration to the ground must be adequate to produce a bare-earth surface DEM that meets or exceeds requirements for vertical accuracy.
The anticipated schedule of delivery and quality assurance is as follows:
● Flight of contracted area for data product. ○ Length of acquisition time to be determined by Aero-Graphics, Inc. in
collaboration with AGRC. ● Process and deliver all data products to AGRC for initial inspection and review.
○ AGRC has 30 days to review and submit correction requests. ● Aero-Graphics, Inc. addresses initial review comments and redelivers areas to AGRC for
final inspection. ○ Aero-Graphics, Inc. has 20 days to redeliver with corrections.
● AGRC final inspection and review. ○ AGRC has 20 days to review and submit correction requests.
● Aero-Graphics, Inc. addresses final review comments and delivers final and complete data products to AGRC.
○ Aero-Graphics, Inc. has 20 days to redeliver final data product.
If it is not possible to rework the data to correct error(s), a reflight of that area may be required.
3.1. Inspection Schedule
An inspection schedule for quality assurance of all products will be developed between Aero-Graphics, Inc. and AGRC. Aero-Graphics, Inc. shall document its internal quality assurance work as described in Section 6. A review committee designated by AGRC will quality check the lidar products. The USGS National Geospatial Technical Operations Center (NGTOC) will also be used to ensure that the delivered data products meet the requirements of the USGS NGP Lidar Base Specification Version 1.2 (2014) and The National Map: 3D Elevation Program (3DEP) set forth in this SOW. Deliverables will not be accepted without acceptance by the USGS NGTOC. The inspection period for each initial data product delivery will be up to 30-calendar days; these inspection periods may be concurrent. Review of any redelivery of data with corrections will be completed within 20-calendar days of receipt. If collection conditions necessitate the need for a later acquisition, AGRC, and Aero-Graphics, Inc. can modify this date through a contract amendment. Deliveries will be made to AGRC.
4. Access to Lands and Airspace

Washakie & Whites Valley Final Project Report 38 Aero-Graphics, Inc.: Geospatial Services
Aero-Graphics, Inc. is responsible for applying for and obtaining all required permits, clearances, permissions, etc. for access, over-flight, or intrusion to restricted or otherwise limited ground access and/or airspace, which may be included within the requirement of this project. AGRC can assist with expediting these processes where possible.
5. Data Product Deliverables
See the USGS NGP Lidar Base Specifications Version 1.2 (2014) (http://pubs.usgs.gov/tm/11b4/) “Data Processing and Handling” section and Section 15 “Cited Specifications and Standards” for requirements on the processing and handling of the lidar data.
5.1. Metadata
Descriptive information about the project to include textual reports, graphics, supporting shapefiles, and Federal Geographic Data Committee (FGDC) compliant metadata files are required. See National Spatial Data Infrastructure (NSDI) Content Standards for Digital Geospatial Metadata (FGDC, 1998) and Lidar Base Specifications Version 1.2 (USGS, 2014) “Metadata” section for metadata requirements for this project.
A current Product Characterization Report of the instrument used shall be included in the Project History Report/Folder (Section 6) as a deliverable.
5.2 Raw Point Cloud
Raw point cloud deliverables shall include or conform to the following procedures and
specifications:
● No classifications are required; however, Overage (overlap) and Withheld Flags will be properly set.
● All collected points, fully calibrated, georeferenced, and adjusted to ground, organized and delivered in their original swaths, one file per swath, one swath per file.
● If production processing required segmentation of the swath files, the requirements listed in the section “Swath Size and Segmentation,” shall be met.
● Fully compliant LAS Specification version 1.4, Point Data Record Format 6, 7, 8, 9, or 10.
● If collected, waveform data in external auxiliary files with the extension .wdp. See the LAS Specification version 1.4 (American Society for Photogrammetry and Remote Sensing, 2011) for additional information.
● Correct and properly formatted georeference information as Open Geospatial Consortium (OGC) well known text (WKT) in all LAS file headers.
● GPS times recorded as Adjusted GPS Time at a precision sufficient to allow unique timestamps for each pulse.
● Intensity values, normalized to 16-bit. See the LAS Specification version 1.4 (American Society for Photogrammetry and Remote Sensing, 2011) for additional information.
● A report of the assessed relative vertical accuracy of the point cloud (smooth surface repeatability and overlap consistency). Relative vertical accuracy requirements are listed in table 2. Raw swath point cloud data shall meet the

Washakie & Whites Valley Final Project Report 39 Aero-Graphics, Inc.: Geospatial Services
required accuracy levels before point cloud classification and derivative product generation.
● A report of the assessed absolute vertical accuracy (NVA only) of the unclassified lidar point data in accordance with the guidelines set forth in the Positional Accuracy Standards for Digital Geospatial Data (American Society for Photogrammetry and Remote Sensing, 2014). Absolute vertical accuracy requirements using the ASPRS methodology for the raw point cloud are listed in table 4. Raw swath point cloud data shall meet the required accuracy levels before point cloud classification and derivative product generation.
5.3 Classified Point Cloud
Classified point cloud deliverables shall include or conform to the following procedures
and specifications:
● All project swaths, returns, and collected points, fully calibrated, adjusted to ground, and classified, by tiles. Project swaths exclude calibration swaths, cross-ties, and other swaths not used and not intended to be used, in product generation.
● Fully compliant LAS Specification version 1.4 Point Data Record Format 6, 7, 8, 9, or 10.
● If collected, waveform data in external auxiliary files with the extension .wdp. See the LAS Specification version 1.4 (American Society for Photogrammetry and Remote Sensing, 2011) for additional information.
● Correct and properly formatted georeferenced information as OGC WKT included in all LAS file headers.
● GPS times recorded as Adjusted GPS Time at a precision sufficient to allow unique timestamps for each pulse.
● Intensity values, normalized to 16-bit. See the LAS Specification version 1.4 (American Society for Photogrammetry and Remote Sensing, 2011) for additional information.
● Tiled delivery, without overlap, using the project tiling scheme. ● Classification, as defined below.
Code/Class Description
1 Processed, but unclassified
2 Bare earth
7 Low noise
9 Water
10 Ignored ground (near a breakline)
17 Bridge decks
18 High noise

Washakie & Whites Valley Final Project Report 40 Aero-Graphics, Inc.: Geospatial Services
5.4 Bare-Earth Surface (Raster DTM), Hydro-Flattening, and Breaklines
Bare-earth deliverables include the following:
● Bare-earth DEM with hydro-flattening (see section 5.4.1 Hydro-Flattening). ● Cell size no greater than 0.5 meters and no less than the design Nominal Pulse
Spacing (NPS) for QL1 collections. ● Delivery in an industry-standard, GIS-compatible, 32-bit floating point raster
format (ESRI Grid preferred). ● Georeference information shall be included in each raster file. ● Tiled delivery, without overlap, using Project Tiling Scheme (section 7). ● DEM tiles will show no edge artifacts or mismatch. A quilted appearance in the
overall project DEM surface, whether caused by differences in processing quality or character between tiles, swaths, lifts, or other non-natural divisions, will be cause for rejection of the entire deliverable.
● Void areas shall be coded using a unique ‘NODATA’ value. This value shall be identified in the appropriate location within the raster file header or external support files (for example, .aux).
● A report on the assessed absolute vertical accuracy (NVA and VVA) of the bare-earth surface in accordance with the guidelines set forth in the “Positional Accuracy Standards for Digital Geospatial Data” (American Society for Photogrammetry and Remote Sensing, 2014).
● The following thresholds represent the minimum vertical accuracy requirements using the NDEP/ASPRS methodology:
■ NVA ≤ 19.6 cm, 95% Confidence Level (≤10 cm RMSEz) ■ VVA ≤ 29.4 cm, 95% Confidence Level (≤10 cm RMSEz) ■ All Quality Assurance/Quality Control (QA/QC) analysis materials
and results are to be delivered to the State. ● Depressions (sinks), natural or man-made, are not to be filled (as in hydro-
conditioning and hydro-enforcement). ● Permanent islands 1 acre or larger shall be delineated within all water bodies.
5.4.1. Hydro-Flattening
● Hydro-flattening shall be applied to all water within the main channels of rivers and streams, along with all water bodies or impoundments, natural or man-made, that are larger than 2 acres in area (approximately equal to a round pond 350 feet in diameter), and to all streams that are nominally wider than 100 feet, and to all non-tidal boundary waters bordering the project area regardless of size are to be hydro-flattened within the delivered DEMs. Refer to Lidar Base Specifications Version 1.2 (USGS, 2014) “Hydro-Flattening” section for further explanation.
● Hydro-flattened water bodies (lake and ponds) are leveled at a single elevation and streams and rivers are conditioned for continuous downhill flow.
● Hydro-flattened/Bare-earth surface must cover the entire water body and leave no holes in the center. This can be done with interpolation and does not require lidar collection over the entire water body.
● All hydro-flattened areas should have pleasing aesthetic appearance. ● The methodology used for hydro-flattening is at the discretion of Aero-
Graphics, Inc. Refer to the “Digital Elevation Model Hydro-Flattening” section and “Appendix 2. Hydro-Flattening Reference” in the Lidar Base

Washakie & Whites Valley Final Project Report 41 Aero-Graphics, Inc.: Geospatial Services
Specifications Version 1.2 for detailed discussions concerning hydro-flattening.
● The bare-earth DEM data should keep intact all road culverts and similar features, regardless of size, defined as having earth between the road surface and the top of the structure.
● Bridges are required to be removed from the bare-earth DEM. Streams and rivers should be continuous at bridge locations.
5.4.2. Breaklines
All breaklines used for hydro-flattening are to be delivered in a shapefile and/or geodatabase format as PolylineZ or PolygonZ feature classes. See Lidar Base Specifications Version 1.2 (USGS, 2014) “Breaklines” section for breakline requirements.
5.5 First Return Surface (Raster DSM)
First-return deliverables include the following:
● First return DEM (for example, highest hit). ● Cell size no greater than 0.5 meters and no less than the design Nominal Pulse
Spacing (NPS) for QL1 collections. ● Delivery in an industry-standard, GIS-compatible, 32-bit floating point raster
format (ESRI Grid preferred). ● Georeference information shall be included in each raster file. ● Tiled delivery, without overlap, using Project Tiling Scheme (Section 7). ● DEM tiles will show no edge artifacts or mismatch. A quilted appearance in the
overall project DEM surface, whether caused by differences in processing quality or character between tiles, swaths, lifts, or other non-natural divisions, will be cause for rejection of the entire deliverable.
Void areas shall be coded using a unique ‘NODATA’ value. This value shall be identified
in the appropriate location within the raster file header or external support files (for
example, .aux).
5.6 Intensity Images
● 0.5 m resolution intensity images in 8-bit grayscale GeoTIFF format for QL1
collections.
6. Contractor’s Project History Report/Folder
Aero-Graphics, Inc. will compile and provide a project history report/folder upon conclusion of the lidar acquisition. This folder will be used by AGRC in the inspection process for the lidar. The report/folder, will contain, at a minimum, the following:
● Methods o A record of field work procedures.

Washakie & Whites Valley Final Project Report 42 Aero-Graphics, Inc.: Geospatial Services
o Data derivation and adjustments. o Processing report detailing calibration, classification, and product generation
procedures including methodology used for breakline collection and hydro-flattening.
o Any problems encountered and solutions used in resolving such problems. ● Correspondence and records
o The Statement of Work (SOW) between AGRC and Aero-Graphics, Inc. o All production guidance received from AGRC to include all written guidance
from telephone conferences, emails, or contractual modifications, or any other source.
o Lidar acquisition methods; results; Aero-Graphics, Inc. accuracy assessments, including internal reproducibility and absolute accuracy; file formats; file-naming schemes; and tiling schemes.
● Flight information o Aircraft trajectory log
▪ SBET files (smooth, best, estimated trajectory) detailing aircraft position (easting, northing, elevation), angle, rotation (heading, pitch, and roll), and GPS time, recorded at regular intervals of ≤ 1 second. May include additional attributes (ASCII text or shapefile and .dbf format).
o Statistical report summarizing the results of the airborne GPS adjustment and the overall accuracy of the adjusted IMU data.
o Collection report detailing mission planning and flight logs. ● Control
o Survey Report detailing the collection of control and reference points used for calibration and QA/QC.
o The documentation for the identity, published position, and measured position of all existing National Geodetic Survey (NGS) marks used for reference stations.
● Quality Assurance/Quality Control (QA/QC) o QA/QC Reports (detailing the analysis, accuracy assessment and validation
of: ● The point data (absolute, within swath, and between swath) ● The bare-earth surface (absolute) ● Other optional deliverables as appropriate
o Quality control procedures and results. o All internal quality control checklists. o Internal quality control error calls and the corrective actions taken to correct
the error(s). o All Aero-Graphics, Inc. QA validation reports/error reports and accuracy
reports, generated from internal software QA programs demonstrating that the data meets requirements as stated in the SOW.
7. Tiling Scheme
A single non-overlapped tiling scheme for both data products will be established and agreed upon by AGRC and Aero-Graphics, Inc. before each collection. This scheme will be used for ALL tiled deliverables.

Washakie & Whites Valley Final Project Report 43 Aero-Graphics, Inc.: Geospatial Services
Tiling for the Lidar deliverables will be based on the U.S. National Grid and should be named according to the U.S. National Grid System based on the SW corner (ex. 12TVK060160). Tiles will be 2,000-meter x 2,000-meter tiles with the exception of tiles around the periphery of the project area that are better suited for 1,000-meter x 1,000-meter tiles. 1,000-meter x 1,000-meter tiles will be used for the .las point cloud files.
● Tile size is required to be an integer multiple of 0.5 meters for raster deliverables. ● Tiles are required to be sized using the same units as the coordinate system of the data. ● Tiles are required to be indexed in X and Y to an integer multiple of the tile’s X-Y
dimensions. ● All tiled deliverables will conform to the project tiling scheme, without added overlap. ● Tiled deliverables will edge-match seamlessly and without gaps.
7.1. Void Areas
The extent of lidar coverage over the project area shall be sufficient to ensure void areas do not exist within the project area. Void areas within delivered tiles and within the project area are not acceptable.
8. Delivery Medium and Format
Deliverables shall be delivered on USB3 compatible portable hard drives using an uncompressed and unencrypted NTFS file system. Delivery tiles shall be accompanied by an index shapefile, of the tiles delivered, suitable for loading into ArcMap.
All data and products associated with contract deliverables will meet or exceed relevant National Standard for Spatial Data Accuracy (NSSDA) standards. See NSDI Geospatial Positioning Accuracy Standards, Part 3: National Standard for Spatial Data Accuracy (FGDC, 1998).
At the completion of the project, after all deliverables have been accepted by AGRC, Aero-Graphics, Inc. will deliver hard drives containing all the finalized deliverables for the project, and become the property of the State of Utah.
9. Data Acquisition Requirements and Collection Conditions Refer to Lidar Base Specification Version 1.2 (2014) for the following specifications:
● Acquisition requirements ● Collection conditions
9.1. Additional Data Acquisition Requirements
● Instrument calibrated for every mission. ● Flight plans are parallel flight lines with a cross-tie at/and or near the end of each
project flightlines. ● Flight plan considers requirements for point density, terrain, PDOP (positional
dilution of position), and Geomagnetic Kp Index (see http://www-app3.gfz-potsdam.de/kp_index/description.html).

Washakie & Whites Valley Final Project Report 44 Aero-Graphics, Inc.: Geospatial Services
● The intensity values (signal strength) of each return pulse will be recorded in the LAS, in their files native radiometric resolution.
● In order to prevent clustering effects and ensure uniform densities throughout the data set, a regular 1 x 1 meter grid will be laid over the data. At least 90% of the cells in the grid shall contain the requisite number of points per square meter (ppsm).
10. Standards, Specifications, and Requirements Refer to Lidar Base Specification Version 1.2 (2014) for the following specifications:
● Quality Level 1 and Quality Level 2 Specifications ● Vertical Accuracy Requirements ● Positional Accuracy Validation ● Relative Accuracy Requirements ● Completeness of coverage
10.1. Projection and Mapping Units
● Projection (Coordinate System): Universal Transverse Mercator (UTM) Zone 12, NAD 83, Meters; NAVD88, Meters (NAD_1983_2011_UTM_Zone_12N).
● Mapping Units: Meters (UTM). ● Vertical Reference: Orthometric Heights, Meters. ● WKID: 6341 Authority: EPSG
10.2. Datums
All data collected must be tied to the datums listed below:
● Horizontal Datum: o North American Datum of 1983 / High Accuracy Resolution Network
adjustment (NAD 83 [2011] / HARN) required. ● Vertical Datum:
o North American Vertical Datum 1988 (NAVD88), using latest geoid model available from the NGS (for example, GEOID12B). All vertical units will be measured in meters.
● Geoid Model: o The most recent NGS approved geoid model is required to perform
conversions from ellipsoidal heights to orthometric heights.
10.3. Usability
● Files shall have consistent internal formats. ● Aero-Graphics, Inc. shall propose all details of file names and file formats that
are not specified here. Proposed names and formats must be approved by AGRC.
● Files may be gzip or zip compressed. Use of compression shall be lossless and uniform across a given data layer.
● GIS data (ESRI grids, shapefiles) shall have complete and correct associated projection, metadata, and sidecar files.
● All files must be readable and free of malicious code.

Washakie & Whites Valley Final Project Report 45 Aero-Graphics, Inc.: Geospatial Services
10.4. GPS Procedures
10.4.1. GPS Measurements
All GPS measurements shall be made with dual frequency Global Navigation Satellite System (GNSS) receivers with GLONASS. All GPS measurements shall be made during periods with PDOP ≤ 3.0 and with at least six satellites in common view of both a stationary reference receiver and the roving receiver.
10.4.2. Stationary Reference Receivers
Stationary reference receivers shall be located at existing NGS marks or at new marks. In the case of an existing mark, its location shall be verified by processing one GPS session of at least two hours duration and comparing the computed position with the position published by NGS. Each new mark shall be located by tying to one or more NGS Continuously Operating Reference Stations (CORS) by static GPS methods. If the distance to the nearest CORS is less than 80 km, use at least two independent GPS sessions, each at least two hours long. If the distance to the nearest CORS is greater than 80 km, use at least two sessions each at least four hours long.
10.4.3. GPS Reference Receivers
At least two GPS reference receivers shall be in operation during all lidar missions, sampling positions at ≥1 Hz. The roving GPS receiver in the aircraft shall sample positions at ≥ 2 Hz. Differential GPS baseline lengths shall be no longer than 30 km. Check Points, Ground Control Points (GCPs), or ground survey points used for both survey calibration and assessment of absolute vertical accuracy, shall be established using GPS and (or) other techniques that are expected to result in accuracies of 1.5 cm (RMSEz) or better. Strongly clustered GCPs are useful, perhaps even desirable, for calibration. Vertical accuracy shall be assessed by calculating and averaging the distances between a subset of at least 30 GCPs that are not clustered and a surface interpolated from lidar first returns. At least 20% of flight line swaths should contain points in this subset and the maximum distance between these GCPs should be no less than one-half the maximum distance across the survey area.
10.4.4. Project History Report/Folder
Aero-Graphics, Inc. Project History Report/Folder (Section 6) shall document the identity, published position, and measured position of all existing NGS marks used for reference stations. The locations of new marks shall be described, along with their measured positions and the identity and published positions of CORS to which their locations were tied. The report shall describe the technique(s) used to establish GCPs and document the positions and residuals of all GCPs used to evaluate survey accuracy.
10.5. Ground Control
Two types of vertical accuracy GCP (or ground surveyed points) will be collected by Aero-Graphics, Inc. for this project: Control Points and Check Points. Refer to NSSDA guidelines, Lidar Base Specifications Version 1.2 (USGS, 2014) “Collection” section, and

Washakie & Whites Valley Final Project Report 46 Aero-Graphics, Inc.: Geospatial Services
ASPRS Guidelines, Vertical Accuracy Reporting for Lidar Data (ASPRS, 2004) “2.3 Selecting and Collecting Check Points” section for Check Point placement in land cover classes and guidelines on Check Points.
● The above two types of ground control will be clearly labeled and delivered as separate shapefiles to the State.
10.6. Supplemental Ground Control
Differentially corrected or real time GPS network (RTK) GPS ground control used to supplement the airborne GPS positional adjustment shall be stored on portable media, in a non-proprietary format mutually agreeable to AGRC and Aero-Graphics, Inc. Ground control is the responsibility of Aero-Graphics, Inc.
10.6.1. Utah Reference Network
AGRC maintains The Utah Reference Network (http://gis.utah.gov/#gps) of over 90 GPS VRS RTK stations and will facilitate use of this network upon request of Aero-Graphics, Inc.
11. Data Release, Data Use and Distribution Rights
11.1. Data Release
Aero-Graphics, Inc. will not release data produced in each project plan, to any other party or entity without approval by AGRC, prior to the processing, loading, incorporation, and AGRC’s final acceptance of data products.
11.2. Data Use and Distribution Rights
After final acceptance has been made, all deliverable data and documentation will be free from restrictions regarding use and distribution (the State of Utah and partners require unrestricted rights to all delivered data and reports that are placed in the public domain). Data and documentation provided under this project plan shall be in the public domain and freely distributable by Federal, State, and local government agencies.

Washakie & Whites Valley Final Project Report 47 Aero-Graphics, Inc.: Geospatial Services
13. Project Communication
13.1. Production Status Reports
Aero-Graphics, Inc. shall provide weekly status reports for all work on projects to AGRC’s Project Manager. Reports will include detailed information regarding the work accomplished for each production phase. An online website may be used to provide status information.
13.2. Acquisition Reports
Aero-Graphics, Inc. shall provide regular progress updates to AGRC’s Project Manager throughout the data acquisition process.
● Update frequency shall be based upon the collection period, but no less than once a week.
● Reports shall include shapefiles representing the geographic extent of the acquired data.
● Updates shall commence at acquisition onset and shall continue until acquisition is complete.
13.3. Initial Project Meeting
An initial project meeting between AGRC and Aero-Graphics, Inc. will be scheduled after each project request. This meeting will ensure that both AGRC and Aero-Graphics, Inc. 1) understand the requirements necessary to produce the deliverables, 2) review source data, and 3) make any final adjustments to technical guidance.
13.4. Teleconference
Aero-Graphics, Inc. will teleconference regularly (weekly or as needed) with the State to discuss status, production, and technical issues during a project.
14. Delivery Date and Timely Completion
14.1. Delivery Date
AGRC and Aero-Graphics, Inc. will agree in writing to a delivery schedule for Lidar products. Deliver for all final Lidar products, including any redeliveries because of quality assurance rejection, is no later than September 31, 2017. Aero-Graphics, Inc. shall not exceed this date without agreement to a new date from AGRC. Any request for modifications of the final delivery date must be received 30 days prior to the expiration of the original date. Request will only be considered for reasons outside Aero-Graphics, Inc. control, such as unforeseen weather changes.
14.2. Timely Completion
The payment schedule shall include penalties for late delivery of products. The payment schedule will be based on 40% of the total project cost after completion of the lidar

Washakie & Whites Valley Final Project Report 48 Aero-Graphics, Inc.: Geospatial Services
acquisition flights. After the completion of processing and corrections based on the quality assurance review by AGRC, and delivery of the final product(s) to AGRC, payment will be made as follows. If delivered on time as specified in the contract, another 30% of the total project cost will be paid. There will be a 30% holdback that will be paid after that final delivery of all data and required reports and metadata deliveries are confirmed by AGRC. If the final product(s) is not delivered on the schedule specified, there will be a 3% (of the total bid) penalty for each week the product delivery is delayed.
15. List of Cited Specifications and Standards
Specifications for the acquisition of Lidar and deliverables not explicitly outlined above must adhere to the required specifications in the following documents:
Proponent Agency/ Organization
Name Published
Date Website
American Society for Photogrammetry and Remote Sensing (ASPRS)
LAS Specification Version 1.4
July 2011 http://www.asprs.org/a/society/committees/standards/LAS_1_4_r13.pdf
U.S. Geological Survey, National Geospatial Program (USGS NGP)
Lidar Base Specifications Version 1.2
2014 http://pubs.usgs.gov/tm/11b4/
Federal Geographic Data Committee (FGDC)
National Spatial Data Infrastructure (NSDI) Geospatial Positioning Accuracy Standards, Part 3: National Standard for Spatial Data Accuracy
1998 http://www.fgdc.gov/standards/projects/FGDC-standards-projects/accuracy/ part3/chapter3
National Digital Elevation Program (NDEP)
NDEP Guidelines for Digital Elevation Data
May 2004 http://www.ndep.gov/NDEP_Elevation_Guidelines_Ver1_10May2004.pdf
FGDC NSDI Content Standard for Digital Geospatial Metadata
1998 http://www.fgdc.gov/standards/projects/FGDC-standards-projects/metadata/ base-metadata/v2_0698.pdf
Federal Emergency Management Agency (FEMA)
Guidance for Flood Risk Analysis and Mapping: Elevation Guidance
Nov. 2015 http://www.fema.gov/media-library-data/1449865619080-7895ba81cd9b94c6d9ac125bb1958e0c/Elevation_Guidance_Nov_2015.pdf
FGDC United States National Grid
December 2001
http://www.fgdc.gov/standards/projects/FGDC-standards-projects/usng/fgdc_std_011_2001_usng.pdf
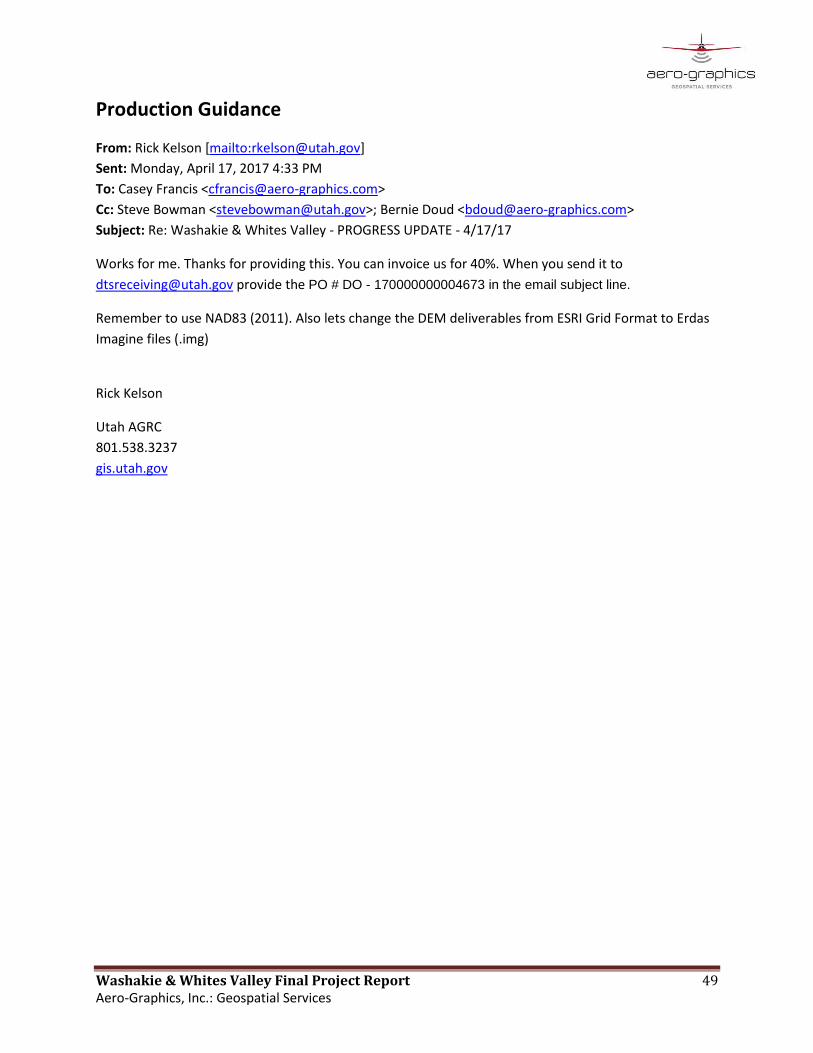
Washakie & Whites Valley Final Project Report 49 Aero-Graphics, Inc.: Geospatial Services
Production Guidance
From: Rick Kelson [mailto:[email protected]]
Sent: Monday, April 17, 2017 4:33 PM
To: Casey Francis <[email protected]>
Cc: Steve Bowman <[email protected]>; Bernie Doud <[email protected]>
Subject: Re: Washakie & Whites Valley - PROGRESS UPDATE - 4/17/17
Works for me. Thanks for providing this. You can invoice us for 40%. When you send it to
[email protected] provide the PO # DO - 170000000004673 in the email subject line.
Remember to use NAD83 (2011). Also lets change the DEM deliverables from ESRI Grid Format to Erdas
Imagine files (.img)
Rick Kelson
Utah AGRC
801.538.3237
gis.utah.gov
Top Related