


Languages
Pages
Legal

Walk Before You Run:
Starting the Climb up the
Analytics Ladder
Rob Ende
Vice President, Supply Chain
INFORMS NY - October 21, 2009
2
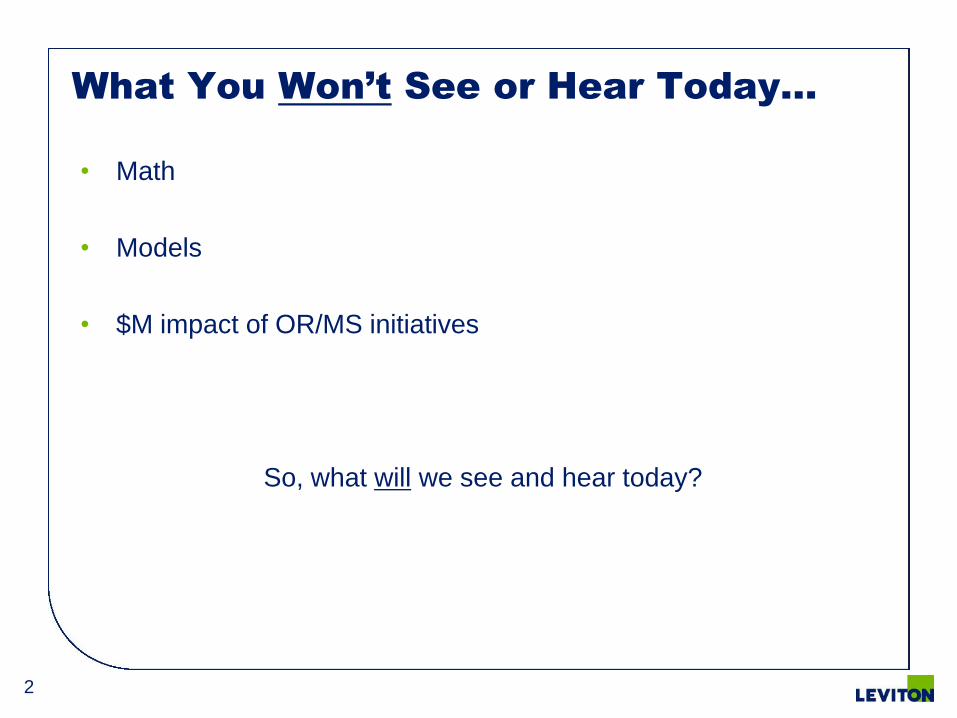
What You Won’t See or Hear Today…
• Math
• Models
• $M impact of OR/MS initiatives
So, what will we see and hear today?

3
Agenda
• My background
• Leviton company overview
• Analytics at Leviton
– Framework: Analytical Competition
– Current state & challenges
– Approach to date
– Examples
– Future opportunities
• Questions & discussion

4
My Background
• B.S. in Aerospace Engineering at Penn State
• M.S. in Aeronautics and Astronautics at Stanford
• Grumman Aerospace Corporation – Aerodynamics Engineer
• MBA (and “Cohort Geek”) at Wharton
• Boston Consulting Group
• Arrow Electronics
– Supply Chain Analysis & Optimization group
– INFORMS Roundtable
– INFORMS Practice Conference presentation 2006
• Leviton Manufacturing Company since 2008
5
Agenda
• My background
• Leviton company overview
• Analytics at Leviton
– Framework: Analytical Competition
– Current state & challenges
– Approach to date
– Examples
– Future opportunities
• Questions & discussion
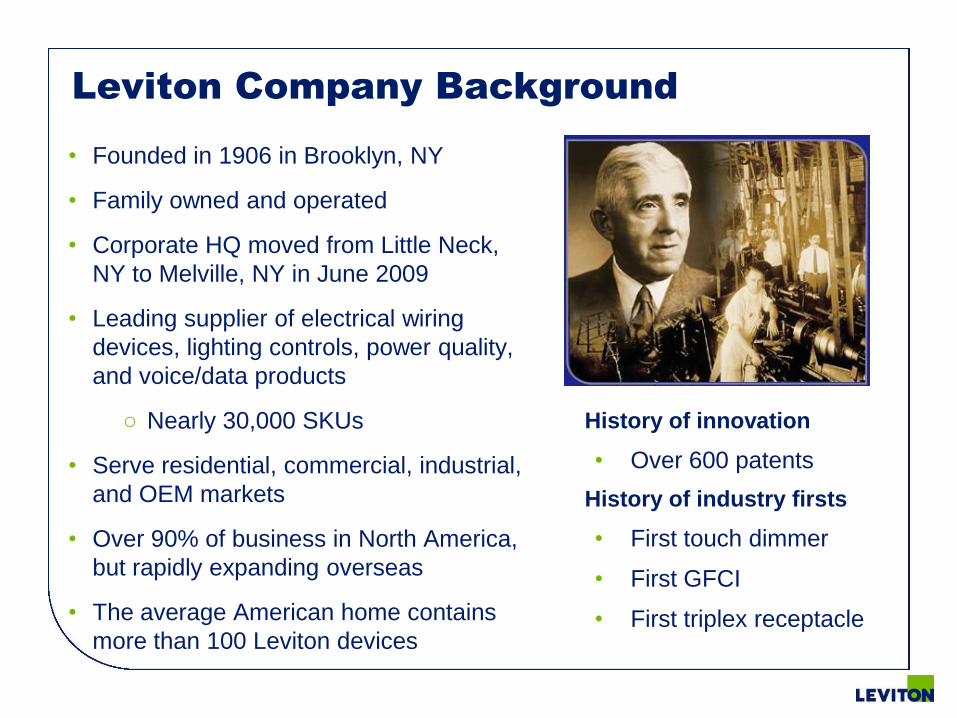
Leviton Company Background
• Founded in 1906 in Brooklyn, NY
• Family owned and operated
• Corporate HQ moved from Little Neck,
NY to Melville, NY in June 2009
• Leading supplier of electrical wiring
devices, lighting controls, power quality,
and voice/data products
○ Nearly 30,000 SKUs
• Serve residential, commercial, industrial,
and OEM markets
• Over 90% of business in North America,
but rapidly expanding overseas
• The average American home contains
more than 100 Leviton devices
•History of innovation
• Over 600 patents
•History of industry firsts
• First touch dimmer
• First GFCI
• First triplex receptacle
7
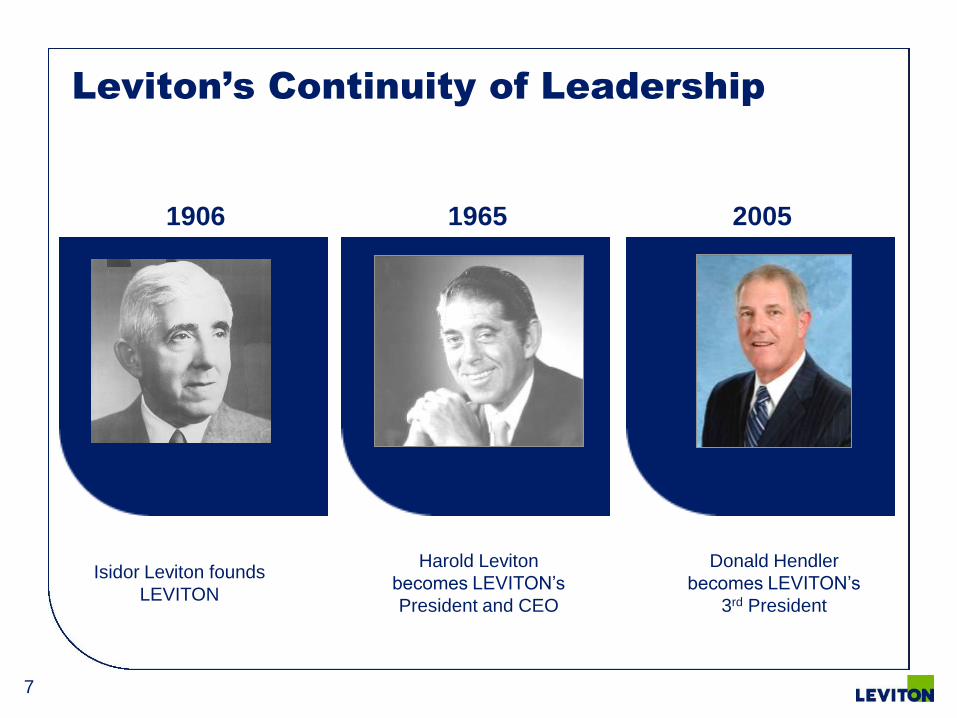
19651906 2005
Leviton’s Continuity of Leadership
Harold Leviton
becomes LEVITON’s
President and CEO
Isidor Leviton founds
LEVITON
Donald Hendler
becomes LEVITON’s
3rd President

8
Business Units
•Residential Products
• Wiring Devices
• Lighting Controls
• Home Automation
• Integrated Networks
• Home Entertainment
9
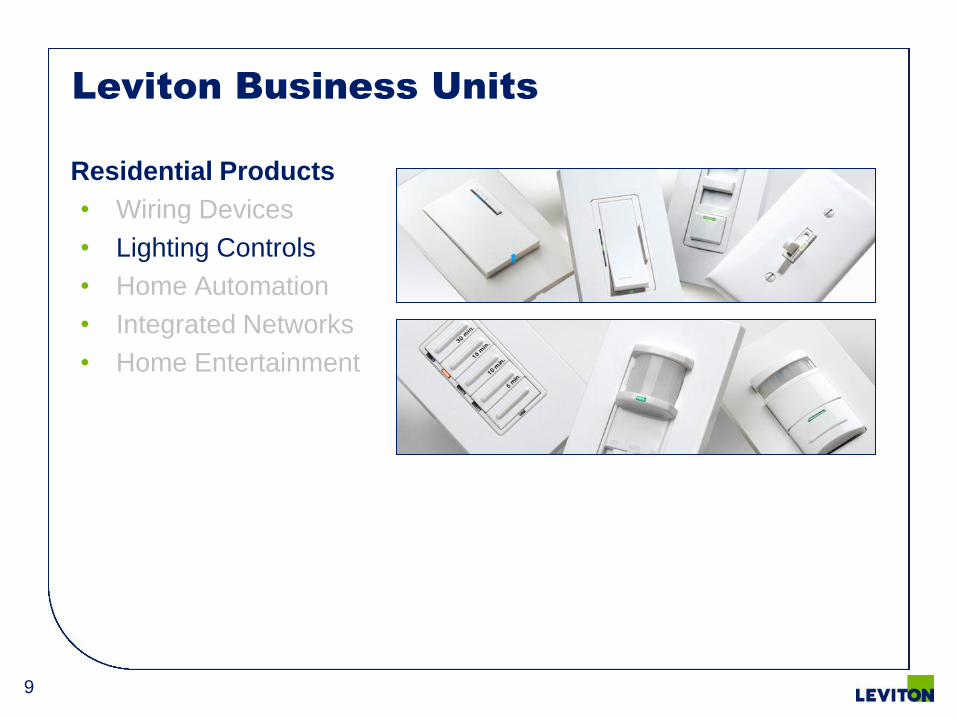
Leviton Business Units
•Residential Products
• Wiring Devices
• Lighting Controls
• Home Automation
• Integrated Networks
• Home Entertainment
10
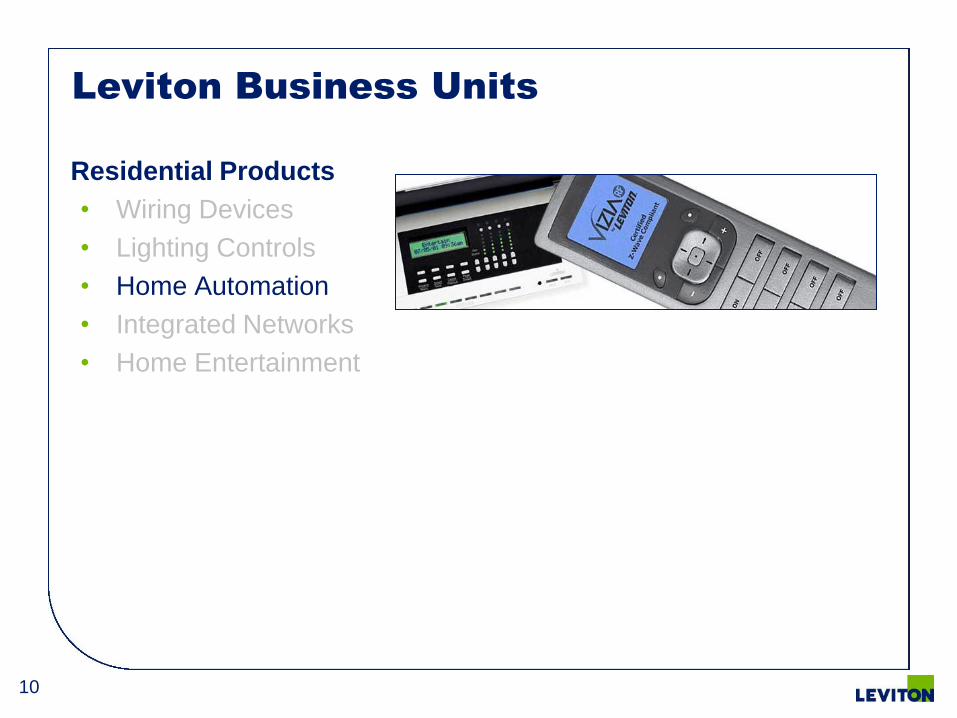
Leviton Business Units
•Residential Products
• Wiring Devices
• Lighting Controls
• Home Automation
• Integrated Networks
• Home Entertainment
11
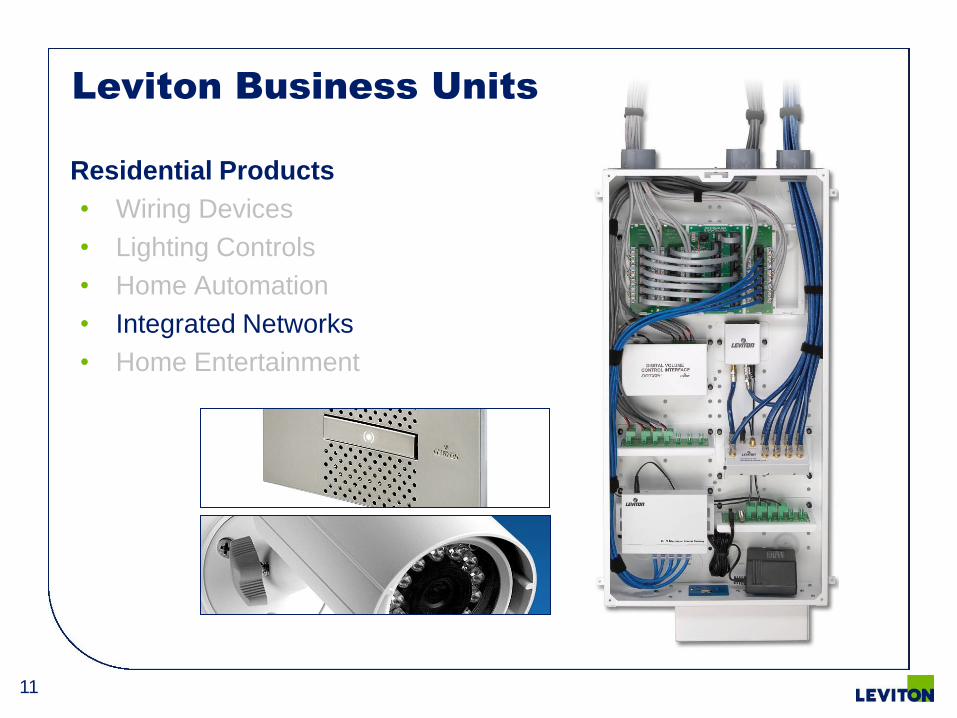
Leviton Business Units
•Residential Products
• Wiring Devices
• Lighting Controls
• Home Automation
• Integrated Networks
• Home Entertainment
12
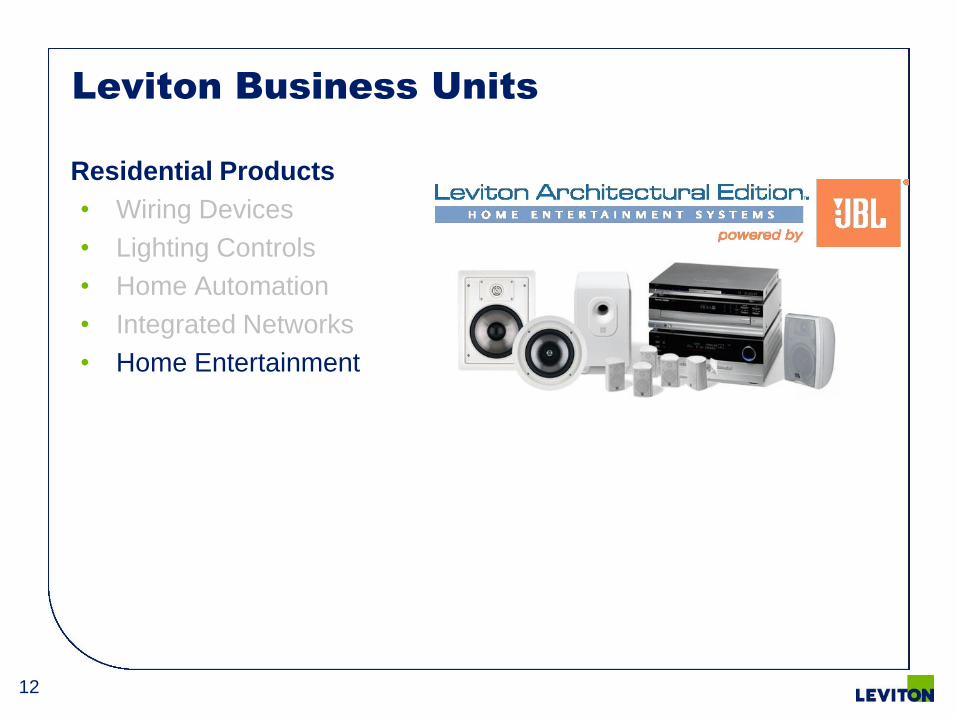
Leviton Business Units
•Residential Products
• Wiring Devices
• Lighting Controls
• Home Automation
• Integrated Networks
• Home Entertainment
13
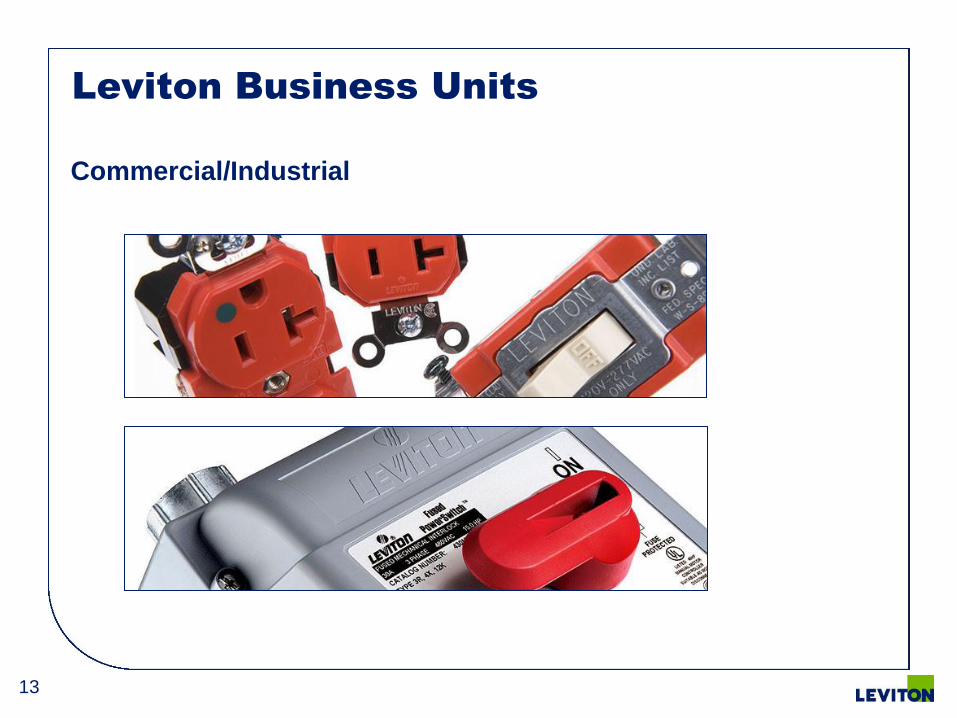
Leviton Business Units
•Commercial/Industrial
14
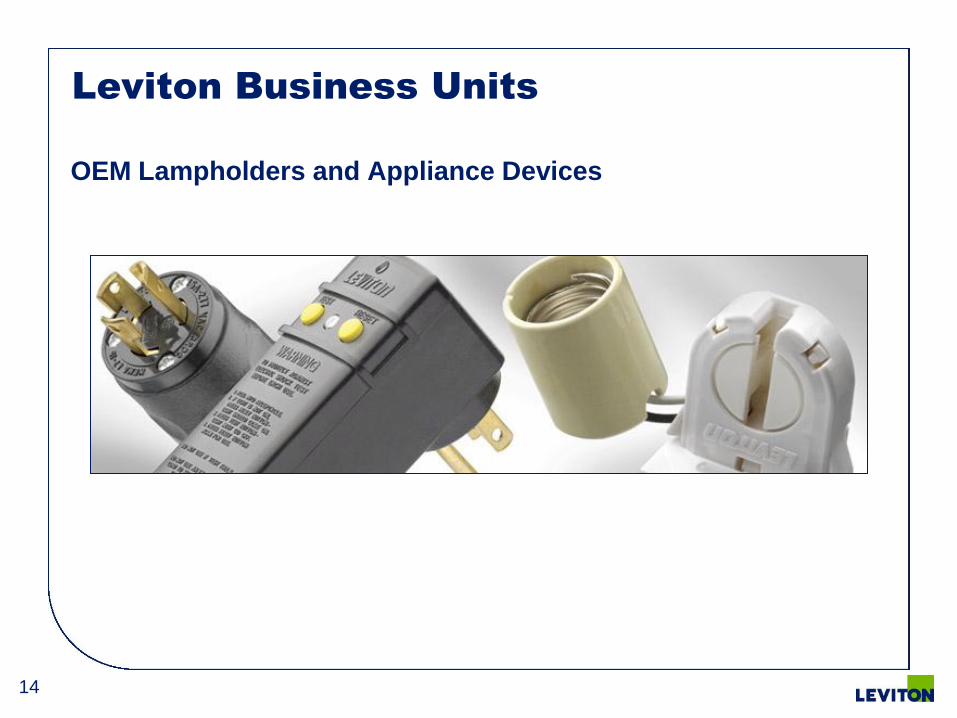
Leviton Business Units
•OEM Lampholders and Appliance Devices
15
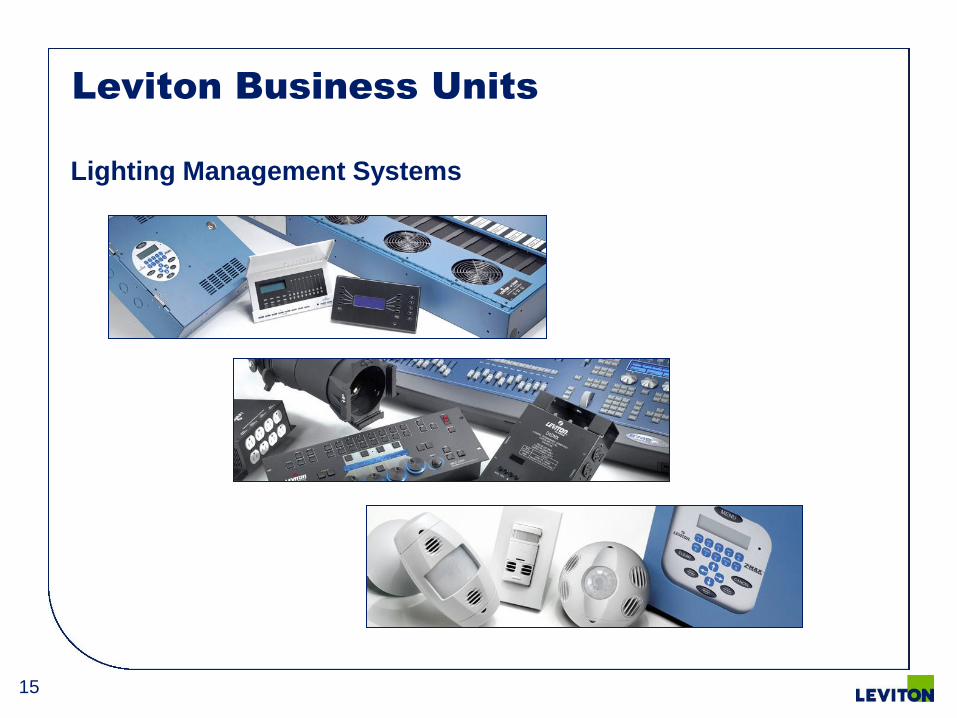
Leviton Business Units
•Lighting Management Systems
16
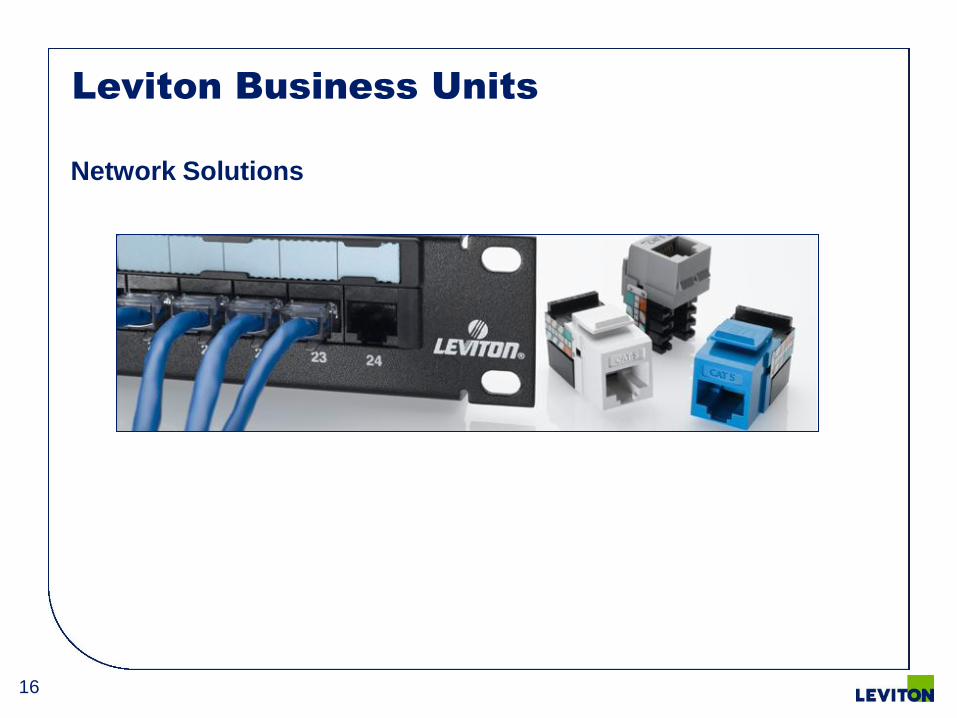
Leviton Business Units
•Network Solutions

17
Leviton’s Global Supply Chain
Network
Manufacturing Distribution
Manufacturing
USA
• Morganton, NC
• W. Jefferson, NC
• El Paso, TX
• Bothell, WA
• Portland, OR
• Lake Forest, IL
Mexico
• Tijuana (2)
• Ensenada
• Camargo
• Jimenez
China
• Dongguan
• Nanjing
Distribution
USA
• Sparks, NV
• Nashville, TN
Pointe Claire, Quebec
Mexico City
Dubai
China
• Hong Kong
• Shenzhen

18
2 DC Network as of April 2009
Sparks, NV
Nashville, TN
• 408,000 sq ft
• ~100 employees
• ~20,000 cartons per day
(standard capacity)
• 457,000 sq ft
• ~140 employees
• ~25,000 cartons per day
(standard capacity)

19
Agenda
• My background
• Leviton company overview
• Analytics at Leviton
– Framework: Analytical Competition
– Current state & challenges
– Approach to date
– Examples
– Future opportunities
• Questions & discussion
20
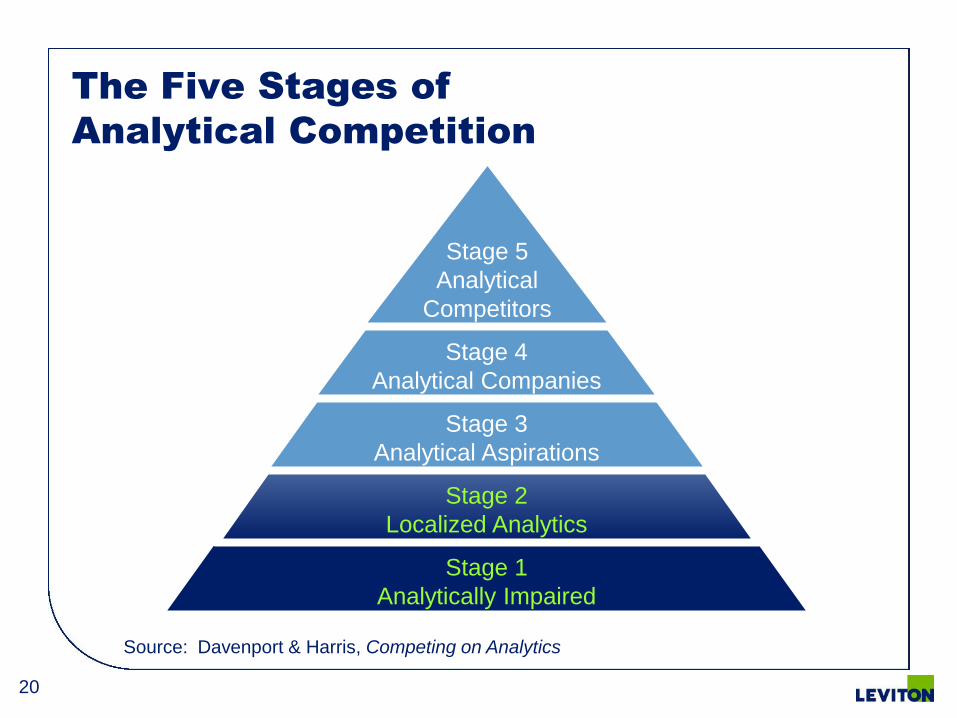
The Five Stages of
Analytical Competition
Stage 1
Analytically Impaired
Stage 2
Localized Analytics
Stage 3
Analytical Aspirations
Stage 4
Analytical Companies
Stage 5
Analytical
Competitors
Source: Davenport & Harris, Competing on Analytics
21
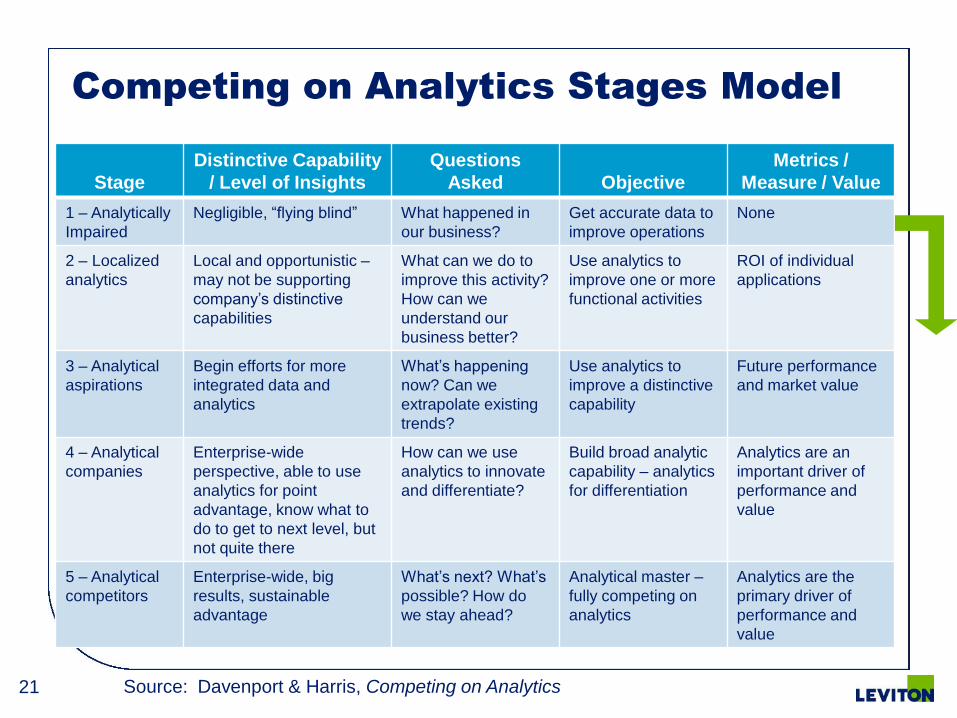
Competing on Analytics Stages Model
Stage
Distinctive Capability
/ Level of Insights
Questions
Asked Objective
Metrics /
Measure / Value
1 – Analytically
Impaired
Negligible, “flying blind” What happened in
our business?
Get accurate data to
improve operations
None
2 – Localized
analytics
Local and opportunistic –
may not be supporting
company’s distinctive
capabilities
What can we do to
improve this activity?
How can we
understand our
business better?
Use analytics to
improve one or more
functional activities
ROI of individual
applications
3 – Analytical
aspirations
Begin efforts for more
integrated data and
analytics
What’s happening
now? Can we
extrapolate existing
trends?
Use analytics to
improve a distinctive
capability
Future performance
and market value
4 – Analytical
companies
Enterprise-wide
perspective, able to use
analytics for point
advantage, know what to
do to get to next level, but
not quite there
How can we use
analytics to innovate
and differentiate?
Build broad analytic
capability – analytics
for differentiation
Analytics are an
important driver of
performance and
value
5 – Analytical
competitors
Enterprise-wide, big
results, sustainable
advantage
What’s next? What’s
possible? How do
we stay ahead?
Analytical master –
fully competing on
analytics
Analytics are the
primary driver of
performance and
value
Source: Davenport & Harris, Competing on Analytics
22
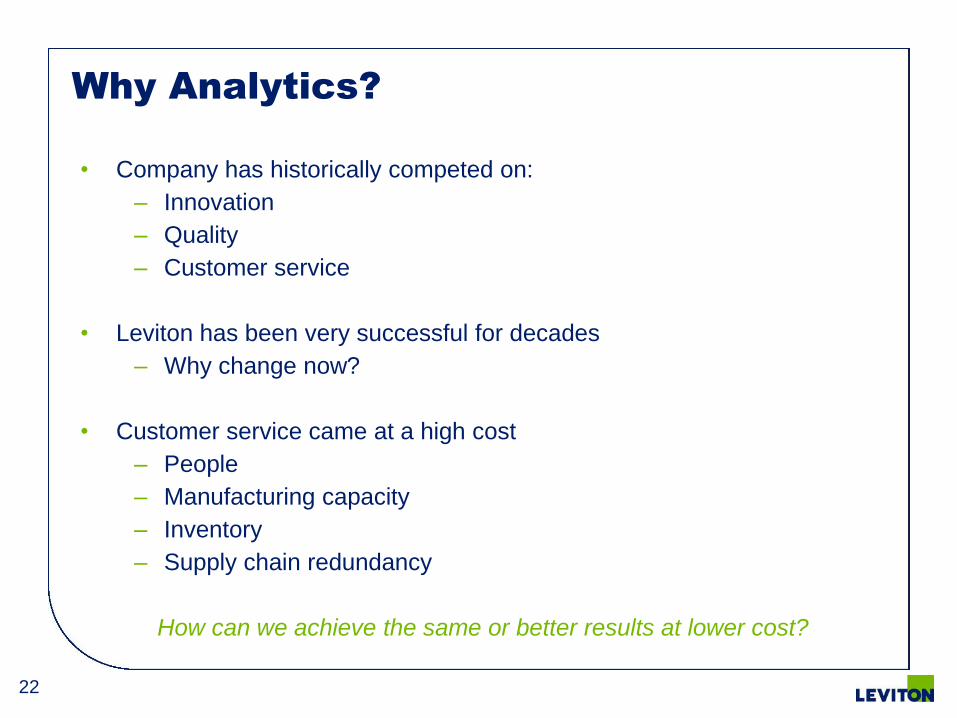
Why Analytics?
• Company has historically competed on:
– Innovation
– Quality
– Customer service
• Leviton has been very successful for decades
– Why change now?
• Customer service came at a high cost
– People
– Manufacturing capacity
– Inventory
– Supply chain redundancy
How can we achieve the same or better results at lower cost?
23
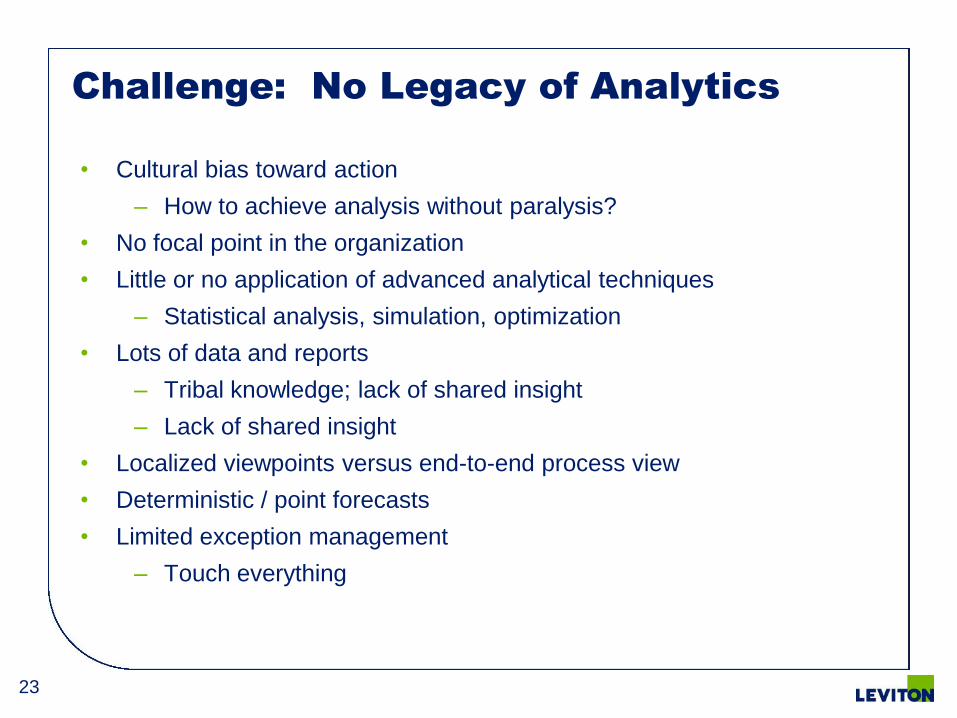
Challenge: No Legacy of Analytics
• Cultural bias toward action
– How to achieve analysis without paralysis?
• No focal point in the organization
• Little or no application of advanced analytical techniques
– Statistical analysis, simulation, optimization
• Lots of data and reports
– Tribal knowledge; lack of shared insight
– Lack of shared insight
• Localized viewpoints versus end-to-end process view
• Deterministic / point forecasts
• Limited exception management
– Touch everything
24
High Level View of Leviton’s Supply Chain
Supplie
rs
Custo
mers
DC’s
SC Planning
Purchasing
Plants
Transportation
Orders
Ord
er
Mgm
t S
ys.
Customer
Service
EDI
B2B
Orders
Demand (Orders, History)
Production
Requirements
RM & Component
Requirements
Purchase
Orders
Raw Materials
& Components
FG
Replenishment Customer Shipments
Purchased FG
(Private Fleet) (Common Carrier)
Informational Flow
Physical Flow
ASN
Note: excludes Reverse Logistics (i.e., returns) and all Financial Flows
25
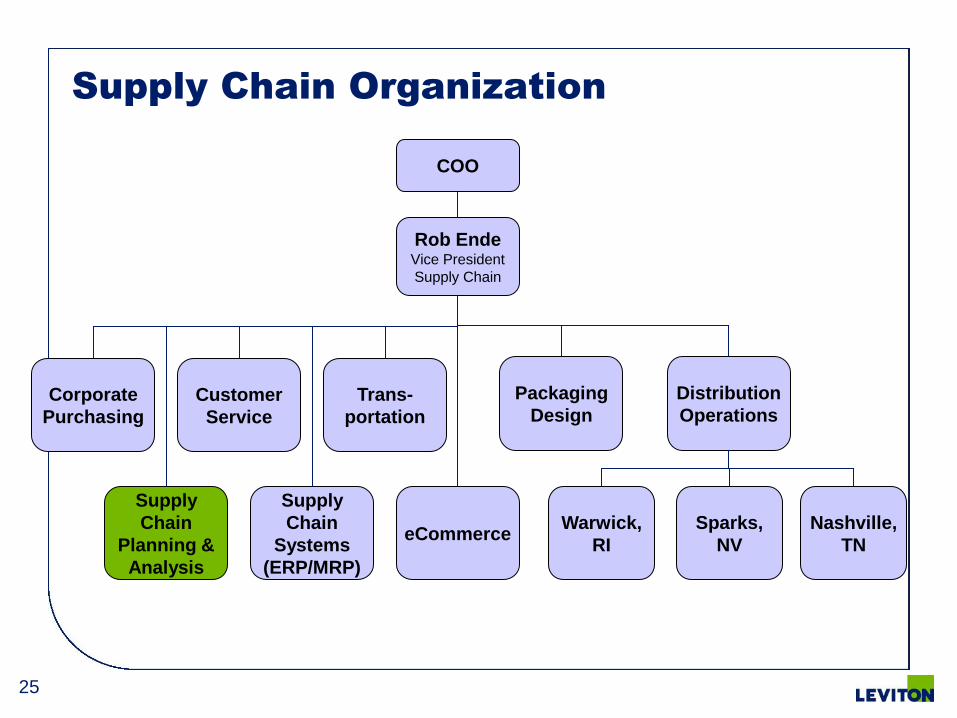
Supply Chain Organization
Rob EndeVice President
Supply Chain
Corporate
Purchasing
Distribution
OperationsTrans-
portation
Customer
Service
eCommerceNashville,
TN
Sparks,
NV
Warwick,
RI
Packaging
Design
Supply
Chain
Systems
(ERP/MRP)
Supply
Chain
Planning &
Analysis
COO

26
Meeting the Challenge
• New Roles
– Director of Supply Chain Planning & Analysis
– Manager of Demand Planning
– Supply Chain Engineer
• Databases for Decision-Support
– Planning & Inventory Management
– Spend Analysis
– Transportation
• On-Demand Reporting for Business Users
27
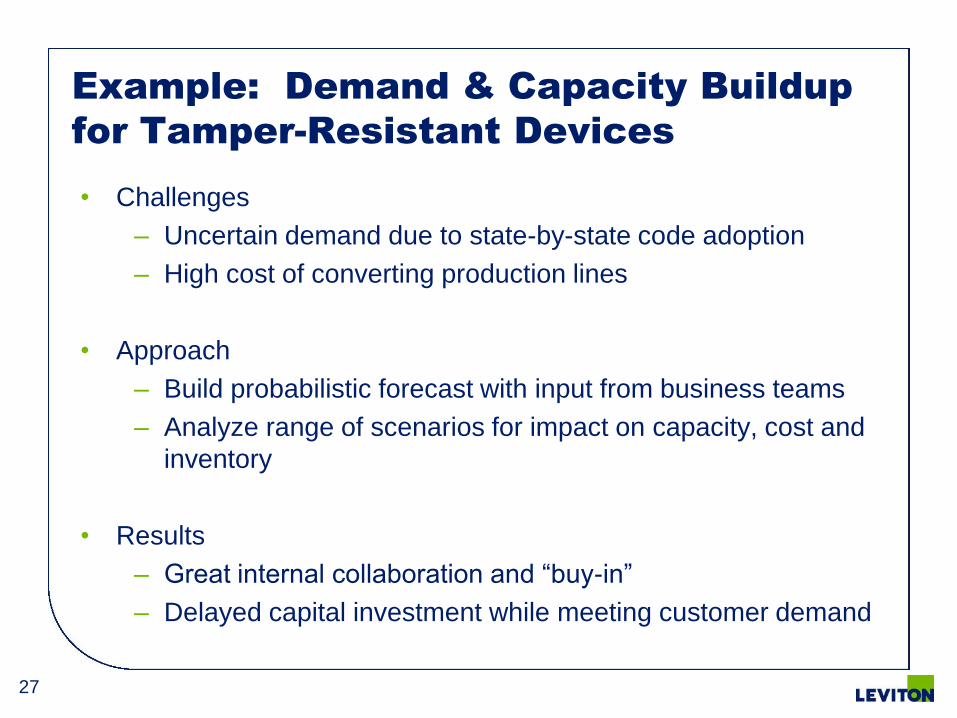
Example: Demand & Capacity Buildup
for Tamper-Resistant Devices
• Challenges
– Uncertain demand due to state-by-state code adoption
– High cost of converting production lines
• Approach
– Build probabilistic forecast with input from business teams
– Analyze range of scenarios for impact on capacity, cost and
inventory
• Results
– Great internal collaboration and “buy-in”
– Delayed capital investment while meeting customer demand
28
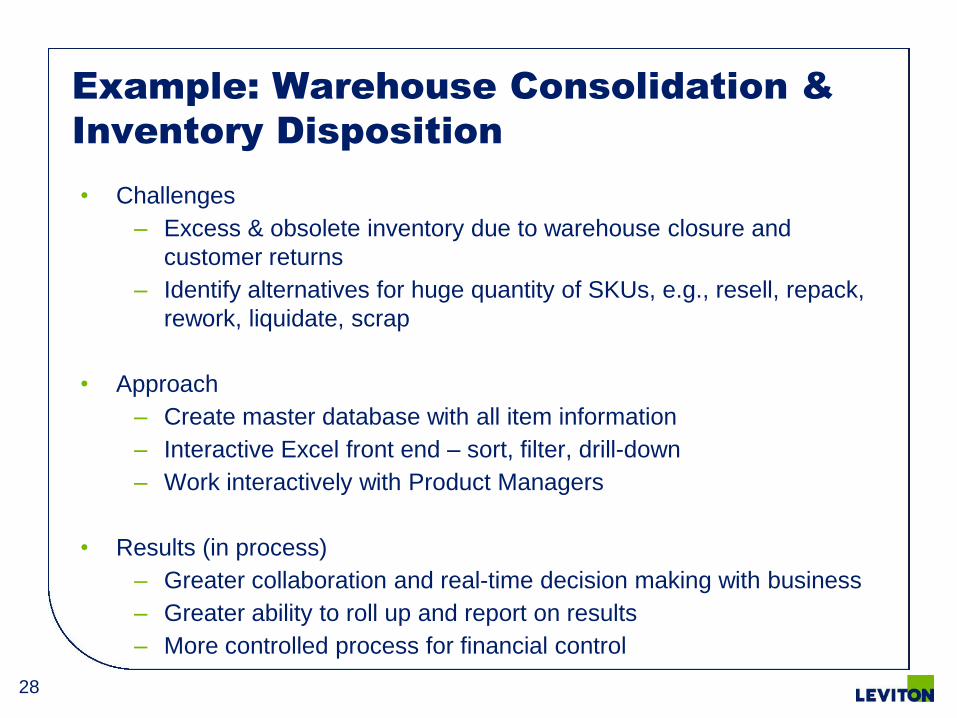
Example: Warehouse Consolidation &
Inventory Disposition
• Challenges
– Excess & obsolete inventory due to warehouse closure and
customer returns
– Identify alternatives for huge quantity of SKUs, e.g., resell, repack,
rework, liquidate, scrap
• Approach
– Create master database with all item information
– Interactive Excel front end – sort, filter, drill-down
– Work interactively with Product Managers
• Results (in process)
– Greater collaboration and real-time decision making with business
– Greater ability to roll up and report on results
– More controlled process for financial control

29
Example: Transportation
• Challenges
– Complex transportation network
– Lack of effective decision support to identify opportunities for cost
reduction
• Approach
– Working with external consultants, build comprehensive shipments
database and “what-if” queries
• Results (in process)
– Identified several high value opportunities, e.g., shipment
consolidation between west coast facilities and Sparks DC
30
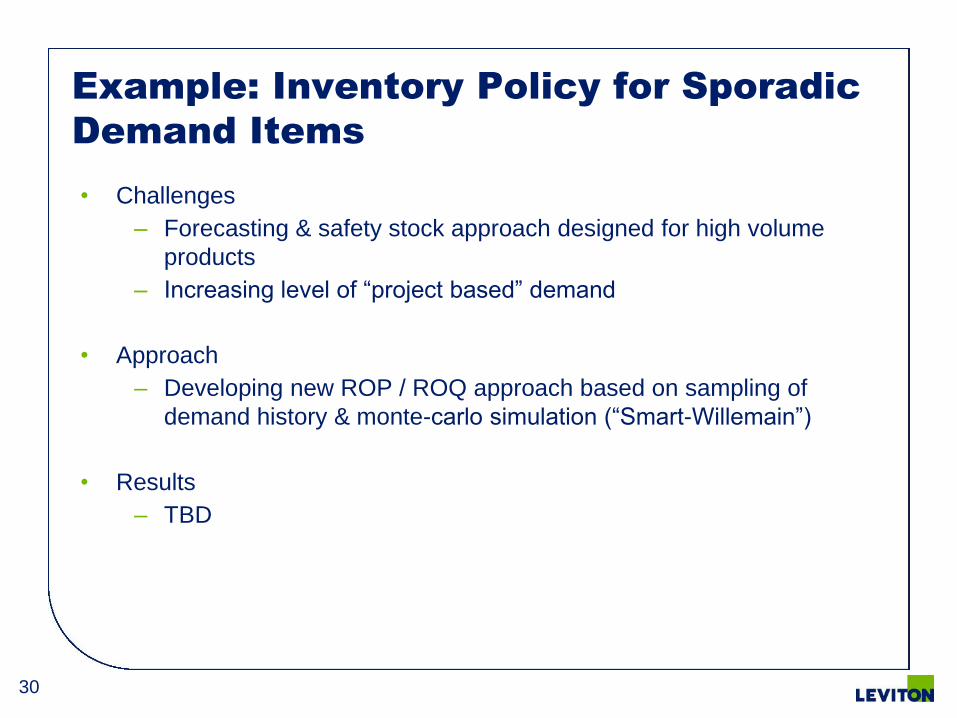
Example: Inventory Policy for Sporadic
Demand Items
• Challenges
– Forecasting & safety stock approach designed for high volume
products
– Increasing level of “project based” demand
• Approach
– Developing new ROP / ROQ approach based on sampling of
demand history & monte-carlo simulation (“Smart-Willemain”)
• Results
– TBD
31
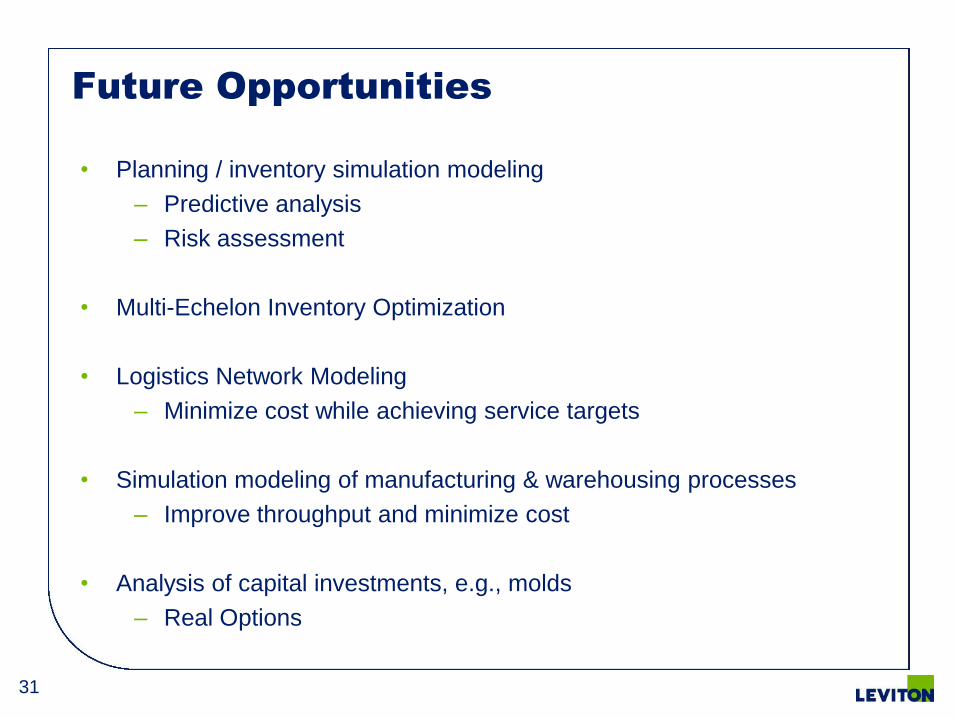
Future Opportunities
• Planning / inventory simulation modeling
– Predictive analysis
– Risk assessment
• Multi-Echelon Inventory Optimization
• Logistics Network Modeling
– Minimize cost while achieving service targets
• Simulation modeling of manufacturing & warehousing processes
– Improve throughput and minimize cost
• Analysis of capital investments, e.g., molds
– Real Options
32
Agenda
• My background
• Leviton company overview
• Analytics at Leviton
– Framework: Analytical Competition
– Current state & challenges
– Approach to date
– Examples
– Future opportunities
• Questions & discussion
Top Related