


Languages
Pages
Legal

CDR UW
Complimentary Calcium Fractionation Techniques to Increase Coproduct Solids
Value and Utilization
Mike MolitorWisconsin Center for Dairy Research
Center for Dairy Research “Solution Based Research Backed by Experience, Passion and Tradition”
CDR UW Presentation Outline
1. Background 2. Project Philosophies 3. Calcium Fractionation 4. Trials & Data 5. Conclusions

CDR UW Background
• Co-Products are UF Permeates derived from either Milk, Sweet Whey or Acid Whey
• AW contains 3X more Ca than Milk Perm. • Calcium becomes Insoluble by Increasing
any combination of three Variables; pH, Temperature and/or Ca Concentration
• Processing Examples that exceed Calcium Solubility are 2X NF/RO of Milk Permeate due to its High pH or AW Evaporation due to heat & concentration even with pH < 4.6!
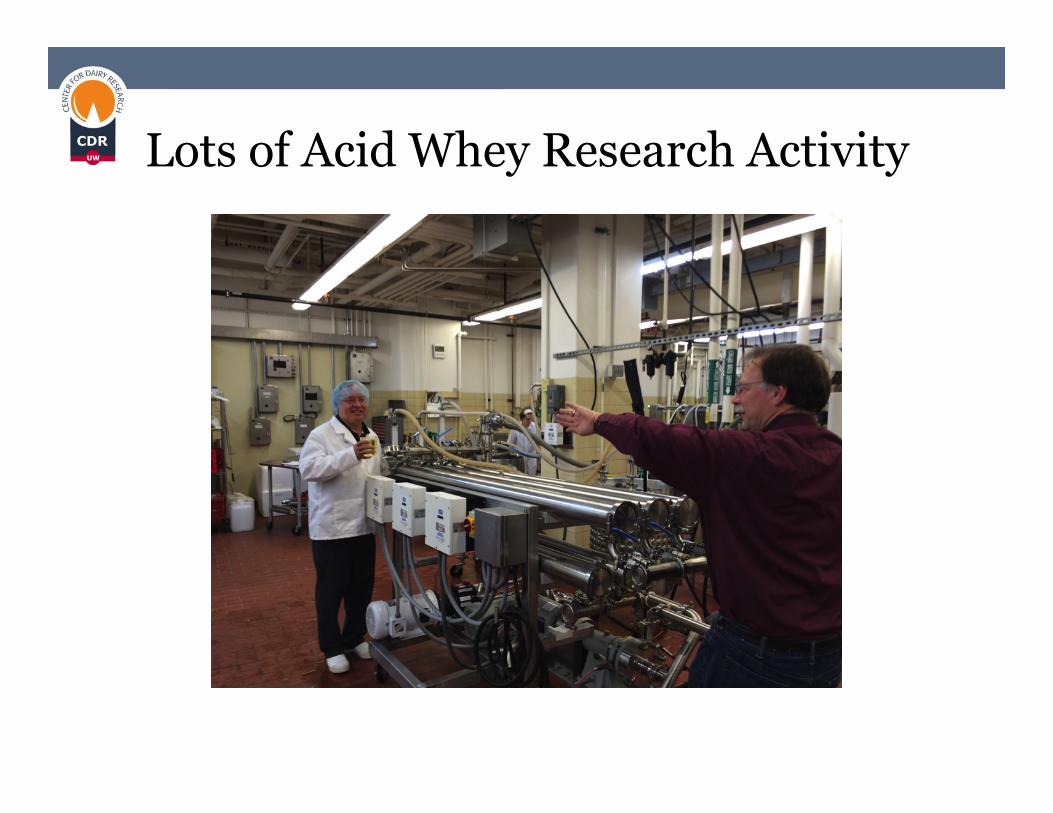
CDR UW Lots of Acid Whey Research Activity

CDR UW Stokes Law
for Sedimentation Velocity
• Defines the Variables to consider for particle separation • Particle Radius (R) Squared has a very significant impact
– Thus double the Radius and it will travel 4X faster • Density Difference is Necessary [ ρ (particle) – ρ (fluid)]
– The particle density may be fixed, but measure it – The fluid solids (density) has an upper limit
• The Force applied (g) or use more force Mechanically

CDR UW This Study’s Philosophy
• The High Calcium Phosphate content of Acid Whey is both a problem and an opportunity
• Fractionating Coproducts increases the Purity of both streams created by the separation
• Generate Process Rate and mass balance Data available for Economic Evaluations
• Create the Prototypes which are necessary to explore New Applications
CDR UW Ca Fractionation Options
1. Mechanical via Hydrocyclones 2. Filtration Concentration of; a. Soluble Ca via Nanofiltration b. Insoluble Calcium utilizing High Temperature compatible, open pore size UF elements from Germany

CDR UW
Generating Calcium Phosphate (CaP) CaP Yield Potential is 7% of the AW Permeate Solids
Standard NF to Retain Lactose
Acid pH UF Permeate
NF Retentate The Ca & Lactose are concentrated
NF Permeate is mostly Lactic acid, Na, K, Cl
& Galactose
Heat to 150 F
Alkali to pH 7
NF lowers the costs to make & process the CaP
NF or not?

CDR UW The Hydrocyclone Design

CDR UW
Our First Hydrocyclone Test Run The Full Process
Hydrocyclone mounted horizontally & the Yield The CaP harvested
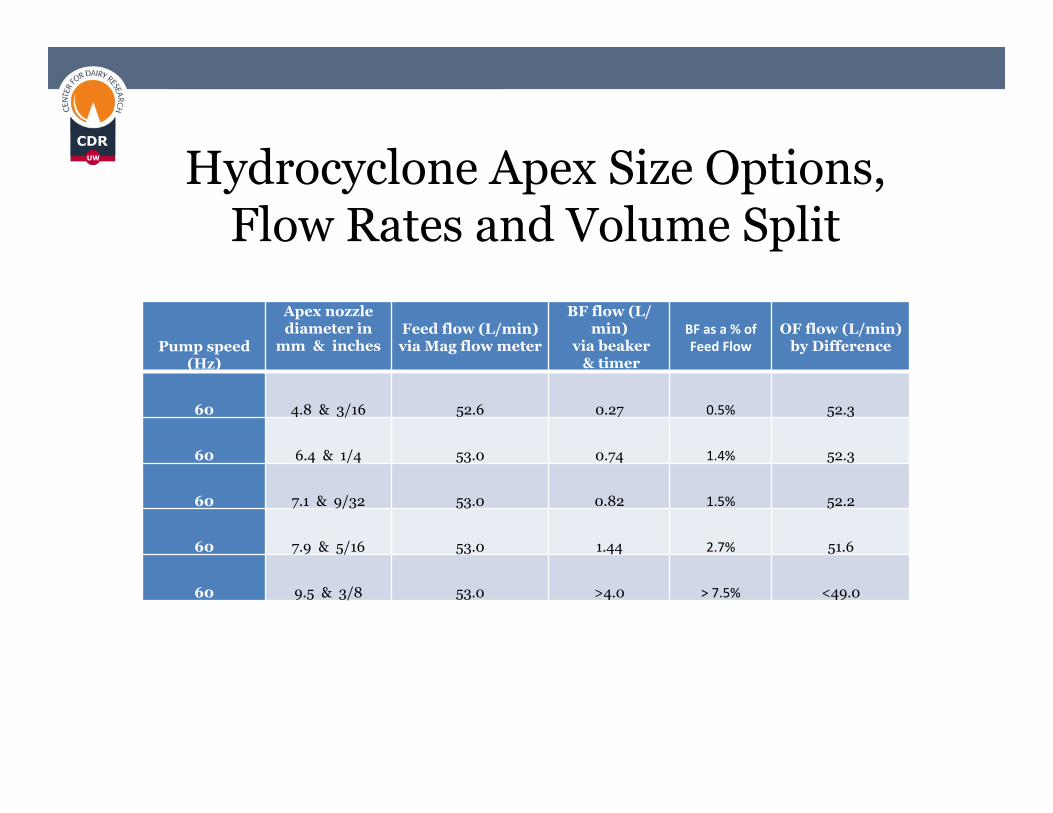
CDR UW Hydrocyclone Apex Size Options,
Flow Rates and Volume Split
Pump speed (Hz)
Apex nozzle diameter in
mm & inches
Feed flow (L/min) via Mag flow meter
BF flow (L/min)
via beaker & timer
BF as a % of Feed Flow
OF flow (L/min) by Difference
60 4.8 & 3/16 52.6 0.27 0.5% 52.3
60 6.4 & 1/4 53.0 0.74 1.4% 52.3
60 7.1 & 9/32 53.0 0.82 1.5% 52.2
60 7.9 & 5/16 53.0 1.44 2.7% 51.6
60 9.5 & 3/8 53.0 >4.0 > 7.5% <49.0
CDR UW
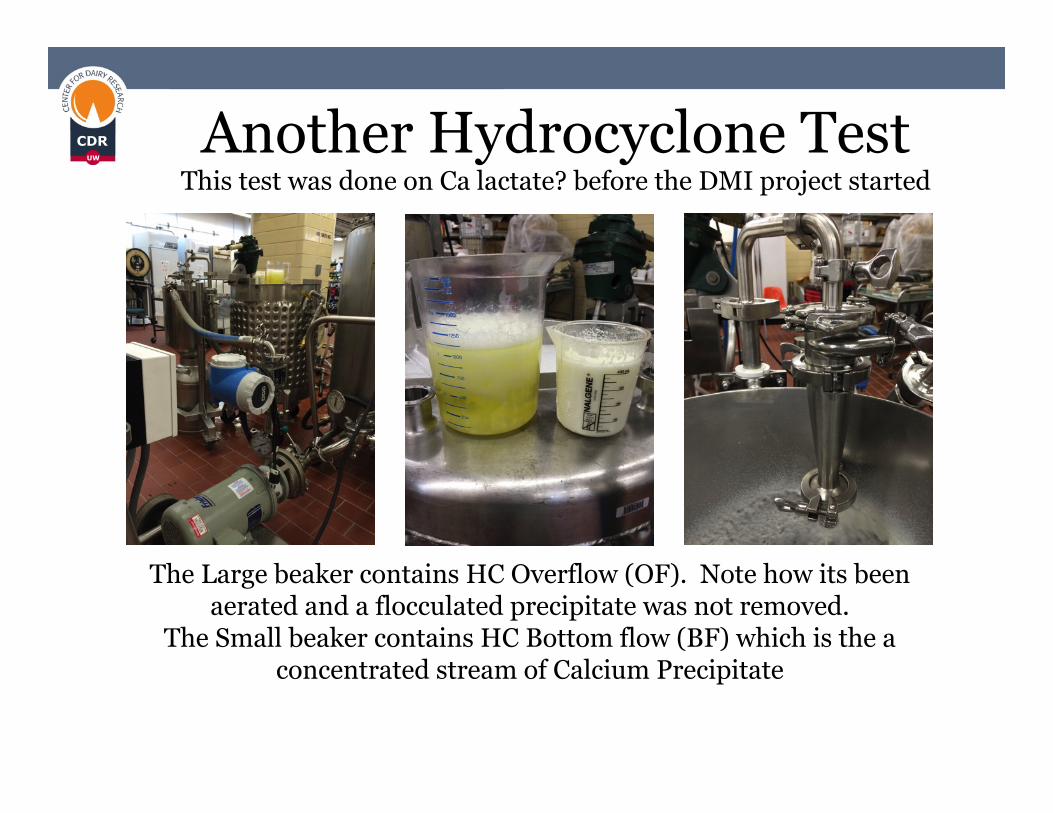
Another Hydrocyclone Test This test was done on Ca lactate? before the DMI project started
The Large beaker contains HC Overflow (OF). Note how its been aerated and a flocculated precipitate was not removed.
The Small beaker contains HC Bottom flow (BF) which is the a concentrated stream of Calcium Precipitate

CDR UW
How Turbulence Impacts the CaP Particle Size Range Generated
NF Concentrate from AW UF Permeate
Ca depleted
Use for edible lactose
Special high temperature compatible Ultrafiltration
NF Concentrate from AW UF Permeate

CDR UW CaP Particle Size Determined by
1. Low Turbulence Neutralization (LTN) 2. High Turbulence Neutralization (HTN)
0.00
1.00
2.00
3.00
4.00
5.00
6.00
7.00
8.00
0.50 5.00 50.00 500.00
Vol
ume
(%)
Size (um)
HC Feed LTN
HC Feed HTN
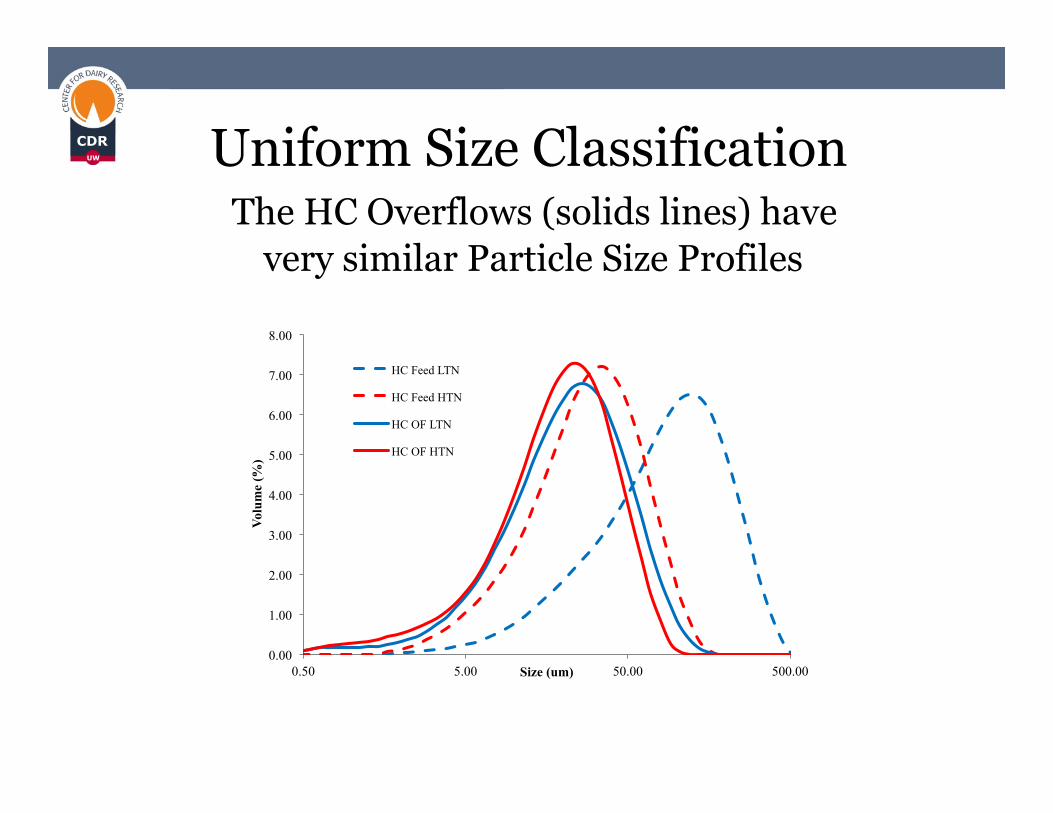
CDR UW Uniform Size Classification
The HC Overflows (solids lines) have very similar Particle Size Profiles
0.00
1.00
2.00
3.00
4.00
5.00
6.00
7.00
8.00
0.50 5.00 50.00 500.00
Volu
me
(%)
Size (um)
HC Feed LTN
HC Feed HTN
HC OF LTN
HC OF HTN

CDR UW Effect of Washing CaP
The Large CaP Particle (the red profile) Washed by decanting to achieve purified CaP (the green profile)
0.00
1.00
2.00
3.00
4.00
5.00
6.00
7.00
8.00
9.00
10.00
0.50 5.00 50.00 500.00
Volu
me
(%)
Size (um)
HC Feed LTN
HC BF LTN
Washed BF
CDR UW
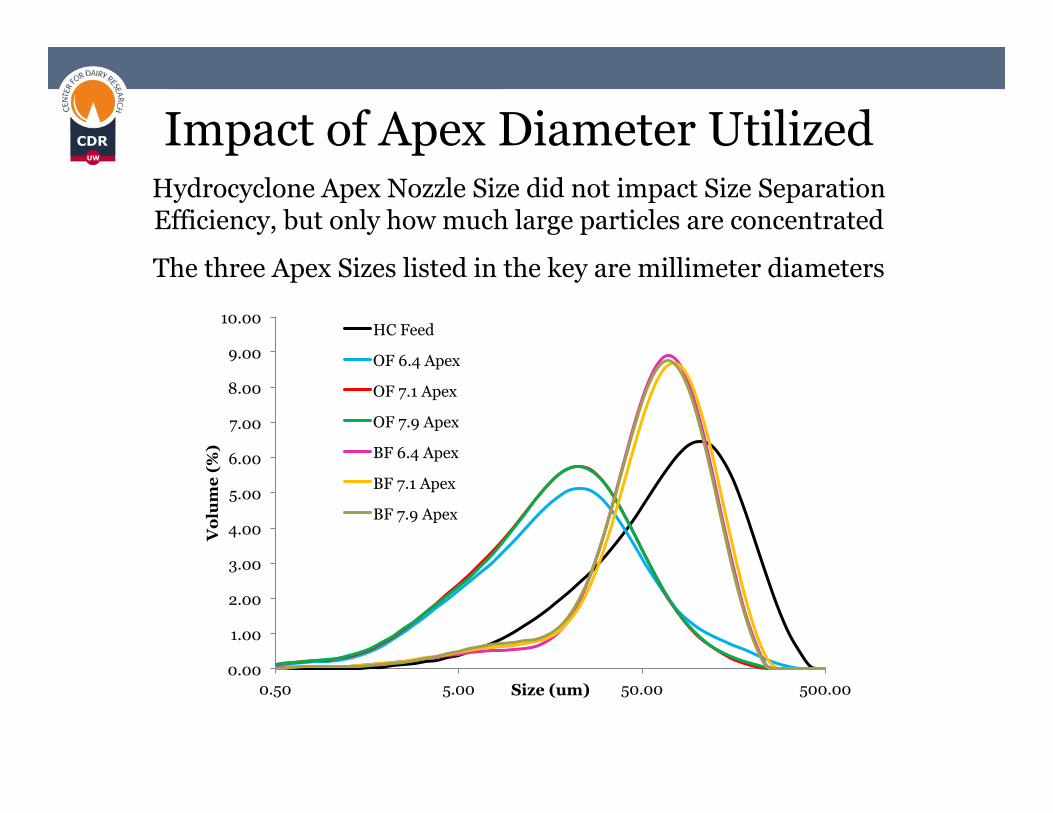
Impact of Apex Diameter Utilized
Hydrocyclone Apex Nozzle Size did not impact Size Separation Efficiency, but only how much large particles are concentrated
The three Apex Sizes listed in the key are millimeter diameters
0.00
1.00
2.00
3.00
4.00
5.00
6.00
7.00
8.00
9.00
10.00
0.50 5.00 50.00 500.00
Vol
ume
(%)
Size (um)
HC Feed
OF 6.4 Apex
OF 7.1 Apex
OF 7.9 Apex
BF 6.4 Apex
BF 7.1 Apex
BF 7.9 Apex
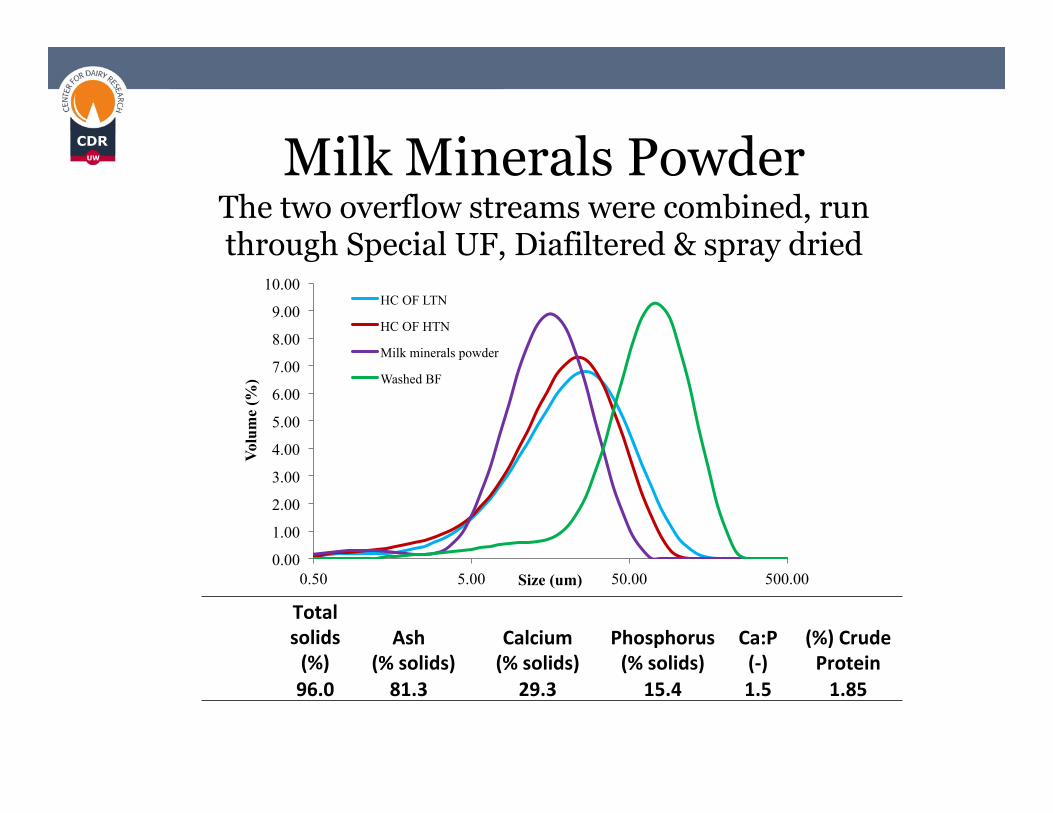
CDR UW Milk Minerals Powder
The two overflow streams were combined, run through Special UF, Diafiltered & spray dried
Total solids (%)
Ash (% solids)
Calcium (% solids)
Phosphorus (% solids)
Ca:P (-‐)
(%) Crude Protein
96.0 81.3 29.3 15.4 1.5 1.85
0.00
1.00
2.00
3.00
4.00
5.00
6.00
7.00
8.00
9.00
10.00
0.50 5.00 50.00 500.00
Volu
me
(%)
Size (um)
HC OF LTN
HC OF HTN
Milk minerals powder
Washed BF

CDR UW
Trial start Date
%Ash Dry Basis
%Protein Dry Basis
%Lactose Dry Basis
1/22/15 5.0% 1.5% % Reduction 43% 51%
7/27/15 5.9% 1.9% 91.7% % Reduction 38% 37%
7/28/15 5.0% 1.6% 95.9% % Reduction 43% 47%
Composition of Milk Permeate after Demineralization
“% Reduction” is the percentage of Ash or Protein Removed compared to Milk Permeate, the Process Feed material
Note the High Lactose Purity Achieved
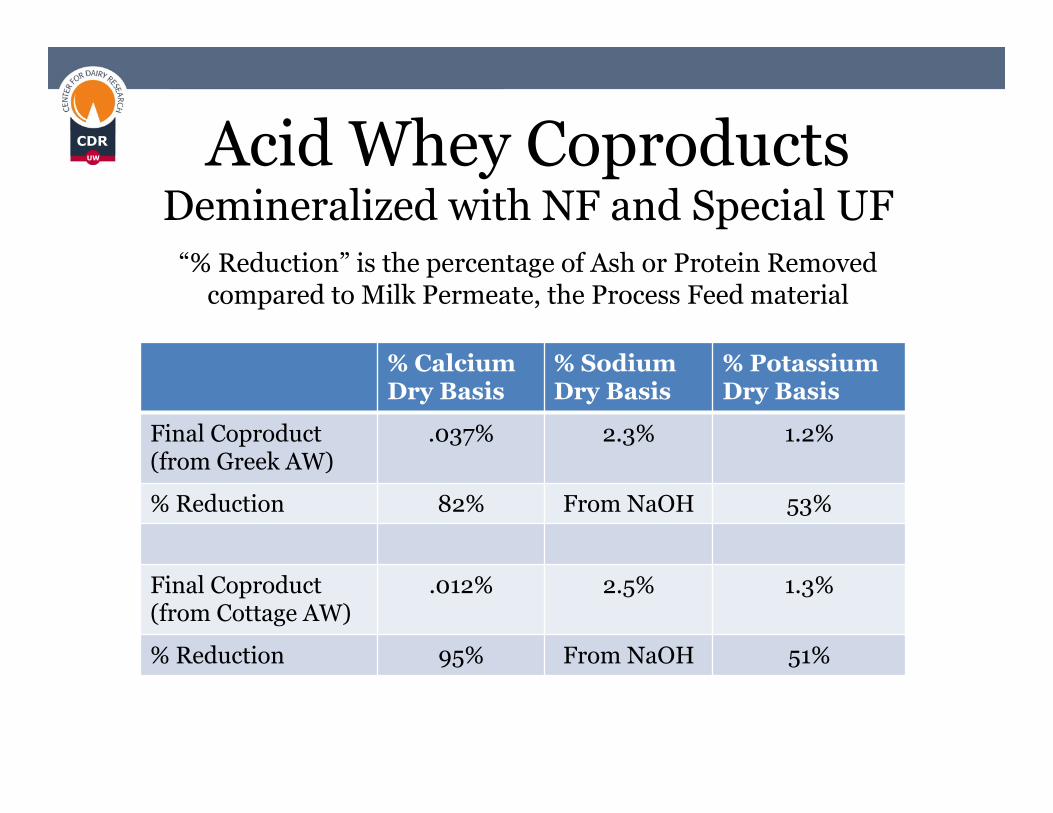
CDR UW Acid Whey Coproducts
Demineralized with NF and Special UF
“% Reduction” is the percentage of Ash or Protein Removed compared to Milk Permeate, the Process Feed material
% Calcium Dry Basis
% Sodium Dry Basis
% Potassium Dry Basis
Final Coproduct (from Greek AW)
.037% 2.3% 1.2%
% Reduction 82% From NaOH 53%
Final Coproduct (from Cottage AW)
.012% 2.5% 1.3%
% Reduction 95% From NaOH 51%

CDR UW
Conclusion- CaP is in a better place The Problem of Ca Soil
blinding an Evaporator Plate Is Resolved by Producing Milk Minerals & then Edible Lactose

CDR UW Acknowledgements
Wisconsin Center for Dairy Research Staff; Becky Kalscheuer and Yanjie Lu Shane Crowley, FulBright Scholar & PhD Candidate, University College Cork, Cork, Ireland Richa Singh, UW Madison Masters Candidate

CDR UW
Project funding provided by the National Dairy Council managed by Dairy Management, Inc.