


Languages
Pages
Legal


UV-1900i
C101-E168A
UV-VIS Spectrophotometer
UV-1900i
© Shimadzu Corporation, 2019
www.shimadzu.com/an/
For Research Use Only. Not for use in diagnostic procedures. This publication may contain references to products that are not available in your country. Please contact us to check the availability of these products in your country.Company names, products/service names and logos used in this publication are trademarks and trade names of Shimadzu Corporation, its subsidiaries or its affiliates, whether or not they are used with trademark symbol “TM” or “®”.Third-party trademarks and trade names may be used in this publication to refer to either the entities or their products/services, whether or not they are used with trademark symbol “TM” or “®”.Shimadzu disclaims any proprietary interest in trademarks and trade names other than its own.
The contents of this publication are provided to you “as is” without warranty of any kind, and are subject to change without notice. Shimadzu does not assume any responsibility or liability for any damage, whether direct or indirect, relating to the use of this publication.
LabSolutions and Analytical Intelligence Logo are trademarks of Shimadzu Corporation. TrayCell is a registered trademark of Hellma GmbH & Co. KG. in Germany.Excel is a registered trademark or trademark of the Microsoft Corporation in the USA and other countries.
First Edition: November 2019, Printed in Japan 3655-01004-30AIT
https://www.shimadzu.com/an/molecular_spectro/uv/uv-1900/index.html
UV-1900i Website
-Automated support functions utilizing digital technology, such as M2M, IoT , and Artificial Intelligence (AI), that enable higher productivity and maximum reliability.-Allows a system to monitor and diagnose itself, handle any issues during data acquisition without user input, and automatically behave as if it were operated by an expert.-Supports the acquisition of high quality, reproducible data regardless of an operator’s skill level for both routine and demanding applications.

Easy-to-use user interface design
Ergonomic touch-screen display
Easy to Operate, Obtain Answers Easily and Rapidly
High Performance to Meet Diverse Needs
Validation functions enable checks in accordance with Pharmacopeia (JP, USP, and EP)
to be performed easily
In combination with LabSolutions™ DB/CS, comply with FDA 21 CFR Part 11 and
PIC/S GMP guidelines
Advanced Regulatory Compliance
The instrument is equipped with an ultra high-speed scan, which can acquire a
spectrum in a few seconds, with the lowest level of stray light and noise in its class
N a v i g a t e Y o u r W a y
UV-1900i UV-2600i/2700i
UV-i Selection
SolidSpec™™-3700iUV-3600i Plus

54UV-1900iUV-VIS Spectrophotometer
Display languages are available in eight languages (Japanese, English,
Chinese, Spanish, Portuguese, German, French, Russian).
The instrument is equipped with a stylus pen, allowing operation by this pen or a finger.
The UV-1900i on-screen user interface includes large, easy-to-see
icons deployed on a black background, so the instrument
settings are evident at a glance. In addition, the large,
easy-to-see icons improve intuitive understanding, which
enables users to quickly become familiar with the operations.
Furthermore, the user interface is designed to minimize
transitions between windows, so users do not get confused
during the operations.
In quantitation mode on the UV-1900i,
the stages of the entire measurement
process and the current status are always
shown on the display. As a result, users
know immediately what to do in the next
step.
Navigation Tabs Improve Usability
Easy-to-Use Interface
Grasp the Current Status and
Operating Procedures at a Glance
Easy to Operate, Obtain Answers Easily and Rapidly Ergonomic Hardware Design
The control panel is ergonomically designed and positioned
at the optimum viewing angle for the user. Users can
operate easily with any posture. Since the panel is
pressure-sensitive, the device can be operated with gloved
fingers or a stylus pen. The stylus pen can be stored right
next to the control panel.

76
Note: One method of determining the lower limit of quantitation is to use ten times the standard deviation. This is an actual measured value and is not guaranteed.
Low Stray Light High Reproducibility and Repeatability AccuracyThe photometric repeatability accuracy is 0.0002 Abs max. (0.5 Abs and 1.0 Abs). With this high photometric repeatability accuracy,
variance in the measurement results is suppressed, enabling more accurate quantitation and the detection of low-concentration
samples.
No.123456789
10Standard
Deviation σ
Absorbance of Blank Solution (273 nm)-0.000010.00001-0.000020.000020.00001-0.000030.00001-0.000040.000010.00005
0.000025
2.5
2.0
1.5
1.0
0.5
0.0
Calibration Curve
Conc. (mg/mL)
Abs.
0.0 10.0 20.0 30.0 40.0
3.00
2.50
2.00
1.50
1.00
0.50
0.00
Calibration Curve
Conc. (mg/L)
Abs.
0.00 1.00 2.00 3.00
Stray light is at 0.5 % max. (198 nm), making accurate measurements are possible up to
the vicinity of 2 Abs even in the ultraviolet region. In addition, high-concentration
samples can be quantified accurately.
The figure on the right is a calibration curve for acetic acid, created with absorbance at
200 nm.
The correlation coefficient is 0.9997 and correct measured values are obtained even in
the vicinity of 2 Abs. Linearity will be lost in the high absorbance region due to the
stray light.
The figure on the right is a calibration curve for
caffeine, created with absorbance at 273 nm.
The calibration curve has an Abs = 0.0528 Conc.
The lower limit of quantitation determined from
the standard deviation is 0.0051 mg/L.
Ultra-Fast ScanSpectra can be acquired as fast as 29,000 nm/min. Ultra-fast scan is effective in tracking chemical reactions in a short time. In
addition to the absorbance change at specified wavelengths, spectra can also be acquired in a short time with the UV-1900i.
Therefore, more detailed behavior can be investigated by observing spectra with the UV-1900i.
The figures below show the analysis of the particle agglomeration process when salts are added to silver nanoparticles.
Measurements of the 300 to 700 nm region were performed in ultra-fast scan mode. In addition to the decrease of
absorbance at 400 nm and the increase of absorbance at 480 nm, the temporal changes of spectra can also be observed.
High Performance to Meet Diverse Needs
Instrument with 1.00 % Stray LightUV-1900i
1.0
0.8
0.6
0.4
0.2
0.0
0.97
0.92
0.87
0.77
0.72
0.67
0.62
0.23
0.21
0.19
0.17
0.15
0.13
0.11
0.09
0.07
Ab
s.
Ab
sorb
ance
at
400
nm
(A
bs)
Ab
sorb
ance
at
480
nm
(A
bs)
nm300.0 400.0 500.0 600.0 700.0
480nm
400nm
0 100 200 300
Time (sec)
Temporal Changes of Absorbance at 400 and 480 nmAbsorption Spectra of Silver Nanoparticles
400 500 600
Black: after 0 minRed: after 0.5 minBlue: after 1 minGreen: after 2 minOrange: after 5 minPurple: after 10 min
UV-1900iUV-VIS Spectrophotometer

76
Note: One method of determining the lower limit of quantitation is to use ten times the standard deviation. This is an actual measured value and is not guaranteed.
Low Stray Light High Reproducibility and Repeatability AccuracyThe photometric repeatability accuracy is 0.0002 Abs max. (0.5 Abs and 1.0 Abs). With this high photometric repeatability accuracy,
variance in the measurement results is suppressed, enabling more accurate quantitation and the detection of low-concentration
samples.
No.12345678910
StandardDeviation σ
Absorbance of Blank Solution (273 nm)-0.000010.00001-0.000020.000020.00001-0.000030.00001-0.000040.000010.00005
0.000025
2.5
2.0
1.5
1.0
0.5
0.0
Calibration Curve
Conc. (mg/mL)
Abs.
0.0 10.0 20.0 30.0 40.0
3.00
2.50
2.00
1.50
1.00
0.50
0.00
Calibration Curve
Conc. (mg/L)
Abs.
0.00 1.00 2.00 3.00
Stray light is at 0.5 % max. (198 nm), making accurate measurements are possible up to
the vicinity of 2 Abs even in the ultraviolet region. In addition, high-concentration
samples can be quantified accurately.
The figure on the right is a calibration curve for acetic acid, created with absorbance at
200 nm.
The correlation coefficient is 0.9997 and correct measured values are obtained even in
the vicinity of 2 Abs. Linearity will be lost in the high absorbance region due to the
stray light.
The figure on the right is a calibration curve for
caffeine, created with absorbance at 273 nm.
The calibration curve has an Abs = 0.0528 Conc.
The lower limit of quantitation determined from
the standard deviation is 0.0051 mg/L.
Ultra-Fast ScanSpectra can be acquired as fast as 29,000 nm/min. Ultra-fast scan is effective in tracking chemical reactions in a short time. In
addition to the absorbance change at specified wavelengths, spectra can also be acquired in a short time with the UV-1900i.
Therefore, more detailed behavior can be investigated by observing spectra with the UV-1900i.
The figures below show the analysis of the particle agglomeration process when salts are added to silver nanoparticles.
Measurements of the 300 to 700 nm region were performed in ultra-fast scan mode. In addition to the decrease of
absorbance at 400 nm and the increase of absorbance at 480 nm, the temporal changes of spectra can also be observed.
High Performance to Meet Diverse Needs
Instrument with 1.00 % Stray LightUV-1900i
1.0
0.8
0.6
0.4
0.2
0.0
0.97
0.92
0.87
0.77
0.72
0.67
0.62
0.23
0.21
0.19
0.17
0.15
0.13
0.11
0.09
0.07
Ab
s.
Ab
sorb
ance
at
400
nm
(A
bs)
Ab
sorb
ance
at
480
nm
(A
bs)
nm300.0 400.0 500.0 600.0 700.0
480nm
400nm
0 100 200 300
Time (sec)
Temporal Changes of Absorbance at 400 and 480 nmAbsorption Spectra of Silver Nanoparticles
400 500 600
Black: after 0 minRed: after 0.5 minBlue: after 1 minGreen: after 2 minOrange: after 5 minPurple: after 10 min
UV-1900iUV-VIS Spectrophotometer

98
The UV-1900i provides network access via wireless connectivity.
Data transfer function*1 PictBridge function*2
Data can now be transferred to a PC via a network.
Thanks to wireless printing, multiple UV units can print from a single printer.
(A router and other network equipment must be installed to use a network.)
Sleep Mode and Wakeup FunctionAnalysis can start the instant the user arrives at the laboratory
in the morning. The instrument requires no time to warm up.
Bar-Code Reader and Keyboard Entry FunctionSample names and numerical values can be entered by a bar-code reader or from the keyboard.
This saves time when entering sample names for a multiple sample analysis, and prevents sample misidentification and other
human errors.*3
*1: Optional expanded memory is required. The instrument is not compatible with control via a network.*2: A PictBridge compatible printer is required.
*3: Use a bar-code reader and keyboard with a USB connection.
Network Connectivity Function
Previousday
NextmorningStart Time
:9 00Ready
PhotometricMeasures the photometric value at a
single wavelength or multiple (up to
eight) wavelengths.
SpectrumMeasures a sample spectrum using
wavelength scanning.
QuantitationGenerates a calibration curve from the
measurement of standards, and then
calculates the concentrations of
unknowns.
KineticsMeasures absorbance changes as a
function of time, and obtains the
enzymatic activity values. The kinetics
measurement method or the rate
measurement method can be selected.
Time CourseMeasures changes over time in
photometric values at a specified
wavelength.
Biomethod Quantifies DNA or protein
concentrations.
A Diversity of Measurement ModesVarious Functions for Comfortable Daily Measurement
UV-1900iUV-VIS Spectrophotometer

1110
Applications
Foods
This is an example of the analysis of food dyes. By using
ultra-fast scan mode, the time needed for routine spectral
checks can be shortened. The 350 nm to 900 nm region can be
measured at 1 nm intervals in approx. 4 seconds.
Pharmaceuticals and Life Sciences
This is an example of the analysis of λDNA. Trace quantities (on
the order of a few µL) can be measured by combining the
instrument with Nano Stick and TrayCell®.
Using TrayCell, a calibration curve for 4 µL of λDNA was
obtained in the range between 25 ng/µL and 500 ng/µL.
Chemistry
This is an example of the analysis of colored cellophane tape.
Materials can be confirmed quantitatively by using LabSolutions
UV-Vis and color measurement software.
1.00
0.80
0.60
0.40
0.20
0.00350 400 600
Wavelength (nm)
Absorption Spectra of Food Dyes
Transmittance Spectra of Colored Cellophane Tape Chromaticity Diagram of XY Color System
800 900
Ab
sorb
ance
(A
bs.
)
TrayCell
Nano Stick
Optical path length: 1 mm
Black: 500Red: 250Blue: 100Green: 50Orange: 25 Unit: ng/µL
0.90
0.80
0.70
0.60
0.50
0.40
0.30
0.20
0.10
0.00
100
80
60
40
20
0
0.00
380 500 600Wavelength (nm)
700 780
0.10 0.20 0.30 0.40 0.50 0.60 0.70 0.80x
y
Tran
smit
tan
ce (
%)
220 25.0 100.0 300.0 500.0250 300 330
Wavelength (nm)
Calibration Curve
Concentration (ng/µL)
Ab
sorb
ance
(A
bs.
)
Ab
sorb
ance
(A
bs.
)
1.2
1.0
0.5
0.0
1.2
1.0
0.5
0.0
Film Holder
Accessories
Used in transmittance measurement of thin samples such as films and filters. It holds the samples for analysis.
Multi-Cell Sample Compartment
Sipper Unit
Holds up to six 10-mm square cells on the sample side. No temperature control capability.
(P/N 204-58909)
Expanded Memory
The UV-1900i main unit can store up to 999 sets of data.The saved data can be read out from a PC.(A network connection is required for data readout.)
(P/N 207-23119-41)
(P/N 206-69160-41)
Number of cells: 6 on the sample side
1 on the reference sideNote: Square cells are not included, please purchase separately.
Specifications:
Outside diameter: φ15 to 22 mm
Height: 75 to 115 mm
Note: Test tube is not included.
This attachment permits measurement of up to six sample cells under
constant-temperature conditions. Combination of this attachment and
the Kinetics mode provides measurement of temperature-sensitive
enzyme kinetics of one to six samples.
CPS-100 Cell Positioner, Thermoelectrically Temperature Controlled (P/N 206-29500-41)
Number of cells: 6 on the sample side (temperature-controlled)
1 on the reference side (temperature not controlled)
Temperature control range: 16°C to 60°C
Temperature display accuracy (difference from the true value): ± 0.5°C
Temperature control precision (variation of temperature): ± 0.1°C
Ambient temperature: 15°C to 35°C
Note: Square cells (P/N 200-34442) are not included, please purchase
separately.
A USB adapter CPS
(P/N 206-25234-91)
is required.
Four types of sipper units with different flow cells are available. The
stepping motor-driven peristaltic pump ensures reliable and smooth
aspiration of sample solution.
(Direct driving is possible from the UV-1900i so no interface is required.)
Note: The use of a Solenoid Valve (Fluoropolymer) (P/N 204-06599-01)
and the SWA-2 Sample Waste Unit (206-23820-58) are
recommended when strong acids, strong alkalis, or organic
solvents are to be measured.
Model P/N
Sipper Unit 160L (Standard Sipper)
Sipper Unit 160T (Triple-Pass Sipper)
Sipper Unit 160C (Constant-Temperature Sipper)
Sipper Unit 160U (Supermicro Sipper)
206-23790-51
206-23790-52
206-23790-53
206-23790-54
Standard Sample Volume
2.0 mL
1.5 mL
2.5 mL
0.5 mL
Holds two rectangular cells with an optical path length of 10, 20, 30, 50, 70, or 100 mm.
Long-Path Rectangular Cell Holder (P/N 204-23118-01)
Holds test tube instead of sample compartment.
Test Tube Holder (P/N 207-23510-41)
Uses Peltier effect for controlling the sample and reference
temperature, so no thermostated bath or cooling water is required.
TCC-100 Thermoelectrically Temperature Controlled Cell Holder (P/N 206-29510-41)
Number of cells: One each on the sample and reference sides
(temperature-controlled)
Temperature control range: 7°C to 60°C
Temperature display accuracy (difference from the true value):
± 0.5°C
Temperature control precision (variation of temperature): ± 0.1°C
Note: Square cells (P/N 200-34442) are not
included, please purchase
separately.
UV-1900iUV-VIS Spectrophotometer

1312
Standard Software: LabSolutions UV-Vis
The combination of the UV-1900i, offering lower stray light levels and higher accuracy,
with LabSolutions UV-Vis software, which achieves labor-saving measurements,
provides a more convenient analytical environment.
Data ManagementFrom Measurement to Data OutputSetting Parameters
Smooth Operability
Database Management
In addition to regular file management in folders on a PC, ideal
solutions for saving data in a database with sophisticated
security functionality and compliance with ER/ES-related
regulations are also available.
Data analysis and data output operations can be performed at
the same time (simultaneously) as data measurement. Time
spent outputting or analyzing data can also be reduced by
simultaneously sending data to an Excel® spreadsheet in real
time or saving data as text. The software can also automatically
perform post-processing of measured data, such as
processing/correcting spectra, and perform pass/fail judgments
of measurement results (automatic spectral evaluation).
By specifying various evaluation criteria for measurement
results, spectra judgments can be made automatically.Four separate measurement modes for spectral, quantitative,
photometric, time-course, and automatic measurements
(optional) enable measurements to be performed using intuitive
operations.
Instrument parameter settings can be specified via panels that
are separate from the measurement window. The control panels
include various functionality that is laid out for superior
visibility. Each measurement window connects seamlessly to the
corresponding parameter settings window.
Managing data in a database can prevent the overwriting or
deletion of analysis data. Furthermore, during postrun
analysis, the data can be managed using version numbers,
so there are no concerns about overwriting the data.
Optional Software
LabSolutions DB UV-Vis
LabSolutions CS UV-Vis
Instrument Control Panel
Four Measurement Modes
In the report creation window, reports can either be prepared based
on a previously specified report format or freely laid out based on
various parameters, data, or other elements.
Stronger Data ManagementImproved Productivity of Data Analysis Operations Automatic Spectral Evaluation(Spectral Evaluation Function)
Four Measurement Mode Windows
Ver. 1 Ver. 2 Ver. 3
Reduces operator errors.
Analysis Postrunanalysis
Postrunanalysis
Easily transfer data to external data analysis software (simultaneous text saving and matrix output functions)
Analyze data in Excel® concurrently with data measurement(Excel® data analysis real-time transfer function)
Sta
rtm
ea
sure
me
nt
Fin
ishm
ea
sure
me
nt
Fin
ish m
ea
sure
me
nts
for m
ultip
le sa
mp
les
UV-1900iUV-VIS Spectrophotometer
1514
Compatible with Validation from PC Software
Validation can be implemented with PC software by using the optionally available UV validation software.
In addition to simplifying daily inspections, this makes instrument performance checks and records management easier, enabling more
secure regulatory compliance.
• Inspection results can not only be printed but also saved to a file, so the results can be called up later for confirmation.
• The inspection parameters can also be saved to separate files for periodic and routine inspections, and then called up for use.
• The user can select confirmation of instrument performance indicators as per JIS K0115 General rules for molecular absorptiometric analysis, as well as the general test methods in the Japanese Pharmacopeia, USP and various EP inspections. (Order inspection jigs and reagents separately.)
UV-1900iUV-VIS Spectrophotometer
Full Support for Pharmacopeia, GLP/GMP, FDA 21 CFR Part 11 and Other Regulations
Improved Security Functions
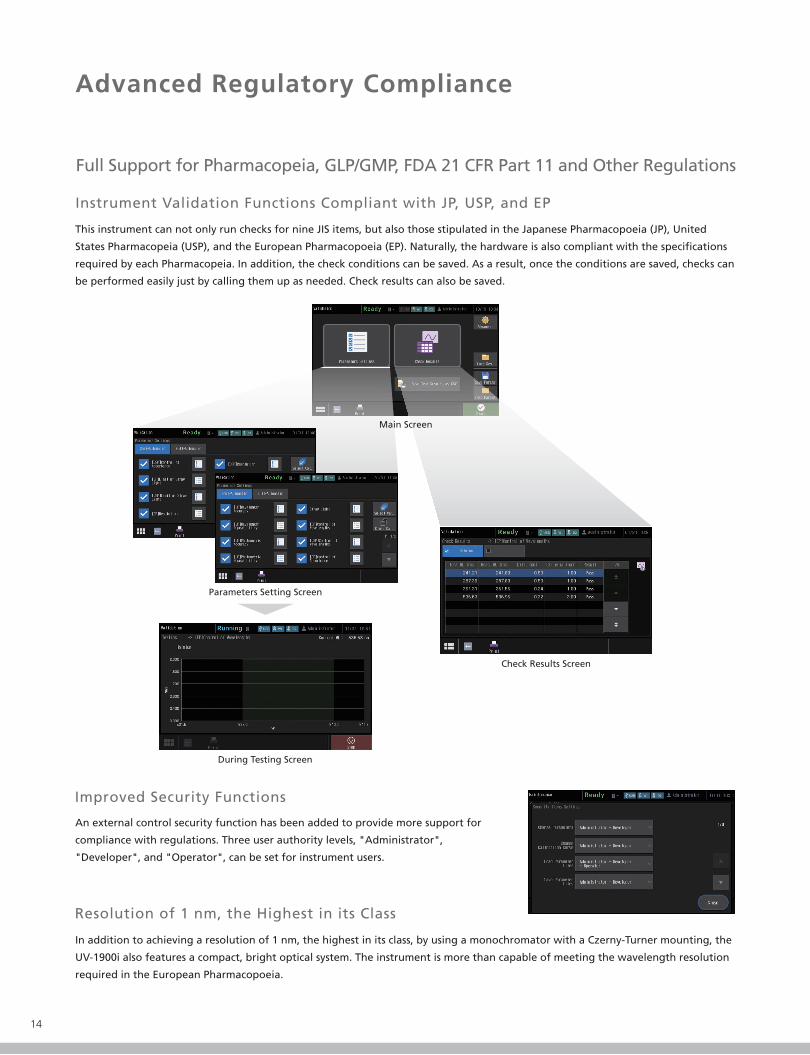
Instrument Validation Functions Compliant with JP, USP, and EP
This instrument can not only run checks for nine JIS items, but also those stipulated in the Japanese Pharmacopoeia (JP), United
States Pharmacopeia (USP), and the European Pharmacopoeia (EP). Naturally, the hardware is also compliant with the specifications
required by each Pharmacopeia. In addition, the check conditions can be saved. As a result, once the conditions are saved, checks can
be performed easily just by calling them up as needed. Check results can also be saved.
An external control security function has been added to provide more support for
compliance with regulations. Three user authority levels, "Administrator",
"Developer", and "Operator", can be set for instrument users.
Resolution of 1 nm, the Highest in its Class
In addition to achieving a resolution of 1 nm, the highest in its class, by using a monochromator with a Czerny-Turner mounting, the
UV-1900i also features a compact, bright optical system. The instrument is more than capable of meeting the wavelength resolution
required in the European Pharmacopoeia.
Advanced Regulatory Compliance
During Testing Screen
Parameters Setting Screen
Check Results Screen
Main Screen
Support for FDA 21 CFR Part 11, PIC/S GMP Guidelines and Other Regulations and Guidelines
Ensuring the integrity of data (database management), including the user management, user authority management, and data audit
trails required for compliance with FDA 21 CFR Part 11, PIC/S GMP guidelines, and other ER/ES regulations, is possible.
LabSolutions DB UV-Vis or UVProbe / LabSolutions DB System
The system allows for data management and user management
with a database. Compliant with ER/ES regulations, the system is
optimally configured for customers using a PC.
LabSolutions CS UV-Vis or UVProbe / LabSolutions CS System (Network System)
The system is optimally configured for customers who want to manage data on a server together with LC and GC data for ER/ES
compliance.
Analysis equipmentroom or an officeClient PC
LabSolutions server
LC GC GCLCCombine with Multi Data Registration license to enableintegrated management of these instruments’ data.
EDX Particle sizeanalyzer
ICPMSUV RFAcquisition
controller PC FTIR
GCMS TOCAA

1514
Compatible with Validation from PC Software
Validation can be implemented with PC software by using the optionally available UV validation software.
In addition to simplifying daily inspections, this makes instrument performance checks and records management easier, enabling more
secure regulatory compliance.
• Inspection results can not only be printed but also saved to a file, so the results can be called up later for confirmation.
• The inspection parameters can also be saved to separate files for periodic and routine inspections, and then called up for use.
• The user can select confirmation of instrument performance indicators as per JIS K0115 General rules for molecular absorptiometric analysis, as well as the general test methods in the Japanese Pharmacopeia, USP and various EP inspections. (Order inspection jigs and reagents separately.)
UV-1900iUV-VIS Spectrophotometer
Full Support for Pharmacopeia, GLP/GMP, FDA 21 CFR Part 11 and Other Regulations
Improved Security Functions
Instrument Validation Functions Compliant with JP, USP, and EP
This instrument can not only run checks for nine JIS items, but also those stipulated in the Japanese Pharmacopoeia (JP), United
States Pharmacopeia (USP), and the European Pharmacopoeia (EP). Naturally, the hardware is also compliant with the specifications
required by each Pharmacopeia. In addition, the check conditions can be saved. As a result, once the conditions are saved, checks can
be performed easily just by calling them up as needed. Check results can also be saved.
An external control security function has been added to provide more support for
compliance with regulations. Three user authority levels, "Administrator",
"Developer", and "Operator", can be set for instrument users.
Resolution of 1 nm, the Highest in its Class
In addition to achieving a resolution of 1 nm, the highest in its class, by using a monochromator with a Czerny-Turner mounting, the
UV-1900i also features a compact, bright optical system. The instrument is more than capable of meeting the wavelength resolution
required in the European Pharmacopoeia.
Advanced Regulatory Compliance
During Testing Screen
Parameters Setting Screen
Check Results Screen
Main Screen
Support for FDA 21 CFR Part 11, PIC/S GMP Guidelines and Other Regulations and Guidelines
Ensuring the integrity of data (database management), including the user management, user authority management, and data audit
trails required for compliance with FDA 21 CFR Part 11, PIC/S GMP guidelines, and other ER/ES regulations, is possible.
LabSolutions DB UV-Vis or UVProbe / LabSolutions DB System
The system allows for data management and user management
with a database. Compliant with ER/ES regulations, the system is
optimally configured for customers using a PC.
LabSolutions CS UV-Vis or UVProbe / LabSolutions CS System (Network System)
The system is optimally configured for customers who want to manage data on a server together with LC and GC data for ER/ES
compliance.
Analysis equipmentroom or an officeClient PC
LabSolutions server
LC GC GCLCCombine with Multi Data Registration license to enableintegrated management of these instruments’ data.
EDX Particle sizeanalyzer
ICPMSUV RFAcquisition
controller PC FTIR
GCMS TOCAA

UV-1900i
C101-E168A
UV-VIS Spectrophotometer
UV-1900i
© Shimadzu Corporation, 2019
www.shimadzu.com/an/
For Research Use Only. Not for use in diagnostic procedures. This publication may contain references to products that are not available in your country. Please contact us to check the availability of these products in your country.Company names, products/service names and logos used in this publication are trademarks and trade names of Shimadzu Corporation, its subsidiaries or its affiliates, whether or not they are used with trademark symbol “TM” or “®”.Third-party trademarks and trade names may be used in this publication to refer to either the entities or their products/services, whether or not they are used with trademark symbol “TM” or “®”.Shimadzu disclaims any proprietary interest in trademarks and trade names other than its own.
The contents of this publication are provided to you “as is” without warranty of any kind, and are subject to change without notice. Shimadzu does not assume any responsibility or liability for any damage, whether direct or indirect, relating to the use of this publication.
LabSolutions and Analytical Intelligence Logo are trademarks of Shimadzu Corporation. TrayCell is a registered trademark of Hellma GmbH & Co. KG. in Germany.Excel is a registered trademark or trademark of the Microsoft Corporation in the USA and other countries.
First Edition: November 2019, Printed in Japan 3655-01004-30AIT
https://www.shimadzu.com/an/molecular_spectro/uv/uv-1900/index.html
UV-1900i Website
-Automated support functions utilizing digital technology, such as M2M, IoT , and Artificial Intelligence (AI), that enable higher productivity and maximum reliability.-Allows a system to monitor and diagnose itself, handle any issues during data acquisition without user input, and automatically behave as if it were operated by an expert.-Supports the acquisition of high quality, reproducible data regardless of an operator’s skill level for both routine and demanding applications.
Top Related