


Languages
Pages
Legal


U.S. Department of LaborU.S. Department of Labor
Employment and Training AdministrationEmployment and Training Administration
The Power of DataThe Power of Data
Improving Performance through the Improving Performance through the Use of Data & Data ToolsUse of Data & Data Tools

OverviewOverview
• Public DataPublic Data Federal statistical agenciesFederal statistical agencies
State and local workforce informationState and local workforce information
• Analytical Tools & Customized Data Analytical Tools & Customized Data
ResourcesResources DOL data information sourcesDOL data information sources
Policy institutes and other research organizationsPolicy institutes and other research organizations

The Benefits of DataThe Benefits of Data
• Using public and/or Using public and/or private sector private sector
information sources information sources can help promote can help promote
the workforce vision the workforce vision of your state or of your state or
region by providing region by providing valuable insights valuable insights into performance.into performance.

The Uses of DataThe Uses of Data
• Analyze clients served; create benchmarksAnalyze clients served; create benchmarks
• Design performance planning strategiesDesign performance planning strategies
• Leverage resources more effectivelyLeverage resources more effectively
• Increase positive outcomes for workersIncrease positive outcomes for workers

Data Use ExampleData Use ExampleData can help place WIA program Data can help place WIA program
participants in the most appropriate participants in the most appropriate occupations or training programs based on occupations or training programs based on actual supply and demand for workers in a actual supply and demand for workers in a
particular industry.particular industry.


Bureau of Labor StatisticsBureau of Labor Statistics

Bureau of Labor StatisticsBureau of Labor Statistics• Current Population Survey (CPS)Current Population Survey (CPS)
• Current Employment Statistics (CES)Current Employment Statistics (CES)
• Quarterly Census of Employment and Quarterly Census of Employment and
Wages (QCEW)Wages (QCEW)
• Local Area Unemployment Statistics Local Area Unemployment Statistics
(LAUS)(LAUS)
• Occupational Employment Statistics (OES)Occupational Employment Statistics (OES)
• Mass Layoff Statistics (MLS)Mass Layoff Statistics (MLS)

Employment & Training Employment & Training AdministrationAdministration
• PY’ 07 WIA Summary of Annual PY’ 07 WIA Summary of Annual Performance DataPerformance Data

Employment & Training Employment & Training AdministrationAdministration
• Government Performance & Results Act Government Performance & Results Act (GPRA)(GPRA)

Data Tool:Data Tool: O*Net OnLine O*Net OnLineOccupation Information NetworkOccupation Information Network
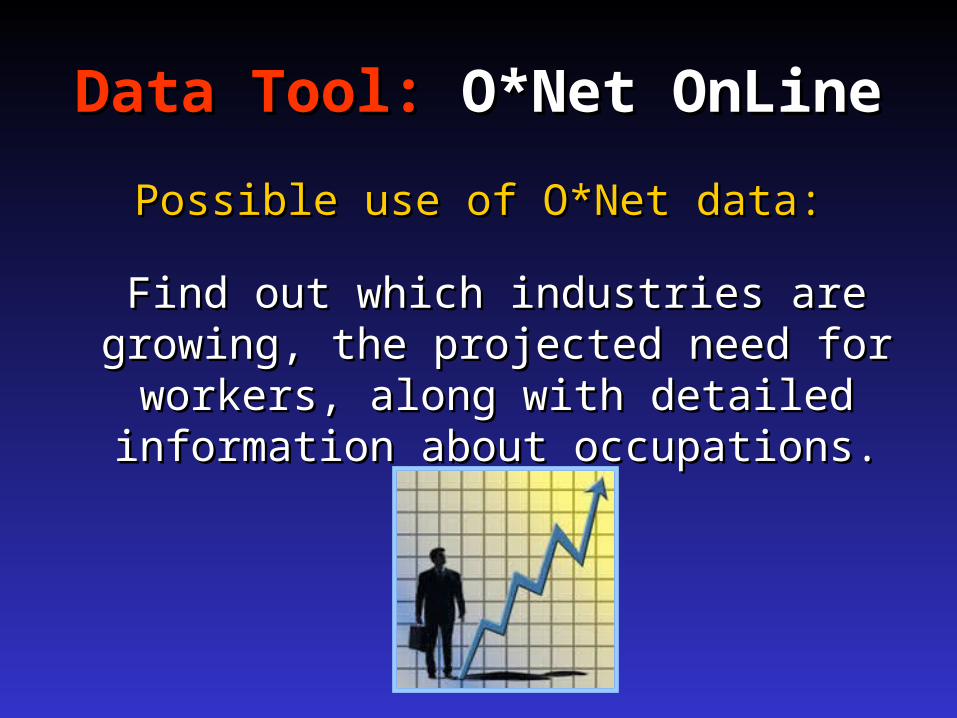
Data Tool:Data Tool: O*Net OnLine O*Net OnLine
Possible use of O*Net data:Possible use of O*Net data:
Find out which industries are growing, the Find out which industries are growing, the projected need for workers, along with projected need for workers, along with detailed information about occupations.detailed information about occupations.

Data Tool:Data Tool: America’s Career InfoNet America’s Career InfoNet
• Occupational informationOccupational information
• Industry informationIndustry information
• State informationState information
Career information delivery systemsCareer information delivery systems Career resource network sitesCareer resource network sites State employment trendsState employment trends Links to state LMI officesLinks to state LMI offices

Data Tool:Data Tool: CareerOneStop Portal CareerOneStop Portal• Besides job and resume information provides Besides job and resume information provides
state LMI data on:state LMI data on:
Fastest-growing occupationsFastest-growing occupationsOccupations with the most openingsOccupations with the most openingsOccupations with the largest employmentOccupations with the largest employmentOccupations with declining employmentOccupations with declining employmentHighest-paying occupations Highest-paying occupations Requiring only work experience or on-the-job trainingRequiring only work experience or on-the-job trainingRequiring post-secondary training Requiring post-secondary training Requiring a bachelor's degree or higherRequiring a bachelor's degree or higher

U.S. Department of CommerceU.S. Department of Commerce
• Bureau of Economic Analysis (BEA)Bureau of Economic Analysis (BEA)
• Census BureauCensus Bureau
• Survey of Income and Program ParticipationSurvey of Income and Program Participation
• Local Employment Dynamics (LED)Local Employment Dynamics (LED)
Quarterly Workforce Indicators (QWIs)Quarterly Workforce Indicators (QWIs)
Industry FocusIndustry Focus

Bureau of Economic AnalysisBureau of Economic AnalysisMap showing economic growth Map showing economic growth
by metropolitan areaby metropolitan area

Data Tool:Data Tool: Census Bureau/LED: Census Bureau/LED: Quarterly Workforce IndicatorsQuarterly Workforce Indicators

Data Tool:Data Tool: Census Bureau/LED: Census Bureau/LED: Industry FocusIndustry Focus

Census Bureau: Industry FocusCensus Bureau: Industry Focus
Possible use of QWI & Industry Focus data:Possible use of QWI & Industry Focus data:
Examine an industry in your state, county, Examine an industry in your state, county, or city to determine if its level of turnover or city to determine if its level of turnover impacts employment retention rates in impacts employment retention rates in
WIA programs.WIA programs.
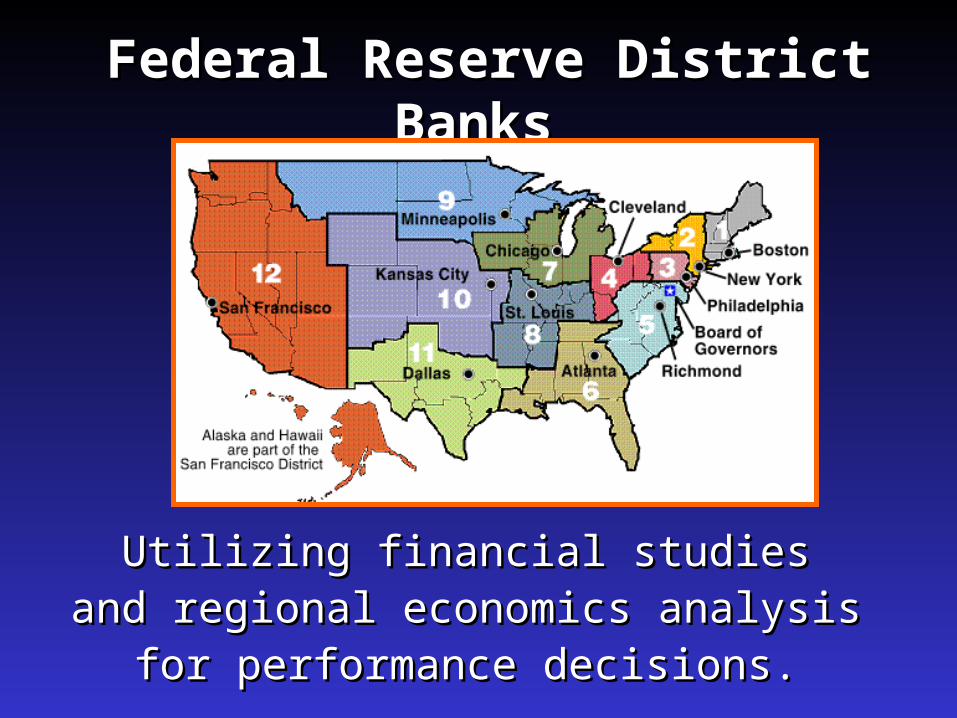
Federal Reserve District BanksFederal Reserve District Banks
Utilizing financial studies Utilizing financial studies and regional economics analysis and regional economics analysis
for performance decisions. for performance decisions.

Data Tool:Data Tool: Fedstats Fedstats• Covers over 100 different federal agenciesCovers over 100 different federal agencies

Data Tool:Data Tool: Economic Modeling Economic Modeling Services Inc. (EMSI)Services Inc. (EMSI)
Example: Economic impact reportExample: Economic impact report

Data Tool:Data Tool: Economic Modeling Economic Modeling Services Inc. (EMSI)Services Inc. (EMSI)
Example: Economic impact reportExample: Economic impact report
In Wisconsin a loss of 250 jobs in financeIn Wisconsin a loss of 250 jobs in finance
and insurance results in a total of 609 lost jobs and insurance results in a total of 609 lost jobs across industries ranging from local across industries ranging from local government, to retail, to health care, government, to retail, to health care, including the financial industry itself.including the financial industry itself.
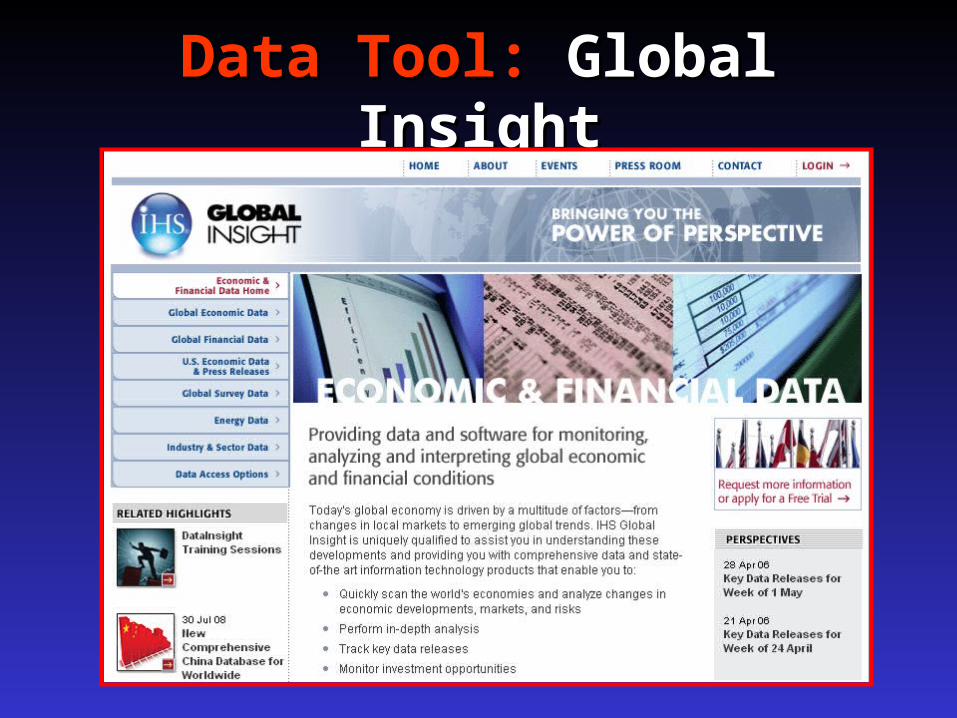
Data Tool:Data Tool: Global Insight Global Insight

Data Tool:Data Tool: Workforce Workforce Information DatabaseInformation Database
Possible use of WID data:Possible use of WID data:
Compare wages for specific occupations Compare wages for specific occupations across counties and metropolitan areas across counties and metropolitan areas
whether entry level, some experience, or whether entry level, some experience, or highly experienced.highly experienced.

Data Tool:Data Tool: The Employer The Employer DatabaseDatabase

Data Tool:Data Tool: Projections Projections WorkgroupWorkgroup
A downloadable software package with:A downloadable software package with: short-term industry employment forecastsshort-term industry employment forecasts
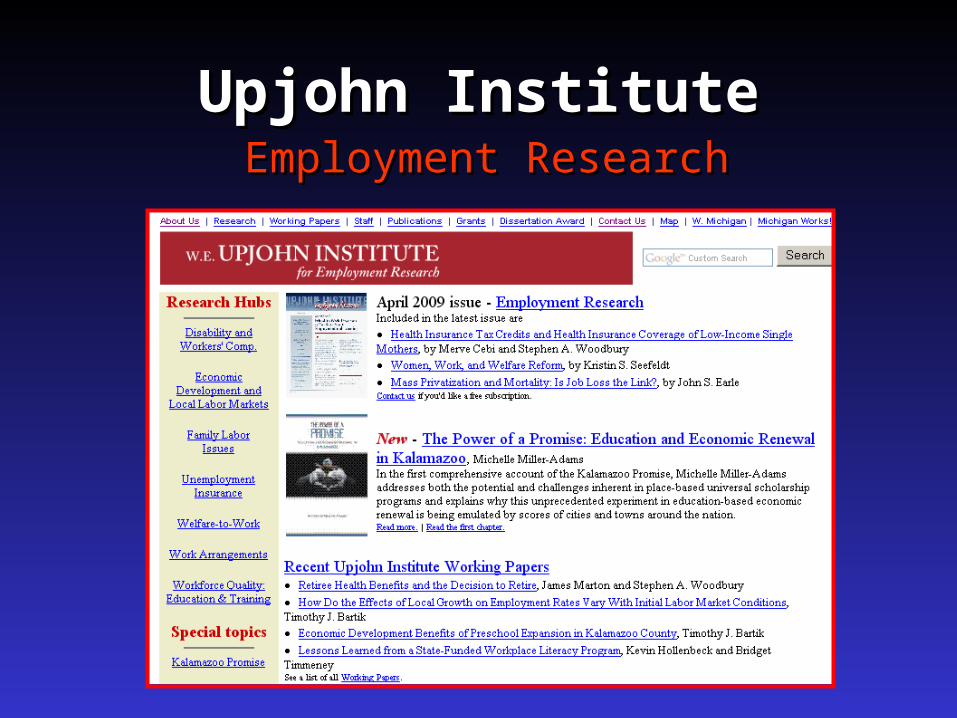
Upjohn InstituteUpjohn InstituteEmployment ResearchEmployment Research

Ways to Assess PerformanceWays to Assess Performance
Also consider…Also consider…• Before vs. after program comparisonsBefore vs. after program comparisons• Time trend projection or pre-program Time trend projection or pre-program
data vs. actual and post-program datadata vs. actual and post-program data• Comparisons with similar programsComparisons with similar programs
Comparisons of negotiated or expected Comparisons of negotiated or expected levels of performance with actual levels in levels of performance with actual levels in only one way to assess performance.only one way to assess performance.

The Federal Research and Evaluation Database (FRED) The Federal Research and Evaluation Database (FRED) enables analysis of the Trade Act Participant Report enables analysis of the Trade Act Participant Report (TAPR) and the WIA Standardized Record Data (TAPR) and the WIA Standardized Record Data (WIASRD). Both are annually submitted by states on (WIASRD). Both are annually submitted by states on exiters' demographic characteristics, the services they exiters' demographic characteristics, the services they received, and the outcomes they achieved after exit. received, and the outcomes they achieved after exit.
Data Tool:Data Tool: Federal Research Federal Research & Evaluation Database & Evaluation Database
(FRED)(FRED)
www.fred-info.orgwww.fred-info.org

Data Tool:Data Tool: Federal Research & Federal Research & Evaluation Database (FRED)Evaluation Database (FRED)

Data Tool:Data Tool: Federal Research & Federal Research & Evaluation Database (FRED)Evaluation Database (FRED)
Drill down-all measuresDrill down-all measures
Drill down by measureDrill down by measure
Benchmark performance against peersBenchmark performance against peers
Create a performance adjustment model and worksheetCreate a performance adjustment model and worksheet
Calculated performance by rolling quartersCalculated performance by rolling quarters
Profiles by program areaProfiles by program area
Find the top performers for a given performance Find the top performers for a given performance measuremeasure
Ad hoc analysisAd hoc analysis

Data Tool:Data Tool: Federal Research & Federal Research & Evaluation Database (FRED)Evaluation Database (FRED)

Data Tool:Data Tool: Federal Research & Federal Research & Evaluation Database (FRED)Evaluation Database (FRED)

Data Tool:Data Tool: Federal Research & Federal Research & Evaluation Database (FRED)Evaluation Database (FRED)
• Allows for analysis of exiters' demographic Allows for analysis of exiters' demographic characteristics, the services they received, characteristics, the services they received, and the outcomes they achieved after exit.and the outcomes they achieved after exit.

What’s Involved in Analyzing What’s Involved in Analyzing Results?Results?
• Review reports summarizing performance on Review reports summarizing performance on the common measures, other federal the common measures, other federal measures, and/or project-specific measuresmeasures, and/or project-specific measures
• Talk to staff and others with first-hand Talk to staff and others with first-hand knowledge of the program and its operationknowledge of the program and its operation
• Generate questions related to the logic of the Generate questions related to the logic of the program design and current environmentprogram design and current environment
• Develop a list of performance issuesDevelop a list of performance issues

Fishbone Diagram ExampleFishbone Diagram Example
Low Performa
nce on the
Certificate Rate
Low Performa
nce on the
Certificate Rate
Potential Contributing
Factor
Data Source?
Potential Contributing
Factor
Potential Contributing
Factor
Increased # of youth with multiple barriersIncreased # of youth with multiple barriers
Certificates not recordedCertificates not recorded
High training drop-out rateHigh training drop-out rate
Late project start-upLate project start-up
Potential Contributing
Factor
Potential Contributing
Factor
Potential Contributing
Factor
Data Source?
MIS/Reason for dropping out
MIS/Part. file documentation
MIS/Part. file assessments
Monitoring reports

Communicating ResultsCommunicating Results
• Written reportWritten report• Data bookData book• FlyerFlyer• Formal oral presentationFormal oral presentation• Round table with partners/stakeholdersRound table with partners/stakeholders• PosterPoster• Web siteWeb site
Whatever Delivery Strategy You Whatever Delivery Strategy You Choose:Choose:
• Link findings to the program’s outputs Link findings to the program’s outputs and desired outcomesand desired outcomes
• Include successes and challengesInclude successes and challenges• Support your claims with dataSupport your claims with data• Acknowledge knowledge gapsAcknowledge knowledge gaps
ConclusionConclusion
By using a combination of public data from By using a combination of public data from
federal, state and local sources in federal, state and local sources in
conjunction with available private sources, conjunction with available private sources,
policy makers and workforce professionals policy makers and workforce professionals
can make better informed decisions, which can make better informed decisions, which
can positively impact performance can positively impact performance
outcomes.outcomes.

Questions & Comments?Questions & Comments?
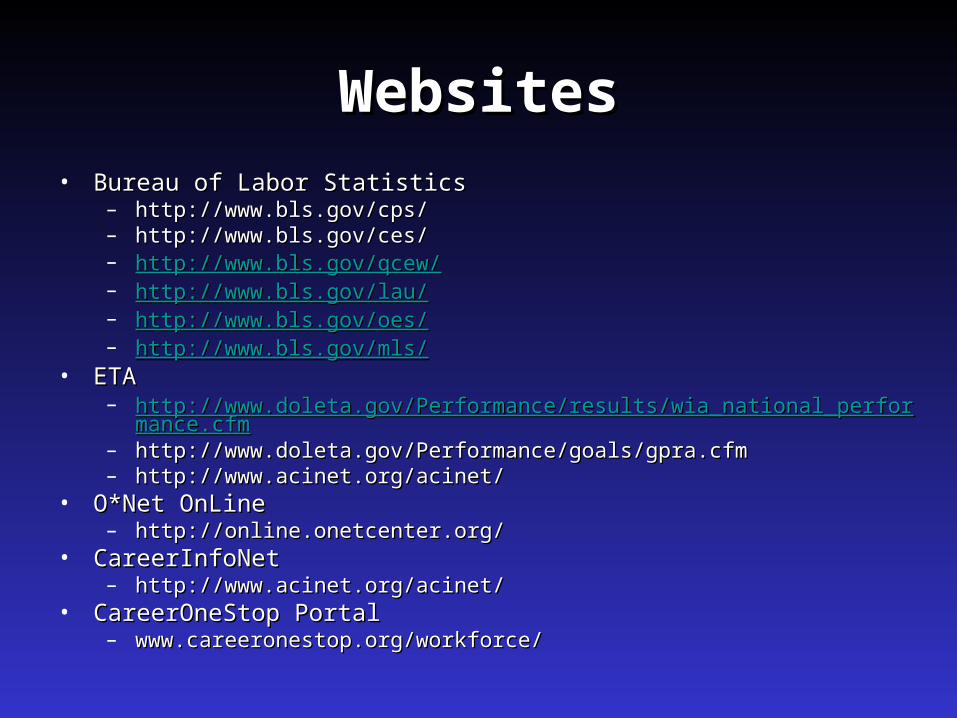
WebsitesWebsites• Bureau of Labor StatisticsBureau of Labor Statistics
– http://www.bls.gov/cps/http://www.bls.gov/cps/– http://www.bls.gov/ces/http://www.bls.gov/ces/– http://www.bls.gov/qcew/http://www.bls.gov/qcew/– http://www.bls.gov/lau/http://www.bls.gov/lau/– http://www.bls.gov/oes/http://www.bls.gov/oes/– http://www.bls.gov/mls/http://www.bls.gov/mls/
• ETAETA– http://www.doleta.gov/Performance/results/wia_national_performance.cfmhttp://www.doleta.gov/Performance/results/wia_national_performance.cfm– http://www.doleta.gov/Performance/goals/gpra.cfmhttp://www.doleta.gov/Performance/goals/gpra.cfm– http://www.acinet.org/acinet/http://www.acinet.org/acinet/
• O*Net OnLineO*Net OnLine– http://online.onetcenter.org/http://online.onetcenter.org/
• CareerInfoNetCareerInfoNet– http://www.acinet.org/acinet/http://www.acinet.org/acinet/
• CareerOneStop PortalCareerOneStop Portal– www.careeronestop.org/workforce/www.careeronestop.org/workforce/

WebsitesWebsites• US Department of CommerceUS Department of Commerce
– http://www.commerce.gov/http://www.commerce.gov/– http://www.bea.gov/http://www.bea.gov/– http://http://www.bea.gov/regional/index.htm#gspwww.bea.gov/regional/index.htm#gsp– http://http://lehd.did.census.gov/led/datatools/datatools.htmllehd.did.census.gov/led/datatools/datatools.html– http://lehd.did.census.gov/led/datatools/qwiapp.htmlhttp://lehd.did.census.gov/led/datatools/qwiapp.html
• Federal Reserve District BanksFederal Reserve District Banks– http://www.federalreserve.gov/OTHERFRB.HTMhttp://www.federalreserve.gov/OTHERFRB.HTM
• FedstatsFedstats– http://www.fedstats.gov/http://www.fedstats.gov/
• EMSIEMSI– http://www.economicmodeling.com/http://www.economicmodeling.com/
• Global InsightGlobal Insight– http://www.economicmodeling.com/http://www.economicmodeling.com/
• Labor Market Information Training Institute & WIDLabor Market Information Training Institute & WID– http://www.lmi-net.orghttp://www.lmi-net.org//– http://www.almisdb.org/http://www.almisdb.org/
• Employer DatabaseEmployer Database– http://www.infousagov.com/employer.asphttp://www.infousagov.com/employer.asp
• Projections WorkgroupProjections Workgroup– http://dev.projectionscentral.com/http://dev.projectionscentral.com/
• Upjohn InstituteUpjohn Institute– http://www.upjohninst.org/http://www.upjohninst.org/
• Federal Research & Evaluation DatabaseFederal Research & Evaluation Database– http://www.fred-info.orghttp://www.fred-info.org
Top Related