


Languages
Pages
Legal


URBANIZATION, NUTRITION TRANSITION, AND OBESITY: EVIDENCE
FROM CHINA
by
Song Zhou
A thesis submitted to the Faculty of the University of Delaware in partial fulfillment of the requirements for the degree of Master of Science in Agricultural and Resource Economics
Spring 2013
© 2013 Song Zhou All Rights Reserved

URBANIZATION, NUTRITION TRANSITION, AND OBESITY: EVIDENCE
FROM CHINA
by
Song Zhou
Approved: __________________________________________________________ Titus O. Awokuse, Ph.D. Professor in charge of thesis on behalf of the Advisory Committee Approved: __________________________________________________________ Titus O. Awokuse, Ph.D. Chair of the Department of Applied Economics and Statistics Approved: __________________________________________________________ Mark W. Rieger, Ph.D. Dean of the College of Agriculture and Natural Resources Approved: __________________________________________________________ James G. Richards, Ph.D. Vice Provost for Graduate and Professional Education

iii
ACKNOWLEDGMENTS
I would never have been able to finish this thesis without the support of
many people. First and foremost I would like to express my utmost gratitude to my
advisor Professor Titus Awokuse, for his support and encouragement through my
graduate study. His illuminating guidance and incredible patience, has made
immeasurable contribution in every stage of the writing of this thesis. Moreover, he has
always been supportive, encouraging and inspiring in every step of my academic
progress while at the University of Delaware. I sincerely appreciate Professor Thomas
Ilvento and Professor John Bernard for their extensive knowledge and insightful advice
on my thesis work. With the guidance of my thesis committee members, this
challenging thesis work has proved to be an enjoyable and wonderfully rewarding
learning experience.
I greatly benefited from research assistance from Yue Tan, who has always
been helpful on my thesis. Also, I would like to extend my appreciation to Professor
Siyan Wang for her advice on econometric methods in this thesis.
I owe my sincere gratitude to Professor James Butkiewicz and Professor
Jeffrey Miller, for their insightful advice and generous help in my study on Economics
and in my pursuit of academic career.
Also, I would like to extend my appreciation to Erma Wolpert and Margaret
Brumit for helping out with all the administrative needs during my graduate study.
I would like to thank my fellow students in the Department of Applied
Economics and Statistics, and in the Department of Economics. They have made my

iv
life very enjoyable in the University of Delaware in these two years. Especially, my
sincere gratitude goes to Ruizhi Xie and Weibiao Li.
Finally, I would like to take this opportunity to express my deepest
gratitude to my parents for their endless support, encouragement and caring through all
these years. Without their support, I would not have been able to make this
accomplishment.
v
TABLE OF CONTENTS
LIST OF TABLES ....................................................................................................... vii LIST OF FIGURES ..................................................................................................... viii ABSTRACT .................................................................................................................. ix Chapter 1 INTRODUCTION ................................................................................................ 1
1.1 Motivation .................................................................................................... 1 1.2 Objectives ..................................................................................................... 4 1.3 Contribution .................................................................................................. 5
2 LITERATURE REVIEW ..................................................................................... 7
2.1 Empirics of Urbanization and Health Outcomes in China ........................... 7 2.2 Nutrition Transition and Obesity ................................................................ 10 2.3 Obesity and Some Related Factors ............................................................. 15
2.3.1 Population Density ............................................................................ 15 2.3.2 Food Price .......................................................................................... 16 2.3.3 Education ........................................................................................... 17 2.3.4 Fast Food ........................................................................................... 18
3 DATA ................................................................................................................. 20
3.1 Data Source ................................................................................................ 20 3.2 Obesity and Nutrition ................................................................................. 21 3.3 Urbanization ............................................................................................... 22 3.4 Food Prices ................................................................................................. 24 3.5 Individual Characteristics ........................................................................... 25 3.6 Statistical Summary .................................................................................... 27
4 ECONOMETRIC METHODS ........................................................................... 30
4.1 Background ................................................................................................. 30 4.2 Panel Data Regression, ............................................................................... 32 4.3 Model Specification .................................................................................... 36

vi
5 RESULTS ........................................................................................................... 40
5.1 Results of Model Specification Tests and Diagnostic Tests ....................... 40 5.2 Urbanization and Obesity ........................................................................... 42
5.2.1 Full Sample Results ........................................................................... 42 5.2.2 Gender Differences ............................................................................ 44 5.2.3 Regional Differences ......................................................................... 46
5.3 Urbanization and Nutrition Transition ........................................................ 46
CONCLUSION ............................................................................................................ 48
TABLES ....................................................................................................................... 52
FIGURES ..................................................................................................................... 62
REFERENCES ............................................................................................................. 68

vii
LIST OF TABLES
Table 1: Descriptive Statistics of Variables .................................................................. 52 Table 2: Descriptive Statistics by Gender Groups ........................................................ 53 Table 3: Effects of Urbanization on Obesity ................................................................ 54 Table 4: Effects of Urbanization on Obesity for Males ................................................ 56 Table 5: Effects of Urbanization on Obesity for Females ............................................ 58 Table 6: Effects of Urbanization on Obesity by Provinces........................................... 60 Table 7: Effects of Urbanization on Nutrition .............................................................. 61
viii
LIST OF FIGURES
Figure 1: Percentage of Urban Population to Total Population .................................... 62 Figure 2: Trend of BMI Average Level ........................................................................ 63 Figure 3: Trend of TSF Average Level ......................................................................... 64 Figure 4: Trend of Urbanization Index Average Level ................................................. 65 Figure 5: Fraction of Overweight (25≤BMI<30) People in Population ....................... 66 Figure 6: Fraction of Obese (30<BMI) People in Population ...................................... 67
ix
ABSTRACT
This thesis explores the effects of urbanization on nutrition transition and
obesity. Taking adult individuals from a longitudinal dataset, the China Health and
Nutrition Survey (CHNS), from the year 1989 to 2009, this study uses the fixed effects
model to examine the effects of urbanization on nutrition transition and obesity,
controlling for community-level food prices and individual characteristics. The
findings confirm the hypothesis that rising urbanization has positive effects on the
obesity level in the adult population in China. Also, the results reveal a nutrition
transition towards a dietary pattern of more fat and protein intake, which is consistent
with previous studies.
The regression analysis uses Body Mass Index (BMI) as measurement for
body weight and Triceps Skin Fold (TSF) for body fat. The empirical results show that
urbanization has positive effect on BMI, but the effect is not statistically significant for
TSF. Evidence from the analysis on gender difference indicates that the effect of
urbanization on obesity is more pronounced for females than for males. For regional
difference, Heilongjiang and Hubei, among other provinces, appear to have consistent
results for urbanization’s positive effect on obesity levels. This study also indicates
price effects of food on the obesity level, and confirms the previous empirical

x
evidence that obesity corresponds to food price changes. Individual characteristics act
as significant predictors for obesity level. The effect of education on obesity yields
mixed results. And physical activity has negative effect on BMI. Income has negative
effect on obesity level in females.
1
Chapter 1
INTRODUCTION
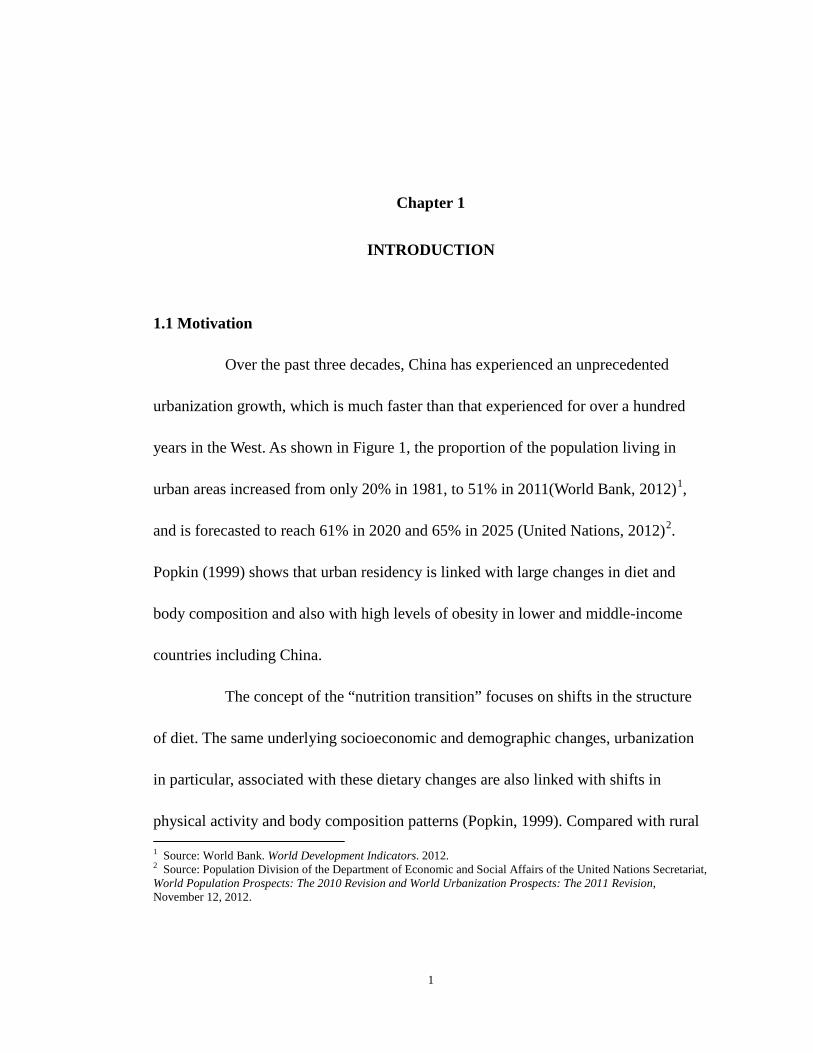
1.1 Motivation
Over the past three decades, China has experienced an unprecedented
urbanization growth, which is much faster than that experienced for over a hundred
years in the West. As shown in Figure 1, the proportion of the population living in
urban areas increased from only 20% in 1981, to 51% in 2011(World Bank, 2012)1,
and is forecasted to reach 61% in 2020 and 65% in 2025 (United Nations, 2012)2.
Popkin (1999) shows that urban residency is linked with large changes in diet and
body composition and also with high levels of obesity in lower and middle-income
countries including China.
The concept of the “nutrition transition” focuses on shifts in the structure
of diet. The same underlying socioeconomic and demographic changes, urbanization
in particular, associated with these dietary changes are also linked with shifts in
physical activity and body composition patterns (Popkin, 1999). Compared with rural 1 Source: World Bank. World Development Indicators. 2012. 2 Source: Population Division of the Department of Economic and Social Affairs of the United Nations Secretariat, World Population Prospects: The 2010 Revision and World Urbanization Prospects: The 2011 Revision, November 12, 2012.

2
diets, urban diets exhibit trends toward consumption of more milled and polished
grains, food higher in fat, more animal products, more sugar, more food prepared
away from the home, and more processed foods (Popkin and Bisgrove, 1988; Popkin
et al. 1993). The developing world is facing dramatic changes in food availability,
dietary patterns, and life style. These changes constitute “nutrition transition” and
bring about health consequences, particularly obesity. And those changes in diet and
activity patterns are fueling the obesity epidemic (Popkin, 2001b).
China is unique among countries in nutrition transition because of the
extraordinary pace at which these changes are occurring and also because of its size in
population. The classic Chinese diet based on rice and vegetables is being replaced by
increasing amounts of animal products and a Western-type diet profile. Take the fast
food restaurants as an example, the restaurant counts of “Yum! Brands” in China
(including Pizza Hut and KFC), grew from 2558 to 4493 during the 5 year from 2007
to 2011 with annual growth rate of 12%, compared with 3% worldwide in the same
period of time3. At the same time, economic and technological development has
dramatically lowered the energy demands of work and daily living, thus increasing the
risk of a positive energy balance and excess weight gain (Weng and Caballero, 2007).
3 http://www.yum.com/investors/restcounts.asp

3
Wang et al. (2007) show that the prevalence of overweight and obesity
increased in all gender and age groups and in all geographic areas in China in the
period between 1992 and 2002. The prevalence of overweight and obesity increased
from 14.6 to 21.8%. Also, Wildman et al. (2008) evaluate trends in BMI and the
prevalence of overweight and obesity between 1991 and 1999-2000 among Chinese
adults. The results show that the prevalence of overweight and obesity increased in all
age groups in rural and urban areas.
Obesity has been linked to several diseases including high cholesterol,
diabetes, hypertension, and asthma (Kopelman, 2000; Koplan and Diez, 1999; Peeters
et al., 2003; Wellman and Friedberg, 2002). In addition, obesity-related morbidity has
been estimated to account for a significant share of total medical expenditures in
China. The total medical cost attributable to overweight and obesity was estimated at
about 2.74 billion dollars accounting for 3.7% of national total medical costs in 2003
(Zhao et al., 2008). Therefore, the obesity level in the population of China with rising
urbanization is worth addressing.
There has been a growing body of empirical evidence focusing on the
causes and effects of obesity, and on nutrition transition in developing countries.
However, only a few have addressed the impact of urbanization on nutrition transition
and obesity levels (Popkin, 1999; Van de Poel et al., 2009). Previous studies have

4
investigated the comparison between urban and rural diets, the difference of which
could lead to diet structure change within the urbanization process. Some have shown
that urban residency is linked to transitions of diet structure and also with increasing
levels of obesity in lower and middle-income countries (Popkin 1993, 1994, 1998,
1999, 2001b). Those studies use very few panels of survey individuals for
urbanization and its effects on diet and physical activity patterns. However, that short
period of time can not sufficiently reveal the dynamics of nutrition transition and
obesity in the scenario of urbanization. Thus, panels with more time periods need to be
included in the analysis to evaluate the relationship between urbanization, nutrition
transition, and obesity.
1.2 Objectives
This thesis aims to explore the effects of urbanization on nutrition
transition and obesity level in China. This analysis uses an urbanization index which
incorporates a comprehensive representation of urbanization growth across China, to
evaluate the impact of urbanization on body weight and body fat over time, as well as
on changes in diet structure. Also, this study examines whether variation in food prices
could affect the obesity level by inducing the changes in diet pattern. Previous studies
find some empirical evidence that when the prices of staple cooking oil become

5
cheaper relative to other food, people will consume more of it. And because cooking
oil is the most energy-dense of all foods, such a food substitution can lead to a higher
level of calorie intake (Lu and Goldman, 2010). In addition, the regression analysis
controls for individual characteristics, such as age, income, education, and physical
activity levels, to examine the effects of these individual factors on nutrition transition
and obesity. Moreover, this thesis would examine the role of gender and regional
differences in explaining the impact of urbanization on nutrition transition and obesity.
1.3 Contribution
This study expands the previous literature in three aspects. First, this study
analyzes more recent data than previous studies and includes more dynamics by using
more panels of the longitudinal survey data. Following Popkin (1999), which is
basically a static analysis on urbanization, nutrition transition, and obesity, I further
explore the changes in dynamics. Compared with Popkin (1999), which used 3 waves
of data, including 1989, 1991, and 1993, this study uses 8 panel data waves from 1989
to 2009.
Second, variation in food prices can have effects on obesity by influencing
individuals’ diet patterns (Lu and Goldman, 2010). This study incorporates food prices,
as a group of control variables along with other control variables of individual

6
characteristics, such as age, gender, educational attainment, income levels, and
physical activity levels. Following the empirical method of Lu and Goldman (2010), I
employ the fixed effects model using a larger time span for exploring dynamic
changes in nutrients intake and obesity level in the scenario of urbanization in China. I
use BMI for body weight and TSF for body fat as proxies for obesity as comparison. I
set the urbanization index at community-level as the key regressor along with other
covariates, as community-level relative prices of cooking oil, and individual-level
characteristics. Departing from Lu and Goldman (2010), who use 3 different settings
of relative prices, I use staple food, pork, and vegetable prices deflated by edible oil
prices as a uniform model specification. Also, I introduce an interaction term of
education attainment and income level as an explanatory variable.
Third, the analysis will extend to gender and regional differences, which
could provide additional insight on the linkage between urbanization and obesity level
in China. This could reveal more specific demographic patterns in nutrition and
obesity in the scenario of urbanization.
The remainder of the thesis proceeds as follows. The next section covers
literature review. Section 3 presents descriptions of data. Section 4 introduces the
econometric methodology. The empirical results are discussed in Section 5, and
Section 6 concludes the study.
7
Chapter 2
LITERATURE REVIEW
2.1 Empirics of Urbanization and Health Outcomes in China
Previous studies have investigated the linkages between urbanization and
health outcomes, such as physical activity, overweight, hypertension and so on (Liu et
al., 2003; Monda et al., 2007; Van de Poel et al., 2009; Jones-Smith and Popkin, 2010;
Van de Poel et al., 2011).
Liu et al. (2003) examine the impact of urbanization on rural health care
and insurance. The empirical analysis uses a logistic model with data from China
Health and Nutrition Survey, from 1989 to 1993. The results indicate that urbanization
leads to a significant and equitable increase in insurance coverage, which in turn plays
a critical role in access to health care. Urbanization can help make substantial changes
in rural health care and insurance status.
Monda et al. (2007) examine the effect of rapid urbanization on adult
occupational physical activity in China. Longitudinal data was taken from individuals
aged 18 to 55 from the years 1991 to 1997 of the China Health and Nutrition Survey.
8
Logistic multi-level regression analyses indicates that men have 68% greater odds, and
women have 51% greater odds, of light versus heavy occupational activity given the
mean change in urbanization over the 6-year period. Further, simulations show that
light occupational activity increases linearly with increasing urbanization. After
controlling for individual-level predictors, community-level urbanization explains
54% and 40% of the variance in occupational activity for men and women,
respectively. The empirical results show a reduction in the intensity of occupational
activity with urbanization which indicates a risk of dramatic increase in the numbers
of overweight and obese individuals.
Van de Poel et al. (2009) construct an index of urbanicity from longitudinal
data on community characteristics from the China Health and Nutrition Survey. They
compute a rank-based measure of inequality in disease risk factors by degree of
urbanicity. Prevalence rates of overweight and hypertension almost doubled between
1991 and 2004. Decomposition analysis reveals that one-half of the urbanicity-related
inequality in overweight is directly owing to community level characteristics.
Meanwhile for hypertension the contribution of such characteristics increased from
20% in 1991 to 62% in 2004. At the individual level, lower engagement in physical
activity and farming explains more than half of the urban concentration of overweight
and a rising share (28%) of the greater prevalence of hypertension in more urbanized

9
areas. Higher income explains around one-tenth of the urban concentration of both
overweight and hypertension. While the education advantage of urban populations has
a similar sized offsetting effect.
Jones-Smith and Popkin (2010) utilize established scaling procedures from
the psychometric literature to construct and evaluate a multi-component scale to
measure urban features on a continuum in China. The fixed effects regression of
change in a community’s level of urbanicity and change in an individual’s percentage
of total energy from fat, indicate that increasing community urbanicity is associated
with increasing energy from fat. In addition, the results from the analogous logistic
regression, indicates that there is no significant difference between urban and rural
places on the odds of overweight and obesity.
Van de Poel et al. (2011) estimate the net health impact of China’s
unprecedented urbanization. The study uses community and individual level
longitudinal data from the China Health and Nutrition Survey. An index of urbanicity
is constructed from a broad set of community characteristics; and urbanization is
defined in terms of movements across the distribution of this index. The empirical
analysis employs difference-in-difference estimators to identify the treatment effect of
urbanization on the self-assessed health of individuals. The results show that

10
urbanization raises the probability of reporting poor health and that a greater degree of
urbanization has a larger effect.
2.2 Nutrition Transition and Obesity
In the previous literature, some take the perspective of nutrition transition
on addressing the obesity issues. (Popkin, 1993, 1994, 1996, 1998, 1999, 2001a,
2001b, 2004). The concept of nutrition transition is used to capture the dynamic nature
of diet, particularly large shifts in its overall structure. Many of the same factors that
explain shifts in diet also explain those in physical activity and body composition. The
changes in diet and physical activity are reflected in nutritional outcomes such as
stature and body composition. Moreover, these changes are paralleled by changes in
life style and health status, as well as by major demographic and socioeconomic
changes (Popkin, 1998).
Popkin (1993) provides a framework that accommodates the dynamic
nature of diet and the relationship of diet and economic, social, demographic, and
health factors. Dietary changes are reflected in nutritional outcomes, such as changes
in average stature and body composition. Popkin (1993) puts forward some
propositions as an approach to understand the nutrition transition. Notably, major
shifts in population growth, age structure, and spatial distribution are closely

11
associated with nutritional trends and dietary change. Urbanization process, which
related to spatial distribution, is closely associated with nutritional trends and dietary
change.
Also, for the majority of developing world, evidence of increasing obesity
along with nutrition transition is found significant (Popkin, 1994, 1998, 1999, 2001b;
Popkin and Doak, 1998; Popkin and Gordon-Larsen. 2004). Diets of the developing
world are shifting rapidly, particularly with respect to fat (edible oil for example),
caloric sweeteners, and animal source foods. Obesity shifts in adults are occurring
globally, while changes in the developing world are faster than in higher-income
countries (Gordon-Larsen. 2004).
Popkin et al. (1993) explore China's recent history with respect to nutrition
and identify patterns of under and over-nutrition. The finding shows that higher
income levels, particularly in urban areas, are associated with consumption of a diet
higher in fat and with problems of obesity.
Popkin (1994) finds evidence of changes and trends in dietary intake,
physical activity, and body composition patterns in low-income countries. These
changes vary significantly over time, along with problems of under- and over-nutrition
often coexist, reflecting the trend in which an increasing proportion of people consume
the types of diets associated with a number of chronic diseases. China, as a case study,

12
has undergone very rapid dietary changes. Using data from China Health and Nutrition
Survey, the study finds a high-fat diet is significantly more common in urban and
higher income populations than in rural and lower income ones.
Popkin (1996) presents an overview of nutrition transition and experiences
in China and Russia with monitoring of economic and health changes. Dietary changes
are evident in changes in average stature and body composition and parallel major
changes in health status. Nutritional trends and dietary change are associated with
population growth, age structure, and spatial distribution. Urban population has a
distinctly different diet from rural population. Urban diets include superior grains,
more milled and polished grains, higher fat content, more animal products, more sugar,
and more prepared and processed food. Urban and rural diets are farther apart in
low-income countries. Diet and activity are affected by income, patterns of work, and
socioeconomic changes.
Popkin (2001a) illustrates an increase from 22.8% to 66.6% in the
proportion of adults consuming a higher-fat diet in 1989 to 1993, rapid shifts in the
structure of diet as income changes, and important price relationships in China. These
reflect a substantial shift in eating preferences, induced mainly by shifts in income,
prices and food availability, also by the modern food industry and the mass media.
Moreover, the remarkable shift in the occupations structure in lower-income countries
13
from agricultural labor towards employment in manufacturing and service sectors
implies a reduction in energy expenditure. One consequence of the nutrition transition
has been a decline in under-nutrition accompanied by a rapid increase in obesity. Also
there are significant differences between urban and rural dietary patterns, particularly
regarding the consumption of food prepared away from home. Furthermore, the shift
towards a diet higher in fat and meat and lower in carbohydrates and fiber, together
with the shift towards less physical activity, brings about negative nutritional and
health effects.
Du et al. (2002) explore the long-term shifts in the nutrition transition and
the full implications of these changes in the Chinese diet. Using data from China
Health and Nutrition Survey from 1989 to 1997, China National Nutrition Survey
from 1982 to 1992, the annual household consumption surveys of the State Statistical
Bureau, and the Annual Death Report of China, the study finds that the total energy
intake of residents has decreased, as has energy expenditure, large changes in the
composition of energy have occurred. The overall proportion of energy from fat
increased quickly, reaching an overall average of 27.3% and 32.8% for urban residents
in 1997. Large shifts towards increased inactivity at work and leisure occurred. These
changes are linked with rapid increases of overweight, obesity and diet-related
non-communicable diseases as well as total mortality for urban residents.

14
Paeratakul et al., (1998) examine the relationship between diet, particularly
dietary fat intake, and BMI, taking the Chinese adults aged 20 to 45 as a study sample
from China Health and Nutrition Survey. Multiple regression analysis is employed to
examine the cross-sectional relationship between diet and BMI at baseline (1989)
survey, controlling for other biological and socio-economic factors. The results
indicate that diet is becoming an increasingly important determinant of body weight in
that population.
Ng et al. (2008) investigate the price policy effects on edible oil in China.
With four waves of data collected in 1991, 1993, 1997 and 2000 from the China
Health and Nutrition Survey, this analysis uses a longitudinal random effects probit
model and a longitudinal random effects generalized least squares model. The findings
reveal that price policy effects on edible oil can influence dietary composition
(particularly of the poor) in China.
Lu and Goldman (2010) study the effects of relative food prices on obesity
in China. The study employs pooled OLS regressions, random effects model, and
fixed effects model. Using the longitudinal data from China Health and Nutrition
Survey, from 1991 to 2006, they find that the decreases in the price of energy-dense
foods have consistently led to elevated body fat, but the price effect does not always
hold for body weight. The results suggest that changes in food consumption patterns

15
induced by varying food prices can increase the percentage of body fat to risky levels
even without substantial weight gain.
The nutrition transition in developing countries is associated with a major
shift from the consumption of staple crops and whole grains to processed foods. Asfaw
(2011) examines the contribution of processed foods consumption to the prevalence of
overweight and obesity in Guatemala. The results show that all other things remaining
constant, a 10% point increase in the share of partially processed foods from the total
household food expenditure increases the BMI by 3.95%. Moreover, the impact of
highly processed foods is much stronger.
2.3 Obesity and Some Related Factors
There are another strand of literature focus on specific factors related to
obesity, such as population density (Zhao and Kaestner, 2010), food prices (Goldman
et al., 2009; Lakdawalla and Philipson, 2002), education (Anderson et al., 2011;
Webbink et al., 2010), fast food (Powell, 2009; Chou et al., 2004).
2.3.1 Population Density
Zhao and Kaestner (2010) examine the effect of changes in population
density on obesity of residents in metropolitan areas in the U.S. between 1970 and

16
2000. The empirical analysis addresses the possible endogeneity of population density
by using a two-step instrumental variables approach. The empirical evidence indicates
a negative relationship between population density and obesity. Specifically, the
estimates imply that if the average metropolitan area had not experienced the decline
in the proportion of population living in dense areas over the last 30 years, the rate of
obesity would have been reduced by approximately 13%. Notably, the urban sprawl in
the study of Zhao and Kaestner (2010) contrasts with the scenario of urbanization in
my thesis. Urban sprawl in the U.S. from 1970 to 2000 can be regarded as a post
industrialized and post urbanization era. While in China in the past decades,
urbanization is a typical transition among developing world towards a more
industrialized and more urbanized country. Due to the different stages of economic
growth and urbanization development, the comparison of the results of Zhao and
Kaestner (2010) and this thesis should be cautious.
2.3.2 Food Price
The growth in weight has been related to how individuals respond to
changes in food price. Goldman et al. (2009) study the short-run and long-run body
weight consequences of changing food prices. The study employs a fixed effects
model, using health data from the Health and Retirement Study (HRS), a biennial

17
survey of the population over age 50 and food price data. The results show very
modest short-term effects of price per calorie on body weight, while the long-term
effect is much bigger, but it takes a long time for the effect to reach the full scale. The
results suggest that policies raising the price of calories will have little effect on
weight in the short term, but might curb the rate of weight growth and achieve weight
reduction over a very long period of time.
Lakdawalla and Philipson (2002) present a dynamic theory of body weight.
Also, they conduct an empirical analysis with linear regression model, using data from
National Health Interview Survey. They argue that technological change has induced
weight growth by lowering food prices through agricultural innovation.
2.3.3 Education
Previous literature also documents the association between education and
obesity. Anderson et al. (2011) investigate the impact of attending school on body
weight and obesity. Using a regression-discontinuity design, the study compares
weight outcomes of similar age children with one versus two years of school exposure
due to regulations on school starting age. The results show that school exposure is
related to unobserved determinants of child weight. If this endogeneity is not taken
into account, it appears that an additional year of school exposure results in a greater

18
BMI and a higher probability of being overweight or obese. When actual exposure is
instrumented with predicted school exposure in a regression-discontinuity framework,
the significant positive effects disappear.
Webbink et al. (2010) analyze the causal effect of education on the
probability of being overweight by using longitudinal data of Australian identical
twins. In the empirical model, the family fixed effect is removed by differencing
within pairs of twins. The estimation results confirm the negative association between
education and the probability of being overweight. The estimated effect of education
on overweight status increases with age.
2.3.4 Fast Food
Recent empirical studies suggest that the growth of fast-food and
restaurants is contributing to the growth in obesity. Powell (2009) examines the
relationship between adolescent BMI and fast food prices, as well as fast food
restaurant availability. The study draws on four waves of the 1997 National
Longitudinal Survey of Youth and external data. The empirical model of adolescent
BMI regresses on fast food price and the availability of fast food restaurants,
controlling for individual and household characteristics and year dummy variables.
The findings indicate that the price of fast food, not the availability of fast food

19
restaurants has a statistically significant effect on adolescent BMI. Also there is
evidence that the weight of adolescents in low to middle-socioeconomic status
families is most sensitive to fast food prices.
Chou et al. (2004), employing the 1984 -1999 Behavioral Risk Factor
Surveillance System, find that the large positive effects associated with the per capita
number of restaurants. They also find the importance of increasing trends in body
weight in explaining the stability of obesity between 1960 and 1978 and the increase
since 1978. The result implies fast food and full service restaurants are culprits in
undesirable weight outcomes.
Related to my thesis, the urbanization usually proceeds along with
increasing availability of fast food and full service restaurants, which could contribute
to the obesity level.

20
Chapter 3
DATA
3.1 Data Source
This thesis uses data from the China Health and Nutrition Survey (CHNS),
which was designed to examine the effects of the health, nutrition, and family
planning policies and programs implemented by national and local governments and to
see how the social and economic transformation of Chinese society is affecting the
health and nutritional status of its population. It is an on-going panel from over 200
communities in 9 provinces.4 The survey takes place over a 3-day period using a
multistage, random cluster process to draw a sample of about 4400 households with a
total of 26,000 individuals. CHNS collects longitudinal data on demographics,
anthropometric measurements, health indicators, and community-level commodity
prices. It began in 1989 and followed the participants subsequently in 1991, 1993,
1997, 2000, 2004, 2006, and 2009.
4 The nine participating provinces include Liaoning, Heilongjiang, Shandong, Jiangsu, Henan, Hubei, Hunan, Guizhou, and Guangxi. Heilongjiang was not surveyed in 1991 and 1993, and Liaoning was not surveyed in 1997.

21
3.2 Obesity and Nutrition
The key variable is obesity, which is defined as the condition of having an
abnormally high proportion of body fat (National Institutes of Health, 1998, p174).
BMI is traditionally used as a proxy for obesity, mainly because it is convenient to
obtain and easy to interpret. It is defined as weight in kilograms divided by the square
of height in meters: BMI = weight(kg)/height-squared(m2). An individual with a BMI
≥ 25 is classified as overweight and is further considered obese if the BMI ≥ 30
(National Institute of Health, 1998). TSF is a measure for body fat. It is a measure of
anthropometry of the upper arm, specifically, a vertical skinfold measured at the
posterior midpoint between the acromion and the olecranon. It directly measures
subcutaneous body fat, and is widely used to measure body composition in clinical
studies.
Another set of response variables of interest are nutrients which are the
proxies for diet structure that represents nutrition transition. I use energy, fat,
carbohydrate, and protein from CHNS to investigate the nutrition transition along with
the rising urbanization in China.

22
3.3 Urbanization
The urbanization index, which is a key independent variable in this
analysis, is a measure of urbanicity from CHNS. This index is a multi-component
scale to measure urban features on a continuum in China.
Jones-Smith and Popkin (2010) identify 12 components to define and
distinguish urbanicity that could be incorporated in the CHNS data. A maximum total
of 10 points are allotted to each of the 12 components, which include:
Population density: total population of the community divided by community
area, from official records.
Economic activity: typical daily wage for ordinary male worker and percent of the
population engaged in non-agricultural work.
Traditional markets: distance to the market in three categories: within the
boundaries of the community, within the city, but not in this community, or not
within the city/village/town); number of days of operation for eight different types
of market (including food and fuel markets).
Modern markets: number of supermarkets, cafes, internet cafes, indoor
restaurants, outdoor fixed and mobile eateries, bakeries, ice cream parlors, fast
food restaurants, fruit and vegetable stands, bars within the community boundaries.

23
Transportation infrastructure: most common type of road, distance to bus stop,
and distance to train stop. (Distance is categorized as: within community, ≤ 1 km
from community, and ≥ 1 km from community).
Sanitation: proportion of households with treated water and prevalence of
households without excreta present outside the home.
Communications: availability (within community boundaries) of a cinema,
newspaper, postal service, telephone service; and percent of households with a
computer, percent of households with a television, and percent of households with
a cell phone.
Housing: average number of days a week that electricity is available to the
community, percent of community with indoor tap water, percent of community
with flush toilets, and percent of community that cooks with gas.
Education: average education level among adults above 21 years old.
Diversity: variation in community education level and variation in community
income level.
Health infrastructure: number and type of health facilities in or nearby (12 km)
the community and number of pharmacies in community.

24
Social services: provision of pre-school for children under 3 years old, availability
of (offered in community) commercial medical insurance, free medical insurance,
and/or insurance for women and children.
3.4 Food Prices
Another set of independent variables are relative food prices at the
community level, including the price of staple food (rice, wheat, and noodle), pork,
and vegetables relative to price of staple (cooking) oil respectively. Because cooking
oil is the most caloric of all foods, the fraction of oil used in food preparation helps
determine the sum of calories a meal contains.
For the price effects, oil and other foods are considered complementary to
each other. The hypothesis is that consumption of foods corresponds to how expensive
the foods are, and when the relative price of cooking oil decreases, people will use
more oil when preparing meals, and vice versa. Therefore, higher oil intake leads to
more obesity.
Among all edible oils with price information available, soybean, rapeseed,
and peanut oil are identified as staple oils as they account for more than 80% of the
edible oil consumption in certain regions of China (Fang and Beghin, 2002).
Accordingly, each sample province is assigned with the price of its major staple oil,

25
depending on the region it belongs to. Specifically, it is soybean oil for Liaoning,
Heilongjiang, Shandong; rapeseed oil for Jiangsu, Henan, Hubei, Hunan, Guizhou;
peanut oil for Guangxi. Free market prices are used by default, and are substituted
with either state store market prices (1989, 1991, 1993, and 1997) or large store retail
prices (2000, 2004, 2006 and 2009) wherever free market prices are missing.
3.5 Individual Characteristics
Besides the covariates of community level food prices, I include control
variables of individual characteristics such as age, income levels, educational
attainment, and physical activity levels.
Previous literature documents the association between education and
obesity (Anderson et al., 2011; Webbink et al., 2010). Two levels of educational
attainment are constructed for this study, namely, 0 for lower and 1 for higher
education. Lower education includes: no education, elementary school (primary
school), lower middle school. Higher education includes: upper middle school (high
school) or equivalent (including technological and vocational school education),
bachelor’s degree (university or college degree) and beyond. The rational in this
division of educational attainment is based on the national policy of “Nine-year

26
Compulsory Education”5. Since the promulgation of the "Compulsory Education Law
of the People's Republic of China" in 1986, the nine-year compulsory education has
been implemented by governments at various levels. In China, the nine-year schooling
in primary and lower middle schools pertains to compulsory education, typically six
years at primary school and three years at lower middle school. After the stage of
“Nine-year Compulsory Education”, individuals’ educational attainments become
more diversified. Still, I try three levels of educational attainment here. Specifically, I
pick the “bachelor’s degree and beyond” out to be a third level, which is examined for
more specific effect of higher educational attainment on obesity level.
There are two categories of income variables in CHNS: individual income
and household income. In this analysis, I use household income divided by household
size to calculate household income per person. This calculation, following Lu and
Goldman (2010), is based on two considerations, (1) there are significantly fewer
missing data in household income than in individual income; (2) food preparation and
consumption often do not vary within the household level in China, and per capita
household income can better represent the level of disposable income for food than
individual income.
5 http://www.china.org.cn/english/education/184879.htm

27
Physical activities available in CHNS are categorized into two levels: light
and heavy. “Light” includes light activities such as sedentary office work, and jobs
with some standing and sitting, like counter salesperson, and lab technician. “Light”
also includes some moderate activities such as driver and electrician. “Heavy”
includes heavy physical activities, covering occupations such as farmer, athlete, dancer,
steel worker, and lumber worker.
3.6 Statistical Summary
In this analysis, 8 panel waves from the year 1989 to 2009 are utilized. For
each wave, the sample is limited to adult individuals with age between 18 and 75 at
the time of interview. For women, I exclude the waves when they were pregnant to
avoid irrelevant weight shocks. Thus there are 31,612 individual-year observations
and 14,748 individuals in total. Also, it is an unbalanced panel, because the number of
time periods is not the same for all individuals.
The descriptive statistics of the variables are listed in Table 1 for full
sample and Table 2 for gender subsamples. There are about equal numbers of males
and females in the sample. Average BMI is around 22.58, while females have a
slightly higher level but fairly close to males. In contrast, the difference between men
and women is more distinctive in terms of TSF. Females have an average TSF 15.99
28
mm, 36% higher than that of males. In addition, in Figure 2 and Figure 3, I plot the
time trend for BMI and TSF in full sample. The figures reveal different dynamic
characteristics. For BMI, it follows a steady trend over time, from 21.45 in 1989 to
23.33 in 2009, increasing 9%. The increase in TSF is more significant, from 12.55 in
1989 to 16.21 in 2009, increasing 29%, but follows an unstable trend with 1993 the
lowest and 2006 the highest. The urbanization index has an average of 56.78. I plot the
mean of urbanization index over time in Figure 4. It shows a steady and remarkable
growth in the past two decades, increasing 53%, from 43.76 in 1989 to 67.12 in 2009.
Along with the urbanization process, overweight and obesity have become more
prevalent in the population by the definition of BMI cutoffs: the fraction of overweight
(25≤BMI<30) individuals has increased from 8% in 1989 to 26% in 2009, and the
fraction of obese (BMI≥30) individuals has increased from 0.44% in 1989 to 3.77% in
2009, as shown in Figure 5 and Figure 6.
The observed growth in obesity and urbanization leads to inspiration to
investigate the association between these two trends more thoroughly. According to
previous studies, the increasing prevalence of overweight and obesity along with the
urbanization course could be owing to several potential reasons as dietary and activity
pattern shifts. For example, people tend to engage in more sedentary jobs when they
transfer from rural to urban living, from agricultural sector to non-agricultural sectors,

29
thereby shift towards lower physical activity level. Second, urban life offers more
availability of fast food and restaurants, which could contribute to the obesity level.
Moreover, increasing urbanization in China is linked to economic growth and
increases in income level as people move from lower productivity and income in
agricultural sector to higher productivity and income in industrial and service sectors.
This income growth will induce the diet structure changes in population, in which
people can afford more energy-dense food. And this evolution represents the nutrition
transition course in China. Beside the income effect, the price effect on dietary
patterns could also contribute to the obesity level (Lu and Goldman, 2010). Therefore,
I will focus on the effects of urbanization on the diet structure and obesity level,
controlling for relative food prices and individual characteristics such as income levels,
physical activity levels and so on. I turn to a research design for this idea in the next
chapter.
30
Chapter 4
ECONOMETRIC METHODS
The empirical analysis aims to estimate the effects of urbanization on
nutrition transition and obesity. The hypothesis is that, rising urbanization has positive
effects on the obesity level. Also, the urbanization would induce significant nutrition
transition with regard to dietary patterns.
4.1 Background
Previous studies that focus on obesity and contributing factors mainly use
the fixed effects model. In these studies, obesity is a function of contributing factors of
interest, controlling for regional level characteristics, individual level characteristics,
regional or individual fixed effects, and year fixed effects.
Gruber and Frakes (2006) estimate the impact of cigarette taxes on BMI. In
that paper, BMI is the function of cigarette tax, unemployment rate, individual specific
covariates, and fixed effects for the state and year. The results reveal a negative effect

31
of cigarette taxes on body weight, implying that reduced smoking leads to lower body
weights.
Zhao and Kaestner (2010) set a model specification that BMI is a function
of area fixed effects, year fixed effects, individual characteristics, and population
density, to obtain estimates of the association between the proportions of metropolitan
living and the weight of residents. The empirical evidence indicates a negative
relationship between population density and obesity.
Lu and Goldman (2010) use OLS, random effects model and fixed effects
model to explore a causal relationship between food prices and obesity. In the
regression, obesity, using BMI and TSF for measurement of body weight and body fat
respectively, is a function of community level relative cooking oil prices, and
individual level characteristics, such as age, gender, educational attainment, type of
residence, physical activity levels and year fixed effects. Also that paper extends to
gender differences for the price effects on obesity. The empirical results show that oil
consumption can correspond to relative cooking oil prices and increase individuals’
body fat at a faster rate than it affects body weight.
Popkin (1999) investigates the relationship between diet structure and
urbanization. The tested hypothesis is that urban residency is linked with large
changes in diet and body composition and also with high levels of obesity in lower and

32
middle-income countries. The paper uses OLS regression in which energy intake is the
dependent variable and the independent variables are GNP per capita, the proportion
of the population residing in the urban areas, and an interaction term between GNP per
capita and the proportion of urban residents. The regression model predicts that rapid
urbanization, usually associated with greater incomes and economic growth, can have
independent effects on diet structure. Rising urbanization of lower income countries is
accelerating the shift towards increasing consumption of sweeteners and fats. In the
case of China, results show that urban residence is linked with shifts in the structure of
diets towards higher fat foods. In addition, when urbanization is interacted with a
time-varying physical activity measure, its coefficient is significant as a determinant
of obesity in fixed effects model.
4.2 Panel Data Regression6,7
This thesis uses a panel dataset from CHNS. Population models for panel
data contain time-invariant unobserved effects, i.e. unobserved individual
heterogeneity that maybe correlated with regressors. Thus, the exogeneity assumption
that is critical for the OLS regression is violated; thereby the OLS method will provide
inconsistent estimates of the parameters. Also, such unobserved heterogeneity leads to 6 Wooldridge J.M. (2001). “Econometric Analysis of Cross Section and Panel Data” The MIT Press. 7 Cameron, A. C., and P. K. Trivedi. 2005. “Microeconometrics: Methods and Applications” Cambridge University Press.

33
omitted variable bias. These problems due to existence of unobserved individual
heterogeneity in panel data induce departure form OLS estimation. Thus, panel
regressions should be set in a model specification that coherently incorporates
individual specific effects.
A general panel data regression model assumes the existence of unobserved
individual heterogeneity and it is written as
yit = α + Xitβ + uit t = 1,…,T
Here α is the intercept, Xit is a vector of explanatory variables, the error
term uit contains the unobserved heterogeneity, which is presumed to be constant over
time but varies across cross-sectional units. Different assumptions about the error term
uit will generate different forms of the panel regression model. There are two
commonly specified models: the fixed effects (FE) model and random effects (RE)
model.
In an Unobserved Effects Model (UEM) for randomly drawn cross section
observation i:
yit = α + Xitβ + ci + uit t = 1,…,T
Xit are observed explanatory variables. ci is individual effect. uit is
idiosyncratic errors that change across t and i. In fixed effects (FE) model, ci is a

34
parameter to be estimated and has arbitrary correlation with Xit. While in random
effects (RE) model, ci is a random variable and has no correlation with Xit.
The basic framework of fixed effects model is presented as follows:
yit = α + Xitβ + ci + uit t = 1,…,T
Here α is the intercept, ci is the unobserved heterogeneity and uit is the error
term. Under the assumption of strict exogeneity of the explanatory variables
conditional on ci, i.e. E (uit│Xi , ci) = 0, the idea for estimating β is to transform the
equations to eliminate the unobserved effect ci. Specifically, this fixed effects
transformation is the time demeaning of the original equation, which has removed the
individual specific effect ci. Time-constant variables are not allowed in fixed effects
analysis unless they interact with time-varying variables. Based on fixed effects
transformation, the unobserved heterogeneity term is eliminated by subtracting the
group means:
' ( )it i it i it iy y X X u uβ− = − + − t = 1,...,T
In addition, heteroskedasticity and serial correlation would cause
estimation problems in panel data regression. Heteroskedasticity could be inspected
via Modified Wald test with the null hypothesis of no groupwise heteroskedasticity.
With regard to serial correlation, the Wooldridge test is applied to check whether there
is autocorrelation within the residuals. The null hypothesis states that there is no serial

35
correlation. If heteroskedasticity and serial correlation exist, the robust standard error
could be applied to address these problems.
As to random effects model, it is analyzed by generalized least squares
(GLS) when the variance structure is known and by feasible generalized least squares
(FGLS) when the variance is unknown. The random effects model allows for
time-invariant explanatory variables:
yit = α + Xitβ + vit t = 1,…,T
vit = ci + uit
Here α is the intercept, vit is defined as a composite error term, ci is the
unobserved heterogeneity which follows the random effects assumption that it is
uncorrelated with the explanatory variables. Under this assumption, the composite
error term is serially correlated across time:
2 2 2( , ) / ( )it is a aCorr v v µs s s= + t s≠
Because pooled OLS standard errors usually ignore this positive serial
correlation, they will be inefficient. In addition, pooled OLS estimation assumes no
unobserved individual heterogeneity which makes it less efficient when estimating
panel data. Breusch and Pagan (1980) developed a Breusch-Pagan Lagrangian
Multiplier test for choice between a random effects model and an OLS model.

36
Rejection of the null hypothesis that there is no significant difference across units
implies the appropriateness of a random effects model instead of a pooled OLS model.
The Hausman’s (1978) specification test is used to determine which of the
two alternative model specifications (FE versus RE) is more appropriate. The null
hypothesis of the test is no correlation between unobserved effects and the explanatory
variables. Under the null hypothesis, both FE and RE model yield consistent estimates,
but the estimates from RE model are more efficient. Rejecting the null hypothesis is in
favor of FE model against RE model.
In this study, I control for the unobserved individual heterogeneity through
all of the survey years. Prior to that, a Hausman test will be employed to examine the
choice of model specification between fixed effects model and random effects model.
Also, diagnostic tests for heteroskedasticity and serial correlation will be conducted in
the regression model.
4.3 Model Specification
In this thesis, I use the panel data regression to test whether the
urbanization effects on nutrition transition and obesity. In the regression, obesity or
nutrients intake is a function of community level urbanization indexes, community

37
level relative food prices, and individual level characteristics, such as age, income
level, educational attainment, physical activity level, and year fixed effects.
I use two measurements of “OBESITY” for comparison: BMI as a
measurement of body weight and TSF of body fat. Both BMIijt and TSFijt are
continuous variables, for each individual i and community j at time t. Another group of
response variables are nutrients, namely “NUTRITION”, such as “ENERGYijt”, “FATijt”,
“CARBOHYDRATEijt”, and “PROTEINijt”, for each individual i and community j at
time t. The key independent variable “URBANjt”, i.e. the urbanization index, is a
measurement of the levels in urbanization for community j at time t. There are two
groups of control variables in this regression analysis. The variables of “PRICEjt” are
community level relative food prices, specifically, the prices of staple food, pork, and
vegetables, deflated by the price of cooking oil in community j at time t. Another
group of control variables are individual characteristics “Xijt”, such as age, income
level, educational attainment, and physical activity level. In the regression, τt is the
time fixed effect. μi is the individual fixed effect, and εijt is the error term. The models
are specified as follows:
OBESITYijt = β1URBANjt + β2PRICEjt + βkXijt + τt + μi + εijt (1)
NUTRITIONijt = β1URBANjt + β2PRICEjt + βkXijt + τt + μi + εijt (2)
38
The first regression can be used to capture the relationship between
urbanization and obesity level. Among the coefficients, β1 is the coefficient of
urbanization variable. According to our hypothesis, β1 is expected to be positive. β2 is
expected to be positive, for the reason that the lower relative price of cooking oil
means energy-dense food sources are cheaper thereby prompt consumption of this
food source, which leads to higher obesity level. For the coefficients of individual
characteristics βk, I do not have expectation on these signs. The second regression is
designed to examine the relationship between urbanization and change in diet structure,
which represents the nutrition transition (Popkin, 1999). In this regression, I do not
have expectation on the signs of the coefficients.
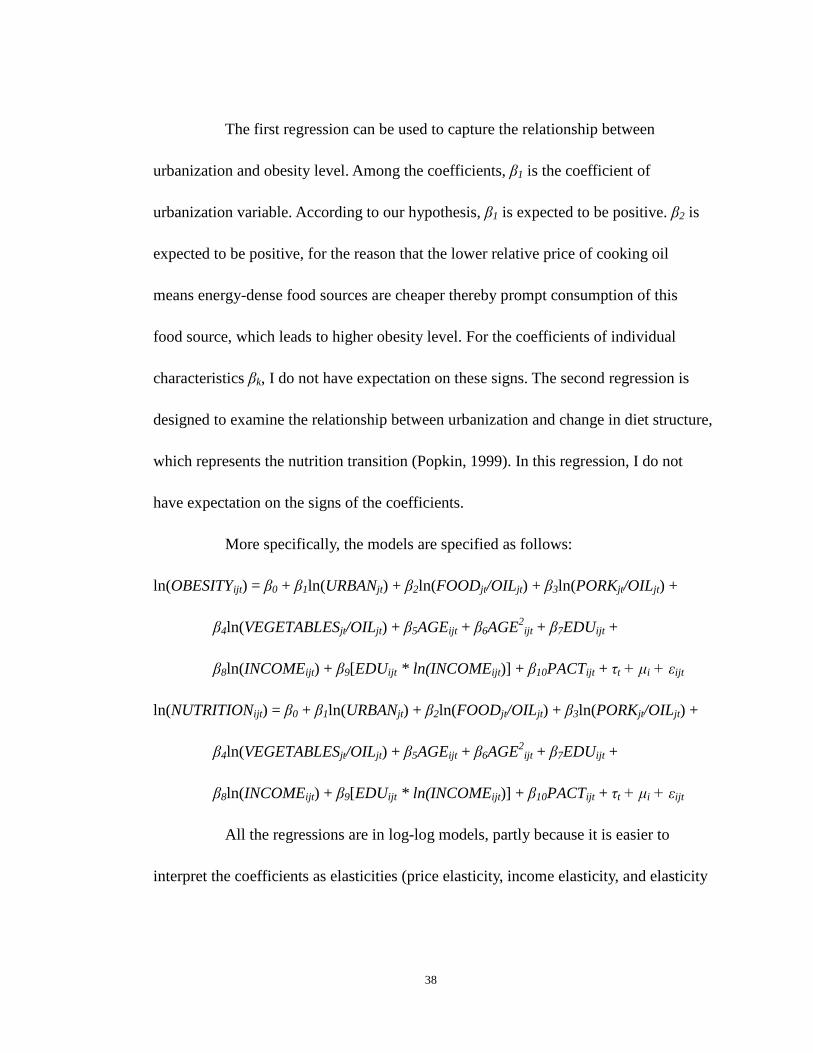
More specifically, the models are specified as follows:
ln(OBESITYijt) = β0 + β1ln(URBANjt) + β2ln(FOODjt/OILjt) + β3ln(PORKjt/OILjt) +
β4ln(VEGETABLESjt/OILjt) + β5AGEijt + β6AGE2ijt + β7EDUijt +
β8ln(INCOMEijt) + β9[EDUijt * ln(INCOMEijt)] + β10PACTijt + τt + μi + εijt
ln(NUTRITIONijt) = β0 + β1ln(URBANjt) + β2ln(FOODjt/OILjt) + β3ln(PORKjt/OILjt) +
β4ln(VEGETABLESjt/OILjt) + β5AGEijt + β6AGE2ijt + β7EDUijt +
β8ln(INCOMEijt) + β9[EDUijt * ln(INCOMEijt)] + β10PACTijt + τt + μi + εijt
All the regressions are in log-log models, partly because it is easier to
interpret the coefficients as elasticities (price elasticity, income elasticity, and elasticity
39
of urbanization effect). The regression will be run on the full sample of adult
individuals. In addition, the analysis will be extended to gender differences, regressing
on female and male subsamples respectively. Moreover, this study will examine
regional differences at provincial level, regressing on provincial subsamples. The next
section presents the empirical results.
40
Chapter 5
RESULTS
The thesis explores the effects of urbanization on the nutrition transition
and obesity level for the adult population in China. Specifically, I use BMI and TSF as
proxies for obesity, and use nutrients intake such as energy, fat, protein and
carbohydrate to capture the changes in dietary patterns in nutrition transition. I employ
panel data regression to examine the effects of urbanization on dietary structure and
obesity level, controlling for the community level relative food prices and individual
level characteristics including age, income, education, and physical activity levels.
5.1 Results of Model Specification Tests and Diagnostic Tests
In this analysis, I conduct a Hausman test to see whether we can reject the
null hypothesis that RE estimator is consistent and more efficient than FE estimator.
The test result rejects the null, thereby shows to be in favor of FE model against RE
model (The Chi-square statistic is 584.46 with p-value 0.0000). Then I turn to FE
regression and take diagnostic tests for heteroskedasticity and serial correlation.

41
Modified Wald test for groupwise heteroskedasticity in fixed effects model
yields result of heteroskedasticity (The Chi-square statistic is 2.4e+35 with p-value
0.0000). For serial correlation, Wooldridge test rejects the null hypothesis of no
first-order autocorrelation (F statistic is 102.797 with p-value 0.0000).
Upon the problems of heteroskedasticity and serial correlation, clustering
on the panel variable produces a variance-covariance estimator that is robust to
cross-sectional heteroskedasticity and within-panel serial correlation that is
asymptotically equivalent to that proposed by Arellano (1987). Although the test
above applies the fixed effects estimator, the robust and cluster robust
variance-covariance estimators are also available for the random effects estimator
(Arellano, 2003; Wooldridge, 2009). Therefore, I estimate the coefficients with
clustered robust standard errors. Compared to the conventional standard errors, these
clustered robust standard errors do not change point estimates of the coefficients, but
would produce larger standard errors and therefore decrease the likelihood for a
coefficient to be statistically significant. Nevertheless it is necessary for correcting
heteroscedasticity and serial correlation problems.
As to the suspicion of time-invariant exogenous variables in the model,
notably, education, income and physical activity, I conduct a Hausman-Taylor

42
instrumental variable estimation (Hausman and Taylor, 1981). The result shows that
there are no time-invariant exogeneous variables in the model.
5.2 Urbanization and Obesity
5.2.1 Full Sample Results
Table 3 presents the effects of urbanization on BMI and TSF in the full
sample. In the table, there are four regressions. The first two on the left are the results
for BMI, and the other two are for TSF.
First of all, the key regressor, urbanization, is shown to be positively
associated with obesity levels for the measurement of BMI. This confirms the
hypothesis that the obesity level increases as urbanization proceeds. The regression
result is not significant for TSF. Urbanization index captures the comprehensive
process of urbanization for a community. Here in the regression analysis, the results
suggest that the urbanization in China has been significantly contributed to the
overweight and obesity level in adult population. This means that the urbanization
comes along with negative health outcomes as increasing body weight level, which
deserve policy considerations.
43
The control variables of relative food prices reveal significant effects on
body weight and body fat. As the price of staple food relative to cooking oil increases,
which means that cooking oil becomes cheaper relative to staple food, TSF increases.
But the results are not statistically significant for BMI. In addition, the price of pork
relative to oil is positively associated with BMI. This regressor can capture to what
extent individuals would substitute animal protein with cooking oil when price
variations are noticeable. However, the price of vegetables relative to oil has negative
correlation with BMI, which is contradictory to the testing hypothesis. One potential
explanation could be price endogeneity that healthier, light-weighted individuals have
more preference for vegetables, driving both price and consumption up (Lu and
Goldman, 2010). Nonetheless, this hypothesis can not be tested here. These findings
are generally consistent with previous study (Lu and Goldman, 2010), which indicates
that obesity corresponds to food price changes.
The factors of individual characteristics, such as age, education, income, and
physical activity, have significant effects on obesity level. Age and age squared are
significant predictors for BMI and TSF, which indicates non-linear and quadratic age
effects. Specifically, BMI increases with age at a decreasing rate. TSF decreases with
age at a decreasing rate. The coefficient of education variable is positive and
statistically significant for BMI but significantly negative for TSF. As educational

44
attainment goes from lower to higher, BMI increases, while TSF decreases. The
coefficient of the interaction term of education and income is negative and statistically
significant for BMI, which indicates that the effect of additional income increment on
body weight is less for an individual with higher education (high school) than for an
individual with lower education. The coefficient of the physical activity variable is
negative and statistically significant for BMI but not significant for TSF. A light
physical activity level is associated with more body weight as compared to heavy. This
result is intuitively understandable and consistent with previous findings, such as Van
de Poel et al. (2009) that lower engagement in physical activity contributes to the urban
concentration of overweight in China.
5.2.2 Gender Differences
For gender differences in RE and OLS regressions, the results in Table 3
show that more females are gaining body weight and body fat than males except in RE
model for BMI. Due to the limitation of FE model, individual fixed effects such as
gender, which is time invariant, can not be estimated with FE model. Therefore, one
approach to overcome that limitation is to run FE model regressions using subsamples
of gender groups.

45
Table 4 presents the results of regression analysis on gender subsamples in
fixed effects model. Urbanization has positive effects on body weight and body fat of
female group at the significance level 1%, while the results are not statistically
significant for male group. This finding indicates that the problem of overweight and
obesity is more pronounced for females in the scenario of urbanization than males.
Notably, the difference between the gender groups mainly lies in education and
income. Educational attainment is a positive predictor for female’s BMI, especially for
high school educational attainment level. However, education has no significant effect
on male’s BMI. Income level has positive effect on BMI of females, but no significant
effect for males. The coefficient of the interaction term of education and income is
negative and statistically significant for BMI in female group, which reveals that the
effect of additional income increment on body weight is less for a female individual
with higher education than the one with lower education. Income level has positive
effect on TSF of females, but no significant effect for males. Educational attainment
has negative effect on TSF at high school level and beyond for males, but at level of
bachelor’s degree and beyond for females.

46
5.2.3 Regional Differences
The analysis on regional differences yields mixed results, as shown in Table
5. Among other provinces, urbanization has positive effect on body weight and body fat
in Heilongjiang and Hubei. In addition, the urbanization is a positive predictor for
BMI in Jiangsu, and TSF in Shandong and Henan. Also, the urbanization is a negative
predictor for BMI in Shandong, and TSF in Hunan and Guangxi. We can see the
effects of urbanization on obesity level vary substantially across the country.
5.3 Urbanization and Nutrition Transition
Table 6-1 and Table 6-2 present the results of regression analysis on
urbanization and nutrition transition. Urbanization has positive effect on fat and
protein intake. This finding reveals the diet structure change towards a pattern of
higher protein and fat in dietary structure of Chinese population. The result is
consistent the finding from Jones-Smith and Popkin (2010) that increasing community
urbanicity is associated with increasing energy from fat. For price effects, the
regression on nutrition yield mixed results. In particular, the relative price of staple
food to cooking oil is a positive predictor for fat intake, and a negative predictor for
carbohydrate intake. Specifically, as cooking oil becomes cheaper, people consume
more of it while substituting staple food (mainly rice and wheat). Among individual

47
characteristics, income has positive effect on energy, fat and protein intake. Physical
activity has positive effect on energy, carbohydrate and protein intake. Also, there are
quadratic age effects. Energy, carbohydrate, and protein increase with age at
decreasing rate. Notably, the findings are consistent with previous study such as
Popkin (1994), Popkin (1999), Popkin (2001a), Popkin et al. (1993), and Popkin et al.
(2001), Du et al. (2002), Jones-Smith and Popkin (2010).

48
Chapter 6
CONCLUSION
This thesis focuses on the impact of the rising urbanization on the nutrition
transition and obesity level. Taking adult individuals from a longitudinal dataset, the
China Health and Nutrition Survey (CHNS), from the year 1989 to 2009, this study uses
the fixed effects (FE) model to examine the effects of urbanization on nutrition
transition and obesity, controlling for community level food prices and individual
characteristics. The empirical results confirm the hypothesis that urbanization induces
the nutrition transition and higher obesity level in population. This study contributes to
the existing literature by introducing relative food prices as control variables and adding
recent panels of longitudinal data for longer time span on the nutrition transition and
obesity dynamics in the urbanization scenario. Also, this thesis extends to the analysis
of gender and regional differences.
Following the study of urbanization, nutrition transition and obesity level in
Popkin (1999), which is basically a static analysis and uses energy intake as a response
variable, I use more data panels to explore the dynamic changes in obesity level

49
associated with urbanization. Following the empirical method of Lu and Goldman
(2010) on relative food prices and obesity, I employ the fixed effects model using data
with a larger time span for exploring dynamic changes in obesity level with
urbanization progress in China. I use Body Mass Index (BMI) as measurement for body
weight and Triceps Skin Fold (TSF) for body fat as comparison. I set the urbanization
index at the community-level as the key independent variable along with two groups of
covariates, community-level relative food prices, and individual level characteristics.
Different from Lu and Goldman (2010), which use 3 different settings of relative prices,
I use staple food, pork, and vegetable prices deflated by edible oil prices as a uniform
specification for regression with BMI and TSF outcomes respectively.
Results in the regression analysis show urbanization has a positive effect on
the obesity level. Specifically, urbanization index is a significant predictor for obesity
level in adult population in China. This finding confirms the hypothesis of this thesis
and is consistent with previous study on urbanization and obesity (Popkin, 1999).
In addition, the obesity level responds to the relative food prices, namely,
the prices of staple food, pork, and vegetables to cooking oil. As price of cooking oil
get relatively cheaper, individuals consume more. Therefore, the change in the diet
pattern leads to a higher level of calorie intake, and more body fat when excess calories
are stored in the body. Also, empirical evidence yields more significant results for BMI

50
than TSF from factors in individual education, income and physical activity. For BMI,
the obesity level of females is more sensitive to education and income levels compared
with males. Moreover, my thesis explores the regional differences of urbanization
effects on obesity among nine selected provinces in CHNS. The provinces of
Heilongjiang and Hubei show the significant positive effects of urbanization on obesity
with both BMI and TSF as outcome of interest.
Also, this study yields some further empirical evidence on nutrition
transition as urbanization proceeds. Urbanization progress has positive effect on fat and
protein intake. These can be attributed to more consumption of cooking oil, meat, egg,
and diary products as the urbanization proceeds.
As we can see from the findings of this thesis, urbanization comes at a
price, from the perspective of health outcomes, as obesity levels rise. For China, there
should be something to be done in the policy agenda concerning the overweight and
obesity issues in the urbanization scenario. Also, it is the case for other countries that
are undergoing a rapid urbanization progress to take more policy considerations on
obesity levels. Specifically, it is possible to induce healthier dietary patterns by
initiating pricing policies and marketing efforts, thereby to control the growth of
obesity. In addition, systematic effort is needed to reduce sedentary physical status and
improve overall physical activity patterns, as more people take the occupations in

51
relatively sedentary jobs along with the urbanization process. Moreover, the policy
addressing the overweight and obesity should emphasize more on female population.
For future studies, progress may lies on the identification of more specific
factors affecting the obesity levels in the scenario of urbanization. Furthermore, the
mechanism of urbanization, nutrition transition and obesity could be more clarified
based on the findings of those contributing factors. Still, there can be more findings
regarding to regional and community-level specifics on obesity and nutrition if more
data are available.
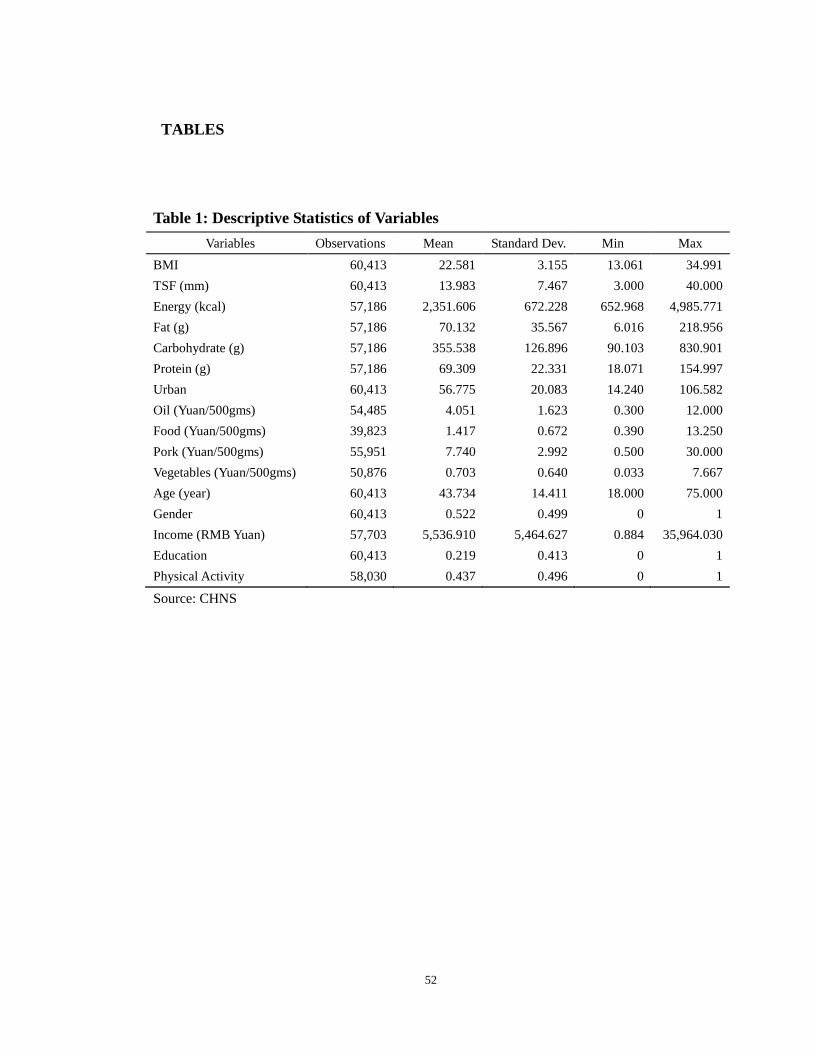
52
TABLES
Table 1: Descriptive Statistics of Variables Variables Observations Mean Standard Dev. Min Max
BMI 60,413 22.581 3.155 13.061 34.991 TSF (mm) 60,413 13.983 7.467 3.000 40.000 Energy (kcal) 57,186 2,351.606 672.228 652.968 4,985.771 Fat (g) 57,186 70.132 35.567 6.016 218.956 Carbohydrate (g) 57,186 355.538 126.896 90.103 830.901 Protein (g) 57,186 69.309 22.331 18.071 154.997 Urban 60,413 56.775 20.083 14.240 106.582 Oil (Yuan/500gms) 54,485 4.051 1.623 0.300 12.000 Food (Yuan/500gms) 39,823 1.417 0.672 0.390 13.250 Pork (Yuan/500gms) 55,951 7.740 2.992 0.500 30.000 Vegetables (Yuan/500gms) 50,876 0.703 0.640 0.033 7.667 Age (year) 60,413 43.734 14.411 18.000 75.000 Gender 60,413 0.522 0.499 0 1 Income (RMB Yuan) 57,703 5,536.910 5,464.627 0.884 35,964.030 Education 60,413 0.219 0.413 0 1 Physical Activity 58,030 0.437 0.496 0 1
Source: CHNS

53
Table 2: Descriptive Statistics by Gender Groups Male Female
Variables Observations Mean Observations Mean
BMI 28867 22.459 31546 22.693 TSF (mm) 28867 11.786 31546 15.993 Urban 28867 56.629 31546 56.910 Oil (Yuan/500gms) 26046 4.058 28439 4.046 Food (Yuan/500gms) 19125 1.414 20698 1.419 Pork (Yuan/500gms) 26737 7.738 29214 7.742 Vegetables (Yuan/500gms) 24334 0.699 26542 0.707 Age (year) 28867 43.672 31546 43.790 Gender 28867 0 31546 1 Income (RMB Yuan) 27457 5602.724 30246 5477.166 Education 28867 0.259 31546 0.182 Physical Activity 27725 0.455 30305 0.421
Source: CHNS

54
Table 3: Effects of Urbanization on Obesity ln(BMI) ln(TSF) ln(Urban) 0.010*** 0.010*** 0.031 0.030 (0.004) (0.004) (0.025) (0.025) ln(Food/Oil) -0.001 -0.001 0.087*** 0.088*** (0.002) (0.002) (0.012) (0.012) ln(Pork/Oil) 0.003* 0.003* -0.004 -0.004 (0.002) (0.002) (0.011) (0.011) ln(Veg/Oil) -0.002** -0.002* 0.001 0.001 (0.001) (0.001) (0.008) (0.008) Age 0.076*** 0.076*** -0.694*** -0.694*** (0.008) (0.008) (0.055) (0.055) Age2 -0.000*** -0.000*** -0.000*** -0.000*** (0.000) (0.000) (0.000) (0.000) ln(Income) 0.001 0.001 0.009** 0.009** (0.001) (0.001) (0.004) (0.004) Education1 0.027** - -0.038* - (0.013) - (0.021) - Edu1*[ln(Income)] -0.003** - - - (0.001) - - - Education01 - 0.029** - -0.036* - (0.013) - (0.021) Education02 - -0.000 - -0.078** - (0.037) - (0.038) Edu01*[ln(Income)] - -0.003** - - - (0.001) - - Edu02*[ln(Income)] - -0.000 - - - (0.004) - - Physical Activity -0.006*** -0.006*** 0.001 0.001 (0.001) (0.001) (0.010) (0.010) Year FE included included included included Constant 0.606** 0.613** 25.274*** 25.290*** (0.255) (0.255) (1.771) (1.771) Observations 31612 31612 31612 31612 Individuals 14748 14748 14748 14748 Education1 (Edu1): 0/1 education dummy for 1; Education01: 0/1/2 education dummy for 1;

55
Education02: 0/1/2 education dummy for 2; Robust standard errors in parenthesis; *** p<0.01, ** p<0.05, * p<0.1

56
Table 4: Effects of Urbanization on Obesity for Males ln(BMI) ln(TSF) ln(Urban) 0.005 0.005 -0.048 -0.049 (0.006) (0.006) (0.040) (0.040) ln(Food/Oil) -0.003 -0.003 0.106*** 0.107*** (0.003) (0.003) (0.020) (0.020) ln(Pork/Oil) 0.003 0.003 0.003 0.002 (0.002) (0.002) (0.017) (0.017) ln(Veg/Oil) -0.003* -0.003* -0.003 -0.003 (0.002) (0.002) (0.012) (0.012) Age 0.080*** 0.080*** -0.818*** -0.818*** (0.011) (0.011) (0.090) (0.090) Age2 -0.000*** -0.000*** -0.000*** -0.000*** (0.000) (0.000) (0.000) (0.000) ln(Income) -0.000 -0.000 0.005 0.005 (0.001) (0.001) (0.007) (0.007) Education1 -0.004 - -0.058** - (0.017) - (0.032) - Edu1*[ln(Income)] 0.001 - - - (0.002) - - - Education01 - 0.001 - -0.056* - (0.018) - (0.032) Education02 - -0.031 - -0.094* - (0.045) - (0.051) Edu01*[ln(Income)] - 0.000 - - - (0.002) - - Edu02*[ln(Income)] - 0.004 - - (0.005) - - Physical Activity -0.006*** -0.006*** 0.015 0.015 (0.002) (0.002) (0.016) (0.016) Year FE included included included included Constant 0.506 0.502 29.428*** 29.445*** (0.356) (0.356) (2.916) (2.916) Observations 15106 15106 15106 15106 Individuals 7115 7115 7115 7115
Education1 (Edu1): 0/1 education dummy for 1

57
Education01: 0/1/2 education dummy for 1 Education02: 0/1/2 education dummy for 2 Robust standard errors in parenthesis *** p<0.01, ** p<0.05, * p<0.1

58
Table 5: Effects of Urbanization on Obesity for Females ln(BMI) ln(TSF) ln(Urban) 0.015*** 0.015*** 0.101*** 0.102*** (0.006) (0.006) (0.030) (0.030) ln(Food/Oil) 0.000 0.000 0.070*** 0.070*** (0.003) (0.003) (0.015) (0.015) ln(Pork/Oil) 0.003 0.003 -0.011 -0.011 (0.002) (0.002) (0.014) (0.014) ln(Veg/Oil) -0.001 -0.001 0.005 0.005 (0.002) (0.002) (0.009) (0.009) Age 0.071*** 0.071*** -0.593*** -0.598*** (0.011) (0.011) (0.064) (0.065) Age2 -0.000*** -0.000*** -0.000*** -0.000*** (0.000) (0.000) (0.000) (0.000) ln(Income) 0.002** 0.002** 0.013** 0.013** (0.001) (0.001) (0.005) (0.006) Education1 0.073*** - - - (0.020) - - - Edu1*[ln(Income)] -0.008*** - - - (0.002) - - - Education01 - 0.068*** -0.021 0.044 - (0.020) (0.025) (0.123) Education02 - 0.061 -0.091* -0.789** - (0.061) (0.055) (0.378) Edu01*[ln(Income)] - -0.008*** - -0.007 - (0.002) - (0.014) Edu02*[ln(Income)] - -0.009 - 0.075* - (0.007) - (0.041) Physical Activity -0.007*** -0.007*** -0.018 -0.018 (0.002) (0.002) (0.012) (0.012) Year FE included included included included Constant 0.745** 0.748** 21.864*** 22.031*** (0.362) (0.362) (2.089) (2.090) Observations 16506 16506 16506 16506 Individuals 7633 7633 7633 7633
Education1 (Edu1): 0/1 education dummy for 1 Education01: 0/1/2 education dummy for 1

59
Education02: 0/1/2 education dummy for 2 Robust standard errors in parenthesis *** p<0.01, ** p<0.05, * p<0.1
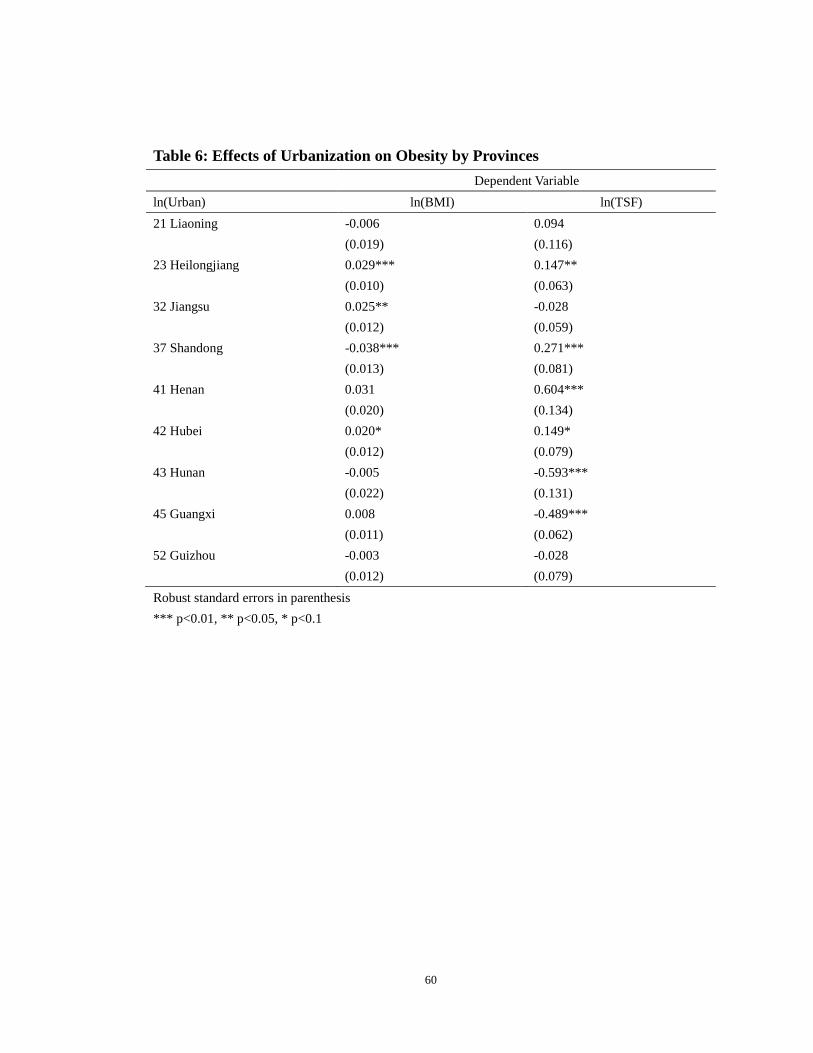
60
Table 6: Effects of Urbanization on Obesity by Provinces Dependent Variable ln(Urban) ln(BMI) ln(TSF) 21 Liaoning -0.006 0.094 (0.019) (0.116) 23 Heilongjiang 0.029*** 0.147** (0.010) (0.063) 32 Jiangsu 0.025** -0.028 (0.012) (0.059) 37 Shandong -0.038*** 0.271*** (0.013) (0.081) 41 Henan 0.031 0.604*** (0.020) (0.134) 42 Hubei 0.020* 0.149* (0.012) (0.079) 43 Hunan -0.005 -0.593*** (0.022) (0.131) 45 Guangxi 0.008 -0.489*** (0.011) (0.062) 52 Guizhou -0.003 -0.028 (0.012) (0.079) Robust standard errors in parenthesis *** p<0.01, ** p<0.05, * p<0.1
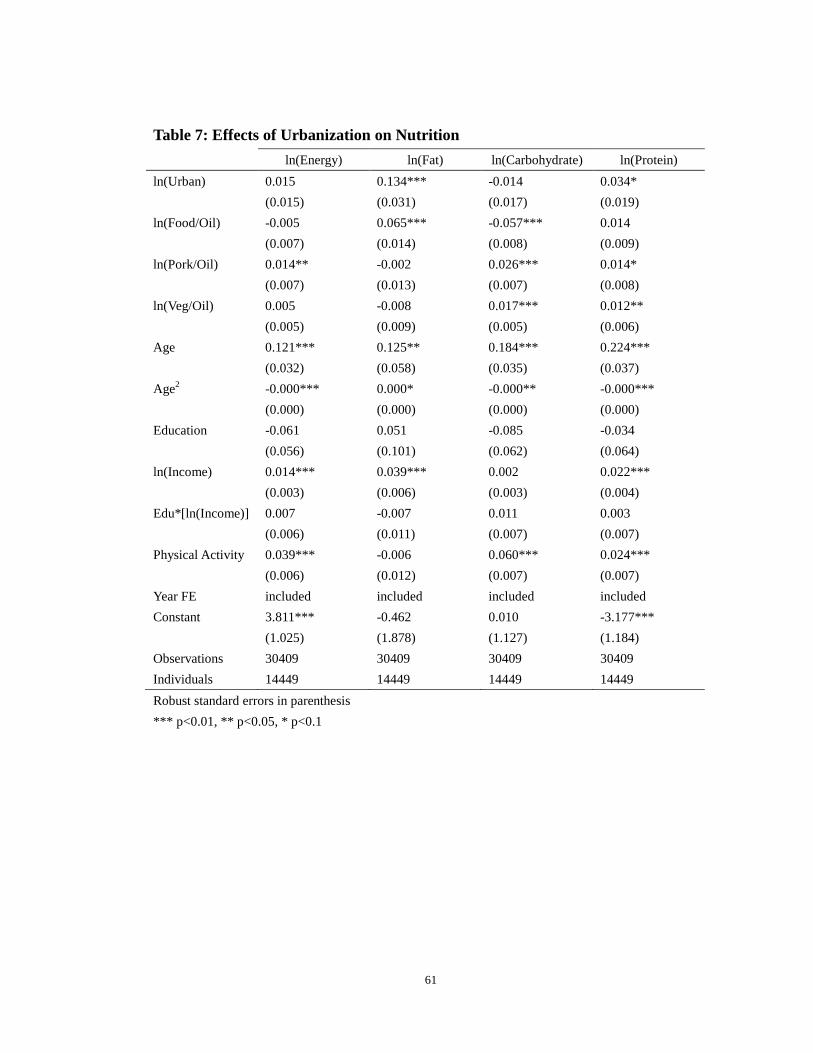
61
Table 7: Effects of Urbanization on Nutrition ln(Energy) ln(Fat) ln(Carbohydrate) ln(Protein) ln(Urban) 0.015 0.134*** -0.014 0.034* (0.015) (0.031) (0.017) (0.019) ln(Food/Oil) -0.005 0.065*** -0.057*** 0.014 (0.007) (0.014) (0.008) (0.009) ln(Pork/Oil) 0.014** -0.002 0.026*** 0.014* (0.007) (0.013) (0.007) (0.008) ln(Veg/Oil) 0.005 -0.008 0.017*** 0.012** (0.005) (0.009) (0.005) (0.006) Age 0.121*** 0.125** 0.184*** 0.224*** (0.032) (0.058) (0.035) (0.037) Age2 -0.000*** 0.000* -0.000** -0.000*** (0.000) (0.000) (0.000) (0.000) Education -0.061 0.051 -0.085 -0.034 (0.056) (0.101) (0.062) (0.064) ln(Income) 0.014*** 0.039*** 0.002 0.022*** (0.003) (0.006) (0.003) (0.004) Edu*[ln(Income)] 0.007 -0.007 0.011 0.003 (0.006) (0.011) (0.007) (0.007) Physical Activity 0.039*** -0.006 0.060*** 0.024*** (0.006) (0.012) (0.007) (0.007) Year FE included included included included Constant 3.811*** -0.462 0.010 -3.177*** (1.025) (1.878) (1.127) (1.184) Observations 30409 30409 30409 30409 Individuals 14449 14449 14449 14449 Robust standard errors in parenthesis *** p<0.01, ** p<0.05, * p<0.1

62
FIGURES
Figure 1: Percentage of Urban Population to Total Population
0
10
20
30
40
50
60
1981 1986 1991 1996 2001 2006 2011
World China
Source: World Bank

63
Figure 2: Trend of BMI Average Level
BMI mean
21
22
23
24
1989 1991 1993 1997 2000 2004 2006 2009
Source: CHNS
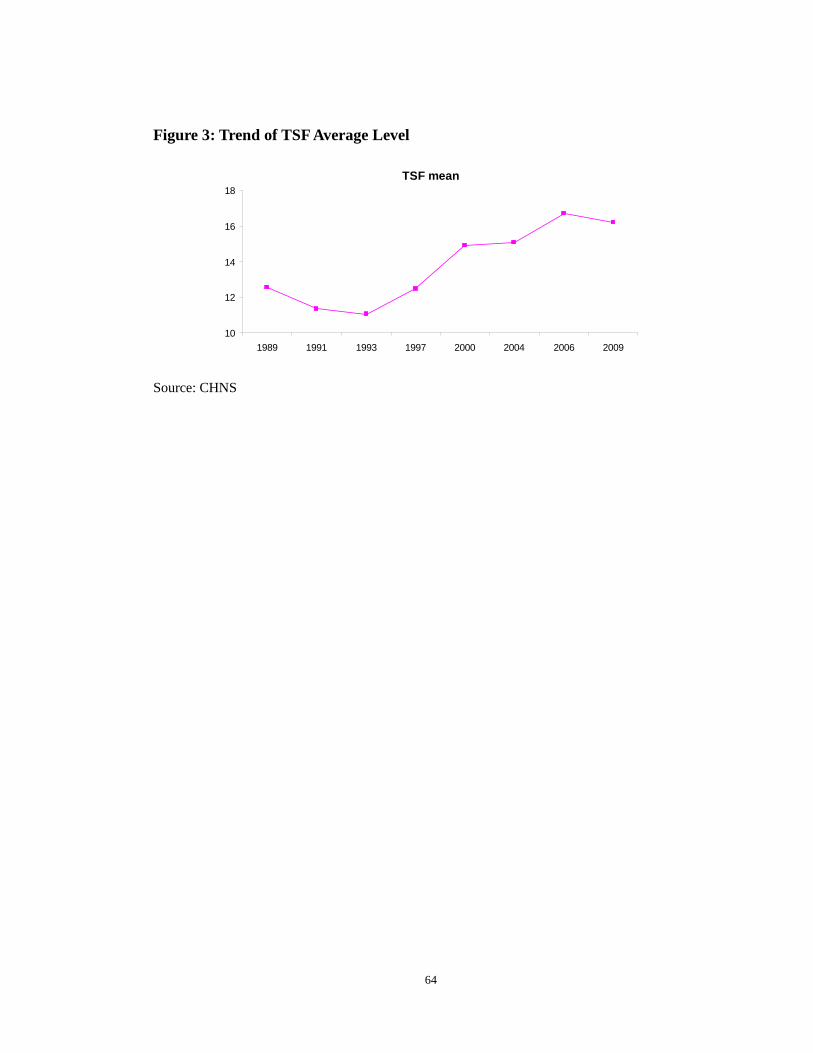
64
Figure 3: Trend of TSF Average Level
TSF mean
10
12
14
16
18
1989 1991 1993 1997 2000 2004 2006 2009
Source: CHNS

65
Figure 4: Trend of Urbanization Index Average Level
URBAN mean
40
50
60
70
1989 1991 1993 1997 2000 2004 2006 2009
Source: CHNS

66
Figure 5: Fraction of Overweight (25≤BMI<30) People in Population
0%
5%
10%
15%
20%
25%
30%
1989 1991 1993 1997 2000 2004 2006 2009
Fraction of Overweight
Source: CHNS

67
Figure 6: Fraction of Obese (30<BMI) People in Population
0%
1%
2%
3%
4%
1989 1991 1993 1997 2000 2004 2006 2009
Fraction of Obese
Source: CHNS

68
REFERENCES
Anderson, P. M., K. F. Butcher, E. U. Cascio, and D. W. Schanzenbach. 2011. “Is Being in School Better? The Impact of School on Children’s BMI When Starting Age Is Endogenous.” Journal of Health Economics, doi:10.1016/j.jhealeco.2011.06.002.
Arellano, M. 1987. “Computing Robust Standard Errors for Within-groups
Estimators.” Oxford Bulletin of Economics and Statistics, 49: 431–434. Arellano, M. 2003. “Panel Data Econometrics” Oxford University Press. Asfaw, A. 2011. “Does Consumption of Processed Foods Explain Disparities in the
Body Weight of Individuals? The Case of Guatemala.” Health Economics, 20(2): 184-195.
Breusch, T. S. and A. R. Pagan, 1980. “The Lagrange Multiplier Test and Its
Applications to Model Specification in Econometrics.” The Review of Economic Studies, 47(1): 239-253.
Cameron, A. C., and P. K. Trivedi. 2005. Microeconometrics: Methods and
Applications. Cambridge University Press. Chou, S.Y., Grossman, M., Saffer, H., 2004. “An Economic Analysis of Adult Obesity:
Results from the Behavioral Risk Factor Surveillance System.” Journal of Health Economics, 23(3): 565-587.
Du, Shufa, B. Lu, F. Zhai, and B.M. Popkin. 2002. “A New Stage of the Nutrition
Transition in China.” Public Health Nutrition, 5:169-174. Fang C, and J. C. Beghin. 2002. “Urban Demand for Edible Oils and Fats in China:
Evidence from Household Survey Data.” Journal of Comparative Economics, 30: 732-753.
Goldman, D., D. Lakdawalla, and Y. Zheng. 2009. “Food Prices and the Dynamics of
Body Weight.” National Bureau of Economic Research Working Paper Series, No.15096.

69
Gruber, J., and M. Frakes. 2006. “Does Falling Smoking Lead to Rising Obesity?” Journal of Health Economics, 25: 183-197.
Hausman, J. A. 1978. “Specification Test in Econometrics.” Econometrica, 46:
1251-1271. Hausman, J. A. and W. E. Taylor. 1981. “Panel Data and Unobservable Individual
Effects.” Econometrica, 49(6): 1377-1398. Jones-Smith, J. C., and B. M. Popkin. 2010. “Understanding Community Context and
Adult Health Changes in China: Development of An Urbanicity Scale.” Social Science & Medicine, 71: 1436-1446.
Kopelman, P. G., 2000. “Obesity as a Medical Problem.” Nature, 404: 635-643. Koplan, J.P., W.H. Dietz, 1999. ”Caloric Imbalance and Public Health Policy.” Journal
of the American Medical Association, 282: 1579-1581. Lakdawalla, D., and T. Philipson. 2002. “The Growth of Obesity and Technological
Change: A Theoretical and Empirical Examination.” National Bureau of Economic Research Working Paper Series, No. 8946.
Liu, G. G., X. Wu, C. Peng, and A. Z. Fu. 2003. “Urbanization and Health Care in
Rural China.” Contemporary Economic Policy, 21(1): 11-24. Lu, Y., and D. Goldman. 2010. “The Effects of Relative Food Prices on Obesity:
Evidence from China: 1991-2006.” National Bureau of Economic Research Working Paper Series, No.15720.
Monda, K. L., P. Gordon-Larsen, J. Stevens, and B. M. Popkin. 2007. “China’s
Transition: The Effect of Rapid Urbanization on Adult Occupational Physical Activity.” Social Science and Medicine, 64: 858-870.
National Institutes of Health. 1998. Clinical Guidelines on the Identification,
Evaluation, and Treatment of Overweight and Obesity in Adults: The Evidence Report. NIH Publication, No.98-4083.

70
Ng, S. W., F. Zhai, and B. M. Popkin. 2008. “Impacts of China's Edible Oil Pricing Policy on Nutrition.” Social Science & Medicine, 66: 414-426.
Paeratakul S., B. M. Popkin, K. Ge, L. S. Adair, and J. Stevens. 1998. “Changes in
Diet and Physical Activity Affect the Body Mass Index of Chinese Adults.” International Journal of Obesity, 22: 424-431.
Peeters, A., J. J. Barendregt, F. Willekens, J.P. Mackenbach, A. Al Mamun, L.
Bonneux, 2003. “Obesity in Adulthood and Its Consequences for Life Expectancy: A Life-table Analysis.” Annals of Internal Medicine, 138: 24-32.
Popkin B. M. 1993. “Nutrition Patterns and Transitions.” Population and Development
Review, 19(1): 138-157. Popkin B. M. 1994. “The Nutrition Transition in Low-income Countries: An Emerging
Crisis.” Nutrition Reviews, 52(9): 285-298. Popkin, B. M. 1996. “Understanding the Nutrition Transition.” Urbanization and
Health Newsletter, 30:3-19. Popkin B. M. 1998. “The Nutrition Transition and Its Health Implications in
Lower-income Countries.” Public Health Nutrition, 1(1): 5-21. Popkin, B. M. 1999. “Urbanization, Lifestyle Changes and the Nutrition Transition.”
World Development, 27(11): 1905-1916. Popkin, B. M. 2001a. “Nutrition in Transition: The Changing Global Nutrition
Challenge.” Asia Pacific Journal of Clinical Nutrition, 10:S13-18. Popkin, B. M. 2001b. “The Nutrition Transition and Obesity in the Developing
World.” The Journal of Nutrition, (S): 871-873. Popkin, B. M. 2004. “The Nutrition Transition: An Overview of World Patterns of
Change.” Nutrition Reviews, 62(7): 140-143. Popkin, B. M., and E. Z. Bisgrove. 1988. “Urbanization and nutrition in low-income
countries.” Food and Nutrition Bulletin, 10(1): 3-23.
71
Popkin B. M., and C. M. Doak. 1998. “The Obesity Epidemic is a Worldwide
Phenomenon.” Nutrition Reviews, 56(4): 106-114. Popkin, B. M., G. Keyou, F. Zhai, X. Guo, and N. Zohoori. 1993. “The Nutrition
Transition in China: A Cross-sectional Analysis.” European Journal of Clinical Nutrition, 47(5):333-46.
Popkin, B. M., and P. Gordon-Larsen. 2004. “The Nutrition Transition: Worldwide
Obesity Dynamics and Their Determinants.” International Journal of Obesity, 28: 2-9.
Popkin, B. M., S. Horton, S. Kim, A. Mahal, and J. Shuigao. 2001. “Trends in Diet,
Nutritional Status and Diet-related Noncommunicable Diseases in China and India: the Economic Costs of the Nutrition Transition.” Nutrition Reviews, 59:379-90.
Powell, L. M., 2009. “Fast Food Costs and Adolescent Body Mass Index: Evidence
from Panel Data.” Journal of Health Economics, 28: 963-970. United Nations. Population Division of the Department of Economic and Social
Affairs of the United Nations Secretariat, World Population Prospects: The 2010 Revision and World Urbanization Prospects: The 2011 Revision, November 12, 2012.
Van de Poel E., O’Donnell O, and Van Doorslaer. 2009. “Urbanization and the Spread
of Diseases of Affluence in China.” Economics and Human Biology, 7: 200-216.
Van de Poel E., O’Donnell O, and Van Doorslaer. 2011. “Is There a Health Penalty of
China’s Rapid Urbanization?” Health Economics, DOI: 10.1002/hec.1717. Wang, Y., J. Mi, X. Y. Shan, Q. J. Wang, and K. Ge. 2007. “Is China Facing an
Obesity Epidemic and the Consequences? The trends in Obesity and Chronic Disease in China.” International Journal of Obesity, 31: 177-188.
72
Webbink, D., N. G. Martin, P. M. Visscher. 2010. “Does Education Reduce the Probability of Being Overweight?” Journal of Health Economics, 29: 29-38.
Wellman, N.S., B. Friedberg. 2002. “Causes and Consequences of Adult Obesity:
Health, Social and Economic Impacts in the United States.” Asia Pacific Journal of Clinical Nutrition, 11(S): 705-709.
Weng, X., and B. Caballero. 2007. “Obesity and Its Related Diseases in China”
Cambria Press. Wildman, R. P., D. Gu, P. Muntner, X. Wu, K. Reynolds, X. Duan, C. Chen, G. Huang,
L. A. Bazzano, and J. He. 2008. “Trends in Overweight and Obesity in Chinese Adults: Between 1991 and 1999-2000.” Obesity, 16(6): 1448-1453.
Wooldridge, J. M. 2001. “Econometric Analysis of Cross Section and Panel Data” The
MIT Press. Wooldridge, J. M. 2009. “Introductory Econometrics: A Modern Approach”
South-Western. World Bank. World Development Indicators. 2012.
http://data.worldbank.org/data-catalog/world-development-indicators. Zhao, Z., and R. Kaestner. 2010. “Effects of Urban Sprawl on Obesity.” Journal of
Health Economics, 29: 779-787. Zhao, W., Y. Zhai, J. Hu, J. Wang, Z. Yang, L. Kong, and C. Chen. 2008. “Economic
Burden of Obesity-related Chronic Diseases in Mainland China.” Obesity Reviews, 9(S1): 62-67.
Top Related