


Languages
Pages
Legal

Slide 1© ABB
Ulrich Spiesshofer, President and CEO, ABB Ltd.; Eric Elzvik, CFO, ABB Ltd., July 21, 2016
Solid progress on profitability2016 Q2 Results

Slide 2© ABB
Important notices
This presentation includes forward-looking information and statements including statements concerning the outlook for ourbusinesses. These statements are based on current expectations, estimates and projections about the factors that may affectour future performance, including global economic conditions, and the economic conditions of the regions and industries thatare major markets for ABB Ltd. These expectations, estimates and projections are generally identifiable by statementscontaining words such as “expects,” “believes,” “estimates,” “targets,” “plans,” “outlook” or similar expressions.
There are numerous risks and uncertainties, many of which are beyond our control, that could cause our actual results todiffer materially from the forward-looking information and statements made in this presentation and which could affect ourability to achieve any or all of our stated targets. The important factors that could cause such differences include, amongothers:
business risks associated with the volatile global economic environment and political conditions costs associated with compliance activities raw materials availability and prices market acceptance of new products and services changes in governmental regulations and currency exchange rates, and such other factors as may be discussed from time to time in ABB Ltd’s filings with the U.S. Securities and Exchange
Commission, including its Annual Reports on Form 20-F.
Although ABB Ltd believes that its expectations reflected in any such forward-looking statement are based upon reasonableassumptions, it can give no assurance that those expectations will be achieved.
This presentation contains non-GAAP measures of performance. Definitions of these measures and reconciliations between these measures and their US GAAP counterparts can be found in the ‘Supplemental reconciliations and definitions’ section of “Financial Information” under “Financial results & presentations” – “Quarterly results & annual reports” on our website at www.abb.com/investorrelations
August 16, 2016

Slide 3© ABB
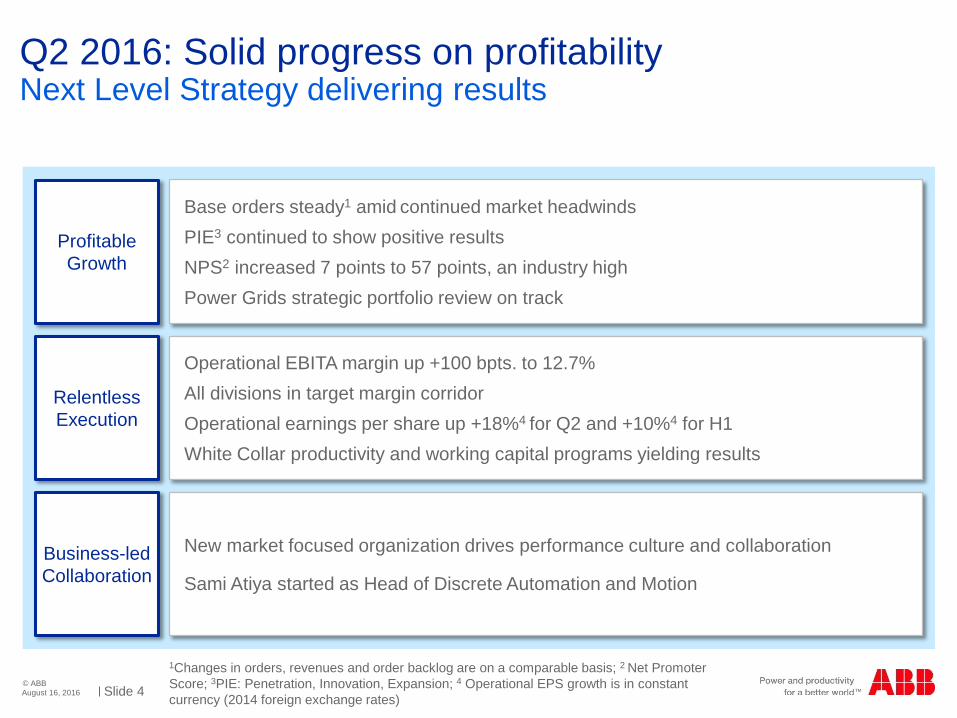
Q2 2016: Solid progress on profitability
1 On a comparable basis; 2 Operational EPS growth is in constant currency (2014 foreign exchange rates)August 16, 2016
Double digit growth in operational earnings and cash flow
Orders Base orders Revenues
$8.3 bn-5%1
$7.7 bn0%1
$8.7 bn-2%1
Operational EPS Cash flow from operating activities
$0.35+18%2
$1.1 bn+80%
Op. EBITA margin
12.7%+1.0 pts.
Slide 4© ABB
Q2 2016: Solid progress on profitability
August 16, 2016
Next Level Strategy delivering results
Business-led Collaboration
Relentless Execution
Profitable Growth
Base orders steady1 amid continued market headwinds PIE3 continued to show positive resultsNPS2 increased 7 points to 57 points, an industry highPower Grids strategic portfolio review on track
Operational EBITA margin up +100 bpts. to 12.7% All divisions in target margin corridorOperational earnings per share up +18%4 for Q2 and +10%4 for H1White Collar productivity and working capital programs yielding results
New market focused organization drives performance culture and collaboration
Sami Atiya started as Head of Discrete Automation and Motion
1Changes in orders, revenues and order backlog are on a comparable basis; 2 Net Promoter Score; 3PIE: Penetration, Innovation, Expansion; 4 Operational EPS growth is in constant currency (2014 foreign exchange rates)
Slide 5© ABB
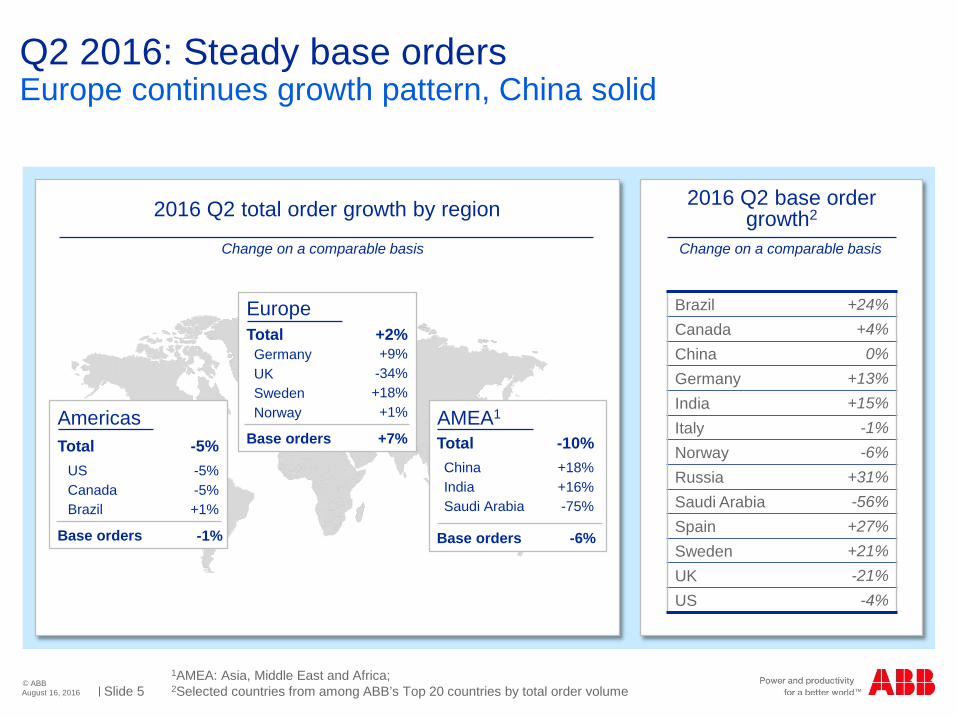
Q2 2016: Steady base orders
August 16, 2016
Europe continues growth pattern, China solid
2016 Q2 total order growth by region
Brazil +24%Canada +4%China 0%Germany +13%India +15%Italy -1%Norway -6%Russia +31%Saudi Arabia -56%Spain +27%Sweden +21%UK -21%US -4%
Change on a comparable basis
2016 Q2 base order growth2
Change on a comparable basis
Middle Africa; 2Selected countries from among ABB’s Top 20 countries by total order volume 1AMEA: Asia, East and
Americas
Base orders
USCanadaBrazil
Total-5%-5%+1%
ChinaIndiaSaudi Arabia
+18%+16%-75%
Europe
Base orders
GermanyUKSwedenNorway
Total+9%
-34%+18%
+1%
-1%
-5%AMEA1
+7%
+2%
Base orders
Total
-6%
-10%

Slide 6© ABB
Q2 2016: achievements by division
August 16, 2016
All divisions in target margin corridor
ABB Group Electrification Products
Discrete Automation and Motion
Process Automation
Power Grids
Orders 8.3 2.5 2.2 1.4 2.7
Comparable -5% -2% -8% -20% 0%
Revenues 8.7 2.4 2.2 1.7 2.8
Comparable -2% -1% -3% -6% +1%
Op. EBITA % 12.7% 17.3% 14.0% 12.2% 9.0%
+1.0 pts. +0.8 pts. -0.5 pts. -0.1 pts. +2.2 pts.
$ bnunless otherwise stated
Slide 7© ABB
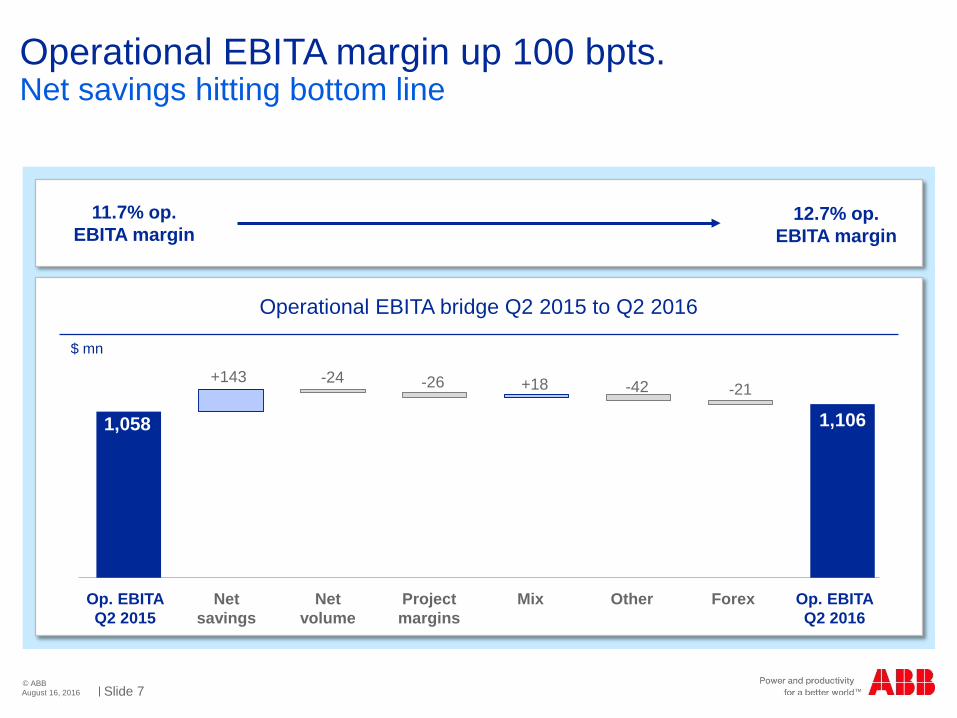
Operational EBITA margin up 100 bpts.
August 16, 2016
Net savings hitting bottom line
11.7% op. EBITA margin
12.7% op. EBITA margin
Net savings
Net volume
OtherProject margins
Mix ForexOp. EBITAQ2 2015
Op. EBITAQ2 2016
Operational EBITA bridge Q2 2015 to Q2 2016
$ mn
1,106
-24-21-26 -42+143 +18
1,058

Slide 8© ABB
Capital allocation priorities remain unchanged
Strong capital management
1NVR: Nominal Value ReductionAugust 16, 2016
Strong working capital management
Timing of tax payments
7th consecutive dividend increase
Dividend payment of 0.74 CHF per share
$1.6 bn dividend distribution from NVR1 paid in July
Q2: 37.6 mn shares, buyback value of ~$780 mn
Total: ~170 mn shares, buyback value of $3.5 bn
Cancelled 100 mn shares in July
2016 dividend distributionStatus of share buyback
A solid cash generator
Working capital initiative yielding results
Cash flow from operating activities, $ mn
598
1 2
1,082598
+80%
Q2 2015 Q2 2016
Slide 9© ABB
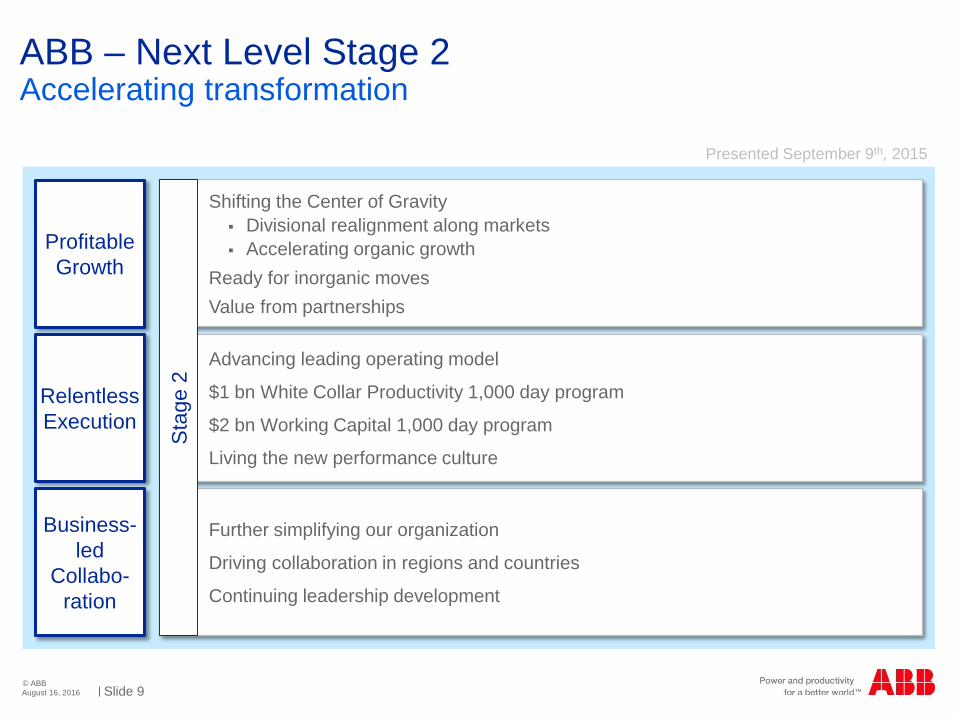
Further simplifying our organization
Driving collaboration in regions and countries
Continuing leadership development
Shifting the Center of Gravity Divisional realignment along markets Accelerating organic growth
Ready for inorganic movesValue from partnerships
Advancing leading operating model
$1 bn White Collar Productivity 1,000 day program
$2 bn Working Capital 1,000 day program
Living the new performance culture
ABB – Next Level Stage 2
August 16, 2016
Accelerating transformation
Profitable Growth
Relentless Execution
Business-led
Collabo-ration
Sta
ge 2
Presented September 9th, 2015

Slide 10© ABB
Q2 2016: Profitable Growth
August 16, 2016
Profitable Growth
Relentless Execution
Business-led
Collabo-ration
Examples
Shifting the Center of Gravity – driving organic growth
PIE
Orders up in Brazil, Russia, India, China
Base orders up overall, steady in China
Framework for growth working
IoTSP1 Connected Services and SafeMove2
YuMi® winning global industry award
First orders for Japanese grid
New partnership business model for Power Grids operational
Penetration:BRIC
Innovation:Robotics
Expansion:Hitachi JV
1IoTSP: Internet of Things, Services and People

Slide 11© ABB
Lean business functions
World wide roll-out of transport mgmt. centers
~90 factories in 13 countries addressed
Global shared services
2 global service centers (IN, PL) operational
Finance (shared accounting services) of >20 countries transitioned
HR Germany & Australia transitioned
Complexity reduction
HQ size reduced by +20%1
Streamlined 4 to 1 locations
August 16, 2016
White Collar Productivity on trackQ2 2016: Relentless Execution
Profitable Growth
Relentless Execution
Business-led
Collabo-ration Confirm $400 mn white collar productivity savings for 2016
Today
1 including relocation of functions to other locations

Slide 12© ABBAugust 16, 2016
Working Capital improvements increased cash flowQ2 2016: Relentless Execution
Profitable Growth
Relentless Execution
Business-led
Collabo-ration
Q2 2015 Q2 2016
5.1
6.2
$ bn
NWC as a percentage of revenues down 150 basis points
NWC Approach

Slide 13© ABB
Q2 2016: Business-led Collaboration
MEA: Middle East and AfricaAugust 16, 2016
Profitable Growth
Relentless Execution
Business-led
Collabo-ration
Cross-divisional New EC appointment
Greenfield Mexican car factory
Combined solutions LV, MV, and robotics
Productivity and energy efficiency
New DM Head: Sami Atiya
Brings extensive industrial experience in Europe, MEA & US
Strong background in automation, software and service
LeadershipCustomers

Slide 14© ABB
Q2 2016 summary and outlook
1Operational EPS growth is in constant currency (2014 foreign exchange rates)August 16, 2016
Mixed short-term picture
Modest growth and increased uncertainties in Europe e.g. Brexit; slower growth in China; continued market growth in US
Oil price effects to continue
Long-term demand outlook remains positive –growth drivers in place for utility, industry, transportation & infrastructure
Op. EBITA margin up +100 bpts. to 12.7%
All divisions in target margin corridor
White collar productivity delivering results
Op. earnings per share up +18%1
Base orders steady; continued market headwinds reflected in total orders -5%
Revenues -2% on lower short cycle volumes and timing of order backlog
Cash flow from operating activities up +80%
Q2 results Outlook
ABB Capital Markets Day October 4, 2016

Slide 15© ABB
ABB Next Level
August 16, 2016
Strong balance sheet; committed to attractive returns to shareholders
Pioneering technology leader with strong positions in attractive markets
Clear transformation agenda driving EPS and CROI
Next Level Strategy: accelerating sustainable value creation


Slide 17© ABB
Key figures Q2 2016
August 16, 2016
Q2 16 Q2 15 Change$ mn unless otherwise indicated $ Local currency Comparable
Orders 8,316 8,996 -8% -5% -5%
Order backlog (end June) 25,338 26,028 -3% 0% +2%
Revenues 8,677 9,165 -5% -3% -2%
Operational EBITA 1,106 1,058 +5% +7%
as % of operational revenues 12.7% 11.7% +1.0 pts
Income from operations 647 961 -33%
as % of revenues 7.5% 10.5% -3.0 pts
Net income 406 588 -31%
Basic earnings per share ($) 0.19 0.26 -28%
Cash flow from operating activities 1,082 598 +484

Slide 18© ABB
Key figures first half 2016
August 16, 2016
H1 16 H1 15 Change$ mn unless otherwise indicated $ Local currency Comparable
Orders 17,569 19,400 -9% -6% -6%
Order backlog (end June) 25,338 26,028 -3% 0% +2%
Revenues 16,580 17,720 -6% -3% -2%
Operational EBITA 2,049 2,007 +2% +5%
as % of operational revenues 12.3% 11.4% +0.9 pts
Income from operations 1,431 1,820 -21%
as % of revenues 8.6% 10.3% -1.7 pts
Net income 906 1,152 -21%
Basic earnings per share ($) 0.42 0.51 -19%
Cash flow from operating activities 1,334 651 +683

Slide 19© ABB
Order backlog by division
August 16, 2016
Q2 2016 Q2 2015 Change %Order backlog (end June)$ mn $ Comparable
Electrification Products 3,164 3,120 +1% +6%
Discrete Automation and Motion 4,532 4,761 -5% -1%
Process Automation 5,985 6,677 -10% -7%
Power Grids 13,310 13,239 +1% +7%
Corporate and Other(incl. Inter-division eliminations) -1,653 -1,769
Total Group 25,338 26,028 -3% +2%
Slide 20© ABB
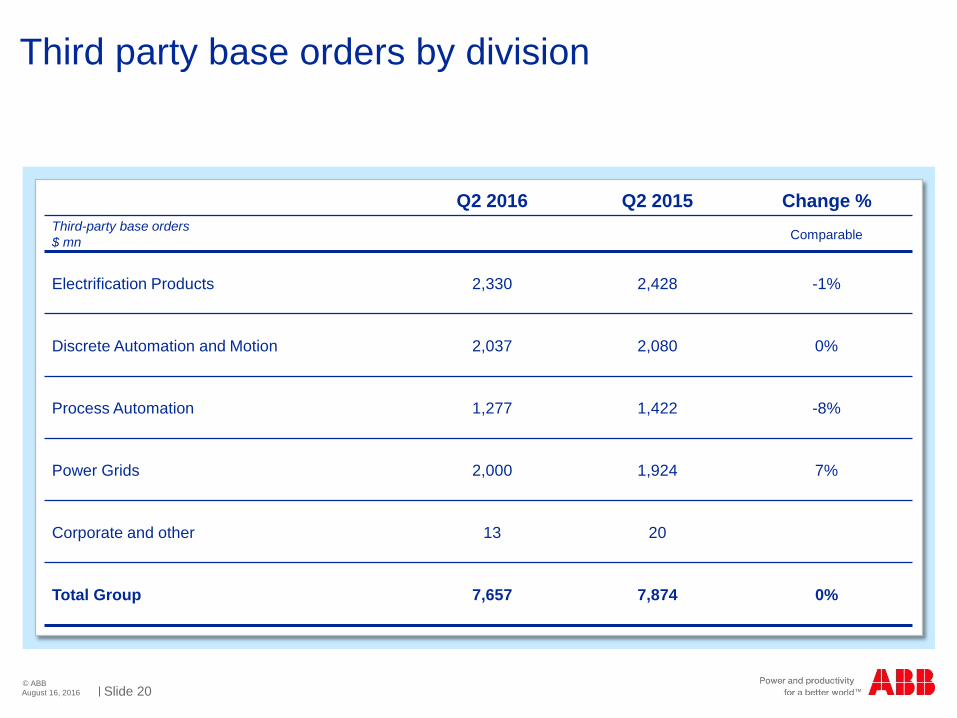
Third party base orders by division
August 16, 2016
Q2 2016 Q2 2015 Change %Third-party base orders$ mn Comparable
Electrification Products 2,330 2,428 -1%
Discrete Automation and Motion 2,037 2,080 0%
Process Automation 1,277 1,422 -8%
Power Grids 2,000 1,924 7%
Corporate and other 13 20
Total Group 7,657 7,874 0%

Slide 21© ABB
Cash flow from operating activities by division
August 16, 2016
Q2 2016 Q2 2015 Change %Cash flow from operating activities$ mn
Electrification Products 364 346 +5%
Discrete Automation and Motion 258 266 -3%
Process Automation 260 98 +165%
Power Grids 289 68 +325%
Corporate and other -89 -180
Total Group 1,082 598 +81%

Slide 22© ABB
Operational EPS analysis
August 16, 2016
Q2 2016 Q2 2015mn $, except per share data in $ EPS EPS 1
Net income (attributable to ABB) 406 0.19 588 0.26 -28%
Operational adjustments:
Acquisition–related amortization 71 80
Restructuring and restructuring-related expenses (including WCP implementation costs) 367 58
Gains and losses on sale of businesses, acquisition-related expenses and certain non-operational items 9 39
FX/commodity timing differences in income from operations 12 -80
Tax on operational adjustments2 -119 -17
Operational net income / Operational EPS 746 0.35 668 0.30 18%3
1Calculated on earnings per share before rounding; 2 Tax amount is computed by applying the Adjusted Group effective tax rate to the operational adjustments, except for gains and losses from sale of businesses for which the actual provision for taxes resulting from the gain or loss has been computed; 3Operational EPS growth rate is in constant currency (2014 foreign exchange rates)

Slide 23© ABB
Regional share of total orders and revenues by division
August 16, 2016
Q2 2016
Electricfication Products
Discrete Automation and
Motion
Process Automation
Power Grids
Ord
ers
Rev
enue
s
37% 37%
26%
38% 37%
25%
29%37%
34%
38%40%
22%
44%27%
29%
30% 36%
34%
40% 38%
22%
39% 31%
30%
Europe Americas Asia, Middle East and Africa

Slide 24© ABB
Electrification Products
In $ mn, y-o-y change comparable
August 16, 2016
Q2 2016O
rder
sR
even
ues
Op.
EB
ITA
&
mar
gin
1 2
1 2
1 2
-2%
-1%
17.3%
2,573 2,451
2,506 2,397
411 414
16.5%
Orders mixed as growth in Europe could not offset declines in the Americas and AMEA. Product orders were stronger in Germany and Russia but softer in China, Saudi Arabia, and the US.
Revenues impacted by lower demand.
Operational EBITA margin improved ~80 basis points on additional cost savings and some positive mix. Capacity adjustments to address the shift in demand were implemented swiftly in the quarter.
Q2 2015
Q2 2015
Q2 2015
Q2 2016
Q2 2016
Q2 2016
Slide 25© ABB
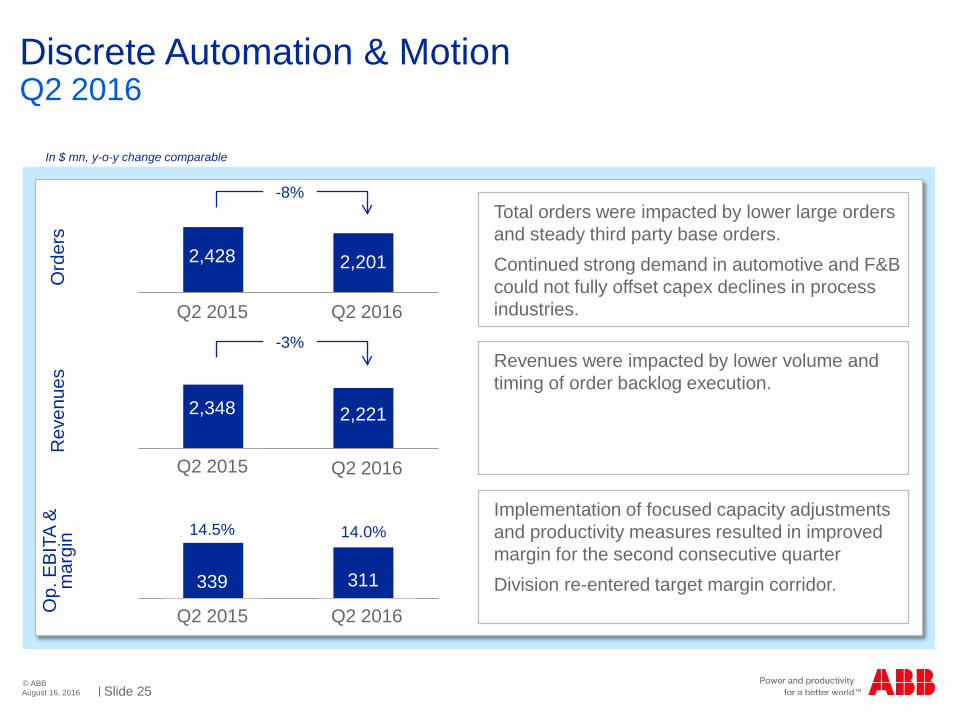
Discrete Automation & Motion
August 16, 2016
Q2 2016O
rder
sR
even
ues
Op.
EB
ITA
&
mar
gin
Total orders were impacted by lower large orders and steady third party base orders. Continued strong demand in automotive and F&B could not fully offset capex declines in process industries.
Revenues were impacted by lower volume and timing of order backlog execution.
Implementation of focused capacity adjustments and productivity measures resulted in improved margin for the second consecutive quarter Division re-entered target margin corridor.
1 2
1 2
1 2
-8%
-3%
14.5%
2,428 2,201
2,221
339 311
14.0%
In $ mn, y-o-y change comparable
Q2 2015
Q2 2015
Q2 2015
Q2 2016
Q2 2016
Q2 2016
2,348

Slide 26© ABB
Process Automation
August 16, 2016
Q2 2016O
rder
sR
even
ues
Op.
EB
ITA
&
mar
gin
Reduced capex & cautious discretionary spending in process industries impacted large and base orders. Total orders declined 20 percent; third party base orders were 8 percent lower.
Revenues were lower on execution timing of the order backlog and lower base order demand.
Operational EBITA margin was basically stable as early initiated cost and productivity savings largely offset lower volumes and reduced capacity utilization.
1 2
1 2
1 2
-20%
-6%
12.2%
1,750 1,369
1,875 1,717
210227
12.3%
In $ mn, y-o-y change comparable
Q2 2015
Q2 2015
Q2 2015
Q2 2016
Q2 2016
Q2 2016

Slide 27© ABB
Power Grids
August 16, 2016
Q2 2016O
rder
sR
even
ues
Op.
EB
ITA
&
mar
gin
Total orders were steady
Strong third party base order growth of 7 percent compensated for lower large orders.
Revenues were higher, reflecting solid conversion of the order backlog.
Operational EBITA margin improved on volumes, productivity and cost savings Result included additional project costs for the remediation actions taken with regards to cable components.
1 2
1 2
1 2
0%
+1%
9.0%
2,754 2,655
2,951 2,779
196 253
6.8%
In $ mn, y-o-y change comparable
Q2 2015
Q2 2015
Q2 2015
Q2 2016
Q2 2016
Q2 2016

Slide 28© ABB
More information available at ABB Investor Relations
August 16, 2016
Name Telephone E-Mail
Alanna AbrahamsonHead of Investor Relations +41 43 317 3804 [email protected]
Binit Sanghvi +41 43 317 3832 [email protected]
Beat Fueglistaller +41 43 317 4144 [email protected]
Annatina Tunkelo +41 43 317 3820 [email protected]
Ruth Jaeger +41 43 317 3808 [email protected]
Top Related