


Languages
Pages
Legal

TRUCK ROUTE ACCESS EVALUATION
Plum Springs Industrial Site Warren County
Site #2575
Report No. KTC-98-37
"Freight Movement and lntennodal Access in Kentucky" SPR 98-189
Brian Aldridge
With: Ken Agent
Lisa Aultman-Hall Dave Cain
Nick Stamatiadis Joel Weber
Kentucky Transportation Center and Department of Civil Engineering University of Kentucky
January 1999
Table of Contents
1.0 Introduction 2.0 Truck Routes in Use 3.0 Route Data Collection and Evaluation
3.1 Traffic Operations and Level of Service 3.2 Accidents 3.3 Cross Section Features 3.4 Curvature Features 3.5 Railroad Crossings 3.6 Bridges 3. 7 Sight Distance
4.0 Route Evaluation and Recommendations 4.1 Problem Truck Miles and Truck Points 4.2 Maintenance Improvement Locations 4.3 Overall Route Rating 4.4 Conclusions and Recommendations
Appendices
Appendix A: Phone Surveys Conducted with Facilities Appendix B: Traffic Counts Conducted by KTC
l l 5 5 8 10 10 16 16 16 16 16 18 18 19
21 24
List of Tables
Table 1: Route Features and Method of Evaluation Table 2. Summary of LOS analysis for each intersection (sec/veh I LOS) Table 3: Accident Types along Warren County Truck Route Table 4: Summary of Problem Truck Miles and Truck Points for Entire Route Table 5: Interpretation of the Overall Route Rating
List of Figures
Figure 1: Location of Truck Generating Sites (Bowling Green, KY) Figure 2: Aerial Photograph of Area (1995 picture) Figure 3: Aerial Photograph of Facilities in Site (1995 picture) Figure 4: Route Map Figure 5: Accident Locations (1994- 1996) Figure 6: Lane Widths Figure 7: Shoulder Widths Figure 8: Underpass as seen from westbound Plum Springs Loop Figure 9: Truck negotiating curve through underpass Figure 10: Warning signage for underpass Figure 11: Curvature on Graham Street Figure 12: Turning radius from Commerce Street onto Plum Springs Loop Figure 13: Turning radius from Graham Street onto Plum Springs Loop Figure 14: Bridge Locations
ii
6 7 8 18 19
2 3 3 4 9 11 12 13 13 14 14 15 15 17
1.0 Introduction
The Freight Movement and Intermodal Access in Kentucky Study (SPR 98-189), undertaken by the Kentucky Transportation Center (KTC) on behalf of the Kentucky Transportation Cabinet (KYTC), has two main objectives. These objectives include the evaluation of access for trucks between intermodal or other truck generating sites and the National Highway System (NHS) and furthering the understanding of freight commodity flows throughout the state. This report summarizes the access evaluation for one cluster of facilities located in Warren County in the Barren River Area Development District (ADD) and Kentucky Transportation Cabinet (KYTC) Highway District #3. The location of the site is shown in Figure I. Work on other specific sites as well as the freight commodity flow task are on-going and are documented elsewhere.
The sites to be evaluated in this project were selected from two existing databases (a truck facility survey from 1994 and the intermodal facility inventory) based on ADD and KYTC planner recommendations, geographic location, distance to the National Highway System, and the number of trucks accessing the site. Consideration was also made for the freight type handled and transportation modes used.
This particular site was visited several times for data collection on May 13 1998 and for video recordings on January 28, 1998. Traffic counts were taken at two intersection on June I, 1998. Aerial photographs of the area can be seen in Figures 2 and 3. The following facilities are located in the area: Bowling Green Concrete, Trace Die Cast, Nyloncraft of Kentucky, American Freightways, Vanmeter Contracting, Woodwork ofMidAmerica, Roadway, Top Drawer Manufacturing, Pepsi, Rapid Parcel Service, and Building Systems and Acoustics Incorporated. Some of these facilities are located west of Plum Springs Loop on Graham Street (approximately 0.2 miles from US 31W and Plum Springs Loop) or Commerce Street (approximately 0.9 miles from US 31 W and Plum Springs Loop), and others are located directly on Plum Springs Loop. Phone surveys were completed on three of the area facilities that were considered to have the highest volume of truck traffic. These facilities indicated that approximately I 00 trucks per day (200-one way trips) are accessing the area as a result of their daily operations. From observation during the various site visits, the total number of trucks utilizing the route (from all the facilities) is only slightly higher as many of the other facilities have only I - 2 trucks per day.
2.0 Truck Routes in Use
There is one primary route (shown on Figure 4) for trucks to reach the NHS- 1-65 in this case. The route takes trucks from Graham Street (from its intersection with Commerce Street) or Commerce Street to Plum Springs Loop, where trucks head southwest to US 31 W. The section of Plum Springs Loop between Commerce Street and Graham Street is also included in this route. US 31 W is a major urban arterial while Plum Springs Loop is a rural collector. Graham Street is local road consisting of dense industrial development. Once on US 31 W, trucks proceed east to the entrance ramp onto KY 446. KY 446, a two-way, four-lane arterial, ends at the 1-65 interchange. There is traffic signal control along this route at the intersection of US 31 Wand Plum Springs Loop and at the intersection ofKY 446 and Corvette Drive. This route is approximately 1.5 miles in length. The average daily traffic (ADT) on US 31 W is 38,092
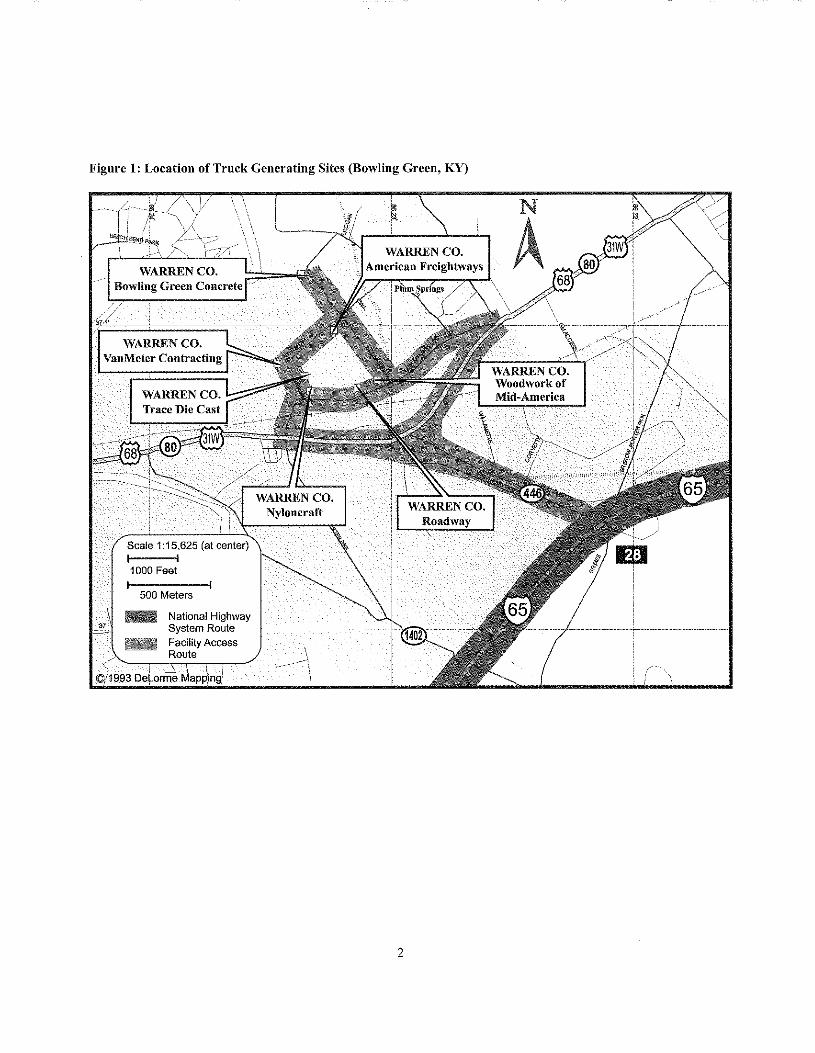
Figure 1: Location of Truck Generating Sites (Bowling Green, KY)
WARREN CO. VanMeter Contracting
1000 Feet
500 Meters
- National Highway System Route
WARREN CO.
2

Figure 2: Aerial Photograph of Area (1995 picture)
Figure 3: Aerial Photograph of Facilities iu Site (1995 picture)
3
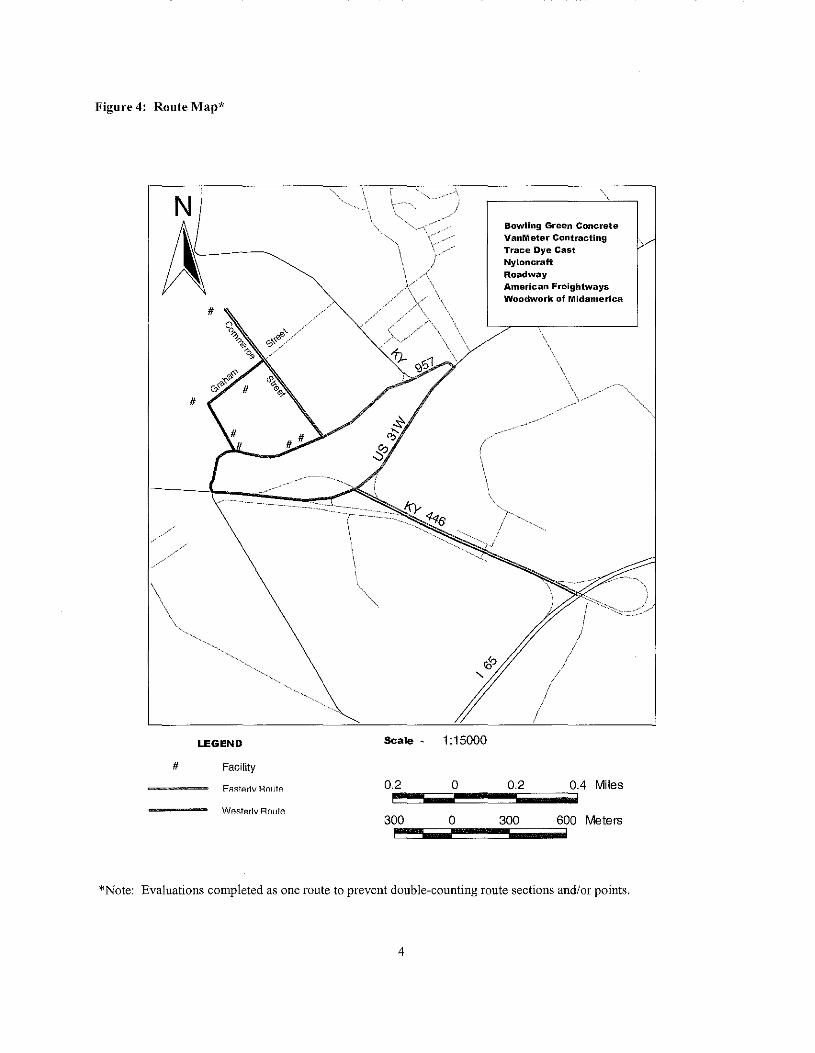
Figure 4: Route Map*
N
IX #
LEGEND Scale ~
# Facility
FRSIArlv RniJIA 0.2
WASIArlv ROIJIA 300
1:15000
0
0
Bowling Green Concrete VanMeter Contracting Trace Dye Cast Nylon craft Roadway American Freightways Woodwork of Midamerica
0.2 0.4 Miles
300 600 Meters
*Note: Evaluations completed as one route to prevent double-counting route sections and/or points.
4
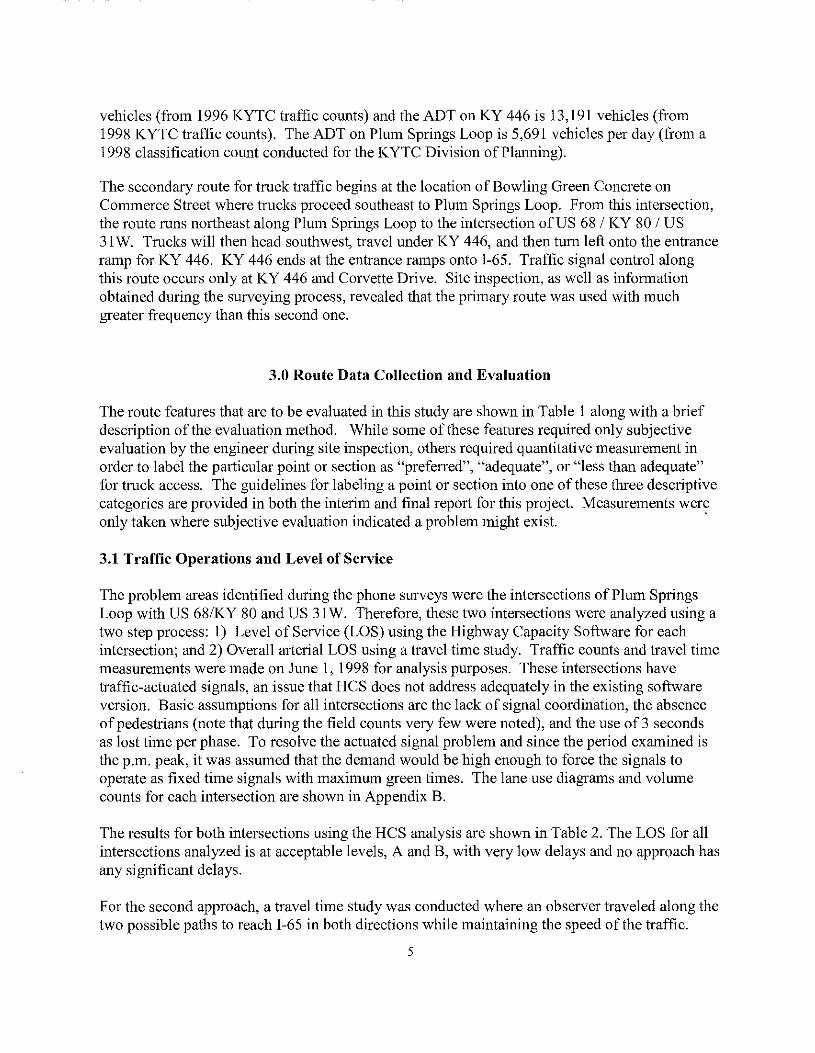
vehicles (from 1996 KYTC traffic counts) and the ADT on KY 446 is 13,191 vehicles (from 1998 KYTC traffic counts). The ADT on Plum Springs Loop is 5,691 vehicles per day (from a 1998 classification count conducted for the KYTC Division of Planning).
The secondary route for truck traffic begins at the location of Bowling Green Concrete on Commerce Street where trucks proceed southeast to Plum Springs Loop. From this intersection, the route runs northeast along Plum Springs Loop to the intersection of US 68 I KY 80 I US 31 W. Trucks will then head southwest, travel under KY 446, and then turn left onto the entrance ramp for KY 446. KY 446 ends at the entrance ramps onto I-65. Traffic signal control along this route occurs only at KY 446 and Corvette Drive. Site inspection, as well as information obtained during the surveying process, revealed that the primary route was used with much greater frequency than this second one.
3.0 Route Data Collection and Evaluation
The route features that are to be evaluated in this study are shown in Table 1 along with a brief description of the evaluation method. While some of these features required only subjective evaluation by the engineer during site inspection, others required quantitative measurement in order to label the particular point or section as "preferred", "adequate", or "less than adequate" for truck access. The guidelines for labeling a point or section into one of these three descriptive categories are provided in both the interim and final report for this project. Measurements were only taken where subjective evaluation indicated a problem might exist. ·
3.1 Traffic Operations and Level of Service
The problem areas identified during the phone surveys were the intersections of Plum Springs Loop with US 681KY 80 and US 31 W. Therefore, these two intersections were analyzed using a two step process: I) Level of Service (LOS) using the Highway Capacity Software for each intersection; and 2) Overall arterial LOS using a travel time study. Traffic counts and travel time measurements were made on June I, 1998 for analysis purposes. These intersections have traffic-actuated signals, an issue that HCS does not address adequately in the existing software version. Basic assumptions for all intersections are the lack of signal coordination, the absence of pedestrians (note that during the field counts very few were noted), and the use of 3 seconds as lost time per phase. To resolve the actuated signal problem and since the period examined is the p.m. peak, it was assumed that the demand would be high enough to force the signals to operate as fixed time signals with maximum green times. The lane use diagrams and volume counts for each intersection are shown in Appendix B.
The results for both intersections using the HCS analysis are shown in Table 2. The LOS for all intersections analyzed is at acceptable levels, A and B, with very low delays and no approach has any significant delays.
For the second approach, a travel time study was conducted where an observer traveled along the two possible paths to reach I-65 in both directions while maintaining the speed of the traffic.
5
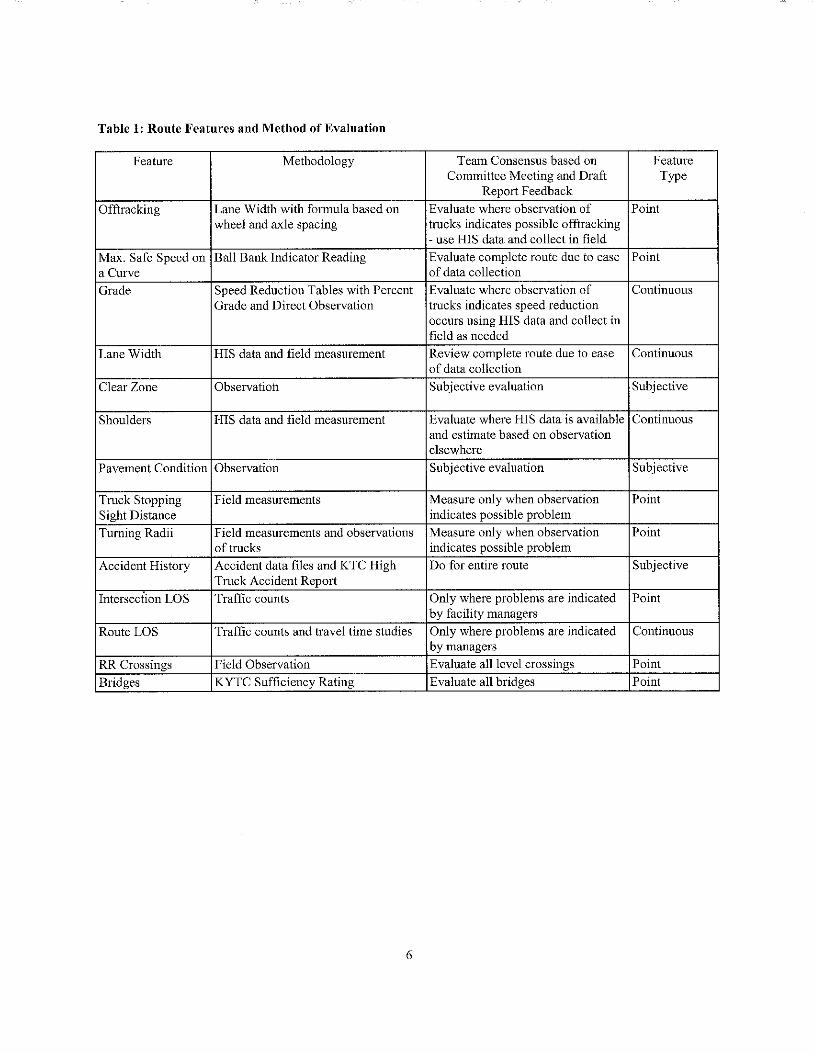
Table 1: Route Features and Method of Evaluation
Feature Methodology Team Consensus based on Feature Committee Meeting and Draft Type
Repmt Feedback
Offtracking Lane Width with formula based on Evaluate where observation of Point wheel and axle spacing tJucks indicates possible offtracking
- use HIS data and collect in field
Max. Safe Speed on Ball Bank Indicator Reading Evaluate complete route due to ease Point a Cw·ve of data collection
Grade Speed Reduction Tables with Percent Evaluate where observation of Continuous Grade and Direct Observation trucks indicates speed reduction
occurs using HIS data and collect in field as needed
Lane Width HIS data and field measurement Review complete route due to ease Continuous of data collection
Clear Zone Observatioh Subjective evaluation Subjective
Shoulders HIS data and field measurement Evaluate where HIS data is available Continuous and estimate based on observation elsewhere
Pavement Condition Observation Subjective evaluation Subjective
Truck Stopping Field measurements Measure only when observation Point Sight Distance indicates possible problem
Turning Radii Field measurements and observations Measure only when observation Point of trucks indicates possible problem
Accident History Accident data files and KTC High Do for entire route Subjective Truck Accident Repmt
Intersection LOS Traffic counts Only where problems are indicated Point by facility managers
Route LOS Traffic counts and travel time studies Only where problems are indicated Continuous by managers
RR Crossings Field Observation Evaluate all level crossings Point
Bridges KYTC Sufficiency Rating Evaluate all bridges Point
6
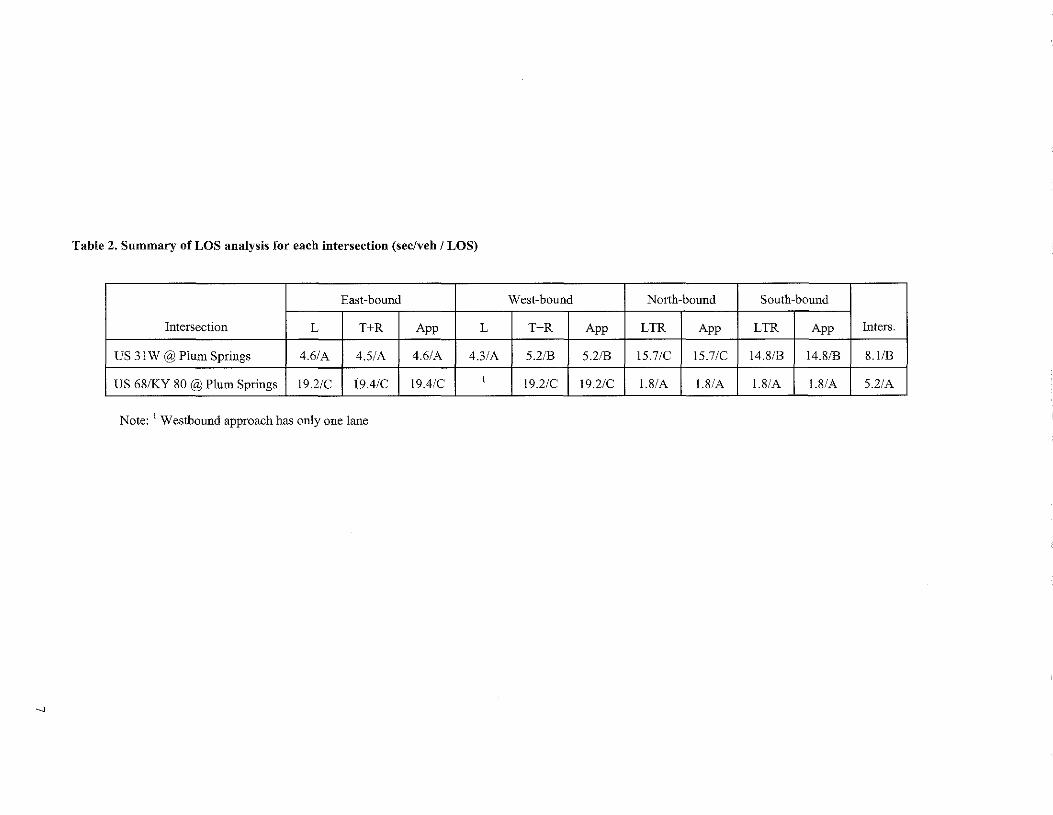
Table 2. Summary of LOS analysis for each intersection (sec/veh I LOS)
East-bound West-bound North-bound South-bound
Intersection L T+R App L T+R App LTR App LTR App Inters.
US 31 W @ Plum Springs 4.6/A 4.5/A 4.6/A 4.3/A 5.2/B 5.2/B 15.7/C 15.7/C 14.8/B 14.8/B 8.1/B
US 68/KY 80 @ Plum Springs 19.2/C (9.4/C 19.4/C I 19.2/C 19.2/C 1.8/A 1.8/A 1.8/A 1.8/A 5.2/A - - --
Note: 1 Westbound approach has only one lane
-...]
Three passes were made for each direction (field data is shown in Appendix B) and the average time for each direction was computed. The route turning right from Commerce Rd. to Plum Springs Loop (westerly route) required a travel time to I-65 of 158 sec and from I-65 171 sec. Given the length of the route, I. 705 miles, the average travel speeds were computed--to I-65 38.8 mph and from I-65 35.9 mph. Using the Highway Capacity Manual and for a type II arterial--urban with medium development and 45 mph speed limit--the LOS is A for both directions. The alternate route, turning left from Commerce Rd. to Plum Springs Loop required a travel time to I-65 of 184 sec and from I-65 of 154 sec. The length of this route is 1.831 miles and the average travel speeds are 35.8 mph to I-65 and 42.8 mph from I-65. The LOS for this route is also A for both directions. Therefore, no significant delays or operational problems experienced along either route, since the arterial operates at a high LOS during the peak period. Given this analysis, the access routes are considered to operate at an acceptable level of service.
3.2 Accidents
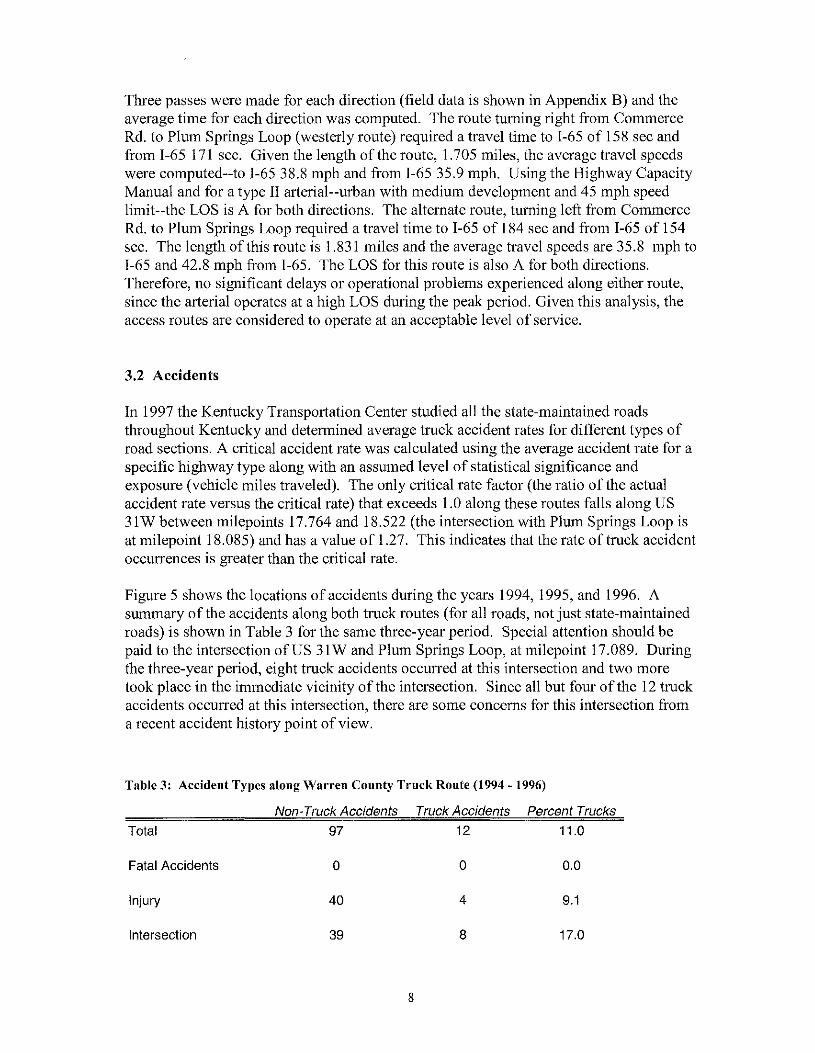
In 1997 the Kentucky Transportation Center studied all the state-maintained roads throughout Kentucky and determined average truck accident rates for different types of road sections. A critical accident rate was calculated using the average accident rate for a specific highway type along with an assumed level of statistical significance and exposure (vehicle miles traveled). The only critical rate factor (the ratio ofthe actual accident rate versus the critical rate) that exceeds 1.0 along these routes falls along US 31 W between milepoints 17.764 and 18.522 (the intersection with Plum Springs Loop is at milepoint 18.085) and has a value of 1.27. This indicates that the rate of truck accident occurrences is greater than the critical rate.
Figure 5 shows the locations of accidents during the years 1994, 1995, and 1996. A summary of the accidents along both truck routes (for all roads, not just state-maintained roads) is shown in Table 3 for the same three-year period. Special attention should be paid to the intersection of US 31W and Plum Springs Loop, at milepoint 17.089. During the three-year period, eight truck accidents occurred at this intersection and two more took place in the immediate vicinity of the intersection. Since all but four of the 12 truck accidents occurred at this intersection, there are some concerns for this intersection from a recent accident history point of view.
Table 3: Accident Types along Warren County Truck Route (1994- 1996)
Non-Truck Accidents Truck Accidents Percent Trucks
Total 97 12 11.0
Fatal Accidents 0 0 0.0
Injury 40 4 9.1
Intersection 39 8 17.0
8
Figure 5: Accident Locations (1994- 1996)
N
A #
"6 ~e?'',/ "'"' "
'2:) ,/
o. ,/'
"'#: "'• rj-'li- # .. , #
LEGEND
# Facility
Accidents: 1 -2 Accidents: 4
# Accidents: 23-27
Freight Access Route State Highway System
Other Roads
Scale- 1:15000
0.2 0
300 0
9
Bowling Green Concrete VanMeter Contracting Trace Dye Cast Nyloncraft Roadway American Freightways Woodwork of Midamerlca
0.2 0.4 Miles
300 600 Meters
3.3 Cross Section Features
Figures 6 and 7 illustrate the sections of the route with different lane widths and shoulder types, respectively. KY 446 and US 31 W consist of "preferred" 12-foot lanes while the remaining roads within the industrial site have !!-foot lanes. The only exceptions to the county road widths is Commerce Street which has 10.5-foot lanes and the length below the railroad underpass (see Figure 2) on Plum Springs Loop. The railroad underpass has only 9-foot lanes, which are considered "less than adequate". The 10.5-foot lanes on Commerce Street are "less than adequate" and the !!-foot lanes on Plum Springs Loop and Graham Street are "adequate". KY 446 has "less than adequate" curbed shoulders for the first 0.3 miles and I 0-foot paved shoulders beyond the interchange with l-65. The 10-foot paved shoulders are considered "preferred" for trucks. US 31 W has only 2-foot shoulders and the county roads possess a range of shoulder widths from 2 to 4 feet and generally are composed of turf. These shoulders are considered "less than adequate".
The only clear zone problem along either route was the railroad underpass on Plum Springs Loop, immediately northwest of the intersection with US 31 W. The 9 foot lane widths below the underpass use all the available space; therefore, there is no shoulder or clear zone available for use. More detail concerning this underpass can be found in section 3.4.
3.4 Curvature Features
Offtracking is considered a problem where a truck cannot stay in its lane through a horizontal curve. The majority of Plum Springs Loop consists of moderate horizontal curvature, but the curvature is not problematic. However, the railroad underpass shown in Figure 8 is situated approximately 350 feet from the intersection of Plum Springs Loop and US 31 W consists of 9 foot lanes with no shoulder. In addition, the underpass lies along a horizontal curve. This combination of curvature and narrow lane widths requires that trucks offtrack into the opposing lanes of traffic, sometimes three feet or more as seen in Figure 9. This has the potential to cause serious problems, both to the drivers that traverse the roadway daily as well as to the structure itself. The 9 foot lane widths would be inadequate even if along a strai~ht stretch of roadway. During the site inspections, several trucks were witnessed stopping before reaching the underpass in order to allow other vehicles to pass through. Trucks are incapable of traveling through the underpass while remaining in their lane. Several warning signs, as seen in Figure l 0, are in-place approximately !50 feet from the actual underpass.
10
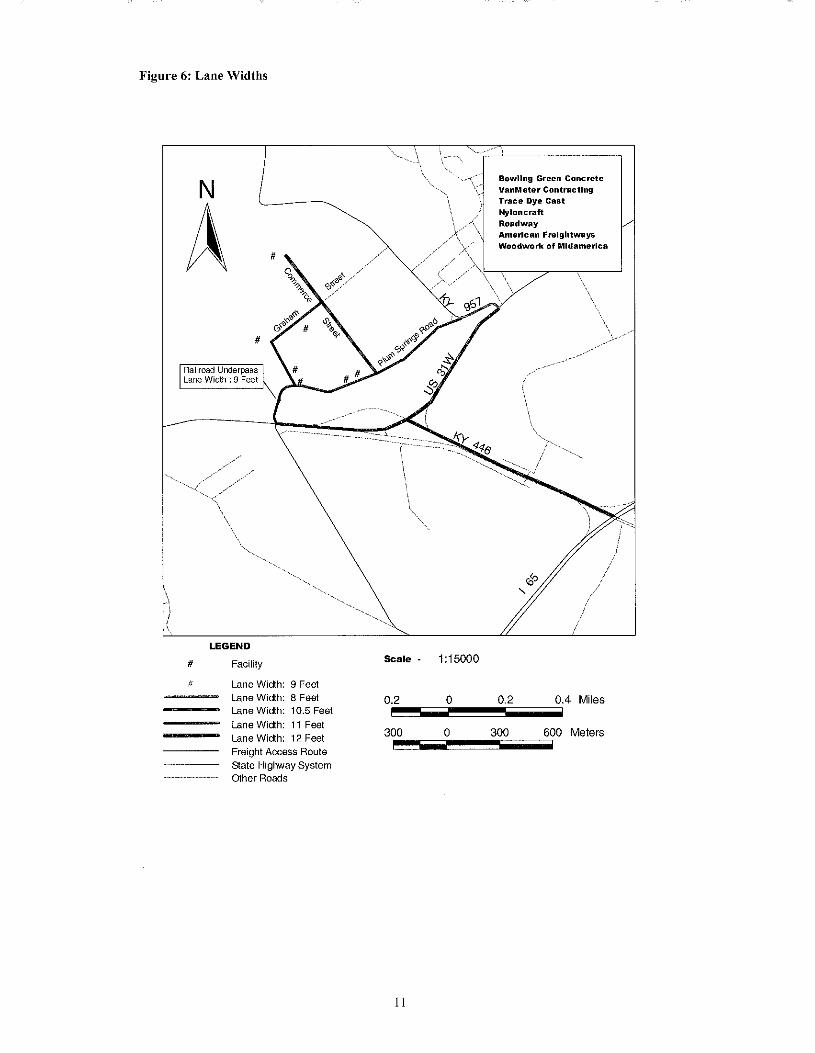
Figure 6: Lane Widths
N
A #
Railroad Underpass Lane Width : 9 Feet
LEGEND
# Facility
/1 Lane Width: Lane Width: Lane Width:
Lane Width: Lane Width:
9 Feet 8 Feet 10.5 Feet 11 Feet 12 Feet
Freight Access Route State Highway System Other Roads
Scale-
0.2
1:15000
0
Bowling Green Concrete VanMeter Contracting Trace Dye Cast Nylon craft Roadway American Freightways Woodwork of Midamerica
0.2 0.4 Miles - ---300 0 300 600 Meters
11
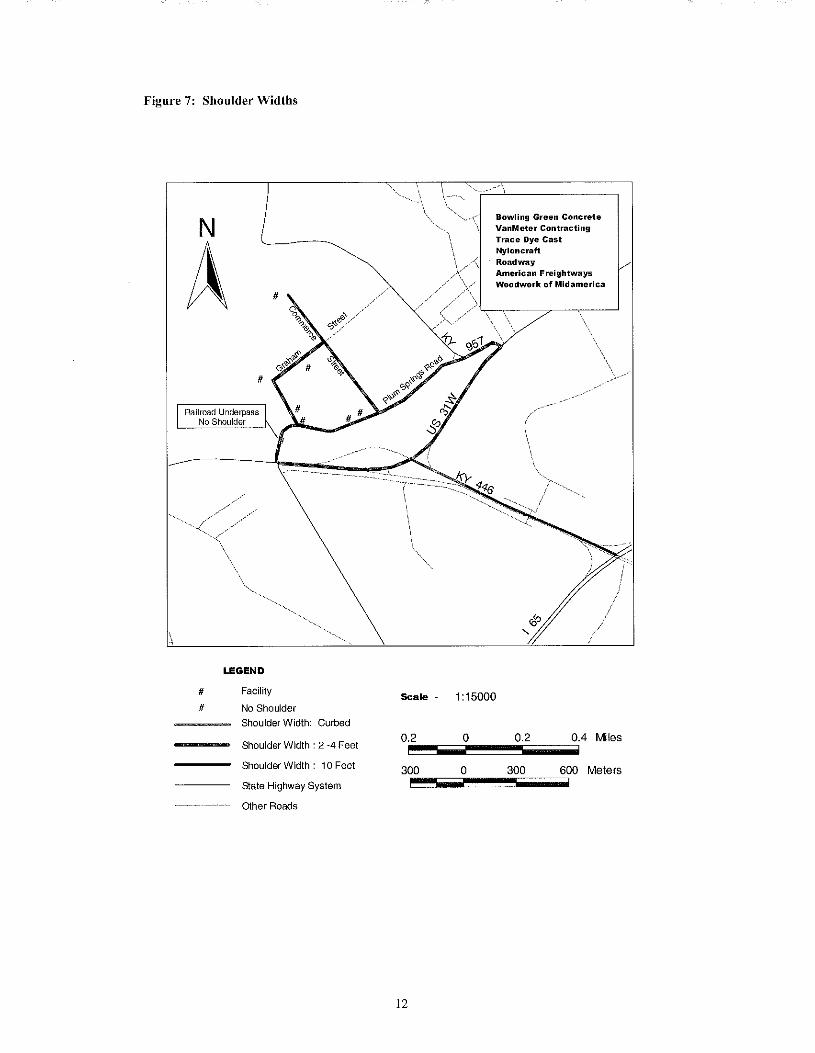
Figure 7: Shoulder Widths
\
N
A Railroad Underpass
No Shoulder
LEGEND
# Facility
# No Shoulder
Shoulder Width:
Shoulder Width
Curbed
:2-4Feet
Shoulder Width : 10 Feet
State Highway System
Other Roads
Scale -
0.2
300
12
Bowling Green Concrete VanMeter Contracting
Trace Dye Cast Nyloncraft
Roadway American Freightways Woodwork of Mid america
1:15000
0 0.2 0.4 Miles
0 300 600 Meters
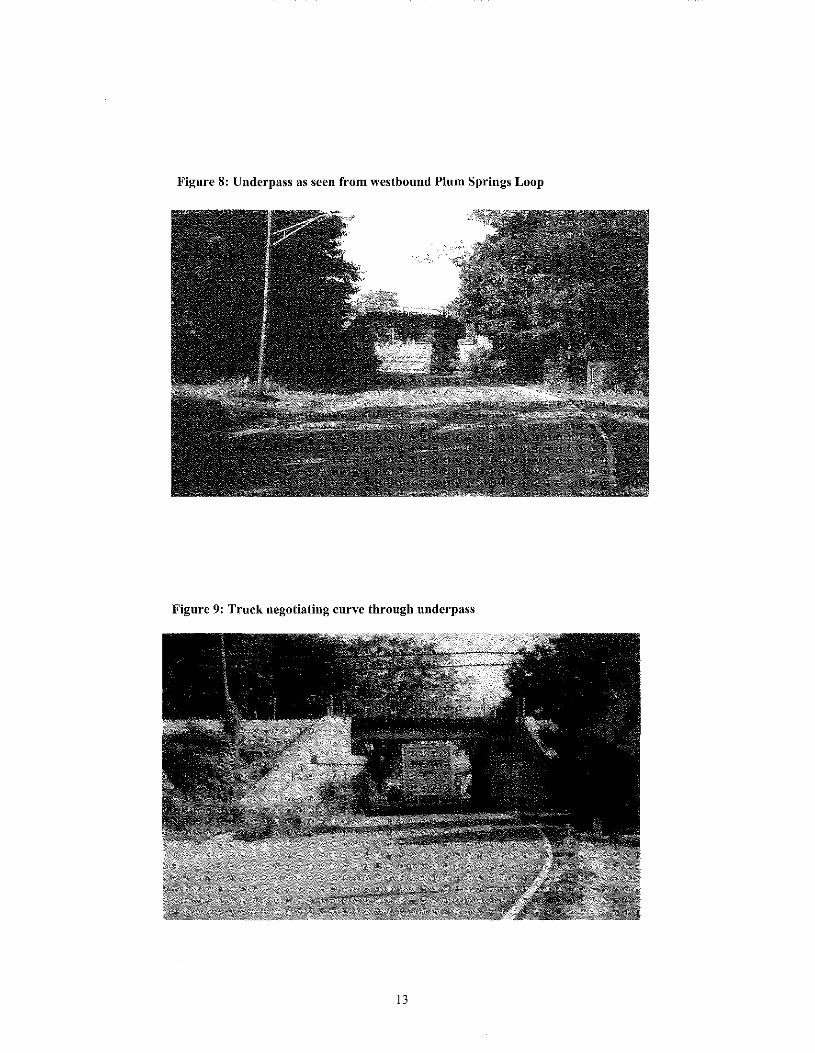
Figure 8: Underpass as seen from westbound Plum Springs Loop
Figure 9: Truck negotiating curve through underpass
13
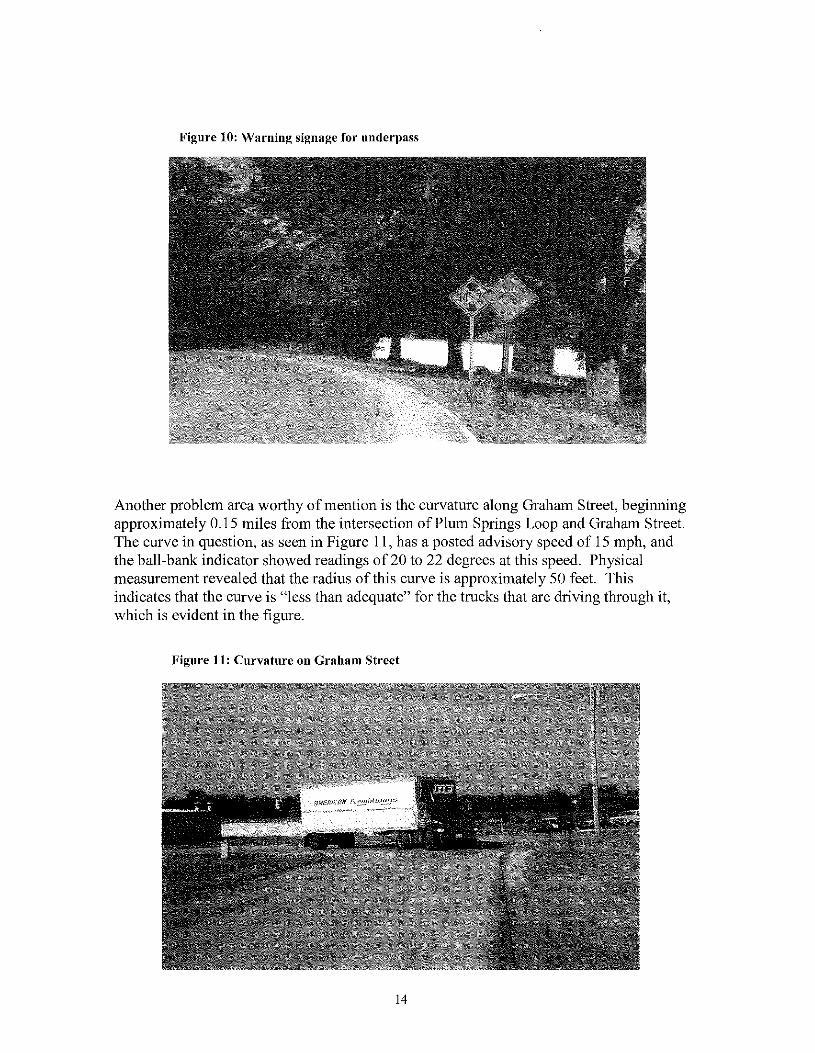
Figure 10: Warning signage for underpass
Another problem area worthy of mention is the curvature along Graham Street, beginning approximately 0.15 miles from the intersection of Plum Springs Loop and Graham Street. The curve in question, as seen in Figure II, has a posted advisory speed of 15 mph, and the ball-bank indicator showed readings of20 to 22 degrees at this speed. Physical measurement revealed that the radius ofthis curve is approximately 50 feet. This indicates that the curve is "less than adequate" for the trucks that are driving through it, which is evident in the figure.
Figure 11: Curvature on Graham Street
14
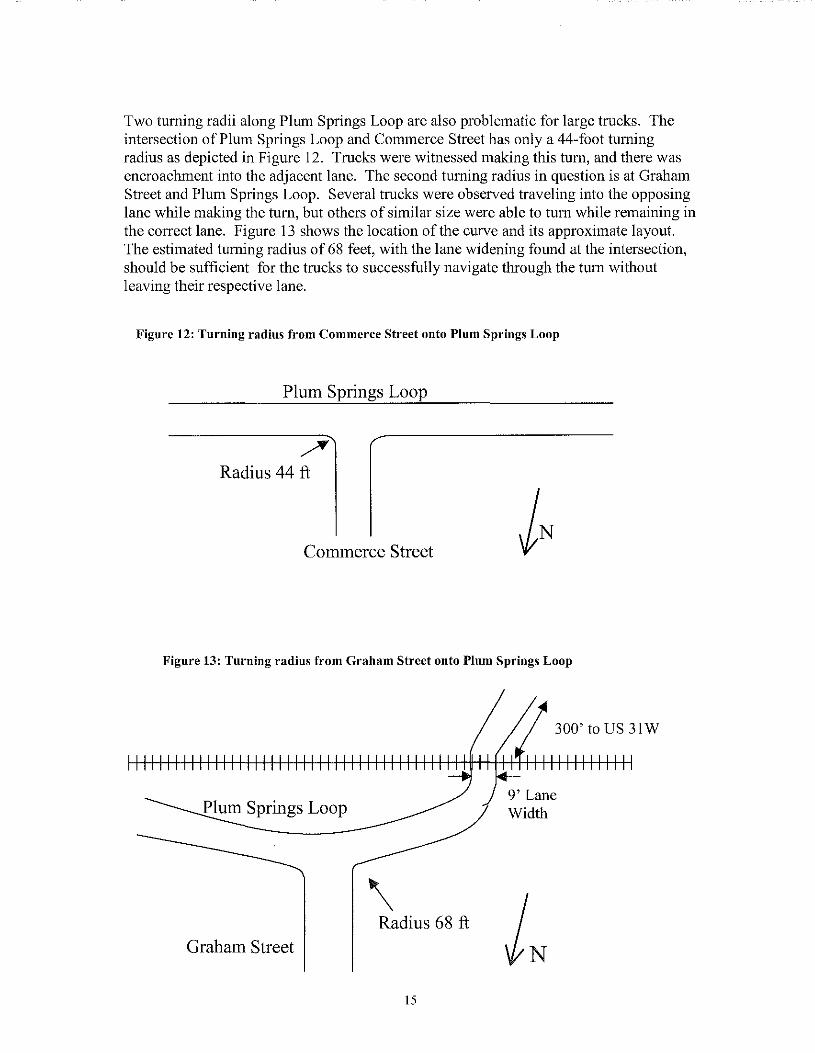
Two turning radii along Plum Springs Loop are also problematic for large trucks. The intersection of Plum Springs Loop and Commerce Street has only a 44-foot turning radius as depicted in Figure 12. Trucks were witnessed making this tum, and there was encroachment into the adjacent lane. The second turning radius in question is at Graham Street and Plum Springs Loop. Several trucks were observed traveling into the opposing lane while making the turn, but others of similar size were able to turn while remaining in the correct lane. Figure 13 shows the location of the curve and its approximate layout. The estimated turning radius of 68 feet, with the lane widening found at the intersection, should be sufficient for the trucks to successfully navigate through the tum without leaving their respective lane.
Figure 12: Turning radius from Commerce Street onto Plum Springs Loop
Plum Springs Loop
/ Radius 44ft
Commerce Street
Figure 13: Turning radius from Graham Street onto Plum Springs Loop
\ Radius 68ft
Graham Street
15
300' to US 31W
9' Lane Width

3.5 Railroad Crossings
There were no at-grade railroad crossings along either route.
3.6 Bridges
There are three bridges along the access routes, illustrated in Figure 14. The Kentucky Transportation Cabinet's Division of Operations maintains a database of bridge sufficiency ratings that are based on the serviceability (as well as other characteristics) of each structure. The first bridge is located on US 31 W at milepoint 17.76 and received a sufficiency rating of 75.7 out of a possible 100 points. This score is equivalent to a rating of"adequate" for the purpose of this evaluation. The remaining two bridges lie on KY 446 at milepoints 0.63 and 1.09. Both bridges are considered "adequate" with sufficiency ratings of 77 and 7 4.3, respectively.
3. 7 Sight Distance
One intersection was investigated with field measurements due to suspected sight distance problems. The intersection of Graham Street and Plum Springs Loop is near the end of a curved segment of roadway. This results in approximately 250 feet of sight distance in the westerly direction towards US 31 W. However, this distance does not result in a sight distance problem as all trucks must slow excessively before proceeding through the underpass in order to allow opposing traffic to pass through. Since the traffic speed is so low through this area and all trucks are forced to reduce speeds, there is no problem with the 250 feet of available sight distance. Thus, no sight distance problems occur along either route.
4.0 Complete Route Evaluation and Recommendations
4.1 Problem Truck Miles and Truck Points
In order to compare different routes to consider the relative urgency of needed route improvements, the features rated "preferred", "adequate", and "less than adequate" along a route have been normalized for the number of miles, number of points, and number of trucks using the section. In the case of this Warren County truck route, 6 features (lane widths, shoulders, bridges, curve safe speed, offtracking, and turning radii) that were evaluated quantitatively have sections or points that are considered only "adequate" or "less than adequate". A section or point that is considered "less than adequate" is weighted two times that of an adequate point or section. Less than "preferred" sections are weighed by length as well as the number of trucks passing that point.
Table 4 contains the total problem truck miles and total problem truck points for lane width, shoulders, turning radii, and bridges along this route. The numbers of trucks along
16

Figure 14: Bridge Locations
N
A #
LEGEND
# Facility
% 800005 Bridges- Bridge Number
Freight Access Route
State Highway System
Other Roads
Scale - 1:15000
Bowling Green Concrete VanMeter Contracting Trace Dye Cast Nyloncraft Roadway American Freightways Woodwork of Mid america
o~.2~""iiiiiiiii~o111111111111;;;o.iii2iiiiiiiiiiiiiiiiliio0.4 Miles
300 0 300 600 Meters
17
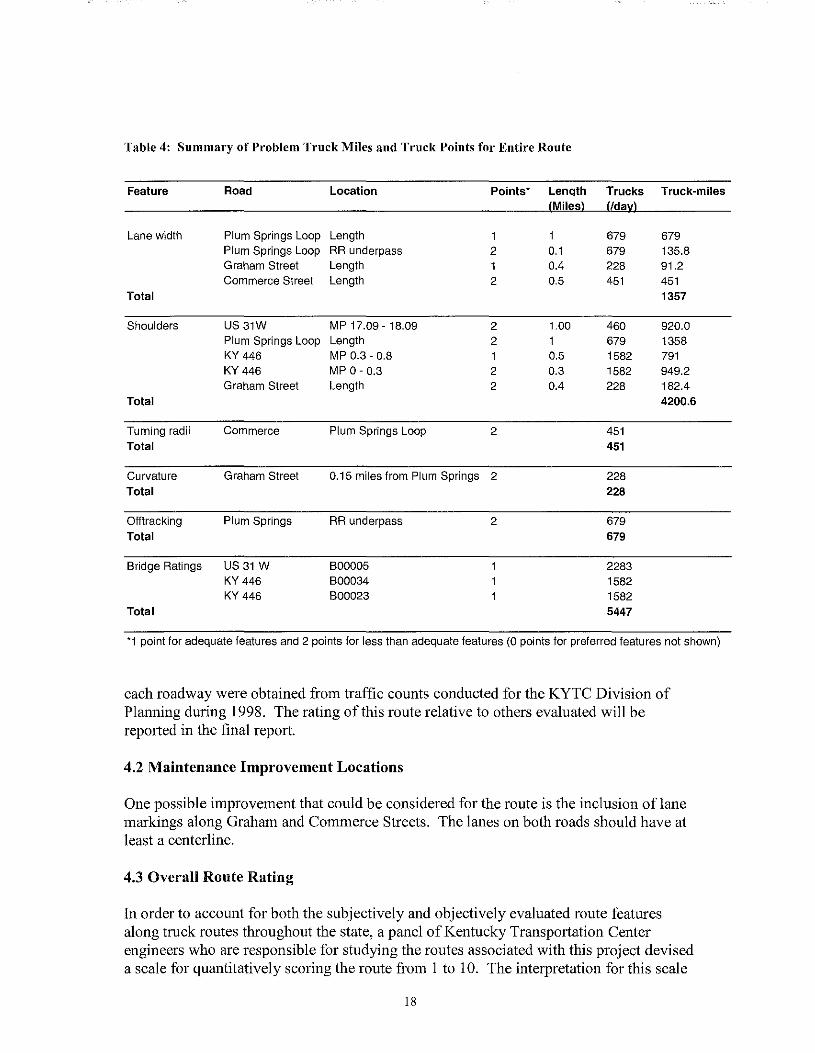
Table 4: Summary of Problem Truck Miles and Truck Points for Entire Route
Feature Road Location Points* Lenqth Truck-miles
Lane width Plum Springs Loop Length 679 679 Plum Springs Loop RR underpass 2 0.1 679 135.8 Graham Street Length 0.4 228 91.2 Commerce Street Length 2 0.5 451 451
Total 1357
Shoulders US 31W MP 17.09-18.09 2 1.00 460 920.0 Plum Springs Loop Length 2 679 1358 KY 446 MP 0.3-0.8 0.5 1582 791 KY 446 MP 0- 0.3 2 0.3 1582 949.2 Graham Street Length 2 0.4 228 182.4
Total 4200.6
Turning radii Commerce Plum Springs Loop 2 451 Total 451
Curvature Graham Street 0.15 miles from Plum Springs 2 228 Total 228
Offtracking Plum Springs RR underpass 2 679 Total 679
Bridge Ratings US31 W 800005 2283 KY 446 800034 1582 KY 446 800023 1582
Total 5447
*1 point for adequate features and 2 points for less than adequate features (0 points for preferred features not shown)
each roadway were obtained from traffic counts conducted for the KYTC Division of Planning during 1998. The rating of this route relative to others evaluated will be reported in the final report.
4.2 Maintenance Improvement Locations
One possible improvement that could be considered for the route is the inclusion oflane markings along Graham and Commerce Streets. The lanes on both roads should have at least a centerline.
4.3 Overall Route Rating
In order to account for both the subjectively and objectively evaluated route features along truck routes throughout the state, a panel of Kentucky Transportation Center engineers who are responsible for studying the routes associated with this project devised a scale for quantitatively scoring the route from I to I 0. The interpretation for this scale
18
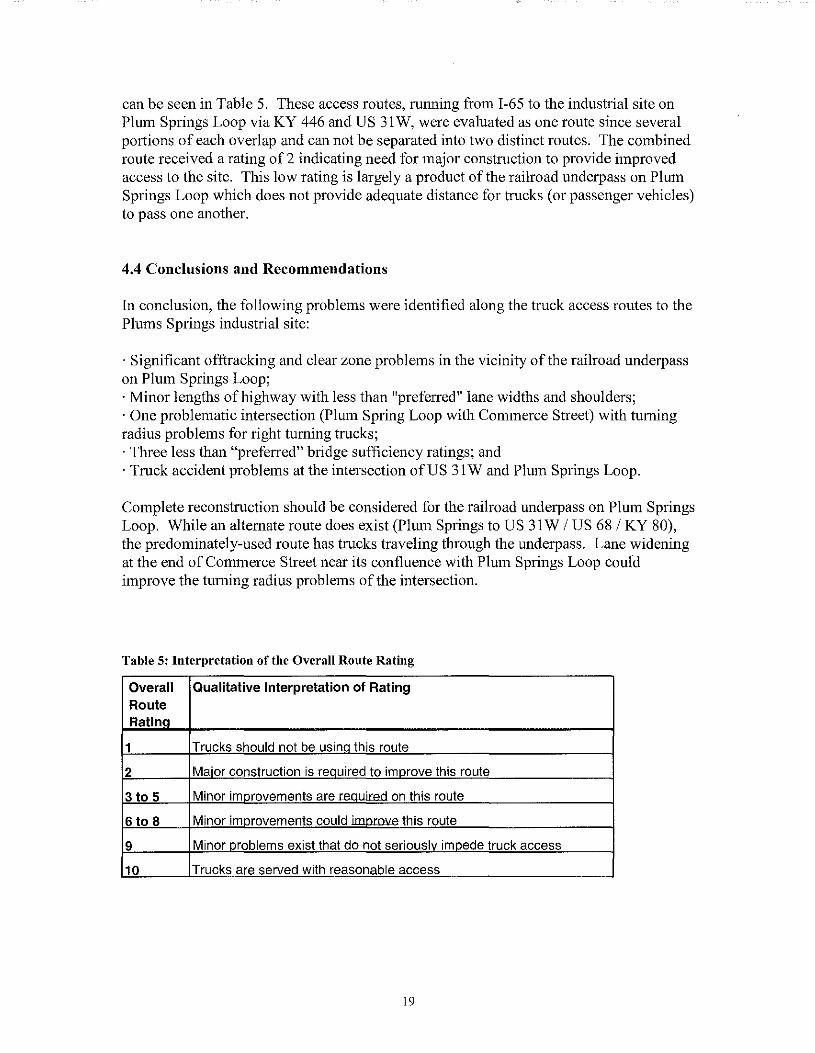
can be seen in Table 5. These access routes, running from I-65 to the industrial site on Plum Springs Loop via KY 446 and US 31 W, were evaluated as one route since several portions of each overlap and can not be separated into two distinct routes. The combined route received a rating of 2 indicating need for major construction to provide improved access to the site. This low rating is largely a product of the railroad underpass on Plum Springs Loop which does not provide adequate distance for trucks (or passenger vehicles) to pass one another.
4.4 Conclusions and Recommendations
In conclusion, the following problems were identified along the truck access routes to the Plums Springs industrial site:
· Significant offtracking and clear zone problems in the vicinity of the railroad underpass on Plum Springs Loop; ·Minor lengths of highway with less than "preferred" lane widths and shoulders; · One problematic intersection (Plum Spring Loop with Commerce Street) with turning radius problems for right turning trucks; · Three less than "preferred" bridge sufficiency ratings; and ·Truck accident problems at the intersection of US 31 Wand Plum Springs Loop.
Complete reconstruction should be considered for the railroad underpass on Plum Springs Loop. While an alternate route does exist (Plum Springs to US 31 WI US 68/ KY 80), the predominately-used route has trucks traveling through the underpass. Lane widening at the end of Commerce Street near its confluence with Plum Springs Loop coufd improve the turning radius problems of the intersection.
Table 5: Interpretation of the Overall Route Rating
Overall Qualitative Interpretation of Rating Route Rating
1 Trucks should not be usinq this route
2 Major construction is required to improve this route
3 to 5 Minor imorovements are rPnllir<>rl on this route
6 to 8 Minor imorovements could imnrm'" this route
9 Minor problems exist that do not seriouslv impede truck access
10 Trucks are served with reasonable access
19

Appendices
20
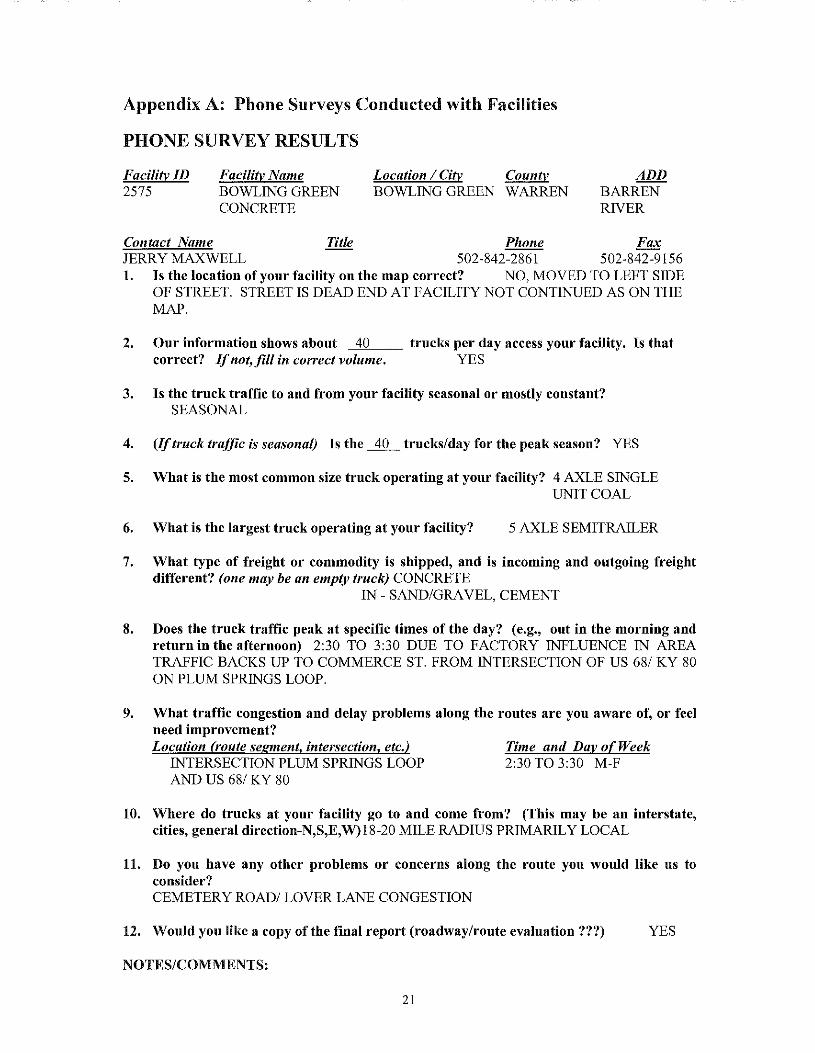
Appendix A: Phone Surveys Conducted with Facilities
PHONE SURVEY RESULTS
Facility lD 2575
Facility Name BOWLING GREEN CONCRETE
Location I City County BOWLINGGREEN WARREN
ADD BARREN RIVER
Contact Name Title Phone Fax JERRY MAXWELL 502-842-2861 502-842-9156 1. Is the location of your facility on the map correct? NO, MOVED TO LEFT SIDE
OF STREET. STREET IS DEAD END AT FACILITY NOT CONTINUED AS ON THE MAP.
2. Our information shows about 40 trucks per day access your facility. Is that correct? If not, fill in correct volume. YES
3. Is the truck traffic to and from your facility seasonal or mostly constant? SEASONAL
4. (If truck traffic is seasonal) Is the ___1!)_ trucks/day for the peak season? YES
5. What is the most common size truck operating at your facility? 4 AXLE SINGLE UNIT COAL
6. What is the largest truck operating at your facility? 5 AXLE SEMITRAILER
7. What type of freight or commodity is shipped, and is incoming and outgoing freight different? (one may be an empty truck) CONCRETE
IN - SAND/GRAVEL, CEMENT
8. Does the truck traffic peak at specific times of the day? (e.g., out in the morning and return in the afternoon) 2:30 TO 3:30 DUE TO FACTORY INFLUENCE IN AREA TRAFFIC BACKS UP TO COMMERCE ST. FROM INTERSECTION OF US 68/ KY 80 ON PLUM SPRINGS LOOP.
9. What traffic congestion and delay problems along the routes are you aware of, or feel need improvement? Location (route segment, intersection, etc./ Time and Dav of Week
INTERSECTION PLUM SPRINGS LOOP 2:30 TO 3:30 M-F AND US 68/ KY 80
10. Where do trucks at your facility go to and come from? (This may be an interstate, cities, general direction-N,S,E,W) 18-20 MILE RADIUS PRIMARILY LOCAL
11. Do you have any other problems or concerns along the route you would like us to consider? CEMETERY ROAD/ LOVER LANE CONGESTION
12. Would you like a copy of the final report (roadway/route evaluation???) YES
NOTES/COMMENTS:
21
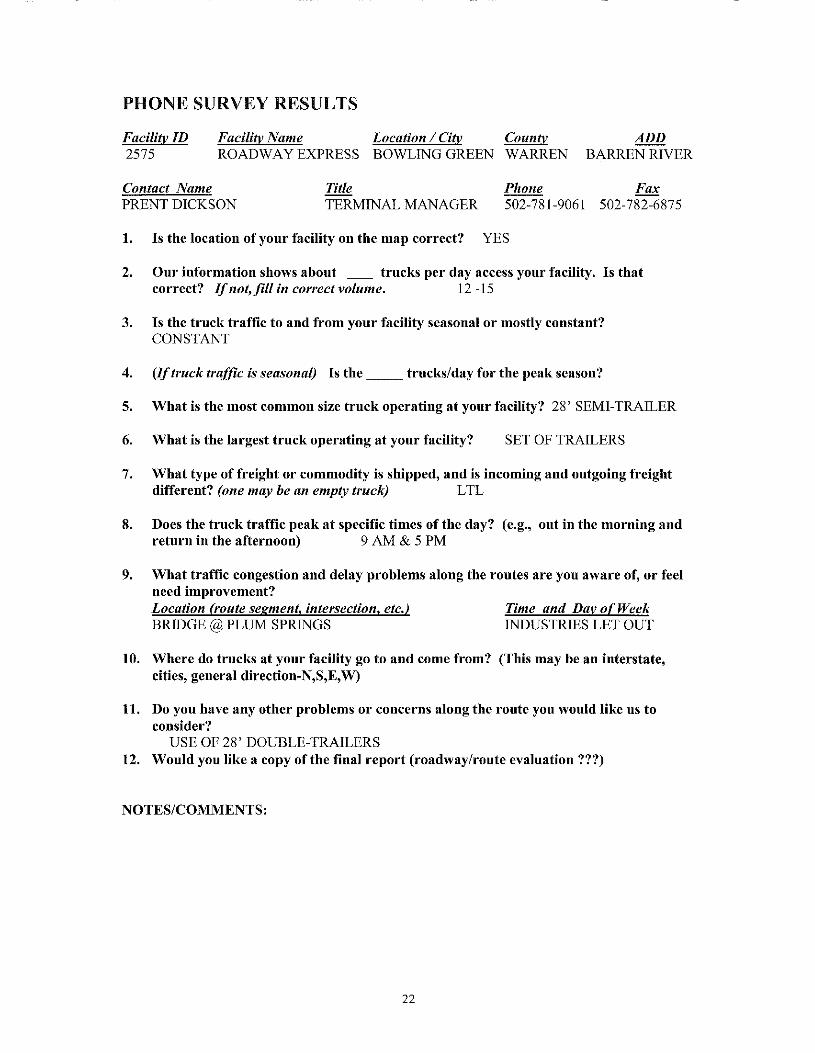
PHONE SURVEY RESULTS
FacilitvlD 2575
Facilitv Name Location I Citv Countv ADD BARREN RIVER ROADWAY EXPRESS BOWLING GREEN WARREN
Contact Name PRENT DICKSON
Title TERMINAL MANAGER
Phone Fax 502-781-9061 502-782-6875
1. Is the location of your facility on the map correct? YES
2. Our information shows about __ trucks per day access your facility. Is that correct? If not, fill in correct volume. 12-15
3. Is the truck traffic to and from your facility seasonal or mostly constant? CONSTANT
4. (If truck traffic is seasonal) Is the __ trucks/day for the peak season?
5. What is the most common size truck operating at your facility? 28' SEMI-TRAILER
6. What is the largest truck operating at your facility? SET OF TRAILERS
7. What type of freight or commodity is shipped, and is incoming and outgoing freight different? (one may be an empty truck) LTL
8. Does the truck traffic peak at specific times of the day? (e.g., out in the morning and return in the afternoon) 9 AM & 5 PM
9. What traffic congestion and delay problems along the routes are yon aware of, or feel need improvement? Location (route segment. intersection. etc.) Time and Dav of Week BRIDGE@ PLUM SPRINGS INDUSTRIES LET OUT
10. Where do trucks at your facility go to and come from? (This may be an interstate, cities, general direction-N,S,E,W)
11. Do you have any other problems or concerns along the route yon would like ns to consider?
USE OF 28' DOUBLE-TRAILERS 12. Would yon like a copy of the final report (roadway/route evaluation ???)
NOTES/COMMENTS:
22
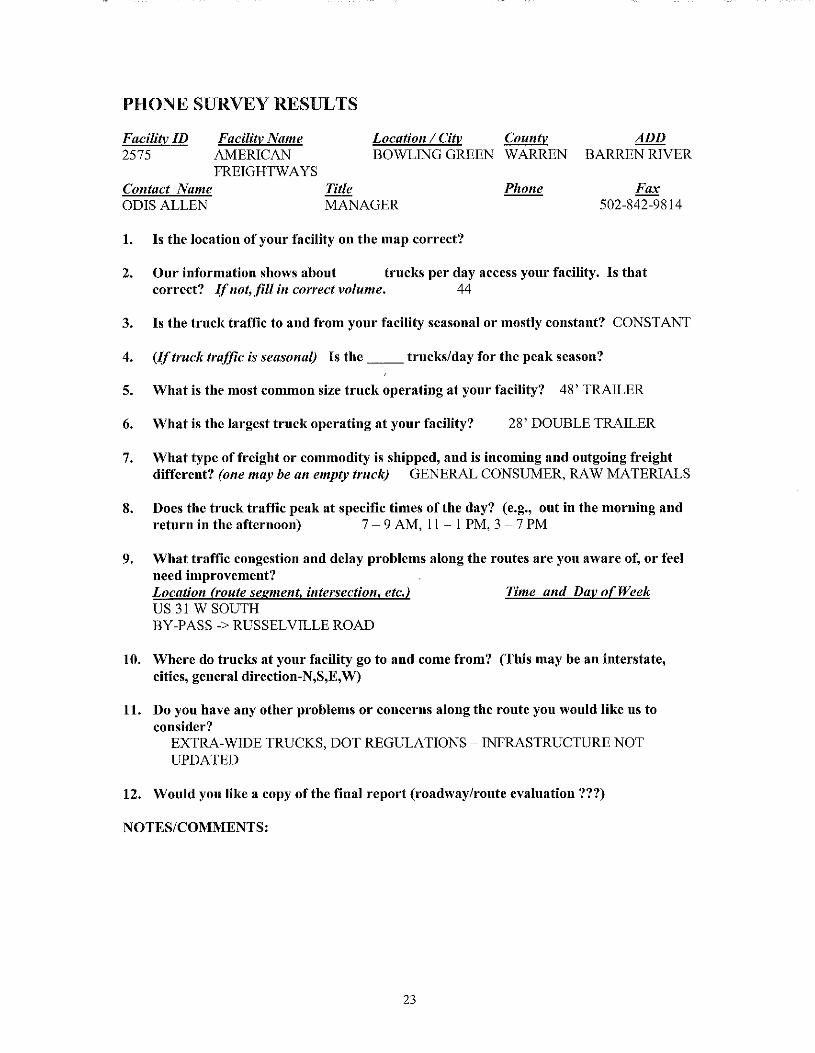
PHONE SURVEY RESULTS
Facilit.J!.ID FacilifJ!. Name Location I CifJ!. Count~ ADD 2575 AMERICAN BOWLING GREEN WARREN BARREN RIVER
FREIGHTWAYS Contact Name Title Phone Fax ODISALLEN MANAGER 502-842-9814
1. Is the location of your facility on the map correct?
2. Our information shows about __ trucks per day access your facility. Is that correct? If not, .fill in correct volume. 44
3. Is the truck traffic to and from your facility seasonal or mostly constant? CONSTANT
4. (If truck traffic is seasonal) Is the __ trucks/day for the peak season?
5. What is the most common size truck operating at your facility? 48' TRAILER
6. What is the largest truck operating at your facility? 28' DOUBLE TRAILER
7. What type of freight or commodity is shipped, and is incoming and outgoing freight different? (one may be an empty truck) GENERAL CONSUMER, RAW MATERIALS
8. Does the truck tratlic peak at specific times of the day? (e.g., out in the morning and return in the afternoon) 7- 9 AM, 11 - I PM, 3- 7 PM
9. What traffic congestion and delay problems along the routes are you aware of, or feel need improvement? Location (route segment. intersection. etc./ Time and Dav of Week US 31 WSOUTH BY-PASS-> RUSSEL VILLE ROAD
10. Where do trucks at your facility go to and come from? (This may be an interstate, cities, general direction-N,S,E,W)
11. Do you have any other problems or concerns along the route you would like us to consider?
EXTRA-WIDE TRUCKS, DOT REGULATIONS- INFRASTRUCTURE NOT UPDATED
12. Would you like a copy ofthe final report (roadway/route evaluation???)
NOTES/COMMENTS:
23
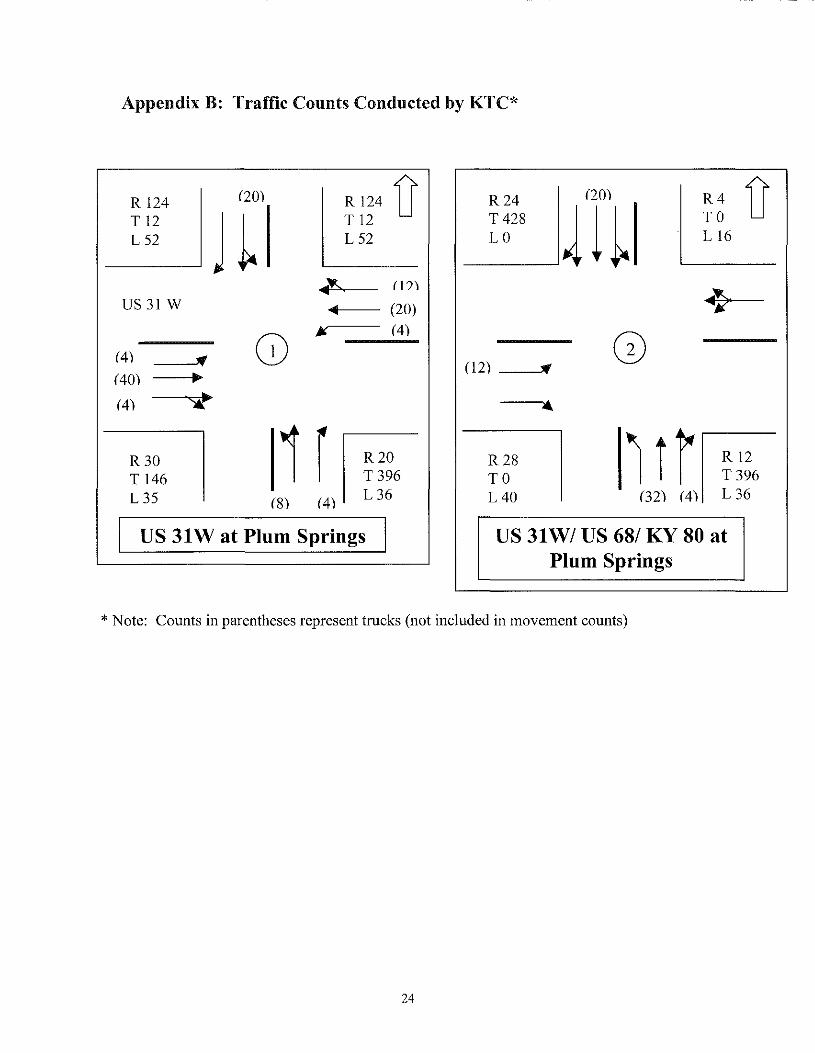
Appendix B: Traffic Counts Conducted by KTC*
R 124 (20) R 124 D T 12 H T 12 L52 L52
R24 (20) R4 D T428
41~ TO
LO L 16
..... {]))
us 31 w .. (20) ~
G) Jf. (4)
(4) !(
(40) ~
G) (12) •
(4) ~ .. 1 r R30 R20
T 146 T396 ~I ir R28 R 12
TO T396
L 35 (8) (4) L36 L40 (32) (4) L36
I US 31W at Plum Springs I US 31W/ US 68/ KY 80 at Plum Springs
*Note: Counts in parentheses represent trucks (not included in movement counts)
24
Top Related