


Languages
Pages
Legal


Tropical Cyclone Report
Hurricane Frances25 August - 8 September 2004
John L. Beven II National Hurricane Center
17 December 2004
Frances was a Cape Verde-type hurricane that reached a peak intensity of category 4 on theSaffir-Simpson Hurricane Scale. It affected the Bahamas as a category 3 hurricane and theFlorida east coast as a category 2 hurricane.
a. Synoptic History
Frances developed from a vigorous tropical wave that moved westward from the coast of Africa on 21August. Convection associated with the wave gradually became better organized, and the first Dvoraksatellite intensity estimates were made on 24 August. A tropical depression formed from the wave near 0000UTC 25 August about 655 n mi west-southwest of the southern Cape Verde Islands. The "best track" chartof the tropical cyclone's path is given in Figure 1, with the wind and pressure histories shown in Figure 2and Figure 3, respectively. The best track positions and intensities are listed in Table 1.
The depression moved westward on the south side of the Bermuda-Azores high and intensified, becoming atropical storm later on 24 August. Frances turned west-northwestward on 26 August as it became ahurricane, and that heading and the intensification continued until 28 August, when Frances reached a firstpeak intensity estimated at 115 kt. The hurricane turned westward late on 29 August while it slowlyweakened during a concentric eyewall cycle. Re-intensification began on 30 August, and Frances reached asecond peak intensity of 125 kt (category 4) late on 31 August as it passed north of the Leeward and VirginIslands. The hurricane moved west-northwestward on 1-2 September, which brought the center just north ofthe Turks and Caicos Islands and the southeastern Bahama Islands. The maximum winds remained 120-125kt during this time while the hurricane underwent a series of concentric eyewall cycles. Moderate westerlyvertical shear developed later on 2 September, and Frances weakened notably during the next two days. Itwas a category 3 hurricane, with winds of 100-110 kt, over the central Bahama Islands on 2-3 Septemberand a category 2 hurricane, with winds of 85-90 kt, over the northwestern Bahamas on 3-4 September.
Steering currents weakened as Frances reached the northwestern Bahamas due to a high pressure ridgebuilding west of the cyclone. This caused storm moved slowly westward across the Gulf Stream on 4September. The shear weakened, which allowed slight re-intensification over the Gulf Stream, followed byslight weakening just before Frances made landfall over the southern end of Hutchinson Island, Florida near0430 UTC 5 September as a Category 2 hurricane. Frances gradually weakened as it moved slowly west-northwestward across the Florida Peninsula, and became a tropical storm just before emerging into thenortheastern Gulf of Mexico near New Port Richey early on 6 September.
Frances did not strengthen over the Gulf, with maximum sustained winds remaining 50-55 kt with apressure near 982 mb. It moved northwestward and made a final landfall near the mouth of the Aucilla

River in the Florida Big Bend region about 1800 UTC 6 September. The northwestward motion continueduntil 7 September, when Frances re-curved northeastward into the westerlies over eastern Alabama andwestern Georgia. Frances weakened to a tropical depression early on 7 September and then becameextratropical over West Virginia early on 9 September. As an extratropical cyclone, Frances briefly hadgale-force winds as it accelerated northeastward across New York later on 9 September. The cyclone turnedeastward across northern New England and southeastern Canada, dissipating over the Gulf of St. Lawrencelate on 10 September.
b. Meteorological Statistics
Observations in Frances (Figure 2 and Figure 3) include satellite-based Dvorak technique intensity estimatesfrom the Tropical Analysis and Forecast Branch (TAFB), the Satellite Analysis Branch (SAB) and the U. S.Air Force Weather Agency (AFWA), as well as flight-level and dropwindsonde observations from flights ofthe 53rd Weather Reconnaissance Squadron of the U. S. Air Force Reserve Command. Microwave satelliteimagery from NOAA polar-orbiting satellites, the NASA Tropical Rainfall Measuring Mission (TRMM),the NASA QuikSCAT, the NASA Aqua, and Defense Meteorological Satellite Program (DMSP) satelliteswere also useful in tracking Frances. Additionally, WSR-88D Doppler radars in Puerto Rico and thesoutheastern United States provided detailed data on Frances, as did a U. S. Department of Defense radarlocated in the Bahamas.
The Air Force Reserve and NOAA Hurricane Hunters flew 34 operational missions for Frances, includingstandard reconnaissance and synoptic surveillance. The aircraft made a total of 59 formal fixes of Frances -56 from the Air Force and 3 from NOAA. A NOAA aircraft reported winds of 144 kt at a flight level of8000 ft at 1726 UTC 31 August, while Air Force aircraft measured winds of 138 kt at 700 mb at 1114 UTC31 August and again at 0543 UTC 2 September. A dropwindsonde in the northern eyewall reported windspeak of 166 kt at a level of 904 mb near 0539 UTC 2 September. The lowest aircraft-measured pressure was935 mb at 0712 UTC 1 September, with a 936 mb pressure reported at 0718 UTC 2 September. Severalresearch flights also occurred, with one such mission deploying a series of drifting buoys that reporteduseful pressure and sea surface temperature data from Frances as well as the subsequent Hurricane Jeanne.
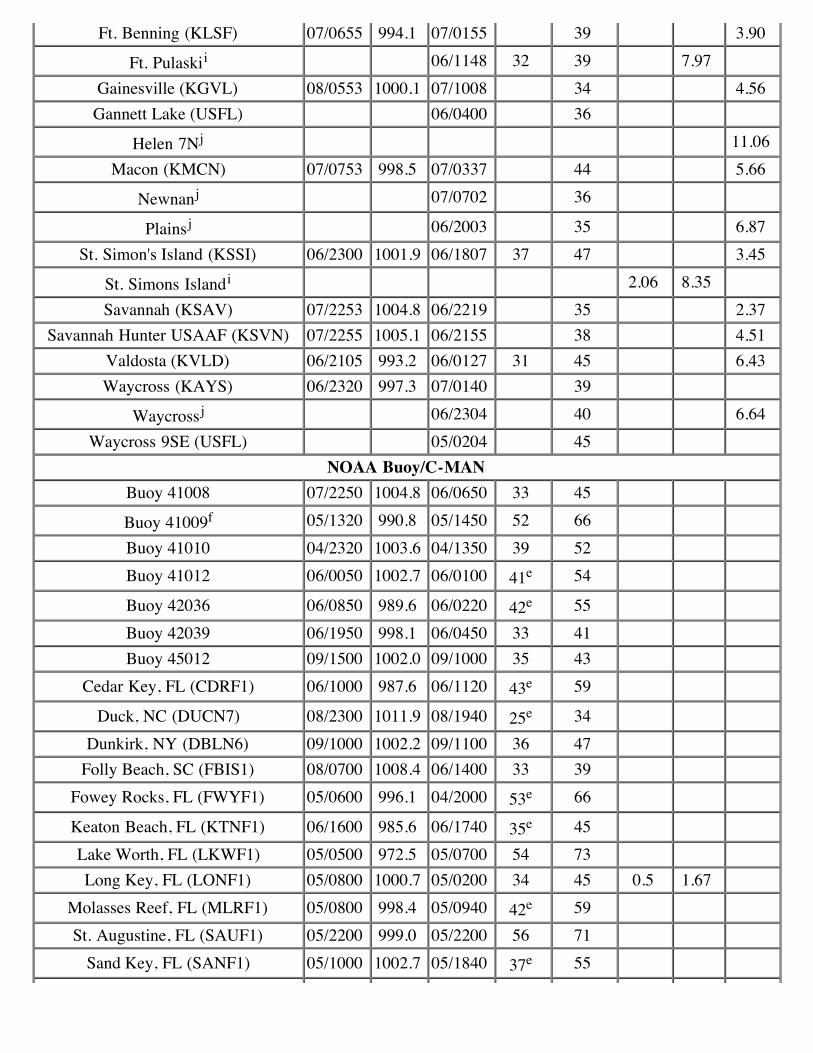
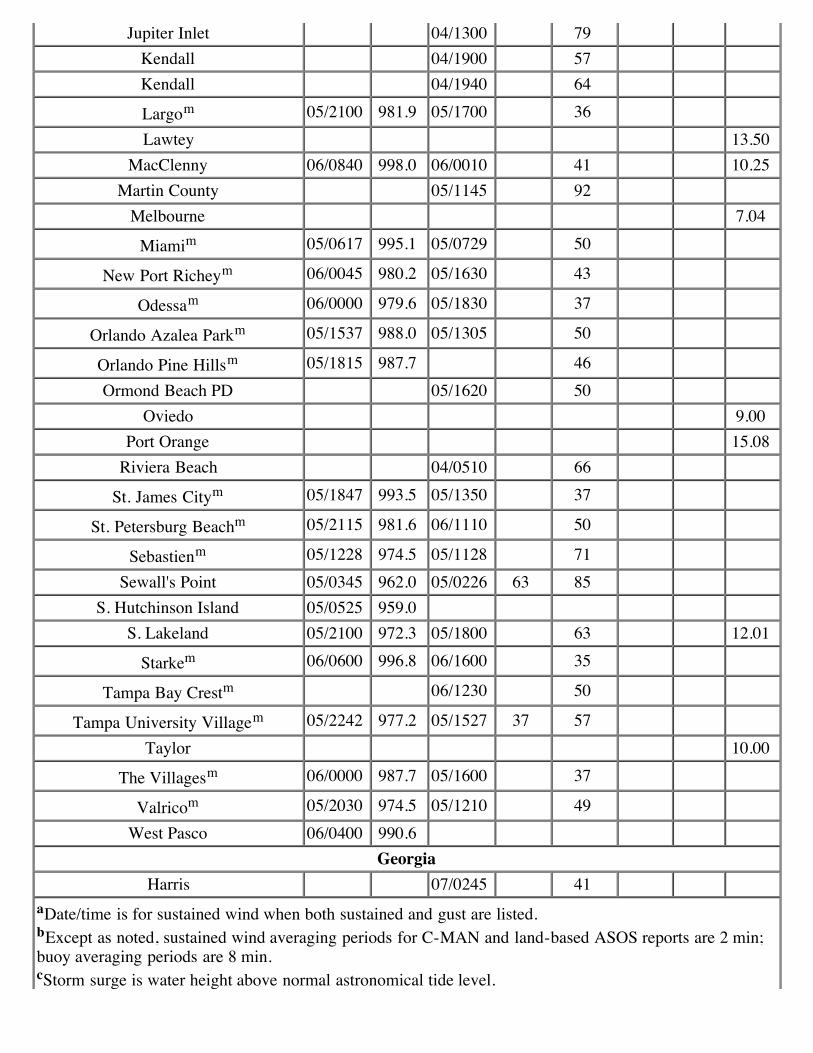
Frances brought hurricane conditions to much of the central and northwestern Bahamas, southeasternFlorida, and the adjacent Atlantic. Ship reports of winds of tropical storm force associated with Frances aregiven in Table 2, and selected surface observations from land stations and data buoys are given in Table 3.The maximum sustained wind reported from a land station was 87 kt at North Eleuthera in the northwesternBahamas at 1000 UTC 3 September. The Coastal Marine Automated Network (C-MAN) station atSettlement Point on Grand Bahama Island reported a 10-minute mean wind of 73 kt at 2320 UTC 4September and a peak gust of 96 kt. San Salvador in the Central Bahamas reported a peak gust of 104 kt at1900 UTC 2 September. In Florida, an Army Corps of Engineers (USACE) station at Port Mayaca reportedsustained winds of 74 kt at 0500 UTC 5 September, while a portable instrumented tower run by the FloridaCoastal Monitoring Program (FCMP) at Ft. Pierce reported 70 kt sustained winds at 0402 UTC 5 Septemberalong with a peak gust of 94 kt. Unofficial reports include a sustained wind of 70 kt from the Jupiter policedepartment and a gust to 94 kt in Martin County. It should be noted that a gust of 108 kt at Port Canaveralthat was reported operationally was found to be unreliable in post-analysis.
Shipping mostly avoided Frances as it crossed the Atlantic. The highest winds reported by a ship were 43 ktfrom a ship with the call sign C6FV9 at 1200 UTC 5 September. Two drifting buoys reported sustainedwinds of 78 kt, although the reliability of these reports is uncertain.
The lowest reported pressure from a land station was 948.1 mb at San Salvador in the Bahamas at 2000UTC 2 September. North Eleuthera reported a minimum pressure of 958.6 mb at 1400 UTC 3 September,

while Settlement Point reported a minimum pressure of 963.2 mb at 1600 UTC 4 September. In Florida, theUSACE station at St. Lucie lock reported a minimum pressure of 962.1 mb at 0600 UTC 5 September,while the FCMP tower at Port Salerno reported a minimum pressure of 962.8 mb at 0550 UTC that day. Astorm chaser on southern Hutchinson Island reported an unofficial pressure of 959.0 mb at 0525 UTC thatday, while a second storm chaser at Sewall's Point reported a pressure of 962.0 mb at 0345 UTC that day.Additionally, a drifting buoy measured a pressure of 955.2 mb at 0307 UTC 2 September.
Frances produced notable storm surges along both the Atlantic and Gulf coasts of Florida. The highestmeasured storm surge was 5.89 ft above mean sea level on the Florida east coast at the St. Lucie Lock. TheNational Weather Service Melbourne Weather Forecast Office (WFO) estimated storm surge at 8 ft nearVero Beach and 6 ft around Cocoa Beach. Lesser storm surge values were estimated elsewhere along theFlorida east coast, while storm surges of 1-2 ft above normal tide levels were reported as far north as theGeorgia coast. Along the Gulf coast, a storm tide of 6 ft was estimated in Pinellas County, FL, while stormtides of 3-5 ft were estimated in the Florida Big Bend area.
Frances also produced significant storm surge on several of the Bahama Islands, which the inundated theairports at Freeport, Grand Bahama, and Marsh Harbor, Abaco. However, exact surge values are notavailable.
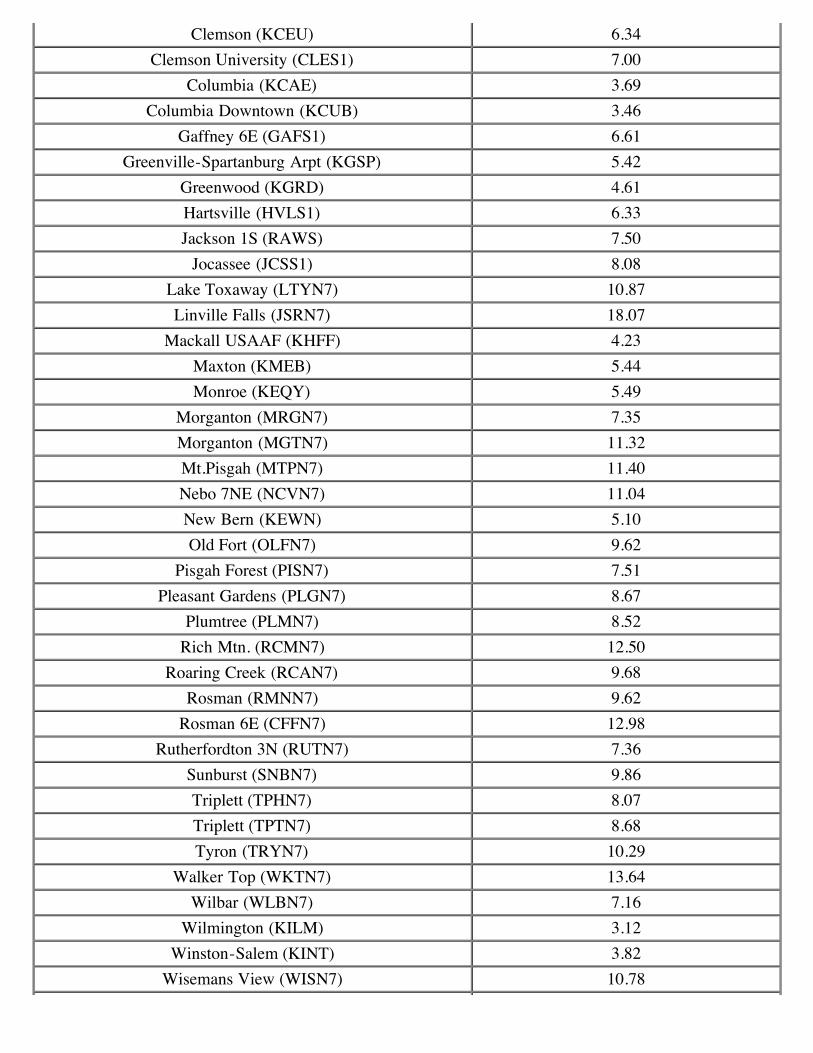
Frances caused widespread heavy rains and associated freshwater flooding over much of the eastern UnitedStates (Figure 4). The maximum reported rainfall was 18.07 in at Linville Falls, North Carolina (Table 4).This was part of a swath of rains in excess of 10 in along the Appalachian Mountains in western NorthCarolina and northeastern Georgia. Rainfalls in excess of 10 in also occurred over large portions of thecentral and northern Florida Peninsula and southeastern Georgia, with storm totals of 15.84 in at HighSprings, FL, 15.81 in near Chassahowitzka, FL, and an unofficial total of 15.08 in at Port Orange, FL (Table3). Storm-total rainfalls of 5-10 in were common elsewhere along Frances' track as a tropical cyclone, withreports of 3-6 in totals along the extratropical portion of the track.
A total of 101 tornadoes have been reported in association with Frances - 23 in Florida, 7 in Georgia, 45 inSouth Carolina, 11 in North Carolina, and 15 in Virginia. Many of the tornadoes occurred in an outbreakover South and North Carolina on 7 September.
c. Casualty and Damage Statistics
Frances is directly responsible for seven deaths - five in Florida, one in the Bahamas, and one in Ohio.Three deaths were caused by wind, two by storm surge, one by freshwater flooding, and one by lightning.The hurricane is indirectly responsible for 42 deaths - 32 in Florida, 8 in Georgia, 1 in the Bahamas, and 1 inOhio.
The American Insurances Service Group reports that Frances causes $4.43 billion in damage to insuredproperty in the United States, with $4.11 billion occurring in Florida. Applying a two-to-one ratio to thisfigure to account for damage to uninsured property yields a damage estimate of $8.86 billion. Additionally,space and military facilities in the Cape Canaveral area reported over $100 million dollars in propertydamage. Therefore, the best estimate of the total property damage from Frances is $9 billion, which in termsof unadjusted damage makes Frances the fourth most costly hurricane in United States history behindAndrew of 1992, and Charley and Ivan of 2004. This total does not include agricultural or economic losses.Widespread property damage also occurred in the central and northwestern Bahama Islands. However, nomonetary damage figures are available at this time.
d. Forecast and Warning Critique

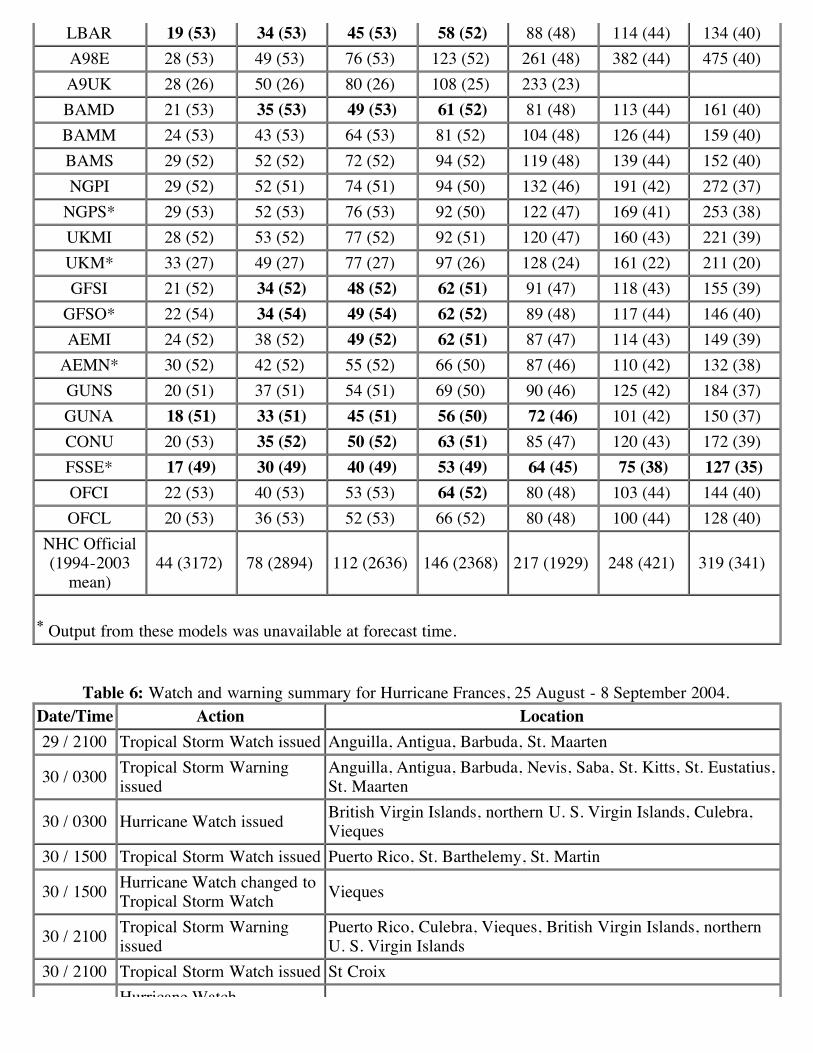
The overall track forecast errors for Frances were exceptionally good. Average official track errors (with thenumber of cases in parentheses) were 20 (53), 36 (53), 52 (53), 66 (52), 80 (48), 100 (44), and 128 (40) n mifor the 12, 24, 36, 48, 72, 96, and 120 h forecasts, respectively. These errors are 50-70% lower than theaverage official track errors for the 10-yr period 1994-2003[1] (44, 78, 112, 146, 217, 248, and 319 n mi,respectively), (Table 5). Not only are the average track forecast errors outstanding, but only five of theindividual track forecasts at any time exceeded the long-term average errors - two 12-h forecasts, one 36-hforecast, and two 96-h forecasts. As good as the official track forecasts were, they were bettered by some ofthe numerical guidance. The lowest track forecast errors amongst the guidance were from the Florida StateUniversity Superensemble (FSSE), which on average outperformed the official forecast at all times.
Some of the low track forecast errors can be attributed to Frances' long track south of the subtropical ridgeand the occasionally slow motion, both of which favor low track forecast errors. However, the forecasterrors stayed relatively low through the time where Frances slowed near the Bahamas and turnednorthwestward across Florida - which were tougher forecast scenarios.
The average intensity forecast errors were also smaller than normal. Average official intensity errors were 2,7, 10, 13, 15, 14, 14, and 16 kt for the 12, 24, 36, 48, 72, 96, and 120 h forecasts, respectively. Forcomparison, the average official intensity errors over the 10-yr period 1994-2003 are 6, 10, 12, 15, 19, 20,and 21 kt, respectively. While the average errors were low, there were two periods of rather large forecasterrors. The first was early in Frances' life when the amount of intensification was underforecast. The secondwas as Frances approached the Bahamas when the impact of the vertical shear was underestimated, resultingin a series of forecast intensities that were too strong.
Table 6 shows the watches and warnings issued for Frances. A hurricane watch was issued for thesoutheastern Bahamas and the Turks and Caicos Islands at 0900 UTC 31 August, with a hurricane warningissued 6 h later. These were 33 and 27 h respectively before the closest approach of the center to the Turksand Caicos. A hurricane watch was issued for the central Bahamas at 1500 UTC 31 August, while ahurricane warning was issued at 1500 UTC 1 September. These were 52 and 28 h respectively before thearrival of the center at San Salvador Island. A hurricane watch was issued for the northwestern Bahamas at1500 UTC 1 September, with a hurricane warning issued at 0000 UTC 2 September. These were 43 and 34 hrespectively before the arrival of the center at Eleuthera Island.
In the United States, a hurricane watch was issued for the east coast of Florida at 0300 UTC 2 September,with a hurricane warning following at 1500 UTC that day. These were 73 and 61 h respectively before thecenter reached Hutchinson Island. Along the Gulf coast, a tropical storm watch was issued for the eventuallandfall area at 1500 UTC 4 September, with a tropical storm warning following 6 h later. These were 51and 45 h respectively before the center reached the Aucilla River.
A series of watches and warnings were issued for the islands of the northeastern Caribbean in anticipationthat Frances would come close enough to produce tropical storm conditions. Also, a hurricane warning wasissued for portions of the Florida Gulf coast in anticipation that Frances would maintain hurricane strengthall the way across the Florida Peninsula, or re-intensify over the Gulf of Mexico. These watches andwarnings did not verify.
Acknowledgements
Much of the data for this report was supplied by the National Weather Service WFOs in Key West, Miami,Tampa, Melbourne, Jacksonville, and Tallahassee FL, as well as by the South Florida Water ManagementDistrict, the St. John's River Water Management District, and the Florida Automated Weather Network(FAWN). NOAA buoy and C-MAN data were provided by the National Data Buoy Center. NOS data wereprovided by the NOAA National Ocean Service. Remote Automated Weather Stations (RAWS) data were

provided by the National Interagency Fire Center. United States Geological Survey (USGS) data wereprovided by the NWISWeb web site. The rainfall map and much of the supplementary rainfall data wasprovided by David Roth of the Hydrometeorological Prediction Center. Much of the tornado data wasprovided by the Storm Prediction Center. Several of the unofficial observations were obtained from theWeather Underground web site.
[1]Errors given for the 96 and 120 h periods are averages over the three-year period 2001-3.
Table 1: Best track for Hurricane Frances, 25 August - 8 September 2004.
Date/Time(UTC)
PositionPressure
(mb)Wind Speed
(kt) StageLat.(°N)
Lon.(°W)
25 / 0000 11.1 35.2 1009 25 tropical depression 25 / 0600 11.2 36.8 1008 30 " 25 / 1200 11.3 38.3 1007 30 " 25 / 1800 11.5 39.8 1005 35 tropical storm 26 / 0000 11.9 41.5 1003 40 " 26 / 0600 12.3 42.9 1000 45 " 26 / 1200 12.8 44.5 994 55 " 26 / 1800 13.3 45.8 987 65 hurricane 27 / 0000 13.7 46.8 984 70 " 27 / 0600 14.2 47.8 980 75 " 27 / 1200 14.7 48.5 970 90 " 27 / 1800 15.4 49.3 962 100 " 28 / 0000 15.9 50.0 962 100 " 28 / 0600 16.6 50.9 962 100 " 28 / 1200 17.2 51.6 958 105 " 28 / 1800 17.7 52.3 948 115 " 29 / 0000 18.1 52.9 948 115 " 29 / 0600 18.4 53.6 948 115 " 29 / 1200 18.6 54.4 948 115 " 29 / 1800 18.8 55.0 948 110 " 30 / 0000 18.9 55.8 954 105 " 30 / 0600 19.0 56.8 958 100 " 30 / 1200 19.2 58.1 956 100 " 30 / 1800 19.4 59.3 948 110 " 31 / 0000 19.6 60.7 946 110 " 31 / 0600 19.8 62.1 950 115 " 31 / 1200 20.0 63.5 949 120 "

31 / 1800 20.3 65.0 942 125 " 01 / 0000 20.6 66.4 941 120 " 01 / 0600 21.0 67.9 939 120 " 01 / 1200 21.4 69.1 937 120 " 01 / 1800 21.8 70.4 941 120 " 02 / 0000 22.2 71.4 939 120 " 02 / 0600 22.7 72.5 937 125 " 02 / 1200 23.2 73.5 939 120 " 02 / 1800 23.8 74.3 948 115 " 03 / 0000 24.2 75.0 948 105 " 03 / 0600 24.7 75.7 954 100 " 03 / 1200 25.3 76.3 958 95 " 03 / 1800 25.7 77.1 960 90 " 04 / 0000 26.0 77.5 960 85 " 04 / 0600 26.4 77.9 960 85 " 04 / 1200 26.8 78.5 962 90 " 04 / 1800 26.8 79.1 962 90 " 05 / 0000 27.0 79.4 958 95 " 05 / 0600 27.2 80.2 960 90 " 05 / 1200 27.4 80.7 969 80 " 05 / 1800 27.8 81.7 975 60 tropical storm 06 / 0000 28.1 82.3 978 55 " 06 / 0600 28.6 83.3 981 55 " 06 / 1200 29.2 83.7 982 55 " 06 / 1800 30.1 84.0 982 50 " 07 / 0000 31.0 84.6 984 35 " 07 / 0600 31.5 85.0 988 30 tropical depression 07 / 1200 32.0 85.2 992 25 " 07 / 1800 32.5 85.1 996 25 " 08 / 0000 33.4 84.7 998 25 " 08 / 0600 34.3 84.3 1000 25 " 08 / 1200 36.1 83.2 1001 25 " 08 / 1800 37.8 82.1 1002 25 " 09 / 0000 38.7 81.3 1001 25 extratropical 09 / 0600 40.5 80.0 1001 30 " 09 / 1200 42.8 77.7 1001 35 " 09 / 1800 44.3 75.7 1002 30 " 10 / 0000 45.3 73.3 1003 25 "

10 / 0600 46.2 70.5 1004 20 " 10 / 1200 46.6 67.3 1005 20 " 10 / 1800 47.2 64.2 1005 20 " 11 / 0000 dissipated 01 / 0700 21.1 68.1 935 120 minimum pressure 31 / 1800 20.3 65.0 942 125 maximum wind 02 / 0730 22.8 72.8 936 125 " 02 / 1930 24.0 74.5 948 110 landfall on San Salvador Island,Bahamas 03 / 0530 24.6 75.6 954 100 landfall on northern end of Cat Island,Bahamas 03 / 1000 25.1 76.1 956 95 landfall on Eleuthera Island,Bahamas 04 / 1000 26.6 78.2 961 90 landfall on Grand Bahama Island,Bahamas 05 / 0430 27.2 80.2 960 90 landfall at southern end of Hutchinson Island, FL 06 / 1800 30.1 84.0 982 50 landfall at mouth of Aucilla River, FL
Table 2: Selected ship and drifting buoy reports with winds of at least 34 kt for Hurricane Frances, 25August -8 September 2004
Ship Name or Call Sign Date/Time (UTC) Lat.(°N)
Lon.(°W) Wind dir/speed (deg/kt) Pressure (mb)
Buoy 41544 01 / 0700 23.0 66.7 090 / 37 1010.4 Buoy 41544 01 / 1600 23.1 66.7 090 / 41 1015.2 Buoy 41927 01 / 1601 23.6 70.1 080 / 93 1010.9 Buoy 41543 02 / 0000 24.0 70.7 100 / 39 1008.1 Buoy 41539 02 / 0000 24.4 69.1 090 / 35 1012.9 Buoy 41545 02 / 0000 24.4 70.4 090 / 39 1011.0 Buoy 41922 02 / 0307 22.2 71.9 N/A / 35 955.2 Buoy 41543 02 / 0400 24.1 70.7 120 / 49 1009.7
Anke-Angela 02 / 0600 26.9 72.1 090 / 36 1016.0 Buoy 41545 02 / 0700 24.4 70.4 110 / 37 1010.8 Buoy 41925 02 / 0727 22.9 71.7 130 / 70 989.3 Buoy 41934 02 / 0906 24.6 72.0 N/A / 78 N/A Buoy 41939 02 / 0910 22.2 71.2 N/A / 52 N/A Buoy 41542 02 / 1800 27.6 69.6 N/A / 58 1016.0 Buoy 41927 02 / 1841 23.6 70.1 N/A / 41 N/A Buoy 41926 03 / 0243 23.1 69.1 140 / 35 1014.6 Buoy 41541 03 / 0700 24.6 76.6 320 / 49 986.7 Buoy 41542 03 / 0700 27.6 69.6 130 / 51 1015.2 Buoy 41541 03 / 1800 24.5 76.4 200 / 58 999.0 Buoy 41540 03 / 2000 27.9 78.6 N/A / 78 1009.0

Buoy 41923 04 / 0227 24.1 71.4 N/A / 49 1013.8 Buoy 41540 04 / 1900 28.3 79.2 N/A / 49 998.3
Zim California 05 / 0000 29.0 77.6 100 / 35 1012.0 Saudi Abha 05 / 0600 26.8 76.4 140 / 37 1005.4
C6FV9 05 / 1200 24.2 81.5 260 / 43 1004.0 Galveston Bay 05 / 1200 27.3 73.8 350 / 40 1013.0
SHIP 05 / 1800 25.0 83.4 270 / 39 1004.7 Maersk New Orleans 06 / 0000 29.1 78.4 120 / 35 1009.0
KS004 06 / 0900 25.8 80.1 170 / 37 1006.9 Chevron Arizona 06 / 0900 27.5 86.1 350 / 37 999.5
Heidelberg Express 06 / 1500 28.5 79.6 130 / 39 1011.8 Sea-Land Freedom 06 / 1800 30.1 79.7 160 / 36 1010.0
Nordon 06 / 1800 31.8 79.3 120 / 35 1013.0 Nordon 07 / 0000 31.4 80.4 120 / 37 1009.3
Nanticoke 09 / 0300 42.1 81.4 050 / 38 1014.0 Canadian Progress 09 / 1200 42.7 80.1 000 / 35 N/A
3FFL8 10 / 0600 43.1 65.1 180 / 35 1018.0
Table 3: Selected surface observations for Hurricane Frances, 25 August - 8 September 2004.MinimumSea-levelPressure
Maximum Surface WindSpeed
(kt)
LocationDate/Time(UTC)
Press.(mb)
Date/Timea (UTC)
Sust.Windb
(kts)
PeakGust(kts)
StormSurgec
(ft)
StormTided
(ft)
Rain(stormtotal)(in)
BahamasN. Eleuthera 03/1400 958.6 03/1000 87
N. Norman Reef (NOAA CREWS) 03/0400 992.0 03/0100 37 53 San Salvador 02/2000 948.1 02/1900 59 104 5.47
AlabamaDothan (KDHN) 07/0359 992.8 06/1937 32 45 1.00
FloridaAlachual 4.71
Altamonte Springs 7E USGS 05/1334 50 Anclote 04/ N/A 61
Apalachicola (KAAF) 06/1823 991.5 06/0232 31 39 1.12 Apalachicolai 06/1906 991.8 05/2200 41 2.48

Astor Bombing Range (KNAE)f 05/1556 995.5 05/0535 28 39
Avalonl 5.98
Big Carlos Passf 06/0000 996.0 05/2012 40 51
Big Cypressg 05/0745 990.3 05/0802 40
Bings Landingi 05/2300 999.5 4.17 Boca Raton (KBCT) 03/2030 50 Brooksville (KBKV) 06/0147 981.4 05/1755 33 47
Buffalo Bluffi 3.49
Bunnel (KX47)f 07/0544 30 39
Cachej 05/1716 39
Canal C-38/S65CWg 05/1315 972.1 05/1315 35 58
Canal C-38/S65DWXg 05/1230 972.4 05/1115 35 65
Cape Canaveral(KCCA)f 05/1119 31 48
Cape Canaveralj 05/1715 52
CCUTi 05/2133 980.1 06/0615 44 55
Cent. Miami-Dadeg 05/0630 995.4 05/0456 59
Chekikaj 47
Citral 6.56
Clearwater Beachi 06/0000 984.1 05/1854 54 64 4.35
Clewiston/CFSWg 05/0815 981.7 05/0745 32 56
Crescent Beachi 6.62 Daytona Beach (KDAB) 05/2000 994.9 05/1000 49 65 9.96
E. Lake Okeechobee/L006g 05/0730 975.3 05/0600 54 79 5.87
E. Lake Okeechobee/LZ40g 05/0730 972.6 05/0720 80
Fernandina Beach (K55J)f 06/0855 38
Fernandina Beachi 06/0800 1002.7 06/0500 43 1.55 7.73 Ft. Lauderdale Exe. (KFXE) 04/1848 48 Ft. Lauderdale Int. (KFLL) 05/0630 990.0 03/1916 36 48 4.26
Ft. Myers (KFMY) 05/1922 992.2 05/1859 32 42 2.89 Ft. Myers (KRSW) 05/1926 992.6 06/1010 31 40 4.44
Ft. Myersi 05/1836 991.9 05/0700 37 4.01 Ft. Pierce (FCMP tower) 05/0402 70 94
Ft. Piercel 05/0300 50 3.44 Fred Howard 04/ N/A 61

Gainesville (KGNV) 06/0044 991.0 05/2200 41 56 10.81
Hastingsl 05/0815 36 8.35 Indian Harbor Beach (FCMP tower) 05/1259 981.9 05/1455 46 68
Jacksonville Cecil Field (KVQQ) 06/0034 27 39 9.17
Jacksonville Craig Exe. (KCRG)f 06/0753 998.6 05/2053 29 52 7.10
Jacksonville I-295i 3.68 Jacksonville Int. (KJAX) 06/0922 998.2 06/0017 38 54 9.13
Jacksonville Main St.i 4.50 Jacksonville NAS (KNIP) 06/0655 997.6 05/2246 42 54 6.37
Kenansvillel 6.44 Key West Intl. (KEYW) 05/0953 1002.9 05/1640 31 38 1.58 Key West NAS (KNQX) 05/0955 1002.9 05/1033 43 1.65
Key Westi 05/1000 1003.6 04/2000 43 0.3 2.22
Lake Apopkak 05/1330 43 Lake City (KLCQ) 06/1439 994.5 06/1909 29 41
Lake Tohopekaligag 05/1545 976.0 05/1345 48 71
Lake Wales Ridgej 05/1246 43
Lake Winderk 05/1245 52
Leesburg (KLEE)f 05/1859 988.5 05/1949 52 6.46
Live Oakl 8.10
Loxahatchee/LXWSg 05/0530 979.1 05/0600 49 76 Marathon (KMTH) 05/0853 1001.7 05/1928 37 1.57 Mariana (KMAI) 06/2323 990.8 06/1424 32 43 1.01
Matanzas Riveri 6.88 Mayport (KNRB) 06/0955 997.6 06/0144 45 55 5.15
Mayporti 6.35
Mayport (Bar Pilots Dock)i 06/0724 1001.7 06/0518 36 49 5.96
Mayport (Degaussing Structure)i 06/0800 1001.4 06/0900 35 51
McKay Bayi 06/1318 38 55
Melbourne (KMLB)f 05/1858 995.9 04/2358 63 7.95 Merrit Island Airport N/A 984.0 05/0935 64 78 Miami Int. (KMIA) 05/0807 995.0 05/1932 37 51 3.49
Miami WFO 04/1940 44 3.09 Naples (KAPF) 05/2007 33 47 1.06
Naplesi 05/0900 996.3 05/1200 36 47 4.30

NASA Tower 19h 05/1040 59 82
NASA Tower 22h 05/1150 55 72
NASA Tower 110h 05/1210 49 78
N. Lake Okeechobee/L001g 05/1000 969.5 05/0715 62 83 5.84
NW Browardg 05/0745 986.9 04/2040 53
NW Collierg 05/0900 994.6 05/1810 47
Oasisj 04/2134 41 Ocala (KOCF) 05/2255 987.8 05/1955 43 10.81
Ochopeej 05/0636 39
Ocklawahal 8.94
Okahumpkal 7.35 Opa Locka (KOPF) 05/0548 993.0 05/1730 37 47 3.43
Orlando Int. (KMCO)f 05/1052 989.4 05/0848 47 60 6.50 Panama City (KPFN) 06/1835 993.9 05/2241 36 53 0.49
Panama City Beachi 06/2200 995.4 07/0700 39 Pembroke Pines (KHWO) 05/0542 992.0 05/0035 35 47 5.04
Perry (K40J) 06/1615 987.1 06/1701 32 41 3.54
Piersonl 9.05
Ponce Inletk 05/2215 36
Port Manateei 4.63 Port Mayaca (USACE) 05/0645 964.7 05/0500 74
Port St. Lucie (Texas Tech tower) 05/0329 67 83 Port Salerno (FCMP tower) 05/0550 962.8 05/0240 49 71
Punta Gorda (KPGD) 05/1905 989.2 06/0538 40 50
Putnam Halll 11.64
Racy Pojnti 05/2100 55
Red Bay Pointi 3.28 St. Augustine (KSGJ) 05/2205 999.0 05/2015 41 53
St. Lucie Lock (USACE) 05/0600 962.1 05/0330 37 5.89 St. Petersburg (KPIE) 05/2216 982.4 06/0619 38 49 5.41 St. Petersburg (KSPG) 05/2147 981.4 06/0101 38 50 6.27
St. Petersburgi 05/2054 981.7 06/0612 36 47 5.02
Sanford (KSFB)f 05/1457 989.8 04/2313 44 61 4.40 Sarasota (KSRQ) 05/2132 984.4 06/0850 36 46 4.69
Seminole Cnty. Stn. 22 05/1214 988.8 05/1451 51 5.98

Seminole Cnty. Stn. 35 05/1514 989.5 05/1257 50 5.77 Skyway Bridge 05/1418 55
SW Palm Beachg 05/0630 986.9 05/0456 59 Space Coast Regional Arpt. (Texas
Tech tower) 05/1529 60 78
Summerland Key Marine Lab 05/1710 31 37 2.07 Tallahassee (KTLH) 06/1910 984.4 05/1938 41 52 2.48
Tamiami Exe. (KTMB) 05/0827 996.0 05/2141 41 49 2.33 Tampa (KTPA) 05/2225 980.0 05/1905 39 47 5.74
Tavaresl 7.37
Tenrawj 05/0723 44
Trident Pieri 05/1300 989.1 05/1224 41 57 7.08
Umatillal 8.86
Vaca Keyi 05/0900 1001.7 05/0300 36 1.0 2.22 Vero Beach (FCMP tower) 05/0435 49 71
Vero Beach (Texas Tech tower) 05/0907 59 73
Vilano Beachi 05/2300 999.5 05/2300 33 53
Virginia Keyi 05/0600 994.5 05/0836 38 49 3.01 Virginia Key AOML 05/0551 992.0 04/2031 53 2.84
W. Cent. Collierg 05/1100 996.6 05/0601 41
W. Lake Okeechobee/L005g 05/0915 980.1 05/0845 52 78 3.53 West Palm Beach (KPBI) 05/0508 972.0 05/0656 56 71 13.56
Winter Haven (KGIF)f 06/1602 977.3 06/1559 40 50
WRWXg 05/1630 976.1 05/1510 59 Georgia
Albany (KABY) 07/0042 991.8 06/1942 38 59 4.53 Alma (KAMG) 07/0002 996.9 07/0237 35 39 6.46
Atlanta Hartsfield Int. (KATL) 07/2151 998.3 07/0800 45 3.02 Bainbridge (KBGE) 06/1620 37
Brasstownj 07/1206 39
Byromvillej 07/0005 37 Brunswick (KBQK) 06/2319 1002.3 06/0221 27 38 Columbus (KCSG) 07/0751 994.4 07/0251 39 3.53
Cookj 06/1804 34 Douglas (KDQH) 06/2259 995.2 06/2259 35
Ft. Benning (KLSF) 07/0655 994.1 07/0155 39 3.90
Ft. Pulaskii 06/1148 32 39 7.97 Gainesville (KGVL) 08/0553 1000.1 07/1008 34 4.56 Gannett Lake (USFL) 06/0400 36
Helen 7Nj 11.06 Macon (KMCN) 07/0753 998.5 07/0337 44 5.66
Newnanj 07/0702 36
Plainsj 06/2003 35 6.87 St. Simon's Island (KSSI) 06/2300 1001.9 06/1807 37 47 3.45
St. Simons Islandi 2.06 8.35 Savannah (KSAV) 07/2253 1004.8 06/2219 35 2.37
Savannah Hunter USAAF (KSVN) 07/2255 1005.1 06/2155 38 4.51 Valdosta (KVLD) 06/2105 993.2 06/0127 31 45 6.43 Waycross (KAYS) 06/2320 997.3 07/0140 39
Waycrossj 06/2304 40 6.64 Waycross 9SE (USFL) 05/0204 45
NOAA Buoy/C-MANBuoy 41008 07/2250 1004.8 06/0650 33 45
Buoy 41009f 05/1320 990.8 05/1450 52 66 Buoy 41010 04/2320 1003.6 04/1350 39 52 Buoy 41012 06/0050 1002.7 06/0100 41e 54
Buoy 42036 06/0850 989.6 06/0220 42e 55 Buoy 42039 06/1950 998.1 06/0450 33 41 Buoy 45012 09/1500 1002.0 09/1000 35 43
Cedar Key, FL (CDRF1) 06/1000 987.6 06/1120 43e 59
Duck, NC (DUCN7) 08/2300 1011.9 08/1940 25e 34 Dunkirk, NY (DBLN6) 09/1000 1002.2 09/1100 36 47
Folly Beach, SC (FBIS1) 08/0700 1008.4 06/1400 33 39 Fowey Rocks, FL (FWYF1) 05/0600 996.1 04/2000 53e 66
Keaton Beach, FL (KTNF1) 06/1600 985.6 06/1740 35e 45 Lake Worth, FL (LKWF1) 05/0500 972.5 05/0700 54 73 Long Key, FL (LONF1) 05/0800 1000.7 05/0200 34 45 0.5 1.67
Molasses Reef, FL (MLRF1) 05/0800 998.4 05/0940 42e 59 St. Augustine, FL (SAUF1) 05/2200 999.0 05/2200 56 71
Sand Key, FL (SANF1) 05/1000 1002.7 05/1840 37e 55
73e

Settlement Point, GBI (SPGF1) 04/1600 963.2 04/2320 73e 96
Sombrero Key, FL (SMKF1) 05/0800 1002.6 05/1740 46e 81 2.23
Tyndall Tower, Fl (SGOF1) 06/1600 992.2 06/0450 48e 58 USF COMPS Stations
Buoy NA2 05/2210 989.5 05/1810 39 47 Aripeka (APK) 06/0212 979.2 4.64
Egmont Key (EGK) 05/1936 45 54 4.02 Homosassa (HOM) 06/0318 983.5 06/1724 47 57 4.51
New Port Richey (PAS) 06/0136 979.6 05/1712 31 44 4.90 North Florida Bay (NFB) 05/0624 999.6 05/0048 33 42 0.5 4.96
Shell Point (SHP) 06/1706 992.7 4.92f Tarpon Springs (TAS) 06/0036 980.7 05/2030 42 4.04
Skidaway Institute StationsTower R2 07/2328 1005.7 06/1028 39 47 Tower R6 07/2100 1007.6 07/1300 35 47 Tower R8 07/2132 1006.3 06/0632 33 39
Unofficial ObservationsFlorida
Alligator Pointm 06/1719 984.6 05/1920 48
Arlingtonm 06/0730 1000.6 06/0625 36 Boca Raton 03/2030 50
Boca Raton Wtr Treatment 03/2054 61 Boynton Beach N/A 977.3 04/1420 61 Boynton Beach 04/1723 66 Boynton Beach 9.56
Clearwaterm 06/1445 34 56
Clermontm 05/1835 984.0 05/1600 56 Delray 04/1835 52
Deerfield Beach 8.00
Dunedinm 05/2315 982.3 05/1515 42 Flagler Beach FD 05/2300 994.9 04/1730 63
Golden Beach 04/1743 50
Holderm 06/0030 987.7 06/0700 39
Jacksonvillem 06/0700 1000.2 06/0512 40
Juno Beachm 05/0345 963.7 05/0830 55 Jupiter PD 04/1655 70 78
Jupiter Inlet 04/1300 79 Kendall 04/1900 57 Kendall 04/1940 64
Largom 05/2100 981.9 05/1700 36 Lawtey 13.50
MacClenny 06/0840 998.0 06/0010 41 10.25 Martin County 05/1145 92
Melbourne 7.04
Miamim 05/0617 995.1 05/0729 50
New Port Richeym 06/0045 980.2 05/1630 43
Odessam 06/0000 979.6 05/1830 37
Orlando Azalea Parkm 05/1537 988.0 05/1305 50
Orlando Pine Hillsm 05/1815 987.7 46 Ormond Beach PD 05/1620 50
Oviedo 9.00 Port Orange 15.08
Riviera Beach 04/0510 66
St. James Citym 05/1847 993.5 05/1350 37
St. Petersburg Beachm 05/2115 981.6 06/1110 50
Sebastienm 05/1228 974.5 05/1128 71 Sewall's Point 05/0345 962.0 05/0226 63 85
S. Hutchinson Island 05/0525 959.0 S. Lakeland 05/2100 972.3 05/1800 63 12.01
Starkem 06/0600 996.8 06/1600 35
Tampa Bay Crestm 06/1230 50
Tampa University Villagem 05/2242 977.2 05/1527 37 57 Taylor 10.00
The Villagesm 06/0000 987.7 05/1600 37
Valricom 05/2030 974.5 05/1210 49 West Pasco 06/0400 990.6
GeorgiaHarris 07/0245 41
aDate/time is for sustained wind when both sustained and gust are listed.bExcept as noted, sustained wind averaging periods for C-MAN and land-based ASOS reports are 2 min;buoy averaging periods are 8 min.cStorm surge is water height above normal astronomical tide level.

dStorm tide is water height above National Geodetic Vertical Datum (1929 mean sea level).e 10-min average wind.fIncomplete record.g South Florida Water Management station - 15-min average sustained wind.hNASA towers are at the Kennedy Space Center and Cape Canaveral Air Force Station; elevation 54 ft; alltower records are incomplete.iNational Ocean Service station - sustained wind averaging periods are 6 min.jRAWS station.kSt. John's River Water Management District station.lFAWN station.mData from Weather Underground web site.
Table 4: Supplemental storm-total rainfall observations for Hurricane Frances, 25 August - 8 September2004.
Station Storm-total Rainfall (in)Florida
Alapaha Tower (ALAF1) 4.79Andytown 2N 4.13
Antioch (BKRF1) 7.34Apollo Beach 1SE (APBF1) 6.34
Archbold (ACHF1) 3.21Archbold 3S (HCAF1) 4.15
Avon Park 2E (APKF1) 6.37Avon Park 2W (AVPF1) 6.57
Balm (BLMF1) 7.01Bartow (BARF1) 5.98
Bartow 3N (LKAF1) 5.83Baxter (BAXF1) 7.00
Bell 4WNW (BLLF1) 7.96Benton 8.85
Big Pine Key 3.28Bowling Green 1S (PAYF1) 6.21
Bradenton 1S (WCRF1) 4.10Bradenton 3SW (PSDF1) 3.89
Bradenton 11ENE (RYEF1) 4.87Brandon 2E (BRDF1) 5.99Brooksville (HLKF1) 10.82Buckingham (OLGF1) 3.77
Bushnell (BSWF1) 7.70

Carrollwood 1N (BALF1) 7.32Carrollwood 1SW (WITF1) 6.43
Chassahowitzka 1E (CHSF1) 15.81Chiefland 5SE (CHIF1) 7.29
Clearwater (ALLF1) 4.75Cooper City 4.22
Coral Springs (CSSF1) 11.67Coral Springs 11W 4.03
Crescent City (CREF1) 4.43Cross City (KCTY) 4.89
Dade City 2E (DCYF1) 7.54Deland 11.26
Devils Garden 5.55Dowling Park (DOWF1) 6.23Dundee 1W (LKHF1) 6.58
Dunedin (CCKF1) 6.50Dunedin 1SE (CRCF1) 5.31Dunnellon 3N (RASF1) 10.60
Dunnellon 5 ESE (DLLF1) 11.30Durant 1E (LKMF1) 7.71Edgeville (EDGF1) 4.71
Ellenton 2NE (GHMF1) 4.88Ellenton 3SE (CYSF1) 6.16Ellenton 9E (GCRF1) 5.69
Federal Point (HASF1) 8.73Melbourne WFO 8.11
Miami Beach 3.74Middleburg (MDDF1) 8.70
Myakka City (MKAF1) 4.80Myakka Head 4NE (HORF1) 6.10Myakka Head 8W (MKHF1) 3.95
Nocatee 5W (HCKF1) 3.39North Miami Beach 3.71
North Port 2N (NPOF1) 3.34North Port 11NE (MRDF1) 3.37
Ocala (OCAF1) 11.05Odessa 3SSW (ISFF1) 6.85
Odessa 4S (CLKF1) 6.21

Oldsmar 2W (TBFF1) 5.63Oldsmar 3NE (OLDF1) 3.97
Ona (ONAF1) 5.53Oneco (ONEF1) 4.22
Oneco 2SE (PDRF1) 4.34Orlando East 7.91
Orange Springs 2SSW (OSPF1) 13.63Osprey 1E (OPRF1) 3.05
Palatka (PTKF1) 11.42Palm Bay 7.27
Palm Harbor 3NE (TRSF1) 7.57Palmetto 4NE (RUBF1) 4.90Penny Farms (PNYF1) 8.73Pinellas Park (SJOF1) 4.88Pinellas Park (PNBF1) 4.31
Pinellas Park2SE (SAWF1) 4.43Plant City (PLCF1) 4.00
Plant City 2S (PCTF1) 7.21Plymouth 7.95
Polk City (PLKF1) 6.57Port Salerno 8.68
Ridge Manor 2SE (WTRF1) 8.11Ruskin WFO (KTBW) 5.53Safety Harbor (SHBF1) 4.80
St. Augustine Lighthouse (STAF1) 5.20St. Leo (STLF1) 3.22
San Antonio 3S (SNTF1) 8.14Sanford 7.54
Sarasota 5E (SRAF1) 3.62Seffner 2E (BKCF1) 8.15
Starke (SRKF1) 9.97Suwannee 6NE (SWNF1) 15.44
Tampa 2E (TBEF1) 8.44Tampa 4NE (HRIF1) 8.07
Tampa By. Can. S-155 (TBCF1) 7.92Tampa By. Can. S-159 (TBAF1) 7.17Tampa By. Can. S-160 (TBBF1) 6.39
Homerville (GAEMN) 6.19

Homerville 5N (HMVG1) 7.40Jesup 8S (JSUG1) 9.80
Lakeland (LAKG1) 5.79Leary 5ENE (LERG1) 6.93Lumber City (LBRG1) 8.68
Madray Springs 2WNW (MRYG1) 10.78McIntyre 6SW (MCIG1) 7.65
Metter 1SE (MTFG1) 11.91Moody AFB (KVAD) 8.30
Mountain City 2N (MTCG1) 8.10Mountain City 2SW (MCTG1) 9.34
Nahunta (GAEMN) 9.22Nahunta 6NE (NAHG1) 10.64
Naseville (NSHG1) 6.55Offerman (OFFG1) 9.34
Okefenokee 9SW (SWCG1) 7.71Patterson (PATG1) 11.94
Peachtree City (KFFC) 3.77Pridgen (PRDG1) 5.58
Redisville (REDG1) 9.80Statenville (STNG1) 6.68
Sterling 3SW (STRG1) 7.25TallulaFalls (TLUG1) 11.28
Tallulah Falls 1NE (TFLG1) 10.03Tugalo Dam (TUGG1) 11.08
Warner Robbins AFB (KWRB) 6.45Waycross 4NE (AYSG1) 6.86
Willacoochee 5ENE (WILG1) 6.80Woodbine (WBNG1) 7.83Yonah Dam (YNHG1) 9.93
AlabamaBleecker (BLEA1) 3.20
South CarolinaAnderson (KAND) 6.20
Caesars Head (CAES1) 12.14Calhoun Falls (CALS1) 7.78
Calhoun Falls 5S (RBRS1) 6.99Chesnee 7 WSW (CNES1) 6.58
Clemson (KCEU) 6.34Clemson University (CLES1) 7.00
Columbia (KCAE) 3.69Columbia Downtown (KCUB) 3.46
Gaffney 6E (GAFS1) 6.61Greenville-Spartanburg Arpt (KGSP) 5.42
Greenwood (KGRD) 4.61Hartsville (HVLS1) 6.33Jackson 1S (RAWS) 7.50
Jocassee (JCSS1) 8.08Lake Toxaway (LTYN7) 10.87Linville Falls (JSRN7) 18.07
Mackall USAAF (KHFF) 4.23Maxton (KMEB) 5.44Monroe (KEQY) 5.49
Morganton (MRGN7) 7.35Morganton (MGTN7) 11.32Mt.Pisgah (MTPN7) 11.40Nebo 7NE (NCVN7) 11.04New Bern (KEWN) 5.10Old Fort (OLFN7) 9.62
Pisgah Forest (PISN7) 7.51Pleasant Gardens (PLGN7) 8.67
Plumtree (PLMN7) 8.52Rich Mtn. (RCMN7) 12.50
Roaring Creek (RCAN7) 9.68Rosman (RMNN7) 9.62
Rosman 6E (CFFN7) 12.98Rutherfordton 3N (RUTN7) 7.36
Sunburst (SNBN7) 9.86Triplett (TPHN7) 8.07Triplett (TPTN7) 8.68Tyron (TRYN7) 10.29
Walker Top (WKTN7) 13.64Wilbar (WLBN7) 7.16
Wilmington (KILM) 3.12Winston-Salem (KINT) 3.82
Wisemans View (WISN7) 10.78

Yancy (YNCN7) 7.41Tennessee
Leconte (MTLT1) 3.46
KentuckyHarlan (LYLK2) 4.49Jackson (KJKL) 4.26
VirginiaApple Orchard Mtn. (APEV2) 10.24
Big Meadows (BGMV2) 11.50Buena Vista (BUVV2) 5.61
Charlottesville (KCHO) 3.03Copper Hill (COHV2) 8.12Free Union (FRUV2) 10.00
Galax Water Plant (GAAV2) 5.83Glasgow 1SE (GLAV2) 7.13
Goshen (GOHV2) 10.13Hot Springs (HSPV2) 5.32Lexington (NOHV2) 6.14
Mason Cove (MASV2) 7.05Mathews Arm (MATV2) 10.00
Table 5: Preliminary forecast evaluation (heterogeneous sample) for Hurricane Frances, 25 August - 8September 2004. Forecast errors (n mi) are followed by the number of forecasts in parentheses. Errorssmaller than the NHC official forecast (OFCL) are shown in bold-face type. Verification includes the
depression stage, but does not include the extratropical stage, if any.Forecast
TechniquePeriod (hours)
12 24 36 48 72 96 120CLP5 27 (53) 58 (53) 96 (53) 144 (52) 266 (48) 402 (44) 535 (40) GFDI 19 (53) 34 (53) 50 (53) 68 (52) 108 (48) 156 (44) 222 (40)
GFDL* 22 (51) 33 (51) 44 (51) 61 (51) 101 (48) 145 (44) 200 (40) GFNI 27 (51) 49 (51) 74 (51) 94 (50) 140 (46) 204 (42) 290 (38)
GFDN* 33 (51) 52 (50) 74 (50) 97 (49) 129 (45) 186 (41) 263 (37) AF1I 28 (48) 51 (48) 75 (48) 102 (47) 165 (43)
AFW1* 43 (25) 72 (25) 89 (25) 106 (24) 153 (22) COAI 30 (32) 64 (32) 102 (32) 141 (30) 222 (27)
COAL* 30 (17) 53 (17) 92 (17) 119 (15) 193 (14) COEI 34 (26) 74 (26) 119 (26) 165 (25)
COCE* 30 (14) 62 (14) 101 (13) 145 (13)
LBAR 19 (53) 34 (53) 45 (53) 58 (52) 88 (48) 114 (44) 134 (40) A98E 28 (53) 49 (53) 76 (53) 123 (52) 261 (48) 382 (44) 475 (40) A9UK 28 (26) 50 (26) 80 (26) 108 (25) 233 (23) BAMD 21 (53) 35 (53) 49 (53) 61 (52) 81 (48) 113 (44) 161 (40) BAMM 24 (53) 43 (53) 64 (53) 81 (52) 104 (48) 126 (44) 159 (40) BAMS 29 (52) 52 (52) 72 (52) 94 (52) 119 (48) 139 (44) 152 (40) NGPI 29 (52) 52 (51) 74 (51) 94 (50) 132 (46) 191 (42) 272 (37)
NGPS* 29 (53) 52 (53) 76 (53) 92 (50) 122 (47) 169 (41) 253 (38) UKMI 28 (52) 53 (52) 77 (52) 92 (51) 120 (47) 160 (43) 221 (39) UKM* 33 (27) 49 (27) 77 (27) 97 (26) 128 (24) 161 (22) 211 (20) GFSI 21 (52) 34 (52) 48 (52) 62 (51) 91 (47) 118 (43) 155 (39)
GFSO* 22 (54) 34 (54) 49 (54) 62 (52) 89 (48) 117 (44) 146 (40) AEMI 24 (52) 38 (52) 49 (52) 62 (51) 87 (47) 114 (43) 149 (39)
AEMN* 30 (52) 42 (52) 55 (52) 66 (50) 87 (46) 110 (42) 132 (38) GUNS 20 (51) 37 (51) 54 (51) 69 (50) 90 (46) 125 (42) 184 (37) GUNA 18 (51) 33 (51) 45 (51) 56 (50) 72 (46) 101 (42) 150 (37) CONU 20 (53) 35 (52) 50 (52) 63 (51) 85 (47) 120 (43) 172 (39) FSSE* 17 (49) 30 (49) 40 (49) 53 (49) 64 (45) 75 (38) 127 (35)OFCI 22 (53) 40 (53) 53 (53) 64 (52) 80 (48) 103 (44) 144 (40) OFCL 20 (53) 36 (53) 52 (53) 66 (52) 80 (48) 100 (44) 128 (40)
NHC Official(1994-2003
mean)44 (3172) 78 (2894) 112 (2636) 146 (2368) 217 (1929) 248 (421) 319 (341)
* Output from these models was unavailable at forecast time.
Table 6: Watch and warning summary for Hurricane Frances, 25 August - 8 September 2004.Date/Time Action Location29 / 2100 Tropical Storm Watch issued Anguilla, Antigua, Barbuda, St. Maarten
30 / 0300 Tropical Storm Warningissued
Anguilla, Antigua, Barbuda, Nevis, Saba, St. Kitts, St. Eustatius,St. Maarten
30 / 0300 Hurricane Watch issued British Virgin Islands, northern U. S. Virgin Islands, Culebra,Vieques
30 / 1500 Tropical Storm Watch issued Puerto Rico, St. Barthelemy, St. Martin
30 / 1500 Hurricane Watch changed toTropical Storm Watch Vieques
30 / 2100 Tropical Storm Warningissued
Puerto Rico, Culebra, Vieques, British Virgin Islands, northernU. S. Virgin Islands
30 / 2100 Tropical Storm Watch issued St Croix Hurricane Watch

30 / 2100 Hurricane Watchdiscontinued All
31 / 0300 Tropical Storm Watch issued Northern coast of the Dominican Republic from ManzanilloBayto Cabo Engano
31 / 0300 Tropical Storm Warningissued Guadeloupe
31 / 0900 Tropical Storm Warningdiscontinued Antigua, Barbuda, Nevis, St. Kitts
31 / 0900 Hurricane Watch issued Southeastern Bahamas,Turks and Caicos Islands 31 / 1500 Hurricane Warning issued Southeastern Bahamas, Turks and Caicos Islands
31 / 1500 Tropical Storm Warningissued
Northern coast of the Dominican Republic Punta Gorda toManzanillo Bay
31 / 1500 Hurricane Watch issued Central Bahamas
31 / 1500 Tropical Storm Warningdiscontinued
Anguilla, Antigua, Barbuda, Guadeloupe, Nevis, Saba, St.Eustatius, St. Maarten
31 / 1500 Tropical Storm Watchdiscontinued
St. Barthelemy, St. Croix, St. Martin, and Dominican Republiccoast south of Punta Gorda
31 / 2100 Tropical Storm Warningdiscontinued Puerto Rico, Culebra, Vieques, U. S. and British Virgin islands
1 / 1500 Hurricane Warning issued Central Bahamas 1 / 1500 Hurricane Watch issued Northwestern Bahamas
1 / 2100 Tropical Storm Warningdiscontinued Dominican Republic
2 / 0000 Hurricane Warning issued Northwestern Bahamas
2 / 0300 Hurricane Watch issued Florida east coast from Florida City to Flagler Beach includingLake Okeechobee
2 / 0300 Tropical Storm Watch issued Florida Keys from Florida City to Seven Mile Bridge includingFlorida Bay
2 / 0900 Hurricane Watch extendedsouthward Florida Keys from Florida City to Craig Key
2 / 1500 Hurricane Warning issued Florida east coast from Florida City to Flagler Beach includingLake Okeechobee
2 / 1500Hurricane Watch andTropical Storm Warningissued
Florida Keys from Florida City to Seven Mile Bridge includingFlorida Bay
2 / 1500 Hurricane Warningdiscontinued Turks and Caicos Islands
3 / 0300 Hurricane Warningdiscontinued Southeastern Bahamas
3 / 1500 Hurricane Watch extendednorthward Floridacoast from Flagler Beach to Fernandina Beach
3 / 2100 Tropical Storm Warningissued Floridacoast from Flagler Beach to Fernandina Beach

3 / 2100 Hurricane Warningdiscontinued Central Bahamas
4 / 0300 Tropical Storm Warningissued Florida southwest coast from Bonita Beach to Florida City
4 / 0300 Tropical Storm Watch issued Florida west coast from Bonita Beach to Suwannee River
4 / 0900 Tropical Storm Warningextended northward Florida west coast from Bonita Beach to Englewood
4 / 1500 Tropical Storm Warningextended northward
Florida and Georgia coasts from Fernandina Beach to AltamahaSound
4 / 1500 Tropical Storm Warningextended northward Florida west coast from Englewood to Anna Maria Island
4 / 1500 Tropical Storm Watchextended northward Florida west coast from Suwannee River to St Marks
4 / 2100 Tropical Storm Warningextended northward Florida west coast from Anna Maria Island to St. Marks
4 / 2100 Tropical Storm Watchextended westward Florida Gulf coast from St. Marks to Panama City
4 / 2100 Hurricane Warningdiscontinued
Northwestern Bahamas except Grand Bahama, Abaco, Bimini,and the Berry Islands
5 / 0900 Hurricane Warning changedto Tropical Storm Warning Florida southeast coast from Deerfield Beach to Florida City
5 / 0900 Tropical Storm Warningissued
Florida Keys south of Seven Mile Bridge including the DryTortugas
5 / 1500 Hurricane Warning issued Florida Gulf coast from Suwannee River to Destin
5 / 1500 Hurricane Watchdiscontinued Florida east coast from Flagler Beach to Fernandina Beach
5 / 1500 All warnings discontinued Northwestern Bahamas
5 / 2100 Hurricane Warning extendedsouthward Florida west coast from Suwannee River to Anna Maria Island
5 / 2100 Hurricane warning changedto tropical storm warning
Florida east coast from Jupiter Inlet to Flagler Beach includingLake Okeechobee
5 / 2100 All warnings discontinued Florida east coast from Florida City to Jupiter Inlet
6 / 0600 Tropical Storm Warningdiscontinued
Florida west coast from Bonita Beach to Florida City includingthe Florida Keys, the Dry Tortugas, and Lake Okeechobee
6 / 0900 All warnings discontinued Florida west coast south of Englewood and Florida east coastsouth of CocoaBeach
6 / 1500 Hurricane Warning changedto Tropical Storm Warning
Florida Gulf coast from Indian Pass to Destin and Florida westcoast from Anna Maria Island to SuwanneeRiver
6 / 1500 All warnings discontinued Georgia coast, Florida east coast, and Florida west coast south ofAnna Maria Island
6 / 2100 Hurricane Warning changedto Tropical Storm Warning Florida Gulf coast from Suwannee River to St Marks
6 / 2100 All warnings discontinued Florida coast west of St. Marks and south of Suwannee River

7 / 0300 All warnings discontinued Florida coast
Top Related