


Languages
Pages
Legal

Trends in Higher Education Series For detailed data, visit: trends.collegeboard.org
The Starting Point
• Published prices have been rising rapidly.
• Increases in federal grant aid and tax benefits have cushioned price increases — but led to concerns about federal spending.
• Concerns about student debt are mounting.
• Is anything changing?
Trends in Higher Education Series For detailed data, visit: trends.collegeboard.org
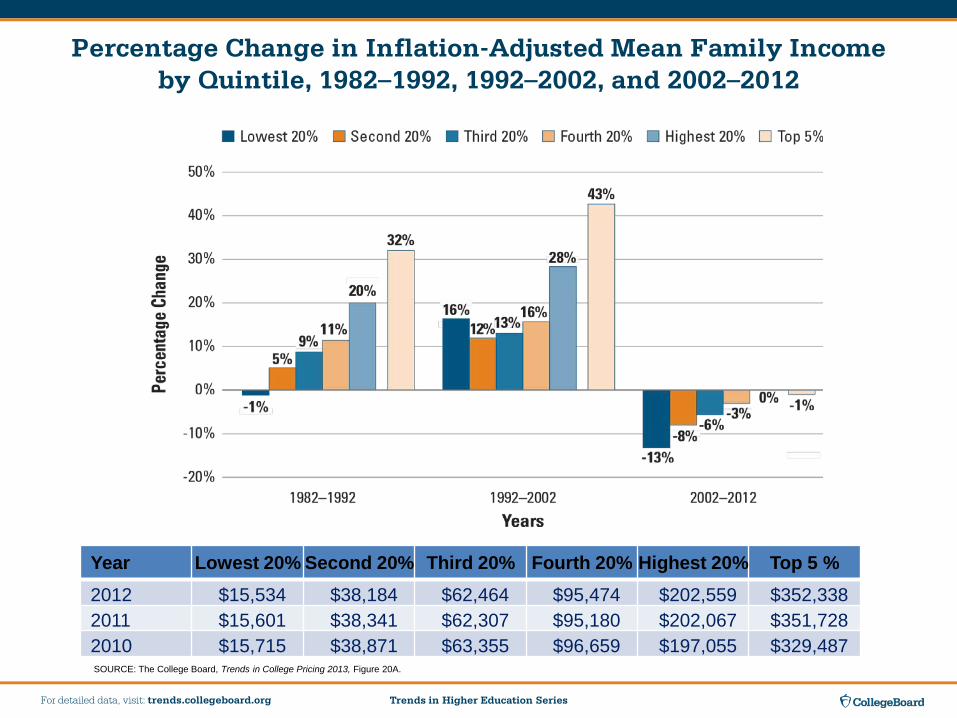
Percentage Change in Inflation-Adjusted Mean Family Income by Quintile, 1982–1992, 1992–2002, and 2002–2012
SOURCE: The College Board, Trends in College Pricing 2013, Figure 20A.
Year Lowest 20% Second 20% Third 20% Fourth 20% Highest 20% Top 5 %2012 $15,534 $38,184 $62,464 $95,474 $202,559 $352,3382011 $15,601 $38,341 $62,307 $95,180 $202,067 $351,7282010 $15,715 $38,871 $63,355 $96,659 $197,055 $329,487
Trends in Higher Education Series For detailed data, visit: trends.collegeboard.org
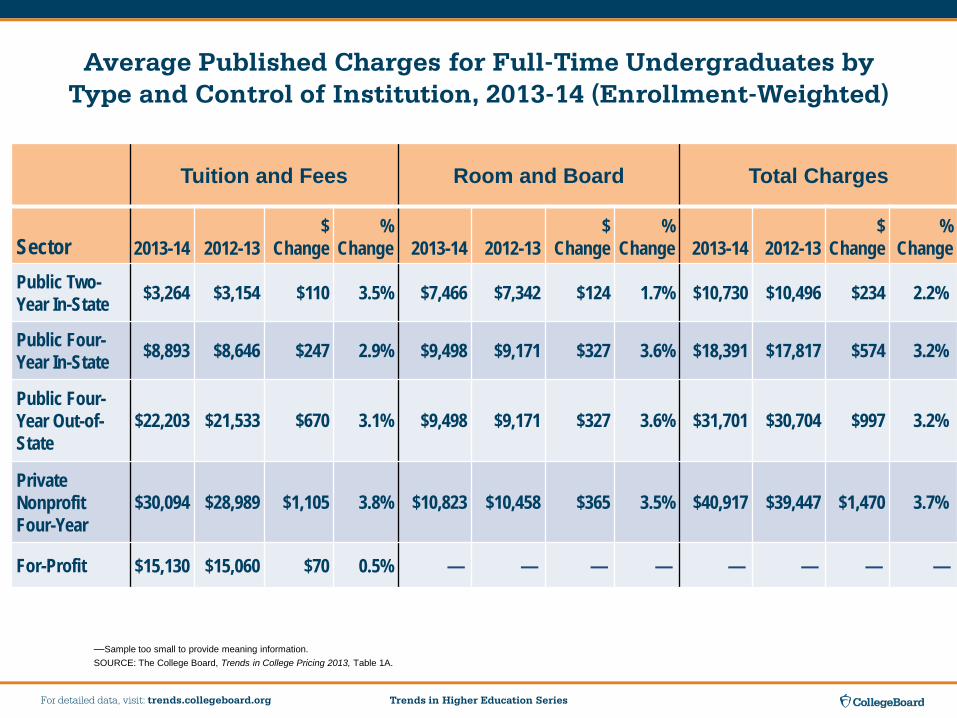
Average Published Charges for Full-Time Undergraduates by Type and Control of Institution, 2013-14 (Enrollment-Weighted)
—Sample too small to provide meaning information. SOURCE: The College Board, Trends in College Pricing 2013, Table 1A.
Tuition and Fees Room and Board Total Charges
Sector 2013-14 2012-13$
Change%
Change 2013-14 2012-13$
Change%
Change 2013-14 2012-13$
Change%
Change
Public Two-Year In-State $3,264 $3,154 $110 3.5% $7,466 $7,342 $124 1.7% $10,730 $10,496 $234 2.2%
Public Four-Year In-State $8,893 $8,646 $247 2.9% $9,498 $9,171 $327 3.6% $18,391 $17,817 $574 3.2%
Public Four-Year Out-of-State
$22,203 $21,533 $670 3.1% $9,498 $9,171 $327 3.6% $31,701 $30,704 $997 3.2%
Private Nonprofit Four-Year
$30,094 $28,989 $1,105 3.8% $10,823 $10,458 $365 3.5% $40,917 $39,447 $1,470 3.7%
For-Profit $15,130 $15,060 $70 0.5% — — — — — — — —

Trends in Higher Education Series For detailed data, visit: trends.collegeboard.org
Average Annual Percentage Increases in Inflation-Adjusted Published Prices by Decade, 1983-84 to 2013-14
SOURCE: The College Board, Trends in College Pricing 2013, Figure 4.
Trends in Higher Education Series For detailed data, visit: trends.collegeboard.org
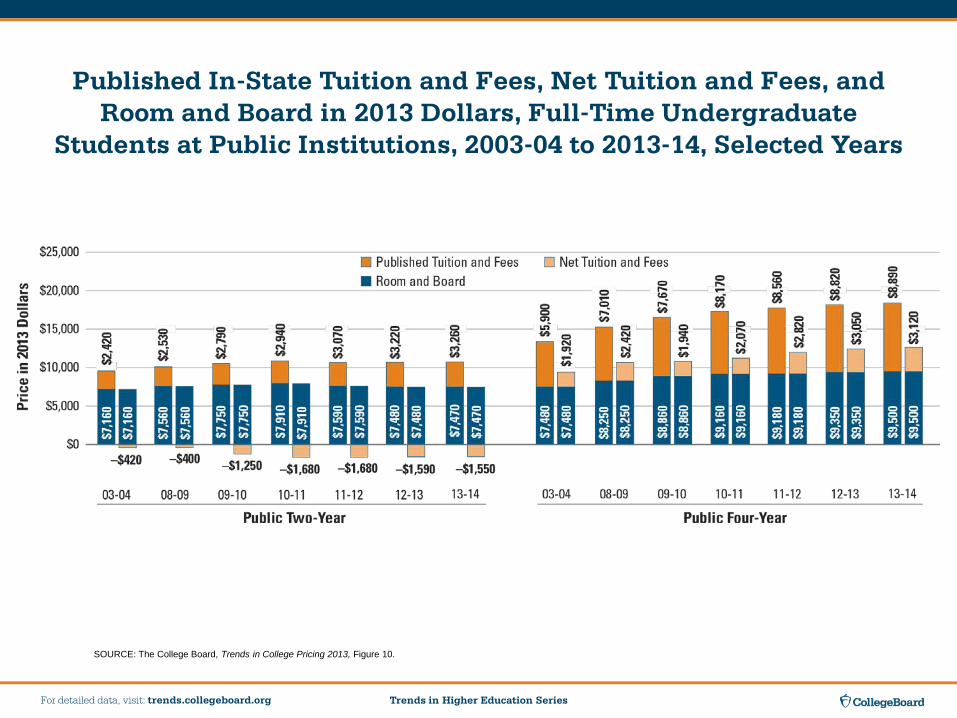
Published In-State Tuition and Fees, Net Tuition and Fees, and Room and Board in 2013 Dollars, Full-Time Undergraduate
Students at Public Institutions, 2003-04 to 2013-14, Selected Years
SOURCE: The College Board, Trends in College Pricing 2013, Figure 10.
Trends in Higher Education Series For detailed data, visit: trends.collegeboard.org
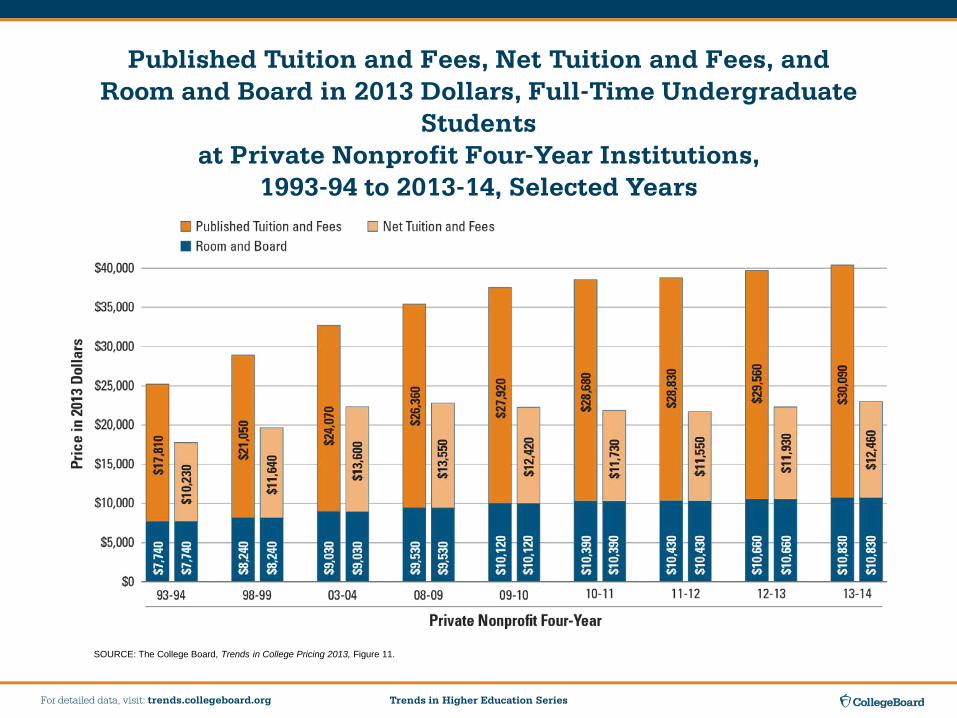
Published Tuition and Fees, Net Tuition and Fees, and Room and Board in 2013 Dollars, Full-Time Undergraduate
Students at Private Nonprofit Four-Year Institutions,
1993-94 to 2013-14, Selected Years
SOURCE: The College Board, Trends in College Pricing 2013, Figure 11.
Trends in Higher Education Series For detailed data, visit: trends.collegeboard.org
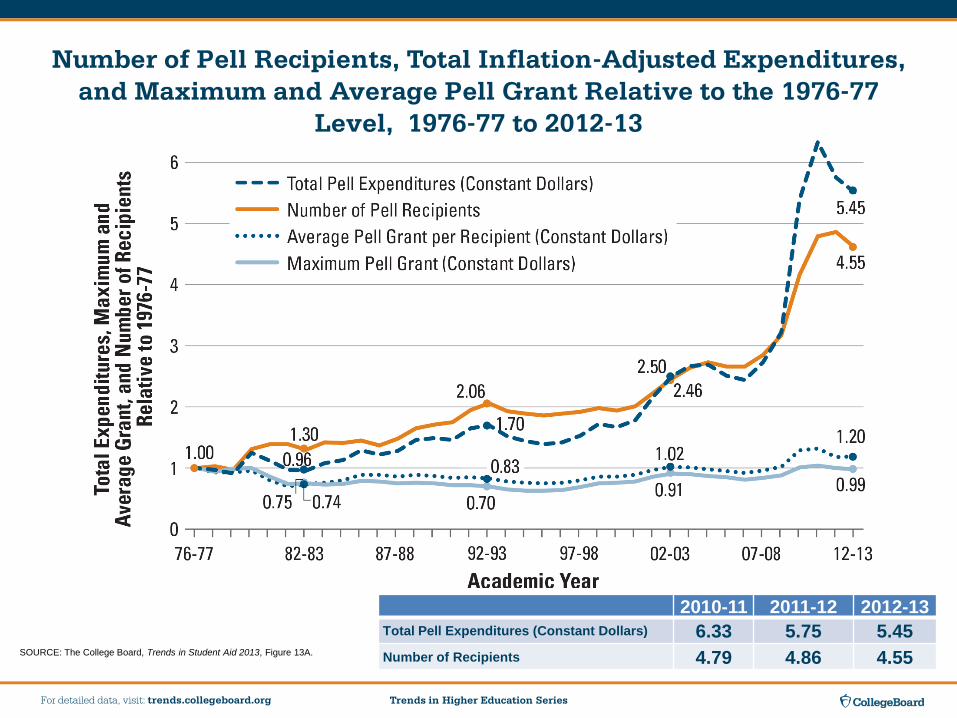
Number of Pell Recipients, Total Inflation-Adjusted Expenditures, and Maximum and Average Pell Grant Relative to the 1976-77
Level, 1976-77 to 2012-13
SOURCE: The College Board, Trends in Student Aid 2013, Figure 13A.
2010-11 2011-12 2012-13Total Pell Expenditures (Constant Dollars) 6.33 5.75 5.45Number of Recipients 4.79 4.86 4.55
Trends in Higher Education Series For detailed data, visit: trends.collegeboard.org
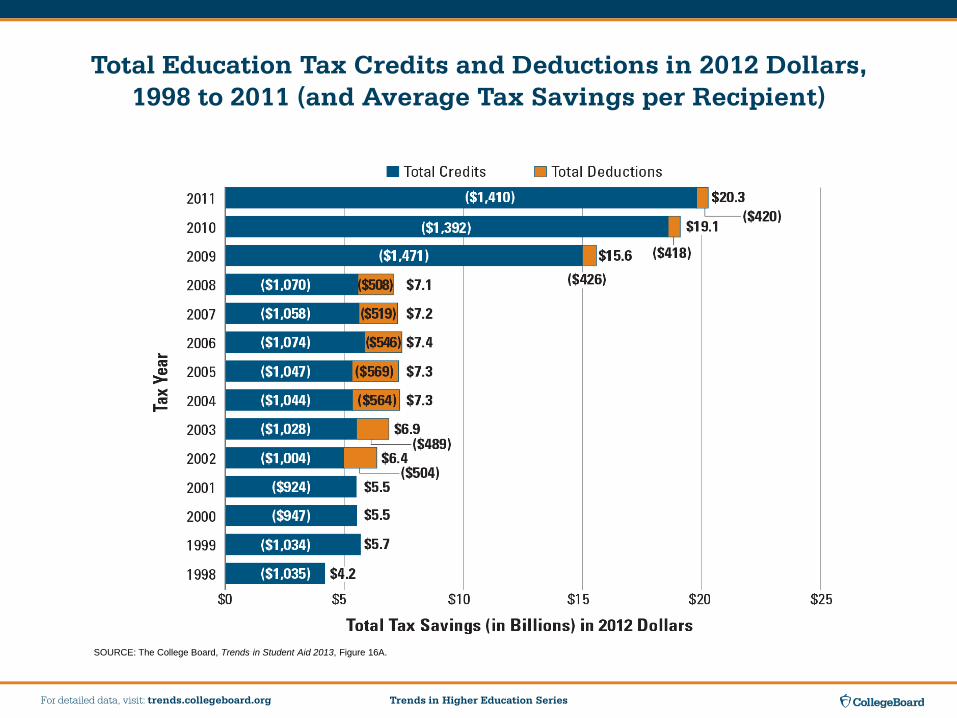
Total Education Tax Credits and Deductions in 2012 Dollars, 1998 to 2011 (and Average Tax Savings per Recipient)
SOURCE: The College Board, Trends in Student Aid 2013, Figure 16A.
Trends in Higher Education Series For detailed data, visit: trends.collegeboard.org
Averages hide the realities for many students.
Trends in Higher Education Series For detailed data, visit: trends.collegeboard.org
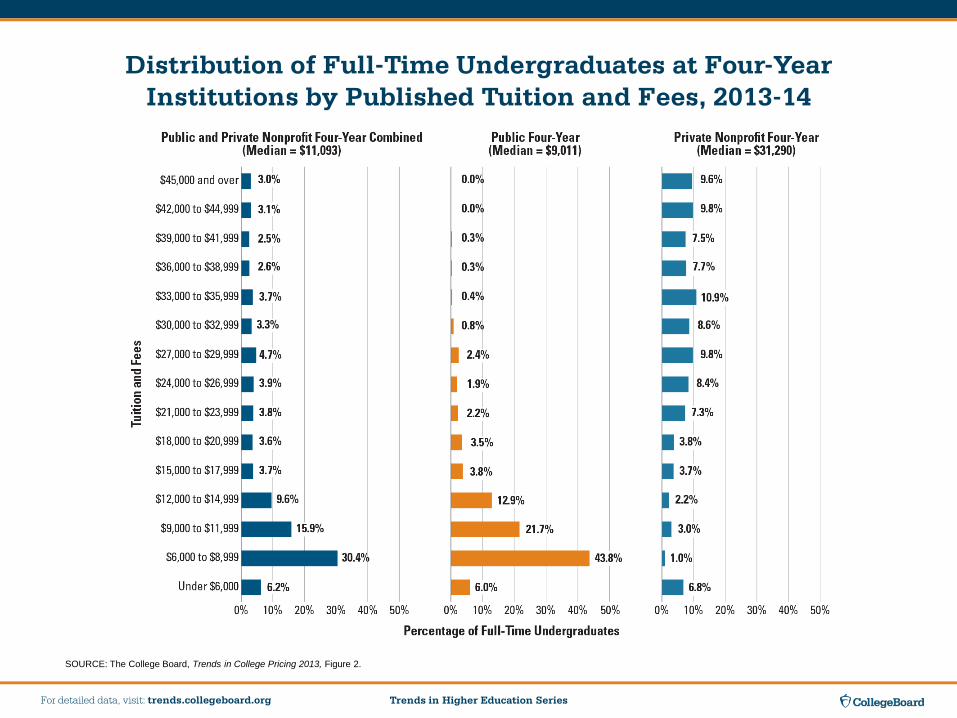
Distribution of Full-Time Undergraduates at Four-Year Institutions by Published Tuition and Fees, 2013-14
SOURCE: The College Board, Trends in College Pricing 2013, Figure 2.
Trends in Higher Education Series For detailed data, visit: trends.collegeboard.org
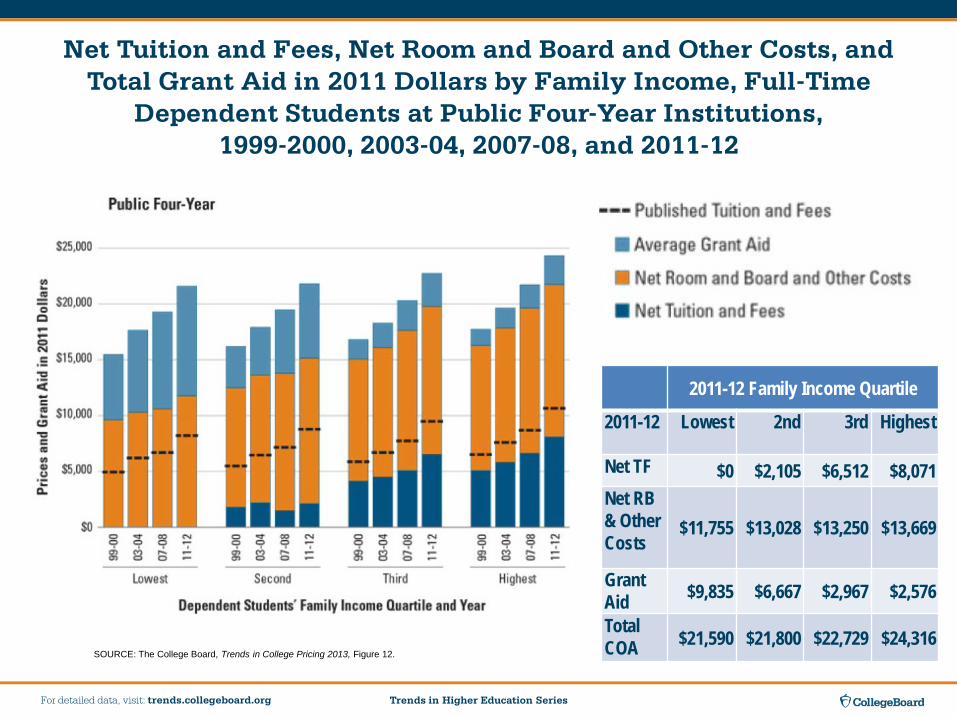
Net Tuition and Fees, Net Room and Board and Other Costs, and Total Grant Aid in 2011 Dollars by Family Income, Full-Time
Dependent Students at Public Four-Year Institutions, 1999-2000, 2003-04, 2007-08, and 2011-12
SOURCE: The College Board, Trends in College Pricing 2013, Figure 12.
2011-12 Family Income Quartile
2011-12 Lowest 2nd 3rd Highest
Net TF $0 $2,105 $6,512 $8,071Net RB& Other Costs
$11,755 $13,028 $13,250 $13,669
GrantAid $9,835 $6,667 $2,967 $2,576
TotalCOA $21,590 $21,800 $22,729 $24,316
Trends in Higher Education Series For detailed data, visit: trends.collegeboard.org
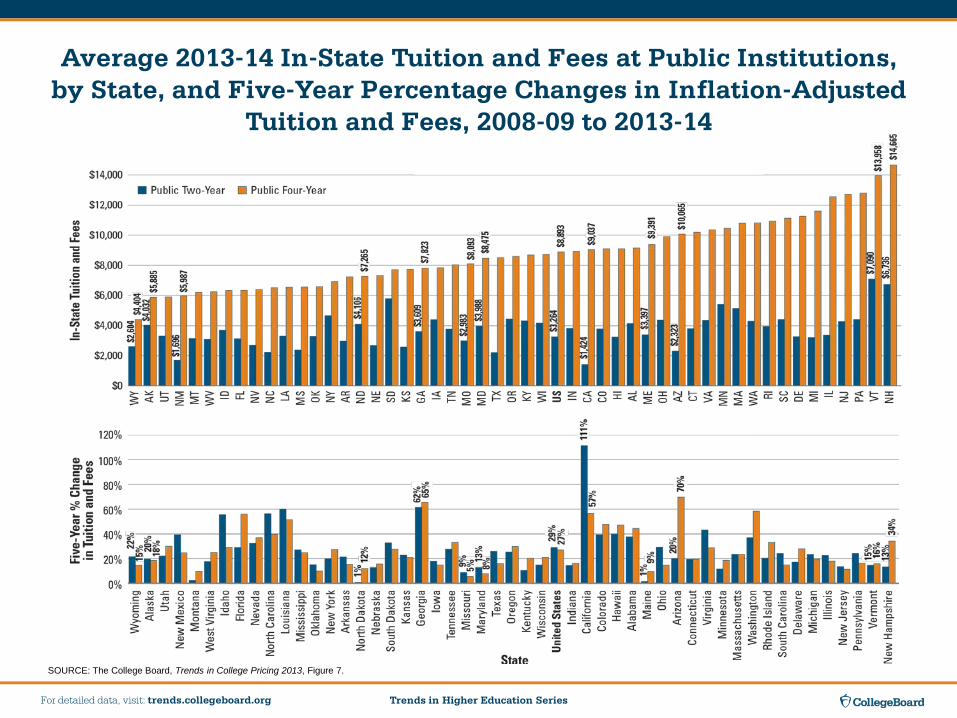
Average 2013-14 In-State Tuition and Fees at Public Institutions, by State, and Five-Year Percentage Changes in Inflation-Adjusted
Tuition and Fees, 2008-09 to 2013-14
SOURCE: The College Board, Trends in College Pricing 2013, Figure 7.
Trends in Higher Education Series For detailed data, visit: trends.collegeboard.org
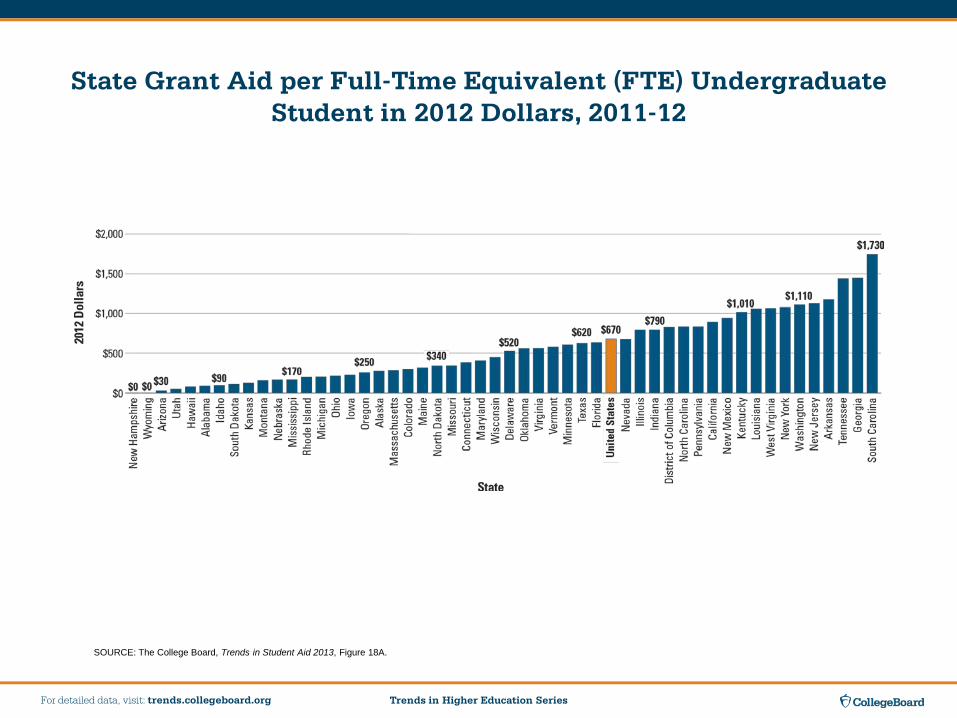
State Grant Aid per Full-Time Equivalent (FTE) Undergraduate Student in 2012 Dollars, 2011-12
SOURCE: The College Board, Trends in Student Aid 2013, Figure 18A.
Trends in Higher Education Series For detailed data, visit: trends.collegeboard.org
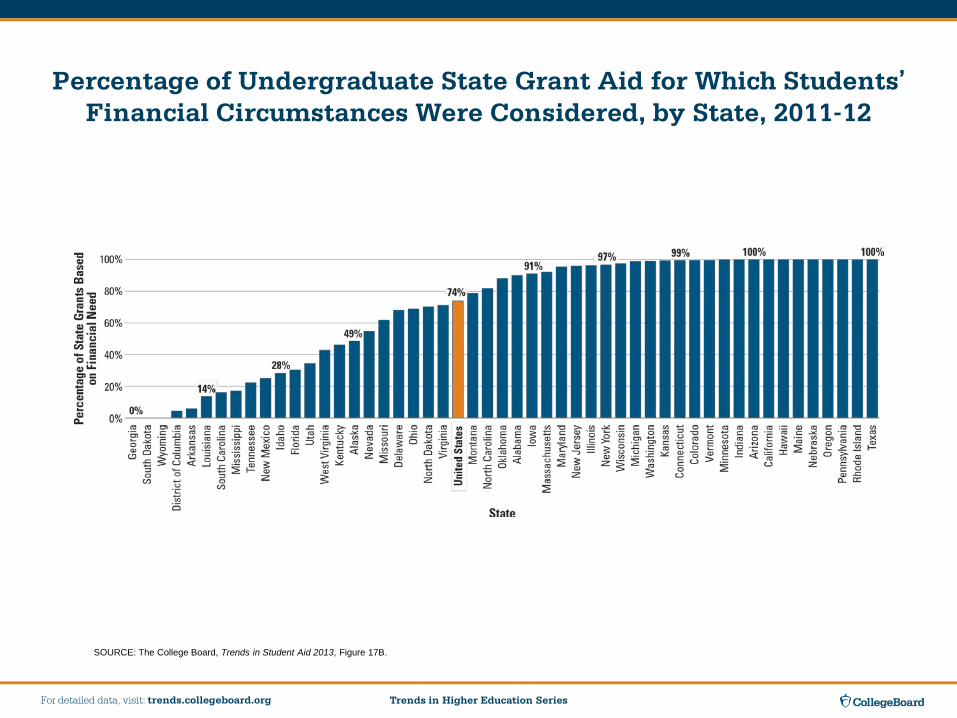
Percentage of Undergraduate State Grant Aid for Which Students’Financial Circumstances Were Considered, by State, 2011-12
SOURCE: The College Board, Trends in Student Aid 2013, Figure 17B.
Trends in Higher Education Series For detailed data, visit: trends.collegeboard.org
State Funding
Trends in Higher Education Series For detailed data, visit: trends.collegeboard.org
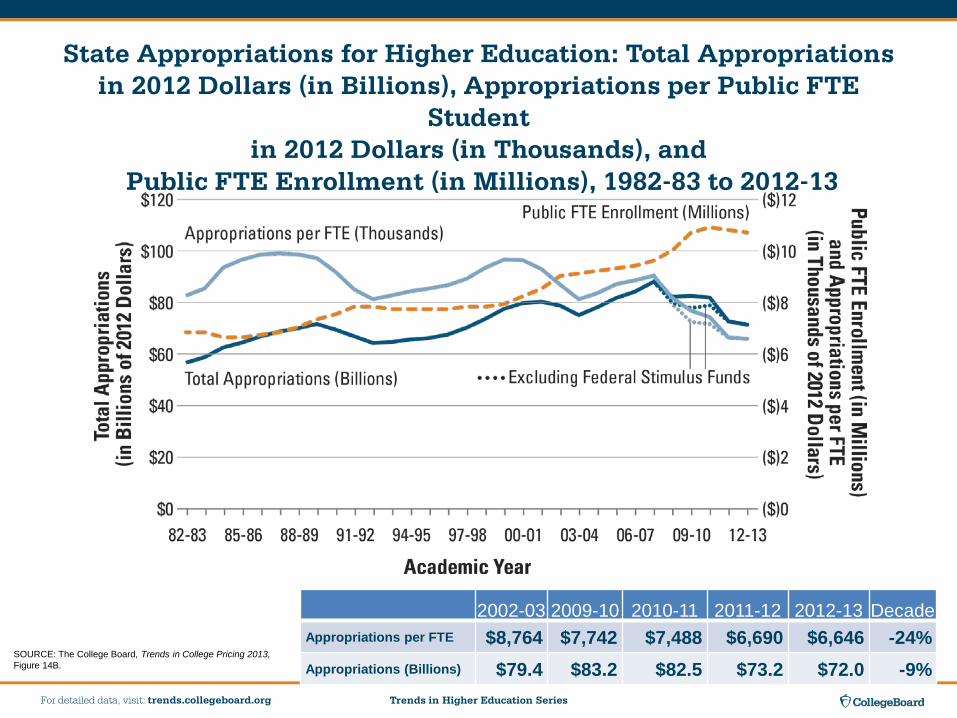
State Appropriations for Higher Education: Total Appropriations in 2012 Dollars (in Billions), Appropriations per Public FTE
Student in 2012 Dollars (in Thousands), and
Public FTE Enrollment (in Millions), 1982-83 to 2012-13
SOURCE: The College Board, Trends in College Pricing 2013, Figure 14B.
2002-03 2009-10 2010-11 2011-12 2012-13 DecadeAppropriations per FTE $8,764 $7,742 $7,488 $6,690 $6,646 -24%Appropriations (Billions) $79.4 $83.2 $82.5 $73.2 $72.0 -9%
Trends in Higher Education Series For detailed data, visit: trends.collegeboard.org
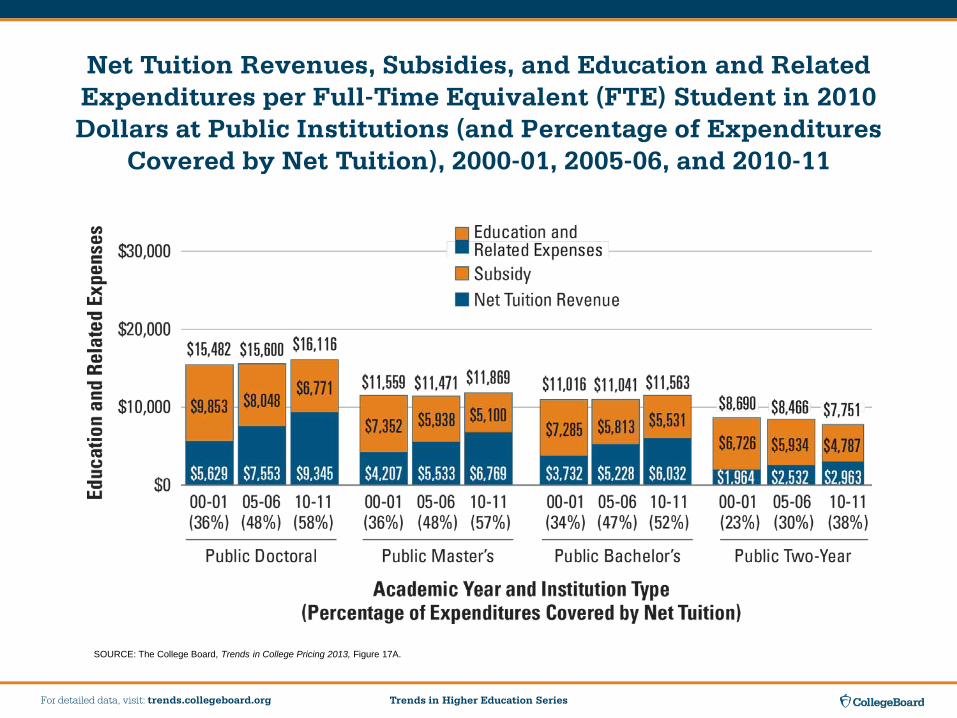
Net Tuition Revenues, Subsidies, and Education and Related Expenditures per Full-Time Equivalent (FTE) Student in 2010 Dollars at Public Institutions (and Percentage of Expenditures
Covered by Net Tuition), 2000-01, 2005-06, and 2010-11
SOURCE: The College Board, Trends in College Pricing 2013, Figure 17A.
Trends in Higher Education Series For detailed data, visit: trends.collegeboard.org
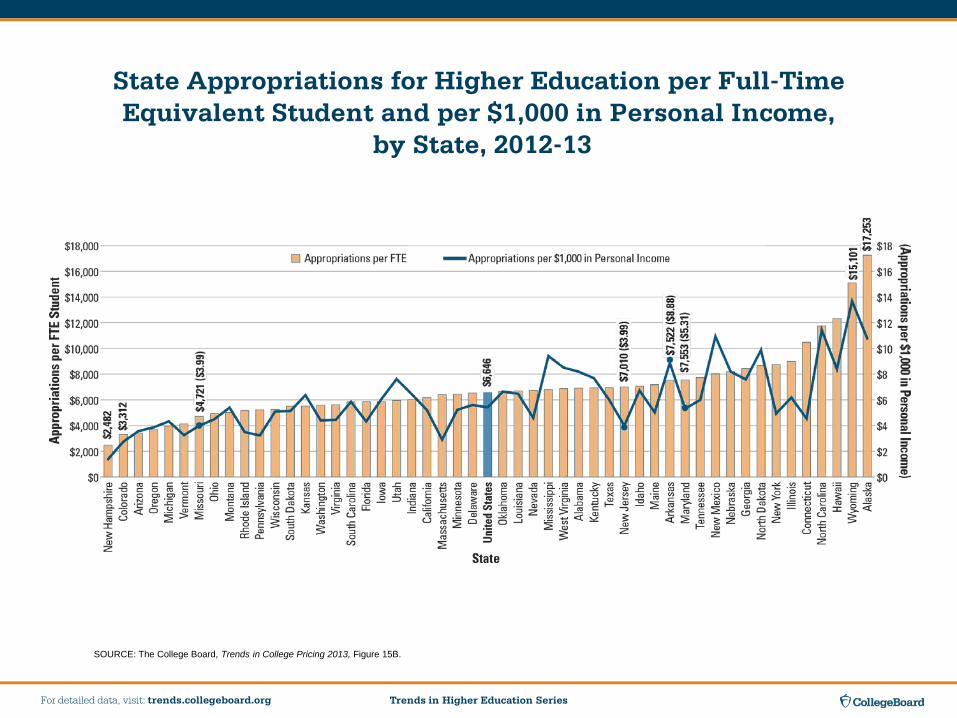
State Appropriations for Higher Education per Full-Time Equivalent Student and per $1,000 in Personal Income,
by State, 2012-13
SOURCE: The College Board, Trends in College Pricing 2013, Figure 15B.
Trends in Higher Education Series For detailed data, visit: trends.collegeboard.org
Changes in Student Aid
Trends in Higher Education Series For detailed data, visit: trends.collegeboard.org
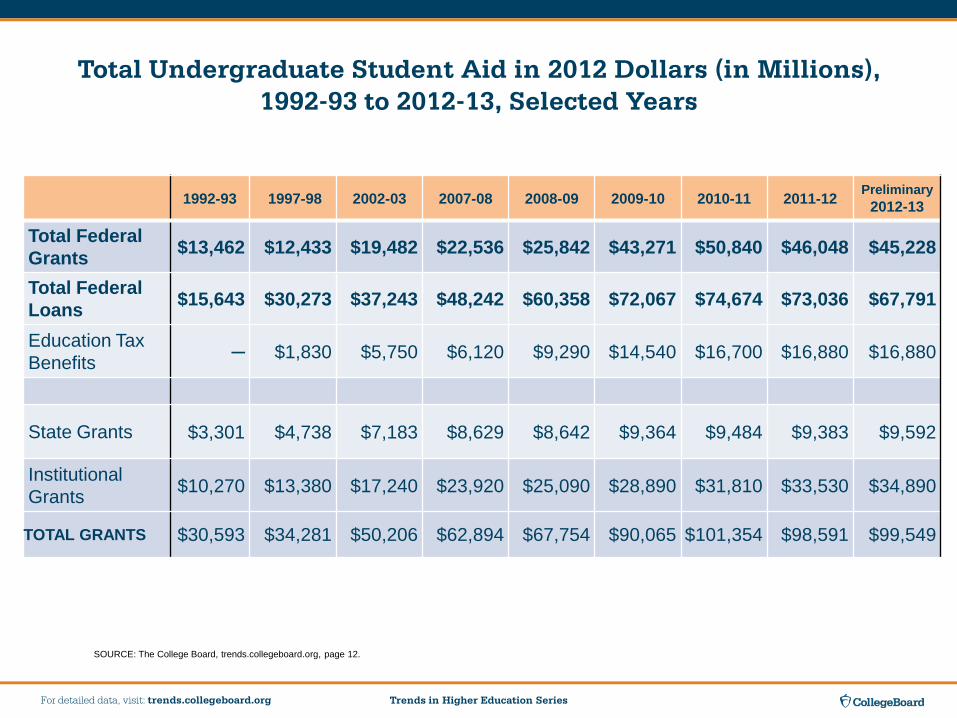
Total Undergraduate Student Aid in 2012 Dollars (in Millions), 1992-93 to 2012-13, Selected Years
SOURCE: The College Board, trends.collegeboard.org, page 12.
1992-93 1997-98 2002-03 2007-08 2008-09 2009-10 2010-11 2011-12 Preliminary 2012-13
Total Federal Grants $13,462 $12,433 $19,482 $22,536 $25,842 $43,271 $50,840 $46,048 $45,228
Total Federal Loans $15,643 $30,273 $37,243 $48,242 $60,358 $72,067 $74,674 $73,036 $67,791
Education Tax Benefits ─ $1,830 $5,750 $6,120 $9,290 $14,540 $16,700 $16,880 $16,880
State Grants $3,301 $4,738 $7,183 $8,629 $8,642 $9,364 $9,484 $9,383 $9,592
Institutional Grants $10,270 $13,380 $17,240 $23,920 $25,090 $28,890 $31,810 $33,530 $34,890
TOTAL GRANTS $30,593 $34,281 $50,206 $62,894 $67,754 $90,065 $101,354 $98,591 $99,549
Trends in Higher Education Series For detailed data, visit: trends.collegeboard.org
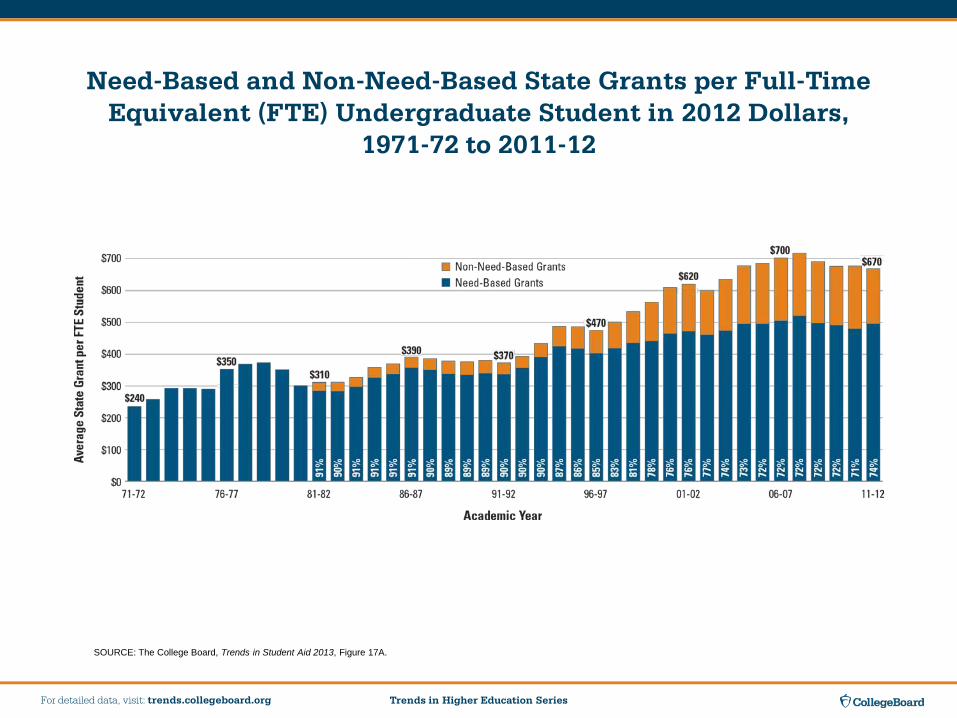
Need-Based and Non-Need-Based State Grants per Full-Time Equivalent (FTE) Undergraduate Student in 2012 Dollars,
1971-72 to 2011-12
SOURCE: The College Board, Trends in Student Aid 2013, Figure 17A.
Trends in Higher Education Series For detailed data, visit: trends.collegeboard.org
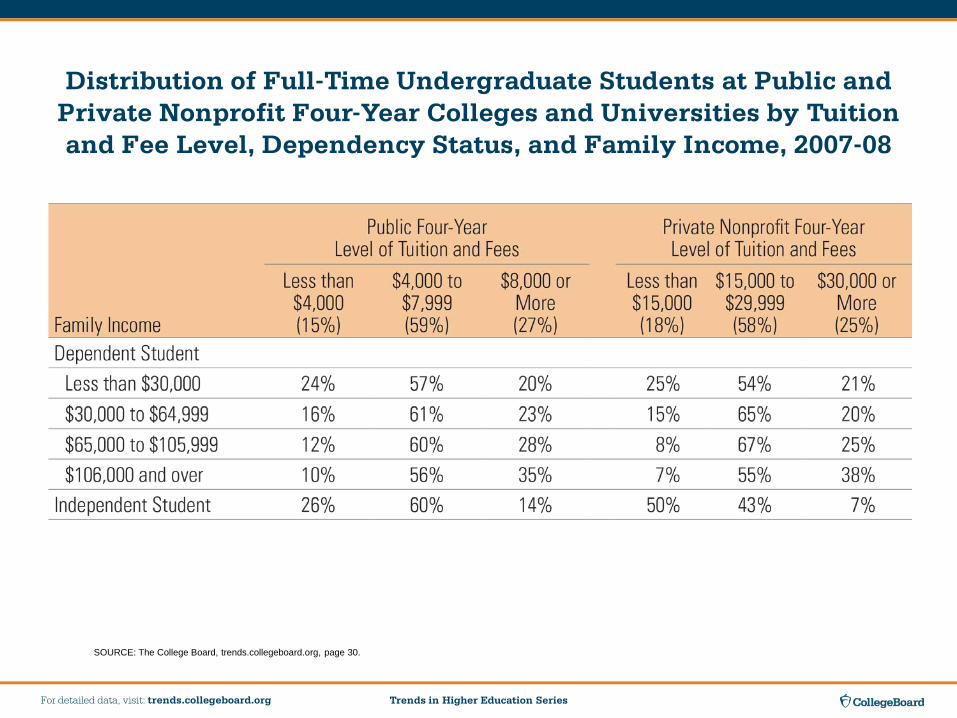
Distribution of Full-Time Undergraduate Students at Public and Private Nonprofit Four-Year Colleges and Universities by Tuition and Fee Level, Dependency Status, and Family Income, 2007-08
SOURCE: The College Board, trends.collegeboard.org, page 30.
Trends in Higher Education Series For detailed data, visit: trends.collegeboard.org
Student Debt
Trends in Higher Education Series For detailed data, visit: trends.collegeboard.org
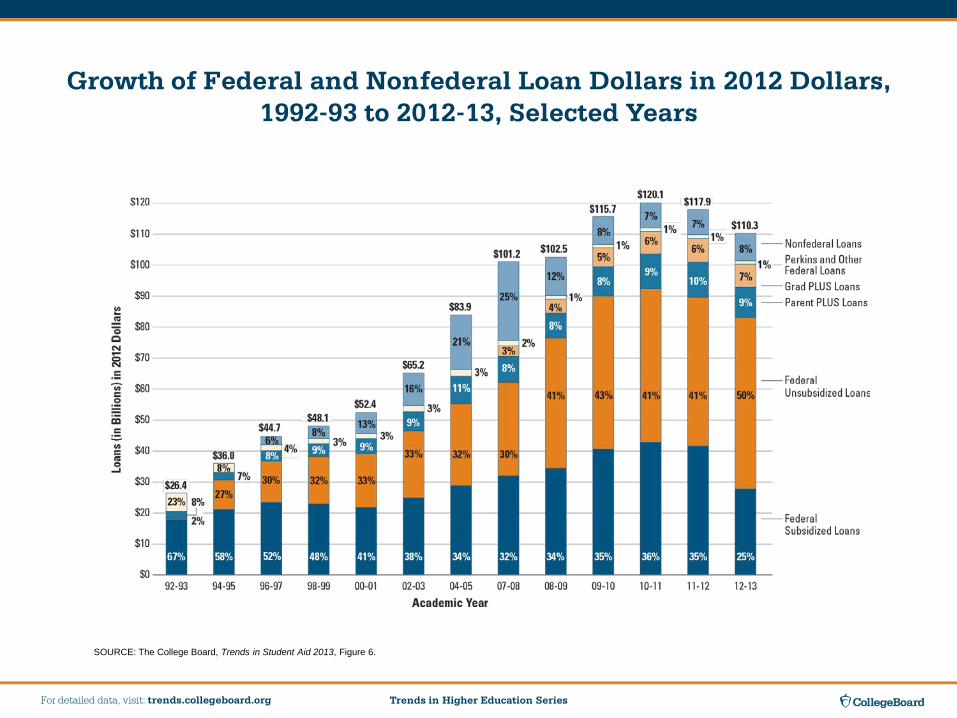
Growth of Federal and Nonfederal Loan Dollars in 2012 Dollars, 1992-93 to 2012-13, Selected Years
SOURCE: The College Board, Trends in Student Aid 2013, Figure 6.

Trends in Higher Education Series For detailed data, visit: trends.collegeboard.org
Total Number of Undergraduate and Graduate Federal Subsidized and Unsubsidized Student Loan Borrowers and Average Amount
Borrowed in 2012 Dollars, 2002-03 to 2012-13
SOURCE: The College Board, Trends in Student Aid 2013, Figure 7B.
Trends in Higher Education Series For detailed data, visit: trends.collegeboard.org
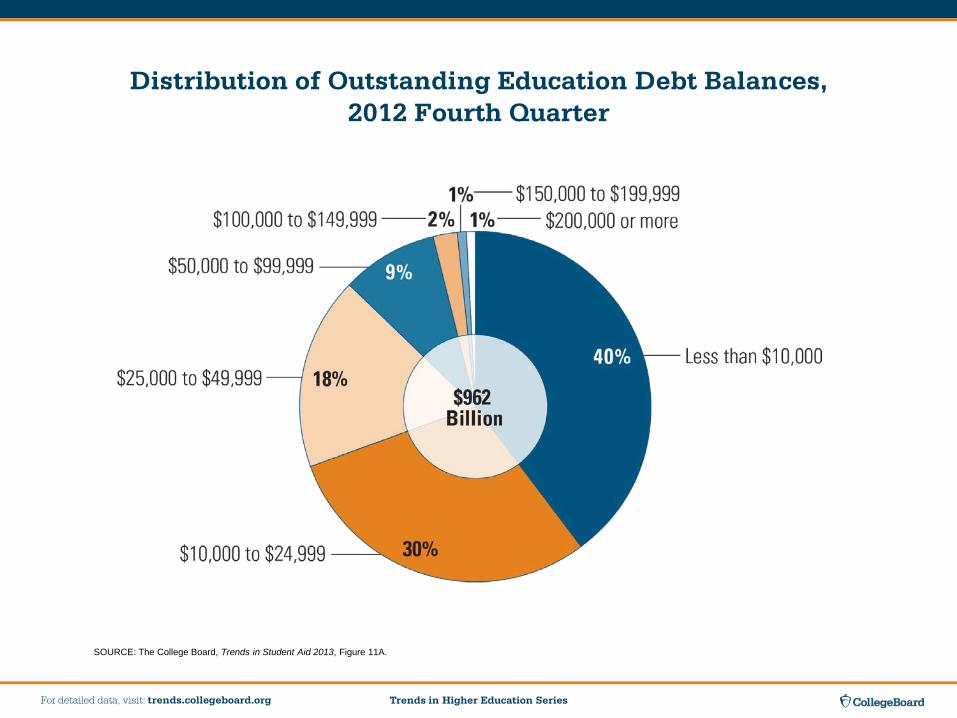
Distribution of Outstanding Education Debt Balances, 2012 Fourth Quarter
SOURCE: The College Board, Trends in Student Aid 2013, Figure 11A.
Trends in Higher Education Series For detailed data, visit: trends.collegeboard.org
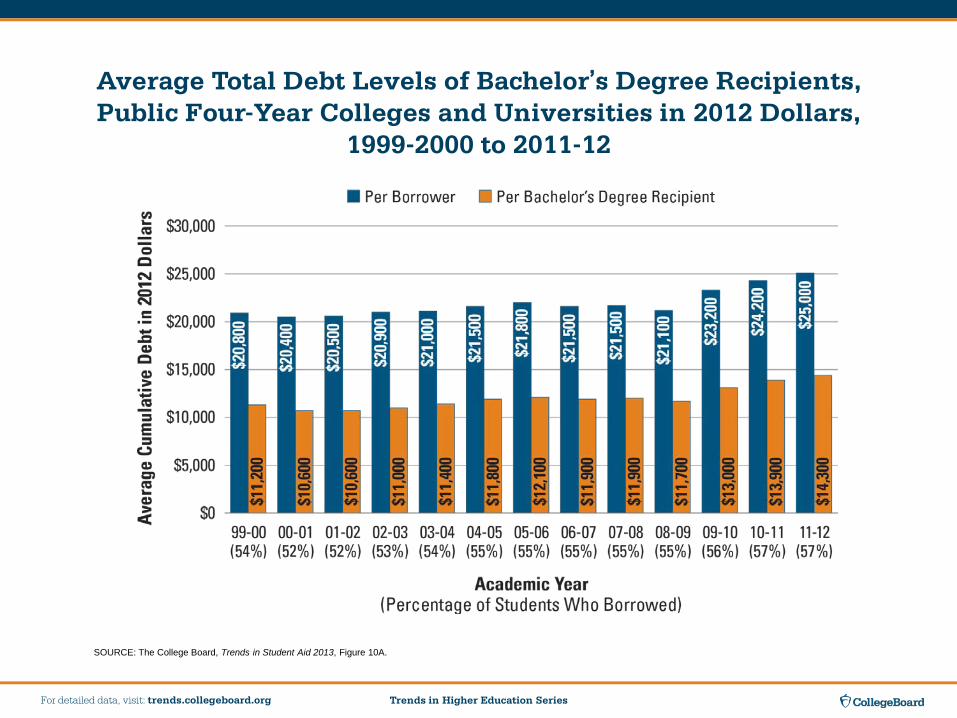
Average Total Debt Levels of Bachelor’s Degree Recipients, Public Four-Year Colleges and Universities in 2012 Dollars,
1999-2000 to 2011-12
SOURCE: The College Board, Trends in Student Aid 2013, Figure 10A.
Trends in Higher Education Series For detailed data, visit: trends.collegeboard.org
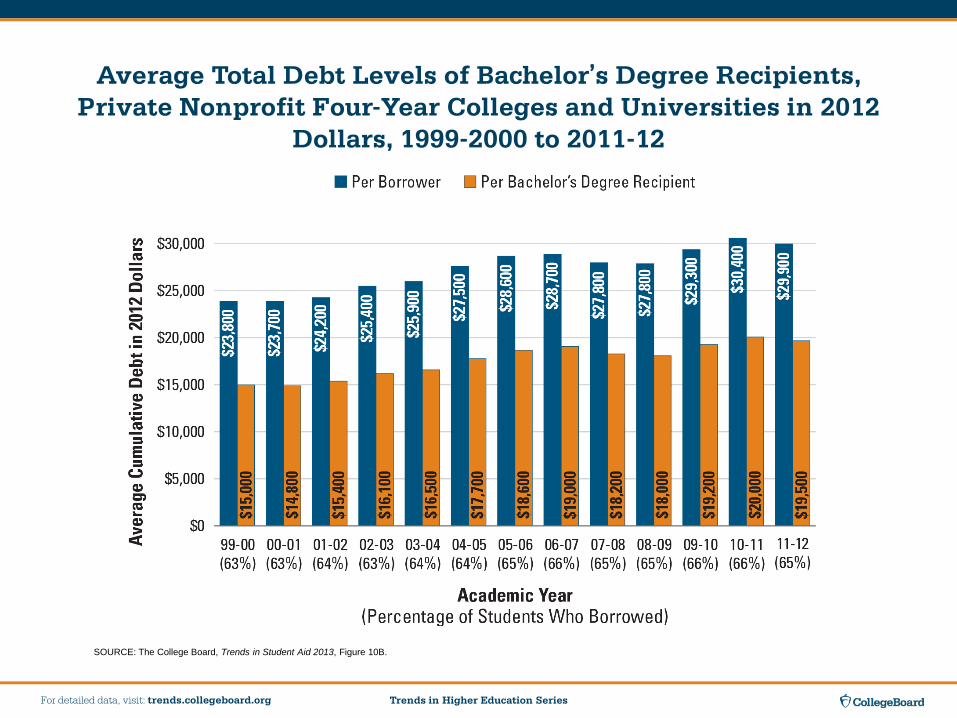
Average Total Debt Levels of Bachelor’s Degree Recipients, Private Nonprofit Four-Year Colleges and Universities in 2012
Dollars, 1999-2000 to 2011-12
SOURCE: The College Board, Trends in Student Aid 2013, Figure 10B.
Trends in Higher Education Series For detailed data, visit: trends.collegeboard.org
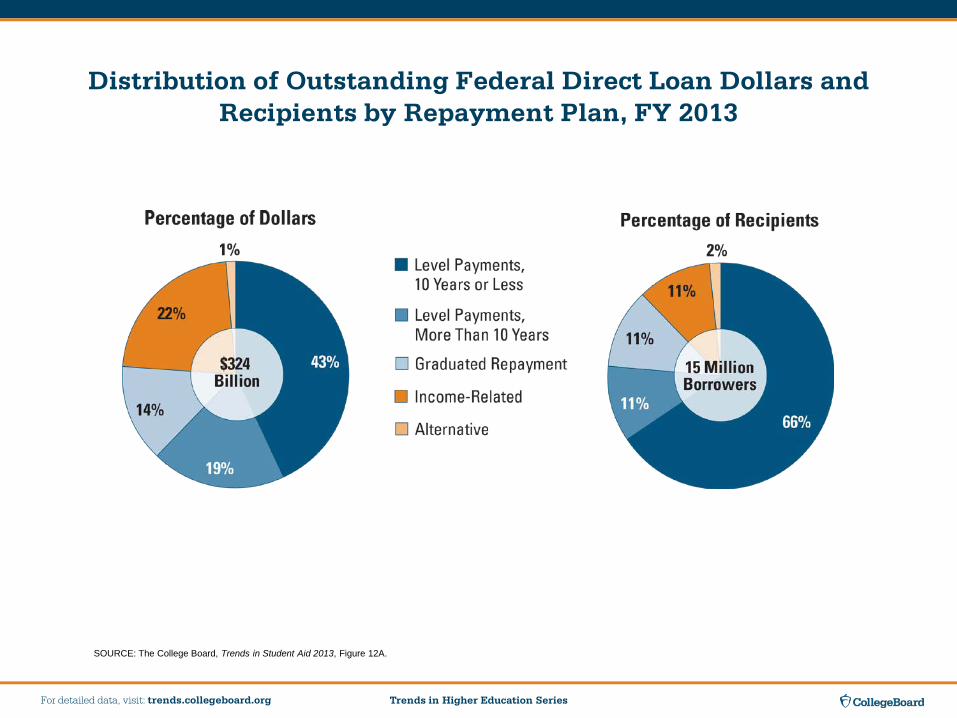
Distribution of Outstanding Federal Direct Loan Dollars and Recipients by Repayment Plan, FY 2013
SOURCE: The College Board, Trends in Student Aid 2013, Figure 12A.
Trends in Higher Education Series For detailed data, visit: trends.collegeboard.org
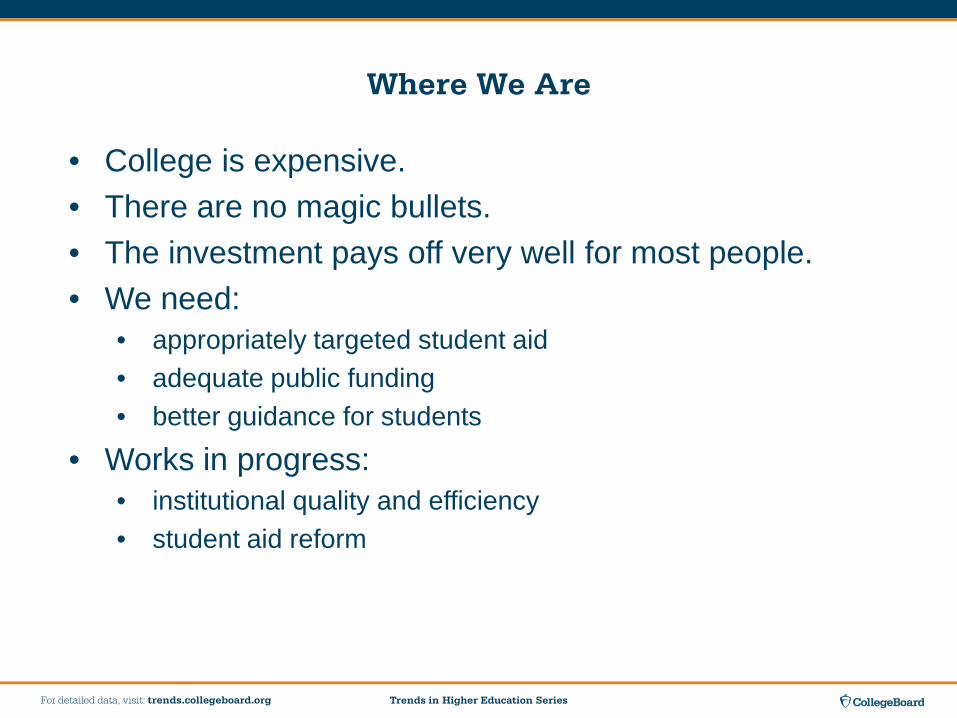
Where We Are
• College is expensive.• There are no magic bullets.• The investment pays off very well for most people.• We need:
• appropriately targeted student aid • adequate public funding• better guidance for students
• Works in progress: • institutional quality and efficiency • student aid reform
Trends in Higher Education Series For detailed data, visit: trends.collegeboard.org
For more information, visit:
trends.collegeboard.org
Sandy Baum, [email protected]
Jennifer Ma, [email protected]
Kathleen Payea, [email protected]
Top Related