


Languages
Pages
Legal


Kildare County Council
Traffic Modelling Report
Maynooth Strategic Traffic Model
Issue Date: 31-01-2017

Document Control
Prepared By: Conor de Courcy AECOM
Checked By: Jonathan Hennessy AECOM
Approved By: AECOM
Revision History
Revision Date Comments
1 31-01-2017 Work In Progress
AECOM Maynooth Traffic Management Plan and Traffic Model
Kildare County Council Traffic Modelling Report
Page 1
Maynooth Strategic Traffic Model
Traffic Modelling Report
TABLE OF CONTENTS
1. Introduction ................................................................................................................. 4
1.1 Overview ....................................................................................................................... 4
1.2 Project Background ....................................................................................................... 4
2 Data Collection ............................................................................................................ 7
2.1 Introduction ................................................................................................................... 7
2.2 National Transport Model .............................................................................................. 7
2.3 National Traffic Model ................................................................................................... 8
2.4 Traffic Surveys .............................................................................................................. 8
2.5 GeoDirectory Data ...................................................................................................... 25
3 Model Development .................................................................................................. 28
3.1 Overview ..................................................................................................................... 28
3.2 Definition of Model Study Area .................................................................................... 28
3.3 Network Development ................................................................................................. 29
3.4 Matrix Development .................................................................................................... 35
3.5 Assignment Model ...................................................................................................... 35
3.6 Estimation of Annual Average Daily Traffic (AADT) ..................................................... 36
4 Model Calibration & Validation ................................................................................ 38
4.1 Introduction ................................................................................................................. 38
4.2 Calibration................................................................................................................... 38
4.3 Model Validation ......................................................................................................... 41
4.4 Comparison of Traffic Patterns .................................................................................... 44
4.5 Model Convergence .................................................................................................... 47
5 Future Year Model Development.............................................................................. 49
5.1 Introduction ................................................................................................................. 49
5.2 Future Year Matrix Development ................................................................................ 49
5.2.1 Overview ..................................................................................................................... 49
5.3 Maynooth Area Future Development........................................................................... 49
5.4 Future Land Use Projections & Associated Traffic Generation .................................... 52
5.5 Allocation & Distribution of Future Growth ................................................................... 55
5.6 Comparison of KCC Forecast to ERM and NTM ......................................................... 55
5.7 Future Year Matrix Analysis ........................................................................................ 57
6 Future Year Scenario Assessment .......................................................................... 62
6.1 Maynooth LAP Roads Objectives ................................................................................ 62
6.2 Future Year Scenarios Assessed ................................................................................ 65

AECOM Maynooth Traffic Management Plan and Traffic Model
Kildare County Council Traffic Modelling Report
Page 2
6.3 Do-Minimum Network ................................................................................................. 65
6.4 Do Something Networks ............................................................................................. 65
6.5 Results ........................................................................................................................ 69
7 Conclusion ................................................................................................................ 81
7.1 Conclusion .................................................................................................................. 81
Appendix A – Traffic Surveys
Appendix B – Model Calibration
Appendix C – Model Validation
Appendix D – Future Year Forecasting & Demand Allocation - Technical Note 1
AECOM Maynooth Traffic Management Plan and Traffic Model
Kildare County Council Traffic Modelling Report
Page 3
Chapter 1
Introduction

AECOM Maynooth Traffic Management Plan and Traffic Model
Kildare County Council Traffic Modelling Report
Page 4
1. Introduction
1.1 Overview
This Traffic Modelling Report (TMR) outlines the development, calibration/validation and traffic
forecasting process for a strategic local area traffic model of Maynooth. The traffic model has
been developed as part of the Maynooth Traffic Management Plan and Traffic Model project on
being undertaken by AECOM on behalf of Kildare County Council (KCC). The model will be used
to test the impacts of future traffic management proposals, highway network interventions and
land use proposals in the Maynooth area. The traffic model study area for the proposed scheme
is illustrated in Figure 1.1 below.
The strategic traffic model has been developed in accordance with Transport Infrastructure
Irelands’ (TII’s) Project Appraisal Guidelines (PAG) 2016. These guidelines are in compliance
with the Department of Transport, Tourism and Sports’ Common Appraisal Framework for
Transport Projects and Programmes (2016).
Figure 1.1 – Maynooth Traffic Model Study Area
1.2 Project Background
Maynooth is defined in the Regional Planning Guidelines (RPG’s) for the Greater Dublin Area
(GDA), 2010-2022, as a Large Growth Town II. As a Large Growth Town, Maynooth is an
important self-sustaining regional economic driver, accommodating significant investment in
transport, housing, economic and commercial activity with high-quality transport links to Dublin
and other towns.
Maynooth also functions as a vibrant college town with a growing population, an expanding
university complex and potential new commercial and science/technology offerings. Within

AECOM Maynooth Traffic Management Plan and Traffic Model
Kildare County Council Traffic Modelling Report
Page 5
Maynooth there are new residential developments under construction and a number of potential
developments are currently in the early planning process.
The current transport network and traffic management arrangements can result in significant
delays and congestion, particularly along the R406, Moyglare Road and R148. The majority of
the north-south and east-west traffic has to travel through the Main Street /Straffan Road junction
or the Mill Street / Leinster St /Main St junction. These junctions are currently operating at
capacity and have major impact on congestion within the town. This traffic congestion causes a
reduction in the quality of life for people living in and visiting Maynooth.
The Maynooth Local Area Plan 2013 to 2019 contains a number of new road links that will
provide alternative routes to the existing arrangement and provide much needed relief to the
main links within the town. The provision of these new links will provide further opportunity for
improvements to the public realm and to the pedestrian/cyclists network.
Resources for the delivery of these new links are however limited and some of the infrastructure
will need to be delivered in conjunction with other commercial developments. As a consequence
there is a need to understand the benefits that these new links may provide so that their delivery
can be prioritised and any investments appropriately focused. The Maynooth Traffic
Management Plan will provide KCC with plan led approach to future traffic management that
assists in the fulfilment of the Maynooth Local Area Plan 2013 to 2019 objectives. The Plan, with
clear recommendations for the management of traffic within Maynooth, will provide KCC with
important information in relation to transport within Maynooth, including the following:
Traffic Management Plans for local schools.
Details on potential relief provided by new link roads and streets.
Cross-sectional and junction requirements for new link roads.
Preliminary layouts for future improvements, such as Main Street and its associated junctions.
Options for future traffic management of Maynooth.
Options for traffic management and circulation within the core town centre.
The Maynooth Strategic Traffic Model (STM) will allow KCC to investigate the impact and
opportunities presented by the provision of new link roads and other infrastructure improvements.
It will provide the means to assess the impact of major traffic management changes on the
overall road network and will be a useful tool in assessing the impact of future developments on
the transport network. The results from the traffic model will help to provide a strategic overview
of existing and future traffic conditions within Maynooth.

AECOM Maynooth Traffic Management Plan and Traffic Model
Kildare County Council Traffic Modelling Report
Page 6
Chapter 2 Data Collection

AECOM Maynooth Traffic Management Plan and Traffic Model
Kildare County Council Traffic Modelling Report
Page 7
2 Data Collection
2.1 Introduction
In order to develop a traffic model, a significant level of traffic data is required to ensure that the
model can replicate existing traffic patterns and volumes. This section of the TMR describes the
collation of data for the construction of the Base Year (2016) Maynooth STM.
2.2 National Transport Model
The starting point for the development of the Base Year STM was the 2015 Base Year National
Transport Model1 (NTpM), which was developed by Transport Infrastructure Ireland (TII). The
NTpM is a strategic multi-modal variable demand model used by TII to assess the impact of
infrastructure or policy changes at National, Regional and local level. Within the NTpM there are
four modules, which are as follows:
National Traffic Model (NTM);
National Rail Model (NRM);
National Bus Model (NBM); and
Variable Demand Model (VDM)
The three assignment models (NTM, NRM & NBM) are used to assign the demand for travel
represented by the demand matrices to the network, generating travel costs (e.g. time, distance,
tolls, fares) for each mode. A brief overview of the Variable Demand Model is provided in the
following section.
2.2.1 Variable Demand Modelling
The role of the Variable Demand Model (VDM) is to assess, if required, the impact of a change in
the transport network or change in the cost of travel (e.g. fuel costs, fares) upon the demand for
travel (mode switching, induced demand etc.). Table 5.2.1 of PAG Unit 5.2: Construction of
Transport Models provides guidance on when variable demand modelling is required.
The VDM operates at a national level as it requires the full cost of a trip between an origin and
destination; therefore any assessment of potential demand responses arising from strategic
highway network investments in Maynooth should be undertaken with the NTpM and not the
Maynooth STM. However, any demand responses identified as a result of the proposed schemes
can be incorporated into the STM using demand matrix adjustment techniques.
1 TII National Transport Model documentation - http://www.tii.ie/tii-library/strategic-planning/

AECOM Maynooth Traffic Management Plan and Traffic Model
Kildare County Council Traffic Modelling Report
Page 8
2.3 National Traffic Model
The NTM is a strategic (macroscopic) traffic model developed using the transportation modelling
software VISUM and forms the highway element of the NTpM as outlined above. The model
covers the entire national and regional road network and is used by TII as a tool in the appraisal
of potential road schemes and land-use and policy changes. The NTM provides demand data for
Light Vehicles (Car & Light Goods Vehicles) and Heavy Vehicles (Other Goods Vehicle 1, Other
Goods Vehicle 2 and Buses/Coaches) for the following time periods:
Average AM Peak Hour (average hour between 07:00 – 09:00); and
Average Inter Peak Hour (average hour between 12:00 – 14:00).
The model provided both the initial highway network and demand matrices for the Maynooth
STM. The NTM is high level strategic traffic model and though it is suitably refined to test impacts
on a national scale it is not detailed enough to assess local impacts on the network.
2.4 Traffic Surveys
A summary of the traffic survey data that was collated to inform the development of the Base
Year (2016) STM is outlined in Table 2.1 below. Figures 2.1 to 2.4 illustrate the location of the
traffic surveys.
Table 2.1 - Traffic Survey Data
Survey Type Description
Origin – Destination (OD)
Automatic Number Plate Recognition (ANPR) surveys were carried out at 21 sites on Thursday the 19
th May 2016 from 07:00 to 19:00.
In addition to the ANPR surveys Automatic Traffic Counts (ATC) surveys were carried out at the 21 ANPR sites 24 hours a day over a two week period from Tuesday the 17
th to Monday the 30
th May
2016.
Traffic Counts
Automatic Traffic Counts (ATC) surveys were carried out at an
additional 6 sites in the Town Centre 24 hours a day over the two
week period from Tuesday the 17th to Monday the 30
th May 2016.
Junction Turning Movement Count (JTC) surveys were carried out
at 31 locations from 07:00 to 19:00 on Tuesday the 17th May 2016
and Thursday the 19th May 2016.
Traffic data from 2 permanent Transport Infrastructure Ireland (TII)
Traffic Monitoring Units (TMU) local to the Maynooth area.
Journey Time
Journey time survey data was collected as part of the ANPR
surveys.

AECOM Maynooth Traffic Management Plan and Traffic Model
Kildare County Council Traffic Modelling Report
Page 9
Figure 2.1 – Overview of ANPR & ATC Survey Locations
Figure 2.2 - Overview of Additional ATC Survey Locations

AECOM Maynooth Traffic Management Plan and Traffic Model
Kildare County Council Traffic Modelling Report
Page 10
Figure 2.3 - Overview of JTC Survey Locations
Figure 2.4 – TII Traffic Monitoring Units within the Study Area

AECOM Maynooth Traffic Management Plan and Traffic Model
Kildare County Council Traffic Modelling Report
Page 11
2.4.1 Automatic Traffic Counts
An Automated Traffic Count (ATC) captures the traffic flow passing a given point on a road and
classifies the flow into different vehicle classifications, such as Cars, Light Goods Vehicles (LGV)
and Heavy Goods Vehicles (HGV). Traffic flow data, extracted from the ATC survey sites (21
ATC survey sites indicated in Figure 2.1 and the 6 additional ATC survey sites indicated in Figure
2.2) undertaken over the two week period from Tuesday the 17th to Monday the 30th May 2016,
is presented in Table 2.2 below for the following time periods:
AM Peak (08:00 – 09:00); and
PM Peak (17:00 – 18:00).
Table 2.2 also provides annual average estimates of both weekday (Mon – Fri) and 7 day traffic
flow based on the ATC Surveys. The following estimates are presented:
2016 Annual Average Weekday Traffic (AAWT); and
2016 Annual Average Daily Traffic (AADT).
It should be noted that a seasonality factor of 0.97 for the month of May has been applied to the
collected data in line with guidance provided in TII PAG Unit 16.2: Expansion Factors for Short
Period Traffic Counts. A graphical summary of the peak hour AAWT and AADT information
presented in Table 2.2 & 2.3 below is shown in Figure 2.5 and Figure 2.6.

AECOM Maynooth Traffic Management Plan and Traffic Model
Kildare County Council Traffic Modelling Report
Page 12
Table 2.2 - Automatic Traffic Counter Data 2 Way Flow (2016)
Site Location Vehicles per Hour Vehicles per Day
AM PM AAWT AADT
Site A R406, south of M4 Interchange 1,305 1,340 16,031 15,365
Site B R405, north of M4 Overbridge 429 471 5,712 5,757
Site C R406, north of M4 Interchange 1,376 1,237 17,502 16,609
Site D Straffan Wood 607 656 7,067 6,593
Site E R405, east of R406 Junction 613 466 6,319 5,858
Site F R408, south of Ashley Grove 344 367 3,930 3,684
Site G R408 west of Junction with
Meadowbrook Lawns 286 356 4,107 3,713
Site H R406, north of Junction with R405 1,333 1,480 20,464 19,676
Site I R148, east of Maynooth 729 856 9,890 9,296
Site J R148 each of Junction with R157
south of JTC Site 20 414 477 5,868 5,555
Site K R406 north of Railway Junction 1,228 1,314 18,236 15,732
Site L R148, north of Pound Lane 1,148 1,103 16,110 15,332
Site M R148, west of NUIM entrance 633 571 7,368 6,972
Site N R148 east of NUIM entrance 608 619 9,097 8,643
Site O R148, west of Dunboyne Road
Junction 780 684 11,571 11,353
Site P R148 between Dunboyne Road
Junction and Tesco 600 701 11,139 10,985
Site Q R148, east of R157 Junction 854 1,000 11,166 10,516
Site R Dunboyne Road, north of Pebble Hill 377 358 4,017 3,735
Site S Moyglare Road, north of Maynooth 624 651 7,722 7,285
Site T R157 north of Junction with Dunboyne
Road 796 850 8,358 7,663
Site U Local Road, east of Moyglare Road 527 593 5,052 4,443
Table 2.3 - Automatic Traffic Counter Data Town Centre 2 Way Flow (2016)
Site Location Vehicles per Hour Vehicles per Day
AM PM AAWT AADT
Site 1 Kelly’s Lane 14 28 393 387
Site 2 Fagan's Lane 17 23 351 350
Site 3 Coates Lane 3 5 98 103
Site 4 Double Lane 63 44 688 641
Site 5 Back Lane 2 4 41 40
Site 6 Doctors Lane 193 279 3,065 2,882

AECOM Maynooth Traffic Management Plan and Traffic Model
Kildare County Council Traffic Modelling Report
Page 13
Figure 2.5: Estimated AADT’s within the Study Area

AECOM Maynooth Traffic Management Plan and Traffic Model
Kildare County Council Traffic Modelling Report
Page 14
Figure 2.6: Estimated AADT’s within the Study Area Town Centre

AECOM Maynooth Traffic Management Plan and Traffic Model
Kildare County Council Traffic Modelling Report
Page 15
2.4.2 Junction Turning Counts
A Junction Turning Count (JTC) captures the number of vehicles turning at a junction and
observes which turn they take. As with the ATCs they classify the traffic into different vehicle
categories. JTC surveys were undertaken at 31 junctions from 07:00 to 19:00 on Tuesday the
17th May 2016 and Thursday the 19
th May 2016. Traffic flow was classified by vehicle type and
recorded in 15 minute time intervals. The junctions listed in Table 2.4 below were surveyed (refer
to Figure 2.3).
Table 2.4 – Junction Turning Movement Counts (2016)
Site Location Date
1 R406(N) / Local Road / R406(S) / Maynooth Business Campus / Slip Road Off M4
Tuesday 17th May 2016
2 R406(N) / Slip Road Onto M4 / R406(S)
3 R406(N) / Slip Road Off M4 / R406(S) / Slip Road onto M4
4 R406(N) / Local Road / R406(S) / Lidl Access Road
5 R406(N) / Straffan Wood / R406(S) / Bus Bay
6 Meadowbrook Road(N) / Meadowbrook Road(S) /Straffan Wood
7 Meadowbrook Road(N) / Beaufield /Meadowbrook Road(S)
8 R408(W) / Beaufield / R408(E)
9 R408(N) / R408(W) / Meadowbrook Road
10 R406(N) / R406(S) / R405
11 R406(N) / Train Station / R406(S)
12 R406(N) / R406(S) / Access Road
Thursday 19th May 2016
13 Fagan's Lane / R148(W) / R406 / R148(E)
14 R148(N) / R408 / Canal Place / R148(E)
15 Moyglare Road / R148(W) / R148(S)
16 Moyglare Road(N) / University Access / Moyglare Road(S)
17 Moyglare Road(N) / Moyglare Road(S) / Moyglare Hall
Tuesday 17th May 2016 18
Moyglare Road(N) / Local Road(W) / Moyglare Road (S) / Local Road(E)
19 University Access / R148(W) / Library Access /
Tuesday 17th May 2016 20 Maynooth Campus / R408(S) / R408(E)
21 Dillow's Road / R148(W) / Doctors Lane / R148(E)
22 (1) R148(W) / Exit Only Access / R148(E)
Tuesday 17th May 2016
22 (2) Local Access / R148(W) / Main Tesco Access / R148 (East)
22 (3) R148(W) / Tesco Access / R148(E)
23 R157(N) / Local Road / R157(S)
24 R157(N) / Dillow's Road / R157(S)
25 R157 / R148(W) / R148(E)
26 R148(W) / L5053 / R148(E)
27 L5053 / R405(W) / R405(E)
28 R405(N) / Lawrence’s Avenue / R405(S)
29 R405(N) / R405(S) / Rail Park
30 R406(N) / R406(S) / Maynooth Park
31 R406(N) / R406(S) / Rail Park

AECOM Maynooth Traffic Management Plan and Traffic Model
Kildare County Council Traffic Modelling Report
Page 16
2.4.3 Automatic Number Plate Recognition (ANPR) Surveys
In order to ensure a robust representation of current traffic patterns within the Maynooth STM,
ANPR surveys were undertaken. ANPR surveys are used to provide Origin-Destination data over
a wide area and to also provide journey time information. ANPR cameras are placed on the
roadside at key locations, capturing vehicle registration plates as they passed and time stamping
the registration plate. The data was stored for each unit and the registration plate was ‘tracked’
as it passed through different sites. The time stamps allowed vehicles which make several
prolonged stops to be removed from the data.
By ‘tracking’ the registration plates the ANPR surveys captured the origin and destination of a
given vehicle within the study area. A number of sites were strategically set up throughout the
study area to form a closed cordon and data was recorded on the 19th
May 2016 (a typical
weekday) from 07:00 to 19:00. The survey data was presented on a ‘first seen-last seen’ basis,
whereby the survey data recorded the first site and last site the vehicle was seen at. A vehicle’s
origin and destination within the study area is considered to be the first and last site it was seen
at.
Origin-Destination data was collated at 21 locations within the study area as shown in Figure 2.1.
These locations were chosen to establish traffic pattern information in the area.
For presentation purposes the Origin-Destination dataset has been grouped into nine sectors as
shown in Figure 2.7. Sector 8 represents Maynooth Town Centre whilst Sector 7 represents the
Maynooth University North Campus. The remaining sectors (Sectors 1, 2, 3, 4, 5, 6 and 9)
represent the key strategic routes which provide access and egress to the Town Centre and
University.
The data is presented (expressed as proportions of origin trips) for the AM and PM peak periods
in Tables 2.5 - 2.6 below. The vertical column of row labels represents the sector at which
vehicles were first observed within the network. The horizontal row labels represent the sector at
which vehicles were last seen. Therefore, the tables outline the Origin of a vehicle (the first time
a vehicle was captured within the network) and the Destination (as the last time a vehicle was
captured).
Same site flows (i.e. first seen at Site 2 and last seen at Site 2) and vehicles only seen once in
the network (i.e. seen at only one site) have all been considered and are included into the data.
For example in Table 2.5 for Sector 1, 38% of traffic is considered local traffic as it is not seen at
any other ANPR site. Therefore this traffic has an origin and destination within Sector 1.

AECOM Maynooth Traffic Management Plan and Traffic Model
Kildare County Council Traffic Modelling Report
Page 17
Figure 2.7 – ANPR Sectors

AECOM Maynooth Traffic Management Plan and Traffic Model
Kildare County Council Traffic Modelling Report
Page 18
Table 2.5 – AM Peak O-D Results
AM Destination Sector
1 2 3 4 5 6 7 8 9
Ori
gin
Se
cto
r
1 38% 2% 4% 7% 3% 3% 18% 22% 3%
2 23% 25% 9% 2% 5% 0% 18% 16% 2%
3 10% 3% 30% 18% 1% 4% 15% 19% 1%
4 26% 1% 39% 8% 1% 4% 4% 13% 5%
5 28% 4% 10% 4% 28% 5% 4% 12% 5%
6 12% 1% 19% 2% 5% 22% 22% 15% 1%
7 15% 15% 20% 0% 10% 15% 5% 20% 0%
8 14% 2% 16% 14% 2% 5% 5% 41% 2%
9 31% 6% 11% 25% 1% 4% 2% 10% 10%
Table 2.6 – PM Peak O-D Results
PM Destination Sector
1 2 3 4 5 6 7 8 9
Ori
gin
Se
cto
r
1 24% 1% 4% 8% 16% 8% 6% 22% 10%
2 21% 25% 4% 4% 0% 8% 8% 17% 13%
3 7% 1% 24% 36% 2% 7% 2% 16% 6%
4 22% 1% 18% 13% 1% 3% 2% 19% 20%
5 15% 0% 8% 5% 24% 18% 4% 19% 7%
6 6% 0% 5% 2% 17% 27% 27% 17% 0%
7 29% 5% 16% 4% 12% 7% 1% 22% 4%
8 24% 4% 7% 6% 4% 12% 5% 30% 9%
9 20% 2% 5% 18% 10% 2% 0% 26% 18%
As can be seen from the above tables there are significant volumes of local trips in the Maynooth
area with the majority of trips having a destination within Maynooth Town Centre (Sector 8) in the
AM and PM peak hours. The traffic desire lines for the R406 north and R148 east and west of
Maynooth, and the R405 west and R157 south during the AM and PM peaks are presented in
Figures 2.8 to 2.17 below.

AECOM Maynooth Traffic Management Plan and Traffic Model
Kildare County Council Traffic Modelling Report
Page 19
Figure 2.8 – AM Peak – R406 Northbound Desire Lines
Figure 2.9 – AM Peak – R148 Westbound Desire Lines

AECOM Maynooth Traffic Management Plan and Traffic Model
Kildare County Council Traffic Modelling Report
Page 20
Figure 2.10 – AM Peak – R148 Eastbound Desire Lines
Figure 2.11 – AM Peak – R405 Westbound Desire Lines

AECOM Maynooth Traffic Management Plan and Traffic Model
Kildare County Council Traffic Modelling Report
Page 21
Figure 2.12 – AM Peak – R157 Southbound Desire Lines

AECOM Maynooth Traffic Management Plan and Traffic Model
Kildare County Council Traffic Modelling Report
Page 22
Figure 2.13 – PM Peak – R406 Northbound Desire Lines
Figure 2.14 – PM Peak - R148 Westbound West Desire Lines

AECOM Maynooth Traffic Management Plan and Traffic Model
Kildare County Council Traffic Modelling Report
Page 23
Figure 2.15 – PM Peak - R148 Eastbound Desire Lines
Figure 2.16 – PM Peak – R405 Eastbound Desire Lines

AECOM Maynooth Traffic Management Plan and Traffic Model
Kildare County Council Traffic Modelling Report
Page 24
Figure 2.17 – PM Peak – R157 Southbound Desire Lines
2.4.4 Journey Times
Journey time information was collated from the ANPR data in order to ensure that the travel time
on existing roads was properly reflected within the base models, thereby ensuring that a robust
assignment could be undertaken. A cap was placed on the recorded journey times from the
ANPR data in order to ensure trips with stop offs included as part of the recorded journey times
were excluded. Analysis was also undertaken to remove statistical outliers from the data. These
journey times represent an average of journey time surveys captured on Tuesday 19th of May
2016.
The journey times for 6 key routes in the model were analysed, these key routes are shown
graphically in Figure 2.18 below. Details of the resultant journey times for the AM and PM Peak
periods are presented in Table 2.7. This journey time data was used to validate the base year
models.

AECOM Maynooth Traffic Management Plan and Traffic Model
Kildare County Council Traffic Modelling Report
Page 25
Figure 2.18 Journey Time Routes
Table 2.7 – Average Journey Time during Modelled Peak Hours
Route Description Direction Average Duration (min:sec)
AM PM
A R148 & R406 through
Maynooth
Northbound 00:08:43 00:08:37
Southbound 00:10:58 00:11:06
B R405 & Moyglare Road
through Maynooth
Northbound 00:10:52 00:09:36
Southbound 00:10:23 00:08:59
C R408 & Dunboyne Road
Through Maynooth
Eastbound 00:09:37 00:12:46
Westbound 00:10:33 00:12:42
D R148 through Maynooth
Eastbound 00:08:24 00:09:29
Westbound 00:08:30 00:10:32
2.5 GeoDirectory Data
The GeoDirectory dataset is a database jointly established by An Post and Ordnance Survey
Ireland. The dataset is a complete address database of all buildings in Ireland, with each building
classified as commercial, residential or both (commercial and residential use) within the dataset.
The data for the study area was utilised to help inform the disaggregation of NTM zones and the

AECOM Maynooth Traffic Management Plan and Traffic Model
Kildare County Council Traffic Modelling Report
Page 26
placement of zone connectors. Figure 2.19 below shows the GeoDirectory units by type within
the study area.
Figure 2.19 – GeoDirectory Points within Traffic Model

AECOM Maynooth Traffic Management Plan and Traffic Model
Kildare County Council Traffic Modelling Report
Page 27
Chapter 3
Model Development

AECOM Maynooth Traffic Management Plan and Traffic Model
Kildare County Council Traffic Modelling Report
Page 28
3 Model Development
3.1 Overview
This section of the report describes the development, calibration and validation of the 2016 Base
Year Maynooth STM’s which have been developed for the following time periods:
AM Peak Hour (08:00 – 09:00); and
PM Peak Hour (17:00 – 18:00).
These peak hours were defined (as highlighted in green below) following an assessment of the
ATC’s within the study area. Traffic flows at each of the ATCs within the study area were
aggregated together to reveal the following traffic demand profile.
Figure 3.1 – Peak Hour Selection
3.2 Definition of Model Study Area
In order to identify the extent of the study area for the Maynooth STM a high level assessment
was undertaken using the National Traffic Model (NTM). An indicative route alignment was coded
into the future NTM (2030 High Growth) and assessed to establish the extents of the existing
road network impacted upon.
-
2,000
4,000
6,000
8,000
10,000
12,000
14,000
16,000
18,000
0000
0100
0200
0300
0400
0500
0600
0700
0800
0900
1000
1100
1200
1300
1400
1500
1600
1700
1800
1900
2000
2100
2200
2300
To
tal V
eh
icle
s a
cro
ss 3
7
AT
C's
Hour Beginning

AECOM Maynooth Traffic Management Plan and Traffic Model
Kildare County Council Traffic Modelling Report
Page 29
3.3 Network Development
As mentioned previously, the NTM was used as a starting point for developing the 2016
Maynooth STM’s. Having identified the extent of the study area, the subsequent area of influence
was ‘cordoned’ out of the 2015 NTM Base model and is shown in Figure 3.2 below.
Figure 3.2 – Maynooth STM Study Area Cordoned from NTM
As outlined in Figure 3.2 above in cordoning the roads impacted by the Maynooth LAP 2013 to
2019 proposals from the NTM it was noted that the road impacted include all radial routes
connecting into Maynooth namely the M4, R148, R157, R405 and R406. These routes link the
neighbouring towns of Kilcock, Dunboyne, Leixlip and Celbridge to Maynooth. Therefore in the
subsequent refinement of the STM for Maynooth external zones which represent each of the
neighbouring towns were created to ‘feed’ traffic into the network, further details of the model
zone refinement process are given in Section 3.3.2 of this report.
3.3.1 Refinement of STM Road Network
Once the study area had been cordoned from the NTM, the road network was further refined to
reflect the 2016 road network conditions (i.e. inclusion of further detail such as refined road
capacity, turn bans, junction types etc.). This information was collected through site observations
and aerial mapping.

AECOM Maynooth Traffic Management Plan and Traffic Model
Kildare County Council Traffic Modelling Report
Page 30
There were a significant number of local roads which are not included in the 2015 NTM modelled
network. These local roads were coded into the 2016 STM as they could be potentially impacted
upon by any proposed schemes.
The road network was developed to a level of detail that included all National Primary,
Secondary and Regional roads and all significant local roads throughout the study area. The
information on each link included:
Link Length;
Link type, for example, National Regional Road, Local Urban, Local Rural etc.;
Link capacity;
Speed limit and free flow speed; and
Reference to an appropriate speed flow curve
3.3.2 Refinement of STM Zoning System
The refinements to the highway network needed to be accompanied by a finer representation of
trip demand through the use of smaller zone sizes in the Maynooth STM. The zoning system in
the NTM is based on the aggregation of Electoral Divisions (ED’s), which is not suitable for a
smaller local area model such as the Maynooth STM. A refined zoning system was therefore
needed to be designed.
Additionally the refined zoning system for the Maynooth STM was required to be designed in a
fashion that ensured the Maynooth STM zones were compatible with both TII’s NTM and the
National Transport Authorities (NTA) Eastern Regional Model (ERM). A zone disaggregation
process as outlined below was therefore undertaken.
Zone Disaggregation
Within the NTM the Maynooth urban area is covered by one large zone, Zone 490, which also
includes the Celbridge and Leixlip urban areas. Within the ERM the zone structure local to
Maynooth is more refined with nine smaller zones covering the Maynooth urban area. The zone
structures of both the NTM and the ERM in the area local to Maynooth are entirely compatible
with the ERM zoning structure representing a sub-set of the NTM zone structure. The zone
structure local to Maynooth from both the NTM and the ERM are shown in Figures 3.3 and 3.4
overleaf.

AECOM Maynooth Traffic Management Plan and Traffic Model
Kildare County Council Traffic Modelling Report
Page 31
Figure 3.3 – NTM Zone 490 Coverage
Figure 3.4: NTM & ERM Zone Structure Local to Maynooth

AECOM Maynooth Traffic Management Plan and Traffic Model
Kildare County Council Traffic Modelling Report
Page 32
The Maynooth STM required a zone structure which could accurately reflect local traffic patterns
in Maynooth whilst at the same time maintaining compatibility with the zone structure of both TII’s
NTM and the NTA’s ERM. In order to achieve these objectives NTM Zone 490 was initially
disaggregated in three sub zones representing the Maynooth, Celbridge and Leixlip urban areas.
The disaggregation of NTM zone 490 was based on analysis of the An Post Geo-Directory data
contained within each of the ERM model zones in the three resultant NTM sub zones. Figure 3.5
below refers.
Figure 3.5: NTM Zone 490 Disaggregation
Upon completion of the initial disaggregation of NTM Zone 490 in three sub zones the resultant
Maynooth zone as indicated in Figure 3.5 above was then disaggregated into a significantly finer
zone structure which is capable of reflecting, to a high degree of accuracy, the local traffic
movements in the Maynooth town centre and its environs. The starting point in this
disaggregation was the ERM zone system; however a finer zoning structure (which maintains
compatibility with the ERM and NTM) has been developed to reflect local traffic movements. The
Maynooth STM zone structure takes account of existing and future land use patterns. The
development of the zone structure again utilised An Post Geocoding information which allowed a
detailed understanding of the quantum of residences and commercial buildings in each zone.
Figure 3.6 overleaf outlines the ERM zone structure local to Maynooth and the Maynooth STM
zone structure which forms a subset of the ERM zones.

AECOM Maynooth Traffic Management Plan and Traffic Model
Kildare County Council Traffic Modelling Report
Page 33
Figure 3.6: ERM Zone Structure and Maynooth STM Zone Structure
As part of the NTM cordoning process three more full NTM zones (Zones 326, 488 and 496)
were entirely cordoned from the NTM. Additionally 21 external zones were created as part of the
model cordoning process. These zones all represented external zones in the Maynooth STM as
they essentially feed traffic into and out of the detailed modelled area as outlined in Figure 3.6
above. For external zones an aggregation process was therefore undertaken which matched the
external zones to each of the radial routes feeding into the detailed modelled area. In instances
where a number of external zones created from the NTM cordoning process were found to feed
traffic onto the same radial route they aggregated to simplify the final demand matrix.
The original model cordoned from the NTM contained 25 zones, which included the 4 internal
zones and 21 external zones. The disaggregation of the various zones noted above produced a
model containing a total of 56 zones, including 11 external zones. The refined STM highway
network and zoning structure is shown in Figure 3.7 below.

AECOM Maynooth Traffic Management Plan and Traffic Model
Kildare County Council Traffic Modelling Report
Page 34
Figure 3.7 – Refined Maynooth STM Zone Structure
3.3.3 Link Travel Times
The total travel time of a trip from origin to destination is a function of both link travel time and
junction delay. Link travel times in the network are determined by a predefined Volume-Delay
Function (VDF) in VISUM, which describes the relationship between current traffic volumes (q)
and the capacity of the link (qmax). The VDF used in this model is based on the Bureau of Public
Roads 3 (BPR 3) function:
t cur = t0 * (1 + a * sat
b) , if sat ≤ sat crit
t0 * (1 + a * satb) + (q – q max) * d , if sat > sat crit
Where: t0 = free flow travel time (based on link length (km) and free flow speed (v0))
sat = q/(qmax * c)
The VDF function is globally applied to all links in the network as the capacity (q) and free flow
speed (v0) of each link (input during network development) feed directly into the VDF. A VDF is
applied to each link classification in the model based on adjusted a, b, c and d parameter values
which reflect the quality of that road type.

AECOM Maynooth Traffic Management Plan and Traffic Model
Kildare County Council Traffic Modelling Report
Page 35
3.4 Matrix Development
The following time periods were required for the Maynooth STM:
Morning peak from 08:00 – 09:00 (AM Peak Period); and
Evening Peak from 17:00 – 18:00 (PM Peak Hour)
‘Prior’ AM Peak Light and Heavy vehicle matrices were extracted from the cordoned 2015 NTM.
The matrices were disaggregated to provide a more refined STM zoning system as discussed in
Section 3.3.2 above. The process of zone splitting was undertaken using VISUM, whereby origin
and destination trip ends were allocated to the sub-zones based on An Post GeoDirectory
information whilst maintaining the equivalent distribution of the larger zones.
The resultant ‘Prior’ matrices were then adjusted during the calibration process using matrix
estimation methods to reflect 2016 demand. As there is no PM Peak Hour NTM an alternative
approach to generate the PM Peak Hour ‘Prior’ matrices was adopted. The calibrated AM Peak
Hour matrices were transposed to give a ‘Prior’ PM matrix as a starting point for the calibration
process. Each of these matrices were then modified during the calibration process using the
2016 traffic survey data ascertained for each peak, using select link analysis and matrix
estimation tools in VISUM.
3.5 Assignment Model
The assignment model applies the demand for travel, represented by the trip matrices, to the
supply, in the form of the road network. The ‘generalised cost’ of a journey, represented by a
combination of time, distance and tolls is compared in a route choice algorithm, and a stable
output is produced, where ideally, all possible routes between an origin and destination have the
same ‘cost’. Generalised cost is computed as follows:
Generalised Cost = Value of Time * Time + Vehicle Operating Cost * Distance + Toll
3.5.1 Assignment Algorithm
The Route Choice Algorithm selected is based on Equilibrium Lohse. This assignment method
models the learning process of road users using the network. The first iteration step is an ‘all or
nothing’ assignment, which means that all trips are assigned onto the lowest impedance route
(route with the lowest generalised cost) of the unloaded network. No congestion or delay is taken
into account in the route choice for each trip.
In each subsequent iteration, the new lowest impedance route for each OD pair is found. Drivers
make use of information gained during their previous trips for the new route search and all known
‘shortest’ routes are searched for in an iterative process. For the route search the impedance is
deduced from the impedance of the current volume and the estimated impedance from the
previous iteration step. In other words the route search estimates delay based on impedance in
the previous iteration and uses this to inform the new route choice.
The assignment terminates when a stable solution is calculated and user equilibrium is reached.
When equilibrium conditions have been reached, no user can further reduce the impedance of
their trip by switching route.

AECOM Maynooth Traffic Management Plan and Traffic Model
Kildare County Council Traffic Modelling Report
Page 36
3.6 Estimation of Annual Average Daily Traffic (AADT)
To estimate the Annual Average Daily Traffic (AADT), conversion rates were developed which allowed the extrapolation of AM and PM peak hour traffic flows to AAWT, using a calculated conversion factor then from AAWT to AADT:
Regression analysis, based on data from TMU’s located within the study area, was used to generate the equation outlined above. In order to assess the accuracy of the AM and PM Peak hour expansion factors to AADT a comparison of observed and modelled 2014 & 2015 AADTs has been undertaken in Table 3.1. Table 3.1 - Accuracy of AM, Inter & PM Peak Hour Expansion Factors to AADT
TII TMU
AADT
Accuracy Observed Modelled
TMU 20041 2014 49,281 50,343 -2.2%
TMU 20041 2015 50,690 50,405 0.6%
TMU 20042 2014 35,798 35,645 0.4%
TMU 20042 2015 37,586 36,996 1.6%
The table above shows that the expansion factors used to estimate AADT from AM and PM peak hour models leads to accurately modelled AADT forecasts.
2.20 * (a + b) = LV AAWT
2.81 * (x + y) = HV AAWT
(LV AAWT) * 0.96 = LV AADT
(HV AAWT) * 0.82 = HV AADT
LV AADT + HV AADT = Total AADT
Where,
a = AM Peak Period LV Demand, x = AM Peak Period HV Demand
b = PM Peak Period LV Demand, y = PM Peak Period HV Demand

AECOM Maynooth Traffic Management Plan and Traffic Model
Kildare County Council Traffic Modelling Report
Page 37
Chapter 4
Model Calibration & Validation

AECOM Maynooth Traffic Management Plan and Traffic Model
Kildare County Council Traffic Modelling Report
Page 38
4 Model Calibration & Validation
4.1 Introduction
Following the development of the base year models, the process of calibrating and validating the
models was undertaken.
4.2 Calibration
The purpose of model calibration is to ensure that the model assignments reflect the existing
travel situation. Calibration is an iterative process, whereby the model is continually revised to
ensure that base year conditions are accurately represented.
4.2.1 Matrix Estimation
Matrix Estimation (ME) is the process in which the number of trips assigned along a model link is
adjusted to match an observed total. ME can be undertaken manually through select link (flow
bundle) analysis or through the “TFlow Fuzzy” matrix estimation tool provided in VISUM. “TFlow
Fuzzy” is designed to automatically adjust trip matrices to match modelled volumes to observed
volumes along multiple links or turns.
The Maynooth STM’s were calibrated utilising flow bundle analysis as it allowed greater control
over the calibration process than “TFlow Fuzzy”. Flow bundle matrices were extracted, examined
and subsequently adjusted to match observed flows both up and downstream of the point at
which the flow bundle was taken.
4.2.2 Calibration Criteria
The model calibration process has been undertaken based on the requirements of the TII PAG
Unit 5.2: Construction of Traffic Models and with reference to the calibration criteria outlined in
Table 5.2.2 of that document. The PAG specifies the acceptable values for modelled and
observed flow comparisons and suggests how calibration should relate to the magnitude of the
values being compared. A summary of these targets is shown in Table 4.1 below.
Table 4.1 - Model Calibration Criteria: Individual Flows
Criteria & Measures Guideline
Assigned Hourly Flows (e.g. links or turning movements) vs. Observed Flows:
Individual flows within 100 vph for flows <700 vph
>85% of cases Individual flows within 15% for flows 700 – 2700 vph
Individual flows within 400 vph for flows > 2700
The standard method used to compare modelled values against observations on a link involves
the calculation of the Geoff E. Havers (GEH) statistic (Chi-squared statistic), incorporating both
relative and absolute errors. The GEH statistic is a measure of comparability that takes account
of not only the difference between the observed and modelled flows, but also the significance of
this difference with respect to the size of the observed flow. The GEH statistic is calculated as
follows:

AECOM Maynooth Traffic Management Plan and Traffic Model
Kildare County Council Traffic Modelling Report
Page 39
𝑮𝑬𝑯 = √(𝑴 − 𝑶)𝟐
𝟎. 𝟓(𝑴 + 𝑶)
Where M = Modelled Flow and O = Observed Flow.
Guidance in the PAG sets out the following criteria in relation to GEH values:
Table 4.2 - Model Calibration Criteria: GEH Values
Criteria and Measures Requirement
GEH statistic Individual flows: GEH < 5 > 85% of cases
4.2.3 Calibration Results
A total of 44 links flows and 77 turning flows were used in the calibration process, the results of
which are summarised in Tables 4.3 - 4.6. The results in full can be found in Appendix B of this
report.
Table 4.3 - Link Calibration Results: Individual Flows
% of Calibration Sites Meeting Individual Flow Criteria
Time Period Link Flows
Required Total Traffic Lights Heavies
AM Peak 96% 93% 98% >85%
PM Peak 96% 93% 98% >85%
Table 4.4 - Link Calibration Results: GEH Values
% of Calibration Sites with GEH < 5
Time Period Link Flows Required
Total Traffic Lights Heavies
AM Peak 96% 96% 87% >85%
PM Peak 98% 98% 93% >85%
Table 4.5 - Turn Calibration Results: Individual Flows
% of Calibration Sites Meeting Individual Flow Criteria
Time Period Link Flows Required
Total Traffic Lights Heavies
AM Peak 100% 96% 100% >85%
PM Peak 95% 94% 100% >85%
Table 4.6 - Turn Calibration Results: GEH Values
% of Calibration Sites with GEH < 5
Time Period Link Flows
Required Total Traffic Lights Heavies
AM Peak 96% 96% 100% >85%
PM Peak 89% 89% 100% >85%

AECOM Maynooth Traffic Management Plan and Traffic Model
Kildare County Council Traffic Modelling Report
Page 40
The comparison of modelled and observed flows demonstrates that the AM and PM Peak period
models match the flow criteria for all user classes. Likewise, the GEH results show that the AM
Peak and PM Peak periods models also match the criteria for all user classes. The results
therefore confirm that the models have been calibrated to a standard compliant with the PAG
criteria for all user classes and all time periods.
4.2.3 Trip Length Distribution Check
The output trip matrix from the matrix estimation process must be checked to ensure that the
process has not significantly altered trip distribution. It is possible that in seeking to increase the
flow along a particular link, that the matrix estimation process might add significant numbers of
short trips between the two zones at either end of the link in question. This could have the effect
of creating excessive short distance trips while longer distance trips are unaffected, which in turn
would push the trip distance distribution toward short trips.
To check the output of the matrix estimation process, the Trip Length Distributions (TLD) from
before (pre) and after (post) matrix estimation are compared. The TLD for each peak hour for
Light Vehicles are represented as histograms in Figure 4.1 and 4.2.
Figure 4.1 - TLD AM Peak Hour (LV)
0
0.05
0.1
0.15
0.2
Pro
po
rtio
n o
f T
rip
s
Trip Length (km)
AM Peak Uncalibrated
AM Peak Calibrated

AECOM Maynooth Traffic Management Plan and Traffic Model
Kildare County Council Traffic Modelling Report
Page 41
Figure 4.2 - TLD PM Peak Hour (LV)
In undertaking the matrix calibration process for Maynooth it was noted that the proportion of
short distance trips in the distance bands 2 km to 4 km and 4 km to 6 km decreased in each of
the AM and PM peak demand matrices. However this was not a concern in this instance as Zone
490 (which has a radius of circa 5km) was disaggregated into 45 sub-zones in the model building
process. A large volume of internals trips was noted in the ANPR surveys and the pre calibration
matrices were developed to reflect these internal trips between the sub zones. A quantum of
existing internal trips were present in the original demand matrices from the NTM. This resulted
in a double counting of some short distance trips, which then had to be reduced in the calibration
process. Overall the TDL figures illustrate that the TLD has not been significantly altered as a
result of matrix estimation.
4.3 Model Validation
Model validation comprises the comparison of calibrated flows against an independent dataset
which was not used as part of the calibration process. Validation checks included:
Additional link flows;
Turning flow validation; and
Overall model validation (e.g. journey times)
The model was also checked against the OD data collected as part of the ANPR and used as
part of matrix development though this is not required under PAG guidance.
4.3.1 Validation of Link Flows
A total of 22 observed and modelled link flows were compared at a number of validation sites
which were kept exclusive of the calibration data, in accordance with the criteria above. The
permissible difference was calculated for each value (based on the observed figure) and
compared with that which had been modelled. Validation results are included in Appendix C and
are summarised in Tables 4.7 and 4.8.
0
0.05
0.1
0.15
0.2P
rop
ort
ion
of
Tri
ps
Trip Length (km)
PM Peak Uncalibrated
PM Peak Calibrated

AECOM Maynooth Traffic Management Plan and Traffic Model
Kildare County Council Traffic Modelling Report
Page 42
Table 4.7 - Validation Results: Individual Flows
% of Validation Sites Meeting Individual Flow Criteria
Time Period Link Flows
Required Total Traffic Lights Heavies
AM Peak 92% 92% 100% >85%
PM Peak 100% 100% 100% >85%
Table 4.8 - Validation Results: GEH Values
% of Validation Sites with GEH < 5
Time Period Link Flows Required
Total Traffic Lights Heavies
AM Peak 92% 92% 92% >85%
PM Peak 100% 100% 192% >85%
A comparison against the validation counts shows that the AM and PM Peak period models all
exceed the PAG requirements for the validation of traffic flow on links. Likewise, all models
exceed the GEH criteria of 85%. The results therefore demonstrate that the validation criteria as
set out by TII in the PAG are successfully met by all models.
4.3.2 Validation of Turning Flows
A further 34 observed and modelled turning flows were compared at each of the validation sites
in accordance with the criteria above. The permissible difference was calculated for each value
(based on the observed figure) and compared with that which had been modelled. Validation
results are included in Appendix C and are summarised in Tables 4.9 and 4.10 below.
Table 4.9 - Validation Results: Turning Flows
% of Validation Sites Meeting Individual Flow Criteria
Time Period Link Flows
Required Total Traffic Lights Heavies
AM Peak 98% 98% 100% >85%
PM Peak 96% 93% 100% >85%
Table 4.10 - Validation Results: GEH Values
% of Validation Sites with GEH < 5
Time Period Link Flows
Required Total Traffic Lights Heavies
AM Peak 87% 87% 100% >85%
PM Peak 87% 87% 100% >85%
A comparison against the validation turning counts shows that all the models exceed the PAG
requirements for the validation of traffic flow. Likewise, all models exceed the GEH criteria of
85%. The results therefore demonstrate that the validation criteria as set out by TII in PAG are
successfully met by all models.

AECOM Maynooth Traffic Management Plan and Traffic Model
Kildare County Council Traffic Modelling Report
Page 43
4.3.3 Validation of Journey Times
As part of the validation process, the modelled journey times were compared against the
surveyed journey times to ensure the model gave a reasonable representation of existing
conditions. The results of the journey time validation are presented in tables 4.11 to 4.12 for the
AM and PM peak hours respectively, for the journey time routes shown previously in Figure 2.6.
Table 4.11 - AM Peak Modelled/Observed Journey Times
Route Description Direction
Average Duration (min:sec)
ABS Diff %
Diff Validated
Observed AM
Modelled AM
A
R148 & R406 through Maynooth
Northbound
00:08:43
00:09:02 00:00:19 4%
Southbound 00:10:58 00:10:00 00:00:58 9%
B
R405 & Moyglare Road through Maynooth
Northbound 00:10:52 00:10:00 00:00:52 8%
Southbound 00:10:23 00:10:28 00:00:05 1%
C
R408 & Dunboyne Road Through Maynooth
Eastbound 00:09:37 00:11:57 00:02:20 24%
Westbound 00:10:33 00:08:57 00:01:36 15%
D R148 through Maynooth
Eastbound 00:08:24 00:09:42 00:01:18 15%
Westbound 00:08:30 00:08:30 00:00:00 0%
Percentage Validated 87.5%
Table 4.12 - PM Peak Modelled/Observed Journey Times
Route Description Direction
Average Duration (min:sec)
ABS Diff %
Diff Validated
Observed AM
Modelled AM
A R148 & R406 through Maynooth
Northbound 00:08:37 00:09:04 00:00:27 5%
Southbound 00:11:06 00:09:49 00:01:17 12%
B
R405 & Moyglare Road through Maynooth
Northbound 00:09:36 00:10:08 00:00:32 6%
Southbound
00:08:59 00:10:10 00:01:11 13%
C
R408 & Dunboyne Road Through Maynooth
Eastbound 00:12:46 00:09:43 00:03:03 24%
Westbound
00:12:42 00:11:11 00:01:31 12%
D R148 through Maynooth
Eastbound 00:09:29 00:09:18 00:00:11 2%
Westbound 00:10:32 00:09:06 00:01:26 14%
Percentage Validated 87.5%
All models satisfy the PAG requirement that 85% of all modelled journey times are within 15% of
observed data or within 1 minute if higher than 15%. As such, the base year models are

AECOM Maynooth Traffic Management Plan and Traffic Model
Kildare County Council Traffic Modelling Report
Page 44
considered validated to the requirements of PAG Unit 5.2: Construction of Transport Models in
terms of journey times.
4.4 Comparison of Traffic Patterns
Although not required under PAG guidance, the routing of traffic though the study area was
checked against the results from the OD surveys outlined in Section 2.4.3. The difference
between observed and modelled traffic patterns are presented in Tables 4.13 – 4.14 below for
both light and heavy vehicles.
Whilst no guidelines exist on the validation of OD patterns, a target of +/- 20% was used as a
target deviation limit. The tables below show that all of OD pairs are within the +/- 20% target
value. There were a number of instances in which the +/- 20% criteria was slightly exceeded as a
result of matrix manipulation to meet the calibration criteria. Each of these instances was
amended in the matrices, and afterwards the calibration criteria were rechecked.

AECOM Maynooth Traffic Management Plan and Traffic Model
Kildare County Council Traffic Modelling Report
Page 45
Table 4.13 - Comparison of AM Peak Traffic Patterns
490009 490011 490008 490003 490025 490002 490042 490010 490038 490034 490037 490005 490029 490024 490021 490019 490004 1009 Average
490009 - -1% -3% 0% -2% 0% 0% -9% 0% 0% 11% 9% -3% -3% 0% 0% 6% 12% 1%
490011 -3% - 3% -1% 14% -1% 0% -8% 0% 0% -9% 2% 0% 3% -1% 2% -1% 0% 0%
490008 -12% 5% - 0% -2% -1% 0% -2% 0% 2% -13% -2% -1% -3% -1% 0% -2% 0% -2%
490003 0% -11% 0% - 3% 1% 0% -11% 0% 2% 2% 8% 0% 0% 0% 0% 0% 1% 0%
490025 -2% 0% -13% 0% - -1% 0% 3% 0% 3% -5% 5% -3% -3% -1% 0% 1% 2% -1%
490002 -8% 0% 1% 13% 8% - 0% -3% 0% 1% -2% -2% 1% 1% 1% -1% 0% -2% 0%
490042 0% 0% 9% 0% 0% -3% - 1% 2% 1% 0% 0% 0% 0% 0% 0% 0% 0% 1%
490010 -2% -4% -9% 0% 0% -1% 0% - 0% -2% -9% -2% 3% 6% -2% 1% -1% 18% 0%
490038 0% 0% -3% 0% 0% 5% 0% -5% - 0% -13% -4% 0% 2% 3% 0% 0% -3% -1%
490034 3% -1% -3% 8% 5% 0% 0% -10% 0% - -3% -1% -2% -1% -2% 0% 1% -4% -1%
490037 -4% -1% -20% 0% 7% -4% 0% -8% -1% 0% - 18% 0% 0% 0% 0% 2% 0% -1%
490005 -7% -3% -10% 0% -5% 0% 0% -11% 0% -3% 16% - -1% -5% -2% 0% 3% 0% -2%
490029 0% 0% -7% 0% -6% 0% 0% 0% 0% -4% -17% -1% - 11% 0% 14% 0% 1% 0%
490024 16% 0% 2% 0% -3% 0% 0% -4% -3% -3% -2% -9% 2% - -7% 2% -3% 16% 0%
490021 -5% 0% -7% 0% -5% 0% 0% -2% 0% 0% 0% 5% 0% 0% - 0% 0% 1% -1%
490019 -11% 0% 5% 0% -3% 0% 0% -4% 0% 0% -14% -3% 0% 16% 0% - 0% 2% -1%
490004 -8% -3% -19% 0% -2% -4% 0% -2% -1% -1% -1% 2% -2% -2% -1% 0% - 19% -1%
1009 3% -1% -11% 0% 3% -2% 0% 1% 0% 4% -2% 9% 0% -2% -3% 0% 5% - 0%
Average -2% -1% -5% 1% 1% -1% 0% -4% 0% 0% -4% 2% 0% 1% -1% 1% 1% 4% 0%
AM
Destination Zone
Ori
gin
Zo
ne

AECOM Maynooth Traffic Management Plan and Traffic Model
Kildare County Council Traffic Modelling Report
Page 46
Table 4.14 - Comparison of PM Peak Traffic Patterns
490009 490011 490008 490003 490025 490002 490042 490010 490038 490034 490037 490005 490029 490024 490021 490019 490004 1009 Average
490009 - -2% -8% 0% 1% -6% 0% -1% 0% 4% 3% -7% -4% -6% 0% 1% -15% 9% -2%
490011 -7% - 9% 0% 0% -4% 0% -7% -3% 7% -1% -5% -1% -2% -2% -2% -10% 1% -2%
490008 -3% 0% - 0% 0% 4% 7% -2% 0% 0% -9% -7% -2% -4% 0% -1% -15% 1% -2%
490003 0% 0% 0% - 0% -3% 0% 0% 0% 19% -7% 0% 0% 0% -7% 0% -7% 3% 0%
490025 -9% -1% -9% 0% - -1% 0% -2% -1% 5% -3% -6% -3% -7% 2% 0% -8% 3% -2%
490002 -4% -2% -14% 3% -1% - 18% -2% 2% 0% -5% -1% -3% -13% -1% 0% -7% -4% -2%
490042 0% 0% 0% 0% 0% 0% - 0% 0% 0% 0% 0% 0% 0% 0% 0% 0% 0% 0%
490010 -10% -5% -5% -1% 6% -5% 0% - -1% 4% -5% -5% -1% 7% -3% 2% 2% 19% 0%
490038 0% 0% -6% 0% 4% 0% 2% -6% - 0% -14% -6% -12% -12% -6% 0% 1% -5% -4%
490034 0% 0% 2% -1% 5% -13% 1% 1% 0% - -2% -10% 1% -12% 0% 0% -7% 6% -2%
490037 -8% -4% -19% 6% 3% -3% 0% -6% -2% 11% - 17% -1% -8% 8% -1% 0% 0% 0%
490005 -4% -6% -12% 2% 3% -1% 0% -2% -2% 0% 15% - -1% -7% 0% 0% -9% 6% -1%
490029 0% 0% -12% 0% 0% -9% 0% 12% 0% 0% 13% -20% - 0% 0% 0% -4% 0% -1%
490024 -12% 3% -19% 0% 0% -7% 0% 17% 1% -6% -4% -16% 4% - -1% 18% -4% 18% -1%
490021 -6% -2% -9% 0% 0% 1% 0% -8% 2% 2% -1% -4% 0% 1% - 0% -2% 13% -1%
490019 -5% 2% -19% 0% 2% -4% 0% 1% -5% 17% -5% 0% 18% -14% -5% - 0% 0% -1%
490004 -2% -5% -12% 0% 12% -6% 0% -3% -2% 1% 2% -7% -3% -8% -3% 0% - 13% -1%
1009 -9% -4% -9% 0% 6% -12% -1% 9% -1% 0% 0% -1% 1% 16% -2% 1% 15% - 0%
Average -5% -2% -8% 1% 2% -4% 2% 0% -1% 4% -1% -5% 0% -4% -1% 1% -4% 5% -1%
PM
Ori
gin
Zo
ne
Destination Zone
AECOM Maynooth Traffic Management Plan and Traffic Model
Kildare County Council Traffic Modelling Report
Page 47
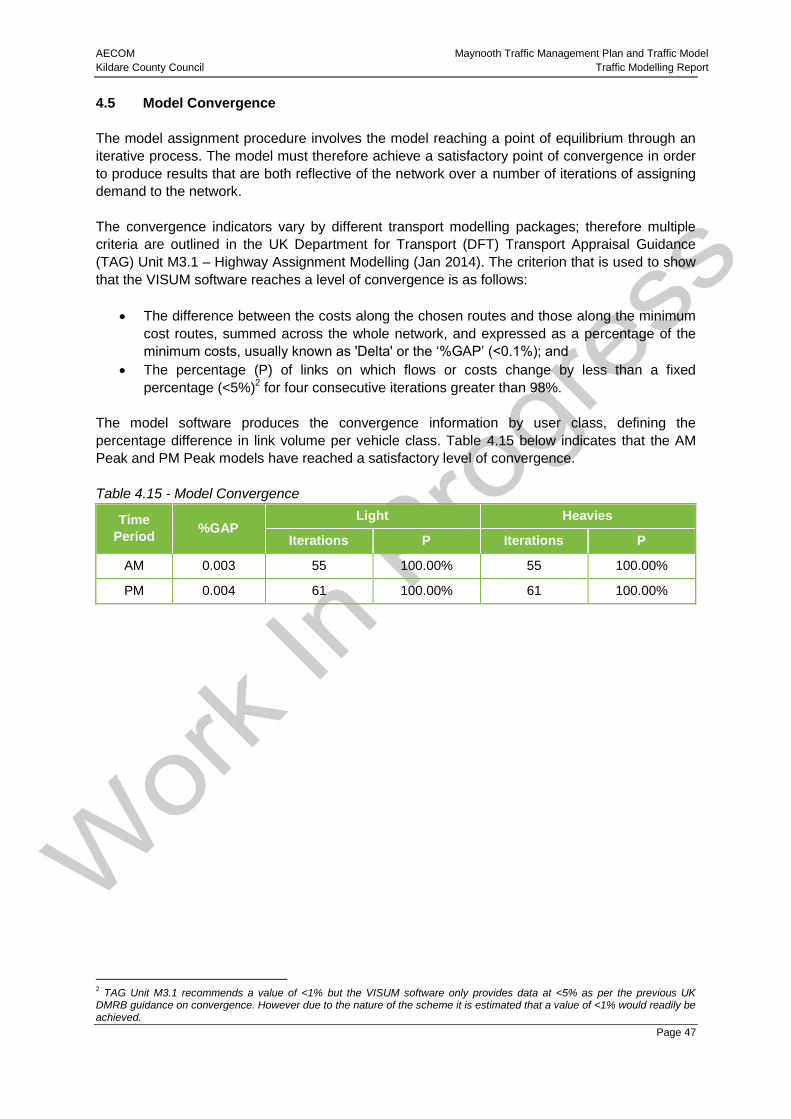
4.5 Model Convergence
The model assignment procedure involves the model reaching a point of equilibrium through an
iterative process. The model must therefore achieve a satisfactory point of convergence in order
to produce results that are both reflective of the network over a number of iterations of assigning
demand to the network.
The convergence indicators vary by different transport modelling packages; therefore multiple
criteria are outlined in the UK Department for Transport (DFT) Transport Appraisal Guidance
(TAG) Unit M3.1 – Highway Assignment Modelling (Jan 2014). The criterion that is used to show
that the VISUM software reaches a level of convergence is as follows:
The difference between the costs along the chosen routes and those along the minimum
cost routes, summed across the whole network, and expressed as a percentage of the
minimum costs, usually known as 'Delta' or the ‘%GAP’ (<0.1%); and
The percentage (P) of links on which flows or costs change by less than a fixed
percentage (<5%)2 for four consecutive iterations greater than 98%.
The model software produces the convergence information by user class, defining the
percentage difference in link volume per vehicle class. Table 4.15 below indicates that the AM
Peak and PM Peak models have reached a satisfactory level of convergence.
Table 4.15 - Model Convergence
Time
Period %GAP
Light Heavies
Iterations P Iterations P
AM 0.003 55 100.00% 55 100.00%
PM 0.004 61 100.00% 61 100.00%
2 TAG Unit M3.1 recommends a value of <1% but the VISUM software only provides data at <5% as per the previous UK
DMRB guidance on convergence. However due to the nature of the scheme it is estimated that a value of <1% would readily be achieved.

AECOM Maynooth Traffic Management Plan and Traffic Model
Kildare County Council Traffic Modelling Report
Page 48
Chapter 5
Future Year Demand Development

AECOM Maynooth Traffic Management Plan and Traffic Model
Kildare County Council Traffic Modelling Report
Page 49
5 Future Year Model Development
5.1 Introduction
This section of the report summaries the development of the future year traffic models for the
Maynooth Traffic Management Plan. Full details on the process can be found in the Future Year
Forecasting & Demand Allocation - Technical Note 1 contained in Appendix D of this report.
The future years models developed were (+ 5 years) 2021 and (+10 years) 2031. These years
were selected as they complied with guidance provided on forecast assessment years outlined in
TII’s Traffic and Transport Assessment (TTA) Guidelines 2014.
5.2 Future Year Matrix Development
5.2.1 Overview
The future years for the Maynooth STM are 2021 and 2031. As it was a requirement of the study
that the zone structure of the Maynooth STM was compatible with both TII’s NTM and the NTA’s
ERM future year traffic growth projections were developed for three potential growth projection
scenarios namely:
The projections inherent in the NTpM future year models;
The projections inherent in the ERM future year models; and
Projections developed by KCC based on the land use zonings and forecasts contained
within the Maynooth Local Area Plan 2013 to 2019 and the Draft Kildare County
Development Plan (CDP) 2017 – 2023.
The KCC growth projections scenario was developed based on the land-use zoning information
provided by KCC covering the periods: 2016 to 2021, and 2021 to 2031. It is worth noting however
that the actual full development zoned lands contained within the Maynooth Local Area Plan 2013
to 2019 and the Draft Kildare County Development Plan (CDP) 2017 – 2023 will likely occur at a
point beyond the horizon of the current plans.
5.3 Maynooth Area Future Development
5.3.1 Land Use Zonings Maynooth
The future land use zoning objectives of the Maynooth Local Area Plan 2013 to 2019 outline the
spatial locations throughout Maynooth where future land-use is anticipated and accordingly zoned.
Figure 5.1 below refers. These land-use zonings together with growth projections outlined in the
Draft Kildare CDP 2017-2023 formed the basis of the future land use development forecasts in the
Maynooth area as outlined by KCC.

AECOM Maynooth Traffic Management Plan and Traffic Model
Kildare County Council Traffic Modelling Report
Page 50
Figure 5.1: Maynooth LAP Land Use Zonings
5.3.2 Population Projections and Assumptions
The core strategy for the Draft Kildare CDP 2017-2023 proposes a population increase in
Maynooth of 5,786 for a 9 year horizon, i.e. a population growth of 642 people per annum from
2017 - 2026. Based on data as supplied by KCC it was considered reasonable to use this figure of
642 people per annum to estimate population increases for 2021 and 2031. The estimated
population growth projections are shown in Table 5.1 below.
Table 5.1 -: Population Projections for 2021 and 2031 Maynooth
Year Population Population Increase (642 per annum)
2016 13,210 -
2021 16,420 + 3210
2031 22,840 + 6420

AECOM Maynooth Traffic Management Plan and Traffic Model
Kildare County Council Traffic Modelling Report
Page 51
5.3.3 Non-Residential Land Use Projections
The zoning objectives of the Maynooth LAP 2013 to 2019 and the Draft Kildare CDP 2017-2023 as
they relate to the Maynooth study area and the quantum of zoned lands (hectares) for non-
residential land uses are presented in Table 5.2 below.
Table 5.2 - Maynooth Quantum of Zoned Lands
Other Future Land Use Type 2021 2031
Secondary School 2 schools*
Office 75.5 ha** 70.2 ha****
Industrial 2.9 ha 2.9 ha
Warehousing 3.2 ha***
Community 0.7 ha
* Planning permission 13/828 granted for two post-primary schools with capacity for 2,000 pupils
** 73.2 hectares zoned for Research and Technology. No permission granted – this is a long term strategic
employment site, post 2021.
*** 3.2 ha ‘Warehousing’ also included under ‘Office’
**** Includes 59 hectares zoned for Research and Technology at Collinstown.
In order to estimate the potential impact of the zoning objectives set out in Table 5.2, in terms of
the generation of additional traffic, the following methodology was applied:
KCC’s Planning Department were consulted to ascertain their estimation of the future land use projections for each of the zones within the STM and anticipated build out date for the land use projections;
Trip rates associated with the population growth and land use quanta as indicated in Tables 5.1 and 5.2 were established using the TRICS database and Trip Rates synthesised by AECOM for use in similar land use and transport studies;
These trips rates were then applied to the quantum of undeveloped lands as specified by KCC’s Planning Department.
5.3.4 Maynooth University Growth
Forecasts were obtained from Maynooth University for an anticipated growth from 9,000 students
(in 2016) to 18,000 students by 2031. Using this information it was estimated that the traffic
demand at Maynooth University would likely double in the period 2016 to 2031. Using a linear
interpolation between the existing 2016 demand at Maynooth University and the forecast 2031
demand a future demand projection for 2021 was estimated. The additional demand for the
Maynooth University zone was added to the future forecast 2021 and 2031 demand matrices.

AECOM Maynooth Traffic Management Plan and Traffic Model
Kildare County Council Traffic Modelling Report
Page 52
5.4 Future Land Use Projections & Associated Traffic Generation
5.4.1 Future Land Use Projections - Kildare County Council
In order to simplify the matching of future land use projections (both residential and other future
land use) with the disaggregated Maynooth STM zone structure, AECOM worked with KCC to
develop a future land use matrix of the STM zones numbers set against a range of typical land use
types. The land use types corresponded with the planning data received from KCC and the zoning
objectives of the Maynooth LAP 2013 to 2019 and the Draft Kildare CDP 2017 – 2023. These land
use types and their units of measurement are specified in Table 5.3 below.
Table 5.3 – Land use Types and Units of Measurement
Land use Type Measurement
Residential Population or No. of Units
Secondary School No. of Units
Office Site Area (ha/m2)
Industrial and Warehousing Site Area (ha/m2)
Retail Site Area (ha/m2)
Enterprise and Employment Site Area (ha/m2)
Community Site Area (ha/m2)
KCC’s Planning Department then populated the matrix with their future land use projections for
each zone in the STM and specified an anticipated build out date for each of the land use
projections.
5.2 Future Residential Development (KCC)
It is considered reasonable that up to the year 2021, 80% of all new population will be located in
areas where ‘new residential’ land is zoned and that the remaining 20% would be located on other
zoned lands where ‘residential’ would be permitted (Town Centre, Existing Residential & Infill). By
2026, it is assumed that the ‘new residential’ zoned lands will be built-out. Of the population
increase for the 10 year period 2021-2031, 45% is assigned to ‘new residential’ zoned land (to
reflect 2021-2026), 45% to ‘agricultural’ zoned land within the plan area (which could potentially be
re-zoned for residential purposes in future plans) and 10% to other zoned lands where ‘residential’
would be permitted (town centre, existing residential & infill). The calculations are set out in Table
5.4 below.

AECOM Maynooth Traffic Management Plan and Traffic Model
Kildare County Council Traffic Modelling Report
Page 53
Table 5.4 - Geographical Location of New Population (2021 and 2031 Maynooth)3
Year Population of
Maynooth
Population
Increase
(642 per
annum)
New Population
in STM’s with
Lands Zoned C
(New
Residential
Areas)
New Population
in STM’s with
lands Zoned
A1, A2 and B
New Population
in STM’s with
Lands Zoned I
(Agriculture)
2016 13,210 - - - -
2021 16,420 + 3210
2568
(80% of new
population)
642
(20% of new
population)
0
2031 22,840 + 6420
2889
(45% of new
population to the
year 2026 only)
642
(10% of
population
increase)
2889
(45% of
population
increase post
2026)
5.3 Future Employment Development
In the absence of future jobs forecasts for Maynooth it was necessary for AECOM to develop a
number of assumptions regarding future employment development based on information from the
Draft Kildare CDP 2017 – 2023 and information supplied by KCC’s Planning Department in relation
to future population growth projections and future land use data (as described above). Based on
section 5.2.3 of the Draft Kildare CDP 2017 – 2023, the following high level data was extracted:
A jobs to population ratio of 0.7 is assumed;
The total Kildare labour force will increase by as much as 126,800 by 2023 (50% of population).
AECOM developed a set of high level assumptions regarding future employment development
based on the assumption that the jobs ratio and ratio of labour force to population increase hold
true for both 2021 and 2031. Furthermore, it is assumed that these countywide assumptions for
Kildare apply to the Maynooth area. Table 5.5 below sets out future employment projections for the
Maynooth area based on the above assumptions on the labour force to population ratio and job
ratio in addition to the population projections supplied by KCC.
Table 5.5 – Maynooth Employment Projections
2016 2021 2031 2016 -
2021
2021 -
2031
Population 13,210 16,420 22,840 3,210 6,420
Estimated Labour Force 6,605 8,210 11,420 1,605 3,210
Estimated Number of Jobs 4,624 5,747 7,994 1,124 2,247
Table 5.5 demonstrates that the projected additional number of jobs in Maynooth in 2021 and 2031
will be, respectively, 1,124 and 2,247. The estimated number of new jobs required for the
Maynooth area (based on the population projections) is assumed to be distributed across the future
employment type land uses in 2021 and 2031 by the process described below.
3 Source: Kildare County Council Memorandum ‘Maynooth Future Growth Forecasts 2021 and 2031’,
17/11/2016.
AECOM Maynooth Traffic Management Plan and Traffic Model
Kildare County Council Traffic Modelling Report
Page 54
5.4 National Traffic Model Forecasts
Future year growth in the Maynooth STM external zones (i.e. volume of traffic entering and leaving
the model cordon) was applied based on the forecast data from TII’s NTM module of the National
Transport Model (NTpM). Furthermore, the forecasts based on KCC’s data were compared to
those generated by the NTM.
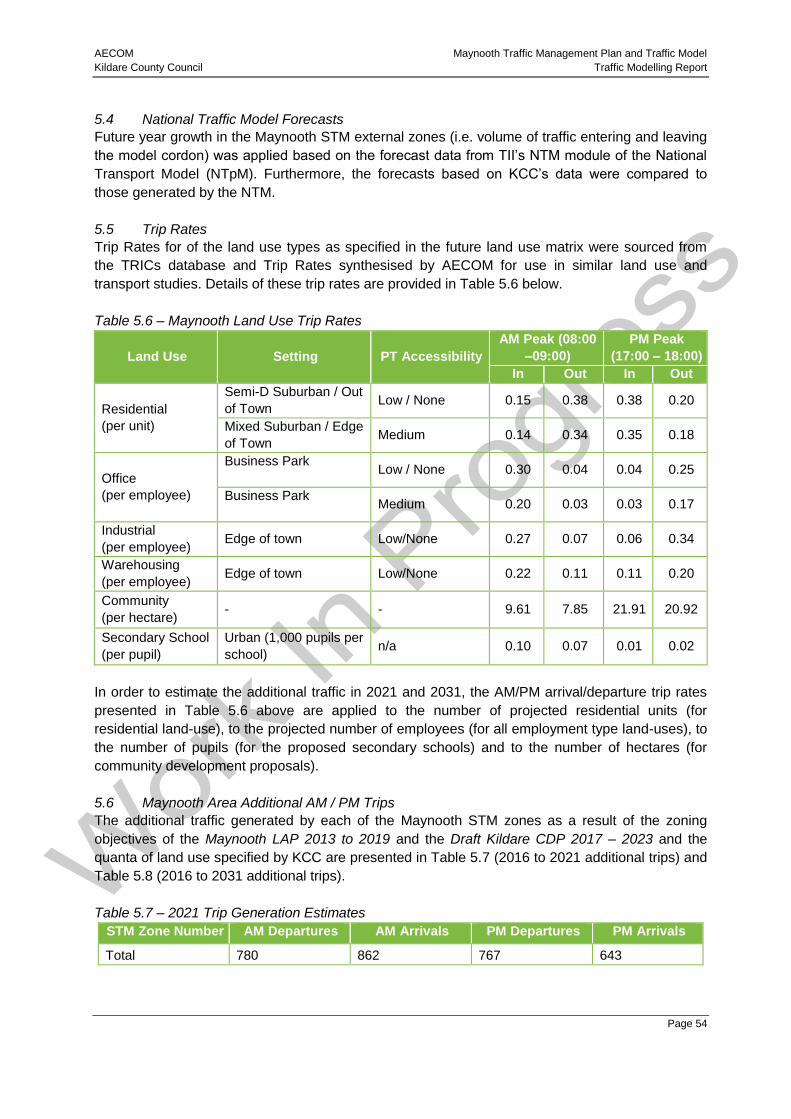
5.5 Trip Rates
Trip Rates for of the land use types as specified in the future land use matrix were sourced from
the TRICs database and Trip Rates synthesised by AECOM for use in similar land use and
transport studies. Details of these trip rates are provided in Table 5.6 below.
Table 5.6 – Maynooth Land Use Trip Rates
Land Use Setting PT Accessibility
AM Peak (08:00
–09:00)
PM Peak
(17:00 – 18:00)
In Out In Out
Residential
(per unit)
Semi-D Suburban / Out
of Town Low / None 0.15 0.38 0.38 0.20
Mixed Suburban / Edge
of Town Medium 0.14 0.34 0.35 0.18
Office
(per employee)
Business Park
Low / None 0.30 0.04 0.04 0.25
Business Park
Medium 0.20 0.03 0.03 0.17
Industrial
(per employee) Edge of town Low/None 0.27 0.07 0.06 0.34
Warehousing
(per employee) Edge of town Low/None 0.22 0.11 0.11 0.20
Community
(per hectare) - - 9.61 7.85 21.91 20.92
Secondary School
(per pupil)
Urban (1,000 pupils per
school) n/a 0.10 0.07 0.01 0.02
In order to estimate the additional traffic in 2021 and 2031, the AM/PM arrival/departure trip rates
presented in Table 5.6 above are applied to the number of projected residential units (for
residential land-use), to the projected number of employees (for all employment type land-uses), to
the number of pupils (for the proposed secondary schools) and to the number of hectares (for
community development proposals).
5.6 Maynooth Area Additional AM / PM Trips
The additional traffic generated by each of the Maynooth STM zones as a result of the zoning
objectives of the Maynooth LAP 2013 to 2019 and the Draft Kildare CDP 2017 – 2023 and the
quanta of land use specified by KCC are presented in Table 5.7 (2016 to 2021 additional trips) and
Table 5.8 (2016 to 2031 additional trips).
Table 5.7 – 2021 Trip Generation Estimates
STM Zone Number AM Departures AM Arrivals PM Departures PM Arrivals
Total 780 862 767 643

AECOM Maynooth Traffic Management Plan and Traffic Model
Kildare County Council Traffic Modelling Report
Page 55
Table 5.8 – 2031 Trip Generation Estimates
STM Zone Number AM Departures AM Arrivals PM Departures PM Arrivals
Total 1529 2045 1956 1381
The resultant additional trip generation (presented in Tables 5.7 and 5.8) were then added to
known 2016 traffic data for Maynooth in order to develop future demand origin and destination trip
ends for 2021 and 2031. Future year demand for external zones was assumed to be the same as
that given by TII’s NTM.
5.5 Allocation & Distribution of Future Growth
The additional trips for 2021 and 2031 were added to the base year (2016) known trip ends. Future
year trip distribution was undertaken utilising the furnessing distribution method. In order to carry
out the trip distribution process, it was first necessary to ‘seed’ the cells with no trips in the base
year matrices with very small numbers (0.01 vehicles) to allow for future year trips between those
specific cells. Otherwise any cell with a zero will remain zero irrespective of the factor applied. As
part of the trip distribution process the matrix totals were doubly constrained to the mean of the
forecast trip ends totals. The distribution of these trips was then based on that of the existing sub
zone or if the land use type had been updated significantly, a neighbouring zone of existing land
use type comparable to that of the updated zone.
5.6 Comparison of KCC Forecast to ERM and NTM
In order to ensure a robust forecasting approach was utilised in line with other similar projects the
trip generation estimates outlined in the tables above were compared to growth forecasts
contained in TII’s NTM and the NTA’s ERM.
Since the zone structure of the Maynooth STM is compatible with TII’s NTM the NTA’s ERM by
definition it was possible to compare the overall future light matrix totals based on the KCC, NTM
and ERM forecasts. The 2021 and 2031 forecasts for the NTM and ERM were based on a linear
interpolation of the demand in zones related to the Maynooth STM between the base year and
future year models. A per annum percentage growth rate was established from the examination of
the NTM and ERM linear interpolations and applied to develop 2021 and 2031 Maynooth STM
forecasts based on NTM and ERM forecasts respectively. Table 5.9 below outlines a comparison
of the NTM, ERM and KCC growth forecasts for Maynooth.

AECOM Maynooth Traffic Management Plan and Traffic Model
Kildare County Council Traffic Modelling Report
Page 56
Table 5.9 – Comparison of KCC Forecast to NTM and ERM Forecasts (LV)
Growth 2016 2021 2031
Growth
2016 – 2021
Growth
2016 - 2031
AM PM AM PM AM PM AM PM AM PM
KCC 16,532 17,142 18,490 18,999 22,237 22,782 11.8% 10.8% 34.5% 32.9%
NTM 16,532 17,142 18,079 18,737 21,772 22,545 9.4% 9.3% 31.7% 31.5%
ERM 16,532 17,142 17,717 18,513 20,748 21,851 7.2% 8.0% 25.5% 27.5%
Figure 5.2 and Figure 5.3 below compares the AM and PM matrix totals generated by each of the
growth forecasts for light vehicles. There is a clear correspondence between the KCC and TII
forecasts with the KCC forecast producing slightly higher growth overall (refer to Table 5.9).
Figure 5.2: Comparison of the KCC, NTM and ERM forecast for the AM Peak Period (LV)
16000
17000
18000
19000
20000
21000
22000
23000
24000
2016 2021 2031
Matr
ix T
ota
l
Year
KCC NTM ERM

AECOM Maynooth Traffic Management Plan and Traffic Model
Kildare County Council Traffic Modelling Report
Page 57
Figure 5.3: Comparison of the KCC, NTM and ERM forecast for the PM Peak Period (LV)
Table 5.10 below provides the future heavy vehicle (HV) matrix totals based on the KCC, NTM
and ERM forecasts. Once again the KCC forecasts closely correspond to the NTM and ERM
forecasts.
Table 5.10 – Comparison of KCC Forecast to NTM and ERM Forecasts (HV)
Growth
Forecast
2016 2021 2031 Growth
2016 – 2021
Growth
2016 - 2031
AM PM AM PM AM PM AM PM AM PM
KCC 944 944 1152 1141 1673 1652 22.0% 20.8% 77.3% 75.1%
NTM 944 944 1116 1116 1656 1656 18.2% 18.2% 75.4% 75.4%
ERM 944 944 1165 1068 2183 1585 23.4% 13.2% 131.3% 67.9%
The total growth in the Maynooth STM is based on the development zones and land use types
identified by KCC – the outcome of this process shows a good correspondence with the both TII’s
NTM and the NTA’s ERM growth forecasts as identified above. However based on KCC’s local
knowledge and close correspondence with both TII’s and the NTA’s forecast in the Maynooth
region, it was determined that KCC’s forecast was the most appropriate forecast to proceed with.
As a result, 2021 and 2031 demand matrices were developed based on the KCC forecast. Due to
the close correspondence between the zone structure of the Maynooth STM and the ERM, any
demand impacts associated with public transport proposals may be accounted for by applying a
percentage change in the forecast trip ends.
5.7 Future Year Matrix Analysis
The PAG requires a quantitative assessment of the impact of the traffic forecasting process to be
undertaken upon the following criteria:
Trip Length Distribution;
Trip End Growth; and
16000
17000
18000
19000
20000
21000
22000
23000
24000
2016 2021 2031
Matr
ix T
ota
l
Year
KCC NTM ERM

AECOM Maynooth Traffic Management Plan and Traffic Model
Kildare County Council Traffic Modelling Report
Page 58
Zone to Zone Growth.
5.7.1 Trip Length Distribution
Trip Length Distribution (TLD) graphs for the AM Peak and PM Peak (Light Vehicles) are illustrated
below for the KCC growth scenario. The figures compare the TLD in the 2016 Base Year models
and the 2031 Future Year Growth Do-Minimum models.
The purpose of comparing the TLD in the base and future year models is to assess the impact of
the trip distribution (furnessing) process. The proportions of trips in the various distance bands
should be similar between the base and future years. TLD graphs for AM Peak, Inter Peak and PM
Peak are shown respectively in Figures 5.4 and 5.5 below.
Figure 5.4 - AM Peak TLD (LV)
0
0.05
0.1
0.15
0.2
Pro
po
rtio
n o
f T
rip
s
Trip Length (km)
AM Peak 2016
AM Peak 2031

AECOM Maynooth Traffic Management Plan and Traffic Model
Kildare County Council Traffic Modelling Report
Page 59
Figure 5.5 - PM Peak TLD (LV)
Overall the TLD is similar between the Base and Design Year models in the AM and PM peak;
however some minor changes were noted as a result of the trip distribution process. It was noted
that short distance trips in the distance band 0 km to 2 km decreased in the AM and PM peaks and
that trips in the distance band 6 km to 8 km increased and 10 to 12 km in each of the peaks.
Checks were undertaken on these distance bands to ascertain the reasons for the increases in trip
volumes. In these distance bands the decrease in shorter distance trips in the distance band 0 km
to 2 km and the increase in trips from 6 to 8km in the AM and PM peak periods occurred as a result
of the forecast future land use growth in internal model zones as specified by KCC. The increase in
trips in the distance band 10 km to 12 km occurred as a result of increased growth forecast
increases in external to external zone growth as predicted by the NTM. The changes in the
distance bands were considered acceptable given the forecast future network conditions.
5.7.2 Trip End Growth
An assessment of the Trip End Growth (TEG) between the Base and Design Year demand in the
AM and PM Peak was undertaken to assess if there were any significant changes in demand at trip
end level when compared to the overall growth between the Base and Design Year demand.
The PAG guidance on the GEH statistic indicates that any GEH statistic above 10 warrants further
investigation. Of the 11 external zones 9 have a GEH greater than 10. This is reasonable as they
are large zones connecting to adjacent towns.
A total of 9 out of 45 internal zones in the model exceeded a GEH statistic of 10; these zones are
presented in Table 5.11 below. These zones were investigated to ascertain the reasons for the
large increases in growth in these zones. It was noted all cases that the large increase in growth
occurred as a forecast future land use in the zones. The larger growth predicted in these zones
was therefore considered acceptable given the forecast future network conditions.
0
0.05
0.1
0.15
0.2P
rop
ort
ion
of
Tri
ps
Trip Length (km)
AM Peak 2016
AM Peak 2031

AECOM Maynooth Traffic Management Plan and Traffic Model
Kildare County Council Traffic Modelling Report
Page 60
Table 5.11 - Model Calibration Criteria: Zones with TLD GEH Values above 10
Zone Future Land use Forecast (KCC)
490005 Maynooth University to increase from 9,000 to 18,000 students
490006 Residential zone, Population increase of 649
490011 Residential zone, Population increase of 803
490013 Residential zone, Population increase of 361
490014 Planning permission 13/828 granted for two post primary schools with capacity for 2,000 pupils
490016 Residential zone, Population increase of 725
490017 Residential zone, Population increase of 517
490021 3.2ha zoned for Office/light industry/warehousing & 2.9ha site zoned Office
490022 Residential zone, Population increase of 203
5.7.3 Zone to Zone Growth
The same procedure for TEG was also undertaken for zone to zone growth. The GEH statistic for
each origin-destination pair was assessed to show any significant outliers or issues in the AM Peak
and PM Peak demand. In the AM Peak and PM Peak 0.6% of zone to zone growth had a GEH
greater than 10. These zones were further investigated. All of these instances were external zones
and zones with increased demand shown in Table 5.11 above.

AECOM Maynooth Traffic Management Plan and Traffic Model
Kildare County Council Traffic Modelling Report
Page 61
Chapter 6
Future Year Scenario Assessment
AECOM Maynooth Traffic Management Plan and Traffic Model
Kildare County Council Traffic Modelling Report
Page 62
6 Future Year Scenario Assessment
6.1 Maynooth LAP Roads Objectives
The function of the Maynooth STM is to act as a tool that KCC can use to assess the relative
merits of the provision of new link roads and other infrastructure improvements within Maynooth
and of land use changes and associated traffic demand on the existing transport network in
Maynooth.
Within the Section 7.5.3 of the Maynooth LAP 2013 to 2019 a suite of Roads Objectives are
referenced, namely:
TRO 1: To carry out a study investigating the safety and capacity of the existing Straffan Road
M4 Interchange to establish whether an upgrade or new interchange working in tandem with
the existing one is required. In the event that a new interchange is required the location shall
be identified together with connections to the existing and proposed non-national road
network.
TRO 2: To facilitate the future construction of the following roads and in the interim protect
these routes from development:
a) Between the Straffan Road (A) and the Celbridge Road (B)
b) Between the Moyglare Road (C) and the County Boundary (D) (only a small section of
this road to the County Boundary has to be completed)
c) Between the Celbridge Road (B) and the Leixlip Road (E)
d) Between the Kilcock Road (F) and the Moyglare Road (C)
e) Between the Kilcock Road (F) and the Rathcoffey Road (G)
f) Between the Rathcoffey Road (G) and the Straffan Road (A)
g) Between the Dunboyne Road (H) and the Moyglare Road (I)
h) A new Street that will connect the Straffan Road (J) with Leinster Street (K) and onto
Parson Street (L)
TRO 3: To carry out the following road realignments and improvements at:
a) Sharp bend on Convent Lane
b) Along the Rathcoffey Road between the town boundary and Bond Bridge, where
necessary
c) Along sections of the Dunboyne Road
d) Pound Lane
e) Moneycooley Road
f) Kilcock road at Laraghbyran
g) Roundabout at Maynooth Business Park
h) Beaufield road, Rathcoffey road junction
i) Meadowbrook link road and the Straffan Road junction
TRO 4: To provide passive traffic calming measures throughout the town of Maynooth
where necessary, as funding allows.

AECOM Maynooth Traffic Management Plan and Traffic Model
Kildare County Council Traffic Modelling Report
Page 63
TRO 5: To carry out the following in relation to car parking:
a) Provide distinctly coloured disabled car parking spaces at appropriate locations
throughout the town.
b) Investigate the provision of additional off street public car parking in the town
centre.
c) Ensure the provision of permanent durable surfaces to all public and private car-
parking facilities.
d) Ensure adequate car parking spaces are provided in all new developments with
suitably sized oil/water interceptors
TRO 6: To ensure that the objectives of the Maynooth Traffic Management Plan (once
adopted) are delivered.
TRO 7: To include all signalised junction installations within the SCOOT/UTC system in place
within the area of the plan
Of the above mentioned objectives those mentioned under noted under objective TRO 2 constitute
new roads objectives. These new roads objectives are shown graphically in Figure 6.1 overleaf.
In order to assess the relative merits of the provision of these new roads AECOM worked with KCC
to develop three future year Do Something scenarios which were assessed in the Maynooth STM
2021 and 2031 future year models. The future year Do Something scenarios assessed comprised
varying combinations of the TRO 2 new roads objectives and are outlined in the following sections
of this report.

AECOM Maynooth Traffic Management Plan and Traffic Model
Kildare County Council Traffic Modelling Report
Page 64
Figure 6.1: Maynooth LAP New Roads Objectives

AECOM Traffic Management Plan and Traffic Model for Maynooth
Kildare County Council Traffic Modelling Report – Base Year
Page 65
6.2 Future Year Scenarios Assessed
In assessing potential Do Something scenarios it is necessary to assess the range of Do
Something Scenarios against a baseline Do Nothing or Do Minimum Scenario. The Do Minimum
Scenario in this case was taken to be the existing road network with no improvement beyond
general maintenance.
Three potential Do Something scenarios were assessed. Do Something Scenarios 1 & 2 were
developed to assess the relative merits of constructing either an eastern or western of the Royal
Canal and Maynooth Rail Line. The Do Something 1 & 2 scenarios comprised varying
combinations of TRO 2 objectives (a) to (f). A third scenario, Do Something 3, was also developed
which assessed the merits of progressing the TRO 2 short term objectives (g) and (h).
Further detail on the Do Minimum Scenario and Do Something Scenarios are discussed in the
following sections.
6.3 Do-Minimum Network
A future year ‘Do-Minimum’ network should include the existing road network plus any committed
infrastructure improvements in the study area. As there are no significant road improvements
committed within the study area, the ‘Do-Minimum’ future network for the Maynooth Traffic
Management Plan consists of the existing road network, which is assumed to be maintained over
time.
6.4 Do Something Networks
Three scenarios were developed for assessment in the future year 2021 and 2031 models, namely:
Scenario 1 – Long Term Objectives – Progression of Eastern Orbital Route
Scenario 2 – Long Term Objectives – Progression of Western Orbital Route
Scenario 3 – Short Term Objectives
These options were modelled and assessed through the Maynooth STM’s. In assessing the
relative benefits of each option network statistics were extracted from the traffic models for each
scenario and a comparison was made between the Do-Minimum and the Do-Something Options
under consideration. The key network statistics comprised the following:
Total Network Travel Time (hours) for all vehicles;
Total Network Vehicle Kilometres (hrs) for all vehicles; and
Total Delay (hrs)
The three Do Something scenarios are detailed below.
6.4.1 Do Something Scenario 01 – Long Term Objectives –Eastern Orbital Route
Do Something Scenario 1 provides an Eastern Orbital Route beginning north of the Royal Canal on
the R148 Kilcock Road. The route provides a link from the R148 to the Moyglare Road north of
Maynooth University. The proposed road then continues eastwards joining with the R157 and
traveling southwards down to the R148 Leixlip Road. This scenario involves an eastern crossing of
the Royal Canal and Maynooth Rail Line connecting up with the R405. The final link of the Eastern
Orbital Route is a link form the R405 to the R406 north of the M4/R406 interchange. This final link

AECOM Traffic Management Plan and Traffic Model for Maynooth
Kildare County Council Traffic Modelling Report – Base Year
Page 66
is included in all Do Something modelled scenarios. Figure 6.2 below outlines the potential Eastern
Orbital Route assessed.
Figure 6.2 – Do Something Scenario 01 – Eastern Orbital Route

AECOM Traffic Management Plan and Traffic Model for Maynooth
Kildare County Council Traffic Modelling Report – Base Year
Page 67
6.4.2 Do Something Scenario 02 – Long Term Objectives –Western Orbital Route
Do Something Scenario 02 provides a Western Orbital Route and contains the same upgrades as
Scenario 01 from the R148 Kilcock Road connecting back to the R148 Leixlip Road. New links are
proposed from the R148 Kilcock Road to the R408 Rathcoffey Road and continuing on adjacent to
the M4 to link up with the R406 Straffan Road. Again the link from Straffan Road to the R405 is
modelled in this scenario. Figure 6.3 below outlines the potential Western Orbital Route assessed.
The results of the network statistics were compared for Scenario 01 and 02 to assess the relative
merits of constructing an eastern or western crossing of the Royal Canal and Maynooth Rail Line.
Figure 6.3 – Do Something Scenario 02 – Western Orbital Route

AECOM Traffic Management Plan and Traffic Model for Maynooth
Kildare County Council Traffic Modelling Report – Base Year
Page 68
6.4.3 Do Something Scenario 03 – Short Term Objectives
Do Something Scenario 03 assessed the shorter term TRO 2 objectives. A link from the Straffan
Road (R406) to the Celbridge Road (R405) is provided as in Do Something Scenarios 01 and 02.
An additional proposed link from Moyglare Road to Dunboyne Road is provided to alleviate the
amount of traffic passing through the town centre. Figure 6.4 below outlines the shorter term
objectives.
Figure 6.4 - Scenario 03 – Short Term Objectives

AECOM Traffic Management Plan and Traffic Model for Maynooth
Kildare County Council Traffic Modelling Report – Base Year
Page 69
6.5 Results
The following sections outline individually the results the analysis of each of the Do Something
Scenarios 01, 02 and 03 versus the Do Minimum scenarios in each of the future year 2021 and
2031 models. The assessment of the benefits of each scenario was developed based on the
impacts on the network performance parameters:
Total Network Travel Time (hours) for all vehicles;
Total Network Vehicle Kilometres (hrs) for all vehicles; and
Total Delay (hrs)
In addition to the network performance parameter assessment, volume difference plots were also
examined for each option versus the Do Minimum scenario. The figures below show difference
plots for each scheme. Traffic increases on road sections are represented in red whilst decreases
on particular road sections are shown in green.
A further comparison has also been undertaken in addition to the individual assessments. The
network performance parameters from the Do Something Scenarios 01 and 02, have been
compared to assess the relative merits of constructing an either and eastern or western crossing of
the Royal Canal and Maynooth Rail Line.
6.5.1 Do Something Scenario 01 Results
Figure 6.5 below presents the volume difference plot of Do Something Scenario 01 (Eastern Orbital
Route) versus the Do Minimum Scenario.
Figure 6.5 – Difference Plot 2021 – Do Something Scenario 01 vs Do Minimum
The proposed of the Eastern Orbital Route scheme is seen to provide significant benefits to the
local road network providing a level of congestion relief to nearly all of the main radial routes
leading into Maynooth, namely:
The R406 (Straffan Road);
The R148 (Kilcock and Leixlip Roads);
The R405 (Celbridge Road); and
The Moyglare Road

AECOM Traffic Management Plan and Traffic Model for Maynooth
Kildare County Council Traffic Modelling Report – Base Year
Page 70
Tables 6.1 to 6.4 below present the results of the network performance statistics analysis of Do
Something Scenario 01 (Eastern Orbital Route) versus the Do Minimum Scenario. The network
performance statistics analysis confirms that the Eastern Orbital Route would have a positive
impact on network performance with total network travel time and congestion related delay reduced
in both the AM and PM peak hours.
Table 6.1 – Do Something Scenario 01 Network Statistics – AM Peak 2021
Scenario Total Network
Trips
Total Distance
(km)
Total Travel
Time (hrs) Total Delay (hrs)
2021 DM AM 19,641 171,864 3,387 799
2021 DS1 AM 19,641 171,275 3,188 629
% change relative to Do Min
n/a 0.3% 5.9% 21.2%
Table 6.2 – Do Something Scenario 01 Network Statistics – PM Peak 2021
Scenario Total Network
Trips
Total Distance
(km)
Total Travel
Time (hrs) Total Delay (hrs)
2021 DM PM 20,140 175,459 3,423 789
2021 DS1 PM 20,140 174,911 3,282 674
% change relative to Do Min
n/a 0.3% 4.1% 14.6%
Table 6.3 – Do Something Scenario 01 Network Statistics – AM Peak 2031
Scenario Total Trips (Vehs/hr)
Total Distance (km)
Total Travel Time (hrs)
Total Delay (hrs)
2031 DM AM 23,892 213,620 4,646 1,360
2031 DS1 AM 23,892 210,547 4,364 1,140
% change relative to Do Min
n/a 1.4% 6.1% 16.1%
Table 6.4 – Do Something Scenario 01 Network Statistics – PM Peak 2031
Scenario Total Trips (Vehs/hr)
Total Distance (km)
Total Travel Time (hrs)
Total Delay (hrs)
2031 DM PM 24,435 217,206 4,757 1,414
2031 DS1 PM 24,435 214,582 4,515 1,225
% change relative to Do Min
n/a 1.2% 5.1% 13.4%

AECOM Traffic Management Plan and Traffic Model for Maynooth
Kildare County Council Traffic Modelling Report – Base Year
Page 71
6.5.2 Do Something Scenario 02
Figure 6.6 below presents the volume difference plot of Do Something Scenario 02 (Western
Orbital Route) versus the Do Minimum Scenario.
Figure 6.6 – Difference Plot 2021 – Do Something Scenario 02 vs Do Minimum
The proposed of the Western Orbital Route scheme is seen to provide significant benefits to the
local road network providing a level of congestion relief to all of the main radial routes leading into
Maynooth, namely:
The R406 (Straffan Road);
The R408 (Rathcoffey Road);
The R148 (Kilcock and Leixlip Roads);
The R405 (Celbridge Road); and
The Moyglare Road
Tables 6.5 to 6.8 below present the results of the network performance statistics analysis of Do
Something Scenario 02 (Western Orbital Route) versus the Do Minimum Scenario. Again the
network performance statistics analysis confirms that the Western Orbital Route would have a
positive impact on network performance with total network travel time and congestion related delay
recused in both the AM and PM peak hours. The Western Orbital Route is seen to provide more
congestion relief overall than the Eastern Orbital Route.
Table 6.5 – Do Something Scenario 02 Network Statistics – AM Peak 2021
Scenario Total Trips (Vehs/hr)
Total Distance (km)
Total Travel Time (hrs)
Total Delay (hrs)
2021 DM AM 19,641 171,864 3,387 799
2021 DS2 AM 19,641 169,903 3,165 600
% change relative to Do Min
n/a 1.1% 6.6% 24.8%
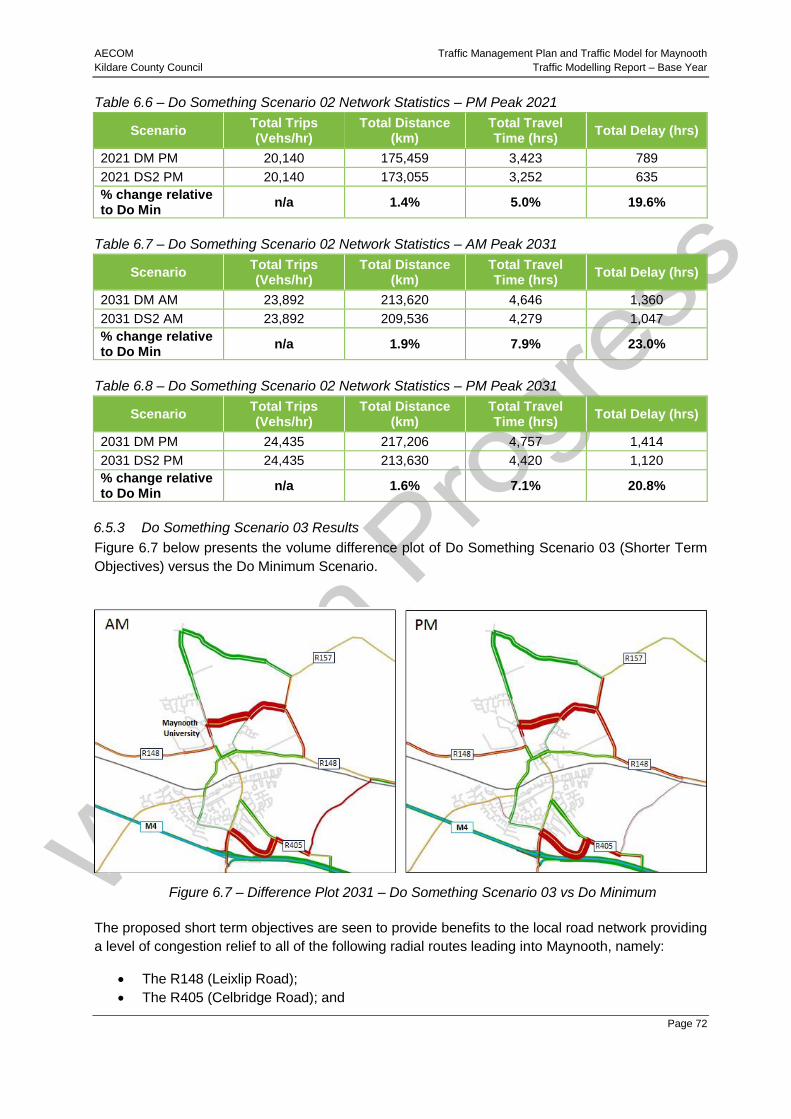
AECOM Traffic Management Plan and Traffic Model for Maynooth
Kildare County Council Traffic Modelling Report – Base Year
Page 72
Table 6.6 – Do Something Scenario 02 Network Statistics – PM Peak 2021
Scenario Total Trips (Vehs/hr)
Total Distance (km)
Total Travel Time (hrs)
Total Delay (hrs)
2021 DM PM 20,140 175,459 3,423 789
2021 DS2 PM 20,140 173,055 3,252 635
% change relative to Do Min
n/a 1.4% 5.0% 19.6%
Table 6.7 – Do Something Scenario 02 Network Statistics – AM Peak 2031
Scenario Total Trips (Vehs/hr)
Total Distance (km)
Total Travel Time (hrs)
Total Delay (hrs)
2031 DM AM 23,892 213,620 4,646 1,360
2031 DS2 AM 23,892 209,536 4,279 1,047
% change relative to Do Min
n/a 1.9% 7.9% 23.0%
Table 6.8 – Do Something Scenario 02 Network Statistics – PM Peak 2031
Scenario Total Trips (Vehs/hr)
Total Distance (km)
Total Travel Time (hrs)
Total Delay (hrs)
2031 DM PM 24,435 217,206 4,757 1,414
2031 DS2 PM 24,435 213,630 4,420 1,120
% change relative to Do Min
n/a 1.6% 7.1% 20.8%
6.5.3 Do Something Scenario 03 Results
Figure 6.7 below presents the volume difference plot of Do Something Scenario 03 (Shorter Term
Objectives) versus the Do Minimum Scenario.
Figure 6.7 – Difference Plot 2031 – Do Something Scenario 03 vs Do Minimum
The proposed short term objectives are seen to provide benefits to the local road network providing
a level of congestion relief to all of the following radial routes leading into Maynooth, namely:
The R148 (Leixlip Road);
The R405 (Celbridge Road); and

AECOM Traffic Management Plan and Traffic Model for Maynooth
Kildare County Council Traffic Modelling Report – Base Year
Page 73
The Moyglare Road
Tables 6.9 to 6.12 below present the results of the network performance statistics analysis of Do
Something Scenario 03 (Shorter Term Objectives) versus the Do Minimum Scenario. The network
performance statistics analysis confirms that the proposed scheme would have a positive impact
on network performance with total network travel time and congestion related delay recused in both
the AM and PM peak hours. The short term objectives do not however provide as significant a level
of benefit as either the Eastern or Western Orbital Routes.`
Table 6.9 – Do Something Scenario 03 Network Statistics – AM Peak 2021
Scenario Total Trips (Vehs/hr)
Total Distance (km)
Total Travel Time (hrs)
Total Delay (hrs)
2021 DM AM 19,641 171,864 3,387 799
2021 DS3 AM 19,641 171,276 3,302 719
% change relative to Do Min
n/a 0.3% 2.5% 10.0%
Table 6.10 – Do Something Scenario 03 Network Statistics – PM Peak 2021
Scenario Total Trips (Vehs/hr)
Total Distance (km)
Total Travel Time (hrs)
Total Delay (hrs)
2021 DM PM 20,140 175,459 3,423 789
2021 DS3 PM 20,140 174,796 3,357 727
% change relative to Do Min
n/a 0.4% 1.9% 7.9%
Table 6.11 – Do Something Scenario 03 Network Statistics – AM Peak 2031
Scenario Total Trips (Vehs/hr)
Total Distance (km)
Total Travel Time (hrs)
Total Delay (hrs)
2031 DM AM 23,892 213,620 4,646 1,360
2031 DS3 AM 23,892 210,875 4,555 1,298
% change relative to Do Min
n/a 1.3% 2.0% 4.5%
Table 6.12 – Do Something Scenario 03 Network Statistics – PM Peak 2031
Scenario Total Trips (Vehs/hr)
Total Distance (km)
Total Travel Time (hrs)
Total Delay (hrs)
2031 DM PM 24,435 217,206 4,757 1,414
2031 DS3 PM 24,435 215,011 4,652 1,329
% change relative to Do Min
n/a 1.0% 2.2% 6.0%

AECOM Traffic Management Plan and Traffic Model for Maynooth
Kildare County Council Traffic Modelling Report – Base Year
Page 74
6.5.4 Do Something Scenario 01 versus Do Something 02
A further comparison has also been undertaken in addition to the individual assessments, the
network performance parameters from the Do Something Scenarios 01 and 02, have been
compared to assess the relative merits of constructing an either and eastern or western crossing of
the Royal Canal and Maynooth Rail Line.
Figures 6.8 and 6.9 below graphically present a comparison of the total travel time and total delay
savings relative to the Do Minimum Scenario for the Do Something Scenarios 01 and 02 for the
future years 2021 and 2031.
Figure 6.8 – 2021 Total Network Travel Time & Delay Savings – Scenario 01 vs Scenario 02
-
50
100
150
200
250
2021 DS1 AM 2021 DS2 AM 2021 DS1 PM 2021 DS2 PM
Total Travel Time (hrs) Total Delay (hrs)

AECOM Traffic Management Plan and Traffic Model for Maynooth
Kildare County Council Traffic Modelling Report – Base Year
Page 75
Figure 6.9 – 2031 Total Network Travel Time & Delay Savings – Scenario 01 vs Scenario 02
As can be seen from both Figures 6.8 and 6.9 whilst both Do Something Scenario 01 and 02
present significant travel time and delay savings, relative to the Do Minimum scenario, Do
Something Scenario 02 (Western Orbital Route) is seen to deliver a greater level of travel time
savings.
The results however should be viewed in the context of the impact they have on the radial routes
feeding into Maynooth and streets with Maynooth’s town centre. As discussed in Sections 6.5.1
and 6.5.2 above Do Something Scenario 01 (Eastern Orbital Route) provides relief to the following
radial routes:
The R406 (Straffan Road);
The R148 (Kilcock and Leixlip Roads);
The R405 (Celbridge Road); and
The Moyglare Road
Whilst Do Something Scenario 02 (Western Orbital Route) provides relief to the below list of radial
routes:
The R406 (Straffan Road);
The R408 (Rathcoffey Road);
The R148 (Kilcock and Leixlip Roads);
The R405 (Celbridge Road); and
The Moyglare Road
Do Something Scenario 02 therefore provides relief to all the radial links that Do Something
Scenario 01 benefits and additionally provides relief to the R408 (Rathcoffey Road). However it is
necessary to examine Figures 6.10 and 6.11 below, which outline the volume to capacity ratio on
all key road links, to determine where congestion relief is required on the network. As can be seen
-
50
100
150
200
250
300
350
400
2031 DS1 AM 2031 DS2 AM 2031 DS1 PM 2031 DS2 PM
Total Travel Time (hrs) Total Delay (hrs)
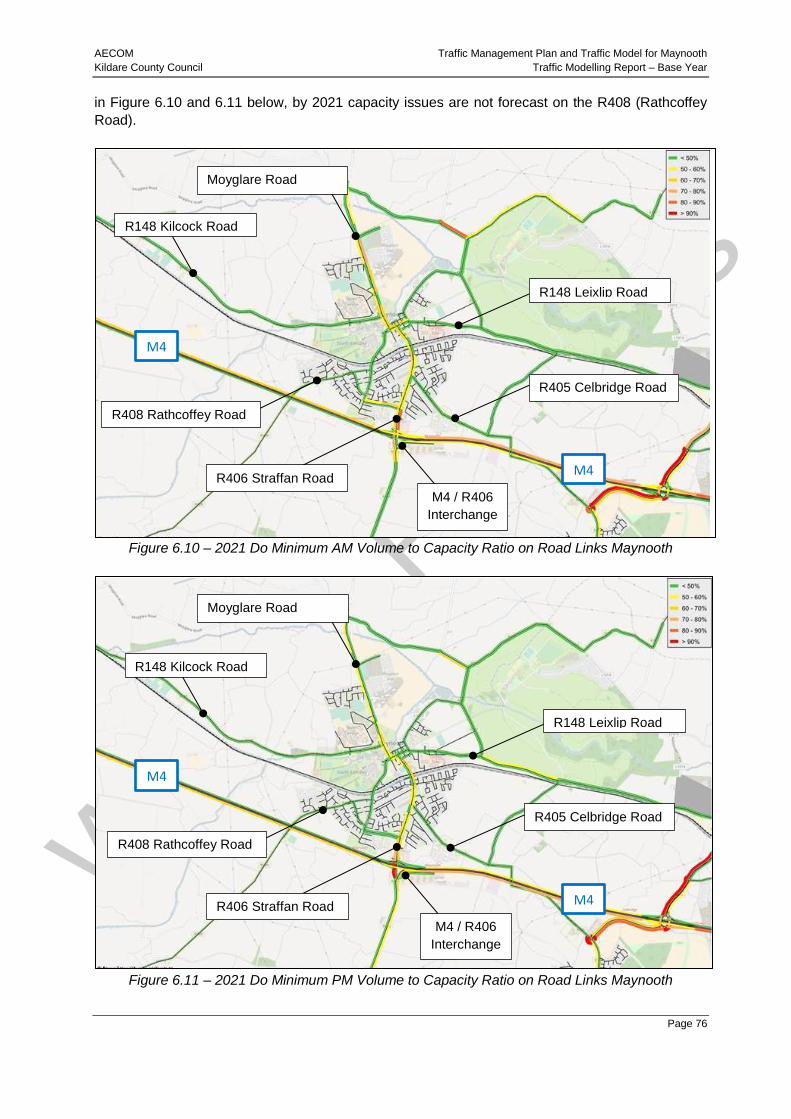
AECOM Traffic Management Plan and Traffic Model for Maynooth
Kildare County Council Traffic Modelling Report – Base Year
Page 76
in Figure 6.10 and 6.11 below, by 2021 capacity issues are not forecast on the R408 (Rathcoffey
Road).
Figure 6.10 – 2021 Do Minimum AM Volume to Capacity Ratio on Road Links Maynooth
Figure 6.11 – 2021 Do Minimum PM Volume to Capacity Ratio on Road Links Maynooth
R405 Celbridge Road
R408 Rathcoffey Road
R148 Kilcock Road
R148 Leixlip Road
M4
M4
M4
M4
R408 Rathcoffey Road
R406 Straffan Road
R406 Straffan Road
Moyglare Road
Moyglare Road
R148 Leixlip Road
R148 Kilcock Road
R405 Celbridge Road
M4 / R406
Interchange
M4 / R406
Interchange

AECOM Traffic Management Plan and Traffic Model for Maynooth
Kildare County Council Traffic Modelling Report – Base Year
Page 77
In examining Figures 6.10 and 6.11 above it can be seen that capacity issues are not forecast on
the R408 during either the AM or PM peak hours by 2021. Rather congestion is forecast on the:
R406 Straffan Road;
The Moyglare Road;
The M4; and
The M4 / R406 Interchange
Figures 6.12 and 6.13 below outline the volume to capacity ratio on all key road links upon the
implementation of Do Something Scenario 01 (Eastern Orbital Route). It can be seen that there are
notable improvement in the volume to capacity ratio on the:
R406 Straffan Road;
The Moyglare Road; and
Sections of the M4.
Capacity issues however still remain on at the M4 / R406 Interchange in the PM peak.
Figure 6.12 – 2021 Do Something 01 AM Volume to Capacity Ratio on Road Links Maynooth
M4 / R406
Interchange
M4
M4
R148 Kilcock Road
Moyglare Road
R405 Celbridge Road
R148 Leixlip Road R408 Rathcoffey Road
R406 Straffan Road

AECOM Traffic Management Plan and Traffic Model for Maynooth
Kildare County Council Traffic Modelling Report – Base Year
Page 78
Figure 6.13 – 2021 Do Something 01 PM Volume to Capacity Ratio on Road Links Maynooth
Figures 6.14 and 6.15 overleaf outline the volume to capacity ratio on all key road links upon the
implementation of Do Something Scenario 02 (Western Orbital Route). It can be seen that there
are notable improvement in the volume to capacity ratio on the:
R406 Straffan Road;
The Moyglare Road; and
Sections of the M4.
However capacity however still remain on at the M4 / R406 Interchange in the PM peak and the
progression of the Western Orbital Route is seen to increase traffic flow through the M4 / R406
Interchange in the AM peak hour. The progression of the Western Orbital Route would therefore
necessitate improvements in capacity at the M4 / R406 Interchange.
M4 / R406
Interchange
M4
M4
R148 Kilcock Road
Moyglare Road
R405 Celbridge Road
R148 Leixlip Road
R408 Rathcoffey Road
R406 Straffan Road

AECOM Traffic Management Plan and Traffic Model for Maynooth
Kildare County Council Traffic Modelling Report – Base Year
Page 79
Figure 6.11 – 2021 Do Something 02 AM Volume to Capacity Ratio on Road Links Maynooth
Figure 6.15 – 2021 Do Something 02 PM Volume to Capacity Ratio on Road Links Maynooth
M4 / R406
Interchange
M4 / R406
Interchange
M4
M4
M4
M4
R148 Kilcock Road
R148 Kilcock Road
Moyglare Road
Moyglare Road
R405 Celbridge Road
R405 Celbridge Road
R148 Leixlip Road
R148 Leixlip Road
R408 Rathcoffey Road
R408 Rathcoffey Road
R406 Straffan Road
R406 Straffan Road
AECOM Traffic Management Plan and Traffic Model for Maynooth
Kildare County Council Traffic Modelling Report – Base Year
Page 80
Chapter 7
Conclusion

AECOM Traffic Management Plan and Traffic Model for Maynooth
Kildare County Council Traffic Modelling Report – Base Year
Page 81
7 Conclusion
7.1 Conclusion
The aim of KCC in developing the Maynooth Strategic Traffic Model (STM) was to develop a tool
that accurately represents existing traffic conditions in Maynooth and that can be used by KCC to
assess the impacts of major land-use changes and transport network infrastructural improvements
in the Maynooth Area and its environs. It was a requirement of the commission that the Maynooth
STM should be compatible, at a zonal level, with the both Transport Infrastructure Ireland’s (TII’s)
National Transport Model (NTpM) and the National Transport Authorities (NTA’s) Eastern Regional
Model (ERM).
The Maynooth STM has therefore been developed in the software VISUM as a cordon of the
National Traffic Model (NTM) element of the NTpM. The zone structure in the STM has been
developed in such as fashion that it maintains compatibility with the NTM and ERM zone
structures. Therefore any demand impacts associated with public transport proposals or large
infrastructural changes assessed in the NTpM or ERM can easily be accounted for in the Maynooth
STM by applying a percentage change in the forecast trip ends in the zones local to Maynooth in
the larger models to the Maynooth STM zones.
Prior to the development of the Maynooth STM a significant collection programme which included
link counts, junction turning movement counts, origin-destination surveys and journey time surveys
was carried out in May 2016. This data has been used to fully calibrate and validate AM and PM
peak hour models for Maynooth to the standard recommended in the PAG Unit 5.2: Construction of
Transport Models.
Upon completion of the 2016 base year model future year forecast models for 2021 and 2031 were
developed. The forecast models were developed based on KCC’s forecasts for the Maynooth area
as outlined in the Maynooth Local Area Plan 2013 to 2019 and the Draft Kildare County
Development Plan (CDP) 2017 – 2023. In order to sense check the forecasts developed based on
KCC’s projections a comparison was made between the forecasts based on KCC’s projections and
forecasts developed based on the projections in the NTpM and the ERM future year models. The
KCC forecasts were found to closely correspond to the NTM and ERM forecasts and based on
KCC’s local knowledge it was considered appropriate that the future year forecasts based on
KCC’s projections were taken forward for future year scenario assessment.
Three future year scenarios were then developed for assessment in the future year 2021 and 2031
models, namely:
Scenario 01 –Progression of Eastern Orbital Route
Scenario 02 –Progression of Western Orbital Route
Scenario 03 – Short Term Objectives
These scenarios were developed based on the future road construction objectives outlined in TRO
2 of the Maynooth Local Area Plan 2013 to 2019. These future year scenarios were then assessed
based on their impacts on the network performance parameters:
Total Network Travel Time (hours);
Total Network Vehicle Kilometres (hrs) for all vehicles; and
Total Delay (hrs)

AECOM Traffic Management Plan and Traffic Model for Maynooth
Kildare County Council Traffic Modelling Report – Base Year
Page 82
Each of the future year scenarios were found to deliver improved levels of network performance
with Scenario’s 01 and 02 delivering the most significant levels of network performance
improvement.
A further comparison of Scenario’s 01 and 02 was then undertaken. Scenario 02 (the Western
Orbital Route) was found to deliver the most significant level of network improvement of all the
scenarios assessed. This scenario however attracts more traffic through the already congested M4
/ R406 Interchange and the progression of the Western Orbital Route would therefore necessitate
improvements in capacity at the M4 / R406 Interchange.

AECOM Traffic Management Plan and Traffic Model for Maynooth
Kildare County Council Traffic Modelling Report – Base Year
Page 83
Appendices
Top Related