


Languages
Pages
Legal

Trade House 426 Alok Nagar, Kanadia Main Road Near Bangali Square
Indore-452001 (M.P.) India Mobile :+91-9039261444
E-mail: [email protected] Telephone :+91-731-698.3000
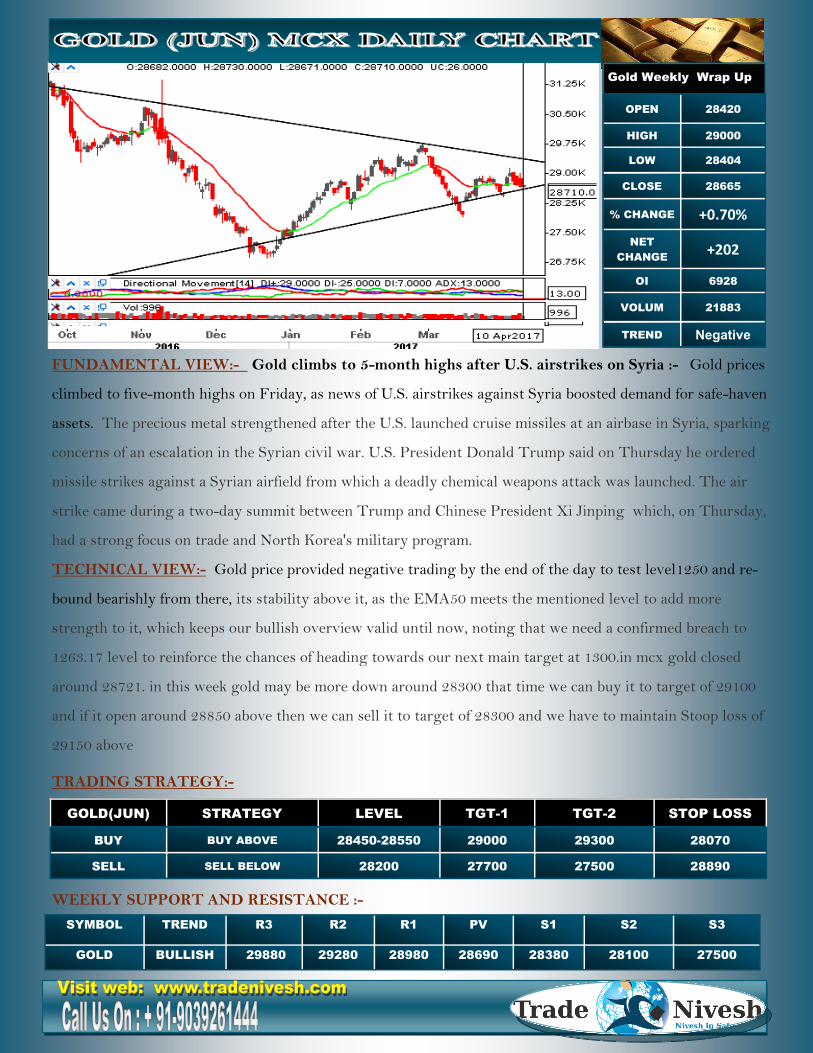
FUNDAMENTAL VIEW:- Gold climbs to 5-month highs after U.S. airstrikes on Syria :- Gold prices
climbed to five-month highs on Friday, as news of U.S. airstrikes against Syria boosted demand for safe-haven
assets. The precious metal strengthened after the U.S. launched cruise missiles at an airbase in Syria, sparking
concerns of an escalation in the Syrian civil war. U.S. President Donald Trump said on Thursday he ordered
missile strikes against a Syrian airfield from which a deadly chemical weapons attack was launched. The air
strike came during a two-day summit between Trump and Chinese President Xi Jinping which, on Thursday,
had a strong focus on trade and North Korea's military program.
TECHNICAL VIEW:- Gold price provided negative trading by the end of the day to test level1250 and re-
bound bearishly from there, its stability above it, as the EMA50 meets the mentioned level to add more
strength to it, which keeps our bullish overview valid until now, noting that we need a confirmed breach to
1263.17 level to reinforce the chances of heading towards our next main target at 1300.in mcx gold closed
around 28721. in this week gold may be more down around 28300 that time we can buy it to target of 29100
and if it open around 28850 above then we can sell it to target of 28300 and we have to maintain Stoop loss of
29150 above
TRADING STRATEGY:-
WEEKLY SUPPORT AND RESISTANCE :-
SYMBOL TREND R3 R2 R1 PV S1 S2 S3
GOLD BULLISH 29880 29280 28980 28690 28380 28100 27500
Gold Weekly Wrap Up
OPEN 28420
HIGH 29000
LOW 28404
CLOSE 28665
% CHANGE +0.70%
NET
CHANGE +202
OI 6928
VOLUM 21883
TREND Negative
GOLD(JUN) STRATEGY LEVEL TGT-1 TGT-2 STOP LOSS
BUY BUY ABOVE 28450-28550 29000 29300 28070
SELL SELL BELOW 28200 27700 27500 28890
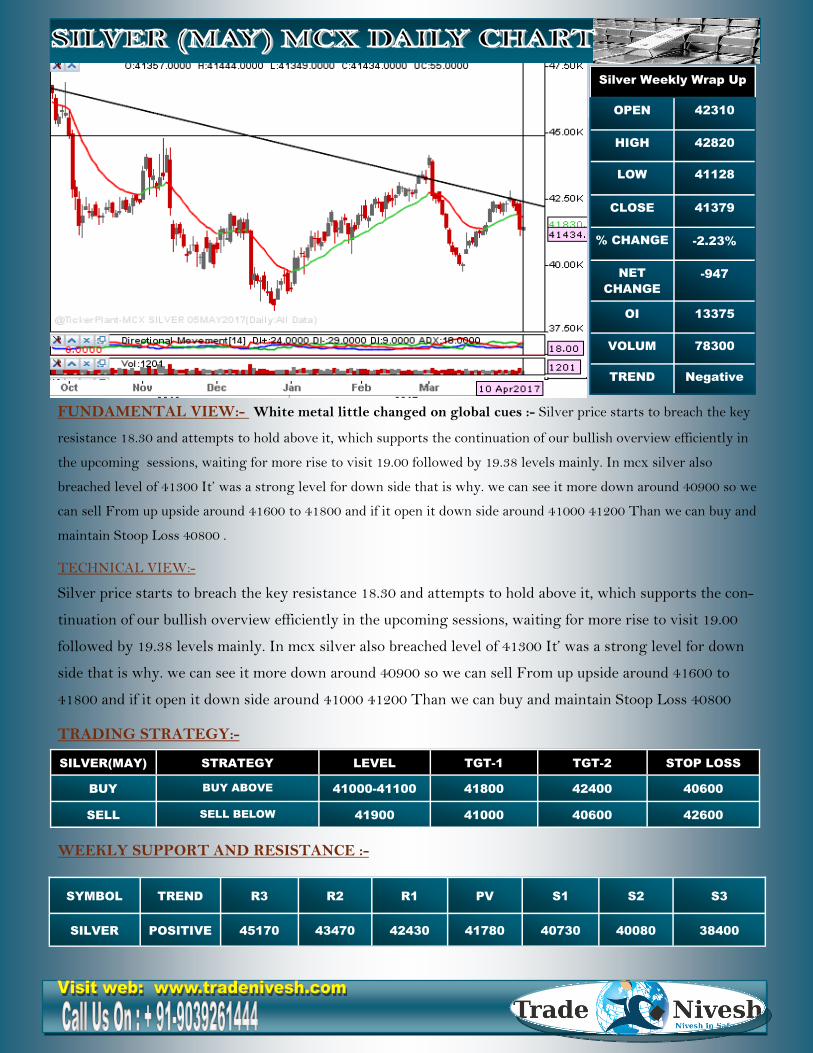
FUNDAMENTAL VIEW:- White metal little changed on global cues :- Silver price starts to breach the key
resistance 18.30 and attempts to hold above it, which supports the continuation of our bullish overview efficiently in
the upcoming sessions, waiting for more rise to visit 19.00 followed by 19.38 levels mainly. In mcx silver also
breached level of 41300 It’ was a strong level for down side that is why. we can see it more down around 40900 so we
can sell From up upside around 41600 to 41800 and if it open it down side around 41000 41200 Than we can buy and
maintain Stoop Loss 40800 .
TECHNICAL VIEW:-
Silver price starts to breach the key resistance 18.30 and attempts to hold above it, which supports the con-
tinuation of our bullish overview efficiently in the upcoming sessions, waiting for more rise to visit 19.00
followed by 19.38 levels mainly. In mcx silver also breached level of 41300 It’ was a strong level for down
side that is why. we can see it more down around 40900 so we can sell From up upside around 41600 to
41800 and if it open it down side around 41000 41200 Than we can buy and maintain Stoop Loss 40800
TRADING STRATEGY:-
WEEKLY SUPPORT AND RESISTANCE :-
SYMBOL TREND R3 R2 R1 PV S1 S2 S3
SILVER POSITIVE 45170 43470 42430 41780 40730 40080 38400
Silver Weekly Wrap Up
OPEN 42310
HIGH 42820
LOW 41128
CLOSE 41379
% CHANGE -2.23%
NET
CHANGE
-947
OI 13375
VOLUM 78300
TREND Negative
SILVER(MAY) STRATEGY LEVEL TGT-1 TGT-2 STOP LOSS
BUY BUY ABOVE 41000-41100 41800 42400 40600
SELL SELL BELOW 41900 41000 40600 42600
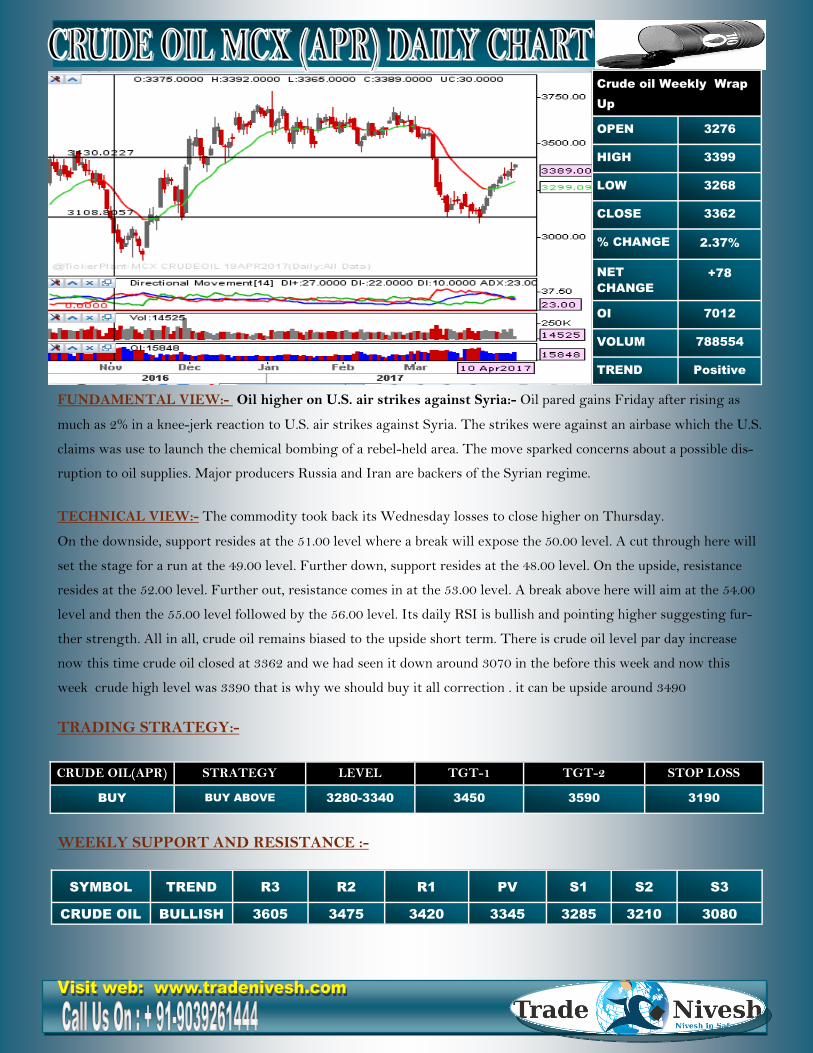
FUNDAMENTAL VIEW:- Oil higher on U.S. air strikes against Syria:- Oil pared gains Friday after rising as
much as 2% in a knee-jerk reaction to U.S. air strikes against Syria. The strikes were against an airbase which the U.S.
claims was use to launch the chemical bombing of a rebel-held area. The move sparked concerns about a possible dis-
ruption to oil supplies. Major producers Russia and Iran are backers of the Syrian regime.
TECHNICAL VIEW:- The commodity took back its Wednesday losses to close higher on Thursday.
On the downside, support resides at the 51.00 level where a break will expose the 50.00 level. A cut through here will
set the stage for a run at the 49.00 level. Further down, support resides at the 48.00 level. On the upside, resistance
resides at the 52.00 level. Further out, resistance comes in at the 53.00 level. A break above here will aim at the 54.00
level and then the 55.00 level followed by the 56.00 level. Its daily RSI is bullish and pointing higher suggesting fur-
ther strength. All in all, crude oil remains biased to the upside short term. There is crude oil level par day increase
now this time crude oil closed at 3362 and we had seen it down around 3070 in the before this week and now this
week crude high level was 3390 that is why we should buy it all correction . it can be upside around 3490
TRADING STRATEGY:-
WEEKLY SUPPORT AND RESISTANCE :-
SYMBOL TREND R3 R2 R1 PV S1 S2 S3
CRUDE OIL BULLISH 3605 3475 3420 3345 3285 3210 3080
Crude oil Weekly Wrap
Up
OPEN 3276
HIGH 3399
LOW 3268
CLOSE 3362
% CHANGE 2.37%
NET
CHANGE
+78
OI 7012
VOLUM 788554
TREND Positive
CRUDE OIL(APR) STRATEGY LEVEL TGT-1 TGT-2 STOP LOSS
BUY BUY ABOVE 3280-3340 3450 3590 3190
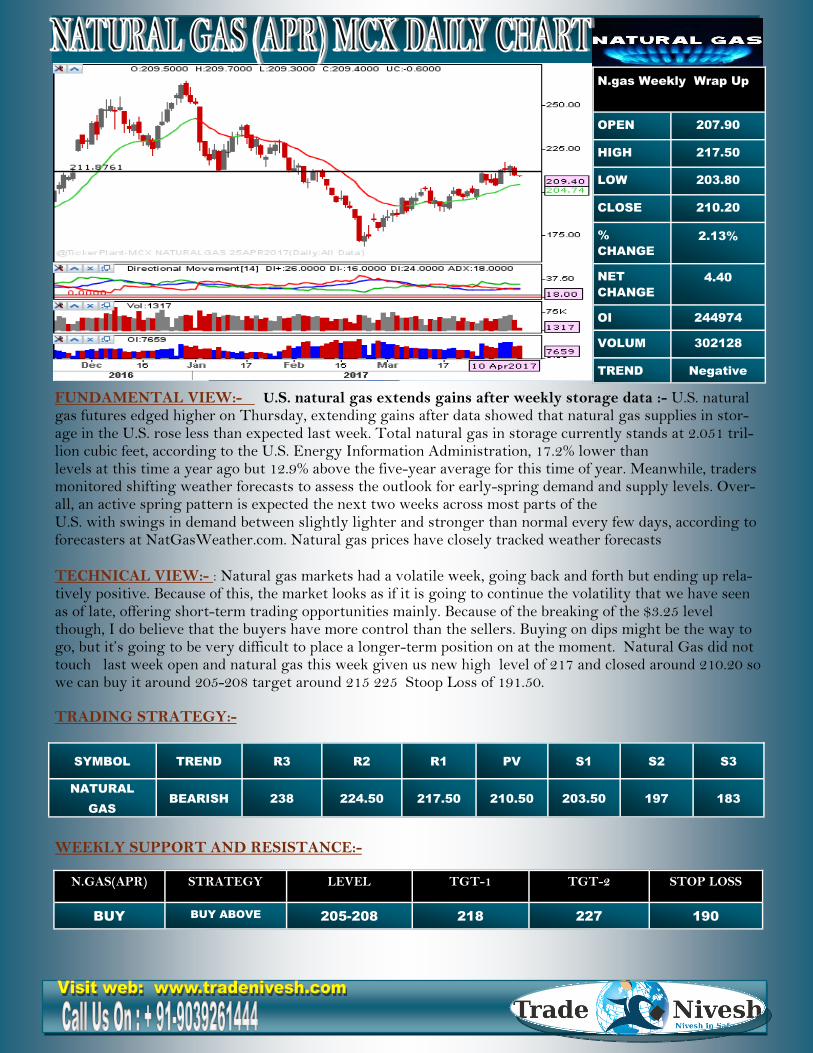
FUNDAMENTAL VIEW:- U.S. natural gas extends gains after weekly storage data :- U.S. natural gas futures edged higher on Thursday, extending gains after data showed that natural gas supplies in stor-age in the U.S. rose less than expected last week. Total natural gas in storage currently stands at 2.051 tril-lion cubic feet, according to the U.S. Energy Information Administration, 17.2% lower than levels at this time a year ago but 12.9% above the five-year average for this time of year. Meanwhile, traders monitored shifting weather forecasts to assess the outlook for early-spring demand and supply levels. Over-all, an active spring pattern is expected the next two weeks across most parts of the U.S. with swings in demand between slightly lighter and stronger than normal every few days, according to forecasters at NatGasWeather.com. Natural gas prices have closely tracked weather forecasts TECHNICAL VIEW:- : Natural gas markets had a volatile week, going back and forth but ending up rela-tively positive. Because of this, the market looks as if it is going to continue the volatility that we have seen as of late, offering short-term trading opportunities mainly. Because of the breaking of the $3.25 level though, I do believe that the buyers have more control than the sellers. Buying on dips might be the way to go, but it’s going to be very difficult to place a longer-term position on at the moment. Natural Gas did not touch last week open and natural gas this week given us new high level of 217 and closed around 210.20 so we can buy it around 205-208 target around 215 225 Stoop Loss of 191.50.
TRADING STRATEGY:-
WEEKLY SUPPORT AND RESISTANCE:-
SYMBOL TREND R3 R2 R1 PV S1 S2 S3
NATURAL
GAS
BEARISH 238 224.50 217.50 210.50 203.50 197 183
N.gas Weekly Wrap Up
OPEN 207.90
HIGH 217.50
LOW 203.80
CLOSE 210.20
%
CHANGE
2.13%
NET
CHANGE
4.40
OI 244974
VOLUM 302128
TREND Negative
N.GAS(APR) STRATEGY LEVEL TGT-1 TGT-2 STOP LOSS
BUY BUY ABOVE 205-208 218 227 190
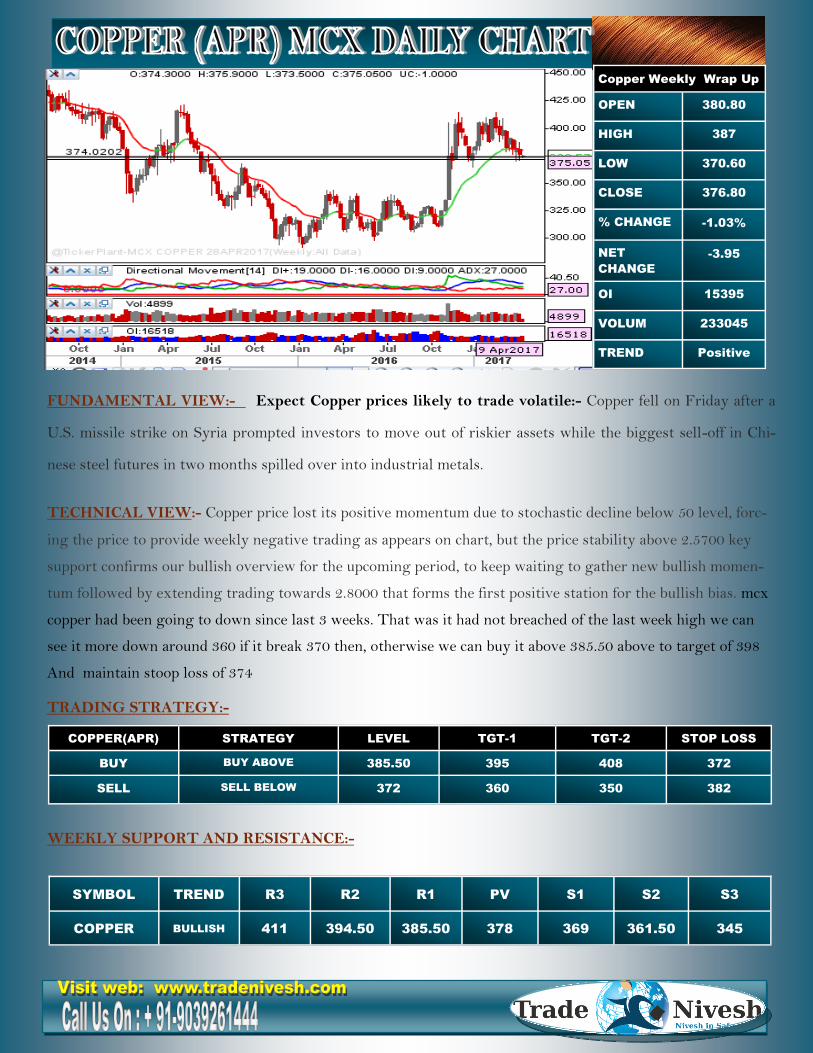
FUNDAMENTAL VIEW:- Expect Copper prices likely to trade volatile:- Copper fell on Friday after a
U.S. missile strike on Syria prompted investors to move out of riskier assets while the biggest sell-off in Chi-
nese steel futures in two months spilled over into industrial metals.
TECHNICAL VIEW:- Copper price lost its positive momentum due to stochastic decline below 50 level, forc-
ing the price to provide weekly negative trading as appears on chart, but the price stability above 2.5700 key
support confirms our bullish overview for the upcoming period, to keep waiting to gather new bullish momen-
tum followed by extending trading towards 2.8000 that forms the first positive station for the bullish bias. mcx
copper had been going to down since last 3 weeks. That was it had not breached of the last week high we can
see it more down around 360 if it break 370 then, otherwise we can buy it above 385.50 above to target of 398
And maintain stoop loss of 374
TRADING STRATEGY:-
WEEKLY SUPPORT AND RESISTANCE:-
SYMBOL TREND R3 R2 R1 PV S1 S2 S3
COPPER BULLISH 411 394.50 385.50 378 369 361.50 345
Copper Weekly Wrap Up
OPEN 380.80
HIGH 387
LOW 370.60
CLOSE 376.80
% CHANGE -1.03%
NET
CHANGE
-3.95
OI 15395
VOLUM 233045
TREND Positive
COPPER(APR) STRATEGY LEVEL TGT-1 TGT-2 STOP LOSS
BUY BUY ABOVE 385.50 395 408 372
SELL SELL BELOW 372 360 350 382
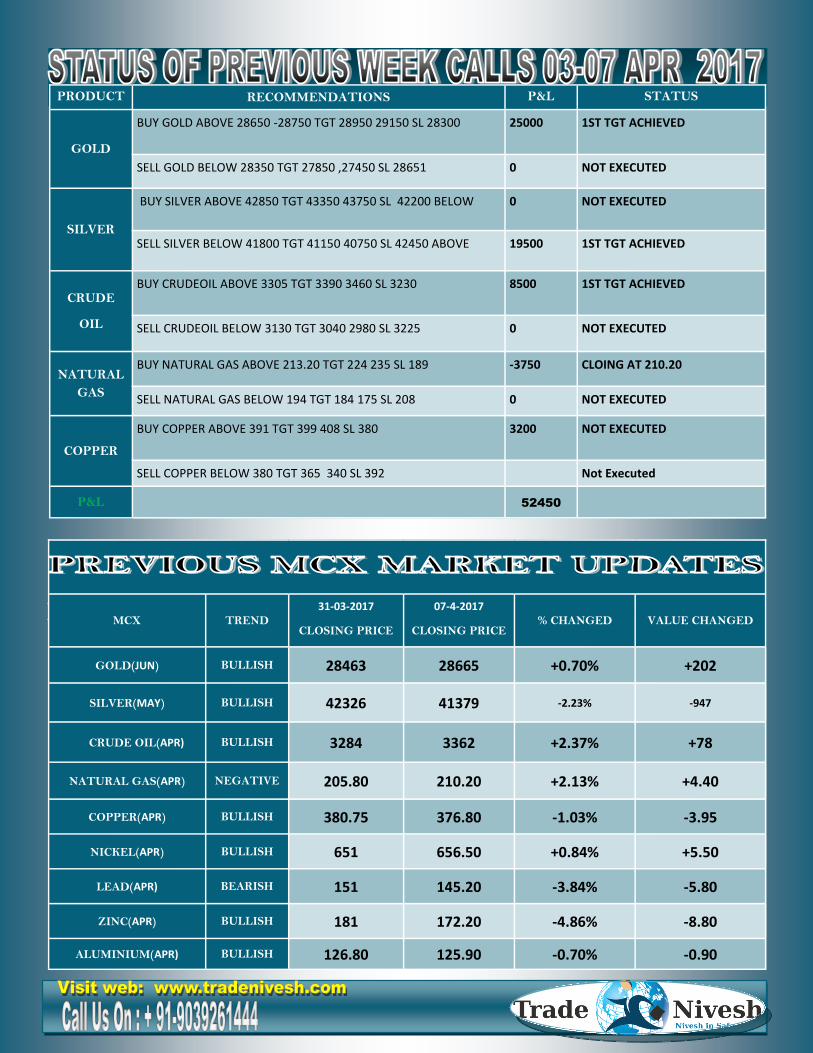
PRODUCT RECOMMENDATIONS P&L STATUS
GOLD
BUY GOLD ABOVE 28650 -28750 TGT 28950 29150 SL 28300 25000 1ST TGT ACHIEVED
SELL GOLD BELOW 28350 TGT 27850 ,27450 SL 28651 0 NOT EXECUTED
SILVER
BUY SILVER ABOVE 42850 TGT 43350 43750 SL 42200 BELOW 0 NOT EXECUTED
SELL SILVER BELOW 41800 TGT 41150 40750 SL 42450 ABOVE 19500 1ST TGT ACHIEVED
CRUDE
OIL
BUY CRUDEOIL ABOVE 3305 TGT 3390 3460 SL 3230 8500 1ST TGT ACHIEVED
SELL CRUDEOIL BELOW 3130 TGT 3040 2980 SL 3225 0 NOT EXECUTED
NATURAL
GAS
BUY NATURAL GAS ABOVE 213.20 TGT 224 235 SL 189 -3750 CLOING AT 210.20
SELL NATURAL GAS BELOW 194 TGT 184 175 SL 208 0 NOT EXECUTED
BUY COPPER ABOVE 391 TGT 399 408 SL 380 3200 NOT EXECUTED
COPPER
SELL COPPER BELOW 380 TGT 365 340 SL 392 Not Executed
P&L 52450
MCX
31-03-2017
CLOSING PRICE
07-4-2017
CLOSING PRICE % CHANGED VALUE CHANGED TREND
GOLD(JUN) 28463 28665 +0.70% +202 BULLISH
SILVER(MAY) 42326 41379 -2.23% -947 BULLISH
CRUDE OIL(APR) 3284 3362 +2.37% +78 BULLISH
NATURAL GAS(APR) 205.80 210.20 +2.13% +4.40 NEGATIVE
COPPER(APR) 380.75 376.80 -1.03% -3.95 BULLISH
NICKEL(APR) 651 656.50 +0.84% +5.50 BULLISH
LEAD(APR) 151 145.20 -3.84% -5.80 BEARISH
ZINC(APR) 181 172.20 -4.86% -8.80 BULLISH
ALUMINIUM(APR) 126.80 125.90 -0.70% -0.90 BULLISH
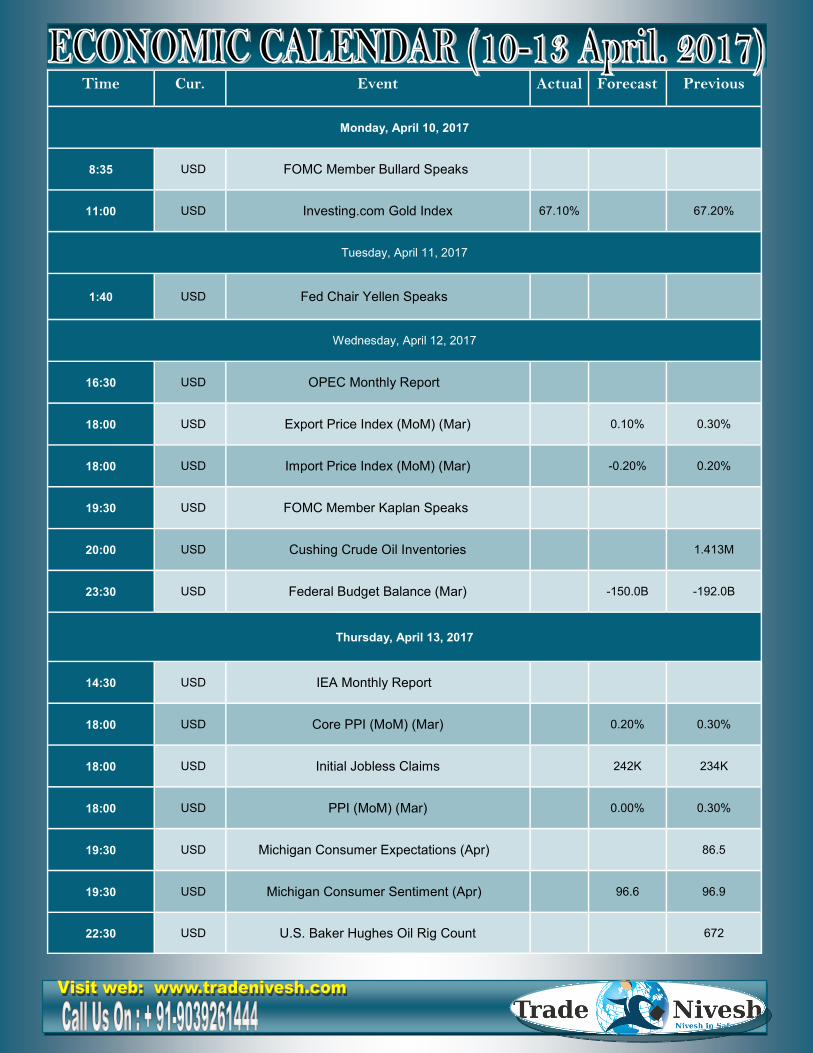
Time Cur. Event Actual Forecast Previous
Monday, April 10, 2017
8:35 USD FOMC Member Bullard Speaks
11:00 USD Investing.com Gold Index 67.10% 67.20%
Tuesday, April 11, 2017
1:40 USD Fed Chair Yellen Speaks
Wednesday, April 12, 2017
16:30 USD OPEC Monthly Report
18:00 USD Export Price Index (MoM) (Mar) 0.10% 0.30%
18:00 USD Import Price Index (MoM) (Mar) -0.20% 0.20%
19:30 USD FOMC Member Kaplan Speaks
20:00 USD Cushing Crude Oil Inventories 1.413M
23:30 USD Federal Budget Balance (Mar) -150.0B -192.0B
Thursday, April 13, 2017
14:30 USD IEA Monthly Report
18:00 USD Core PPI (MoM) (Mar) 0.20% 0.30%
18:00 USD Initial Jobless Claims 242K 234K
18:00 USD PPI (MoM) (Mar) 0.00% 0.30%
19:30 USD Michigan Consumer Expectations (Apr) 86.5
19:30 USD Michigan Consumer Sentiment (Apr) 96.6 96.9
22:30 USD U.S. Baker Hughes Oil Rig Count 672

This document is solely for the personal information of the recipient, and must not be singularly used as the
basis of any investment decision. Nothing in this document should be construed as investment or financial
advice. Each recipient of this document should make such investigations as they deem necessary to arrive at
an independent evaluation of an investment in the securities of the companies referred to in this document
including the merits and risks involved, and should consult their own advisors to determine the merits and
risks of such an investment.
Reports based on technical and derivative analysis center on studying charts of a stock's price movement,
outstanding positions and trading volume. The information in this document has been printed on the basis
of publicly available information, internal data and other reliable sources believed to be true, but we do not
represent that it is accurate or complete and it should not be relied on as such, as this document is for gen-
eral guidance only. Trade Nivesh shall not be in any way responsible for any loss or damage that may arise
Top Related