


Languages
Pages
Legal


Trade Dynamics in the Euro Area:A Disaggregated Approach
DNB/IMF Workshop Preventing and Correcting Macroeconomic Imbalances in the Euro Area
14 October 2011
Peter Wierts, Henk van Kerkhoff, Jakob de Haan
Motivation
Literature on persistent CA imbalances- Aggregate approach; adjustment real exchange rate
Complementary approach - Disaggregated; exports - Competition on global markets
Where is export going? (EMU vs Emerging Markets)What is being exported? (composition)
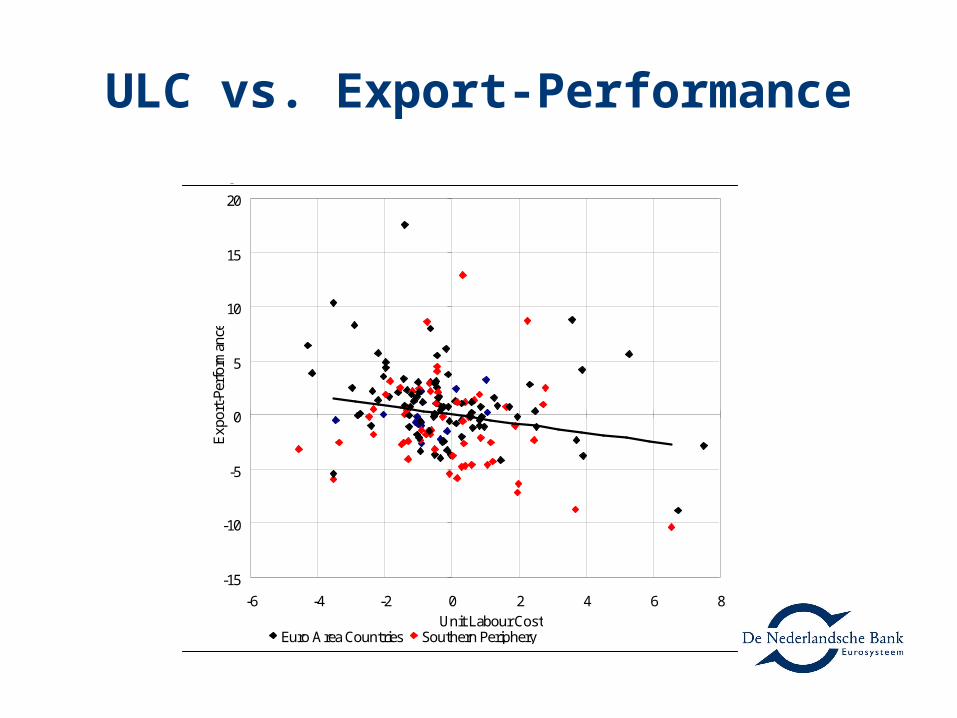
ULC vs. Export-Performance
-15
-10
-5
0
5
10
15
20
-6 -4 -2 0 2 4 6 8Unit Labour Cost
Exp
ort-
Perf
orm
ance
Euro Area Countries Southern Periphery
Annual growth for 1996-2010
Source: AMECO.

Outline
1. Literature
2. Export decompositions euro area countries Partner countries (where?) Composition (what?)
3. Disaggregated export regressions

EMU and Imbalances
- Market inflexibility & lack of adjustment capacity Berger and Nitsch (2010)
- No endogenous process towards optimal currency area Berger and Nitsch (2008); Inklaar et al. (2008); Bednarek et al. (2010)
- The credit boom and capital flows Jaumotte and Sodsriwiboon (2010), Giavazzi and Spaventa (2010),
Lane (2010)
- Trade vis-à-vis rest of the world; export & disaggregated regressions Chen et al. (2010), Flam and Nordström (2003)

Export composition:Technology Intensity (OECD)
High technology industries• Aircraft and spacecraft • Pharmaceuticals• Office, accounting and computing
machinery• Radio, TV and communications
equipment; • Medical, precision and optical
instruments
Medium-low-technology industries
• Building and repairing of ships and boats• Rubber and plastic products• Coke, refined petroleum products and
nuclear fuel• Other non-metallic mineral products• Basic metals and fabricated metal
products
Medium-high-technology industries• Electrical machinery and apparatus, n.e.c.• Motor vehicles, trailers and semi-trailers• Chemicals excluding pharmaceuticals• Railroad and transport equipment, n.e.c.• Machinery and equipment, n.e.c.
Low-technology industries • Manufacturing, n.e.c.• Recycling• Wood, pulp, paper, paper products, printing
and publishing• Food products, beverages and tobacco• Textiles, textile products, leather and footwear
.

Geographical Aggregates
• CoreAustria, Belgium, France, Germany, Luxembourg, Netherlands
• Northern PeripheryFinland, Ireland
• Southern PeripheryGreece, Italy, Portugal, Spain
• Rest Industrialized WorldAustralia, Canada, Denmark, Japan, Korea, New Zealand, Norway, Sweden, Switzerland, UK, US
• Emerging MarketsBrazil, China, Czech Rep.*, Hong Kong, Hungary, India, Poland, Russian Fed.**, Slovak Rep.*, Slovenia
• Rest of the world
* Before 2003: Former Czechoslovakia.** Before 2002: Former USSR.

Trade Imbalance for Euro-Area RegionsExternal trade by declaring country; Trade balance as a percentage of GDP
1999 2004 2009 2010
Core 2.2 3.8 2.4 2.4
Northern Periphery 15.3 14.1 11.9 13.1
Southern Periphery:
Portugal -12.2 -10.4 -11.6 -11.7Italy 1.2 -0.1 -0.4 -1.8Greece -14.5 -16.3 -14.9 -13.7Spain -5.0 -7.2 -4.5 -4.9
Total Southern Periphery -2.4 -4.2 -3.6 -4.3

Partner countries: CoreAs a percentage of Total Exports of Goods
1980 1990 2000 2009
Core 41.8% 40.6% 34.1% 34.7%Northern Periphery 1.1% 1.2% 1.5% 1.3%Southern Periphery 11.9% 14.5% 14.3% 12.4%
Rest Industrialised World 22.6% 26.5% 27.5% 22.7%Emerging Markets 5.0% 4.1% 8.6% 14.0%Rest of the World 17.6% 13.1% 14.0% 14.9%
World 100.0% 100.0% 100.0% 100.0%

Partner countries: Southern-peripheryAs a percentage of Total Exports of Goods
1980 1990 2000 2008
Core 40.4% 43.8% 36.6% 32.2%Northern Periphery 0.7% 1.0% 1.2% 0.9%Southern Periphery 6.0% 11.4% 13.4% 13.6%
Rest Industrialised World 20.1% 25.0% 23.7% 19.0%Emerging Markets 4.1% 4.0% 7.0% 10.8%Rest of the World 28.7% 14.8% 18.1% 23.5%
World 100.0% 100.0% 100.0% 100.0%

Partner countries: Northern-peripheryAs a percentage of Total Exports of Goods
1980 1990 2000 2009
Core 24.5% 29.2% 27.9% 29.3%Northern Periphery 0.6% 0.6% 0.5% 0.4%Southern Periphery 4.5% 7.1% 7.5% 7.5%
Rest Industrialised World 46.6% 46.4% 45.4% 41.3%Emerging Markets 13.2% 8.7% 6.5% 10.2%Rest of the World 10.7% 8.1% 12.3% 11.3%
World 100.0% 100.0% 100.0% 100.0%
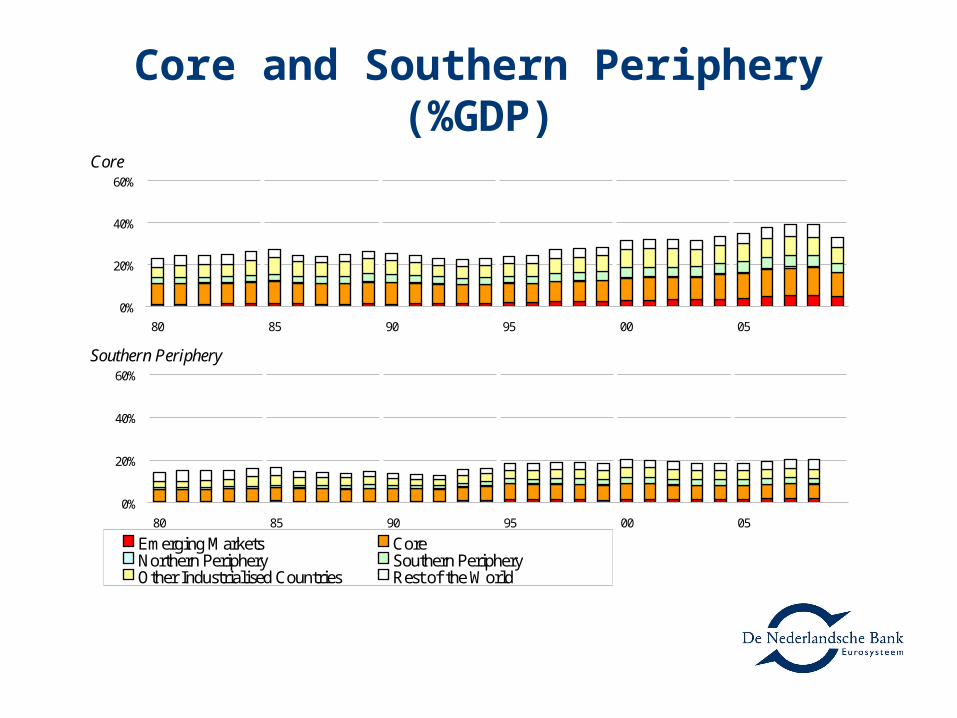
Core and Southern Periphery (%GDP)Core
Southern Periphery
0%
20%
40%
60%
80 85 90 95 00 05
0%
20%
40%
60%
80 85 90 95 00 05
Emerging Markets CoreNorthern Periphery Southern PeripheryOther Industrialised Countries Rest of the World

Export composition: Core
As a Percentage of Total Exports of Goods
As a Percentage of GDP
0%
20%
40%
60%
80%
100%
88 90 92 94 96 98 00 02 04 06 08
0%
20%
40%
60%
88 90 92 94 96 98 00 02 04 06 08
High Technology Manufactures Medium-high Technology ManufacturesMedium-low Technology Manufactures Low Technology ManufacturesNon-manufactured Goods

Composition: Southern-periphery
As a Percentage of Total Exports of Goods
As a Percentage of GDP
0%
20%
40%
60%
80%
100%
88 90 92 94 96 98 00 02 04 06 08
0%
20%
40%
60%
88 90 92 94 96 98 00 02 04 06 08
High Technology Manufactures Medium-high Technology ManufacturesMedium-low Technology Manufactures Low Technology ManufacturesNon-manufactured Goods

Composition: Northern-periphery
As a Percentage of Total Exports of Goods
As a Percentage of GDP
0%
20%
40%
60%
80%
100%
88 90 92 94 96 98 00 02 04 06 08
0%
20%
40%
60%
88 90 92 94 96 98 00 02 04 06 08
High Technology Manufactures Medium-high Technology ManufacturesMedium-low Technology Manufactures Low Technology ManufacturesNon-manufactured Goods
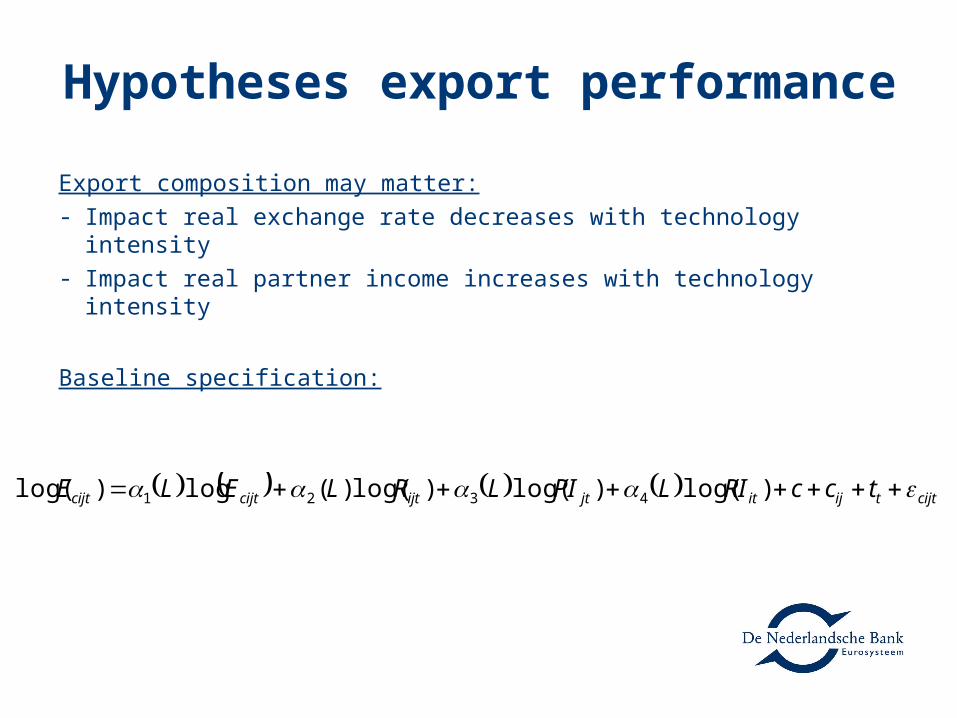
Hypotheses export performance
Export composition may matter:- Impact real exchange rate decreases with technology intensity- Impact real partner income increases with technology intensity
Baseline specification:
cijttijitjtijtcijtcijt tccRILPILRLELE )log()log()log()(log)log( 4321

Total Exports, all Euro Area CountriesDependent variable: log of real exports
Fixed effectsCorrected
Stata command: xtabond xtlsdvc xtreg xtivreg
0.68 0.79 0.69 0.69(0.056)*** (0.012)*** (0.019)*** (0.0073)***
-0.64 -0.56 -0.59 -0.59(0.065)*** (0.19)*** (0.042)*** (0.027)***
0.3 0.31 0.25 0.25(0.050)*** (0.19)*** (0.047)*** (0.036)***
0.1 0.13 0.1 0.11(0.051)** -0.097 (0.041)** (0.023)***
2.13 1.97 2.08 2.08(0.17)*** (0.35)*** (0.13)*** (0.085)***
-1.81 -1.75 -1.76 -1.76(0.22)*** (0.42)*** (-13.10)*** (0.081)***
-0.15 0.4-0.16 (0.045)***
0.22 0.36(0.12)* (0.064)***
Time dummies Yes Yes Yes YesPairwise fixed effects Yes Yes Yes YesNumber of observations 7768 8208 8208 8208Number of groups 440 440 440 440Number of instruments 101R-squared (overall) n.a. n.a. 0.92 0.91Standard errors robust bootstrapped robust conventional
Log Reporter (GNI/Capita, PPP) L1
Log partner real income
Log partner real income L1
Log Reporter (GNI/Capita, PPP)
Lagged dep. var.
Log RER
Log RER L1
Log RER L2
GMM Fixed effects Fixed effects, IV

Long-run coefficients by Export categories
Dependent variable: log of export
Total Low-technology industries
Medium-low technology industries
Medium-high technology industries
High-technology industries
Log RER -0.76 -0.93 -0.89 -0.8 -0.29Log partner real income 1.01 0.91 1.59 1.23 1.19
-0.48 -0.61 -0.17(insignificant) (insignificant) (insignificant)
Number of observations 7768 7768 7759 7766 7731Number of groups 440 440 440 440 440Number of instruments 101 101 101 101
Notes: the estimation Arellano-Bond dynamic panel-data estimation.GMM type instruments: L(2/3).log(export volume); L(2/3)log reporter income.Standard errors are adjusted for clustering on panel groups.
Log Reporter (GNI/Capita, PPP) 1.23 2.25

Export categories, excluding NL & BE,long-run coefficients
Dependent variable: log of export
Total export Low-technology industries
Medium-low technology industries
Medium-high technology industries
High-technology industries
Log RER -0.84 -1 -0.88 -0.83 -0.3Log partner real income 1.1 0.97 1.53 1.31 1.18
Log Reporter (GNI/Capita, PPP) 0.19 -0.08 0.28(insignificant) (insignificant) (insignificant)
Number of observations 6968 6968 6959 6966 6931Number of groups 396 396 396 396 396
Number of instruments 101 101 101 101 101
Notes: the estimation Arellano-Bond dynamic panel-data estimation.GMM type instruments: L(2/3).log(export volume); L(2/3)log reporter income.Standard errors are adjusted for clustering on panel groups.
1.54 2.86

Total exports for country groups,long-run coefficients
Dependent variable: log of export
All euro area Core Southern periphery
Northern periphery
Log RER -0.76 -0.46 -0.7 -1.03Log partner real income 1.01 1.16 1.37 1.22Log Reporter (GNI/Capita, PPP) -0.48
(insignificant)
Number of observations 7768 2972 3196 800Number of groups 440 176 176 44Number of instruments 101 98 101 63
Notes: the estimation Arellano-Bond dynamic panel-data estimation.GMM type instruments: L(2/3).log(export volume); L(2/3)log reporter income.Standard errors are adjusted for clustering on panel groups.
1.03 1.09 2.77

Conclusion – Imbalances in EMUStructural differences in export compositionCore: higher share of high tech than southern periphery, and increasing
Differences in direction of tradeExport southern periphery less oriented to core, more insideCore more oriented towards emerging markets
Differences in export regressionsExport composition matters
PoliciesStructural development: increasing technology intensity takes timeSouthern periphery: relatively strong response to improvement in price
competitiveness
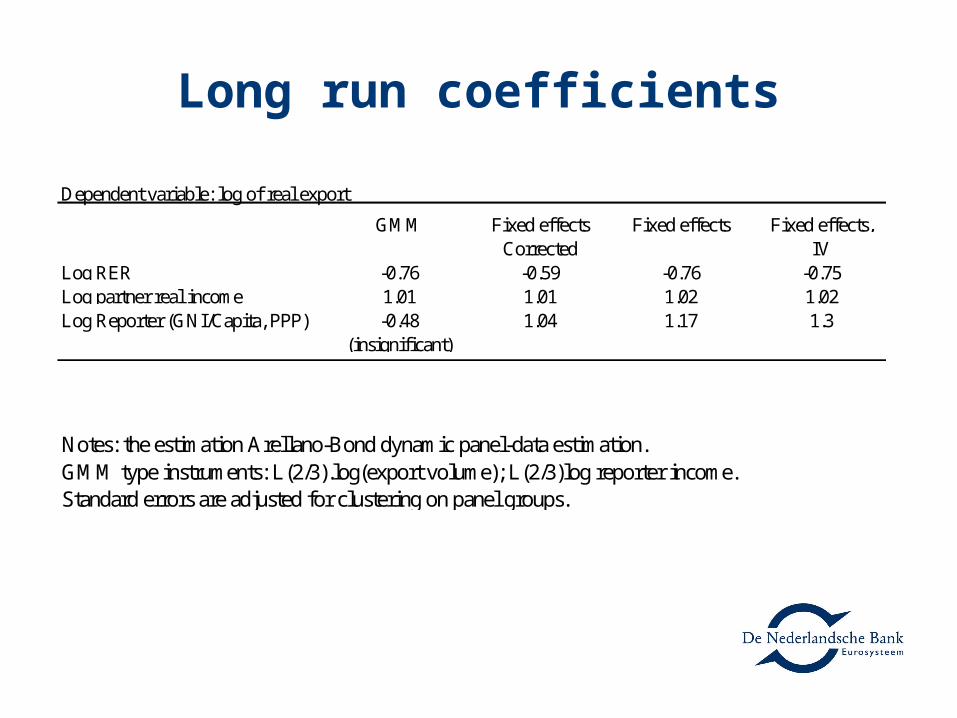
Long run coefficients
Dependent variable: log of real export
Fixed effects Fixed effects Fixed effects,Corrected IV
Log RER -0.76 -0.59 -0.76 -0.75Log partner real income 1.01 1.01 1.02 1.02
-0.48(insignificant)
GMM
Log Reporter (GNI/Capita, PPP) 1.04 1.17 1.3
Notes: the estimation Arellano-Bond dynamic panel-data estimation.GMM type instruments: L(2/3).log(export volume); L(2/3)log reporter income.Standard errors are adjusted for clustering on panel groups.
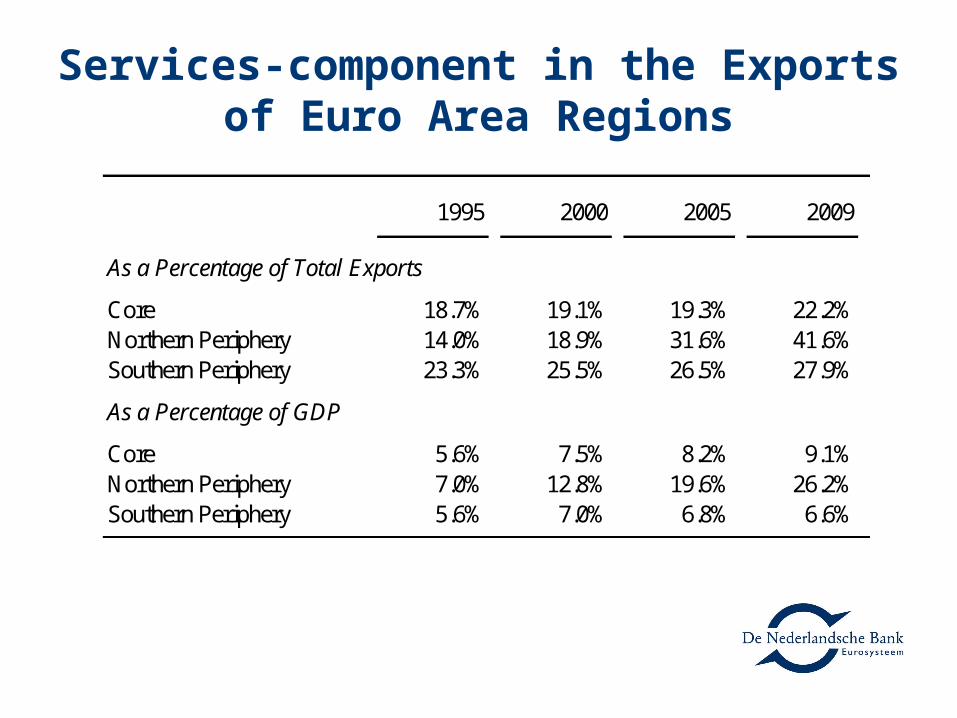
Services-component in the Exports of Euro Area Regions
1995 2000 2005 2009
As a Percentage of Total Exports
Core 18.7% 19.1% 19.3% 22.2%Northern Periphery 14.0% 18.9% 31.6% 41.6%Southern Periphery 23.3% 25.5% 26.5% 27.9%
As a Percentage of GDP
Core 5.6% 7.5% 8.2% 9.1%Northern Periphery 7.0% 12.8% 19.6% 26.2%Southern Periphery 5.6% 7.0% 6.8% 6.6%
Top Related