


Languages
Pages
Legal

National Cancer Institute CARCINOGENESIS Technical Report Series No. 154 1979
BIOASSAY OF
AZOBENZENE
FOR POSSIBLE CARCINOGENICITY
CAS No. 103-33-3
NCI-CG-TR-154
U.S. DEPARTMENT OF HEALTH, EDUCATION, AND WELFARE Public Health Service National Institutes of Health


BIOASSAY OF
AZOBENZENE
FOR POSSIBLE CARCINOGENICITY
Carcinogenesis Testing Program Division of Cancer Cause and Prevention
National Cancer Institute National Institutes of Health Bethesda, Maryland 20014
U. S. DEPARTMENT OF HEALTH, EDUCATION, AND WELFARE Public Health Service
National Institutes of Health
DHEW Publication No. (NIH) 79-1710

ii

BIOASSAY OF AZOBENZENE
FOR POSSIBLE CARCINOGENICITY
Carcinogenesis Testing Program Division of Cancer Cause and Prevention
National Cancer Institute National Institutes of Health
FOREWORD; This report presents the results of the bioassay of azobenzene conducted for the Carcinogenesis Testing Program, Division of Cancer Cause and Prevention, National Cancer Institute (NCI), National Institutes of Health, Bethesda, Maryland. This is one of a series of experiments designed to determine whether selected chemicals have the capacity to produce cancer in animals. A negative ^esult, in which the test animals do not have a greater incidence of cancer than control animals, does not: necessarily mean that a test chemical i not a carcinogen, inasmuch as the experiments are conducted under a limited set of circumstances. A positive results demonstrates that a test chemical is carcinogenic for animals under the conditions of the test and indicate that exposure to the chemical is a potential risk to man. The actual determination of the risk to man from chemicals found to be carcinogenic in animals requires a wider analysis.
CONTRIBUTORS; This bioassay of azobenzene was conducted at the NCI Frederick Cancer Research Center (FCRC) (1), Frederick, Maryland, for NCI (2) by Litton Bionetics, Inc.
The manager of the bioassay at FCRC was Dr. B. Ulland, the toxicologist was Dr. E. Gordon, and Drs. R. Cardy and D. Creasia compiled the data. Ms. S. Toms was responsible for management of data, Mr. D. Cameron for management of histopathology, Mr. L. Callahan for management of the computer branch, and Mr. R. Cypher for management of the facilities. Mr. A. Butler performed the computer services. Histopathologic evaluations for rats and mice were performed by Dr. B. Ulland (1). The diagnoses included in this report represent his interpretations.
ill
Animal pathology tables and survival tables were compiled at EG&G Mason Research Institute (3). Statistical analyses were performed by Dr. J. R. Joiner (4) and Ms. P. L. Yong (4), using methods selected for the bioassay program by Dr. J. J. Gart (5). The chemicals used in this bioassay were analyzed at FCRC by Dr. W. Zielinsky (1). The chemical narrative and analyses were reviewed and approved by Dr. W. Lijinsky (1).
This report was prepared at Tracer Jitco (4) under the direction of NCI. Those responsible for the report at Tracer Jitco were Dr. C. R. Angel, Acting Director of the Bioassay Program; Dr. S. S. Olin, Deputy Director for Science; Dr. J. F. Robens, toxicologist; Dr. R. L. Schueler, pathologist; Dr. G. L. Miller, Ms. L. A. Owen, Ms. M. S. King, and Mr. W. D. Reichardt, bioscience writers; and Dr. E. W. Gunberg, technical editor, assisted by Ms. Y. E. Presley.
The following scientists at NCI were responsible for evaluating the bioassay experiment, interpreting the results, and reporting the findings: Dr. Kenneth C. Chu, Dr. Cipriano Cueto, Jr., Dr. J. Fielding Douglas, Dr. Richard A. Griesemer, Dr. Thomas E. Hamm, Dr. William V. Hartwell, Dr. Morton H. Levitt, Dr. Harry A. Milman, Dr. Thomas W. Orme, Dr. A. R. Patel, Dr. Sherman F. Stinson, Dr. Jerrold M. Ward, and Dr. Carrie E. Whitmire.
(1) Frederick Cancer Research Center, P.O. Box B, Frederick, Maryland.
(2) Carcinogenesis Testing Program, Division of Cancer Cause and Prevention, National Cancer Institute, National Institutes of Health, Bethesda, Maryland.
(3) EG&G Mason Research Institute, 1530 East Jefferson Street, Rockville, Maryland.
(4) Tracor Jitco, Inc., 1776 East Jefferson Street, Rockville, Maryland.
(5) Mathematical Statistics and Applied Mathematics Section, Biometry Branch, Field Studies and Statistics, Division of Cancer Cause and Prevention, National Cancer Institute, National Institutes of Health, Bethesda, Maryland.
IV
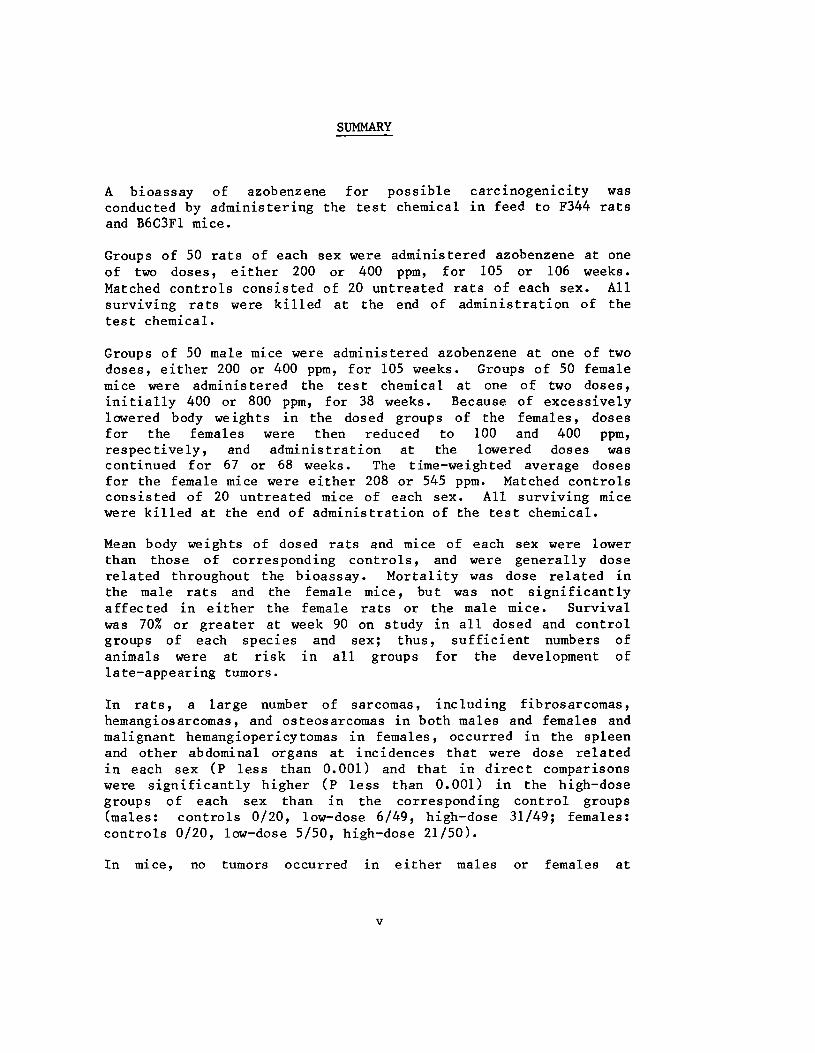
SUMMARY
A bioassay of azobenzene for possible carcinogenicity was conducted by administering the test chemical in feed to F344 rats and B6C3F1 mice.
Groups of 50 rats of each sex were administered azobenzene at one of two doses, either 200 or 400 ppm, for 105 or 106 weeks. Matched controls consisted of 20 untreated rats of each sex. All surviving rats were killed at the end of administration of the test chemical.
Groups of 50 male mice were administered azobenzene at one of two doses, either 200 or 400 ppm, for 105 weeks. Groups of 50 female mice were administered the test chemical at one of two doses, initially 400 or 800 ppm, for 38 weeks. Because of excessively lowered body weights in the dosed groups of the females, doses for the females were then reduced to 100 and 400 ppm, respectively, and administration at the lowered doses was continued for 67 or 68 weeks. The time-weighted average doses for the female mice were either 208 or 545 ppm. Matched controls consisted of 20 untreated mice of each sex. All surviving mice were killed at the end of administration of the test chemical.
Mean body weights of dosed rats and mice of each sex were lower than those of corresponding controls, and were generally dose related throughout the bioassay. Mortality was dose related in the male rats and the female mice, but was not significantly affected in either the female rats or the male mice. Survival was 70% or greater at week 90 on study in all dosed and control groups of each species and sex; thus, sufficient numbers of animals were at risk in all groups for the development of late-appearing tumors.
In rats, a large number of sarcomas, including fibrosarcomas, hemangiosarcomas, and osteosarcomas in both males and females and malignant hemangiopericytomas in females, occurred in the spleen and other abdominal organs at incidences that were dose related in each sex (P less than 0.001) and that in direct comparisons were significantly higher (P less than 0.001) in the high-dose groups of each sex than in the corresponding control groups (males: controls 0/20, low-dose 6/49, high-dose 31/49; females: controls 0/20, low-dose 5/50, high-dose 21/50).
In mice, no tumors occurred in either males or females at

incidences that were significantly higher in the dosed groups than in the corresponding control groups.
It is concluded that under the conditions of this bioassay, azobenzene was carcinogenic (sarcomagenic) for F344 rats, inducing various types of sarcomas in the spleen and other abdominal organs of both males and females. The test chemical was not carcinogenic for B6C3F1 mice of either sex.
vi
TABLE OF CONTENTS
I. Introduction. 1
II. Materials and Methods 3
A. Chemical 3 B. Dietary Preparation 3 C. Animals 4 D. Animal Maintenance 5 E. Subchronic Studies.... 7 F. Chronic Studies 11 G. Clinical and Pathologic Examinations 11 H. Data Recording and Statistical Analyses 14
III. Results - Rats 21
A. Body Weights and Clinical Signs (Rats) 21 B. Survival (Rats) 21 C. Pathology (Rats) 24 D. Statistical Analyses of Results (Rats) 27
IV. Results - Mice /. 31
A. Body Weights and Clinical Signs (Mice) 31 B. Survival (Mice) 31 C. Pathology (Mice) 34 D. Statistical Analyses of Results (Mice) 36
V. Discussion 37
VI. Bibliography 41
APPENDIXES
Appendix A Summary of the Incidence of Neoplasms in Rats Administered Azobenzene in the Diet 43
Table Al Summary of the Incidence of Neoplasms in Male Rats Administered Azobenzene in the Diet 45
Table A2 Summary of the Incidence of Neoplasms in Female Rats Administered Azobenzene in the Diet 49
vii
Page
Appendix B Summary of the Incidence of Neoplasms in Mice Administered Azobenzene in the Diet 53
Table Bl Summary of the Incidence of Neoplasms in Male Mice Administered Azobenzene in the Diet 55
Table B2 Summary of the Incidence of Neoplasms in Female Mice Administered Azobenzene in the Diet 58
Appendix C Summary of the Incidence of Nonneoplastic Lesions in Rats Administered Azobenzene in the Diet 63
Table Cl Summary of the Incidence of Nonneoplastic Lesions in Male Rats Administered Azobenzene in the Diet 65
Table C2 Summary of the Incidence of Nonneoplastic Lesions in Female Rats Administered Azobenzene in the Diet 70
Appendix D Summary of the Incidence of Nonneoplastic Lesions in Mice Administered Azobenzene in the Diet 75
Table Dl Summary of the Incidence of Nonneoplastic Lesions in Male Mice Administered Azobenzene in the Diet 77
Table D2 Summary of the Incidence of Nonneoplastic Lesions in Female Mice Administered Azobenzene in the Diet 81
Appendix E Analyses of the Incidence of Primary Tumors in Rats Administered Azobenzene in the Diet.... 85
Table El Analyses of the Incidence of Primaryin Male Rats Administered Azobenzene in the Diet
Tumors
87
Table E2 Analyses of the Incidence of Primary Tumors in Female Rats Administered Azobenzene in the Diet 94
viil

Page
Appendix F Analyses of the Incidence of Primary Tumors in Mice Administered Azobenzene in the Diet 101
Table Fl Analyses of the Incidence of Primary Tumors in Male Mice Administered Azobenzene in the Diet 103
Table F2 Analyses of the Incidence of Primary Tumors in Female Mice Administered Azobenzene in the Diet 107
TABLES
Table 1 Azobenzene Subchronic Feeding Studies in Rats and Mice 8
Table 2 Azobenzene Chronic Feeding Studies in Rats 12
Table 3 Azobenzene Chronic Feeding Studies in Mice 13
FIGURES
Figure 1 Growth Curves for Rats Administered Azobenzene in the Diet 22
Figure 2 Survival Curves for Rats Administered Azobenzene in the Diet 23
Figure 3 Growth Curves for Mice Administered Azobenzene in the Diet 32
Figure 4 Survival Curves for Mice Administered Azobenzene in the Diet 33
ix

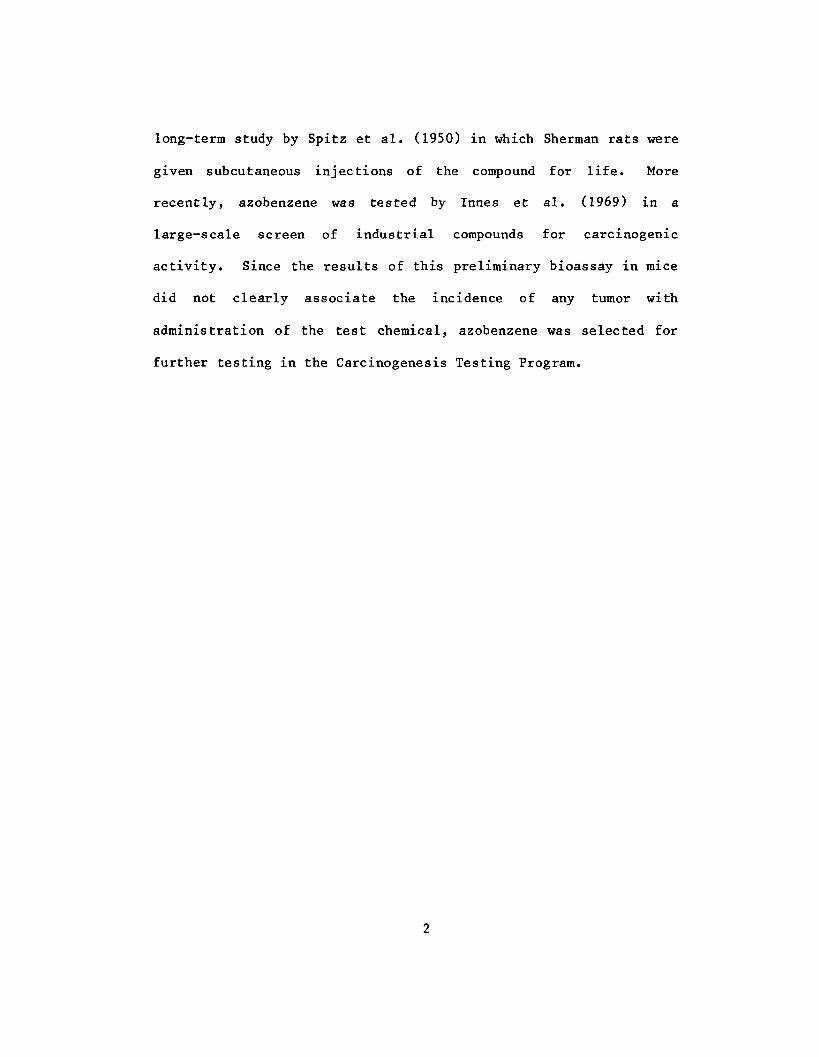
I. INTRODUCTION
Azobenzene (CAS 103-33-3; NCI
C02926) occurs as a by-product
during the manufacture of
benzidine (Noller, 1965; Lurie,
1964). Benzidine is a widely used
intermediate for the azo dyes and Azobenzene
other organic chemicals and is a
carcinogen (Department of Labor, 1974). Azobenzene itself has no
known uses as a dyestuff and is produced only in small quantities
for research purposes (International Agency for Research on
Cancer, 1975).
Since 1950, there has been documented evidence of an increased
risk of bladder cancer in persons employed in the dye industries
(International Agency for Research on Cancer, 1975). Although it
has not been possible to identify the causative dyes or
intermediates by these epidemiological studies, some compounds
have been shown to be carcinogenic in animal studies. Azobenzene
has been regarded in the literature as a noncarcinogen (Daoust
and Calamai, 1971; Eldredge and Luck, 1952), as a result of a
long-term study by Spitz et al. (1950) in which Sherman rats were
given subcutaneous injections of the compound for life. More
recently, azobenzene was tested by Innes et al. (1969) in a
large-scale screen of industrial compounds for carcinogenic
activity. Since the results of this preliminary bioassay in mice
did not clearly associate the incidence of any tumor with
administration of the test chemical, azobenzene was selected for
further testing in the Carcinogenesis Testing Program.

II. MATERIALS AND METHODS
A. Chemical
Azobenzene (diphenyldiimide; azobenzide) was obtained from
Eastman Chemical Company as a hard, dark-orange, crystalline
material. Its purity was determined at Frederick Cancer Research
Center using gas-liquid chromatography (GLC) to be 99.5%, with up
to six minor contaminants and a melting point of 66 C (liter
ature: 68 C). Mass spectral analysis gave a molecular ion at
m/e 182 and a base peak at m/e 77. The infrared spectrum was
consistent with its structure, and was identical to that of a
standard.
B. Dietary Preparation
Test diets containing azobenzene were prepared in 6-kg batches at
the appropriate doses. A known weight of the chemical was first
mixed with an equal weight of autoclaved Wayne® Sterilizable
Lab Meal with 4% fat (Allied Mills, Inc., Chicago, 111.), using a
mortar and pestle. The mixing was continued with second and
third additions of feed, and final mixing was performed with the
remaining quantity of feed for a minimum of 15 minutes in a
Patterson-Kelly twin-shell blender with an intensifier bar.
Detailed GLC analyses of aliquots of azobenzene-feed mixtures
taken from various locations in the blender showed that the
mixture was homogeneous.
C. Animals
Male and female F344 (Fischer) rats and B6C3F1 mice were obtained
as 4-week-old weanlings, all within 3 days of the same age, from
the NCI Frederick Cancer Research Center animal farm (Frederick,
Md.). The animals were housed within the test facility for 2
weeks and were then assigned four rats to a cage and five mice to
a cage on a weight basis for each cage of animals of a given
species and sex. For use in the chronic study, the male rats
were required to weigh 90 to 105 g, averaging at least 100 g; the
female rats, 80 to 95 g, averaging at least 90 g; the male mice,
18 to 22 g, averaging at least 19.5 g; and the female mice, 17 to
21 g, averaging at least 18.5 g. Individual animals were
identified by ear punch.
D. Animal Maintenance
The animals were boused in polycarbonate cages (Lab Products,
Inc., Garfield, N.J.), 19 x 10-1/2 x 8 inches for the rats and
11-1/2 x 7-1/2 x 5 inches for the mice, which were suspended from
aluminum racks (Scientific Cages, Inc., Bryan, Tex.) and were
covered by nonwoven polyester-fiber 12-mil-thick filter paper
(Hoeltge, Inc., Cincinnati, Ohio). The bedding used was
®Absorb-dri hardwood chips (Northeastern Products, Inc.,
Warrenburg, N. Y.). The feed supplied was presterilized Wayne
Sterilizable Lab Meal, provided ad_ libitum in suspended stainless
steel hoppers and replenished at least three times per week.
Water, acidified to pH 2.5, was supplied ad_ libitum from glass
bottles. Sipper tubes (Lab Products, Inc.) were suspended
through the tops of the cages.
The contaminated bedding was disposed of through an enclosed
vacuum line that led to a holding tank from which the bedding was
fed periodically into an incinerator. The cages were sanitized
twice per week and the feed hoppers twice per month at 82 to
88 C in a tunnel-type cagewasher (Industrial Washing Corp.,
Mataway, N. J.), using the detergents, Clout® (Pharmacal
Research Laboratories, Greenwich, Conn.) or Oxford D'Chlor
(Oxford Chemicals, Atlanta, Ga.).

The glass bottles and sipper tubes were sanitized at 82 to 88 C
in a tunnel-type bottle washer (Consolidated Equipment Supply
Co., Mercersburg, Pa.) three times per week, using a Calgen
Commercial Division detergent (St. Louis, Mo.). The racks for
the cages were sanitized at or above 82 C in a rack washer
(Consolidated Equipment Supply Co.) once per month, using Calgen
Commercial Division detergent, and the filter paper was changed
at the same time.
The air in the aniiflal rooms was maintained at 22 to 24 C and 45
to 55% relative humidity. Fresh air was passed through a filter
of 65% efficiency and a bag filter of 95% efficiency at the
intake and through a "Z"-type roughing filter of 30% efficiency
and a bag system of 90 to 95% efficiency at the exhaust (American
Air Filters, Louisville, Ky.; Mine Safety Appliances, Pittsburgh,
Pa.); the air was not recirculated. Room air was changed 15
times per hour. The air pressure was maintained negative to a
clean hallway and positive to a return hallway. Fluorescent
lighting was provided automatically on a 12-hour-per-day cycle.
Rats administered azobenzene and their corresponding controls
were housed in the same room as rats on feeding studies of the
following chemicals:
(CAS 72-56-0) p,p'-ethyl-DDD (CAS 120-62-7) piperonyl sulfoxide

Mice administered azobenzene and their corresponding controls
were housed in the same room as mice on feeding studies of the
following chemicals:
(CAS 128-66-5) C. I. vat yellow 4 (CAS 72-56-0) p,p'-ethyl-DDD (CAS 20941-65-5) ethyl tellurac (CAS 298-00-0) methyl parathion (CAS 85-44-9) phthalic anhydride (CAS 51-03-6) piperonyl butoxide (CAS 86-06-2) 2,4,6-trichlorophenol
E. Subchronic Studies
Subchronic feeding studies were conducted to estimate the maximum
tolerated doses (MTD's) of azobenzene, on the basis of which two
concentrations (referred to in this report as "low" and "high"
doses) were selected for administration in the chronic studies.
Groups of five rats of each sex and five mice of each sex were
fed diets containing azobenzene at one of several doses, and
groups of five control animals of each species and sex were
administered basal diet only. The test chemical was administered
for 7 weeks, followed by 1 week of additional observation. Each
animal was weighed twice per week. Table 1 shows the survival of
animals in each dose group at the end of the study and the week
on study when the last death occurred; the table also shows the
mean body weights of each dosed group at week 7, expressed as
percentages of mean body weights of controls. At the end of the
7
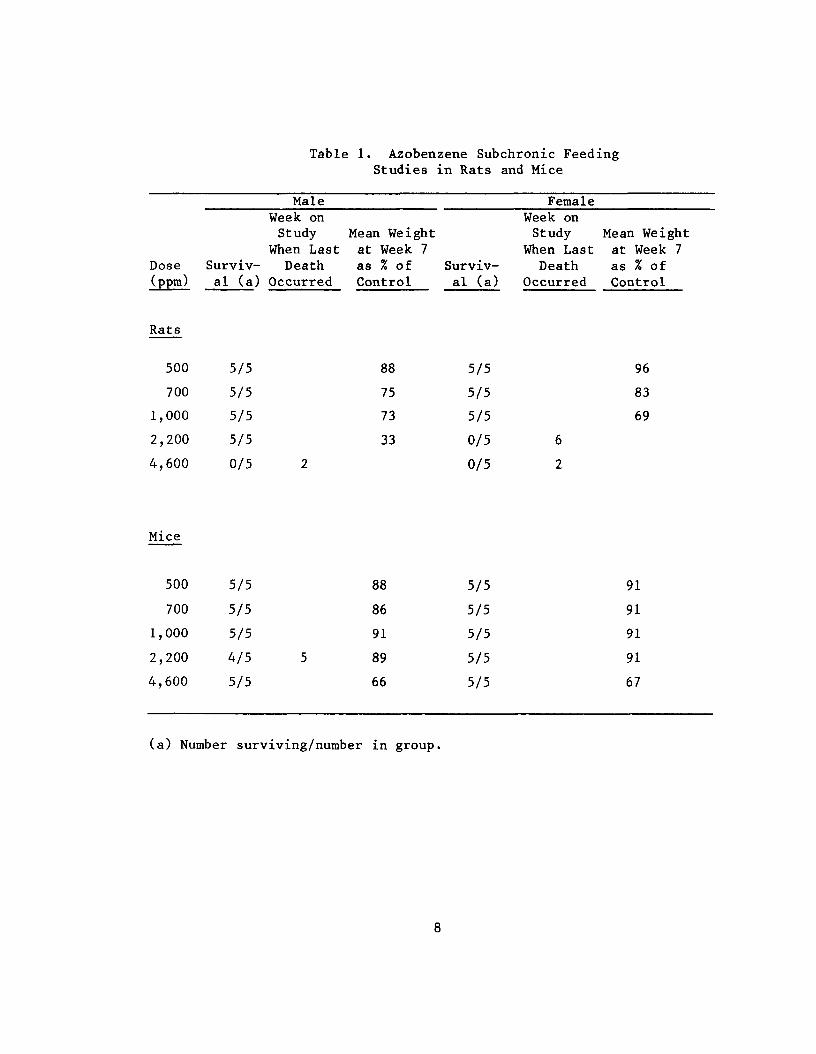
Table 1. Azobenzene Subchronic Feeding Studies in Rats and Mice
Male Female Week on Week on Study Mean Weight Study Mean Weight
When Last at Week 7 When Last at Week 7 Dose Surviv Death as % of Surviv- Death as % of (ppm) al (a) Occurred Control al (a) Occurred Control
Rats
500 5/5 88 5/5 96
700 5/5 75 5/5 83
1,000 5/5 73 5/5 69
2,200 5/5 33 0/5 6
4,600 0/5 2 0/5 2
Mice
500 5/5 88 5/5 91
700 5/5 86 5/5 91
1,000 5/5 91 5/5 91
2,200 4/5 5 89 5/5 91
4,600 5/5 66 5/5 67
(a) Number surviving/number in group.

subchronic studies, all animals were killed using C0? and
necropsied.
Groups of male and female rats receiving doses of 2,200 or 4,600
ppm were observed during clinical examination to be emaciated.
At necropsy, the groups of rats receiving the four highest doses
had slightly enlarged livers. Histopathologic changes due to
administration of the azobenzene were noted in the kidneys and
livers of male and female rats dosed at 1,000 or 2,200 ppm. In
these animals the proximal convoluted tubules of the kidney
contained generally moderate amounts of granular,
yellowish-brown, intracytoplasmic pigment. Trace to moderate
amounts of centrilobular cytoplasmic vacuolation of hepatocytes,
suggestive of lipidosis, occurred in six male rats. Trace to
very small amounts of bile stasis were noted in the livers of
both males and females. The hepatic changes indicated mild
injury. Pigmentation of renal tubules was considered to
represent accumulation of lipofuscin in association with mild
degenerative changes in the tubular epithelium.
No clinical signs were observed during examination of male and
female mice in the groups dosed at 4,600 ppm. At necropsy the
groups of mice receiving the four highest doses had enlarged
spleens and mesenteric nodes. Trace to very slight stasis of the
bile, trace to very slight granular intracytoplasmic pigmentation
of the proximal convoluted tubular epithelium, and slight
pigmentation of the splenic red pulp were noted in all animals
examined.
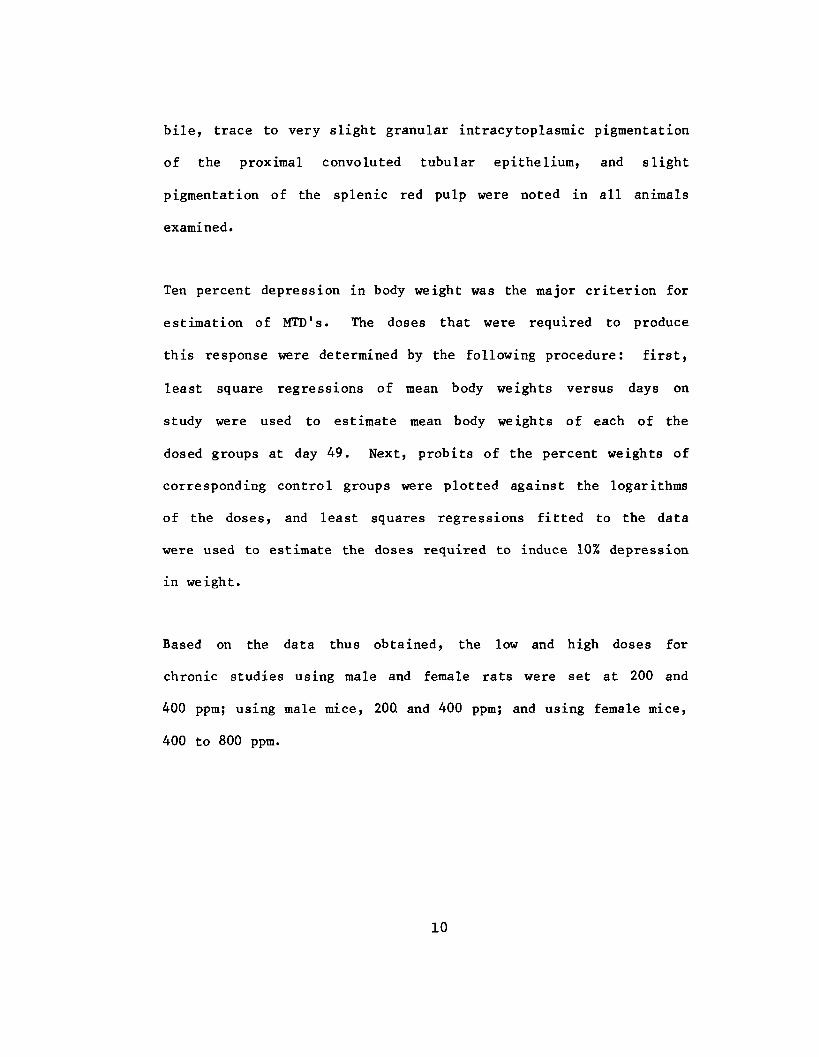
Ten percent depression in body weight was the major criterion for
estimation of MTD's. The doses that were required to produce
this response were determined by the following procedure: first,
least square regressions of mean body weights versus days on
study were used to estimate mean body weights of each of the
dosed groups at day 49. Next, probits of the percent weights of
corresponding control groups were plotted against the logarithms
of the doses, and least squares regressions fitted to the data
were used to estimate the doses required to induce 10% depression
in weight.
Based on the data thus obtained, the low and high doses for
chronic studies using male and female rats were set at 200 and
400 ppm; using male mice, 200. and 400 ppm; and using female mice,
400 to 800 ppm.
10

F. Chronic Studies
The test groups, doses administered, and durations of the chronic
feeding studies are shown in tables 2 and 3. Due to excessive
weight depression in the dosed female mice, doses for the low-
and high-dose groups were reduced to 100 and 400 ppm,
respectively, after week 38.
G. Clinical and Pathologic Examinations
All animals were observed twice daily. Observations for sick,
tumor-bearing, and moribund animals were recorded daily.
Clinical examination and palpation for masses were performed each
month, and the animals were weighed at least once per month.
Moribund animals and animals that survived to the end of the
bioassay were killed using CCL and necropsied.
The pathologic evaluation consisted of gross and microsocopic
examination of major tissues, major organs, and all gross
lesions. The tissues were preserved in 10% buffered formalin,
embedded in paraffin, sectioned, and stained with hematoxylin and
eosin. The following tissues were examined microscopically:
skin, lungs and bronchi, trachea, bone marrow (femur), spleen,"
11

Table 2. Azobenzene Chronic Feeding Studies in Rats
Sex and Initial Azobenzene Time on Test No. of in Diet (b) Study Group Animals (a) (ppm) (weeks)
Male
Matched-Control 20 0 106
Low-Dose 50 200 106
High -Dose 50 400 105
Female
Mat ched-Contro 1 20 0 106
Low-Dose 50 200 106
High-Dose 50 400 105-106
(a) All animals were 6 weeks of age when placed on study.
(b) Test and control diets were provided ad libitum 7 days per week.
12
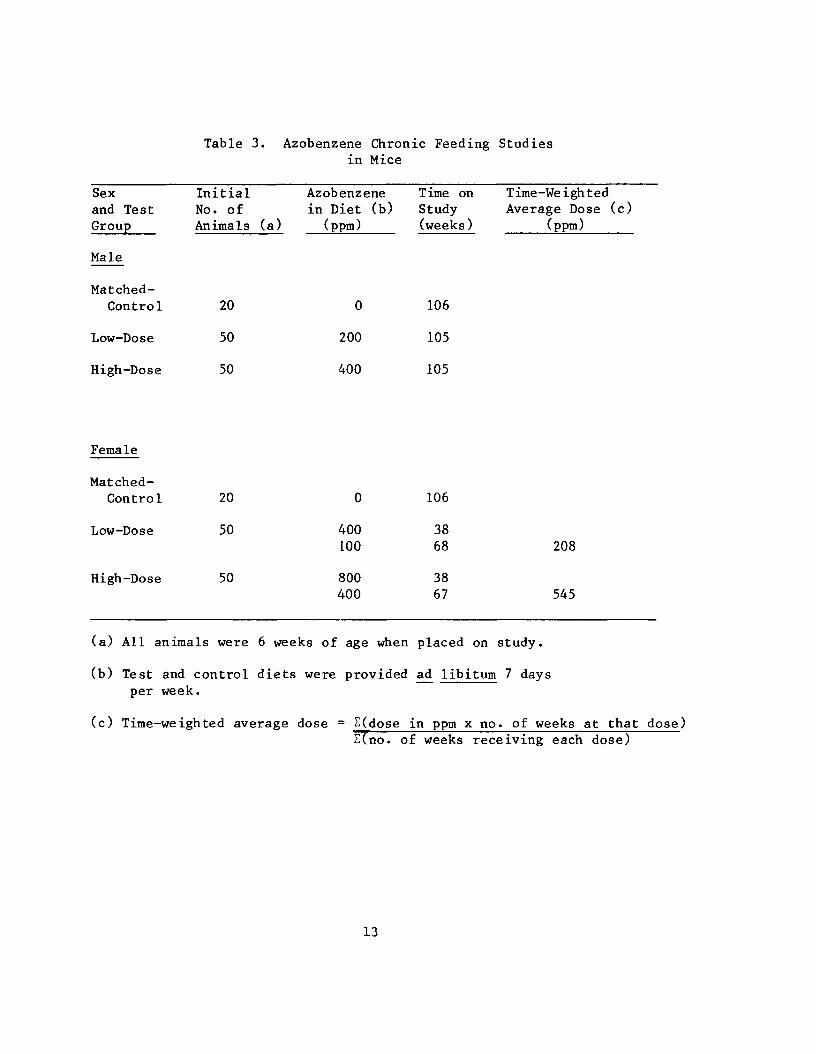
Table 3. Azobenzene Chronic Feeding Studies in Mice
Sex Initial Azobenzene Time on Time-Weighted and Test No. of in Diet (b) Study Average Dose (c) Group Animals (a) (ppm) (weeks) (ppm)
Male
Matched-Control 20 0 106
Low-Dose 50 200 105
High -Dose 50 400 105
Female
Matched-Control 20 0 106
Low-Dose 50 400 38 LOO 68 208
High-Dose 50 800 38 400 67 545
(a) All animals were 6 weeks of age when placed on study.
(b) Test and control diets were provided ad libitum 7 days per week.
(c) Time-weighted average dose = £(dose in ppm x no. of weeks at that dose) . of weeks receiving each dose)
13

lymph nodes (mesenteric and submandibular), thymus, heart,
salivary glands (parotid, sublingual, and submaxillary), liver,
pancreas, esophagus, stomach (glandular and nonglandular), small
and large intestines, kidney, urinary bladder, pituitary,
adrenal, thyroid, parathyroid, testis, prostate, mammary gland,
uterus, ovary, brain (cerebrum and cerebellum), and all tissue
masses. Peripheral blood smears also were made for all animals,
whenever possible.
Necropsies were also performed on all animals found dead, unless
precluded in whole or in part by autolysis or cannibalization.
Thus, the number of animals from which particular organs or
tissues were examined microscopically varies and does not
necessarily represent the number of animals that were placed on
study in each group.
H. Data Recording and Statistical Analyses
Pertinent data on this experiment have been recorded in an
automatic data processing system, the Carcinogenesis Bioassay
Data System (Linhart et al., 1974). The data elements include
descriptive information on the chemicals, animals, experimental
design, clinical observations, survival, body weight, and
14

individual pathologic results, as recommended by the
International Union Against Cancer (Berenblum, 1969). Data
tables were generated for verification of data transcription and
for statistical review.
These data were analyzed using the appropriate statistical
techniques described in this section. Those analyses of
experimental results that bear on the possibility of
carcinogenicity are discussed in the statistical narrative
section.
Probabilities of survival were estimated by the product-limit
procedure of Kaplan and Meier (1958) and are presented in this
report in the form of graphs. Animals were statistically
censored as of the time that they died of other than natural
causes or were found to be missing; animals dying from natural
causes were not statistically censored. Statistical analyses for
a possible dose-related effect on survival used the method of Cox
(1972) for testing two groups for equality and Tarone's (1975)
extensions of Cox's methods for testing for a dose-related
trend. One-tailed P values have been reported for all tests
except the departure from linearity test, which is only reported
when its two-tailed P values is less than 0.05.
15
The incidence of neoplastic or nonneoplastic lesions has been
given as the ratio of the number of animals bearing such lesions
at a specific anatomic site (numerator) to the number of animals
in which that site is examined (denominator). In most instances,
the denominators included only those animals for which that site
was examined histologically. However, when macroscopic
examination was required to detect lesions prior to histologic
sampling (e.g., skin or mammary tumors), or when lesions could
have appeared at multiple sites (e.g., lymphomas), the
denominators consist of the number of animals necropsied.
The purpose of the statistical analyses of tumor incidence is to
determine whether animals receiving the test chemical developed a
significantly higher proportion of tumors than did the control
animals. As a part of these analyses, the one-tailed Fisher
exact test (Cox, 1970) was used to compare the tumor incidence of
a control group with that of a group of dosed animals at each
dose level. When results for a number of dosed groups (k) are
compared simultaneously with those for a control group, a
correction to ensure an overall significance level of 0.05 may be
made. The Bonferroni inequality (Miller, 1966) requires that the
P value for any comparison be less than or equal to 0.05/k. In
cases where this correction was used, it is discussed in the
16

narrative section. It is not, however, presented in the tables,
where the Fisher exact P values are shown.
The Cochran-Armitage test for linear trend in proportions, with
continuity correction (Armitage, 1971), was also used. Under the
assumption of a linear trend, this test determines if the slope
of the dose-response curve is different from zero at the
one-tailed 0.05 level of significance. Unless otherwise noted,
the direction of the significant trend is a positive dose
relationship. This method also provides a two-tailed test of
departure from linear trend.
A time-adjusted analysis was applied when numerous early deaths
resulted from causes that were not associated with the formation
of tumors. In this analysis, deaths that occurred before the
first tumor was observed were excluded by basing the statistical
tests on animals that survived at least 52 weeks, unless a tumor
was found at the anatomic site of interest before week 52. When
such an early tumor was found, comparisons were based exclusively
on animals that survived at least as long as the animal in which
the first tumor was found. Once this reduced set of data was
obtained, the standard procedures for analyses of the incidence
of tumors (Fisher exact tests, Cochran-Armitage tests, etc.) were
followed.
17

When appropriate, life-table methods were used to analyze the
incidence of tumors. Curves of the proportions surviving without
an observed tumor were computed as in Saffiotti et al. (1972).
The week during which an animal died naturally or was sacrificed
was entered as the time point of tumor observation. Cox's
methods of comparing these curves were used for two groups;
Tarone's extension to testing for linear trend was used for three
groups. The statistical tests for the incidence of tumors which
used life-table methods were one-tailed and, unless otherwise
noted, in the direction of a positive dose relationship.
Significant departures from linearity (P less than 0.05,
two-tailed test) were also noted.
The approximate 95 percent confidence interval for the relative
risk of each dosed group compared with its control was calculated
from the exact interval on the odds ratio (Gart, 1971). The
relative risk is defined as P../P where p is the true
binomial probability of the incidence of a specific type of tumor
in a dosed group of animals and p is the true probability of
the spontaneous incidence of the same type of tumor in a control
group. The hypothesis of equality between the true proportion of
a specific tumor in a dosed group and the proportion in a control
group corresponds to a relative risk of unity. Values in excess
18

of unity represent the condition of a larger proportion in the
dosed group than in the control.
The lower and upper limits of the confidence interval of the
relative risk have been included in the tables of statistical
analyses. The interpretation of the limits is that in
approximately 95% of a large number of identical experiments, the
true ratio of the risk in a dosed group of animals to that in a
control group would be within the interval calculated from the
experiment. When the lower limit of the confidence interval is
greater than one, it can be inferred that a statistically
significant result (P less than 0.025 one-tailed test when the
control incidence is not zero, P less than 0.050 when the control
incidence is zero) has occurred. When the lower limit is less
than unity, but the upper limit is greater than unity, the lower
limit indicates the absence of a significant result while the
upper limit indicates that there is a theoretical possibility of
the induction of tumors by the test chemical, which could not be
detected under the conditions of this test.
19

20
III. RESULTS - RATS
A. Body Weights and Clinical Signs (Rats)
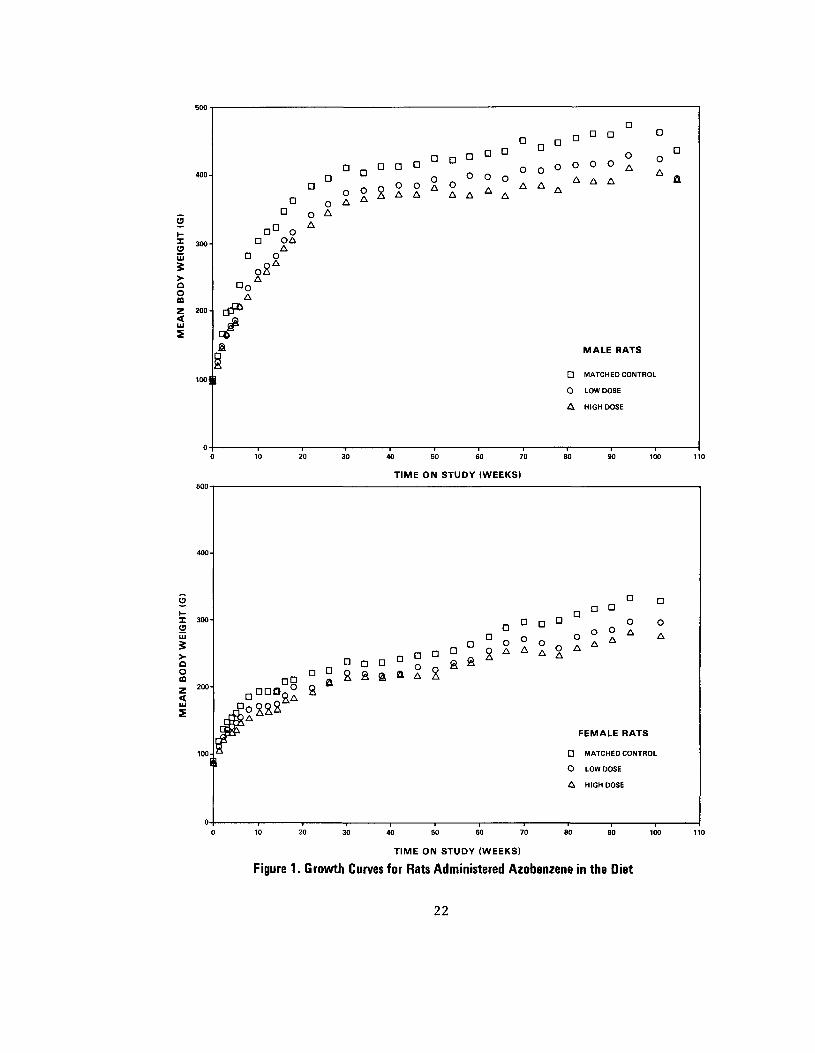
Mean body weights of dosed male and female rats were lower than
those of corresponding controls and were dose related throughout
the bioassay (figure 1). Fluctuation in the growth curves may be
due to mortality; as the size of a group diminishes, the mean
body weight may be subject to variation. Other clinical signs,
such as corneal opacity and tissue masses, occurred at low
incidences and were common to dosed and control groups.
B. Survival (Rats)
The Kaplan and Meier curves estimating the probabilities of
survival for male and female rats administered azobenzene in the
diet at the doses of this bioassay, together with those of the
matched controls, are shown in figure 2. In male rats, the
result of the Tarone test for positive, dose-related trend in
mortality is significant (P less than 0.001). An indicated
departure from linear trend is observed (P less than 0.001)
because the low-dose animals survived longer than the control
21
TIME ON STUDY (WEEKS)
Figure 1. Growth Curves for Rats Administered Azobenzene in the Diet
22

TIME ON STUDY (WEEKS)
Figure 2. Survival Curves for Rats Administered Azobenzene in the Diet
23
animals. In females, the result of the Tarone test is not
significant.
In male rats, 35/50 (70%) of the high-dose group, 47/50 (94%) of
the low-dose group, and 17/20 (85%) of the control group lived at
least as long as week 90 on study. In females, 48/50 (96%) of
the high-dose group, 44/50 (88%) of the low-dose group, and 19/20
(95%) of the control group lived at least as long as week 90 on
study.
Sufficient numbers of rats of each sex were at risk for the
development of late-appearing tumors.
C. Pathology (Rats)
Histopathologic findings on neoplasms in rats are summarized in
Appendix A, tables Al and A2; findings on nonneoplastic lesions
are summarized in Appendix C, tables Cl and C2.
Long-term feeding of azobenzene to male and female rats was
associated with a marked increase in the frequency of malignant
mesenchymal tumors involving the abdominal viscera including
mesentery and omentum. None of these neoplasms were seen in
24
control animals. These tumors often spread throughout the
abdominal cavity involving multiple tissues and organs to such an
extent that determination of the primary site was precluded. The
spectrum of mesenchymal malignancies included a striking array of
forms, from bizarre undifferentiated sarcomas to relatively well-
differentiated fibrosarcomas, osteogenic sarcomas, and vascular
neoplasms.
The abdominal organ most constantly involved was the spleen, and
the most commonly observed tumors of the spleen were
fibrosarcomas. Some were characterized by proliferating
anaplastic spindle cells forming broad sheets, the occurrence of
tumor giant cells, the presence of numerous bizarre mitoses, and
large areas of ischemic necrosis. Others were more
differentiated, having varying amounts of collagen, and were
composed of proliferating spindle cells growing in sheets and
intersecting bundles. Occasionally, these tumors contained
mature adipose tissue. Osteogenic sarcomas observed were all
well-differentiated and contained large amounts of bone, often
trabecular, and osteoid tissue. Hemangiosarcomas observed in
dosed animals varied from solid tumors composed of proliferating
sheets of spindle cells containing a myriad of cleft-like
structures or vascular channels with varying numbers of
erythrocytes to massive cavernous blood-filled tumors with
25
thick fibrotic walls and intersected by traberculae lined by
neoplastic cells. A well-differentiated hemangiopericytoma, with
a typical "whorling" pattern of proliferating pericytes was also
observed in a dosed animal.
A large number of sarcomas were observed involving multiple
organs of the abdominal cavity. These probably represent
extensions of primary splenic neoplasms. Often, nearly every
abdominal organ and tissue, including scrotal fat, was affected,
testifying to the extreme invasiveness of these tumors.
A wide variety of other neoplasms were observed in all groups,
but there was no clear-cut relationship of these neoplasms to
azobenzene exposure.
Nonproliferative lesions associated with long-term dietary intake
of azobenzene were observed in several instances. Increased
amounts of hemosiderin were deposited in the spleen, liver, and
renal tubular epithelium of dosed female rats. Chronic
capsulitis of the spleen was observed in all dosed groups of
males and females, but particularly in the females. This was
characterized by a cystic papillary proliferation of serosal
cells, thickening of the capsule, and focal collections of
mononuclear cells and mineral deposits.
26
Several low-dose male and female rats had unusual accumulations
of mature-appearing adipose tissue within the spleen, and several
females had varying degrees of fibrosis of the splenic pulp.
These changes may be within the spectrum of proliferative lesions
already discussed.
A wide variety of lesions previously found in aged F344 rats
occurred in all groups without relationship to administration of
the test chemical.
Based on the histopathologic examination, azobenzene was
carcinogenic (sarcomagenic) to F344 rats, being associated with a
high incidence of malignant mesenchymal tumors that were not
observed in control animals, under the conditions of this
bioassay. The striking array of splenic proliferative lesions
suggests that azobenzene may have an effect on primitive
reticular cells that are the precursors of the various
differentiated components.
D. Statistical Analyses of Results (Rats)
Tables El and E2 in Appendix E contain the statistical analyses
of the incidences of those primary tumors that occurred in at
27

least two animals of one group and at an incidence of at least 5%
in one or more than one group.
The result of the Cochran-Armitage test for positive dose-related
trend in the incidence of fibrosarcoma of the spleen is
significant in both male (P = 0.020) and female (P = 0.012) rats,
although the results of the Fisher exact test are not
significant. The historical records for the rats maintained as
controls at this laboratory show an incidence of tumors of 1/285
(0.4%) in males and 0/285 in females. Using the incidence of
1/285 as a parameter and assuming a binomial distribution, the
probability level of obtaining 7 or more such tumors out of 49 or
50 animals is less than 0.001.
In male rats, the result of the Cochran-Armitage test for the
incidence of fibrosarcoma of multiple organs is significant (P
less than 0.001). An indicated departure from linear trend is
observed (P = 0.030), due to the steep increase in the incidence
of tumors in the high-dose group. The Fisher exact test shows
that the incidence in the high-dose group is significantly higher
(P = 0.007) than that in the control group. The statistical
conclusion is that the incidence of fibrosarcoma of multiple
organs in male rats is associated with the administration of
28
azobenzene. No such tumor is observed at a significant incidence
in females.
In female rats, the result of the Cochran-Armitage test for the
incidence of osteosarcoma of the spleen is significant (P =
0.041), but the results of the Fisher exact test are not
significant. The historical records of this laboratory show no
such tumor among 285 control F344 female rats. Using 1/285 as a
parameter and assuming a binomial distribution, the probability
level of obtaining 5 such tumors out of 50 animals is less than
0.001.
When tests are performed using the incidences of animals with any
type of sarcoma in the abdominal cavity, the P values for
dose-related trend and for significance of direct comparisons of
high-dose and control groups are less than 0.001 for both male
and female rats.
Significant results in the negative direction are observed in the
incidences of adenomas of the pituitary and of interstitial-cell
tumors of the testis in male rats. The increased incidence in
the negative direction may be due to the earlier mortality of the
high-dose animals.
29
In summary, the incidences of male and female animals with
sarcomas in the abdominal cavity are related to the
administration of azobenzene.
30

IV. RESULTS - MICE
A. Body Weights and Clinical Signs (Mice)
Mean body weights of dosed male and female mice were lower than
those of corresponding controls, and for female mice were dose
related throughout the bioassay (figure 3). Fluctuation in the
growth curve may be due to mortality; as the size of a group
diminishes, the mean body weight may be subject to greater
variation. Other clinical signs such as alopecia, corneal
opacity, and tissue masses occurred at low incidences and were
common to both dosed and control groups.
B. Survival (Mice)
The Kaplan and Meier curves estimating the probabilities of
survival for male and female mice administered azobenzene in the
diet at the doses of this bioassay, together with those of the
matched controls, are shown in figure 4. The result of the
Tarone test for positive dose-related trend in mortality is not
significant in male mice, but is significant (P less than 0.001)
in females.
31
TIME ON STUDY (WEEKS)
Figure 3. Growth Curves for Mice Administered Azobenzene in the Diet
32
TIME ON STUDY (WEEKS)
Figure 4. Survival Curves for Mice Administered Azobenzene in the Diet
33
In male mice, 46/50 (92%) of the high-dose group, 49/50 (98%) of
the low-dose group, and 18/20 (90%) of the control group lived at
least as 'long as week 90 on study. In females, 37/50 (74%) of
the high-dose group, 43/50 (86%) of the low-dose group, and 19/20
(95%) of the control group lived at least as long as week 90 on
study.
Sufficient numbers of mice of each sex were at risk for the
development of late-appearing tumors.
C. Pathology (Mice)
Histopathologic findings on neoplasms in mice are summarized in
Appendix B, tables Bl and B2; findings on nonneoplastic lesions
are summarized in Appendix D, tables Dl and D2.
A variety of neoplasms occurred with approximately equal
frequency in dosed and control mice. The incidence,
distribution, and nature of these neoplasms are similar to those
of neoplasms commonly seen in aged B6C3F1 mice.
Several inflammatory, degenerative, and proliferative lesions
commonly seen in aged B6C3F1 mice occurred with approximately"1
34
equal frequency in dosed and control animals. The occurrence of
these lesions was unrelated to exposure to azobenzene.
Based on the histopathologic examination, changes related to
administration of azobenzene were not observed in B6C3F1 mice
receiving azobenzene under the conditions of this bioassay.
D. Statistical Analyses of Results (Mice)
Tables Fl and F2 in Appendix F contain the statistical analyses
of the incidences of those primary tumors that occurred in at
least two animals of one group and at an incidence of at least 5%
in one or more than one group.
The results of the Cochran-Armitage test for positive
dose-related trend in the incidence of tumors and the results of
the Fisher exact test comparing the incidence of tumors in the
control group with that in each dosed group in the positive
direction are not significant in either sex. However,
significant results in the negative direction are observed in the
combined incidence of liver tumors in male mice.
35

In each of the 95% confidence intervals for relative risk, shown
in the tables, the value of one or less than one is included;
this indicates the absence of significant positive results. It
should also be noted that each of the intervals, except that for
the combined incidence of liver tumors in the high-dose male
mice, has an upper limit greater than one, indicating the
theoretical possibility of the induction of tumors by azobenzene,
which could not be detected under the conditions of this test.
36

V. DISCUSSION
Mean body weights of the dosed rats and mice of each sex were
lower than those of corresponding controls, and were generally
dose related throughout the bioassay. Mortality was dose related
in the male rats and the female mice, but was not significantly
affected in the female rats and male mice. Survival was 70% or
greater at week 90 on study in all dosed and control groups of
each species and sex; thus, sufficient numbers of animals were at
risk in all groups for the development of late-appearing tumors.
In rats, a large number of animals had various types of sarcomas
of the spleen and other abdominal organs. Fibrosarcomas of the
spleen occurred at incidences that were dose related in b-,th male
(P = 0.020) and female (P = 0.012) rats, although in direct
comparisons incidences of the tumors in individual dose'1 <?roups
were not significantly higher than those in corresponding
controls (males: controls 0/20, low-dose 2/49, high-dose 7/49;
females: controls 0/20, low-dose 1/50, high-dose 7/50). The
incidence of fibrosarcomas of the spleen in historical-control
male F344 rats at this laboratory is 1/285, and in female F344
rats it is 0/285; using 1/285 as a parameter and assuming a
binomial distribution, the probability that the occurrence of 7
37
such tumors in 49 male or 50 female high-dose rats in the present
bioassay was due to chance is less than 0.001.
Fibrosarcomas of multiple organs (organs other than the spleen)
occurred at incidences that were dose related (P less than 0.001)
in the male rats, and in a direct comparison the incidence in the
high-dose group was significantly higher (P = 0.007) than that in
the control group (controls 0/20, low-dose 0/49, high-dose
13/50). In females, fibrosarcomas of multiple organs occurred
only in one high-dose animal.
Osteosarcomas of the spleen occurred at incidences that were dose
related (P = 0.041) in the female rats, although in direct
comparisons the incidences in the individual dosed groups were
not significantly higher than that in the control group (controls
0/20, low-dose 1/50, high-dose 5/50). The incidence of
osteosarcomas of the spleen in historical-control female F344
rats at this laboratory is 0/285; using 1/285 as a parameter and
assuming a binomial distribution, the probability that the
occurrence of 5 Such tumors in the 50 high-dose female rats of
the present bioassay was due to chance is less than 0.001. In
males, osteosarcomas of the spleen occurred in one low-dose male
and one high-dose male, but in no control males. Osteosarcomas
also occurred in multiple organs in three additional high-dose
38

females and in three additional high-dose males, but in no
controls of either sex.
When all types of sarcomas of the abdominal cavity were combined,
the incidences of such tumors in both male and female rats were
dose related (P less than 0.001); and in direct comparisons the
incidences of these tumors in the high-dose groups of males and
females were significantly higher (P less than 0.001) than those
in the corresponding controls (males: controls 0/20, low-dose
5/49, high-dose 31/49; females: controls 0/20, low-dose 5/50,
high-dose 21/50).
No tumors occurred in the male or female mice at incidences that
were significantly higher in the dosed groups than in the
corresponding controls.
Essentially no evidence of carcinogenicity of azobenzene for rats
or mice was obtained in early work carried out from 1936 to 1952
(Hartwell, 1963; Eldredge and Luck, 1952; Spitz et al., 1950),
and the compound has generally been considered by cancer
investigators not to be carcinogenic. In the work of Innes et
al. (international Agency for Research on Cancer, 1975; Innes et
al., 1969; NTIS, 1968), however, it was reported that when
azobenzene was administered at 21.5 mg/kg body weight by stomach
39

tube for 3 weeks, then in the diet at 56 ppm for 18 months, to
hybrid mice (B6C3F1 and B6AKF1), an elevated incidence of
hepatomas (P = 0.01) was observed in the male B6C3F1 hybrids;
nevertheless, additional evaluation was proposed. The
observation of an increased incidence of tumors of the liver in
B6C3F1 mice in the study by Innes et al. was not confirmed by the
results of the present bioassay. Damage to the spleen of the
dosed F344 rats, characterized by hemosiderosis and capsulitis,
occurred in the present bioassay; similar damage was reported for
Wistar rats fed azobenzene in the diet in previous studies (Smith
et al., 1943).
It is concluded that under the conditions of this bioassay,
azobenzene was carcinogenic (sarcomagenic) for F344 rats,
inducing various types of sarcomas in the spleen and other
abdominal organs of both males and females. The test chemical
was not carcinogenic for B6C3F1 mice of either sex.
40
VI. BIBLIOGRAPHY
Armitage, P., Statistical Methods in Medical Research, John Wiley & Sons, Inc., New York, 1971, pp. 362-365.
Berenblum. I., ed., Carcinogenicity Testing; A Report of the Panel o>f_ Careinogenicity o£ the Cancer Research Commission of the UICC, Vol. 2 . International Union Against Cancer, Geneva, 1969.
Cox, D. R., Analysis of Binary Data, Methuen and Co., Ltd., London, 1970, pp. 48-52.
Cox, D. R., Regression models and life tables. J_. R. Statist. Soc. B 34 (2):187-220, 1972.
Daoust, R. and Calamai, R., Hyperbasophilic foci as sites of neoplastic transformation in hepatic parenchyma. Cancer Res. 3J.: 1290-1296, 1971.
Department of Labor, Carcinogens - Occupational Health and Safety Standards. Federal Register 39 (20);3756-3757.
Eldredge, N. T. and Luck, J. M., Electrophoretic studies on the water-soluble proteins of liver during azo dye carcinogenesis in the rats. Cancer Res. 12 801-806, 1952.
Gart, J. J., The comparison of proportions: a review of significance tests, confidence limits and adjustments for stratification. Rev. Int. Stat. Inst. 39_:148-169, 1971.
Hartwell, J. L., Survey £f Compounds Which Have Been Tested for Carcinogenic Activity. Public Health Service Publication No. 149, National Cancer Institute, National Institutes of Health, Bethesda, Md., 1963.
Innes, J. R. M., Ulland, B. M., Valeric, M. G., Petrucelli, L., Fishbein, L., Hart, E. R., Pallota, A. J., Bates, R. R., Falk, H. L., Gart, J. J., Klein, M., Mitchell, I., and Peters, J., Bioassay of pesticides and industrial chemicals for tumorigenicity in mice: a preliminary note. £. Natl Cancer Inst. 42:1101-1114, 1969.
41
International Agency for Research on Cancer, Azobenzene. In: IARC Monographs on the Evaluation of_ the Carcinogenic Risk £f Chemicals tx? Man - Some Aromatic Azo Compounds, Vol. 8 International Agency for Research on Cancer, Lyon, France, 1975, pp. 75-81.
Kaplan, E. L. and Meier, P., Nonparametric estimation from incomplete observations. J_. Amer. Statist. Assoc. 53_:457-481, 1958.
Linhart, M. S., Cooper, J. A., Martin, R. L., Page, N. P., and Peters, J. A., Carcinogenesis bioassay data system. Comp. and Biomed. Res. 7 :230-248, 1974.
Lurie, A. P., Benzidine. In: Kirk-othmer Encyclopedia £f Chemical Technology, Vol. 3_, Interscience Publishers, New York, 1964, pp. 408-412 and 420.
Miller, R. G., Jr., Simultaneous Statistical Inference, McGraw-Hill Book Co., New York, 1966, pp. 6-10.
National Technical Information Service (NTIS), Evaluation £f Carcinogenic, Teratogenic, and Mutagenic Activities of Selected Pesticides and Industrial Chemicals. Vol. _!_. Carcinogenic Study. U.S. Department of Commerce, Washington, D.C., 1968.
Noller, C. R., Aromatic nitro compounds. In: Chemistry of Organic Compounds, W. B. Saunders Co., Philadelphia, 1966, pp. 518-520.
Saffiotti, U., Montesano, R., Sellakumar, A. R., Cefis, F., and Kaufman, D. G., Respiratory tract carcinogenesis in hamsters induced by different numbers of administrations of benzo (a)pyrene and ferric oxide. Cancer Res. 32:1073-1081, 1972.
Smith, M. I., Lillie, R. D., and Stohlman, E. F., The toxicity and histopathology of some azo compounds as influenced by dietary protein. Publ. Hlth. Rep. 581:304-317, 1943.
Spitz, S., Maguigan, W. H., and Dobriner, K., The carcinogenic action of benzidine. Cancer 3_:789-804, 1950.
Tarone, R. E., Tests for trend in life table analysis. Biometrika 62 (3):679-682, 1975.
42

APPENDIX A
SUMMARY OF THE INCIDENCE OF NEOPLASMS IN
RATS ADMINISTERED AZOBENZENE IN THE DIET
43

44
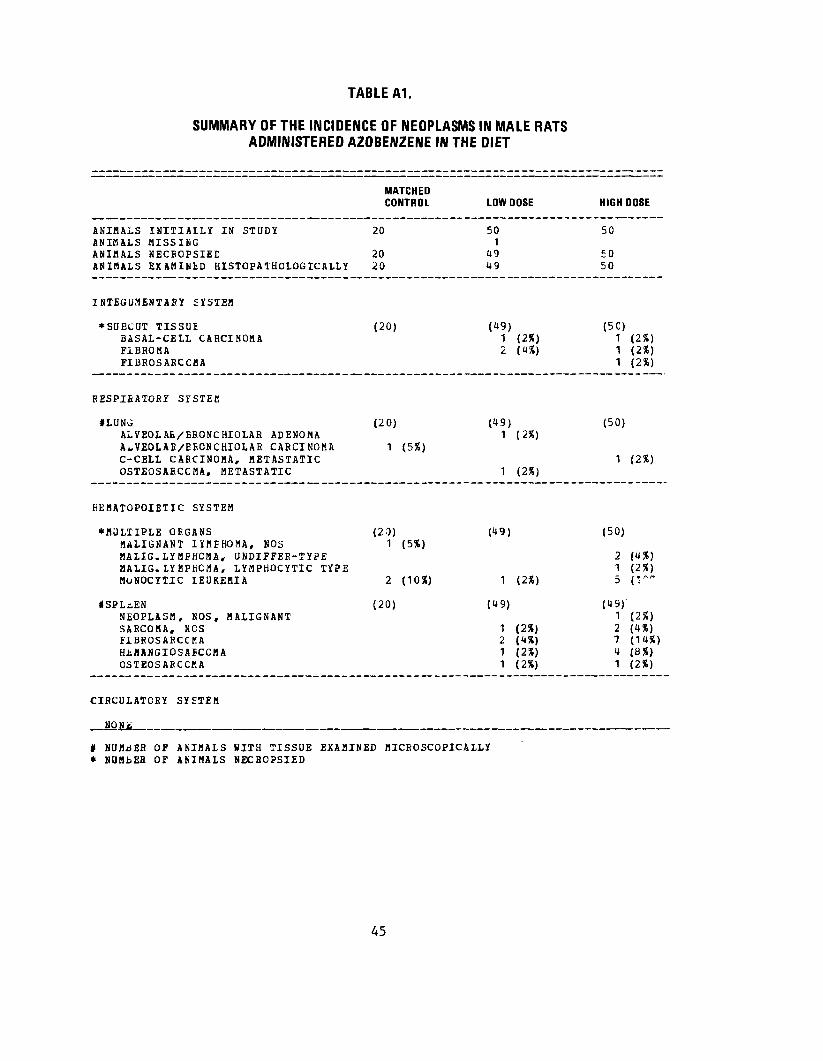
TABLE A1.
SUMMARY OF THE INCIDENCE OF NEOPLASMS IN MALE RATS ADMINISTERED AZOBENZENE IN THE DIET
* NUMBER OF ANIMALS WITH TISSUE EXAMINED MICROSCOPICALLY * NUHbEH OF ANIMALS NECROPSIED
45

TABLE A1. MALE RATS: NEOPLASMS (CONTINUED)
DIGESTIVE S Y S T E M
ILIVER NEOPLASTIC NODULE H E P A T O C E L L U L A R C A R C I N O M A HS-MANGIOSABCOMA OSTBOSABCCEA, HETASTATIC
IPANCREAS H i M A N G I O S A R C C M A
#COLON BUCINOOS C Y S T A D E N O C A R C I N C M A MUCINOOS A D E N O C A R C I N O M A
U R I N A R Y S Y S T E H
NONi,
JNDOCBINE S Y S T E M
tP ITUITARY A D E N O M A , NOS CHROMOPHOBE A D E N O M A
# A D R E N A L P H E O C H R O M O C Y T O M A
fTHYROID C-CELL C A R C I N O M A
REPRODUCTIVE SYSTEH
*MAMMARY GLAND F I B R O A D E N O M A
*PREPUTIAL GIAND S Q U A M O U S CELL C A R C I N C M A
#TESTIS INTERSTITIAL-CELL T U M O R
N E R V O U S S Y S T E M
_ NONE
MATCHED CONTROL
(20)
(20)
(20)
1 (5»)
(20) U ( 2 0 X )
(20) 1 (536)
(20)
(20)
(20) 1 (5X)
(20) 17 (85%)
LOW DOSE
(1*9) 1 (2%) 1 (2X)
(47)
(47) 1 (2«)
C*9)2 (US) 2 ( i*X)
(49) 1 (2X)
(49) 1 (28)
(49) 2 ( 4 % )
(49)
(48) 41 (85%)
HIGH DOSE
(50) 2 (4S) 1 (2X) 1 (2%) 1 (2S)
(48) 1 (2%)
(50)
(49)
3 (68)
(5C) 1 (2»)
(48) 1 (2%)
(50)
< 5 C )
(49) 31 (63%}
# NUMBER OF ANIMALS WITH TISSUE EXAMINED MICROSCOPICALLY * NUMBER OF ANIMALS NECROPSIED
46

TABLE A1. MALE RATS: NEOPLASMS
SPECIAL SENSE ORGANS
*EAR CANALKERATOACAKTHCHA
HUSCULOSKELE1AI SYSTEH
NONE
EODY CAVITIES
*ABDOflINAL CAVITYHiMANGIOSABCOBA
*HES£NTERYSAKCOHA, NCS OSIEOSARCCl'.A, HETASTATIC
ALL OTHER SYSTEMS
*HULTIPLE ORGANSSARCOMA, NCS FIBBOSARCCBA HiSOTHELICRA, HALIGNANTOSTEOSARCOMA
ANIMAL DISPOSITION SUMHARY
ANIHALS INITIALLY IN STDDYNATURAL DIATHSHORIBOND SACRIFICESCHEDULED SACRIFICE ACCIDENTALLY KILLED TERMINAL SACRIFICEANIHAL HISSING
3 INCLUDES AUTCLYZED ANIHA1S
(CONTINUED)
MATCHED CONTROL LOW DOSE HIGH DOSE
(20) (49) (50) 1 (5«)
(20) (49) (50) 1 (2X)
(20) (US) (50) 1 (2X)
1 (2%)
(20) (49) (50) 2 (4S)
13 (2f>%) 1 (2%)
3 (6X)
20 50 50 5 4 2S 2 4 5
13 41 16 1
# NUMBER OF ANIHALS HITH TISSUE EXAHINED MICROSCOPICALLY * NUMBER OF AKIMALS NECROPSIED
47

TABLE A1. MALE RATS: NEOPLASMS (CONTINUED)
TUMOR SUMMARY
TOTAL ANIMALS BITH PRIMARY TUMOBS*TOTAL PBIBABY TOBOBS
TOTAL ANIHALS WITH BENIGN TDHOBSTOTAL EEBIGN TUHOBS
TOTAL ANIMALS WITH MALIGNANT TUHORSTOTAL MALIGNANT TUMOKS
TOTAL ANIMALS HITH SECONDARY TUMOBSfTOTAL SECONDARY TUMORS
TOTAL ANIMALS BITH TUMORS UNCERTAINBENIGN OR HAIIGNANT
TOTAL UNCERTAIN TUMORS
TOTAL ANIMALS HITH TUMOBS UNCERTAINPEMARY OR KETASTATIC TOTAL UNCERTAIN TUMORS
MATCHED CONTROL LOW DOSE HIGH DOSE
20 15 47 29 63 87
19 45 34 23 51 36
6 11 42 6 11 49
1 2 2 2
1 2 1 2
* PRIMARY TOMCES: ALL TUMORS EXCEPT SECONDARY TUMORS # SECONDARY TUMORS: METASTATIC TUMORS OR TUMORS INVASIVE INTO AN ADJACENT ORGAN
48

TABLE A2.
SUMMARY OF THE INCIDENCE OF NEOPLASMS IN FEMALE RATS ADMINISTERED AZOBENZENE IN THE DIET
MATCHED CONTROL LOW DOSE HIGH DOSE
ANIMALS INITIALLY IN STUEY 20 5.) 50 ANIMALS NECBOE5IED 20 50 50 ANIMAi.S EXAHINIE HISTOPATHOLOGICALLY 20 50 50
INTEGUMENTARY SYSTEM
*SKIN (20) (50) (50) SQUAMOUS CELL CARCINOMA 1 (2X)
*SUBCUT TISSUI (20) (5J) (50) FIBROMA 2 (U%) 1 (2X) FIBHOADENCMA 1 (2%)
RESPIBATORY SYSTEM
t L U N G (20) (50) (50) ALVEOLAR/BRONCHIOLAR A D i N O M A 1 (255) A L V E O L A R / E 5 C N C H I O L A R C A R C I N O M A 1 (2») MIXED T U B C E , METASTATIC 1 (2*)
H E M A T O P O I E T I C S Y S T E M
*MULIIPLE O R G A N S (20) (50) (50) G B A N U L O C Y T I C L E U K E M I A 2 (HI) 1 (2%) flONOCYTIC I E U K E H I A 1 (5X) 3 (6%)
ISPL^EN (20) (50) (50) F i B H O S A R C C B A 1 (2%) 1 (1435) lUf lANGIOSABCOMA 1 (2%) H (8%) H E M A N G I O I E f l C Y T O M A , M A L I G N A N T 1 (2X) OSTEOSARCCMA 1 (2%) 5 (10*)
#SPL£NIC CAPSCL£ (20) (50) (5CJ F I B R O S A R C C K A 1 (2X)
ILYMPH NODE (20) (50) (50) M i l l G . L Y M P H O M A , L Y M P H O C Y T I C TYPE 1 (2S)
C I R C U L A T O R Y SYSTEM
NQN£_
* NUHdEH OF ANIMALS HITH TISSUE EXAMINED MICROSCOPICALLY * NUHBEB OF AMIMALS NECROPSIED
49

TABLE A2. FEMALE RATS: NEOPLASMS (CONTINUED) — — — T • • -— ••- - r - - r - — . —• J. - : - • - . -—. T - . . - J "*—- ""• ™* -""•-" ' ~ ' ™ '• '
MATCHED CONTROL LOW DOSE
DIGESTIVE SYSTEM
4LIVER (20) (50) NEOPLASTIC NODDLE HEPATOCE1IDLAB CARCINOMA 1 (2X)
t J E J U N U M (20) (50) S A R C O M A , NOS 1 (2X)
U R I N A B Y S Y S T E M
NONi
E N D O C R I N E SYS1EB
4PITUITAHY (20) (49) A D E N O M A , NOS 4 (20%) 7 (14X) CHBOMOPHCEE ADENOMA 1 <5X) 1 (2X)
I A D B E N A L (20) (50) P H E O C H R O M O C Y T O M A
ITHYfiOID (20) (50) FOLLICOLAB-CELL A D E N O M A 1 (2X) FOLLICULAB-CELL C A R C I N O M A 1 (2X) C-CELL C A R C I N O M A 1 (5X) 3 (6X)
REPRODUCTIVE SYSTEM
*MABHARY G L A h E (20) (50) U N D I F F E R E N T I A T E D C A R C I N O M A 1 (5X) A u E N O M A , N O S 1 (2X) A D E N O C A R C I N O M A , NOS 1 (5X) MIXED T U M C R , M A L I G N A N T F I B R O A D E K C K A 3 (15X) 5 (10X)
*CLITOBAL G L A N D (20) (50) S Q U A M O U S CELL CABCINOMA 1 (2%)
f UTEBUS (20) (50) C A R C I N O M A ^ N O S 1, (2%1
* NDMBER OF ASIHALS HITH TISSUE EXAMINED MICROSCOPICALLY * N D M B E f i OF A K I M A L S NECBOPSIED
HIGH DOSE
(50) 2 ( 4 X )
( 5 0 )
(50) 1 (14X)
(50) 1 (2J8)
( 4 8 )
1 (2X)
(50)
1 ( 2 % )
1 ( 2 X ) 3 (6X)
(50) 1 (2%)
(50)
50

TABLE A2. FEMALE RATS: NEOPLASMS (CONTINUED)
MATCHED CONTROL LOW DOSE HIGH DOSE
ENDOMETEIAI STROMAL POLYP 2 (1051) 5 (1055) 1 (235)
liEHVOUS SYSTSK
tCERtBRUH (20) (50) (50) ASTROCYTCKA 1 (555) 1 (255) MENINGIOMA 1 (235)
SPECIAL SENSE ORGANS
NONE
BUSCOLOSKELETAI SYSTEM
NONE
BODY CAVITIES
*ABDOMINAL CAVITY (20) (50) (50) OSTEOSAECCHA 1 (2*)
ALL OTHER SYSTEMS
*BULXIPI.E O B G A N S (20) (50) (50) FiBROSARCCEA 1 (2%) OSTEOSAECCMA 3 (6%)
ANIBAi DISPOSI1ICN S U H B A B Y
ANIBALS INITIALLY IN STUDY 20 50 50 N A T U R A L DfATH3 2 9 9 BOfi lBUND SACRIFICE 3 3 SCHEDULED SACRIFICE ACCIDENTALLY KILLED T E R M I N A L SACRIFICE 18 38 38 A N I M A L HISSING
9 INCLUDES AH10LYZEP ANIf lALS
i NOHBER OF ANIMALS WITH TISSUE E X A M I N E D MICROSCOPICALLY * NUMBER OF ANIMALS NECBOPSIED
51

TABLE A2. FEMALE RATS: NEOPLASMS (CONTINUED)
10HOB SUMMARY
TOTAL ANIMALS BITH PRIMARY TUMORS*TUTAL PBIHARY TUMOES
TOTAL ANIMAIS WITH BENIGN TUMOBSTOTAL EENIGN TONOBS
TOTAL ANIMALS WITH MALIGNANT TUMOBSTOTAL MALIGNANT TUMORS
TOTAL ANIMALS HITH SECONDARY TOMORSfTOTAL SECCliDABY TOHOBS
TOTAL ANIMALS WITH TUBORS UNCERTAINBEN1GN OB KAIIGNANT
TOTAL UNCERTAIN TUMORS
TOTAL ANIMAIS WITH TUMOSS UNCEBTAIN-PRIfiABY OB DITASTATIC TOTAL UNCERTAIN TUMORS
MATCHED CONTROL LOW DOSE HIGH DOSE
10 32 33 15 43 45
9 19 13 10 23 16
5 18 24 5 2J 27
1 1
2 2
* PBIMABY TUMCBS: ALL TUHOHS £XCEPT SECONDABY TUMORS * SECONDARY TUf.ORS: METASTATIC TUMORS OR TUMOBS INVASIVE INTO AN ADJACENT ORGAN
52

APPENDIX B
SUMMARY OF THE INCIDENCE OF NEOPLASMS IN
MICE ADMINISTERED AZOBENZENE IN THE DIET
53

54
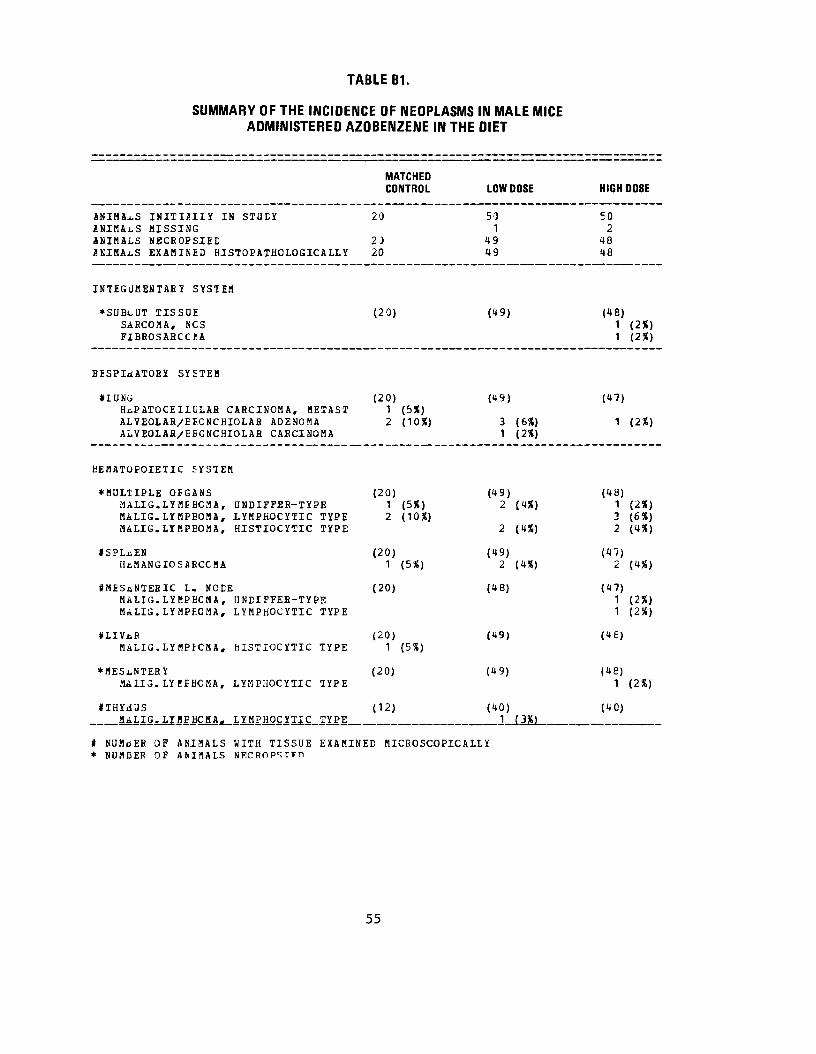
TABLE B1.
SUMMARY OF THE INCIDENCE OF NEOPLASMS IN MALE MICE ADMINISTERED AZOBENZENE IN THE DIET
MATCHED CONTROL LOW DOSE HIGH DOSE
J N I H A ^ S I N I T I J I L Y IN S T U E Y 20 50 50 *N.IMAi.S M I S S I N G 1 2 A N I M A L S N E C R O P S I E D 23 49 48 ANIBA.LS E X A M I N E D HISTOPATHOLOGICAL!Y 20 49 48
I N T E G J f l E N I A B Y S Y S T E M
*SUBcUT TISSUE (20) (49) (48) S A R C O M A , NCS 1 (2%) F I B R O S A R C O M A 1 (2%)
BESPIdATORY SYSTEM
* I U N G (20) (49) (47) H t P A T O C E I L U L A S C A R C I N O M A , METAST 1 (5X) A L V E O L A R / E E O N C H I O L A R A D E N O M A 2 (105!) 3 (6S) 1 (255) A L V E O L A R / E R C N C H I O L A R C A R C I N O M A 1 (2X)
H E M A T O P O I E T I C S Y S T E M
*MULTIP1E O F G A N S (20) ( 4 9 ) (48) M A L I G . L Y M E B C M A , U H D I F F E R - T Y P E 1 (5*) 2 ( 4 X ) 1 (2«) MALIG. L Y M P H O M A , L Y M P H O C Y T I C TYPE 2 (10X) 3 (651) M A L I G . L Y M P H O M A , HISTIOCYTIC T Y P E 2 ( 4 X ) 2 (45S)
ISPL^EN (20) (49) (47) HtMANGIOSARCCMA 1 (5%) 2 (4%) 2 (4«)
*M£ScNTEHIC L. NODE (20) (48) (47) M A L I G . L Y B P f i C M A , UNDIFFEB-TYPE 1 ( 2%) M A L I G . L Y M P F . C M A , L Y M P H O C Y T I C TYPE 1 (2»)
#LJVi.E (20) (49) (48) M A L I G . L Y H P 1 - C M A , HISTIOCYTIC TYPE 1 (555)
*MESi .NTEHY (20) (49) (48) MALI3. L Y K F H C M A , L Y M P H O C Y T I C T Y P E 1 (255)
I T H Y i l U S (12 ) ( 4 0 ) ( 4 0 )
I NUMBER OF ANIMALS HITH TISSUE EXAMINED MICROSCOPICALLY * NUMBER OF ANIMALS NRCROPSTFn
55

TABLE B1. MALE MICE: NEOPLASMS (CONTINUED)
CIRCOiATOHY SYSTEM
NONil .
ElfiESTIVE SJSTIM
I1IVEHNEOPLASTIC N O D U L EHiPATOCEIIOLAR CARCINOMAH £ M A N G I O S A I C O H A
U E I N A 8 Y SYSTifl
NONi
iNDOCEINE SYS1IB
lADRiiNALP H E O C H R O H C C Y T O B ASAfiCOMA, NCS
*THYriOIDPAPILLARY 4D1JJOCARCINOMAFOLLICULAR-CELL A D E N O M A
R E P R O D U C T I V E S Y S T E M
NONfi
KERVOUS SYSTIM
NON£
SPECIAL SENSE CHGANS
NONi
MUSCULOSKELETAL SYSTEM
MATCHED CONTROL LOW DOSE HIGH DOSE
(20) (49) (48) 6 [30%) 8 (16%) 3 (15X) 10 (20K) 2 (U»)
3 (6»)
(20) (U8) (45) 3 (7%)
1 (2%)
(18) (49) (47 ) 1 (2%)
1 (2%)
t NUMtiER OF ANIMALS WITH TISSUE EXAMINED MICROSCOPICALLY * NUMBER OF ANIMALS NECROPSIED
56
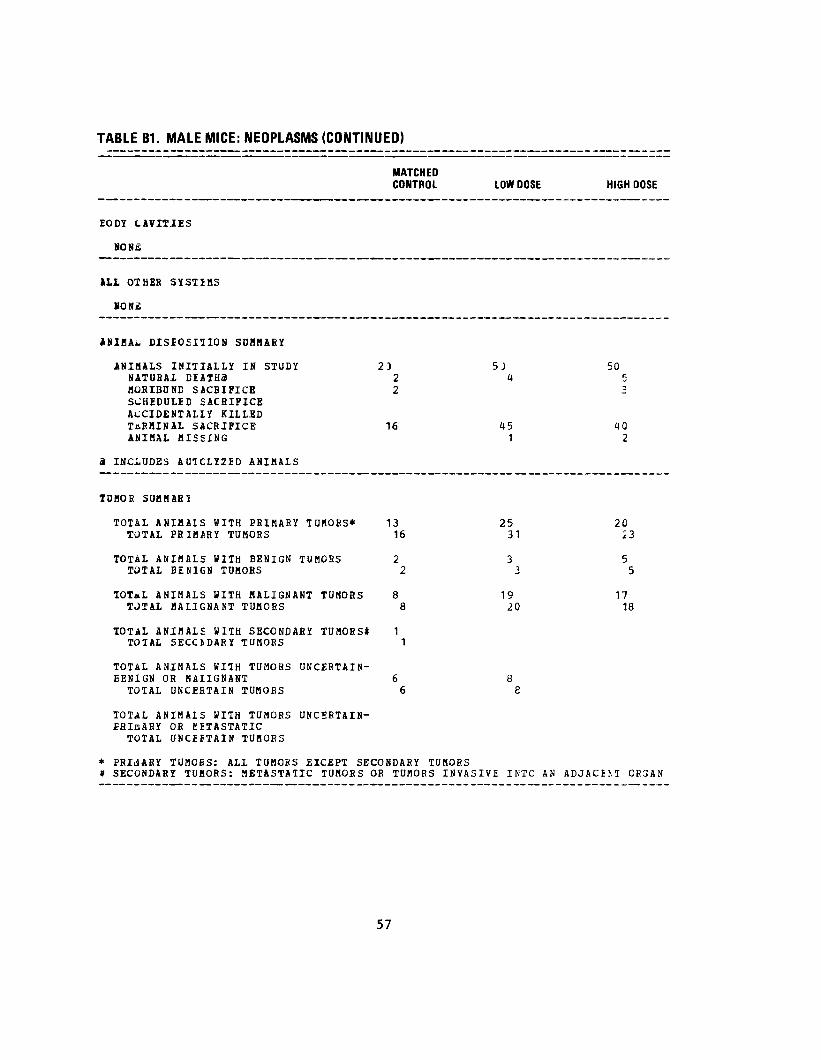
TABLE B1. MALE MICE: NEOPLASMS (CONTINUED)
MATCHED CONTROL LOW DOSE HIGH DOSE
BODY CAVITIES
1U OTHEB SYSTIMS
HONE
ANIHAi DISPOSITION S U M M A R Y
ANIMALS INITIALLY IN S T U D Y 2) 5J 50 N A T U R A L D E A T H S 2 4 5 MORIBUND SACRIFICE 2 2 SCHEDULID SACRIFICE ACCIDENTALLY KILLED T E R M I N A L SACRIFICE 16 45 40 ANIHAL M I S S I N G 1 2
9 INCLUDES A U T C L Y 2 I D A N I M A L S
T D M O E S U H M A B Y
TOTAL A N I M A L S W I T H P R I M A R Y TOHOES* 13 25 2C TOTAL P R I M A R Y TOMORS 16 31 23
TOTAL A N I M A L S WITH B E N I G N T U M O R S 2 3 5 TOTAL B E N I G N TOMORS 2 3 5
TOTAL A N I M A L S H I T H M A L I G N A N T T U M O R S 8 19 17 TOTAL M A L I G N A N T T U M O R S 8 20 18
TOTAL A N I M A L S W I T H SECONDARY TUMORS* 1 TOTAL S E C C l i D A K Y TUMOES 1
TOTAL ANIMALS WITH TUMORS UNCERTAINEENIGN OR MAIIGNANT 6 8 TOTAL UNCERTAIN TUMOES 6 8
TOTAL ANIMAIS HUH TUMORS UNCEfiTAIN-PRIflABY OR KETASTATIC
TOTAL UNCEBTAIN TUMOES
* PRIdARY TUMCES: ALL TOMORS EXCEPT SECONDARY TUMORS « SECONDARY TUBORS: METASTATIC TUMOES OR TUMORS INVASIVE INTC AN ADJACEM OR3AN
57

TABLE B2.
SUMMARY OF THE INCIDENCE OF NEOPLASMS IN FEMALE MICE ADMINISTERED AZOBENZENE IN THE DIET
MATCHED CONTROL LOW DOSE HIGH DOSE
A N I M A i - S I N I T I A L L Y IN S T U D Y 20 53 50 A N I M A L S M I S S I N G 1 7 A N I M A L S NECROPSIEE 20 47 38 A N I M A L S E X A M I N E D HISTOPATHOLOGICAL!,! 20 17 38
I N T E G U M E N T A R Y S Y S T E M
*SUBcUT TISSUE (20) (HI) (38) H i M A N G I O S A E C O M A 1 (2X)
RESPIBATORY SYSTEM
*LUNJ (20) (46) (36) ALVEOLAR/BRONCHIOLAR ADENOMA 2 (10K) 2 (4S) 2 (6*)
HEMATOPOIETIC SYSTEM
MULTIPLE OSGANS (20) (47) (38) HALIG.iYBPKCHA, UNDIFFEB-TYPE 1 (5*) 1 (2X) MALIG.LYMEEOHA, LYMPHOCYTIC TYPE 2 (10%) 1 (2X) 4 (11*) BALIG.LYKEKCMA, HISTIOCYTIC TYPE 2 (10*) 2 (U%) 1 (3*) UNDIFFERENTIATED LEUKEJSIA 1 (2X) GttANULCCYTIC LEUKEMIA 1 (2X) 2 (5X)
ISPljiEN (20) (47) (38) HiHANGIOSJECOBA 1 (2%)
CIRCULATORY SYSTEM
NONE
DIGESTIVE SYS1IM
ILIVtfR (20) (47) (36) N E O P L A S M , NOS, METASTATIC 1 (2X) Hi£il2C!!iiLAR_CAR£!NOHA 2 (4X)
* N U M B E R OF A N I M A L S HITH TISSUE E X A M I N E D MICROSCOPICALLY * NUMBER OF A K I M A I S NECHOPSIID
58

TABLE B2. FEMALE MICE: NEOPLASMS (CONTINUED)
H E M A N G I O S J F C C M A A i i G I O S A B C C K A
U H I N A B Y S Y S T E M
NONA
IHEOCBINE SYSTEM
IPITJITARY A D E N O M A , NCS
J A D R E N A L P h E O C H R O H C C Y T O M A
tTHYBOID FOLLICULAR-CELL A D E N C H A
REPRODUCTIVE SYSTEM
* M A H H A H Y GLAl i t A D E N O M A , N C S
iUTEBUS H E B A N G I O S S E C C S A
IOVAHY GBANULOSA-CELL C A R C I N O M A
N E R V O U S SYSTJB
NONE
SPECIAL S E N S E C F G A K S
*HABLlERIAN G L A N D ADENOMA , NCS
MUSCULOSKELETAL SYSTEM
*ABDOMINAL HCSCLE H B M A N G I O S A F C O M A
MATCHED CONTROL LOW DOSE
(19) C*2) 2 (11SS) 1 (2X)
(20) (47)2 (US)
(20) (45) 1 (5X)
(20) (47)
(20) (47) 1 (2%)
(19) (46)
120) (47) 3 (6X)
(20) (47) 1 12%)
HIGH DOSE
1 {3X) 1 (3X)
' (30)
(37) 1 (3S)
(35)
(38)1 (3S)
(37)
(37)1 (3X)
(38) 1 (3X)
(38)
I NDHQEB OF ANIMALS WITH TISSUE EXAMINED MICROSCOPICALLY * NUMBER OF ANIMALS NECROPSIED
59
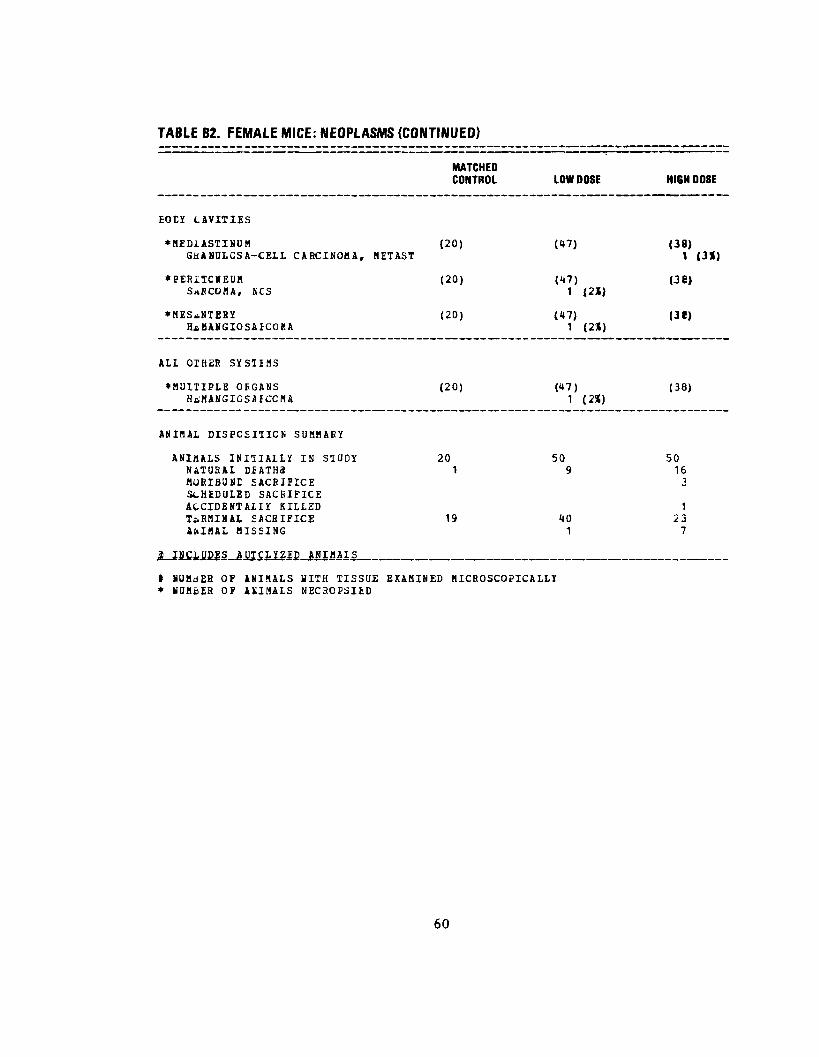
TABLE B2. FEMALE MICE: NEOPLASMS (CONTINUED)
MATCHED CONTROL LOW DOSE HI6H DOSE
EOEY CAVITIES
* M E D I A S T I N U M (20) (K7) (38) GRANULOSA-CELL C A R C I N O M A , METAST 1 (3X)
* P E R I T O N E U M (20) (47) P8) SAECOHA, NCS 1 12X)
* M E S E N T E R Y (20) (U7) (31) HEMANGIOSARCOMA 1 (2X)
A L L OTHER S Y S T E M S
*MULTIPLE O R G A N S (20) (47) (38) H E M A N G I O S A R C O M A 1 (2*)
ANIMAL DISPOSITION S U M M A R Y
ANIMALS I N I T I A L L Y I N S T U D Y 20 50 50 N A T U R A L DEATHS 1 9 16 M O R I B U N D SACRIFICE J
S C H E D U L E D S A C R I F I C E ACCIDENTALLY KILLED 1 T E R M I N A L SACRIFICE 19 40 23 ANIMAL MISSING 1 7
@ INCLUDES AUTOLYZED A N I M A L S ^ , ^
I NUMBER OF ANIMALS WITH TISSUE EXAMINED MICROSCOPICALLY * NUMBER OF ANIMALS NECROPSIED
60

TABLE B2. FEMALE MICE: NEOPLASMS (CONTINUED)
MATCHED CONTROL
10MOR SOMMABX
TOTAL ANIMALS WITH PRIMARY TUHORS*TOTAL PBIBABY TUMOBS
9 10
TOTAL ANIBAIS WITH BENIGN TUMORSTOTAL EENIGN TUHORS
H 5
TOTAL ANIMALS HITH MALIGNANTTOTAL MALIGNANT TUMORS
TUMOHS 5 5
TOTAL ANIMALS WITH SECONDARY TUMOBS* TOTAL SECCKDARY TUMORS
TOTAL ANIHALS WITH TUMORS UNCEBTAINBEN1GN OR HALIGNANT
TOTAL UNCERTAIN TOMOBS
TOTAL ANIMALS UITH TUMORSPRIMARY OE KBTASIATIC
UNCERTAIN
TOTAL UNCEFTAIN TUMORS
* PRIMARY TUMOBS: ALL TUMORS EXCEPT SECONDARY TUMORS
LOW DOSE HIGH DOSE
20 12 23 15
8 5 8 5
13 8 15 10
1 1 1 1
# SECONDARY TUBORS: METASTATIC TUMORS OE TUMORS INVASIVE INTC AN ADJACIKT ORGAN
61

62
APPENDIX C
SUMMARY OF THE INCIDENCE OF NONNEOPLASTIC LESIONS IN
RATS ADMINISTERED AZOBENZENE IN THE DIET
63

64

TABLE C1.
SUMMARY OF THE INCIDENCE OF NONNEOPLASTIC LESIONS IN MALE RATS ADMINISTERED AZOBENZENE IN THE DIET
MATCHED CONTROL LOW DOSE HIGH DOSE
SNIHilS INITIJLILY IN S T U D Y 23 5J E C JNIBALS MISSING 1 ANIBALS N E C R C P S I E E 20 49 50 A N I B A i S E X A M I N E D HISIOPATHOlOGICAiLY 20 49 50
I N T E G U M E N T A R Y S Y S T E M
*SKia (2')) (49) (50) E P I D E R M A L INCLUSION CYST 1 (2%) H Y P E R K E R A T O S I S 1 (58) 1 (2%)
*SUBCUT T I S S U E (20) (49) (53) H E M O R E H A G E 1 ( 2 X ) H h M A T O M A , 1>OS 1 (2X)
BESPIEATORY SYSTEM
» L U N G / B R O N C H D S (20) (49) (50) BKONCHIECTflSIS 1 (2X)
*LOS^ (20) (49) (50) EriONCHOPNEOMONIA, NOS 1 (2%) I N F L A M B A T I C N , NOS 1 (5X) 1 (2%) 1 (2X) H Y P E R P L A S I A , A L V E O L A R E P I T H E L I U M 1 ( 2 X )
H E M A T O P O I E T I C S Y S T E M
ISPLiiEN (23) (49) (49) CONGESTION, NOS 1 (2X) FIBROSIS 1 (2%) M i T A M O R P H C S I S FATTY 3 (6») L Y M P H O I D E E P L E T I O N 1 ( 2 X ) H Y P E R P L A S I A , FOCAL 1 (2X) H Y P E R P L A S I A , BESOTHELIAL 1 (2X) H Y P E R P L A S I A , BETICULUf l CELL 3 (6X)
*SPLtNIC CAPSULE (20) (49) (49)
* NUMDER OF ANIHALS WITH TISSUE EXAMINED MICROSCOPICALLY * N U M f a E R OF A M M A L S NECROPSIED
65

TABLE C1. MALE RATS: NONNEOPLASTIC LESIONS (CONTINUED)
INFLAMHATICN, FOCAL INFLAMMATION, CHRONIC SIDEEOSIS
•SPLENIC BEE EULP HYPERPLASIA, NOS
•MANDIBULAR L. NODE fl£MOBBHAGE SIDEROSIS
CIBCULATORY SYSTEM
IHEAKT THROMBOSIS, NOS FIBROSIS FIBROSIS, IIFFUSE DEGENERATION, NOS
tMYOCABDIUM INFLAMMATION, FOCAL FIBROSIS DEGENERATION, NOS
t ENDOCARDIUM FIBROELASTCSIS, NOS
*PANCREATIC ABTERY, INFLAMMATION, CHRONIC
3IGESTIVE SYSTIM
tPABGTID GLANI INFLAMMATION, NOS INFLAMMATION, NECROTIZING INFLAMMATION, ACUTE INFLAMMATION, CHRONIC
ISUBHAXILLABY GLAND INFLAMMATION, NOS INFLAMMATION, SECROTIZING INFLAMMATION, ACUTE INFLAMMATION, ACUTE/CHEONIC
t NUflbEE OF A N I M A L S WITH TISSUE* NUMBER OF A N I M A L S NECROPSIED
MATCHED CONTROL LOW DOSE
11 (22*)
(20) (49) 4 (8*)
(20) (49)
(20) (49) 1 (2*)
9 (458) 14 (29*) 1 (2X) 1 (2X)
(20) (49)
1 (5*) 1 (2X) 2 (10*)
(20) (49) 1 (2X)
(20) (49) 1 (5X)
(20) (49) 2 (4X)
4 (20 X) 1 (2X) 1 (2*) 1 (2X)
(20) (49) 4 (8*)
3 (15*) 2 (4X)
2 J4£) ... , .. ,
E X A M I N E D BICBOSCOPICALLY
HIGH DOSE
1 (2*) 10 (20X) 1 (2X)
(49) 1 (2%)
(50) 1 (2*) 1 (2X)
(50)
2 (4X)
3 (6X)
(SC) 1 (2*) 2 (4X) 2 (4X)
(50)
(50)
(50) 1 (2*) 1 (2*)
(5C)
1 (2X) . _ J (2*1
66

TABLE C1. MALE RATS: NONNEOPLASTIC LESIONS (CONTINUED) -1 -' ' "~ "~~lr"- — ————» — — —— ——.—._
MATCHED CONTROL LOW DOSE
IMFLAHHATICN, CHEONIC A1ROPHY, NCS BiGENERAllCN, NOS
ILIViR INFLAMMATION, NECROTIZING GRANULOMA, NOS FIBROSIS CHOLANGICf IBEOSIS CIRRHOSIS, NOS NECROSIS, KOS MiTABORPHCSIS FATTY FOCAL CELLULAR CHANGE
(20)
11 (55)1)
(«9)
11 (22X)
35 (71X)
1 (2X) 1 (2») 3 (6X)
ILIVIR/CENTRIIOEULAR CYTOPL&SHIC VACUOLIZATICH HLGALOCY1CSIS
(20) (49)
#BIL£ DUCT HYPERPLASIA, NOS HYPERPLASIA, FOCAL
(20) (49) 1 (2*) 1 (2X)
•PANCREAS PEBIARTEBITIS AT80PHY, NCS
(20) (47) 4 (9X) 4 (9X)
tSTOMACH INFLAMHATICN, CHRONIC
(20) (49) 1 [2%)
URINAfcY SYSTIf
IKIDiJEY (20) (49) NEPHROPATHY 15 (75*) 34 (69X) INFARCT, NCS PIGHENTA1ICN, NOS
HKIDNEY/CORTIX (20) (49) CYST, NOS
# K I D N E Y / T U E U I I (20) (49)
P I G H E N T A T I C N , NOS
f U R I N A R Y E L i l E E R (20) (47)
TE
f NUBtiER OF ANIMALS WITH TISSUE EXAMINED MICROSCOPICALLY * NUMBER OF ANIMALS NECROPSIED
" —— ——•—
HIGH DOSE
1 12%) 1 (2%) 1 (2X)
(SC) 1 (2%) 3 (6X) 1 (2%)
13 (2655) 1 (2X) 3 (6X) 2 (4S) 4 (8X)
(5C) 1 (2X) 1 (2X)
(5C) 3 (6«)
(4£) 2 (4K) 2 (4X)
(5C) 2 (4X)
(50) 14 (28%) 1 (2X) 1 (2X)
<5C) 1 (2X)
( 50 )
( 4 X )
(47)
67
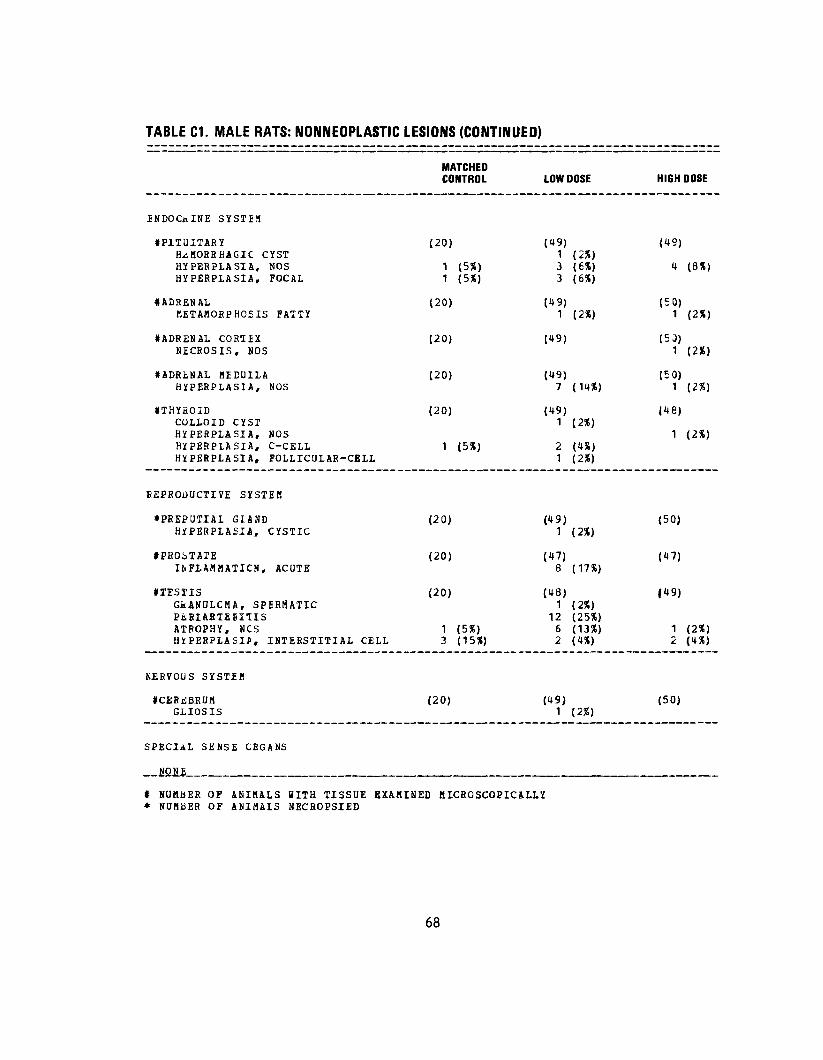
TABLE C1. MALE RATS: NONNEOPLASTIC LESIONS (CONTINUED)
MATCHED CONTROL LOW DOSE
i N D O C a l N E S Y S T I M
•PITUITARY (20) (49) H i M O R H H A G I C CYST 1 ( 2 % ) HYPERPLASIA, NOS 1 (5X) 3 (6X) H Y P E R P I A S I A , FOCAL 1 (5X) 3 (6X)
4 A D R E N A L (20) (49) H E T A M O B P H O S I S FATTY 1 (2X)
# A D R E N A L COR1IX (20) (49) NECROSIS , NOS
#ADRiNAL M E D U I L A (20) (49) H Y P E R P L A S I A , NOS 7 (14«)
tTHYHOID (20) (49) COLLOID CYST 1 (2X) H Y P E R P L A S I A , NOS H Y P E R P L A S I A , C-CELL 1 (5X) 2 (4») H Y P E R P L A S I A , FOLLICULAR-CELL 1 (2X)
REPRODUCTIVE S Y S T E H
*PREPOTIAL G I A N D (20) (49) H Y P E R P L A S I A , CYSTIC 1 (2X)
tPBOiTATE (20) (47) I N F L A M M A T I O N , ACUTE 8 (17X)
*IESIJS (20) (48) G R A N U L O M A , S P E R M A T I C 1 (2%) Pt-RIABTEBIlIS 12 (25X) ATROPHY, NCS 1 ( 5 X > 6 (13X) H Y P E R P L A S I A , I N T E R S T I T I A L CELL 3 (15X) 2 ( 4 X )
N E R V O U S SYSTJB
•CERriBBUM (20) (49) GLIOSIS 1 (2!!)
SPECIAL S E N S E O R G A N S
N O N E
« NUHBER OF ANIMALS WITH TISSUE EXAMINED MICROSCOPICALLY * NUMBER OF ANIMALS NECROPSIED
HIGH DOSE
(49)
4 (8X)
(50) 1 (2%)
(5J) 1 ( 2 X )
(50) 1 (2%)
(48)
1 < 2 X )
(50)
( 4 7 )
l«9)
1 ( 2 X ) 2 ( 4 X )
(50)
68

TABLE C1. MALE RATS: NONNEOPLASTIC LESIONS (CONTINUED)
MATCHED CONTROL LOW DOSE HIGH DOSE
MUSCULOSKELETAL SYSTEM
N O N E
£ODY CAVITIES
*MEDAASTINUM (20) (49) (50) REMORRHAGIC CYST 1 (2X)
*RESENTERY (20) (U9) (50) INFARCT, NCS 1 (235)
ALL OTHER SYSIIHS
ADIPOSE TISSUE INFLAMMA3ICN, CHBONIC 1
SPECIAL BORPHCLOGY SUHHARY
ANIBAL MISSING/NO NECROPSY 1
i NUHbER OF ANIHALS WITH TISSUE EXAHINED BICBOSCOPICALIY * NUMBER OF ANIMALS NECROPSIED
69
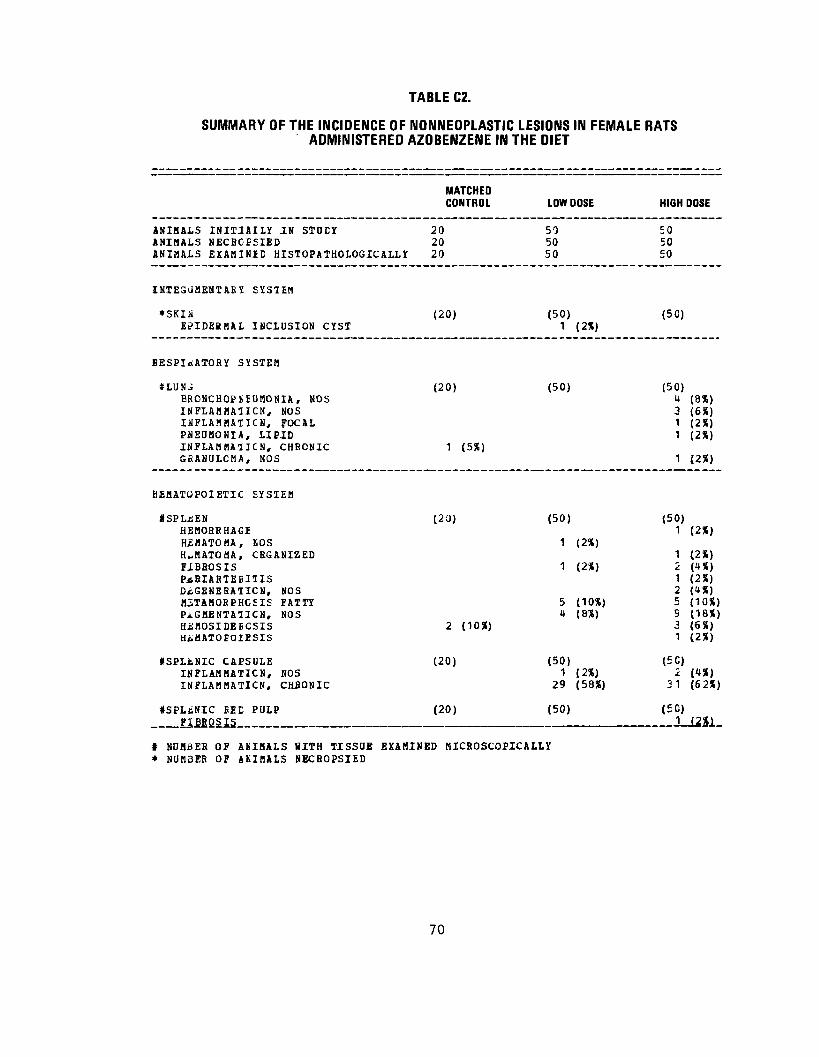
TABLE C2.
SUMMARY OF THE INCIDENCE OF NONNEOPLASTIC LESIONS IN FEMALE RATS ADMINISTERED AZOBENZENE IN THE DIET
MATCHED CONTROL LOW DOSE HIGH DOSE
A N I M A L S INITJAILY IN STOEY 20 50 SO ANIMALS NECBCESIED 20 50 50 A N I M A L S E X A M I N E D HISTOPATHOLOGIC ALLY 20 50 50
INTEGJBEHTAEY SYSTEM
(20) (50) (50) EPIDEBBAL INCLUSION CYST 1 (2X)
BESPIr iATOHY S Y S T E M
SLUNu! (20) (50) (50) BRONCHOPKIUHONIA, NOS « <8X) I N F L A M B A 1 I C N , NOS 3 (6X) I N F L A M M A T I O N , FOCAL 1 (2%) P N E U M O N I A , LIPID 1 (2X) I H F L A M B A 1 I C N , CHBCNIC 1 (5X) G f i A N U L C B A , NOS 1 12%)
HEHATOPOIETIC S Y S T E M
JtSPLjiEN (20) (50) (50) H E M O R E H A G I 1 (2X) H E B A T O M A , SOS 1 (2X) H^HATOMA, CHGANIZED 1 (2*) PIBBOSIS 1 (2X) 2 («X) PjiHIAHTEEITIS 1 (2X) D t G E N E R A T I C N , NOS 2 (4X) MaTAHORPHCSIS FATTY 5 (10») 5 (10X) PJ.GHENTA1ICN, NOS 4 (8%) 9 (18*) H£MOSIDEECSIS 2 (10X) 3 (6«) HfiBATOEOIESIS 1 (2X)
ISPLtNIC CAPSDLE (20) (50) (SO) I N P L A M B A T I C N , NOS 1 I2X) 2 [H%) I N F L A M M A T I C N , CR80NIC 29 (58S) 31 (62X)
iSPLiiNIC B E D POLP (20) (50) (50) FIBROSIS
t NDHBEB OF ANIHALS HITH TISSUE EXABINED MICSOSCOPICA1LY * NUBBER OF AKIBALS SECBOPSIED
70

TABLE C2. FEMALE RATS: NONNEOPLASTIC LESIONS (CONTINUED)
MATCHED CONTROL LOW DOSE HIGH DOSE
PIGMENTATION, NOS 1 (2X) 1 (2X) HYPERPLASIA, NOS 2 (UX)
ILYMPH NODE (20) (50) ( 5C ) HEMORRHAGE 1 (2X) HYPERPLASIA, NOS 1 (2X)
CIRCnLATORY SYSTEM
IHEAB1 (20) (50) ' (50) FIBROSIS 6 (30%) 3 (6X) 11 (22X)
IMY04-ABDIUM (20) (50) (50) FIBBOSIS 1 (2X) DEGENERATION, NOS 2 (<JX)
EIGES1IVE S Y S T E M
I P A R O T I D G L A N n (20) (50) (50) I N F L A H M A T I C N , NOS 1 (2%) 1 (2%) I N F L A M M A T I O N , NSC ROTIZING 1 (5%) 1 (2%) 2 ( 4 X ) I N F L A M M A T I O N , ACU TE/CHBONIC 2 (UX) I N F L A M M A T I O N , C H R O N I 2ONI CC (4»)
tSUBf lAXILLARY G L A N D (20) (50) (SO) I N F L A M M A T I O N , N O S 7 ( 1 U X ) I N F L A M M A T I O N , N E C ROTIZING 1 (5X) 7 (14X) a ( 8 X ) I N F L A M M A T I O N , ACUTTEE 1 (5X) 1 ( 2 X ) INFLAMMATION, ACUTE, 2 1 (2%) 1 (2X)TE/CHRCNIC (10X) I N F L A M M A T I O N , CHRONI 2 3 (6X)ONI CC ( < * X)
I L I V E R (20) (50) « 5 C ) G R A N U L O M A , N O S 16 (32%) 15 (30%) I N F L A M M A T I O N , AL G R A N U L O M A T O U 1 ( 2 X ) C n O L A N G I C F I B R O S I S 3 (15X) 17 (34%) 2 ( 4 X ) CIRRHOSIS, NOS 1 (5X) HEPATITIS, TOXIC 1 (2%) NiCHOSIS, KOS 1 (2%) 2 ( 4 % ) NtCROSIS, I O C A L 1 (2X) NiCHOSIS, C O A G U L A T I VEET I V 1 ( 5 X ) M i T A B O R P H C S I S FATT YYT 1 ( 5 X ) 2 (4») 1 ( 2 % ) P I G M E N T A T I O N , NOS 11 ( 2 2 % )
ANG 3 J15Jfl 7 J14XJ. 3_J5!i_FOCAL_CEIIULAB CHANG EE
t N U H d E R OF A M M A L S WITH TISSUE E X A M I N E D MICROSCOPICALLY * N U M B E R OF A M M A L S NEC80PSI1D
71

TABLE C2. FEMALE RATS: NONNEOPLASTIC LESIONS (CONTINUED)
MATCHED CONTROL LOW DOSE
#LIVt ,R /CENTRI IOBULAR (20) (50) NECROSIS, NOS
*I IVi8/HEPATCCYTIS (20) (50) H^GALOCYTCSIS 1 ( 5 X )
1PANLREAS (20) (50) A T R O P H Y , NCS 1 (2!t)
ISTOMACH (20) (50) U1CER, NCS 1 (5») I S P L A H H A 1 I C N , CHRONIC 1 (2%)
U R I N A R Y SYSTEM
I K I D N E Y (20) (50) P Y E L O N E P H R I T I S , NOS N E P H R O P A T H Y 2 (1055) 4 (6%) P I G H E N T A I I C N , NOS 27 (54%)
# K I D N E Y / T U B U 1 I (20) (50) P I G M E N T A T I O N , NOS 1 (5X)
* U R I N A R Y E L J E I E R (20) (50)HYPERPLASIA, EPITHELIAL 1 (2*)
E N D O C R I N E S Y S T I M
# P I T U I T A B Y (20) (49) CYST, NOS 1 (5X) 1 [2%} H j i M O R R H A G I C CYST 1 (5X) HYPERPLASIA, NOS 2 (4X) H Y P E R P L A S I A , FOCAL 2 (10!!) 2 (4X)
I A D R E N A L 120) (50) H u M O R R H A G I NiCBOSIS, NOS 1 (5*) H Y P E R P L A S I A , FOCAL
# A D R £ N A L C O B T I X (20) (50) HiiTAMORPBCSIS FATTY
. . H Y P E R P L A S I A , NOS .. I i§*)
t NUMBER OF ANIMALS WITH TISSUE EXAHIHED BICBOSCOPICALLY * NUMBER OF ANIMALS NECBOPSIED
HIGH DOSE
(50) 1 ( 2 X )
(50)
(50) 1 ( 2 X )
(50)
(50) 1 ( 2 X ) 3 (655) 2 (48)
(50) 5 (10X)
(50)
(50)
1 (2X) S (1035)
(50) 1 ( 2%)
1 (2%)
( S C ) 1 (2X)
72

TABLE C2. FEMALE RATS: NONNEOPLASTIC LESIONS (CONTINUED) ™ ~™ ~~ "~ — '-"- "- — — —
~—~"~ -i-— _ — ———.——
MATCHED CONTROL LOW DOSE HIGH DOSE
l A D K J i N A L B E D U I L A (20) (50) (50) H Y P E R P L A S I A , NOS 1 (2X) 6 (12XJ
1THYROID [20) (50) l«8) COLLOID CYST 1 (5«) 1 (2X) H Y P E R P L A S I A , C-CELL 2 (105!) 4 (8X)
REPRODUCTIVE S Y S T E M
* H A H M A R Y G L A N I (20) (50) (50) CYST, NOS 1 (5X) I N F L A M M A 1 I C N , CHEONIC 1 (2X) H Y P E R P L A S I A , CYSTIC 1 (5X)
*PREP(JTIAL G L A N D (20) (50) (50) H Y P E R P L A S I A , CYSTIC 1 (2X)
« U T E R U S (20) (50) (50) FIBROSIS 1 (5X) 1 (2X) i {«)
* U T E R U S / E N D C M E T R I U B (20) (50) (50) I N F L A M H A T I C N , VESICULAR 2 (US)
I O V A R Y (20) (50) (50) CYST, SOS 1 {5X)
« O V A i Y / B E D U L I A (20) (5J) (50) H Y P E R P L A S I A , NOS 1 (5X) 1 (2X) 7 (UX)
N E R V O U S SYSTIB
fCBBfiBELLUB (20) (50) (50) H i B O R R H A G E 1 (2*)
SPECIAL SENSE ORGANS
*£YE/LACRIflAI G L A N D (20) (50) (50) I N F L A M M A T I O N , NOS 1 (2X)
HOSCUiOSKELETAI SYSTEH
NONfi
» SOHBEE OF ANIHALS WITH TISSUE EXAMINED HICBOSCOPICALLY * SUHBER OF ANIBALS NBCHOPSIED
73

TABLE C2. FEMALE RATS: NONNEOPLASTIC
EOEY CAVITIIS
*ABDOBINA1 C A V I T YSTEATITISNiCBOSIS, FAT
*MESiNTEBYPfcBIABTEBIlIS
ALL OTHER S Y S T E M S
NONE
SPECIAL MOHEfcCIOGY SOHBAPY
NO LESIOK fEfOBTEDAUTO/NSCBCPSY/HISTO P£BF
LESIONS (CONTINUED)
MATCHED CONTROL LOW DOSE HIGH DOSE
{20) (50) (50) 1 (2%) 1 (2X)
(20) (50) (50) 1 (2X)
3 1
t NOHJEB OF AKIMALS WITH TISSUE EXAMINED BICBOSCOPICALLY * NUMBEB OF AMMALS NECBOPSIED
74
APPENDIX D
SUMMARY OF THE INCIDENCE OF NONNEOPLASTIC LESIONS IN
MICE ADMINISTERED AZOBENZENE IN THE DIET
75

76

TABLE 01.
SUMMARY OF THE INCIDENCE OF NONNEOPLASTIC LESIONS IN MALE MICE ADMINISTERED AZOBENZENE IN THE DIET
MATCHED CONTROL LOW DOSE HIGH DOSE
A N I M A L S INITIALLY IN STUDY 20 50 50 A N I M A L S HISSING 1 2 ANIflALS NECBOPSIED 20 49 18 A N I M A L S E X A H I N E D HISTOPATHOLOGICALS 20 49 48
I N T E G U M E N T A R Y SYSTEM
*SKIil (20) (49) (48) HYPERPIASIi. CYSTIC 1 (5X)
RESPIRATORY SYSTEM
ILUNG/BRONCHICLE (20) (49) (47) HYPERPLASIA, LYHPHOID 3 (6«)
•LUNG (20) (49) |47) INFLAMMATION, FOCAL 1 (5X) HYPERPLASIA, ALVEOLAR EPITHZLIUM 1 (2«)
tEMATOPOIETIC SYSTEM
ISPLiEN (20) (49) (47) ATROPHY, NCS 2 (4X) H Y P E R P L A S I A , L Y M P H O I D 2 (10*) 4 (8*) 1 (235) H L M A T O P O I f S I S 1 (5%) 1 (2*)
ILYMPH NOPE (20) (48) (47) H Y P E R P L A S I A , L Y M P H O I D 15 (328)
I S U B f l A N D I B U I A R L.SODE (20) (48) (47) H Y P E R P L A S I A , I Y M P H O I D 1 (5«)
tCEKVICAL L Y M P H NODE (20) (47) MtTAHOHPfcCSIS FATTY 1 (5%) H Y P E R P L A S I A , L Y M P H O I D 1
• P A N C R E A T I C L . N O E E (20) (47) HYPERPLASIA. LYHPHOID
* NOHBER OF ANIMALS WITH TISSUE EXAMINED MICEOSCOPICALLY * NUMriER OF ANIMALS NECROPSIED
77

TABLE 01. MALE MICE: NONNEOPLASTIC LESIONS (CONTINUED) ~~ ——— — — ~°—•----—J ——""• — „_ „. , i i . . - --r. "~ '~ "— *~ "" — —• •—•
MATCHED CONTROL LOW DOSE HIGH DOSE
((MESENTERIC I. NODE A T R O P H Y , NCS H Y P E R P L A S I A , L Y M P H O I D HiMATOEOIESIS
(20) 211
( 1 J X ) (5X) ( 5 % )
(48) 33
(6X) (6%)
((47)
CIRCULATORY SYSTEM
# B Y O C A R D I U M FIBROSIS FIBROSIS, JCCAL
( 2 0 ) (48) 11
(2X) (2X)
(46)
D I G E S T I V E SYS1IM
4 S A L I V A R Y G L A N D I N F L A M M A T I C N , NOS
(19) (48) 1 I2X)
(47)
*SUBM AXIL L A R K G L A N D I N F L A M M A T I O N , N O S
(19) 6 (32%)
(48) 16 (33%)
(47)
#LIV£R TUROMBOSIS, NOS HflMOBRHAGIC CYST I N F L A M M A T I C N A C U T E P U S T U L A R I N F L A M M A T I O N , CHRONIC FOCAL I N F A R C T , N C S BASOPHILIC CY10 CHANGE FOCAL C E L L U L A R C H A N G E MtGALOCYTCSIS H Y P E R P L A S 1 I C N O D U L E H Y P E R P L A S I A , L Y M P H O I D
(20) 1 (5*) 1 (5X)
1 (5%) 1 (5X)
1 (5X)
1 (5%)
(49)
1 (2X)
1 (2X)
5 (10%)
2 (4S)
{48)
1 (2X)
1 (2X) 1 (2X)
*LIVtR/CENTRIIOBULAR BILE STASIS CYTOPLASMIC VACUOLIZATION
(20) (49) (4€) 1 (2X) 1 (2X)
I L I V £ R / K U E F F E E CELL H Y P E R P L A S I A , NOS
(20) 1 (5X)
(49) (48 )
ISTOBACH U^CER, NOS ABSCESS, NCS
(20) (49) (HI) 1 (2X)
(2X)
»PEYi,RS P A T C B HYPERPLASIAJ_LYHPHQIE
(20) (49) (47)
* NUMBER OF ANIMALS WITH TISSUE EXAMINED MICROSCOPICALLY * NUMBER OF ARIMALS NECBOPSIiD
78
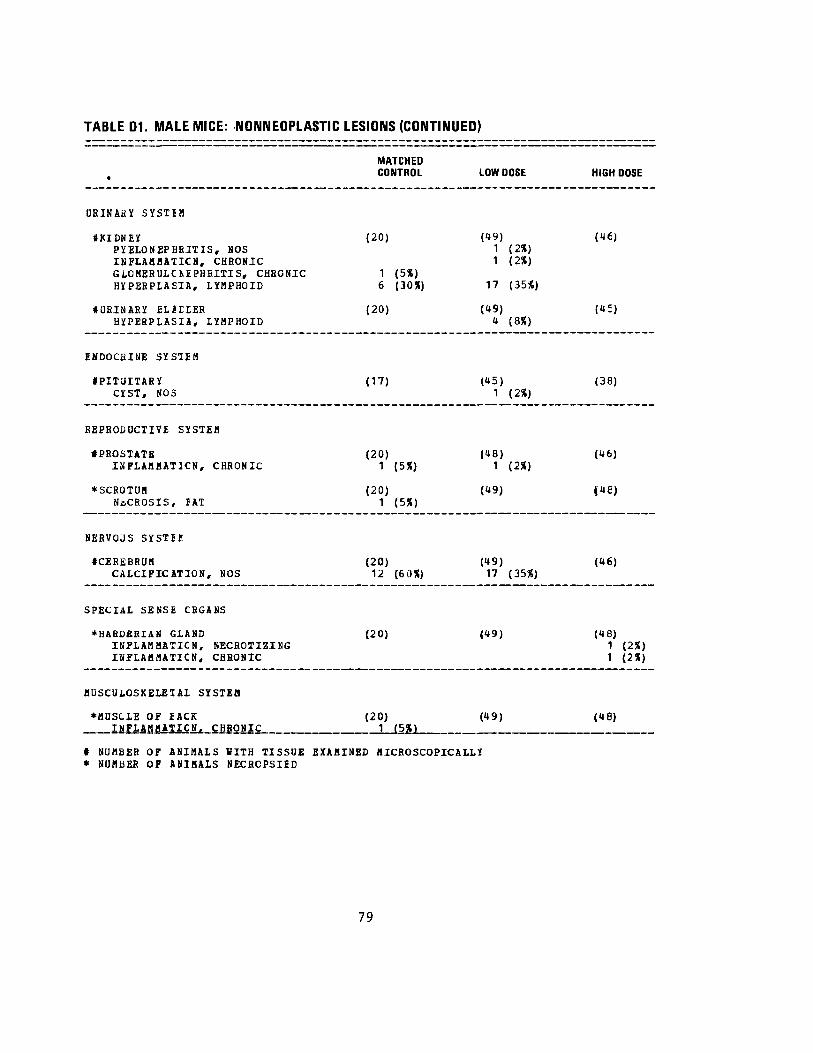
TABLE D1. MALE MICE: NONNEOPLASTIC LESIONS (CONTINUED)
MATCHED CONTROL LOW DOSE HIGH DOSE
OBINAHY SYSTIM
I K I D N E Y (20) (49) (46) P Y E L O N E P H R I T I S , HOS 1 (2*) I N F L A M M A T I O N , CHRONIC 1 (2«) G LO HER U L C J i E P H BITIS, CHRONIC 1 (5!«) H Y P E R P L A S I A , L Y M P H O I D 6 (30%) 17 (35%)
# U H I N A R Y E L i E E E R (20) (49) (45) H Y P E R P L A S I A , L Y M P H O I D 4 (88)
EMDOCHINE S Y S T E M
IPITUITARY (17) (45) (38) CYST, NOS 1 (2%)
REPRODUCTIVE SYSTEM
IPROSTATfi (20) (48) (46) I N F L A M M A T I O N , CHRONIC 1 (5«) 1 (2%)
*SCROTOM (20) (49) J48) NbCROSIS, IAT 1 (5X)
N E R V O U S SYSTie
4CEREBRUM (20) (49) (46) CALCIFICATION, NOS 12 (60X) 17 (35%)
SPECIAL SENSE C R G A N S
H A R D E R I A N G L A N D (20) (49) (48) I H F L A M M A T I C N , NECROTIZING 1 (2X) ISFLAHMATICN, CHRONIC 1 (2S)
JSUSCULOSKELE1A1 SYSTEfl
*MUSCLE OF BACK (20) (49) (48) INFLAMMATION. CHBONIC 1_J5JLL
t N U M B E R OF A N I M A L S HITH TISSUE E X A M I N E D MICROSCOPICALLY * NUMBER OF ASIMALS NECROPSIED
79

TABLE 01. MALE MICE: NONNEOPLASTIC LESIONS (CONTINUED)
MATCHED CONTROL LOW DOSE HIGH DOSE
EODY CAVITIES
*ABDOHINAL C A V I T Y [20) (49) (148) NhCBOSIS, FAT 1 (5SS) I N F A R C T , HCS 1 (2%)
*HES*NTERY (20) (49) (4£) NECROSIS, FAT 1 (5«)
AIL OIHER SYSTIMS
N O N E
SPECIAL HOREbCIOGY SDBHAEI
NO LESION BEPORTED 1 2 1C A M I M A L HISSING/NC NECROISY 1 2 AUTO/NECBCJESY/HISTO PERF 1
* N O M b E B OF A M H A L S W I T H TISSOE E X A M I N E D HICROSCCPICALLY * N U M B E R OF A K I M A L S NECROPSIED
80

TABLE 02.
SUMMARY OF THE INCIDENCE OF NONNEOPLASTIC LESIONS IN FEMALE MICE ADMINISTERED AZOBENZENE IN THE DIET
MATCHED CONTROL LOW DOSE HIGH DOSE
MIBt-LS IIITIA1LI II STUDY 23 5J 50 IBUALS HISSIBG 1 7 tBIBALS BICBCrSIEC 20 47 38 AHH1LS ZXABIIIA HISTOPATHOlOGICAilY 20 U7 38
H7EGUBMT1BT SISIIfl
MClit
BESPI4ATOBI SYSTEH
•IOB6/BBOBCKICLE (20) (46} (36) HYPIBPLAS1I. LTHPBOID 10 (22S)
«LDHG (20) (46) (36) HEHORKHiG! 1 (2%) IMFLASB4TICH, HOS 1 (3X) HYPERPLASIA, FOCAL 1 (5%) HYPERPLASIA, LTHPHOID 6 (30X) 2 (4X)
HEMATOPOIETIC SISTER
IBOHfi HABflOB (20) (46) (37) SIDBROSIS 1 (3%)
tSPLiEN (20) (47) (36) HiHOSIDERCSIS 6 (161) HYPEBPLASIA, LYMPHOID 7 (35S) 16 (34«) 4 (11X) HiHATOFOIISIS 7 (35*) 8 (178)
•LYMPH NODE (20) (47) (35) HYPERPLASIA, LYMPHOID 1 15*) 8 (23*)
*SUBi1ANDIBUIAR L .MODE (20) (47) (35) HYPERPLASIA, IYBPHOID 1 (2*)
*CEBVICAL L Y E P H NODE (20) (47) (35)
f NUMBEB OF ANIMALS WITH TISSUE EXAMINED MICROSCOPICALLY * NOMBEH OF ANIMALS NECBCPSIED
81

TABLE D2. FEMALE MICE: NONNEOPLASTIC LESIONS (CONTINUED)
— - ~~ —
MATCHED CONTROL LOW DOSE HIGH DOSE
H Y P E R P L A S I A , L Y H P H O I D (J (20%)
t M E S E N T E R I C L. NODE [20) C*7) (35) A T R O P H Y , NCS 1 (5X) 2 (H%) H Y P E R P L A S I A , NOS 1 (2X) L Y M P H O C Y T O S I S 1 (2X) HYPERPLASIA, LYHPHOID 1 (5X) 2 («X)
ITHYi lUS (16) (41) ( 26 ) A1ROPHY, tiCS 1 (6X)
C I R C U L A T O R Y S Y S T E M
N O N E
riGESIIVE SYSTIM
• S A L I V A R Y G 1 A K D (19) (45) (35) INFLAMMATION, NOS 2 (11X) 1 (2X)
* S U B H A X I L L A R Y G L A N D (19) (45) (35) INFLAMMATION, NOS 7 (3755) 14 (31X)
*LIVEB (20) (47) (36) I N F L A M M A T I O N , NECROTIZING 1 (2X) 1 (3XJ NtCBOSIS, NOS 1 (3X) NiCBOSIS, fOCAI 1 (5X) 1 (2X) METAMORPHOSIS FATTY 4 (11X) FOCAL C E I I U L A B C H A N G I 1 (5X) 2 (4X) MtGALOCYTCSIS 1 (3X) H Y P E R P L A S I A , LYMPHOID 1 (5X) 9 (19X)
#LIVtB/CAODJT£ LOEE (20) (47) (36) INFARCT, NCS 1 (3X)
IPANCBEAS (20) (47) . (3«) I N F L A H B A T I C N , NOS 1 (5X) 1 (2X) I N F L A H M A I I C N , ACUTE 1 (2X)
1 STOMACH (20) (47) (37)H & H O B R H A G f 1 (3X)
D B I N A R Y SYSTIM
*KIDHEY (20) (<*7) (38) ___ „«, INFLAMMATION. CHRONIC 1 rsxi
t NUMBEB OF ANIMALS HITH TISSUE EXAMINED MICROSCOPICALLY * NUHBEB OF ANIMALS NECROPSIED
82

TABLE 02. FEMALE MICE: NONNEOPLASTIC LESIONS (CONTINUED)
HYPERPLASIA. L Y M P H O I D
IKIDNEY/CORTIX CYST, NOS
IKIDHEY/TUBOII PXGHENTATICN, NOS
f U R I B A R Y BLAEEBH INFIAHHATICN, CHRONIC HYPERPLASIA, LYMPHOID
10-Bi. ADDER/SO EMUCOS A HYPERPLASIA, LYMPHOID
ENDOCRINE SYS1IM
•PITUITARY HYPERPLASIA, FOCAL
lADBJiNAi CORTIX D E G E N E R A T I O N , NOS
•ADRSNAi HIDDILA H Y P E R P L A S I A , NOS
REPRODUCTIVE SYSTEfl
1 UTERUS HYCROHETBA H £ H O R R H A G £ HEHOHRHAGIC CYST HYPERPLASIA, LIHPHOID
• U T E K U S / E N D C K I T R I U M I N F L A M M A T I O N , NOS UJFLAHBA1ICN, VKSICOLAR
W V A S Y / P A R O V A R I A N IHFAHCZ, NCS
•OVARY CYST, NQS
I NOHBEB OF A N I M A L S HITH TISSUE* BO«bEF OF A N I M A L S NECROPSIED
MATCHED CONTROL LOW DOSE
10 (SOX) 13 (28X)
(20) (47)
(20) (47)
(20)
5 (25%)
(47) 1
10 (2X) (21X)
(20) 1 (5X)
(47)
(19) (42) 1 (2X)
(20) (47) 1 (2*)
120) (47)
(20) (47)
1 (2X) 1 (2X) 1 (2X)
(20) (47)
8 (40X) 27 (57X)
(20) (47) 2 (10X)
(19) (46) 1 J5XJ S-J11SI
E X A M I N E D MICROSCOPICALLY
HIGH DOSE
(38) 1 (3X)
(38) 1 (3X)
(36)
(36)
(30)
(37)
(37) 2 (5X)
(37) 2 (5S)
1 (3X)
(37) 11 (303S)
4 (11X)
(37)
(37) 2 (5»1_
83

TABLE 02. FEMALE MICE: NONNEOPLASTIC LESIONS (CONTINUED)
MATCHED CONTROL LOW DOSE HIGH DOSE
THROMBOSIS, NOS 2 (4%) 1 (3») HJEMORRHAGIC CYST 1 (5%) 1 (3X)
N E R V O U S S Y S T E M
*CEBj,BRUH (20) (47) (36) CALCIFICATION, NOS 13 (65%) 12 (26%)
SPECIAL S E N S E C R G A N S
N O N E
KDSCUiOSKELETAL STSTEH
NONE
EOEY CAVITIES
*ABDOMINAL CAVITY (20) (47) (38) NiCROSIS, IA1 1 (2%) INFARCT, KCS 1 (3«) HYPERPLASIA, LYHPHOID 1 (2%)
*MESENTERY (20) (47) (36) NECROSIS, JAT 1 (2%)
ALL OTHER SYSTEMS
O H E N T D H NiCBOSIS, FAT 1
SPECIAL MORPHCIOGY S U M M A R Y
NO LESION B E F O B T E D 2 ANIMAL MISSING/NO NECROPSY 1 7 AUTOLYSIS/NO NECROPSY 2 5
I NUflfiEB OF ANIMALS WITH TISSUE E X A M I N E D MICROSCOPICALLY * NUMBER OF ANIMALS NECROPSIED
84

APPENDIX E
ANALYSES OF THE INCIDENCE OF PRIMARY TUMORS
IN RATS ADMINISTERED AZOBENZENE IN THE DIET
85

86
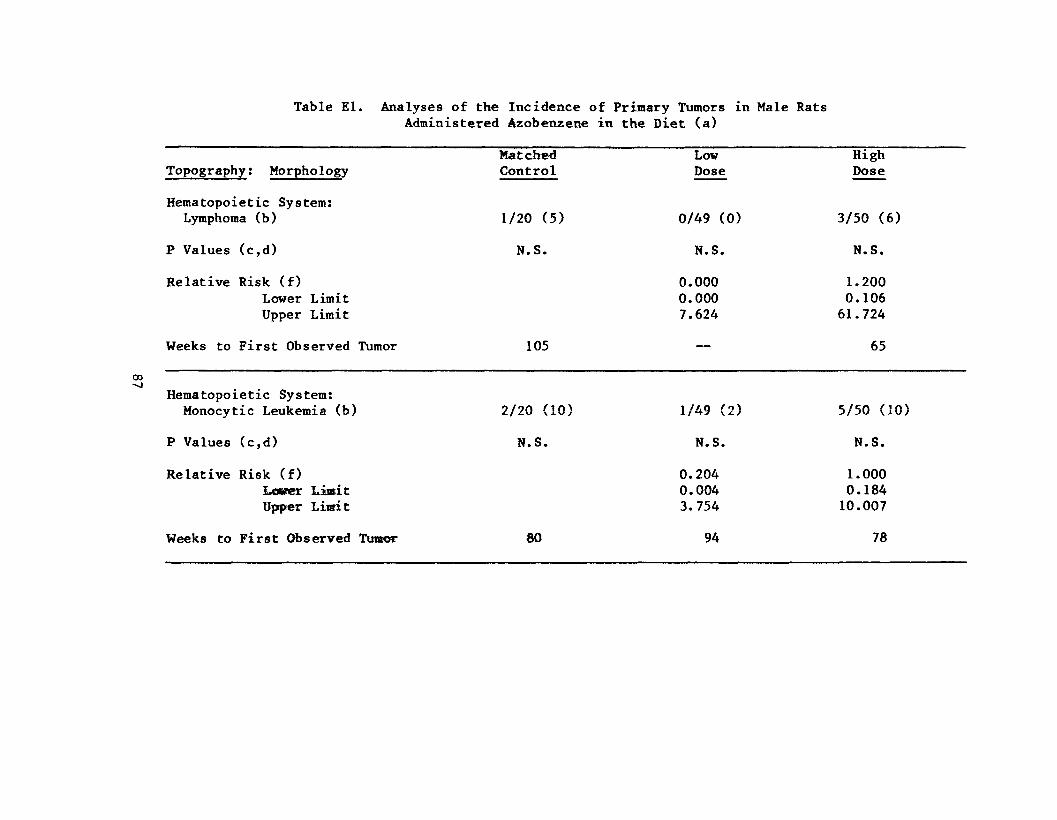
Table El. Analyses of the Incidence of Primary TumorsAdministered Azobenzene in the Diet (a)
in Male Rats
Topography: MorphologyMatched
Control Low Dose
High Dose
Hematopoietic System: Lymphoma (b) 1/20 (5) 0/49 (0) 3/50 (6)
P Values (c,d) N.S. N.S. N.S.
Relative Risk (f) Lower Limit Upper Limit
0.000 0.000 7.624
1.200 0.106 61.724
Weeks to First Observed Tumor 105 —
65
CO -J
Hematopoietic System: Monocytic Leukemia (b) 2/20 (10) 1/49 (2) 5/50 (10)
P Values (c,d) N.S. N.S. N.S.
Relative Risk (f) Lower Limit Upper Limit
0.204 0.004 3.754
1.000 0.184 10.007
Weeks to First Observed Tumor 80 94 78
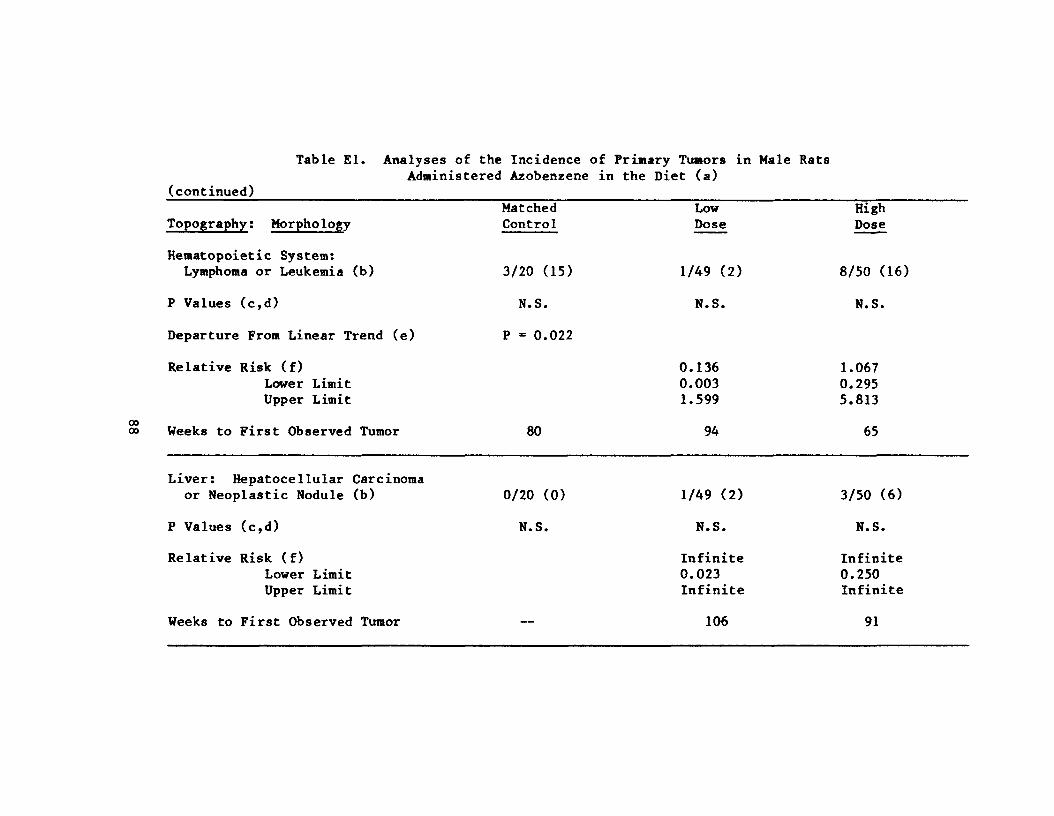
Table El. Analyses of the Incidence of Primary Tumors in Male Rats Administered Azobenzene in the Diet (a)
(continued)
Topography: Morphology
Hematopoietic System: Lymphoma or Leukemia (b)
P Values (c,d)
Departure From Linear Trend (e)
Relative Risk (f) Lower Limit Upper Limit
oo oo Weeks to First Observed Tumor
Liver: Hepatocellular Carcinoma or Neoplastic Nodule (b)
P Values (c,d)
Relative Risk (f) Lower Limit Upper Limit
Weeks to First Observed Tumor
Matched Control
3/20 (15)
N.S.
P = 0.022
80
0/20 (0)
N.S.
Low Dose
1/49 (2)
N.S.
0.136 0.003 1.599
94
1/49 (2)
N.S.
Infinite 0.023 Infinite
106
High Dose
8/50 (16)
N.S.
1.067 0.295 5.813
65
3/50 (6)
N.S.
Infinite 0.250 Infinite
91

Table El. Analyses of the Incidence of Primary Tumors in Male Rats
(continued)
Topography; Morphology
Pituitary: Adenoma, NOS (b)
P Values (c,d)
Relative Risk (f) Lower Limit Upper Limit
Weeks to First Observed Tumor
co VO Pituitary: Chromophobe
Adenoma (b)
P Values (c,d)
Relative Risk (f) Lower Limit Upper Limit
Weeks to First Observed Tumor
Administered Azobenzene in the Diet (a)
Matched Low Control Dose
4/20 (20) 2/49(4)
P = 0.002 (N) N.S.
0.204 0.020 1.323
105 106
0/20 (0) 2/49 (4)
N.S. N.S.
Infinite 0.125 Infinite
86
High Dose
0/49 (0)
P - 0.006 (N)
0.000 0.000 0.435
—
3/49 (6)
N.S.
Infinite 0.255 Infinite
90

Table El. Analyses of the Incidence of Primary Tumors in Male Rats Administered Azobenzene in the Diet (a)
(continued) Matched Low High
Topography! Morphology Control Dose Dose
Testis: Interstitial-cell Tumor (b) 17/20 (85) 41/48 (85) 31/49 (63)
P Values (c,d) P = 0.012 (N) N.S. N.S.
Relative Risk (f) 1.005 0.744 Lower Limit 0.836 0.607 Upper Limit 1.335 1.083
weeks to First Observed Tumor 76 82 82
Spleen: Fibrosarcoma (b) 0/20 (0) 2/49 (4) 7/49 (14)
P Values (c,d) P = 0.020 N.S. N.S.
Relative Risk (f) Infinite Infinite Lower Limit 0.125 0.826 Upper Limit Infinite Infinite
Weeks to First Observed Tumor 106 86

Table El. Analyses of the Incidence of Primary Tumors in Male Rats Administered Azobenzene in the Diet (a)
(continued) Matched Low
Topography: Morphology Control Dose
All Sites: Hemangiosarcoma (b) 0/20 (0) 1/49 (2)
P Values (c,d) N.S. N.S.
Relative Risk (f) Infinite Lower Limit 0.023 Upper Limit Infinite
Weeks to First Observed Tumor 106 —
VO Multiple Organs: Fibrosarcoma (b) 0/20 (0) 0/49 (0)
P Values (c,d) P less " — than 0.001
Departure From Linear Trend (e) P = 0.030
Relative Risk (f) — Lower Limit — Upper Limit —
Weeks to First Observed Tumor
High Dose
4/50 (8)
N.S.
Infinite 0.386 Infinite
82
13/50 (26)
P = 0.007
Infinite 1.674 Infinite
76

__
Table El. Analyses of the Incidence of Primary Tumors in Male Rats Administered Azobenzene in the Diet (a)
(continued) Matched Low
Topography; Morphology Control Dose
Multiple Organs: Osteosarcona (b) 0/20 (0) 0/49 (0)
P Values (c,d) N.S.
Relative Risk (f) Lower Limit
— Upper Limit —
Weeks to First Observed Tumor —
VO Abdominal Cavity: NJ
Sarcoma (b,g) 0/20 (0) 6/49 (12)
P Values (c,d) P less than 0.001 N.S.
Departure from Linear Trend (e) P « 0.027
Relative Risk (f) Infinite Lower Limit 0.680 Upper Limit Infinite
Weeks to First Observed Tumor 106
High Dose
3/50 (6)
N.S.
Infinite 0.250 Infinite
97
31/49 (63)
P less than 0.001
Infinite 4.415 Infinite
76
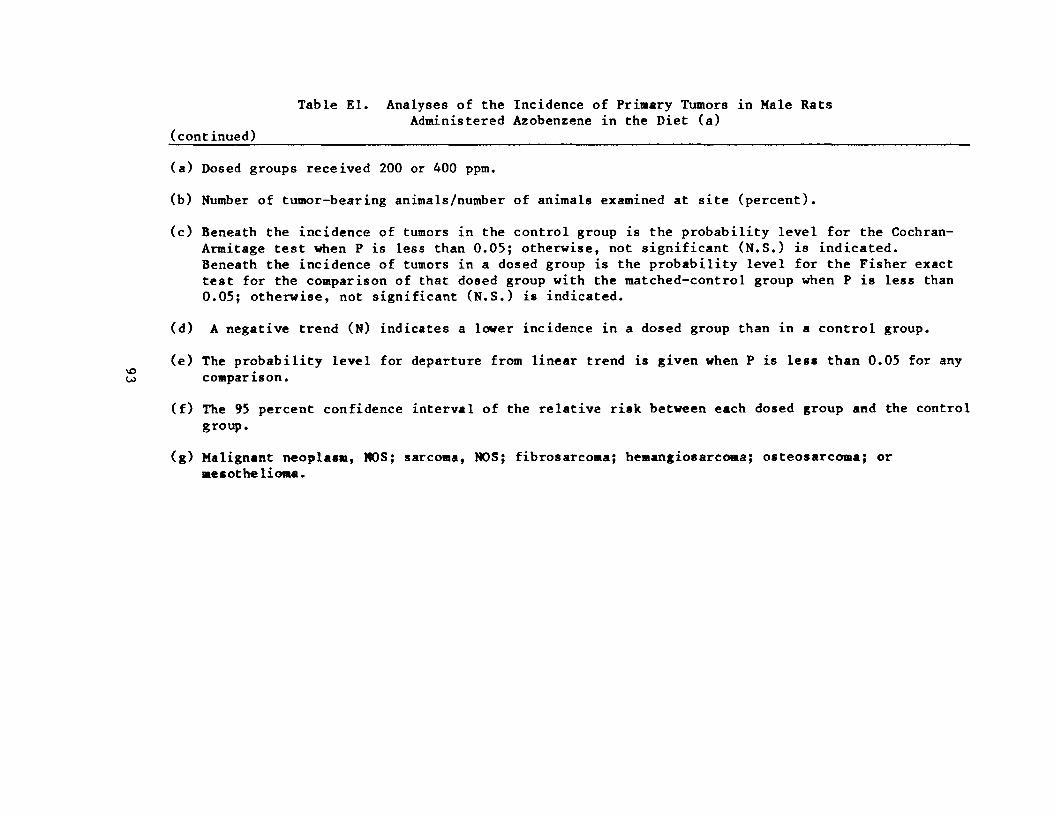
Table El. Analyses of the Incidence of Primary Tumors in Male Rats Administered Azobenzene in the Diet (a)
(continued)
(a) Dosed groups received 200 or 400 ppm.
(b) Number of tumor-bearing animals/number of animals examined at site (percent).
(c) Beneath the incidence of tumors in the control group is the probability level for the Cochran-Armitage test when P is less than 0.05; otherwise, not significant (N.S.) is indicated. Beneath the incidence of tumors in a dosed group is the probability level for the Fisher exact test for the comparison of that dosed group with the matched-control group when P is less than 0.05; otherwise, not significant (N.S.) is indicated.
(d) A negative trend (N) indicates a lower incidence in a dosed group than in a control group.
(e) The probability level for departure from linear trend is given when P is less than 0.05 for any VO w comparison.
(f) The 95 percent confidence interval of the relative risk between each dosed group and the control group.
(g) Malignant neoplasm, NOS; sarcoma, NOS; fibrosarcoma; hemangiosarcoma; osteosarcoma; or mesothelioma.

Table E2. Analyses of the Incidence of Primary Tumors in Female Rats
Topography; Morphology
Hematopoietic System: Monocytic Leukemia (b)
P Values, (c,d)
Relative Risk (f) Lower Limit Upper Limit
Weeks to First Observed Tumor
Hematopoietic System : Lymphoma or Leukemia (b)
P Values, (c,d)
Relative Risk (f) Lower Limit Upper Limit
Weeks to First Observed Tumor
Administered Azobenzene in the Diet (a)
Hatched Low High Control Dose Dose
1/20 (5) 3/50 (6) 0/50 (0)
N.S. N.S. N.S.
1.200 0.000 0.106 0.000 61.724 7.475
106 89 —
1/20 (5) 6/50 (12) 1/50 (2)
M.S. N.S. N.S.
2.400 0.400 0.325 0.005
108.021 30.802
106 89 106
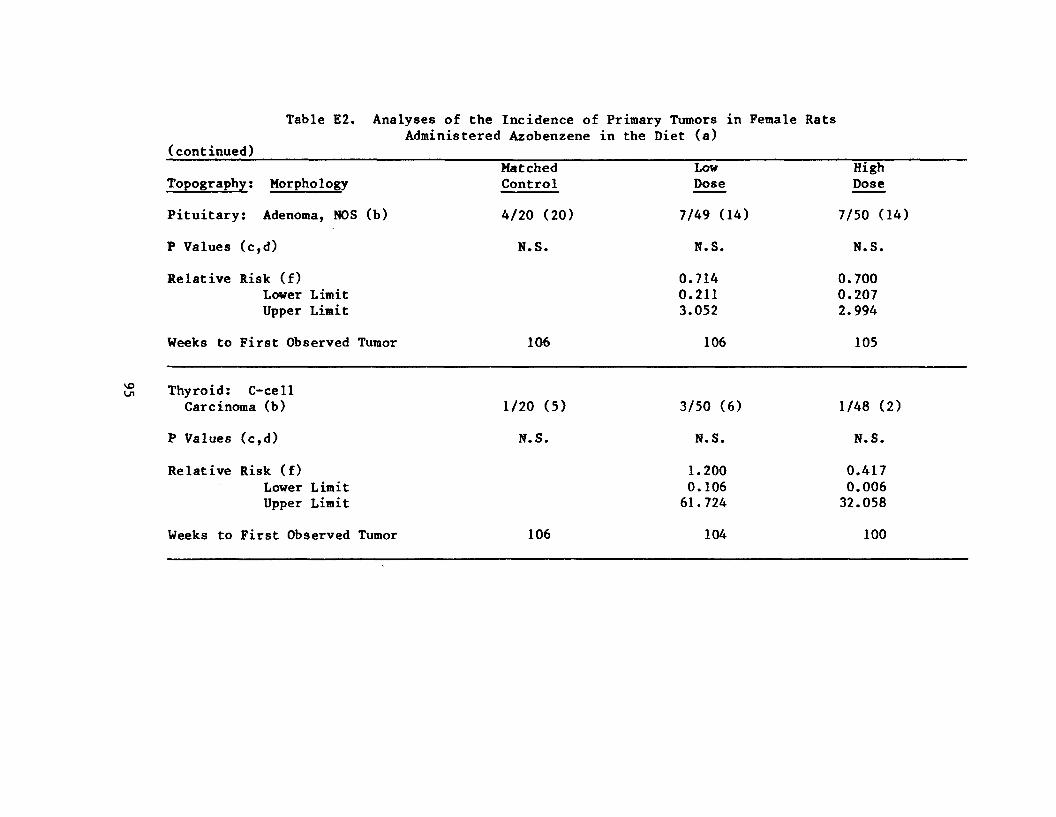
Table E2. Analyses of the Incidence of Primary Tumors in Female Rats
(continued)
Topography: Morphology
Pituitary: Adenoma, NOS (b)
P Values (c,d)
Relative Risk (f) Lower Limit Upper Limit
Weeks to First Observed Tumor
VO Thyroid: C-cell Carcinoma (b)
P Values (c,d)
Relative Risk (f) Lower Limit Upper Limit
Weeks to First Observed Tumor
Administered Azobenzene in the Diet (a)
Matched Low Control Dose
4/20 (20) 7/49 (14)
N.S. N.S.
0.714 0.211 3.052
106 106
1/20 (5) 3/50 (6)
N.S. N.S.
1.200 0.106 61.724
106 104
High Dose
7/50 (14)
N.S.
0.700 0.207 2.994
105
1/48 (2)
N.S.
0.417 0.006 32.058
100

Table E2.
(continued)
Topography: Morphology
Manaary Gland: Fibroadenoma (b)
P Values (c,d)
Relative Risk (f) Lower Limit Upper Limit
Analyses of the Incidence of Primary Tutors in Female Rats Administered Azobenzene in the Diet (a)
Matched Low Control Dose
3/20 (15) 5/50 (10)
N.S. N.S.
0.667 0.147 4.014
Weeks to First Observed Tumor 106 106
VO
** Uterus: Endometrial Stromal Polyp (b) 2/20 (10) 5/50 (10)
P Values (c,d) N.S. N.S.
Relative Risk (f) Lower Limit Upper Limit
1.000 0.184 10.007
Weeks to First Observed Tumor 106 106
High Dose
3/50 (6)
N.S.
0.400 0.060 2.802
105
1/50 (2)
N.S.
0.200 0.004 3.681
100

Table E2. Analyses of the Incidence of Primary Tumors in Female Rats Administered Azobenzene in the Diet (a)
(continued)
Topography: MorphologyMatched
Control Low Dose
High Dose
Spleen: Fibrosarcoma (b) 0/20 (0) 1/50 (2) 7/50 (14)
P Values (c,d) P 0.012 N.S. N.S.
Relative Risk (f) Lower Limit Upper Limit
Infinite 0.022 Infinite
Infinite 0.809 Infinite
Weeks to First Observed Tumor 106 91
MD Spleen: Osteosarcoma (b) 0/20 (0) 1/50 (2) 5/50 (10)
P Values (c,d) P 0.041 N.S. N.S.
Relative Risk (f) Lower Limit Upper Limit
Infinite 0.022 Infinite
Infinite 0.525 Infinite
Weeks to First Observed Tumor 106 106
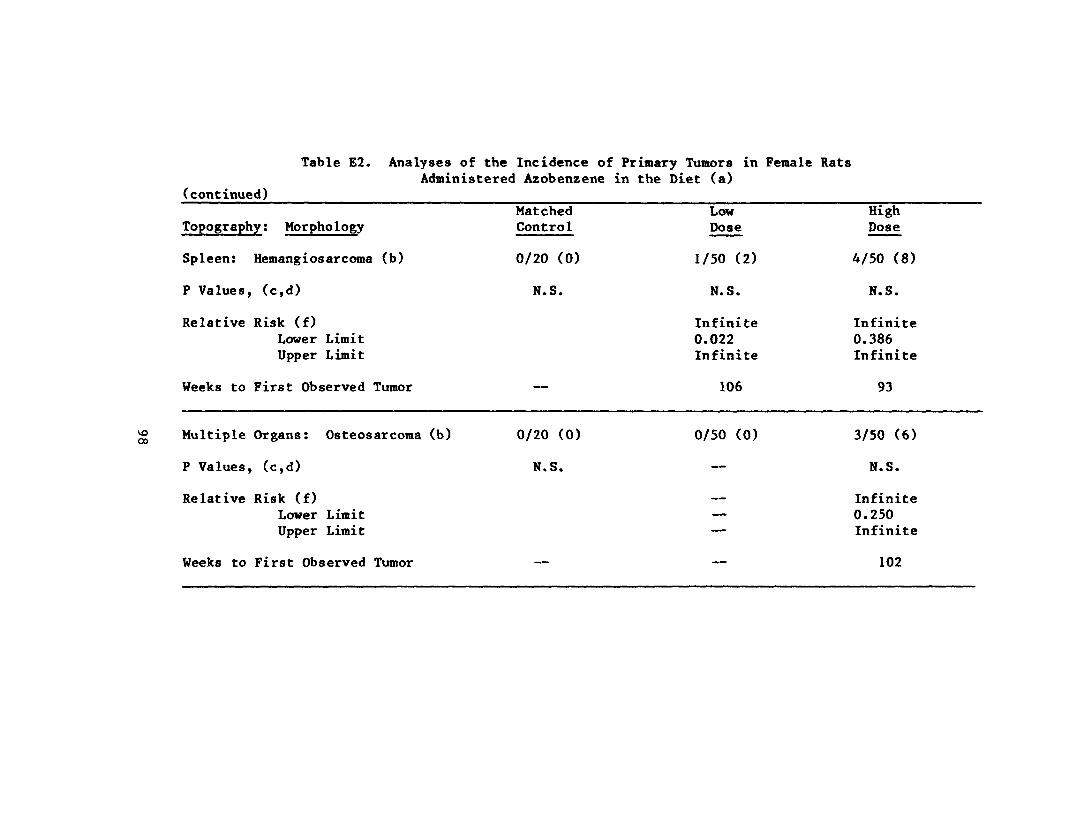
__
Table E2. Analyses of the Incidence of Primary Tumors in Female Rats Administered Azobenzene in the Diet (a)
(continued) Matched Low
Topography; Morphology Control Dose
Spleen: Hemangiosarcoma (b) 0/20 (0) 1/50 (2)
P Values, (c,d) N.S. N.S.
Relative Risk (f) Infinite Lower Limit 0.022 Upper Limit Infinite
Weeks to First Observed Tumor 106
Multiple Organs: Osteosarcoma (b) 0/20 (0) 0/50 (0) oo
P Values, (c,d) N.S. —
Relative Risk (f) Lower Limit Upper Limit —
—
Weeks to First Observed Tumor
High Dose
4/50 (8)
N.S.
Infinite 0.386 Infinite
93
3/50 (6)
N.S.
Infinite 0.250 Infinite
102
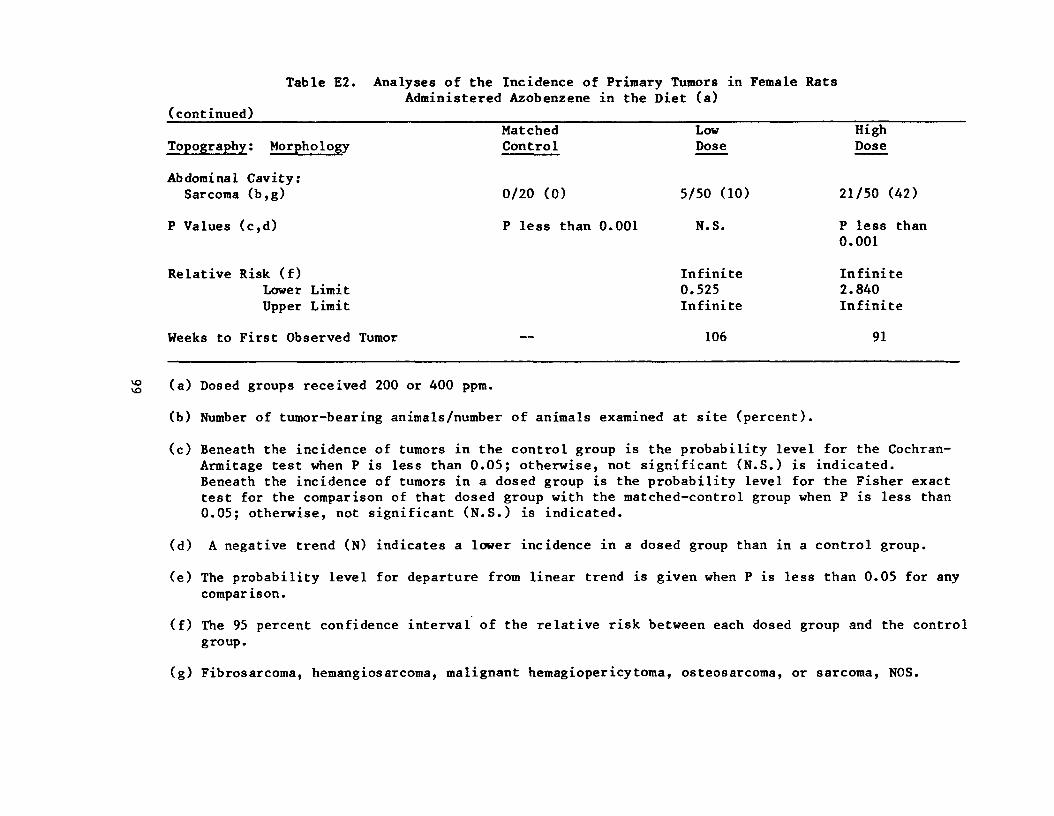
Table E2. Analyses of the Incidence of Primary Tumors in Female Rats Administered Azobenzene in the Diet (a)
(continued)
Topography ; Morphology MatchContr
edol Low Dose
High Dose
Abdominal Cavity: Sarcoma (b,g) 0/20 (0) 5/50 (10) 21/50 (42)
P Values (c,d) P less than 0.001 N.S. P less than 0.001
Relative Risk (f) Lower Limit Upper Limit
Infinite 0.525 Infinite
Infinite 2.840 Infinite
Weeks to First Observed Tumor 106 91
(a) Dosed groups received 200 or 400 ppm.
(b) Number of tumor-bearing animals/number of animals examined at site (percent).
(c) Beneath the incidence of tumors in the control group is the probability level for the Cochran-Armitage test when P is less than 0.05; otherwise, not significant (N.S.) is indicated. Beneath the incidence of tumors in a dosed group is the probability level for the Fisher exact test for the comparison of that dosed group with the matched-control group when P is less than 0.05; otherwise, not significant (N.S.) is indicated.
(d) A negative trend (N) indicates a lower incidence in a dosed group than in a control group.
(e) The probability level for departure from linear trend is given when P is less than 0.05 for any comparison.
(f) The 95 percent confidence interval of the relative risk between each dosed group and the control group.
(g) Fibrosarcoma, hemangiosarcoma, malignant hemagiopericytoma, osteosarcoma, or sarcoma, NOS.

100

APPENDIX F
ANALYSES OF THE INCIDENCE OF PRIMARY TUMORS
IN MICE ADMINISTERED AZOBENZENE IN THE DIET
101

102

Table Fl. Analyses of the Incidence of Primary Tumors in Male Mice
Topography: Morphology
Lung: Alveolar/Bronchiolar Carcinoma or Adenoma (b)
P Values (c,d)
Relative Risk (f) Lower Limit Upper Limit
Weeks to First Observed Tumor
Hematopoietic System: o CO Lymphoma (b)
P Values (c,d)
Relative Risk (f) Lower Limit Upper Limit
Weeks to First Observed Tumor
Administered Azobenzene in the Diet (a)
Matched Low High Control Dose Dose
2/20 (10) 4/49 (8) 1/47 (2)
N.S. N.S. N.S.
0.816 0.213 0.131 0.004 8.603 3.909
106 92 85
4/20 (20) 5/49 (10) 8/48 (17)
N. S. N.S. N.S.
0.510 0.833 0.126 0.261 2.367 3.459
106 92 105
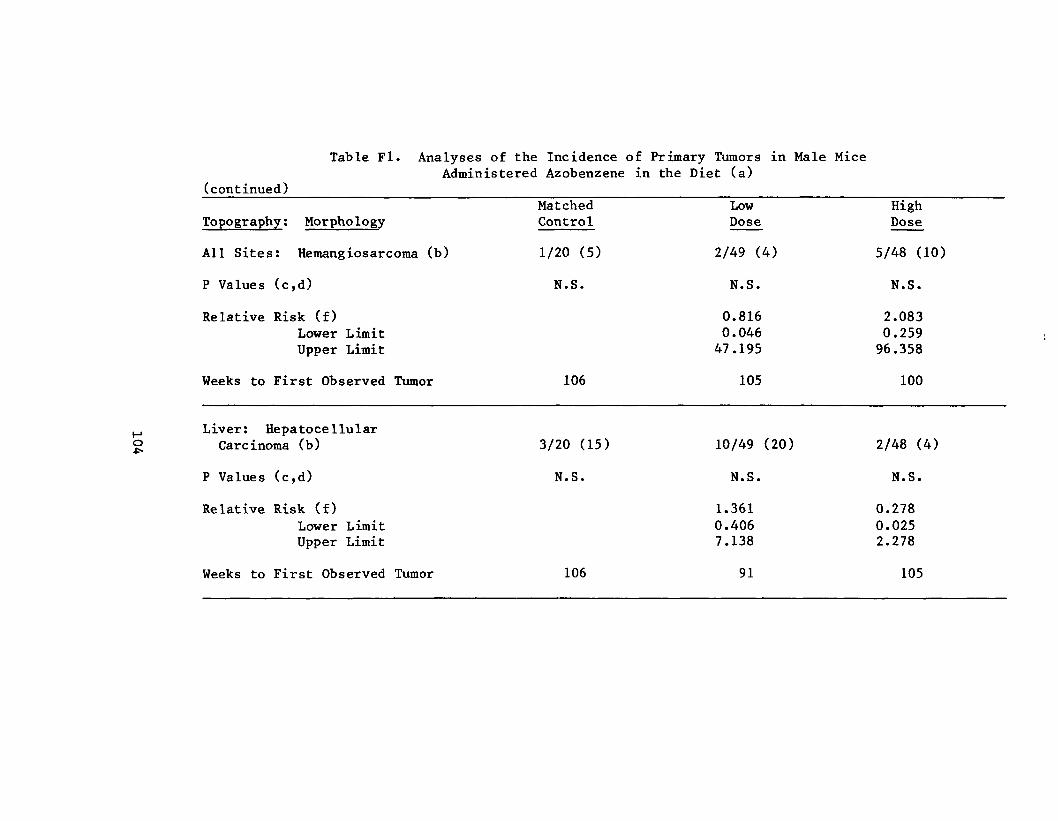
Table Fl. Analyses of the Incidence of Primary Tumors in Male Mice Administered Azobenzene in the Diet (a)
(continued)
Topography: Morphology
All Sites: Hemangiosarcoma (b)
P Values (c,d)
Relative Risk (f) Lower Limit Upper Limit
Weeks to First Observed Tumor
Liver: Hepatocellular Carcinoma (b)
P Values (c,d)
Relative Risk (f) Lower Limit Upper Limit
Weeks to First Observed Tumor
Matched Low High Control Dose Dose
1/20 (5) 2/49 (4) 5/48 (10)
N.S. N.S. N.S.
0.816 2.083 0.046 0.259 47.195 96.358
106 105 100
3/20 (15) 10/49 (20) 2/48 (4)
N.S. N.S. N.S.
1.361 0.278 0.406 0.025 7.138 2.278
106 91 105
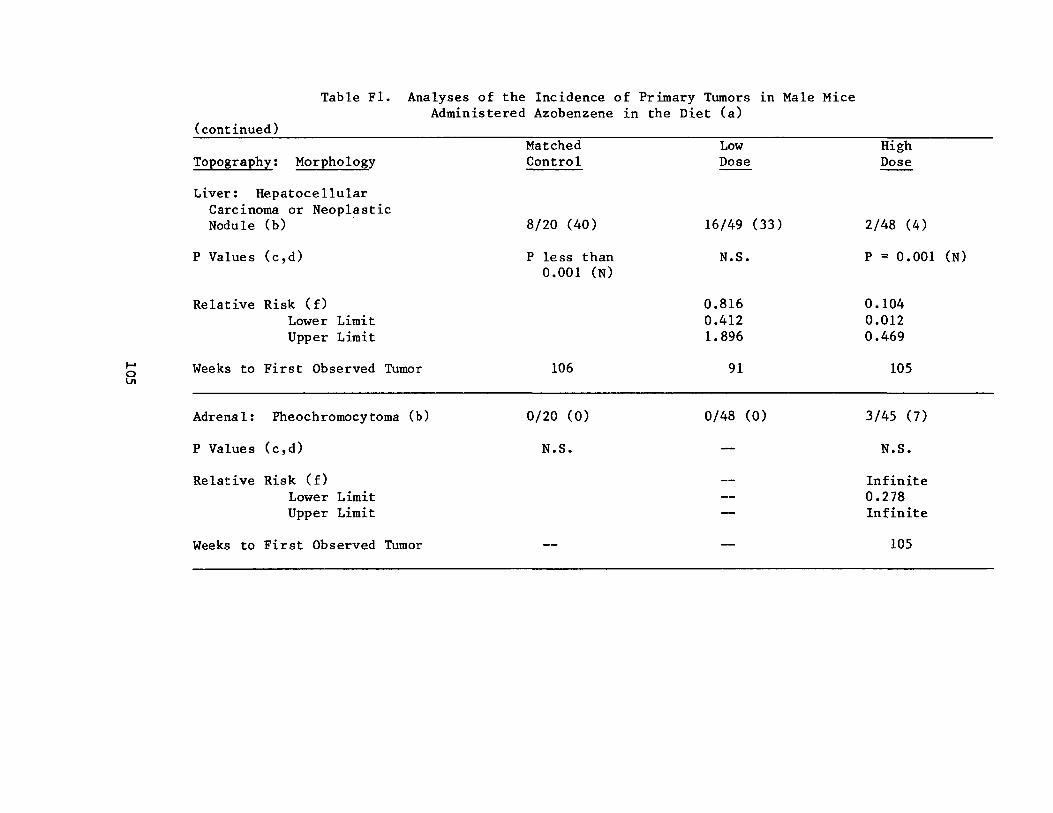
Table Fl. Analyses of the Incidence of Primary Tumors in Male Mice Administered Azobenzene in the Diet (a)
(continued)
Topography: Morphology
Liver: Hepatocellular Carcinoma or Neoplastic Nodule (b)
P Values (c,d)
Relative Risk (f) Lower Limit Upper Limit
Weeks to First Observed Tumor o Ln
Adrenal: Pheochromocytoma (b)
P Values (c,d)
Relative Risk (f) Lower Limit Upper Limit
Weeks to First Observed Tumor
Matched Control
8/20 (40)
P less than 0.001 (N)
106
0/20 (0)
N.S.
Low Dose
16/49 (33)
N.S.
0.816 0.412 1.896
91
0/48 (0)
—
— — —
High Dose
2/48 (4)
P = 0.001 (N)
0.104 0.012 0.469
105
3/45 (7)
N.S.
Infinite 0.278 Infinite
105
Table Fl. Analyses of the Incidence of Primary Tumors in Male Mice Administered Azobenzene in the Diet (a)
(continued)
(a) Dosed groups received 200 or 400 ppm.
(b) Number of tumor-bearing animals/number of animals examined at site (percent).
(c) Beneath the incidence of tumors in the control group is the probability level for the Cochran-Armitage test when P is less than 0.05; otherwise, not significant (N.S.) is indicated. Beneath the incidence of tumors in a dosed group is the probability level for the Fisher exact test for the comparison of that dosed group with the matched-control group when P is less than 0.05; otherwise, not significant (N.S.) is indicated.
(d) A negative trend (N) indicates a lower incidence in a dosed group than in a control group.
(e) The probability level for departure from linear trend is given when P is less than 0.05 for any comparison.
(-• (f) The 95 percent confidence interval of the relative risk between each dosed group and the control o\ group.

Table F2. Analyses of the Incidence of Primary Tumors in Female Mice Administered Azobenzene in the Diet (a)

Table F2. Analyses of the Incidence of Primary Tumors in Female Mice Administered Azobenzene in the Diet (a)
(continued) Matched Low
Topography: Morphology Control Dose
All Sites: Hemangiosarcoma (b) 0/20 (0) 4/47 (9)
P Values (c,d) N.S. N.S.
Relative Risk (f) Infinite Lower Limit 0.411 Upper Limit Infinite
Weeks to First Observed Tumor — 88
Pituitary: Adenoma, NOS (b) 2/19 (11) 1/42 (2)
P Values (c,d) N.S. N.S. o CO
Relative Risk (f) 0.226 Lower Limit 0.004 Upper Limit 4.137
Weeks to First Observed Tumor 106 106
High Dose
1/38 (3)
N.S.
Infinite 0.029 Infinite
0/30 (0)
N.S.
0.000 0.000 2.096
105
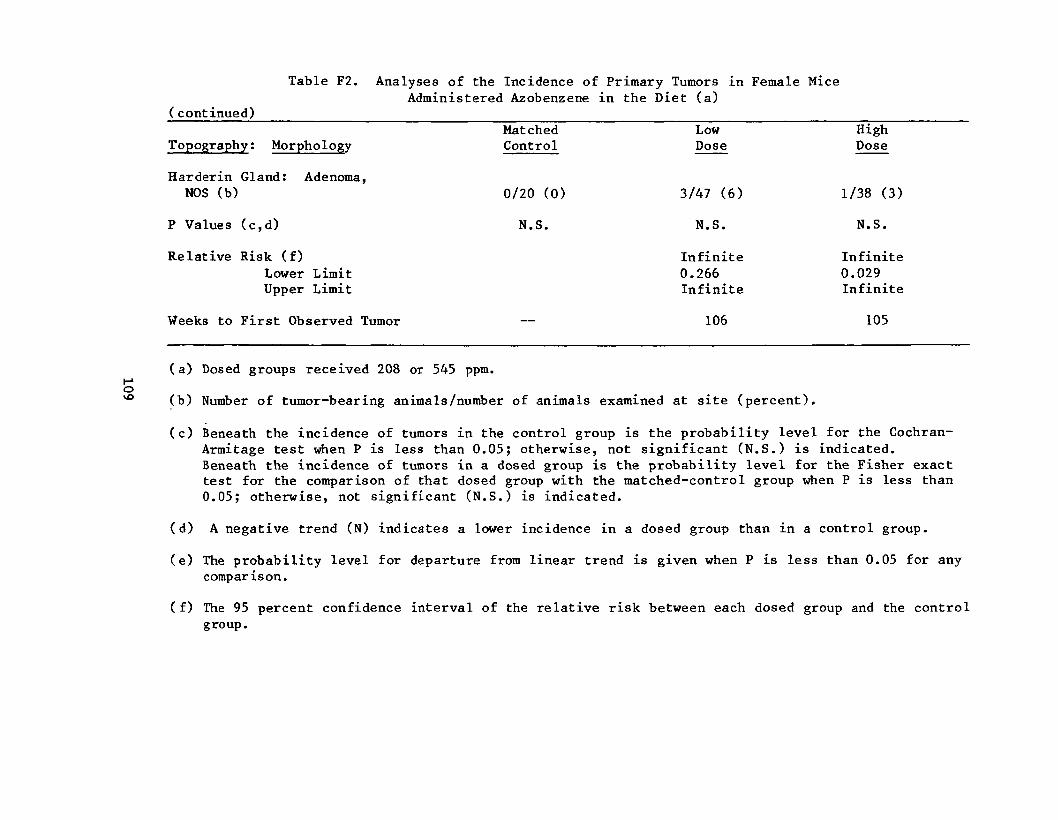
Table F2. Analyses of the Incidence of Primary Tumors in Female Mice Administered Azobenzene in the Diet (a)
(continued) Matched Low High
Topography ; Morphology Control Dose Dose
Harderin Gland: Adenoma, NOS (b) 0/20 (0) 3/47 (6) 1/38 (3)
P Values (c,d) N.S. N.S. N.S.
Relative Risk (f) Infinite Infinite Lower Limit 0.266 0.029 Upper Limit Infinite Infinite
Weeks to First Observed Tumor 106 105
(a) Dosed groups received 208 or 545 ppm.
o\o (b) Number of tumor-bearing animals/number of animals examined at site (percent).
(c) Beneath the incidence of tumors in the control group is the probability level for the Cochran-Armitage test when P is less than 0.05; otherwise, not significant (N.S.) is indicated. Beneath the incidence of tumors in a dosed group is the probability level for the Fisher exact test for the comparison of that dosed group with the matched-control group when P is less than 0.05; otherwise, not significant (N.S.) is indicated.
(d) A negative trend (N) indicates a lower incidence in a dosed group than in a control group.
(e) The probability level for departure from linear trend is given when P is less than 0.05 for any comparison.
( f) The 95 percent confidence interval of the relative risk between each dosed group and the control group.

110

Review of the Bioassay of Azobenzene* for Carcinogenicity by the Data EvaluationRisk Assessment Subgroup of the Clearinghouse on Environmental Carcinogens
December 13, 1978
The Clearinghouse on Environmental Carcinogens was established in May, 1976, in compliance with DREW Committee Regulations and the Provisions of the Federal Advisory Committee Act. The purpose of the Clearinghouse is to advise the Director of the National Cancer Institute on the Institute's bioassay program to identify and evaluate chemical carcinogens in the environment to which humans may be exposed. The members of the Clearinghouse have been drawn from academia, industry, organized labor, public interest groups, and State health officials. Members have been selected on the basis of their experience in carcinogenesis or related fields and, collectively, provide expertise in chemistry, biochemistry, biostatistics, toxicology, pathology, and epidemiology. Representatives of various Governmental agencies participate as ad hoc members. The Data Evaluation/Risk Assessment Subgroup of the Clearinghouse is charged with the responsibility of providing a peer review of reports prepared on NCI-sponsored bioassays of chemicals studied for carcinogenicity. It is in this context that the below critique is given on the bioassay of Azobenzene.
The primary reviewer for the report on the bioassay of Azobenzene agreed that the compound was carcinogenic in treated rats. After commenting on the conditions of test, he said that the bioassay was properly designed and conducted. Based on the results of the study, he concluded that Azobenzene may pose a carcinogenic risk to humans.
The secondary reviewer said that the study was straightforward and that she agreed with the conclusion in the report. It was moved that the report on the bioassay of Azobenzene be accepted as written. The motion was seconded and approved without objection.
Clearinghouse Members Present:
Arnold L. Brown (Chairman), University of Wisconsin Medical School Joseph Highland, Environmental Defense Fund William Lijinsky, Frederick Cancer Research Center Henry Pitot, University of Wisconsin Medical Center Verne A. Ray, Pfizer Medical Research Laboratory Verald K. Rowe, Dow Chemical USA Michael Shimkin, University of California at San Diego
111

Louise Strong, University of Texas Health Sciences Center Kenneth Wilcox, Michigan State Health Department
* Subsequent to this review, changes may have been made in the bioassay report either as a result of the review or other reasons. Thus, certain comments and criticisms reflected in the review may no longer be appropriate.
U.S. GOVERNMENT P R I N T I N G O F F I C E : 1 979-281-217/3032
112


DHEW Publication (NIH) No. 79-1710
Top Related