


Languages
Pages
Legal


Tougher ChoicesFacing Florida’s Future
Dr. Carol WeissertDirector, LeRoy Collins Institute
Professor of Political ScienceFlorida State University
May 20, 2014

2
Looking Behind and Ahead
• 1987 Zwick reportWhat Kind of Future do we want for
Florida?“fundamental changes are needed in the ways we finance government in Florida…”
3
• “We can no longer compete successfully by relying merely on cheap land, cheap labor, low taxes and plenty of sunshine.”– Sound physical infrastructure– Educated and motivated work force– Quality universities and research and
development institutions– Reasonable tax rates and prudent spending policy

4
• “Florida is a state with boundless economic potential…
• Also a state with jammed highways, polluted natural resources, struggling schools, poorly paid teachers, teeming jails, neglected children, needy senior citizens, inadequate health care, a shortage of affordable housing and a declining quality of life.”

5
• “Florida is a state on a collision course with painful realities that must be faced—now.”
6
7
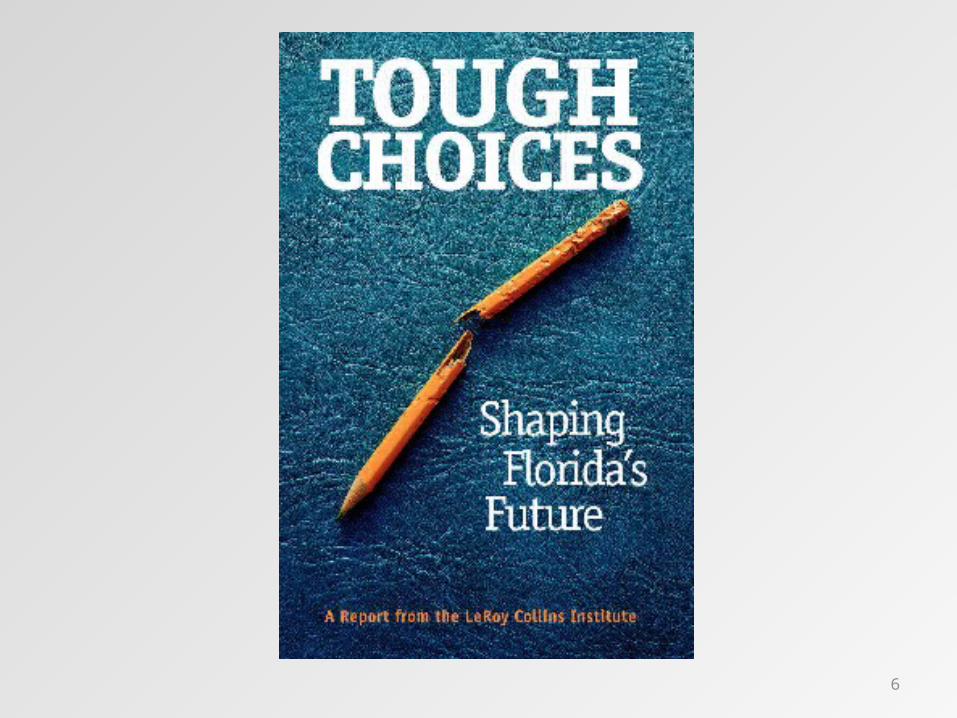
Tough Choices 2005• As noted in the Zwick report (1987), in the 1980s Florida
faced challenges and also opportunities• Promise of the 1980s slipping away by the 2000s
– Growing share of low-skill jobs – Lagging investment in education, Class Size Reduction
Amendment (CSRA), accountability sans funding– Infrastructure: low on major urban roads, effective public
transportation– Little willingness to raise taxes to alter these things
8
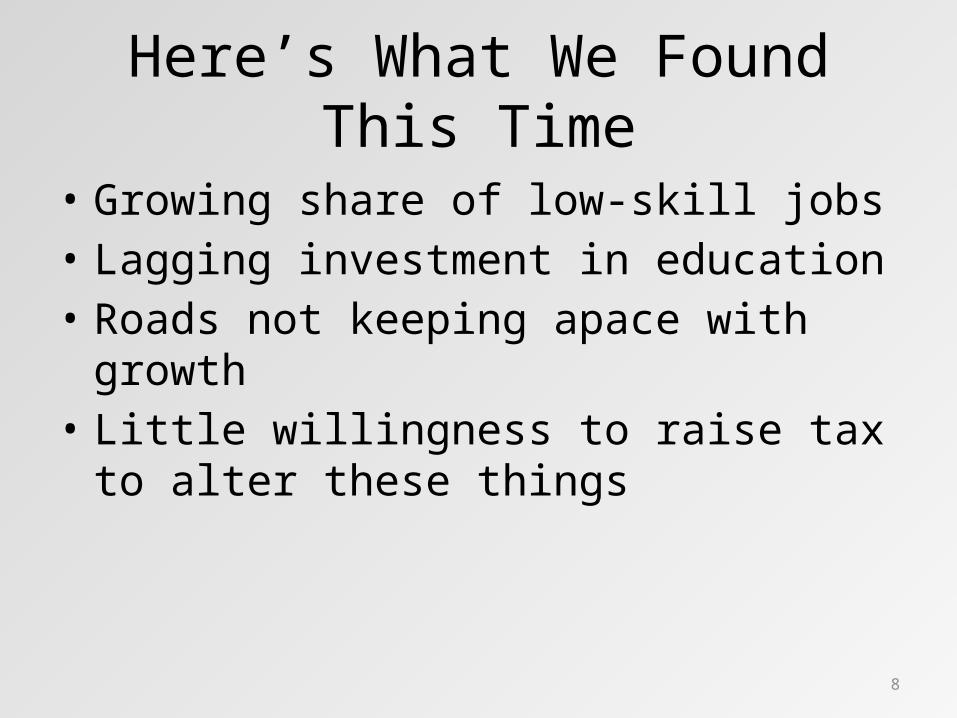
Here’s What We Found This Time
• Growing share of low-skill jobs• Lagging investment in education• Roads not keeping apace with growth• Little willingness to raise tax to alter these
things

9
In addition,
• Florida’s reliance on retirees and tourists comes at a price
• Education comparisons of younger generation in Florida are problematic
• Florida’s workforce is “hollowing out” • State lags nation and South in K-12 education;
higher education• Congestion grows and roads aren’t keeping up

10
• And then there’s Medicaid….
11
Tough Choices: Shaping Florida’s Future
• Bureau of Business and Economic Research– Jim Dewey and Dave Denslow

12
First, setting the stage

13
Data from the U.S. Bureau of Economic Analysis
Income peaks in 2005; Population Growth Continues
1930
1934
1938
1942
1946
1950
1954
1958
1962
1966
1970
1974
1978
1982
1986
1990
1994
1998
2002
2006
2010
75
80
85
90
95
100
105
1
2
3
4
5
6
7
Income per capita Population SharePe
r Cap
ita In
com
e (U
S =
100)
Popu
latio
n Sh
are
(% o
f US)

14
Data from the U.S. Bureau of Economic Analysis
Relative productivity down in the 1990s and 2000s
1991
1992
1993
1994
1995
1996
1997
1998
1999
2000
2001
2002
2003
2004
2005
2006
2007
2008
2009
2010
2011
87
88
89
90
91
92
93
94
95
Relative output per worker (US = 100)
Output Trend 1991-2000

15
Florida is Old, Getting Older
• 18% Floridians 65+ (14% nation)• By 2020 20% 65+• By 2030 24% 65+
– 62% of Florida’s children will be black or Hispanic– 29% of Florida’s senior will be black or Hispanic

16
Implications of Retirees
• Demand different set of services – Housing patterns– Labor Market– Politics

17
Manag
ers
Profes
sionals
Tech
nician
sSa
les
Office &
Admin
Producti
on, Craft
, and Rep
air
Operato
rs, Fa
bricato
rs, La
borers
Protec
tive Se
rvice
s
Food Prep
& Clea
ning
Personal
Care &
Servi
ces
0%
10%
20%
30%
40%
50%
60%
Figure 2.7: Florida Employment GROWTH,(2000-2010)

18
Going into the Knowledge Economy…Florida’s young workers are less educated!
25-34 35-44 45-64 65 plus
Florida Men 0.216 0.253 0.279 0.299
US Men 0.271 0.292 0.293 0.274
Florida Women 0.295 0.299 0.257 0.175
US Women 0.35 0.333 0.279 0.168
2%
7%
12%
17%
22%
27%
32%
College Graduates in Florida and the US in 2010by Age and Gender

19
Education Spending
1988
-198
9
1989
-199
0
1990
-199
1
1991
-199
2
1992
-199
3
1993
-199
4
1994
-199
5
1995
-199
6
1996
-199
7
1997
-199
8
1998
-199
9
1999
-200
0
2000
-200
1
2001
-200
2
2002
-200
3
2003
-200
4
2004
-200
5
2005
-200
6
2006
-200
7
2007
-200
8
2008
-200
9
2009
-201
0
6,000
7,000
8,000
9,000
10,000
11,000
12,000
Current Expenditure per Student ($2012)
Florida South US

20

21

22
Lagging Higher Ed Human Capital Investment
State appropriation recovered some in FY 2013, 2014
Per FTEState
Appropriationsper FTE
Net TuitionRevenueper FTE
Appropriationsplus Net Tuition
per FTE
2006-2007
2011-2012
2006-2007
2011-2012
2006-2007
2011-2012
US 7,667 5,905 4,395 5,189 12,026 11,094
Florida 8,147 4,832 2,301 2,905 10,448 7,737
FL/US 106% 82% 53% 56% 87% 70%
FL Rank 15 37 46 47 43 50
FL Percentile 58 22 16 13 8 0

23
1994
1995
1996
1997
1998
1999
2000
2001
2002
2003
2004
2005
2006
2007
2008
2009
2010
2011
100
110
120
130
140
150
160
170
Indices of Lane Miles and VMT, Florida and the US(1994 = 100)
LM-FL LM-US VMT-FL VMT-US

24
2008
-200
9
2009
-201
0
2010
-201
1
2011
-201
2
2012
-201
3
2013
-201
4$14
$16
$18
$20
$22
$24
Medicaid and Education Spending by Fiscal Year (Billions)
Medicaid Education

25

26
• Medicaid spending per enrollee less in Reform population than non-reform population.
• Reform counties had lower Per Member Per Month costs than non-reform counties.
Medicaid Reform?

27
Here’s What We Found
• Growing share of low-skill jobs• Lagging investment in education• Infrastructure needs growing• Some troubling demographic trends• Reliance on tourists and retirees

28
Record $100 Million in Funding for Florida Tourism

29
Legislative Update
$77.1 billion—largest in state history$500 million—tax cutsIncreased education funding by 2.6% --$575 million—but $400 from higher property taxesHigher ed--$200 million performance based fundingMedicaid--

30
Economy
• Economy is slowly recovering• Unemployment rate lower than nation• Jobs numbers are up

31
National Climate Assessment

32

33
• “No longer can Florida be a state that is cheap and proud of it. This seems unfortunate, if not silly, in a competitive, global economy that feeds on high-skilled jobs. Tougher choices remain ahead.”

34
What is the Solution?
• Floridians need to have open minds to guide some tough choices. They have the right to expect their elected officials—like the Floridians of earlier years—to lead the way. Failing to do so is simply choosing to accept a future far less bright than it could be.
35
What is the Solution?
• Floridians need to have open minds to guide some tough choices. They have the right to expect their elected officials—like the Floridians of earlier years—to lead the way. Failing to do so is simply choosing to accept a future far less bright than it could be.

36
More information?
http://www.Collinsinstitute. fsu.edu
Top Related