


Languages
Pages
Legal


Tokyo Cap and TradeTokyo Cap-and-TradeDriver for a Low Carbon City
Yuki Arata Bureau of Environment Tokyo Metropolitan Government
Tokyo Cap-and-Trade 1.Results 2.Outline 3.Challenges 4.Lessons
1. Remarkable results!2nd Year ReportpGreen Buildings Era in Tokyo
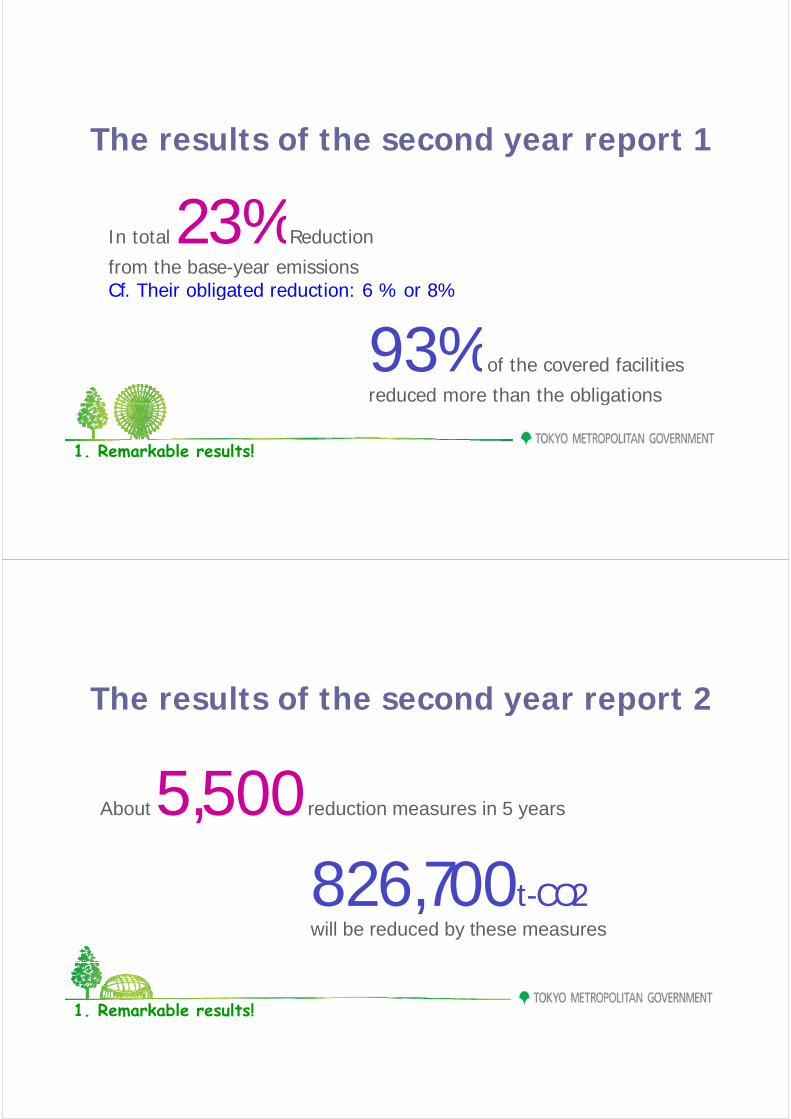
The results of the second year report 1y p
23%In total23%Reduction
from the base-year emissionsCf. Their obligated reduction: 6 % or 8%
93%93% of the covered facilities
reduced more than the obligations
1. Remarkable results!
g
The results of the second year report 2y p
5 500About5,500 reduction measures in 5 years
826,700t-CO2826,700t CO2will be reduced by these measures
1. Remarkable results!

Green Buildings Era in TokyoLow Emission Buildings TOP 30 in Tokyo
Existing Buildings Section
Low Emission Buildings TOP 30 in Tokyo
Existing Buildings SectionRetrofits
Sony CitySony Corporation T k Midt
Roppongi HillsMori Building Co., Ltd.
Sony Corporation Tokyo MidtownMitsui Fudosan Co., Ltd.East Japan Railway CompanyMitsubishi Estate Co., Ltd.1. Remarkable results!
New Building Section - Green Building Design
Low Emission Buildings TOP 30 in TokyoNew Building Section - Green Building Design
Techno-StationObayashi CorporationObayashi Corporation
JP TowerJ P t N t k C Ltd
New Headquarters Construction ProjectShimizu Corporation
Marunouchi Park BuildingMitsubishi Estate Co., Ltd.
Japan Post Network Co., Ltd.East Japan Railway Company
Mitsubishi Estate Co., Ltd.
1. Remarkable results!

Tokyo Cap-and-Trade 1.Results 2.Outline 3.Challenges 4.Lessons
2. Development & Outline ofTokyo’s Cap-and-Trade Program
Tokyo’s GHG Emission Reduction TargetGHG Emission Reduction Target
25% below 2000 levels by 2020

Tokyo Carbon Dioxide Footprinty pTotal CO2 Emissions: 59 million tonnes (FY2010)
Emissions Number of Facilities
Trans-portation 40%
Large CO2 emittingfacilities
Emissions Number of Facilities
1,400 facilities0 2%
Commercial &
IndustrialHouseholds
portation23%
40% facilities
S ll & di
=0.2%
More than
47%Households
28%60%
Small & medium CO2 emitting facilities
700,000 facilities=99.8%
2. Program Development & Outline
Program Developmentg p2002 2005 2010
Reporting program(CO2 Emission Reporting Program)
Mandatory reduction program:( 2 p g g )
*Not mandatory reduction program
Reduction target
reduction program:
TokyoCap and Trade Programg
averaged only 2%Cap-and-Trade Program
Accumulation of data helped to design a tailor-made C&T
2. Program Development & Outline
Accumulation of data helped to design a tailor made C&T
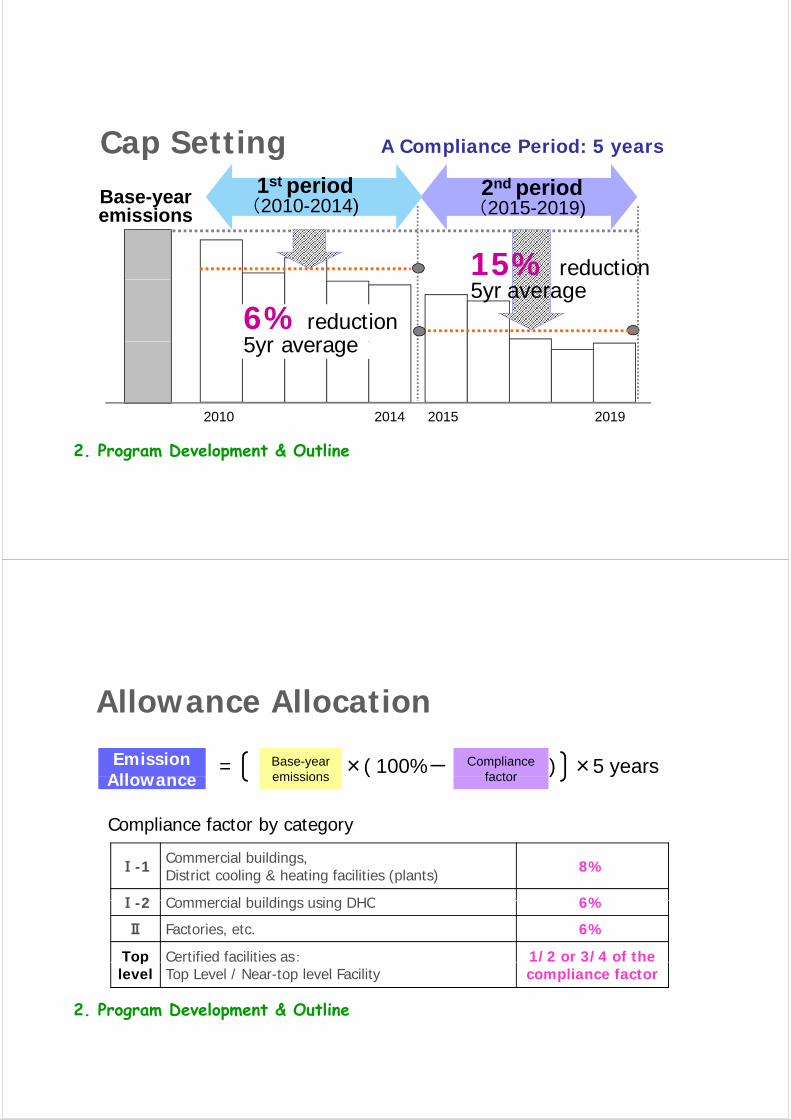
A Compliance Period: 5 yearsCap Setting
Base-year emissions
1st period(2010-2014)
2nd period(2015-2019)
p yp g
emissions )
15% reduction
6% reduction5yr average
5yr average
5yr average
2010 2014 2015 2019
2. Program Development & Outline
Allowance Allocation
Emission Allowance
Base-year emissions
= ×( 100%- ) ×5 yearsCompliance factorAllowance emissions
( ) yfactor
Compliance factor by category
Ⅰ-1Commercial buildings, District cooling & heating facilities (plants) 8%
Ⅰ 2 Commercial buildings using DHC 6%Ⅰ-2 Commercial buildings using DHC 6%
Ⅱ Factories, etc. 6%
Top Certified facilities as: 1/2 or 3/4 of the
2. Program Development & Outline
plevel Top Level / Near-top level Facility
/ /compliance factor

Tokyo Cap-and-Trade 1.Results 2.Outline 3.Challenges 4.Lessons
3. ChallengesStakeholder EngagementStakeholder Engagement
2013 ICAP Training Course @Beijing
Stakeholder Meetingsg
Associate Participants:pBusiness GroupsCompanies with interestsEnvironmental NGOs
Open to the public
Tokyo Metropolitan Government
Open to the public About 200 audience members every time
3. Challenges
2013 ICAP Training Course @Beijing
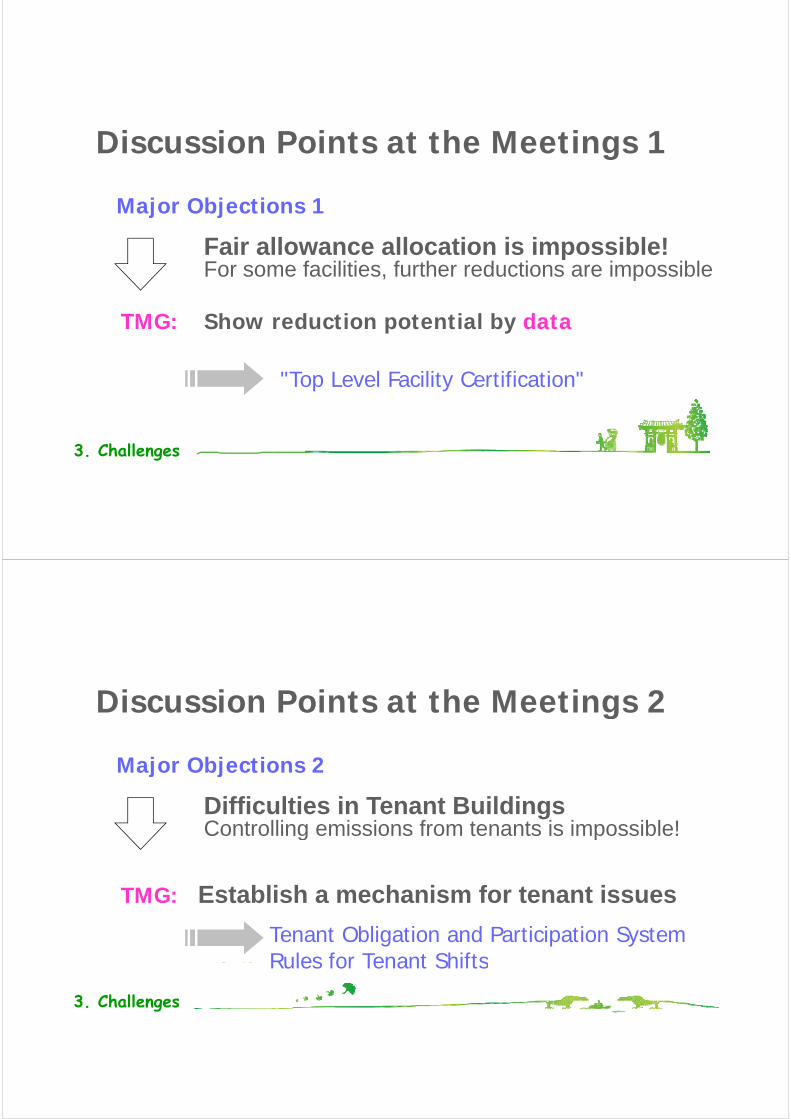
Discussion Points at the Meetings 1g
Major Objections 1j j
Fair allowance allocation is impossible!For some facilities, further reductions are impossible, p
TMG: Show reduction potential by data
"Top Level Facility Certification"
3. Challenges
Discussion Points at the Meetings 2g
Major Objections 2j j
Difficulties in Tenant BuildingsControlling emissions from tenants is impossible!g p
TMG: Establish a mechanism for tenant issues
Tenant Obligation and Participation SystemRules for Tenant Shifts
TMG: Establish a mechanism for tenant issues
3. Challenges
Rules for Tenant Shifts

Tokyo Cap-and-Trade 1.Results 2.Outline 3.Challenges 4.Lessons
4. What we learned: Important factorsThree misunderstandings for energy efficiencyThree misunderstandings for energy efficiencyKey factors for success
Need to break misunderstandings b ildi ffi ion building energy efficiency
Typical complaints from building owners
1. We have already done a lot!
Typical complaints from building owners
2. We know our buildings well; there’s nothing else we can do!
3. It’s costly to retrofit. We can not afford it!y
4. Lessons
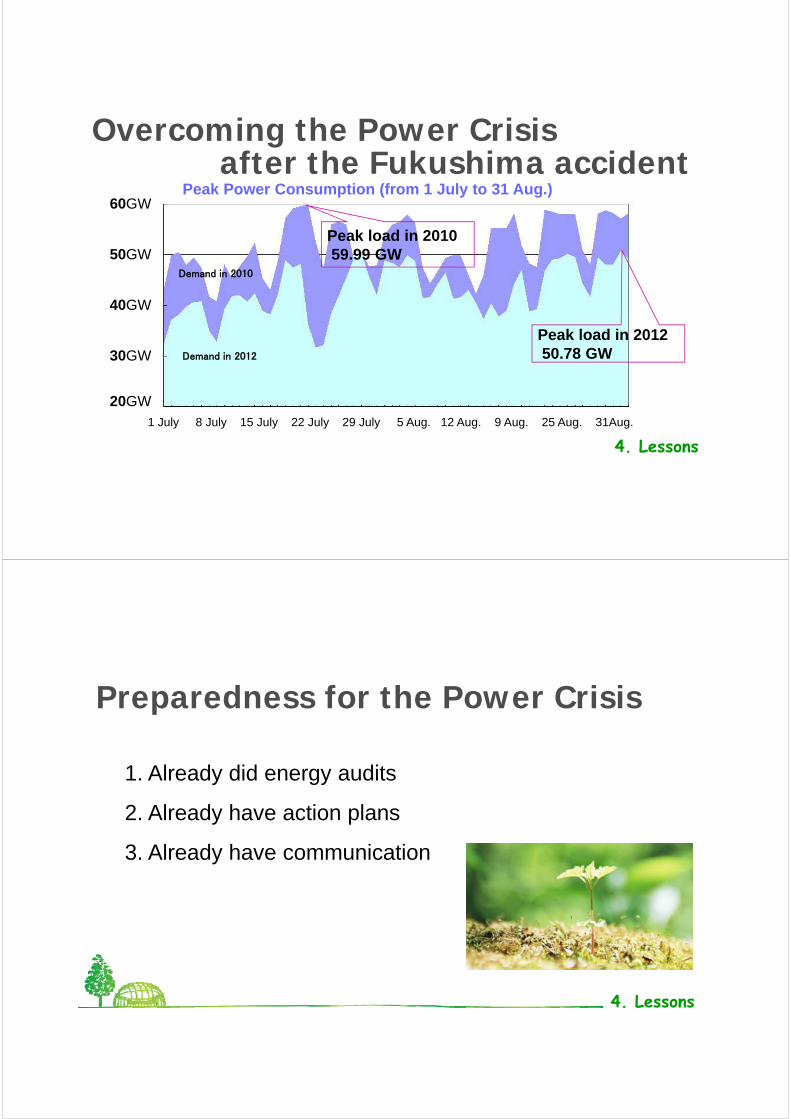
ft th F k hi id tOvercoming the Power Crisis
after the Fukushima accident60GW
Peak Power Consumption (from 1 July to 31 Aug.)
Demand in 2010
Peak load in 201059.99 GW 50GW
Peak load in 2012
40GW
Demand in 2012 50.78 GW30GW
20GW1 July 8 July 15 July 22 July 29 July 5 Aug. 12 Aug. 9 Aug. 25 Aug. 31Aug.
20GW
4. Lessons
Preparedness for the Power Crisis
1 Already did energy audits1. Already did energy audits
2. Already have action plans
3. Already have communication
4. Lessons

The Importance of Cities’ Role
Th k !Thank you!
TMG W b itTMG Websitewww.kankyo.metro.tokyo.jp/eng
www.facebook.com/Environment.TMG
Top Related