


Languages
Pages
Legal

To tweet or not to tweet? That is only the first question
Caroline Muglia, Ben Lea, & John McDonald | USC Libraries Charleston Library Conference | November 6, 2015
What we’ll discuss...
Overview of Altmetrics at USC
Case Study using Plum Analytics platform
Correlations of data set
Why should we care about altmetrics?
Because other people said so...
Because money may be involved...
Because it’s where we’re headed…
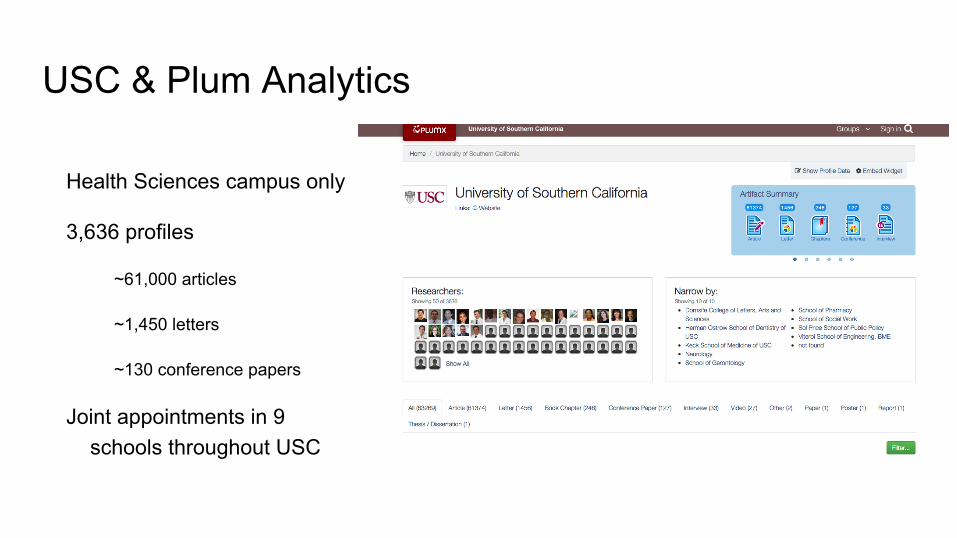
USC & Plum Analytics
Health Sciences campus only
3,636 profiles
~61,000 articles
~1,450 letters
~130 conference papers
Joint appointments in 9 schools throughout USC
Working with Plum
Medical journals where USC scholars published
Pulled USC data, sent it to Plum who loaded data, then fed it back to us
Started with cited reference patterns, but expanded to altmetrics components because we had a lot of questions!
Where do we go from here?
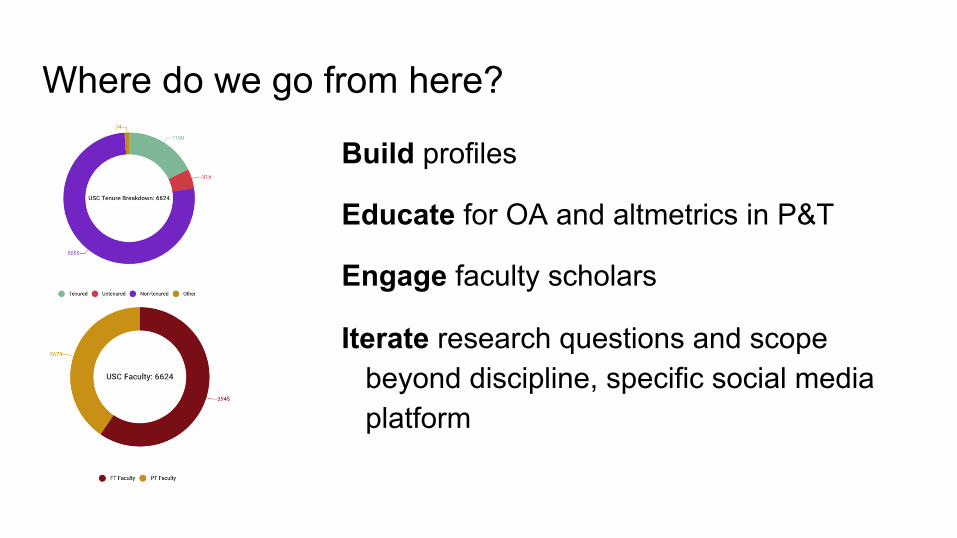
Build profiles
Educate for OA and altmetrics in P&T
Engage faculty scholars
Iterate research questions and scope beyond discipline, specific social media platform

Case Study: Twitter & Medical Journals
Research Parameters
It seems intuitive that scholarly communication happens in non-scholarly formats, particularly social media. But with the availability of altmetric data, we can test that theory.
In that context, we ask whether Twitter (serving here as a stand-in for all social
media) exposure leads to an increase in citations to scholarly literature.
We examined approximately 1,000 articles, written by Keck Medical School authors from 2010-2014. About 150 of those had been tweeted about; the others represent our control group.
Where could impact be measured?
We theorize that, if Twitter has an effect on scholarly communication, the timing of citations would deviate from the norm. As a general rule, an article gets 25% of its total citations in the 2nd year after publication, and another 25% in the 3rd year. Years 1 and 4 get around 20% each, with a scant few appearing in the year of publication; the remaining 10% forms the long tail. So, a significant deviation pattern in the citation curve when an article is tweeted about lends credence to that theory.

Standard citation curve
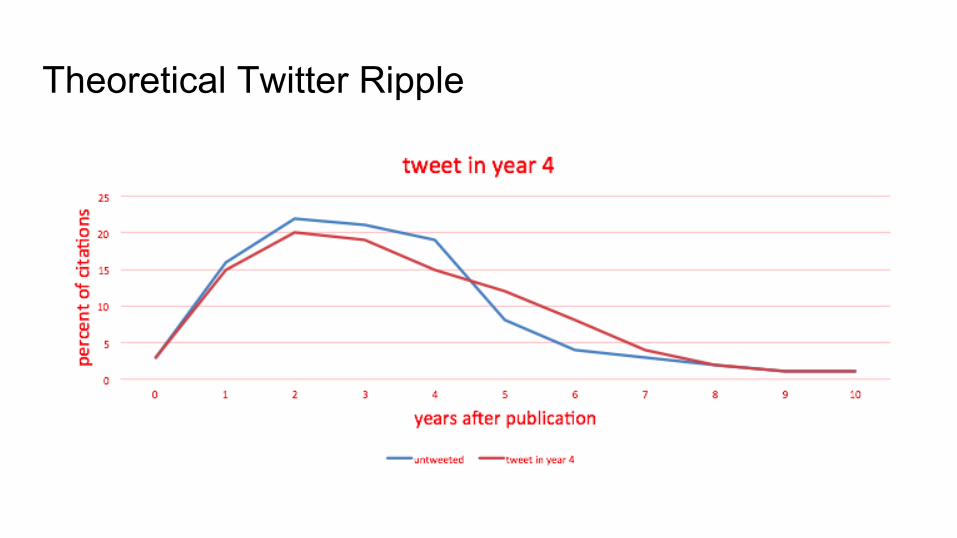
Theoretical Twitter Ripple
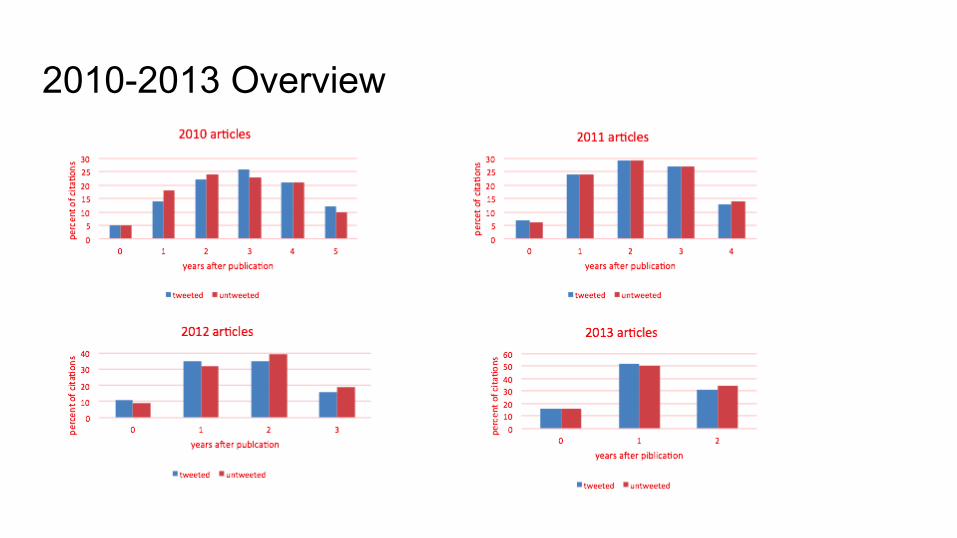
2010-2013 Overview
The tweets themselves
Timing of the tweets: the Twitter Ripple Theory presupposes that there were
post-publication tweets, but without seeing the tweets, we can’t know for sure.
Quality of the tweets: is there a qualitative aspect? Do favorable tweets drive citations? Or is any tweet that drives readers to the article helpful (i.e., there’s no such thing as bad publicity)?
What did we find?
Articles published in more prestigious journals (as measured by SJR – SCImago Journal Rank) got more citations. But, there was a measurable difference in the citation totals, depending on whether or not an article had been tweeted about.
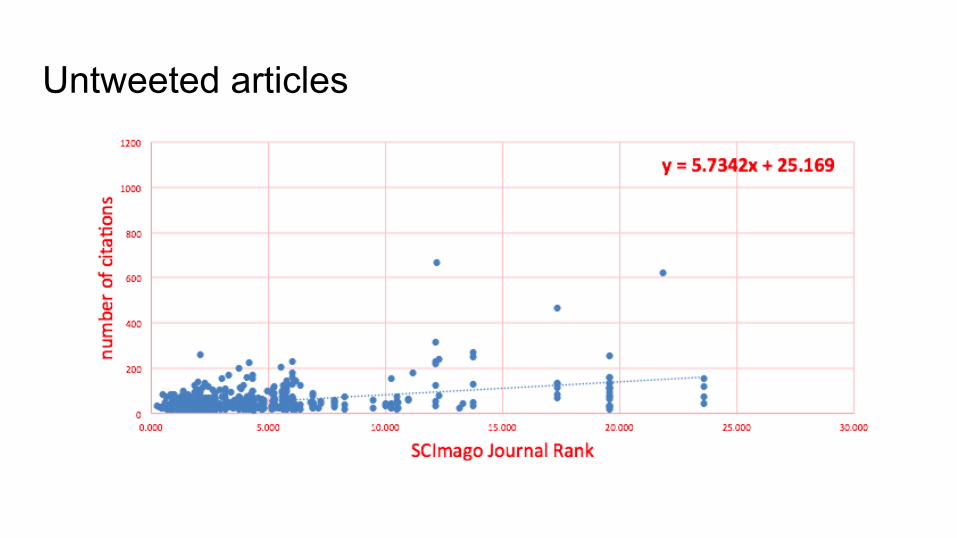
Untweeted articles
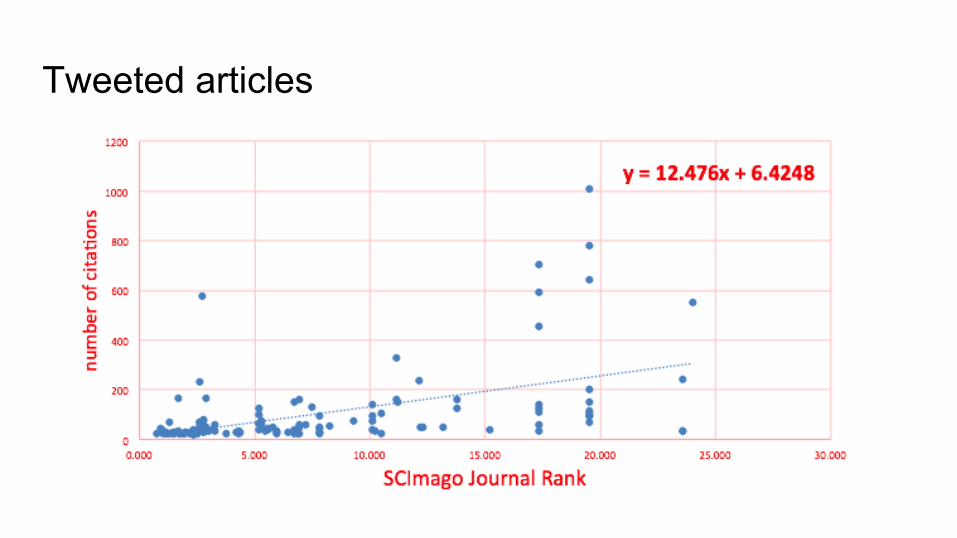
Tweeted articles
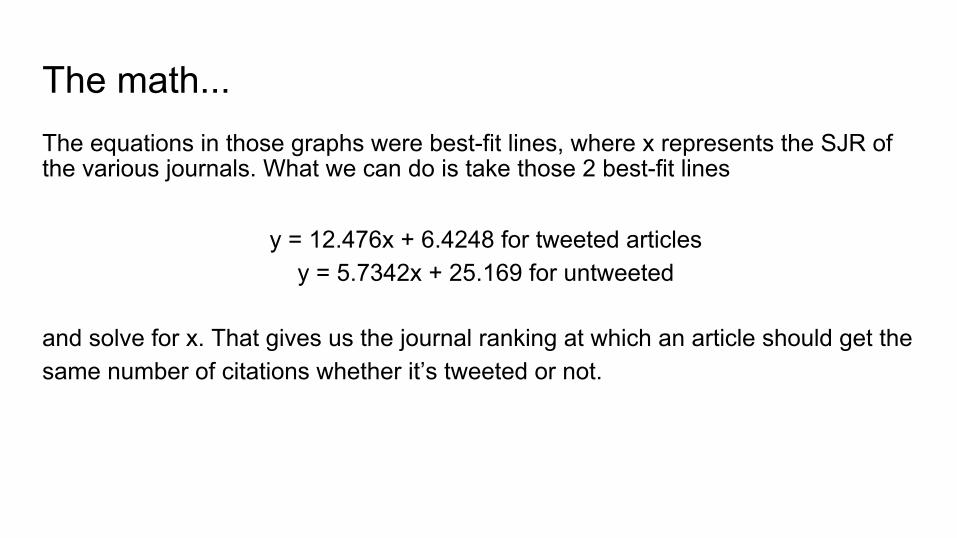
The equations in those graphs were best-fit lines, where x represents the SJR of the various journals. What we can do is take those 2 best-fit lines
y = 12.476x + 6.4248 for tweeted articles y = 5.7342x + 25.169 for untweeted
and solve for x. That gives us the journal ranking at which an article should get the same number of citations whether it’s tweeted or not.
The math...
The Twitter Threshold
That solution yields an SJR of 2.78, what we call the “Twitter Threshold.” In the case of medical journals, this is the top 2% (approximately 150 out of 6,450) journals in that category.
Now, the counter-intuitive stuff
Even one tweet about an article in a highly prestigious journal can double the number of citations that article receives. Conversely, a tweet about an article in a low-prestige journal can serve to diminish the number of citations; however … Above one, the number of tweets correlates negatively with the number of citations. That suggests that every tweet after the first one serves to lower the number of citations.
Image rights owned by Twitter & Craigslist respectively
What’s next?
Does the Twitter Threshold apply across fields? (SJR, top # of journals
in category, or top % of journals?)
If Twitter generates buzz, what impact, if any, does that have on the author(s)? (Increased citations to other articles by authors? Increased grant funding?)
Correlations
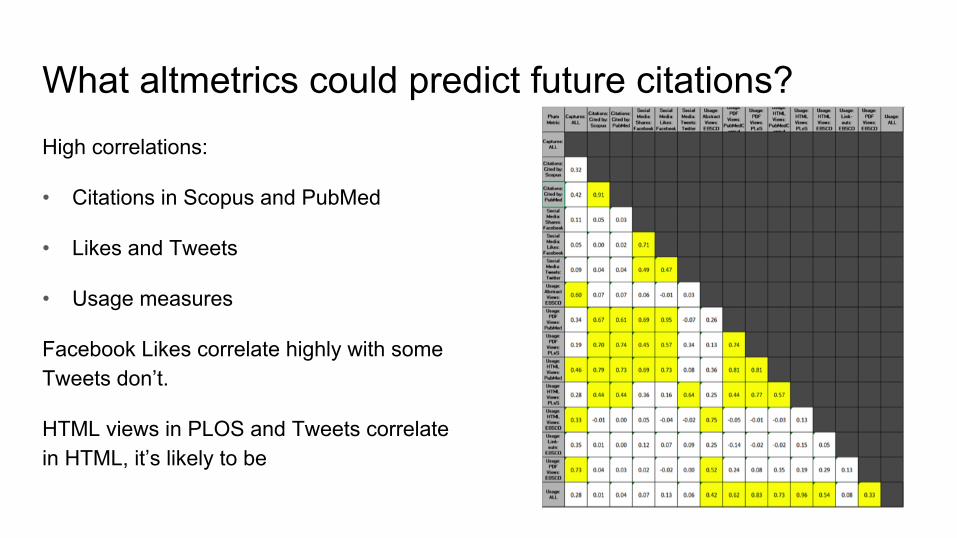
What altmetrics could predict future citations? High correlations:
• Citations in Scopus and PubMed
• Likes and Tweets
• Usage measures
Facebook Likes correlate highly with some usage, but Tweets don’t.
HTML views in PLOS and Tweets correlate highly, so if it’s in HTML, it’s likely to be tweeted
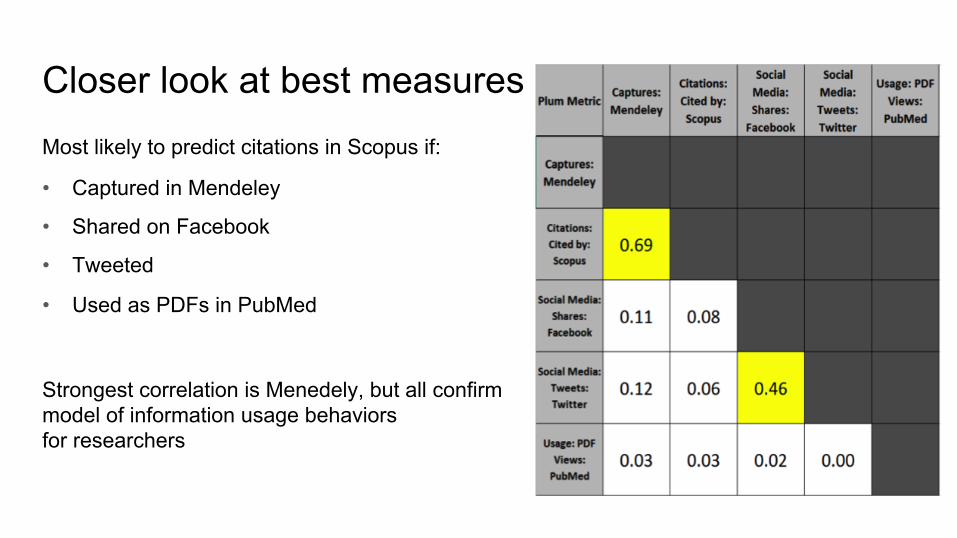
Closer look at best measures Most likely to predict citations in Scopus if:
• Captured in Mendeley
• Shared on Facebook
• Tweeted
• Used as PDFs in PubMed
Strongest correlation is Menedely, but all confirm model of information usage behaviors for researchers
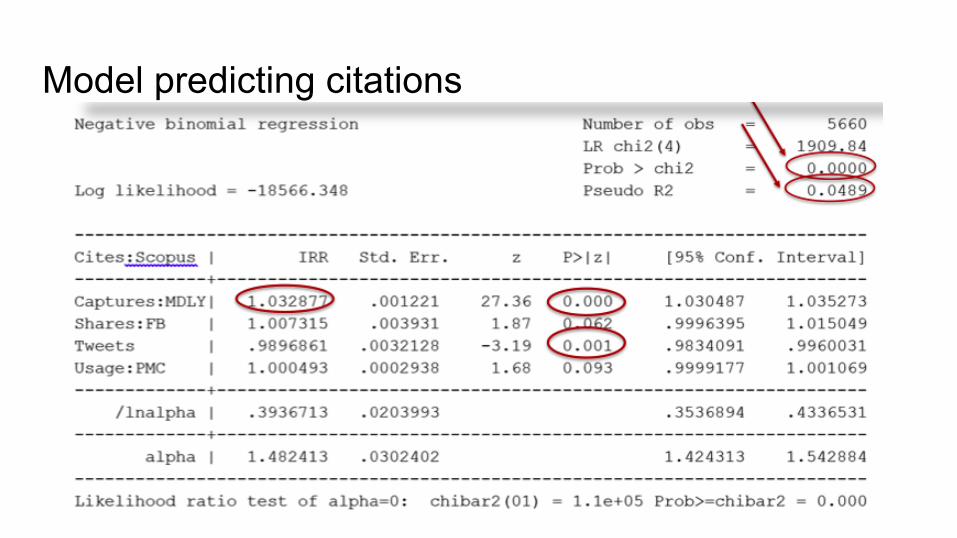
Model predicting citations
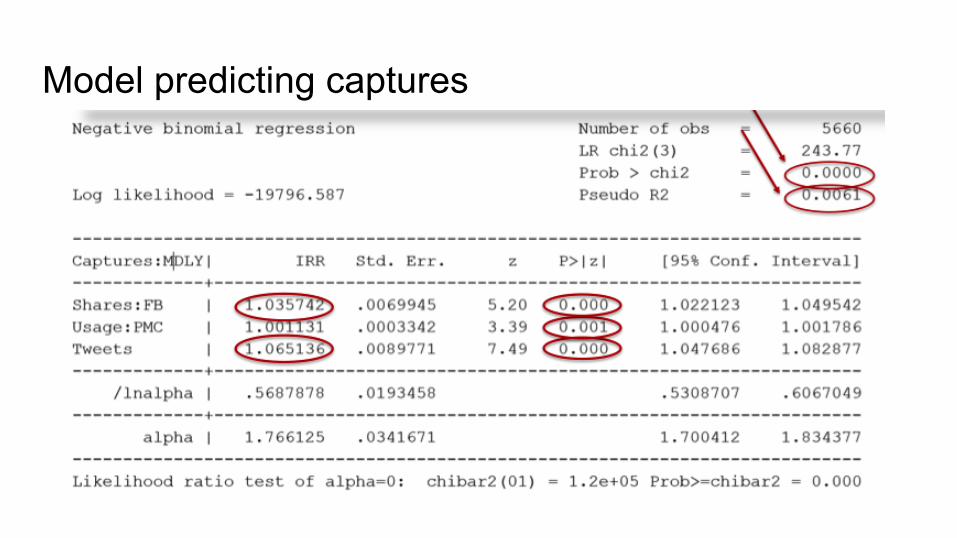
Model predicting captures
Regression results
Alike metrics correlate highly: Citations in Scopus & PubMed, Usage measures with each other, Social Media metrics
Only Captures in Mendeley predict citations for this dataset
One unit increase in captures = 3.3% increase in Citations in Scopus
Social Media, both Facebook Shares and Tweets predict Captures in Mendeley
Increases of 3.6% and 6.5% respectively

Thanks!
Ben Lea, Science & Engineering Librarian, [email protected]
John McDonald, Associate Dean for Collections, [email protected]
Caroline Muglia, Collection Assessment Librarian, [email protected]
Top Related