


Languages
Pages
Legal


Ageing Transition in Myanmar
The analysis and preparation of this report was achieved through the joint efforts of:
Daw Khaing Khaing Soe (Deputy Director)
Daw Sandar Myint (Assistant Director)
Daw Khin Myo Khine (Staff Officer)
Daw Aye Thein (Staff Officer)
Daw Khin Moe Moe Khine Htwe (Assistant Immigration Officer)

| Contents i
Contents
Contents ............................................................................................................................................. i
List of Tables .................................................................................................................................... iii
List of Figures .................................................................................................................................... v
Executive Summary .......................................................................................................................... vi
Chapter I ............................................................................................................................................ 9
Introduction ...................................................................................................................................... 9
1.1 The concept of an ageing population ................................................................................ 9
1.2 Population ageing in the world ........................................................................................ 10
1.3 The elderly in the Myanmar context ................................................................................ 11
1.4 The need to study population ageing in Myanmar .......................................................... 12
1.5 Objectives ......................................................................................................................... 13
1.6 Methodology .................................................................................................................... 14
1.7 Definitions ........................................................................................................................ 14
Chapter II ......................................................................................................................................... 16
Overview of Population Ageing in Myanmar .................................................................................. 16
2.1 Trends in population ageing ............................................................................................. 16
2.2 Sex ratio of the elderly ..................................................................................................... 19
2.3 Determinants of population ageing ................................................................................. 20
2.4 Demographic impact of population ageing ...................................................................... 22
2.5 Demographic profile of the elderly population ............................................................... 26
Socio-economic Characteristics of the Elderly ............................................................................... 32
3.1 Marital status ................................................................................................................... 32
3.2 Education .......................................................................................................................... 35
3.3 Active ageing and the employment of older persons ...................................................... 37
Chapter IV ....................................................................................................................................... 48
Changing Family Structures and Living Arrangements ................................................................... 48
4.1 Changes in family structure.............................................................................................. 48
4.2 Living arrangements of the elderly .................................................................................. 53
Chapter V ........................................................................................................................................ 60
Policies, Programmes, and Care for the Elderly Population ........................................................... 60

ii Contents |
5.1 Government policies and programmes............................................................................ 60
5.2 Care for the elderly .......................................................................................................... 62
5.3 Health care and services for the elderly .......................................................................... 63
Chapter VI ....................................................................................................................................... 66
Conclusion and Recommendations ................................................................................................ 66
6.1 Conclusion ........................................................................................................................ 66
6.2 Policy recommendations .................................................................................................. 67

| List of Tables iii
List of Tables
Page no.
Table 2.1 Per cent distribution of the ageing population (1973-2007) 17
Table 2.2 Sex ratio of the elderly population by age group and residence 20
(1973-2007)
Table 2.3 Demographic indicators of Myanmar 1973 – 2007 22
Table 2.4 Values for the index of ageing from censuses and surveys 23
Table 2.5 Ageing index in ASEAN countries 23
Table 2.6 Comparison of elderly dependency ratios from censuses and surveys 25
Table 2.7 Potential support ratio and parent support ratio 26
Table 2.8 Percentage of aged 80+ in population aged 60+ 27
Table 2.9 Percentage of females in elderly 60+ and 80+ 28
Table 2.10 Geographic distribution of population by age, sex, residence 29
and domain
Table 2.11 Proportion of the population who are elderly (2005-2050) 31
Table 3.1 Per cent distribution of marital status of the elderly by age,
sex and place of residence 34
Table 3.2 Per cent distribution of highest level of education attained
by age, sex and place of residence 36
Table 3.3 Economic activity rates of the elderly by age, sex and residence 40
Table 3.4 Per cent distribution of employment status of the employed
elderly population by age, sex and place of residence 42
Table 3.5 Per cent distribution of current occupation of employed elderly
population by age, sex and place of residence 44
Table 3.6 Per cent distribution for reasons for not working of the elderly
by age, sex and place of residence 46
Table 4.1 Per cent distribution of the relationship to head of household
and size of the household of persons aged 60 and above by sex 49
Table 4.2 Per cent distribution of marital status of the elderly household
heads by sex and place of residence 50
iv List of Tables |
Table 4.3 Per cent distribution of households headed by elderly men
compared to elderly women (ever and never married) by size of
household and place of residence 51
Table 4.4 Proportion of never married by age, sex, and residence 1973-2007 53
Table 4.5 Per cent distribution of living arrangements of the elderly by
selected characteristics 56
Table 4.6 Percentage of elderly people co-residing with at least one child age
0-4 or 5-9 years old 57
Table 4.7 Per cent distribution of housing characteristic and household facilities
by broad age group and place of residence 58
| List of Figures v
List of Figures
Page no.
Figure 2.1 Per cent of elderly by sex, 1973-2007 17
Figure 2.2 Sex ratio of elderly population (60+) and (80+) 19
Figure 2.3 Age distribution of Myanmar Population (1973-2007) 21
Figure 2.4a Elderly dependency ratio (urban) 25
Figure 2.4b Elderly dependency ratio (rural) 25
Figure 2.5 Young children and elderly as percentage of total population 30
Figure 3.1a Marital status of elderly (60+) in 2007 33
Figure 3.1b Marital status of elderly (80+) in 2007 33
Figure 3.2 Literacy rate for the elderly 35
Figure 3.3 Economic activity rates of the elderly by sex and residence, 2007 FRHS 38

vi Executive Summary |
Executive Summary
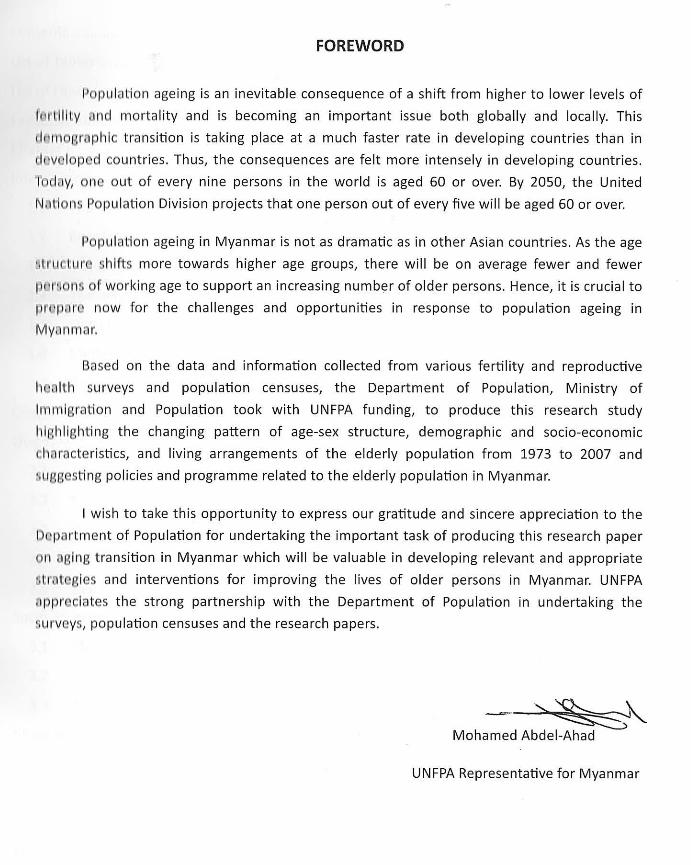
Population ageing is an inevitable consequence of a shift from higher to lower levels of
fertility and mortality and is one of the most significant demographic changes of modern times,
becoming an important issue both globally and locally. This demographic transition is taking
place at a much faster rate in developing countries than in developed countries. Thus, the
consequences are felt more intensely in developing countries. Today, one out of every nine
persons in the world is aged 60 or over. By 2050, the United Nations Population Division projects
that one person out of every five will be aged 60 or over.
Population ageing in Myanmar is not as dramatic as in other Asian countries. The pace of
ageing in Myanmar has, however, been increasing. In 1973 the proportion of the population that
was aged 60 and above was slightly over 6 per cent, but has increased to 8.7 per cent in 2007.
As the age structure shifts more towards higher age groups, there will be on average fewer and
fewer persons of working age to support an increasing number of older persons. Hence, it is
crucial to prepare now for the challenges and opportunities in response to population ageing.
To understand the scope of the situation, this paper highlights the changing pattern of
age-sex structure, characteristics, and living arrangements of the elderly population in the Union
of Myanmar from 1973 to 2007.
The objectives of this paper are:
(1) To study the trends of population ageing in Myanmar during 1973-2007
(2) To explore the demographic and socio-economic characteristics of the elderly
population
(3) To analyse the living arrangements of the elderly population
(4) To provide insights into ageing for policies and programmes related to the elderly
population in Myanmar.
An analysis shows that there has been a significant shift in the age structure of
Myanmar’s population as a result of sustained declines in fertility and mortality during the last
three decades. Myanmar faces a steadily-growing population of older persons. The population
of young, aged under 15 years, has declined 41.5 per cent in 1973 to 28.3 per cent in 2007. This
| Executive Summary vii
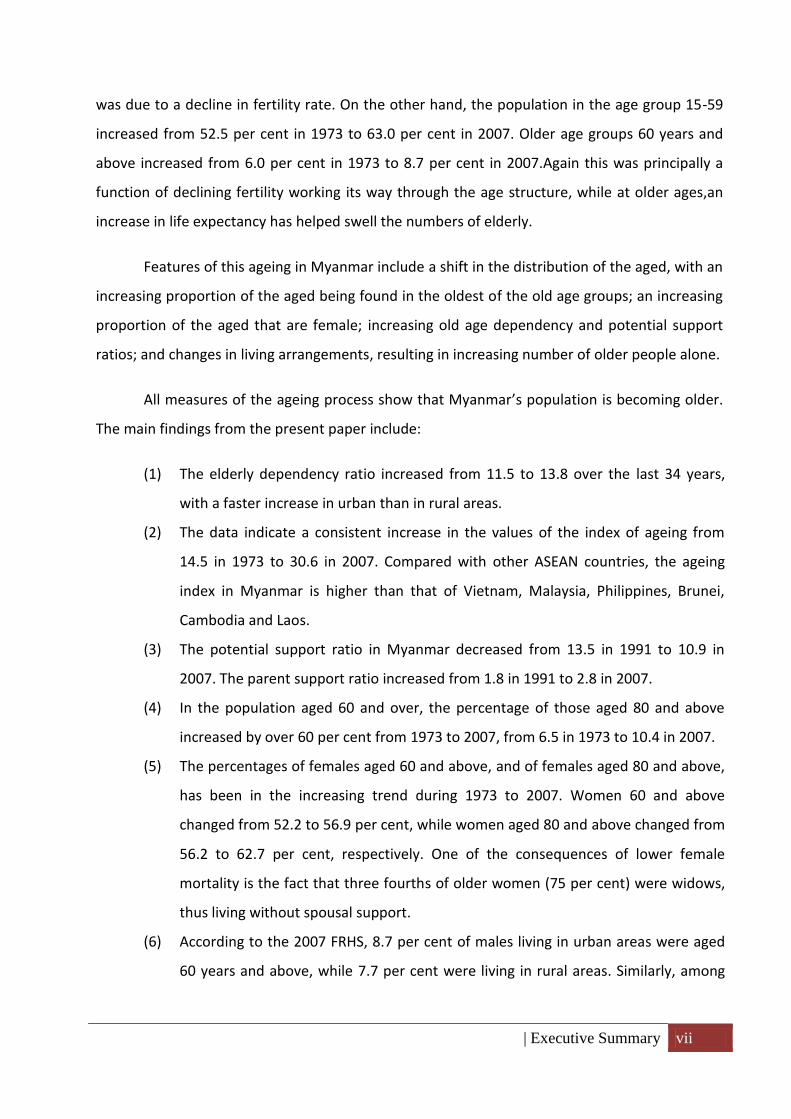
was due to a decline in fertility rate. On the other hand, the population in the age group 15-59
increased from 52.5 per cent in 1973 to 63.0 per cent in 2007. Older age groups 60 years and
above increased from 6.0 per cent in 1973 to 8.7 per cent in 2007.Again this was principally a
function of declining fertility working its way through the age structure, while at older ages,an
increase in life expectancy has helped swell the numbers of elderly.
Features of this ageing in Myanmar include a shift in the distribution of the aged, with an
increasing proportion of the aged being found in the oldest of the old age groups; an increasing
proportion of the aged that are female; increasing old age dependency and potential support
ratios; and changes in living arrangements, resulting in increasing number of older people alone.
All measures of the ageing process show that Myanmar’s population is becoming older.
The main findings from the present paper include:
(1) The elderly dependency ratio increased from 11.5 to 13.8 over the last 34 years,
with a faster increase in urban than in rural areas.
(2) The data indicate a consistent increase in the values of the index of ageing from
14.5 in 1973 to 30.6 in 2007. Compared with other ASEAN countries, the ageing
index in Myanmar is higher than that of Vietnam, Malaysia, Philippines, Brunei,
Cambodia and Laos.
(3) The potential support ratio in Myanmar decreased from 13.5 in 1991 to 10.9 in
2007. The parent support ratio increased from 1.8 in 1991 to 2.8 in 2007.
(4) In the population aged 60 and over, the percentage of those aged 80 and above
increased by over 60 per cent from 1973 to 2007, from 6.5 in 1973 to 10.4 in 2007.
(5) The percentages of females aged 60 and above, and of females aged 80 and above,
has been in the increasing trend during 1973 to 2007. Women 60 and above
changed from 52.2 to 56.9 per cent, while women aged 80 and above changed from
56.2 to 62.7 per cent, respectively. One of the consequences of lower female
mortality is the fact that three fourths of older women (75 per cent) were widows,
thus living without spousal support.
(6) According to the 2007 FRHS, 8.7 per cent of males living in urban areas were aged
60 years and above, while 7.7 per cent were living in rural areas. Similarly, among

viii Executive Summary |
females, 10.7 per cent of those living in urban areas were aged 60 years and above
while 8.9 per cent of the population living in rural areas were elderly.
(7) The median age of Myanmar has increased from 21 years in 1991 to 26 years in
2007.
(8) Life expectancy at birth for both male and female rose from 52.5 in 1973 to 65 in
2007.
(9) By 2050, it is projected that 22.2 per cent of the population will be aged 60 and
over.
(10) For the first time in the history of the country, the population of older persons will
exceed the population of children around 2040.
Due to the rapid changes occurring, and in preparation for the impacts of globalisation,
Myanmar should continue to make every effort to maintain the existing traditions of elderly
care; to raise public awareness of the important role older persons play in society; to mobilize
government agencies, NGOs, and voluntary organizations and the community to actively
participate in caring for older persons; and to promote health care services for the elderly. Data
and literature on the elderly population are scare, so that future research on demographics must
pay more attention to the elderly population.

| Chapter I 9
Chapter I
Introduction
1.1 The concept of an ageing population
Who are the elderly? The United Nations defines 60 years as the age at which people
become elderly. But defining the age of being elderly differs in many countries, depending on
the socio-economic status of each country. In developed countries, 65 years used to be widely
used as the age for defining ‘older person’. Both developed and developing countries tend to
define ‘old’ at a certain pre-established point, for example, retirement from full-time gainful
employment. This age becomes the artificial cut-off point at which an individual is known as an
‘elderly’ or an ‘old’ person.
The first World Assembly on Ageing was held in Vienna in1982 and the International
Plan of Action on Ageing, which was adopted at the Assembly, used age 60 years as the
definition for ‘older persons’. This age was again endorsed at the Second World Assembly on
Ageing (Mujahid, 2006). The Vienna Plan is the first international instrument that has been
created on ageing, and is aimed at strengthening the capacities of governments and civil
society to deal effectively with an ageing population, and to address the development potential
and dependency needs of older persons (WHO, 2002). In 1991, the UN Principles for Older
Persons were adopted addressing the independence, participation, care, self-fulfilment, and
dignity of older persons. In the following year, marking the Tenth Anniversary of the Vienna
Assembly, the General Assembly decided to observe the year 1999 as the International Year of
Older Persons, with the theme, ‘Towards a Society For All Ages’. In line with that decision, the
Macao Declaration and Plan of Action on Ageing for Asia and the Pacific was adopted on 1
October 1998 by the Regional Meeting on a Plan of Action on Ageing for Asia and the Pacific
and endorsed by the Economic and Social Commission for Asia and the Pacific at its fifty-fifth
session in 1999.
The Second World Assembly on Ageing was held in Madrid on 12th April 2002. The
report of the Assembly stated, ‘The world is getting older. In the next 50 years, the number of
older persons will nearly quadruple, growing from about 600 million to almost 2 billion people.
Today, one in every ten people is 60 years and older. By 2050, one out of every five will be an
10 Introduction |
older person, and by 2150, one third of the people in the world are expected to be 60 years of
age or older’ (WHO, 2002). The concern was raised that the impact of demographic change is
expected to be more pronounced in less developed countries (LDCs) than in the more
developed countries (MDCs), because LDCs faced with significantly higher rates of population
ageing at much lower levels of socio-economic development. Thus, population ageing began to
emerge as a significant concern for many developing countries.
The Madrid International Plan of Action on Ageing (MIPAA) of the Second World
Assembly on Ageing identifies three priorities for international efforts: 1) older persons and
development; 2) advancing health and well-being into old age; and 3) ensuring enabling and
supportive environments. In line with this Plan of Action and the commemoration of the
International Year of Older Persons in 1999, many countries in East and South-East Asia have
introduced policies and programmes to enhance the welfare of older persons. As a regional
initiative, the Shanghai Implementation Strategy (2002) has provided added impetus, and there
is growing awareness regionally of the emerging challenges of ageing.
Ten years ago at the Summit of Eight in Denver, Colorado, the Group of Eight (G8)
leaders recognized the importance of population ageing. The ‘Denver Communiqué’
encouraged nations to collaborate in biomedical and behavioural research and to learn from
one another how policies and programmes can help strengthen pension, health, and long-term
care systems. In 2007, the United Nations Commission on Population and Development
focused its work on the changing age structures of populations and their implications for
development.
1.2 Population ageing in the world
Population ageing is one of the most significant demographic changes of modern times,
a crucially important issue both globally and locally, that is an inevitable consequence of a shift
from higher to lower levels of fertility and mortality. In both less and more developed regions,
increasingly more people survive to older ages and once there, they tend to live longer, as
gains in life expectancy are relatively higher at older ages. Women, in particular, experience
remarkable longevity. The increase in the population of the elderly has resulted in a variety of
economic and social problems, which in turn fall on the family, community and government.
| Introduction 11
According to the United Nations, an estimated 737 million persons were aged 60 years
or over in 2009 and constituted the ‘older population’ of the world, nearly two thirds of whom
lived in developing countries. Their number is projected to increase to 2 billion in 2050,
comprising more than 20 per cent of the total population, by which time older persons will
outnumber children (defined as persons aged 0-14 years).
This demographic transition is taking place at a much faster rate in developing countries
today than it did in developed countries. The transition is most marked in countries of East and
South-East Asia, in particular in East Asia. Within the East and South-East Asia region, there are
differences in the pace of ageing between East Asia (which includes the ‘early’ agers Japan, the
Republic of Korea, and China) and South-East Asia. During 2000-2050, the rate of population
ageing will be higher in South-East Asia and although in both sub-regions the rate will decline
from 2025 to 2050, it will decline much more in East Asia (Mujahid, 2006). It is also projected
that the increase in the older population in South-East Asia will be five times more during 2000-
2050 than it was during 1950-2000. South-East Asia will experience a larger increase in the
number of older persons being added during the second half of 2000-2050 than during the first
half and will be faced with a more uphill task in dealing with the ageing situation during the
next fifty years (Mujahid, 2006).
1.3 The elderly in the Myanmar context
In the cultural and social context of Myanmar, a person’s lifespan is divided into three
stages. The earliest stage, lasting from birth to teenage years, is the stage of learning.
Afterwards is adulthood, which is the stage for the acquisition of wealth through work. This is
the longest and busiest stage, which also involves the establishment of the family through
marriage. In the Myanmar language, marriage means ‘setting up a home’. In the third stage,
usually associated with becoming a grandparent, there are major changes in family life. When
there are at least three generations in a family, the oldest will be treated as ‘elderly’.
Buddhism has great influence on the daily life of the majority of people in Myanmar.
Buddhists have preserved the tradition of close family ties, respect for the elders and
reverence for Buddha and the three Gems of the Buddhist tradition. The values of respect for
seniority and filial piety are highly cherished in Myanmar. By virtue of the culture as well as
religion, the young are taught to show respect to their elders. Ideally, senior citizens in

12 Introduction |
Myanmar are regarded highly and hold a special place in the family and in society. Older
persons are treated with respect and act as a good example for others. Most people recognize
the life experiences of the elderly and believe that the advice of the elderly should be followed.
Myanmar customs emphasize the reciprocal duties between parents and children. The
duties of children are to care for their parents, manage family affairs, be heirs to their parents’
properties, make charitable donations, and look after other relatives. To abandon the elderly is
considered immoral. Even though Myanmar is in the midst of societal change with the nuclear
family becoming more common, inter-generational family networks may still in theory
guarantee the care and support the elderly receive from the younger generations (Country
Report of Myanmar, 2007).
According to the results of the 2001 Fertility and Reproductive Health Survey, 94 per
cent of older persons in Myanmar were living with their spouses and family members, showing
that the family plays a central, continuing role in the care of the elderly, seen as the
responsibility of the family, community and the state. Myanmar people tend to place a great
emphasis on the family. The need to care for older persons exists as a priority within the mind
of each and every person in Myanmar.
However, it is important to note that this culture of respecting the elderly may generate
some myths about the situation of the elderly in the country. Moreover, the social structure is
changing due to increasing modernization, urbanization, and industrialization. The changes
have generated significant impacts on the health and socio-economic status of the people.
These effects are also felt by the elderly. This is one reason why an objective analysis, to the
extent permitted by the data, of the situation of the elderly in Myanmar is required.
1.4 The need to study population ageing in Myanmar
The population of Myanmar is also ageing and that the pace of ageing is increasing. As a
consequence of sustained declines in fertility and mortality during the last three decades,
Myanmar faces a steadily growing population of older persons. In 1973, the proportion of the
population that was aged 60 and above was slightly over 6 per cent. As the age structure shifts
more and more towards higher age groups, there are on average fewer and fewer persons of

| Introduction 13
working age to support the increasing number of older persons. Hence, it is crucial to prepare
for the challenges and opportunities in response to population ageing.
Although the Myanmar people still hold strong norms and values related to care for
the elderly, both demographic and socio-economic changes will place great stress on these
values. Population ageing will not automatically lead to negative impacts on society and on
the well-being of the elderly, especially where strong social support systems for the elderly
are in place. Yet it is important to recognize, document, and plan for changes that are
occurring in society that could potentially have an impact on the elderly.
The research findings described in this paper represent the second attempt in
Myanmar at examining the relationship between population ageing and socio-economic
development. The first attempt was the paper ‘The Elderly Population in Myanmar: Trends,
Living Conditions, Characteristics and Prospects’ which was based on the findings of the 2001
Fertility and Reproductive Health Survey. That report presented the results of an in-depth
study of significant indicators on population ageing, including gender differences, in the
process of ageing.
This paper is divided into six chapters. The first chapter provides the background to
the study. Chapter II presents an overview of population ageing in Myanmar and Chapter III
shows socio-economic characteristics of the elderly. Chapter IV discusses the changing family
structure and living arrangement of the elderly, while Chapter V reviews care, policies, and
programmes for elderly population in Myanmar. The main findings and policy
recommendations are summarized in the last chapter.
1.5 Objectives
The objectives of this paper are to:
1. Study the trends of population ageing in Myanmar during the period 1973-2007
2. Explore the demographic and socio-economic characteristics of the elderly
population
3. Analyse the living arrangements of elderly population
4. Provide insights into the policies and programmes for the elderly population in
Myanmar
14 Introduction |
1.6 Methodology
As there has been no survey that has targeted the ageing population in Myanmar, the
data for the analysis presented in this paper is drawn from national censuses and surveys that
have been conducted since 1973, the date of the first modern census of Myanmar, to 2007.
The main source of data is the 2007 Fertility and Reproductive Health Survey (FRHS), the most
recent nation-wide survey of population. This survey was conducted by the Department of
Population of the Ministry of Immigration and Population, with support from UNFPA.
To describe trends in population ageing, data from the 1973 and 1983 censuses, 1991
Population Changes and Fertility Survey (PCFS), 2001 FRHS and 2007 FRHS have been used. The
description of the overview of population ageing, the socio-economic characteristics of the
elderly, and the living arrangements of the elderly is based on the data from the 2007 FRHS.
The analysis is divided into three parts: (1) demographic analysis of the ageing population, (2)
socio-economic characteristics of the elderly, and (3) living arrangements of the elderly.
1.7 Definitions
In order to study the elderly population in Myanmar, measures of ageing, such as the
index of ageing, dependency ratio, potential support ratio, parent support ratio, and median
age of population have been used. An elderly person refers to people aged 60 and over.
The index of ageing is the ratio of the number of elderly persons (aged 60 and above) to
the number of children (aged below 15) in a population.
The old age dependency ratio is the proportion of the population aged 60 and over
divided by the proportion aged 15-59. The ratio is expressed per 100 population. The ratio
provides an indicator of the burden of support of the elderly.
The potential support ratio is an alternative way of expressing the numerical
relationship between those more likely to be economically productive and those more likely to
be dependents. It is the inverse of the old-age dependency ratio, that is, the number of people
in the working ages of 15-64 per every person 65 and older:

| 15
Number of persons of working age 15 - 59
Potential Support Ratio (PSR) = x100
Number of persons 60 and over
The Parent support ratio is a measure that has been commonly used to assess the
demands on families to provide support for their ‘oldest old’ members. It is the number of
persons aged 85 years and over in relation to those aged between 50 to 64 years:
Number of persons aged 85 years and over
Parent Support Ratio = x 100
Number of person aged 50-64 years
The median age of the population is that age at which 50 per cent of the population are
older and 50 per cent are younger, and is an indicator of the degree of ageing in a population.

16 Chapter II |
Chapter II
Overview of Population Ageing in Myanmar
2.1 Trends in population ageing
The aging of the population is a process in which the proportions of adults and elderly
increase while the proportion of children and adolescents decrease. This process results in a
rise in the median age of the population. Ageing occurs when fertility rates decline, while at the
same time life expectancy remains constant or improves older ages (http://www.prb.org/
Educators/Resources/Glossary.aspx).The United Nations has classified populations as ‘young’,
‘mature’ and ‘old’, and in accordance with this definition, Myanmar has a mature aged
population, but is rapidly changing to having an old population (Department of Population,
2005).
The official age of retirement is used to identify people entering the stage of being
aged. For those who are able, the age of retirement in Myanmar is 60, and many people stop
working at that age. In accordance with UN standards and based on the retirement age in
Myanmar, this study defines the ageing population as the population belonging to the age
group 60 years and over. Most of the analysis divides the elderly population in this study into
five-year age groups: 60-64, 65-69, 70-74, 75-79and80 years and over.
Table 2.1 shows the trend of the elderly population by urban or rural residence and sex.
The data indicate that the proportion of people aged 60 and above increased from 6.0 per cent
in 1973 to 8.7 per cent in 2007. The increase in the elderly female population was from 6.3 per
cent in 1973 to 9.4 per cent in 2007, whereas the percentage of males aged 60 and over
increased from 5.8 per cent in 1973 to 8.0 per cent in 2007 (see Figure 2.1). A similar pattern of
increase occurred among the population aged 80 years and over. The higher percentage of
females over males at older ages can be explained by their lower mortality levels compared to
males.
The proportion of elderly living in rural areas, both people aged 60 years and above,
and people 80 years and above, is higher than that of the elderly who were living in urban
areas in 1973. However, in 1991, 2001 and again in 2007, the percentage of the aged

| Overview of Population Ageing in Myanmar 17
population living in urban areas exceeded that of rural areas. This can be explained in part by
the earlier and more rapid fertility transition and higher life expectancies in urban areas
compared to in rural areas.
According to the FRHS conducted in 2007, 8.7 per cent of males living in urban areas
and 7.7 per cent of males living in rural areas were elderly. Similarly, among females, 10.7 per
cent of those living in urban areas and 8.9 per cent of those living in rural areas were aged 60
and above. In both urban and rural areas, there were more elderly females than males.
Table 2.1 Per cent distribution of ageing population (1973-2007)
Year
Ageing Population Total Median age
60-64 65-69 70-74 75-79 80+ (60+)
Union Total 1973 2.4 1.6 1.2 0.5 0.4 6.0 - 1983 2.4 1.6 1.2 0.6 0.5 6.4 - 1991 2.7 1.9 1.3 0.8 0.6 7.1 21.0 2001 2.9 2.3 1.7 0.9 0.7 8.5 24.0 2007 2.6 2.3 1.8 1.1 0.9 8.7 26.0 Male 1973 2.3 1.5 1.1 0.5 0.3 5.8 18.9 1983 2.4 1.5 1.1 0.6 0.4 6.0 19.9 1991 2.5 1.7 1.2 0.7 0.5 6.6 21.0 2001 2.7 2.2 1.5 0.8 0.6 7.7 23.0 2007 2.5 2.1 1.6 1.0 0.7 8.0 25.0 Female 1973 2.4 1.6 1.2 0.6 0.4 6.3 19.3 1983 2.5 1.6 1.3 0.7 0.6 6.7 20.6 1991 2.8 2.0 1.4 0.9 0.7 7.7 22.0 2001 3.0 2.4 1.8 1.0 0.8 9.1 25.0
2007 2.8 2.4 1.9 1.2 1.1 9.4 27.0
0.00
1.00
2.00
3.00
4.00
5.00
6.00
7.00
8.00
9.00
10.00
1973 1983 1991 2001 2007
Male
Female
Figure 2.1 Percent of elderly by sex, 1973-2007

18 Overview of Population Ageing in Myanmar |
Table 2.1 Per cent distribution of ageing population (1973-2007)
Year
Ageing Population Total Median age
60-64 65-69 70-74 75-79 80+ (60+)
Urban
Total
1973 2.1 1.5 1.0 0.5 0.4 5.5 -
1983 2.3 1.6 1.1 0.6 0.5 6.2 -
1991 2.7 2.0 1.3 0.9 0.6 7.4 23.0
2001 3.1 2.4 1.7 1.0 0.8 8.9 27.0
2007 3.0 2.5 1.9 1.2 1.1 9.6 29.0
Male
1973 2.0 1.4 0.9 0.4 0.3 4.9 -
1983 2.2 1.4 1.0 0.5 0.4 5.5 -
1991 2.4 1.8 1.2 0.7 0.4 6.6 22.0
2001 3.1 2.2 1.3 0.8 0.6 7.9 26.0
2007 2.8 2.3 1.7 1.1 0.8 8.7 27.0
Female
1973 2.3 1.6 1.2 0.6 0.4 6.1 -
1983 2.5 1.7 1.3 0.8 0.6 6.9 -
1991 2.9 2.1 1.5 1.0 0.8 8.2 24.0
2001 3.0 2.6 2.1 1.1 1.0 9.8 28.0
2007 3.2 2.7 2.1 1.4 1.3 10.7 30.0
Rural
Total
1973 2.4 1.6 1.2 0.5 0.4 6.2 -
1983 2.5 1.6 1.3 0.6 0.5 6.4 -
1991 2.7 1.8 1.3 0.7 0.6 7.0 21.0
2001 2.8 2.3 1.7 0.9 0.7 8.3 23.0
2007 2.5 2.2 1.7 1.0 0.8 8.2 25.0
Male
1973 2.4 1.6 1.2 0.5 0.4 6.1 -
1983 2.4 1.5 1.2 0.6 0.5 6.2 -
1991 2.6 1.7 1.2 0.6 0.5 6.6 20.0
2001 2.6 2.2 1.5 0.8 0.6 7.7 22.0
2007 2.4 2.1 1.6 0.9 0.7 7.7 24.0
Female
1973 2.4 1.6 1.3 0.5 0.4 6.3 -
1983 2.5 1.6 1.3 0.7 0.6 6.7 -
1991 2.7 2.0 1.4 0.8 0.6 7.5 21.0
2001 3.0 2.4 1.8 1.0 0.8 8.9 24.0
2007 2.6 2.3 1.9 1.1 1.0 8.9 26.0

| Overview of Population Ageing in Myanmar 19
The median age generally increases with an increase in the proportion of older persons
in the population. The median age of Myanmar has increased from 21 years in 1991 to 26 years
in 2007, while the median age in urban areas is more than 4 years higher than in rural areas.
The median age for females is consistently higher than the median age for males in both urban
and rural areas.
2.2 Sex ratio of the elderly
Table 2.2 presents the sex ratio of the elderly population aged 60 and above in
Myanmar. The overall sex ratio in 2007 is 76 males per 100 females, which constitutes a decline
over the past 34 years. The sex ratio of the elderly population has declined from 92.7 in 1973 to
80.7 in 1991 and to 75.8 in 2007 (Figure 2.2). The same trend is observed in both urban and
rural areas. In 2007, the sex ratio was 70.7 for the elderly population in urban areas and 78.0 in
rural areas. Rural areas had a higher sex ratio than urban areas during the period 1973 to 2007.
The same pattern is found for those elderly people aged 80 and above.
0.0
10.0
20.0
30.0
40.0
50.0
60.0
70.0
80.0
90.0
100.0
60+ 80+
Figure 2.2 Sex ratio of elderly population 60+ and 80+
1973
1983
1991
2001
2007

20 Overview of Population Ageing in Myanmar |
Table 2.2 Sex ratio of the elderly population by age group and residence (1973-2007)
Year 60-64 65-69 70-74 75-79 80+ 60+
Union
1973 96.7 93.9 89.4 90.9 77.3 92.7
1983 94.0 91.5 87.7 88.1 75.9 90.0
1991 85.6 82.6 79.1 76.3 64.8 80.8
2001 81.4 82.6 73.9 74.7 63.4 77.9
2007 80.9 78.6 75.1 73.8 59.6 75.8
Urban
1973 88.4 82.3 75.2 74.1 65.1 81.2
1983 87.9 82.0 76.4 72.0 61.9 80.1
1991 77.8 79.9 76.1 69.5 40.9 73.5
2001 90.4 75.1 58.1 64.9 52.4 72.9
2007 76.8 73.8 70 69.6 51.6 70.7
Rural
1973 99.2 97.6 93.6 96.3 81.8 96.2
1983 95.6 95.0 90.8 92.3 82.1 93.1
1991 89.0 83.9 80.4 79.8 77.5 84.2
2001 78.2 85.5 80.5 78.5 68.3 79.8
2007 82.7 80.7 77.2 75.7 63.5 78.0
2.3 Determinants of population ageing
The increasing proportion of older persons in the population is the outcome of
demographic transition. The decline of fertility and mortality are the major demographic
determinants of an ageing population in Myanmar. Falling fertility rates leads to a reduced
number of children, while lower mortality prolongs the survival of older persons.
The trends in basic demographic indicators in Myanmar are presented in Table 2.3. The
data on migration are very limited in Myanmar. The last two modern censuses, those of 1973
and 1983, did not include questions concerning migration. As information about international
migration is not available, the size and age composition of the Myanmar population are
determined by changes in fertility and mortality. There has been a rapid demographic
transition in Myanmar in the last two decades.
| Overview of Population Ageing in Myanmar 21
0-14
15-59
60+
0%
10%
20%
30%
40%
50%
60%
70%
80%
90%
100%
1973 1983 1991 2001 2007
Figure 2.3 Age distribution of Myanmar Population 1973-2007
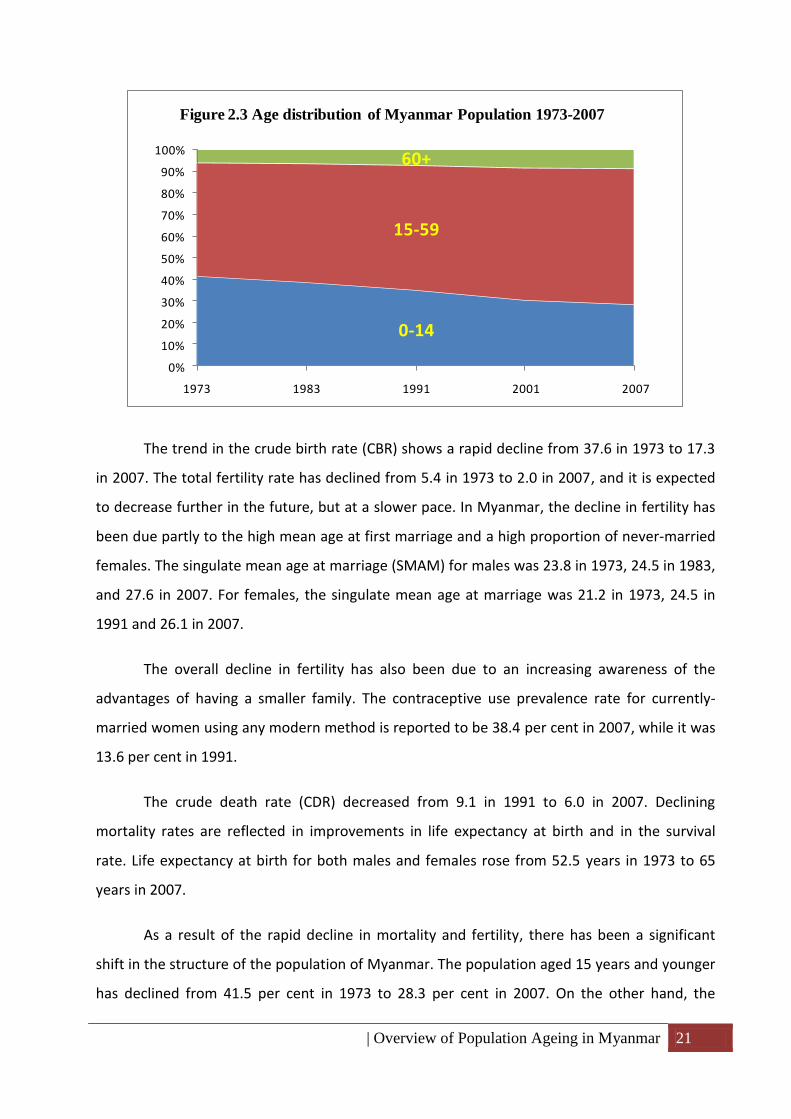
The trend in the crude birth rate (CBR) shows a rapid decline from 37.6 in 1973 to 17.3
in 2007. The total fertility rate has declined from 5.4 in 1973 to 2.0 in 2007, and it is expected
to decrease further in the future, but at a slower pace. In Myanmar, the decline in fertility has
been due partly to the high mean age at first marriage and a high proportion of never-married
females. The singulate mean age at marriage (SMAM) for males was 23.8 in 1973, 24.5 in 1983,
and 27.6 in 2007. For females, the singulate mean age at marriage was 21.2 in 1973, 24.5 in
1991 and 26.1 in 2007.
The overall decline in fertility has also been due to an increasing awareness of the
advantages of having a smaller family. The contraceptive use prevalence rate for currently-
married women using any modern method is reported to be 38.4 per cent in 2007, while it was
13.6 per cent in 1991.
The crude death rate (CDR) decreased from 9.1 in 1991 to 6.0 in 2007. Declining
mortality rates are reflected in improvements in life expectancy at birth and in the survival
rate. Life expectancy at birth for both males and females rose from 52.5 years in 1973 to 65
years in 2007.
As a result of the rapid decline in mortality and fertility, there has been a significant
shift in the structure of the population of Myanmar. The population aged 15 years and younger
has declined from 41.5 per cent in 1973 to 28.3 per cent in 2007. On the other hand, the

22 Overview of Population Ageing in Myanmar |
population in the age group 15-59 increased from 52.5 per cent in 1973 to 63.0 per cent in
2007, while the population of the age group 60 years and above increased from 6.0 per cent to
8.7 per cent in the same time period. This trend reflects both declining fertility and an increase
in life expectancy.
Table 2.3 Demographic Indicators in Myanmar, 1973 – 2007
Indicators 1973 1983 1991* 2001** 2007**
Broad Age group
0-14 41.5 38.6 35.0 30.3 28.3
15-59 52.5 55.0 57.8 61.2 63.0
60+ 6.0 6.4 7.2 8.4 8.7
Sex Ratio 98.9 98.6 95.0 92.0 89.4
SMAM Male 23.8 24.5 26.3 27.6 27.6
Female 21.2 22.4 24.5 25.8 26.1
Proportion Never Married (45-49)
Male 3.5 3.8 4.3 5.7 7.5
Female 5.9 5.9 9.1 11.8 14.8
CBR 37.6 34.4 27.9 17.29
TFR 5.4 4.6 2.9 2.43 2.03
CPR ---- ---- 16.8 37 40.9
CDR 14.2 11 9.1 7.7 6
IMR 85 70 94 69.5 53.2
e00 Total 52.5 55.1 59 61 65
Male 51 53.5 57 59 63
Female 55.8 56.8 61 64 66
Urban Population (%) 23.6 24.1 27 ---- 27
Source: Population Census of Myanmar, 1973 and 1983 * Population Changes and Fertility Survey 1991 ** Fertility and Reproductive Health Surveys, 2001, 2007
2.4 Demographic impact of population ageing
2.4.1 Index of ageing
The index of ageing is defined as the number of persons aged 60 years and over per 100
people aged 0-14 years. Table 2.4 displays the values of the index of ageing for five time points
between 1973 and 2007. The data indicate a consistent increase in the values of the index of

| Overview of Population Ageing in Myanmar 23
ageing from 14.5 in 1973 to 30.6 in 2007. It shows that as fertility declines a shift of age
structure from the younger to older ages occurs and subsequently the index of ageing becomes
larger. Except in 1973, the value is greater in urban areas than in rural areas.
Table 2.4 Values for the index of ageing from censuses and surveys
Residence 1973 1983 1991 2001 2007
Union 14.5 16.5 20.4 27.8 30.6
Urban 13.5 17.3 24.3 34.5 40.2
Rural 14.9 16.3 19.1 26.0 27.8
Table 2.5 shows the index of ageing in selected ASEAN countries. Based on the indicator
of percentage of persons aged 60 and over, the most developed country, Japan has the highest
value of the ageing index in 2007. The ageing index in Myanmar is higher than that of in
Vietnam, Malaysia, Philippines, Brunei, Cambodia and Laos. It is projected that in 2025, the
ageing index in Myanmar will reach 60.8.
Table 2.5 Ageing index in ASEAN countries
Area
Ageing index
1975 2007 2025
Indonesia 13.0 30.9 61.5
Malaysia 13.3 23.5 56.3
Philippines 11.2 18.5 39.7
Singapore 20.4 74.8 233.5
Viet Nam 17.4 26.5 59.2
Myanmar 15.7 30.6 60.8
Thailand 11.7 47.5 99.7
Lao 10.8 13.3 21.4
Cambodia 11.0 16.2 27.6
Brunei 13.9 17.4 50.6
2.4.2 Elderly dependency ratio
The impact of population ageing is increasingly evident in the old age dependency ratio.
This ratio is defined as the number of working age persons (age 15-60) per older person (age
24 Overview of Population Ageing in Myanmar |
60+), and is used as an indicator of the ‘dependency burden’ on potential workers. Between
2000 and 2050, the United Nations has projected that the old age dependency ratio will double
in more developed regions and triple in less developed regions (United Nations, 2004). Table
2.6 provides a comparison of elderly dependency ratios calculated from the 1973 and 1983
censuses and from the 1991, 2001 and 2007 surveys. There was an increase in the ratio
between 1973 and 2007, with increasing disparities between dependency ratios for males and
females. The increasing old age dependency ratio can indicate increasing burdens on the family
as they attempt to support their aged members. As the number of family members in their
working ages falls relative to the number of their elderly dependents, the task of supporting
the elderly becomes more difficult.
The elderly dependency ratio increased from 11.5 to 13.8 over 34 years, with a faster
increase in urban than in rural areas. It is interesting to note that in the 1973 and 1983
censuses, there was a higher proportion of males in urban areas. This phenomenon has
declined in subsequent years, during which the female ageing population has become larger
than that of the male ageing population.
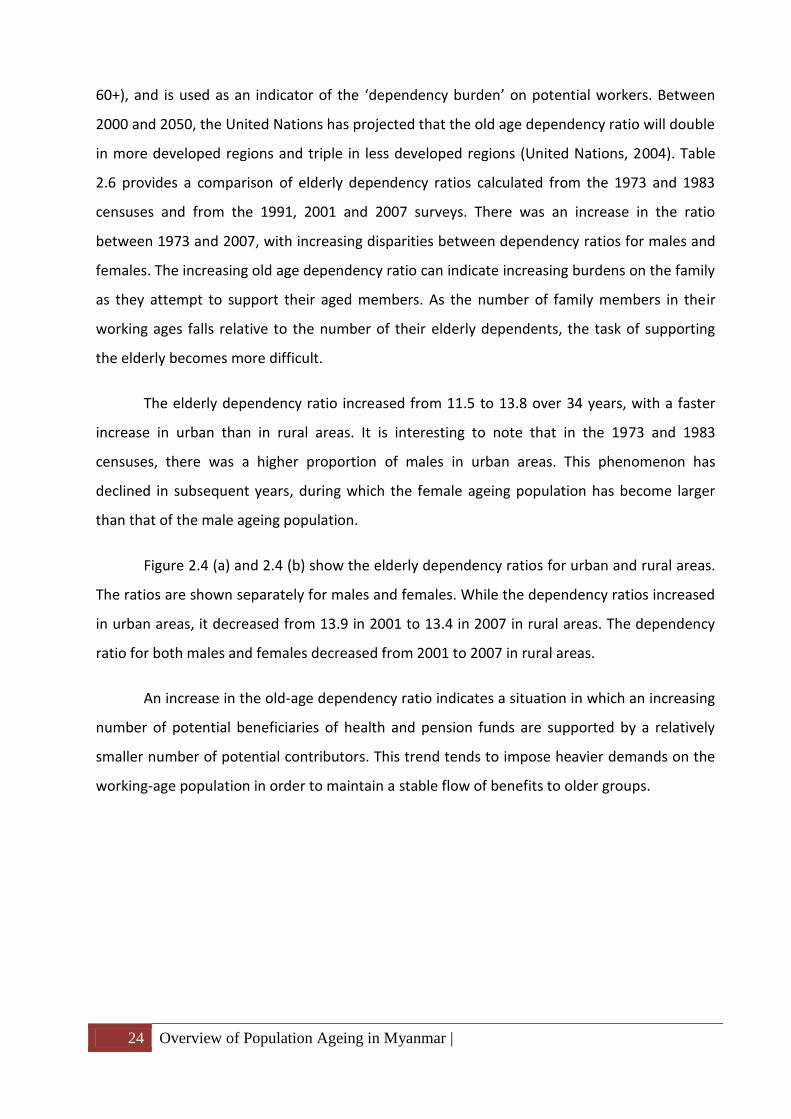
Figure 2.4 (a) and 2.4 (b) show the elderly dependency ratios for urban and rural areas.
The ratios are shown separately for males and females. While the dependency ratios increased
in urban areas, it decreased from 13.9 in 2001 to 13.4 in 2007 in rural areas. The dependency
ratio for both males and females decreased from 2001 to 2007 in rural areas.
An increase in the old-age dependency ratio indicates a situation in which an increasing
number of potential beneficiaries of health and pension funds are supported by a relatively
smaller number of potential contributors. This trend tends to impose heavier demands on the
working-age population in order to maintain a stable flow of benefits to older groups.

| Overview of Population Ageing in Myanmar 25
Table 2.6 Comparison of elderly dependency ratios from censuses and surveys
Year
Elderly dependency ratios
Total Male Female
Union
1973 11.5 11.1 11.8
1983 11.6 11.0 12.1
1991 12.3 11.5 13.2
2001 13.8 12.8 14.8
2007 13.8 12.8 14.6
Urban
1973 10.3 9.2 11.4
1983 10.6 9.5 11.8
1991 11.9 10.7 13.1
2001 13.6 12.3 14.8
2007 14.7 13.4 15.7
Rural
1973 11.9 11.8 12.0
1983 11.9 11.6 12.2
1991 12.5 11.9 13.2
2001 13.9 12.9 14.8
2007 13.4 12.5 14.1
2.4.3 Potential support ratio and Parent support ratio
The potential support ratio is an indicator of demographic ageing and of the degree of
dependency of older persons on potential workers. Table 2.7 presents the potential support
ratio and parent support ratio from three surveys. The potential support ratio is an alternative
way of expressing the numerical relationship between those people more likely to be

26 Overview of Population Ageing in Myanmar |
economically productive and those more likely to be dependents (number of people in the
working ages of 15-64 per person aged 65 and older). The potential support ratio in Myanmar
decreased from 13.5 in 1991 to 10.9 in 2007.
The parent support ratio, in turn, is a measure commonly used to assess the demands
on families to provide support for their oldest old members. It is the number of persons aged
85 years and over in relation to those aged between 50 to 64 years. The parent support ratio
increased from 1.8 in 1991 to 2.8 in 2007. Urban areas had an increase in the parent support
ratio than rural areas during the period 1991 to 2007.
Table 2.7 Potential support ratio and Parent support ratio
Year Potential Support Ratio Parent Support Ratio
Union Urban Rural Union Urban Rural
1991 13.5 13.7 13.4 1.8 2.2 1.6
2001 11.5 11.7 11.4 2.2 2.4 2.1
2007 10.9 10.4 11.1 2.8 3.2 2.7
2.5 Demographic profile of the elderly population
2.5.1 The oldest old population
The population aged 80 years or more is referred to as the ‘oldest old’. With increasing
longevity, more elderly are living to be 80 years and over. In many countries, the oldest old are
now the fastest growing portion of the total population. In 2009, the oldest old (persons aged
80 years or over) constitute 14 per cent of the population aged 60 or over worldwide. The
oldest old constitute one of the fastest-growing segments of the population and, by 2050, 20
per cent of the world’s older population will be aged 80 years or over. According to the World
Population Ageing report, more than half of the world’s oldest-old population is accounted for
by six countries, three of which—China, Japan, and India—are from the Asia region (UN, 2002).
Table 2.8 shows the percentage of the population aged 80 and above among the
population aged 60 and over, taken from censuses and surveys. Overall this percentage
increased by over 60from 1973 to 2007: from 6.5 in 1973 to 10.4 in 2007. This percentage of
the population aged 80 and above is higher in urban than in rural areas.

| Overview of Population Ageing in Myanmar 27
Table 2.8 Percentage of aged 80+ in Population aged 60+
Year
Union Urban Rural
Male Female Total Male Female Total Male Female Total
1973 5.9 7.0 6.5 5.8 7.1 6.5 6.0 6.9 6.5
1983 7.3 8.6 8.0 7.1 9.2 8.3 7.4 8.4 7.9
1991 7.0 8.7 8.0 5.4 9.7 7.8 7.7 8.3 8.0
2001 7.2 8.9 8.2 7.1 9.9 8.7 7.3 8.5 8.0
2007 9.0 11.4 10.4 8.9 12.2 10.9 9.0 11.1 10.2
2.5.2 Feminization of ageing
Globally, the majority of older persons are women because female life expectancy is
longer than male life expectancy. It is estimated that at current mortality rates, men surviving
to age 60 can expect to live another 18 years and women surviving to age 60 can expect an
additional 21 years of life. The ratio of men to women at older ages is lower in developed
countries (74 men per 100 women) than in developing countries (89 men per 100 women)
because the differences in life expectancy between the sexes are larger in developed countries
(United Nations, 2009).
Similarly, women outnumber men among the elderly in Myanmar. At birth there is an
approximate balance in the sex ratio with 102 males to 100 females. Due to higher female life
expectancy, the ratio of males to female declines with age, and women outnumber men in
older age groups.
Table 2.9 presents the percentage of females in the population aged 60 and over and
the percentage of females in the population aged 80 and over by residence. The data shows
that the percentage of females increased from 1973 to 2007 – the percentage of women aged
60 and over increased from 52.2 to 56.9, while the percentage of women aged 80 and over
increased from 56.2 to 62.7. In general, a similar pattern of increase occurred among those
living in urban and rural areas. This increase may be due to a much higher proportion of older
women than older men living without a spouse. The 2007 Fertility and Reproductive Health
Survey reported that 48 per cent of older women, as against 25 per cent of older men, did not

28 Overview of Population Ageing in Myanmar |
have a spouse. Older Myanmar women face disadvantages relative to men including lower
literacy rates, longer widowhoods, and a higher probability of living alone.
In a country where social security coverage is minimal, levels of economic activity
reflect income security, while women’s lower rate of activity can be taken as a proxy for their
being poorer and their more dependent status financially. Those who are single in old age are
likely to receive less care when ill or if they become disabled compared to those women who
have a spouse. The 2007 FRHS showed that 50.2 per cent of older women, as compared to 21.5
of older men, were widowed. Older women are thus more vulnerable than older men. Greater
attention must be paid to their requirements for care, financial support, and social protection.
Table 2.9 Percentage of Females in elderly 60+ and 80+
Year
Percentage of Females in 60+ Percentage of Females in 80+
Union Urban Rural Union Urban Rural
1973 52.2 55.1 51.3 56.2 60.2 55.1
1983 53.0 55.8 52.2 57.0 62.0 55.4
1991 55.3 57.6 54.3 60.7 71.0 56.3
2001 56.2 57.8 55.6 61.2 65.6 59.4
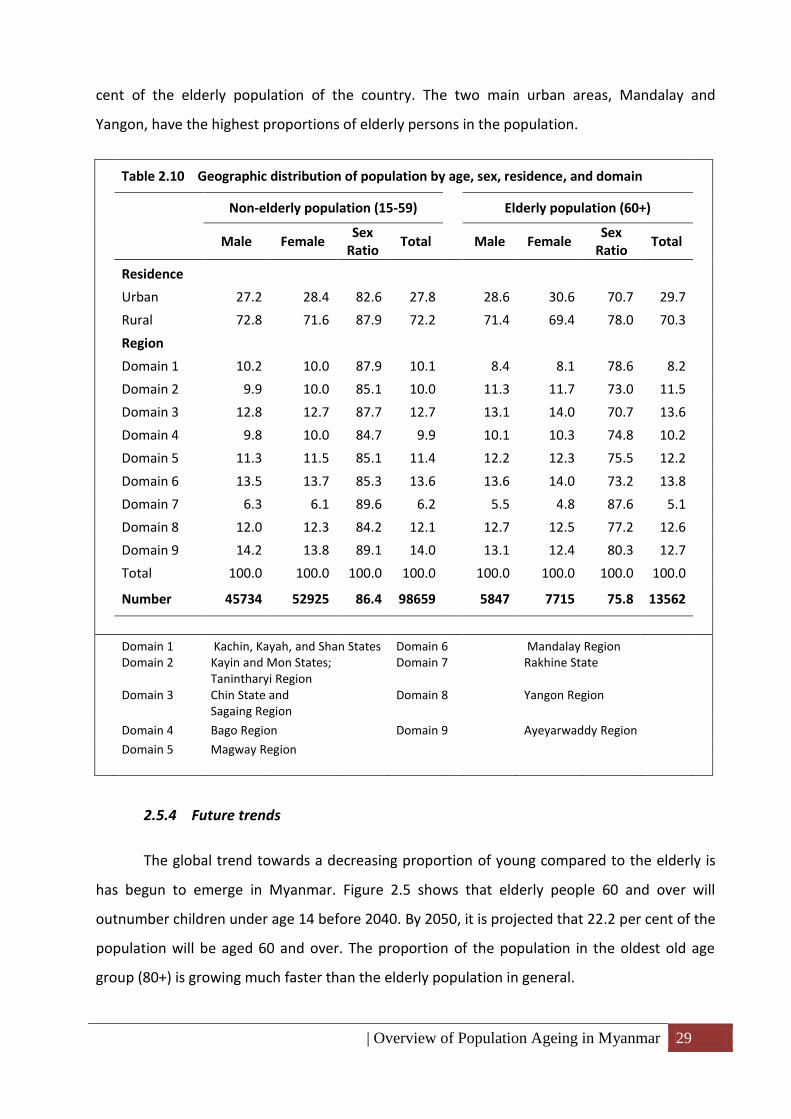
2007 56.9 58.6 56.2 62.7 66.0 61.2
2.5.3 Spatial dimensions of ageing
Table 2.10 shows the geographic distribution of elderly and non-elderly by sex. The sex
ratio (the number of males per 100 females) of the elderly population nationwide is 75.8, while
it is 86.4 for the non-elderly. The predominance of females becomes more marked with
increasing age. Looking at the table, it is apparent that a higher proportion of the population in
urban areas are aged 60 and over when compared with rural areas. However, because the
majority of the population in Myanmar lives in rural areas, there are more elderly people living
in rural areas overall. Approximately 70 per cent of the elderly population lived in rural areas in
2007.
The percentage distribution among the elderly is similar to the distribution of the
population in their working ages. Domain 7 (Rakhine State) was the residence for only 5.1 per
| Overview of Population Ageing in Myanmar 29
cent of the elderly population of the country. The two main urban areas, Mandalay and
Yangon, have the highest proportions of elderly persons in the population.
Table 2.10 Geographic distribution of population by age, sex, residence, and domain
Non-elderly population (15-59) Elderly population (60+)
Male Female
Sex Ratio
Total Male Female Sex
Ratio Total
Residence
Urban 27.2 28.4 82.6 27.8 28.6 30.6 70.7 29.7
Rural 72.8 71.6 87.9 72.2 71.4 69.4 78.0 70.3
Region
Domain 1 10.2 10.0 87.9 10.1 8.4 8.1 78.6 8.2
Domain 2 9.9 10.0 85.1 10.0 11.3 11.7 73.0 11.5
Domain 3 12.8 12.7 87.7 12.7 13.1 14.0 70.7 13.6
Domain 4 9.8 10.0 84.7 9.9 10.1 10.3 74.8 10.2
Domain 5 11.3 11.5 85.1 11.4 12.2 12.3 75.5 12.2
Domain 6 13.5 13.7 85.3 13.6 13.6 14.0 73.2 13.8
Domain 7 6.3 6.1 89.6 6.2 5.5 4.8 87.6 5.1
Domain 8 12.0 12.3 84.2 12.1 12.7 12.5 77.2 12.6
Domain 9 14.2 13.8 89.1 14.0 13.1 12.4 80.3 12.7
Total 100.0 100.0 100.0 100.0 100.0 100.0 100.0 100.0
Number 45734 52925 86.4 98659 5847 7715 75.8 13562
Domain 1 Kachin, Kayah, and Shan States Domain 6 Mandalay Region Domain 2 Kayin and Mon States;
Tanintharyi Region Domain 7 Rakhine State
Domain 3 Chin State and Sagaing Region
Domain 8 Yangon Region
Domain 4 Bago Region Domain 9 Ayeyarwaddy Region
Domain 5 Magway Region
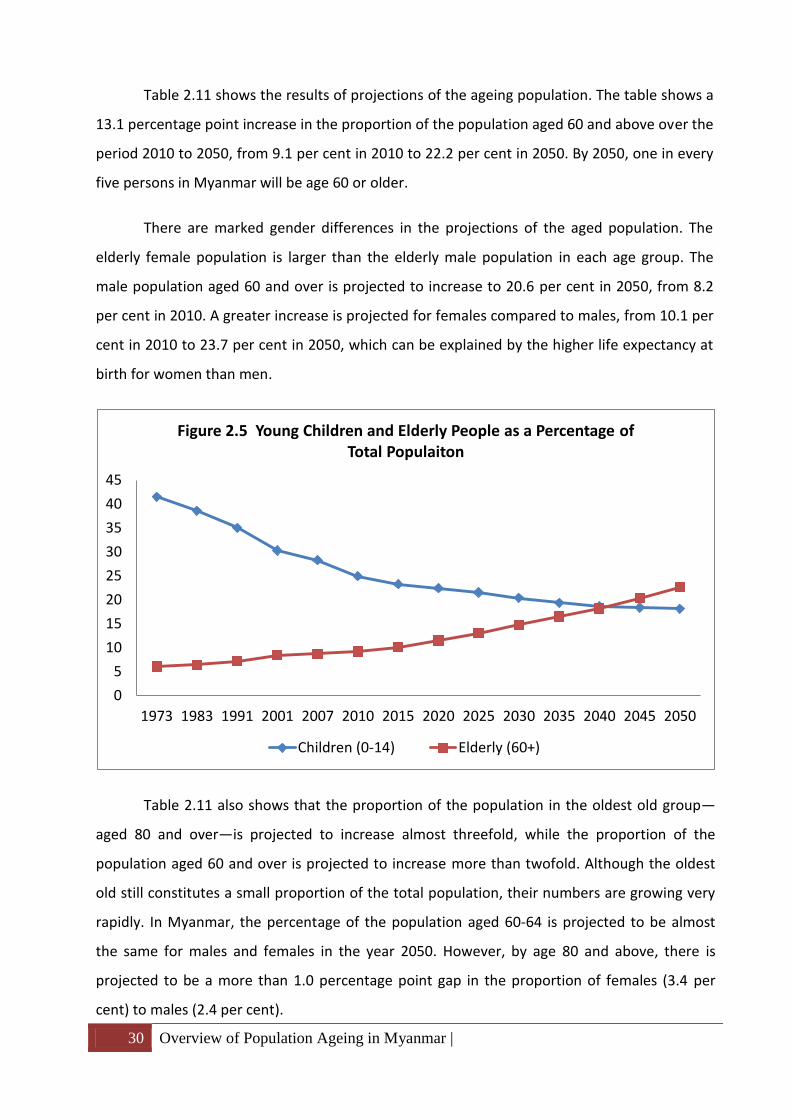
2.5.4 Future trends
The global trend towards a decreasing proportion of young compared to the elderly is
has begun to emerge in Myanmar. Figure 2.5 shows that elderly people 60 and over will
outnumber children under age 14 before 2040. By 2050, it is projected that 22.2 per cent of the
population will be aged 60 and over. The proportion of the population in the oldest old age
group (80+) is growing much faster than the elderly population in general.
30 Overview of Population Ageing in Myanmar |
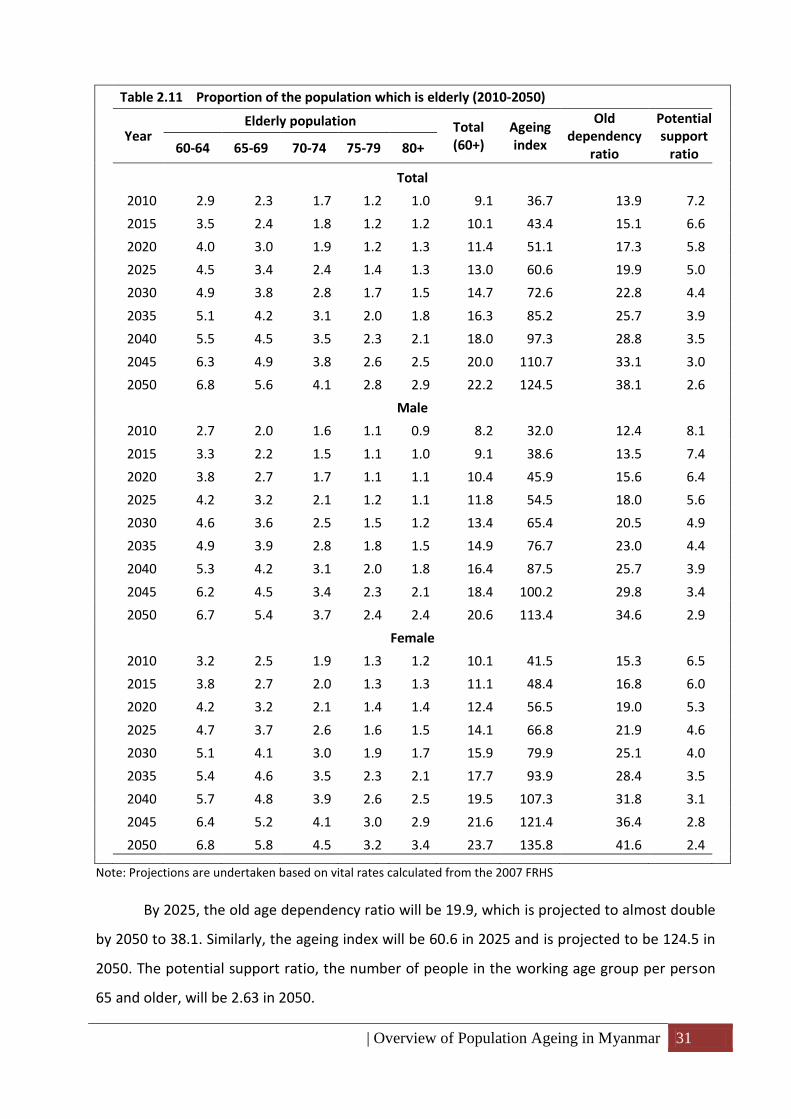
Table 2.11 shows the results of projections of the ageing population. The table shows a
13.1 percentage point increase in the proportion of the population aged 60 and above over the
period 2010 to 2050, from 9.1 per cent in 2010 to 22.2 per cent in 2050. By 2050, one in every
five persons in Myanmar will be age 60 or older.
There are marked gender differences in the projections of the aged population. The
elderly female population is larger than the elderly male population in each age group. The
male population aged 60 and over is projected to increase to 20.6 per cent in 2050, from 8.2
per cent in 2010. A greater increase is projected for females compared to males, from 10.1 per
cent in 2010 to 23.7 per cent in 2050, which can be explained by the higher life expectancy at
birth for women than men.
Table 2.11 also shows that the proportion of the population in the oldest old group—
aged 80 and over—is projected to increase almost threefold, while the proportion of the
population aged 60 and over is projected to increase more than twofold. Although the oldest
old still constitutes a small proportion of the total population, their numbers are growing very
rapidly. In Myanmar, the percentage of the population aged 60-64 is projected to be almost
the same for males and females in the year 2050. However, by age 80 and above, there is
projected to be a more than 1.0 percentage point gap in the proportion of females (3.4 per
cent) to males (2.4 per cent).
0
5
10
15
20
25
30
35
40
45
1973 1983 1991 2001 2007 2010 2015 2020 2025 2030 2035 2040 2045 2050
Figure 2.5 Young Children and Elderly People as a Percentage of Total Populaiton
Children (0-14) Elderly (60+)
| Overview of Population Ageing in Myanmar 31
Table 2.11 Proportion of the population which is elderly (2010-2050)
Year
Elderly population Total (60+)
Ageing index
Old dependency
ratio
Potential support
ratio
60-64 65-69 70-74 75-79 80+
Total
2010 2.9 2.3 1.7 1.2 1.0 9.1 36.7 13.9 7.2
2015 3.5 2.4 1.8 1.2 1.2 10.1 43.4 15.1 6.6
2020 4.0 3.0 1.9 1.2 1.3 11.4 51.1 17.3 5.8
2025 4.5 3.4 2.4 1.4 1.3 13.0 60.6 19.9 5.0
2030 4.9 3.8 2.8 1.7 1.5 14.7 72.6 22.8 4.4
2035 5.1 4.2 3.1 2.0 1.8 16.3 85.2 25.7 3.9
2040 5.5 4.5 3.5 2.3 2.1 18.0 97.3 28.8 3.5
2045 6.3 4.9 3.8 2.6 2.5 20.0 110.7 33.1 3.0
2050 6.8 5.6 4.1 2.8 2.9 22.2 124.5 38.1 2.6
Male
2010 2.7 2.0 1.6 1.1 0.9 8.2 32.0 12.4 8.1
2015 3.3 2.2 1.5 1.1 1.0 9.1 38.6 13.5 7.4
2020 3.8 2.7 1.7 1.1 1.1 10.4 45.9 15.6 6.4
2025 4.2 3.2 2.1 1.2 1.1 11.8 54.5 18.0 5.6
2030 4.6 3.6 2.5 1.5 1.2 13.4 65.4 20.5 4.9
2035 4.9 3.9 2.8 1.8 1.5 14.9 76.7 23.0 4.4
2040 5.3 4.2 3.1 2.0 1.8 16.4 87.5 25.7 3.9
2045 6.2 4.5 3.4 2.3 2.1 18.4 100.2 29.8 3.4
2050 6.7 5.4 3.7 2.4 2.4 20.6 113.4 34.6 2.9
Female
2010 3.2 2.5 1.9 1.3 1.2 10.1 41.5 15.3 6.5
2015 3.8 2.7 2.0 1.3 1.3 11.1 48.4 16.8 6.0
2020 4.2 3.2 2.1 1.4 1.4 12.4 56.5 19.0 5.3
2025 4.7 3.7 2.6 1.6 1.5 14.1 66.8 21.9 4.6
2030 5.1 4.1 3.0 1.9 1.7 15.9 79.9 25.1 4.0
2035 5.4 4.6 3.5 2.3 2.1 17.7 93.9 28.4 3.5
2040 5.7 4.8 3.9 2.6 2.5 19.5 107.3 31.8 3.1
2045 6.4 5.2 4.1 3.0 2.9 21.6 121.4 36.4 2.8
2050 6.8 5.8 4.5 3.2 3.4 23.7 135.8 41.6 2.4
Note: Projections are undertaken based on vital rates calculated from the 2007 FRHS
By 2025, the old age dependency ratio will be 19.9, which is projected to almost double
by 2050 to 38.1. Similarly, the ageing index will be 60.6 in 2025 and is projected to be 124.5 in
2050. The potential support ratio, the number of people in the working age group per person
65 and older, will be 2.63 in 2050.

32 Socio-economic Characteristics of the Elderly |
Chapter III
Socio-economic Characteristics of the Elderly
3.1 Marital status
For older people, marital status plays a very important role in living conditions and well-
being. Older men are more likely than older women to still be married, because women marry
younger than men do and the incidence of widowhood is higher among women. In addition,
men are more likely to remarry after widowhood or divorce than women are. Globally, about
80 per cent of older men are married, compared to only 48 per cent of older women (United
Nations, 2009). In most societies, single and widowed elderly women are more vulnerable to
economic distress than are males who have lost a spouse (Légaré et al 2003).
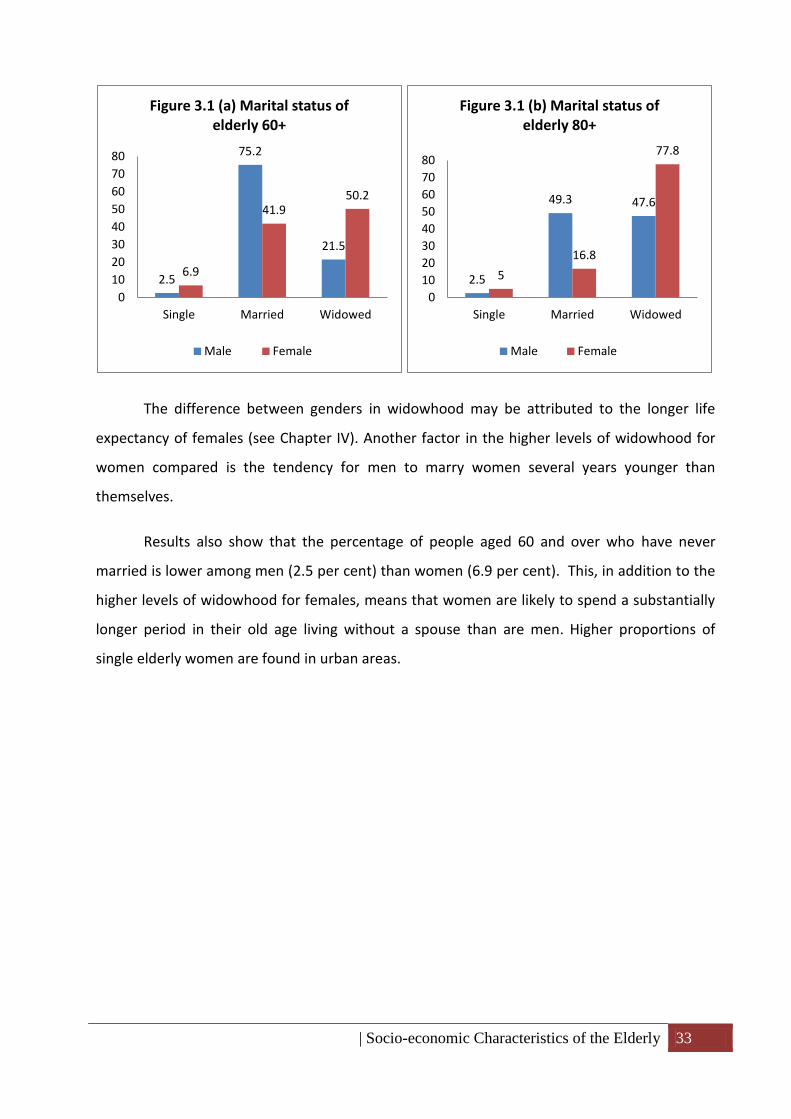
As seen in Figure 3.1a and 3.1b, the majority of elderly people in Myanmar were
married at the time of the 2007 FRHS. This may reflects an almost universal pattern of marriage
among Myanmar people in the past. Marriage has been culturally expected at the ‘proper’ age,
and remaining single until old age was uncommon. However, the majority of female elderly are
widows, while their male counterparts are mainly married. Most widowed women live with
family members, particularly their adult children (data not shown). In 2007, while 22 per cent
of men aged 60 and over are widowers, over 50 per cent of the women of that age were
widowed. Overall, elderly women are more than twice as likely as elderly men to be widowed.
This ratio increases with increasing age. Only 11.1 per cent of males aged 60-64 are widowed
and the proportion increases to 47.6 per cent for those 80 and older. For females, almost 35
per cent of those aged 60-64 are widowed and this increases to 77.8 per cent for those aged 80
and older. The proportion of divorced persons within the various age groups is negligible for
both sexes during the period 1973-2007.
There is a small minority of elderly women who have never married and many of these
women live alone in old age (44.7 per cent, data not shown in table). As the percentage of
women never married who are between the ages 45-49 is increasing, after several decades
there will be more unmarried elderly men and women in Myanmar. However, as women are
more likely than men to remain single, there is a need to ensure that elderly women receive
adequate support for their well-being in old age.
| Socio-economic Characteristics of the Elderly 33
The difference between genders in widowhood may be attributed to the longer life
expectancy of females (see Chapter IV). Another factor in the higher levels of widowhood for
women compared is the tendency for men to marry women several years younger than
themselves.
Results also show that the percentage of people aged 60 and over who have never
married is lower among men (2.5 per cent) than women (6.9 per cent). This, in addition to the
higher levels of widowhood for females, means that women are likely to spend a substantially
longer period in their old age living without a spouse than are men. Higher proportions of
single elderly women are found in urban areas.
2.5
75.2
21.5
6.9
41.9 50.2
0
10
20
30
40
50
60
70
80
Single Married Widowed
Figure 3.1 (a) Marital status of elderly 60+
Male Female
2.5
49.3 47.6
5
16.8
77.8
0
10
20
30
40
50
60
70
80
Single Married Widowed
Figure 3.1 (b) Marital status of elderly 80+
Male Female

34 Socio-economic Characteristics of the Elderly |
Table 3.1 Percentage distribution of marital status of the elderly by age, sex and place of residence.
Marital status
Union Urban Rural
60-64 65-69 70-74 75-79 80+ 60+ 60-64 65-69 70-74 75-79 80+ 60+ 60-64 65-69 70-74 75-79 80+ 60+
Male
Single 3.1 2.4 2.3 1.8 2.5 2.5 4.6 2.7 2.5 3.3 1.3 3.2 2.5 2.3 2.2 1.2 2.9 2.3
Married 84.8 79.0 72.5 65.4 49.3 75.2 86.4 80.6 76.6 65.4 58.4 77.8 84.1 78.3 71.0 65.4 45.7 74.1
Widowed 11.1 17.7 24.6 32.3 47.6 21.5 7.9 16.0 20.3 31.3 40.3 18.3 12.5 18.4 26.1 32.7 50.5 22.8
Divorced 0.9 0.9 0.7 0.6 0.6 0.8 1.1 0.7 0.6 0.0 0.0 0.7 0.8 1.0 0.7 0.8 0.8 0.8
Renounced 0.1 0.0 0.0 0.0 0.0 0.0 0.0 0.0 0.0 0.0 0.0 0.0 0.1 0.0 0.0 0.0 0.0 0.0
Total 1849 1565 1189 719 525 5847 546 444 320 211 149 1670 1303 1121 869 508 376 4177
Female
Single 8.1 6.7 6.1 7.6 5.0 6.9 9.7 9.0 9.0 9.9 6.2 9.0 7.4 5.7 4.9 6.6 4.4 6.0
Married 55.4 47.8 38.0 27.4 16.8 41.9 54.6 45.8 34.8 25.7 19.4 40.5 55.8 48.7 39.3 28.2 15.5 42.6
Widowed 34.8 44.9 55.1 64.5 77.8 50.2 32.5 44.4 55.8 63.7 73.7 49.1 35.9 45.1 54.8 64.8 79.7 50.7
Divorced 1.6 0.5 0.9 0.5 0.5 0.9 3.1 0.7 0.4 0.7 0.7 1.4 1.0 0.4 1.1 0.4 0.3 0.7
Renounced 0.0 0.1 0.0 0.0 0.0 0.0 0.1 0.2 0.0 0.0 0.0 0.1 0 0.1 0.0 0.0 0.0 0.0
Total 2286 1991 1583 974 881 7715 711 602 457 303 289 2362 1575 1389 1126 671 592 5353
Number 4135 3556 2772 1693 1406 13562 1257 1046 777 514 438 4032 2878 2510 1995 1179 968 9530

| Socio-economic Characteristics of the Elderly 35
3.2 Education
Educational attainment is an important indicator of well-being among the elderly,
making them less dependent and widening the scope of their experiences. Higher educational
attainment allows young individuals to prepare for old age by enhancing their ability to
accumulate resources. This reduces potential levels of individual and societal dependence.
Gender differences in literacy in the aged are striking, with 83 per cent of males literate,
with only 57.2 per cent of females so. Literacy levels in rural areas are lower than in urban
areas. The current educational profile of the elderly reflects the country’s educational system
and the accessibility to education during the first half of the twentieth century, when women
had more limited opportunities for education than men. This situation is reflected in the
literacy rate for elderly men, which is almost double that of elderly women (see Figure 3.2).
Compared with the working-age population (age 15-59), literacy rate varies little for men (83.0
for elderly and 88.6 for working-age people) but the gap between elderly and working-age
women is much wider: 57.2 for the elderly compared to 80.7 for the non-elderly. This low
literacy rate among the elderly population, especially in rural areas, needs to be taken into
account for any programme designed to provide information for this population group.
83.0
91.6
79.5
57.2
70.1
51.4
0.0
20.0
40.0
60.0
80.0
100.0
Union Urban Rural
Figure 3.2 Literacy rate for those aged 60 years and above,
by sex, 2007 FRHS
Male
Female
36 Socio-economic Characteristics of the Elderly |
Table 3.2 Percentage distribution of the highest level of education attained by age, sex and place
of residence
Level of education
Male Female Total
15-59 60+ 80+ 15-59 60+ 80+ 60+
Union
Literate 88.6 83.0 77.7 80.7 57.2 51.9 68.3
Illiterate 11.4 17.0 22.3 19.3 42.8 48.1 31.7
Total 100.0 100.0 100.0 100.0 100.0 100.0 100.0
No education 5.3 13.5 17.3 8.9 31.7 38.0 23.6
Primary 37.9 25.3 24.2 45.5 32.3 28.0 29.2
Middle School 25.6 14.3 9.2 18.0 7.8 5.8 10.7
High School 15.3 8.7 4.9 12.4 3.6 1.2 5.9
University 8.3 3.0 0.2 10.7 1.4 0.2 2.1
Others 7.7 35.2 44.2 4.4 23.2 26.7 28.6
Total 100.0 100.0 100.0 100.0 100.0 100.0 100.0
Number 45025 5675 509 51259 7071 805 12746
Urban
Literate 94.6 91.6 85.9 90.1 70.1 65.7 79.0
Illiterate 5.4 8.4 14.1 9.9 29.9 34.3 21.0
Total 100.0 100.0 100.0 100.0 100.0 100.0 100.0
No education 2.2 5.4 9.0 4.1 19.0 26.5 13.2
Primary 18.6 19.0 20.1 26.4 38.2 36.9 29.9
Middle School 29.4 26.8 20.8 21.6 16.6 14.6 20.9
High School 27.6 22.5 16.0 22.0 9.6 3.7 15.1
University 20.1 9.6 0.7 24.4 3.8 0.4 6.3
Others 2.1 16.8 33.3 1.5 12.8 17.9 14.5
Total 100.0 100.0 100.0 100.0 100.0 100.0 100.0
Number 12327 1634 144 14779 2180 268 3814
Rural
Literate 86.4 79.5 74.5 77.0 51.4 45.1 63.7
Illiterate 13.6 20.5 25.5 23.0 48.6 54.9 36.3
Total 100.0 100.0 100.0 100.0 100.0 100.0 100.0
No education 6.4 16.8 20.5 10.9 37.3 43.8 28.0
Primary 45.2 27.9 25.8 53.2 29.7 23.5 28.9
Middle School 24.2 9.2 4.7 16.6 3.9 1.5 6.3
High School 10.7 3.1 0.5 8.5 1.0 0.0 1.9
University 3.8 0.4 0.0 5.2 0.3 0.2 0.3
Others 9.8 42.7 48.5 5.5 27.8 31.1 34.6
Total 100.0 100.0 100.0 100.0 100.0 100.0 100.0
Number 32698 4041 365 36480 4891 537 8932
| Socio-economic Characteristics of the Elderly 37
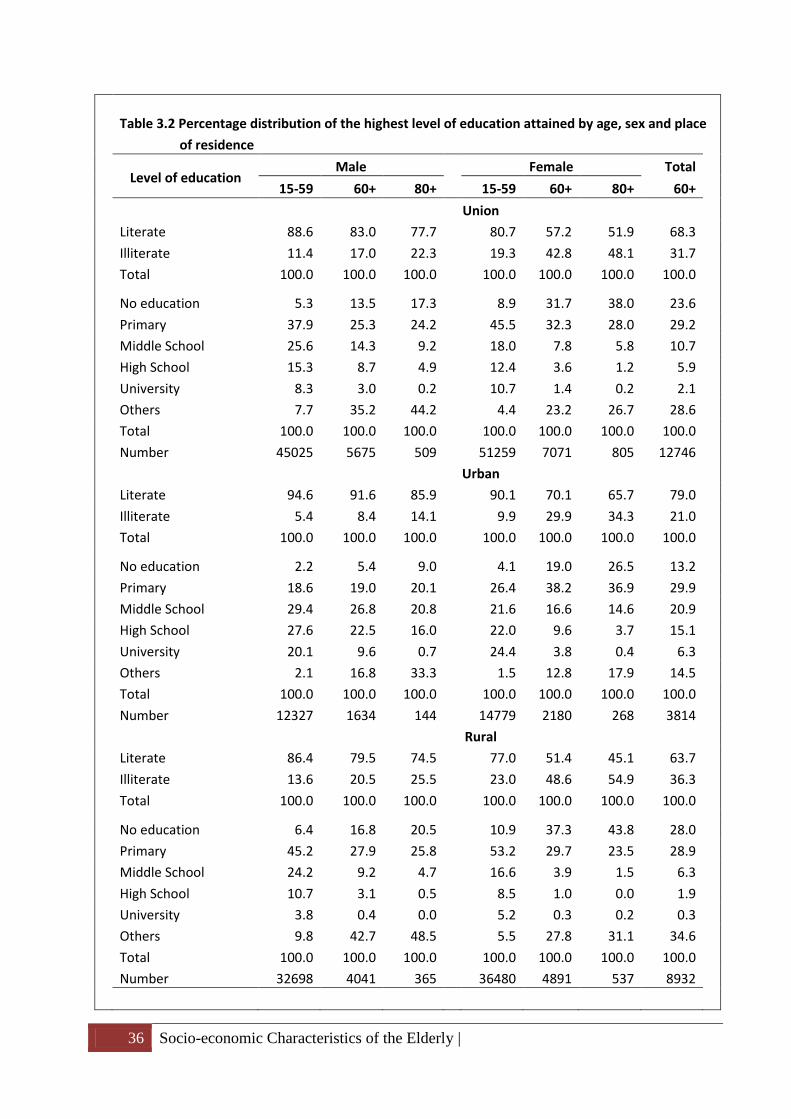
In Table 3.2, it is visible that the percentage of people with no education is higher
among women than men. This differential exists irrespective of age. However, the differences
between generations are clearer among women than men. Non-elderly males with no
education comprise just 5.3 per cent of the population, while 13.5 per cent of elderly males
have no education. The comparable levels of non-elderly and elderly females are 8.9 and 31.7
per cent respectively. Elderly women are in a particularly disadvantaged position regarding
education when compared to both other elderly men and younger women.
This disadvantage is even greater in rural areas. In urban areas, where there is better
access to the education system, 5.4 per cent of elderly males and 19.0 per cent of elderly
females have no education, compared with rural areas, where 16.8 per cent elderly men and
37.3 per cent of elderly women have no education. However, this gender gap in the elderly will
narrow as younger generations, who have higher access to education, ages.
At the national level, less than 1.4 per cent of female elderly had a university-level
education, compared with 3 per cent of their male counterparts. A primary school education is
the most common level of education for the older generations. In both urban and rural areas,
male elderly have higher levels of schooling than do female elderly.
3.3 Active ageing and the employment of older persons
3.3.1 Economically active elderly
Economic activity is a measure of the economic status of the elderly. Globally, the
percentage of male elderly in the labour force is double that of the female elderly, at 40 per
cent vs. 20 per cent. Countries with high per capita income tend to have a lower labour force
participation rate among older persons. In developed countries, just 24 per cent of men aged
60 or over are economically active, whereas 47 per cent of older men are economically active
in developing countries. Among older women, 14 per cent are economically active in
developed countries but 24 per cent work in developing countries. Older persons in developing
countries work until advanced age because they are not covered under existing social security
systems or because even when covered, they receive relatively low pensions (United Nations,
2009).

38 Socio-economic Characteristics of the Elderly |
The household questionnaire of the 2007 FRHS provided information on employment
during the 14 days prior to the survey, thus providing a picture of the levels of economically
active elderly in Myanmar. People who worked during that time were treated as employed and
otherwise were classified as unemployed. For those employed, further information on the type
of occupation, the activity of the establishment where they worked, and their employment
status were obtained. For the unemployed, reasons for not working were asked. The reasons
were pre-coded and one reason was ‘seeking a job’. The economically-active population in the
2007 FRHS, and also in this paper, included those who were working as well as those who were
seeking work. Notably, housewives were not considered economically active because their
work was not considered productive.
The economic activity among the elderly reflects the economic, social, and cultural
situations of the population. The ‘economic activity rate’ of the elderly population refers to the
number of economically active elderly expressed as a proportion of the total population aged
60 and above. In Figure 3.4, the elderly economic activity rate is displayed for men and women
by current place of residence.
52.7
37.0
59.0
25.6
15.0
30.3
0.0
10.0
20.0
30.0
40.0
50.0
60.0
70.0
Union Urban Rural
Figure 3.3 Economic Activity Rate of the elderly by sex and residence, 2007 FRHS
Male
Female
At all working ages, the economic activity rate is higher for men than women, and
higher in rural than urban areas (Department of Population, 2009). In the elderly population,
about one third remains economically active well into old age. Elderly men tend to be more
| Socio-economic Characteristics of the Elderly 39
economically active than elderly women; over half of men aged 60 year and over are in the
labour force, while only 26 per cent of elderly women were. For both elderly men and women,
economic activity rates are much higher in rural than in urban areas. This probably reflects
both the greater economic need for the rural elderly to remain economically active, and the
greater availability of employment, primarily in agriculture, for the rural elderly compared to
urban elderly.
Noticeable proportions—15 per cent of the elderly male aged 80 and over—remain in
the labour force. Although many older persons are probably working because of economic
need rather than desire, the promotion of employment opportunities for the elderly will
decrease the burden of care for families and increase the independence of the elderly.
As seen in Table 3.4, levels of economic activity drop with increasing age. The economic
activity rates for both elderly men and women decrease significantly with increasing age. For
both sexes, the economic activity rate decreased 9 percentage points from 54 per cent at age
60-64 to 45 per cent at ages 65-69, and then decreased a further 19 percentage points to 27
per cent for the 70-74 age group. The decrease in economic activity is greater for women than
for men. A similar pattern is found in both urban and rural areas. Among the oldest old, a small
minority remain economically active, with slightly over 8 per cent of the elderly population
aged 80 and over engaged in economic activities. It is clear that with increasing age, there is a
switch from economic contribution to economic dependency. As a higher proportion of the
elderly become concentrated in the oldest old ages, this will be an issue of increasing concern
for policy and programmes.
In Myanmar, retirement age from public service is 60 years. Upon retirement from
service, retirees are entitled to a gratuity and pension prescribed under the relevant rules and
regulations. The state may continue to employ the retired skilled and experienced personnel or
appoint them as advisors. A large number of elderly people are now serving in important
positions in NGOs, voluntary social organisations, companies, and business firms. Through
active involvement in the social, economic, and religious sectors of the country, they are able
to continue to lead an active life in the society.

40 Socio-economic Characteristics of the Elderly |
Table 3.3 Economic activity rates of the elderly by age, sex and place of residence
Age group
Union Urban Rural
Male Female Total Male Female Total Male Female Total
60-64 72.1 40.0 54.4 52.0 25.7 37.2 80.5 46.5 61.9
65-69 62.6 31.5 45.2 41.9 15.9 27.0 70.8 38.3 52.8
70-74 38.5 17.4 26.5 24.4 10.1 16.0 43.7 20.4 30.6
75-79 32.7 12.3 21.0 26.5 7.6 15.4 35.2 14.5 23.4
80+ 14.7 4.3 8.2 9.4 2.1 4.6 16.8 5.4 9.8
Total 52.7 25.6 37.3 37.0 15.0 24.1 59.0 30.3 42.9
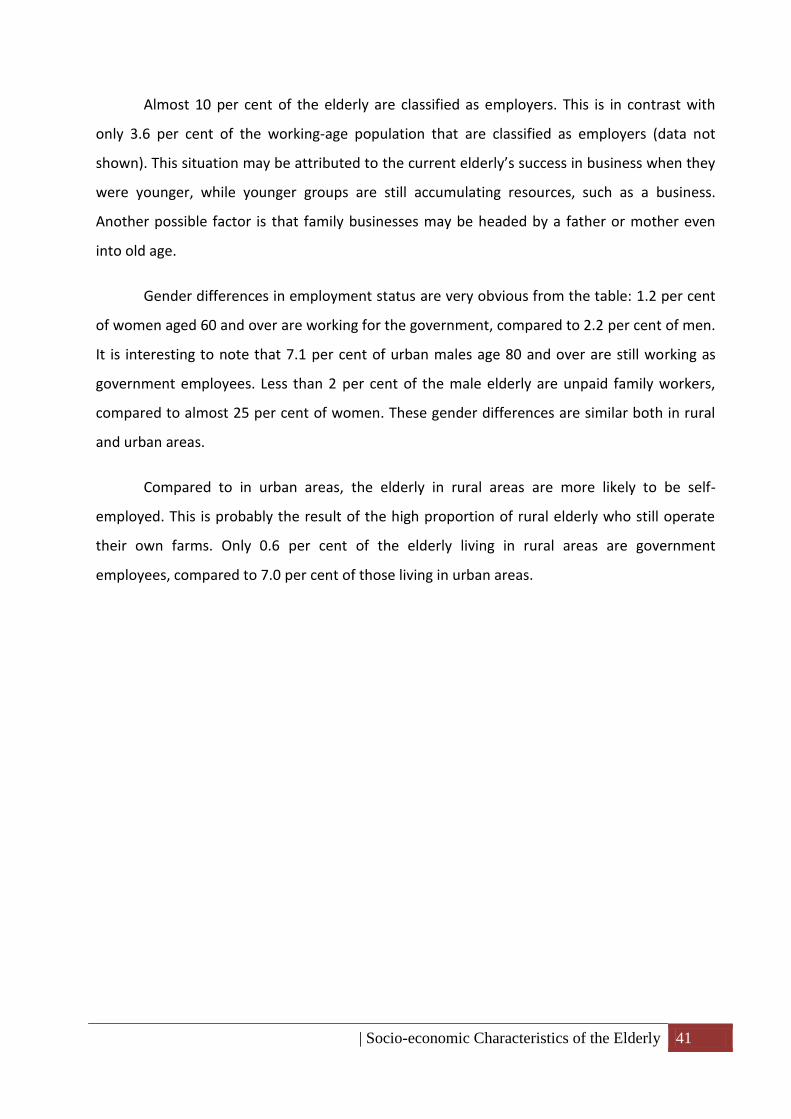
3.3.2 Employment status
Table 3.4 shows the employment status of the elderly by age, sex, and place of
residence. In this paper, ‘employer’ refers to the elderly who run a business and hire more than
four employees; ‘self-employed’ refers to the elderly who also run a business but have less
than four employees; ‘government employee’ and ‘private employee’ are defined as people
working for the government and private sectors respectively. The term ‘others’ includes all
those who are not in other specified categories. Housewives, who were treated in the last
section as not economically active, have been included here as ‘unpaid family worker’.
In Table 3.4, elderly self-employed workers stands out as the largest group among men
and women in rural as well as in urban areas. The second largest group is employers in urban
areas (11.6 per cent) and unpaid family worker in the rural areas (11.8 per cent). Out of the
total population of all ages, self-employed workers also share the highest percentage among all
employment statuses – about 47 per cent. However, the second-ranked employment status in
the working age population was unpaid family worker at 23.6 per cent, while the third was
private employee, at 19.4 per cent (data not shown). Compared to the working-age population,
the people aged 60 and over were less likely to be either an unpaid family worker or a private
employee, with only 10.6 per cent classified as unpaid family workers and 8.7 per cent as
private employees.
| Socio-economic Characteristics of the Elderly 41
Almost 10 per cent of the elderly are classified as employers. This is in contrast with
only 3.6 per cent of the working-age population that are classified as employers (data not
shown). This situation may be attributed to the current elderly’s success in business when they
were younger, while younger groups are still accumulating resources, such as a business.
Another possible factor is that family businesses may be headed by a father or mother even
into old age.
Gender differences in employment status are very obvious from the table: 1.2 per cent
of women aged 60 and over are working for the government, compared to 2.2 per cent of men.
It is interesting to note that 7.1 per cent of urban males age 80 and over are still working as
government employees. Less than 2 per cent of the male elderly are unpaid family workers,
compared to almost 25 per cent of women. These gender differences are similar both in rural
and urban areas.
Compared to in urban areas, the elderly in rural areas are more likely to be self-
employed. This is probably the result of the high proportion of rural elderly who still operate
their own farms. Only 0.6 per cent of the elderly living in rural areas are government
employees, compared to 7.0 per cent of those living in urban areas.
42 Socio-economic Characteristics of the Elderly |
Table 3.4 Percentage distribution of employment status of the employed elderly population by age, sex and place of residence
Employment Status
Male Female Total
60-64 65-69 70-74 75-79 80+ 60+ 60-64 65-69 70-74 75-79 80+ 60+ 60+
Union
Employer 7.5 12.3 14.9 16.6 16.9 11.0 4.8 7.4 8.7 16.7 21.6 7.2 9.5
Self-employed 75.6 74.5 73.0 68.9 71.4 74.3 57.0 57.9 59.8 52.5 54.1 57.4 67.7
Govt. employee 3.4 1.6 0.7 1.7 1.3 2.2 1.9 0.6 0.7 0.8 0.0 1.2 1.8
NGO employee 1.5 0.9 1.8 1.3 1.3 1.3 0.9 0.8 0.7 0.0 2.7 0.8 1.1
Private employee 10.1 9.1 8.1 8.9 5.2 9.3 9.0 7.0 5.4 10.8 5.4 7.9 8.7
Unpaid family worker 1.4 1.3 1.3 2.6 2.6 1.5 25.9 25.6 23.6 18.3 13.5 24.8 10.6
Other 0.6 0.2 0.2 0.0 1.3 0.4 0.5 0.6 1.1 0.8 2.7 0.7 0.5
Total 100.0 100.0 100.0 100.0 100.0 100.0 100.0 100.0 100.0 100.0 100.0 100.0 100.0
Number 1332 978 456 235 77 3078 914 625 276 120 37 1972 5050
Urban
Employer 9.9 14.1 20.8 19.6 14.3 13.5 3.8 10.6 10.9 26.1 20.0 8.3 11.6
Self-employed 59.7 56.5 59.7 57.1 64.3 58.6 64.3 70.2 65.2 60.9 60.0 65.7 61.2
Govt. employee 10.6 7.6 1.3 5.4 7.1 8.0 7.7 2.1 2.2 4.3 0.0 5.1 7.0
NGO employee 4.2 3.8 3.9 1.8 0.0 3.7 3.3 2.1 2.2 0.0 0.0 2.6 3.3
Private employee 14.1 16.3 11.7 10.7 14.3 14.2 6.0 4.3 8.7 8.7 0.0 6.0 11.2
Unpaid family worker 1.4 1.6 2.6 5.4 0.0 2.0 14.3 9.6 6.5 0.0 20.0 11.1 5.3
Other 0.0 0.0 0.0 0.0 0.0 0.0 0.5 1.1 4.3 0.0 0.0 1.1 0.4
Total 100.0 100.0 100.0 100.0 100.0 100.0 100.0 100.0 100.0 100.0 100.0 100.0 100.0
Number 283 184 77 56 14 614 182 94 46 23 5 350 964
Rural
Employer 6.9 11.8 13.7 15.6 17.5 10.4 5.1 6.8 8.3 14.4 21.9 7.0 9.1
Self-employed 79.9 78.7 75.7 72.6 73.0 78.2 55.2 55.7 58.7 50.5 53.1 55.5 69.2
Govt. employee 1.4 0.3 0.5 0.6 0.0 0.8 0.4 0.4 0.4 0.0 0.0 0.4 0.6
NGO employee 0.8 0.3 1.3 1.1 1.6 0.7 0.3 0.6 0.4 0.0 3.1 0.4 0.6
Private employee 9.0 7.4 7.4 8.4 3.2 8.0 9.7 7.5 4.8 11.3 6.3 8.3 8.1
Unpaid family worker 1.3 1.3 1.1 1.7 3.2 1.3 28.8 28.4 27.0 22.7 12.5 27.7 11.8
Other 0.8 0.3 0.3 0.0 1.6 0.5 0.5 0.6 0.4 1.0 3.1 0.6 0.5
Total 100.0 100.0 100.0 100.0 100.0 100.0 100.0 100.0 100.0 100.0 100.0 100.0 100.0
Number 1049 794 379 179 63 2464 732 531 230 97 32 1622 4086

| Socio-economic Characteristics of the Elderly 43
3.3.3 Occupations
This analysis of occupations focuses on people employed at the time of the survey. The
occupational distribution of the elderly population is shown in Table 3.5. As agriculture is the
main occupation in Myanmar, a majority of the employed (64 per cent) are engaged in this
work, with 66 per cent of employed elderly men and 61 per cent of employed elderly women
working in the sector. There is a rural-urban differential in the occupational structure: in all
occupational categories except agricultural workers, the proportional share of workers is
greater in urban than rural areas, and this is true for men as well as for women.
The share of white collar occupations, namely administrators, professionals, technicians
and clerks, is larger among elderly males, while the share of blue collar workers is substantially
higher among elderly females. In urban areas, the proportion of the employed population that
consists of white collar workers is high (9.6 per cent) compared to rural areas (only 0.8 per
cent). More than 50 per cent of the urban elderly are blue collar workers, with the share of
service workers the largest at 33.5 per cent, followed by craft and related workers at 10.8 per
cent, and technicians at 5.7 per cent. In rural areas, blue collar workers comprise only 10.6 per
cent of the employed population.

44 Socio-economic Characteristics of the Elderly |
Table 3.5 Percentage distribution of current occupation of employed elderly population by age, sex and place of residence
Occupation
Male Female Total
60-64 65-69 70-74 75-79 80+ 60+ 60-64 65-69 70-74 75-79 80+ 60+
Union
White Collar 3.2 3.1 2.4 3.8 3.9 3.1 2.0 1.4 0.7 1.7 2.7 1.6 2.5
Blue Collar 19.0 15.8 16.9 20.9 11.7 17.6 23.7 18.2 20.3 23.3 24.3 21.5 19.1
Elementary worker 15.5 13.9 7.5 9.4 11.7 13.3 17.9 14.2 16.3 15.0 5.4 16.1 14.4
Agricultural worker 62.2 67.2 73.0 66.0 72.7 65.9 56.3 66.1 62.7 60.0 67.6 60.8 63.9
Others 0.2 0.0 0.2 0.0 0.0 0.1 0.0 0.0 0.0 0.0 0.0 0.0 0.1
Total 100.0 100.0 100.0 100.0 100.0 100.0 100.0 100.0 100.0 100.0 100.0 100.0 100.0
Number 1332 978 456 235 77 3078 914 625 276 120 37 1972 5050
Urban
White Collar 10.6 12.0 10.4 14.3 * 11.2 7.7 7.4 2.2 8.7 * 6.9 9.6
Blue Collar 58.3 48.4 51.9 57.1 * 53.9 59.9 52.1 54.3 60.9 * 57.4 55.2
Elementary worker 15.2 18.5 5.2 3.6 * 14.0 24.7 24.5 28.3 13.0 * 24.0 17.6
Agricultural worker 15.2 21.2 31.2 25.0 * 20.4 7.7 16.0 15.2 17.4 * 11.7 17.2
Others 0.7 0.0 1.3 0.0 * 0.5 0.0 0.0 0.0 0.0 * 0.0 0.3
Total 100.0 100.0 100.0 100.0 * 100.0 100.0 100.0 100.0 100.0 * 100.0 100.0
Number 283 184 77 56 * 614 182 94 46 23 * 350 964
Rural
White Collar 1.1 1.0 0.8 0.6 3.2 1.1 0.5 0.4 0.4 0.0 3.1 0.5 0.8
Blue Collar 8.4 8.3 9.8 9.5 6.3 8.6 14.8 12.2 13.5 14.4 15.6 13.7 10.6
Elementary worker 15.6 12.8 7.9 11.2 9.5 13.1 16.3 12.4 13.9 15.5 6.3 14.4 13.6
Agricultural worker 74.8 77.8 81.5 78.8 81.0 77.3 68.4 75.0 72.2 70.1 75.0 71.3 74.9
Others 0.0 0.0 0.0 0.0 0.0 0.0 0.0 0.0 0.0 0.0 0.0 0.0 0.0
Total 100.0 100.0 100.0 100.0 100.0 100.0 100.0 100.0 100.0 100.0 100.0 100.0 100.0
Number 1049 794 379 179 63 2464 732 531 230 97 32 1622 4086
| Socio-economic Characteristics of the Elderly 45
3.4 Reasons for being economically inactive
As 37 per cent of the aged population is economically active, we can assume that this
portion of the ageing population may not have serious health problems. However, another
area in need of exploration is how many ageing people who are economically inactive are still
physically and mentally active. It is therefore important to understand the reasons for this
segment of the population to not be working in order to plan social support programmes for
the elderly.
During the 14 days prior to the survey, those people who did not work were treated as
economically inactive. The reasons for their not working were asked - these were pre-coded as
doing housework, being disabled, having income, ill health, being a dependent, job seeking,
and other. ‘Having income’ refers to those who receive money from any source, meaning that
those people did not have to work. For the elderly retired from government services, ‘income’
may mean a pension. Those who were ‘dependent’ were those who were taken care of, either
physically or economically, by others, including their close relatives. As seen in a previous
section, being economically inactive is not uncommon for the elderly population.
In table 3.6, we can clearly see that among the reasons for being inactive, the most
frequent response was being dependent, at 69.3 per cent. It is probable that most of these
elderly were being taken care of by their adult children. However, being a dependent does not
necessarily mean that those people were not active in other ways, such as in social or religious
activities. They may have also been active members looking after the welfare of the household,
on standby for their economically active family members in case of an emergency, or they may
be doing household work.
The percentage of elderly reporting that they are dependent as the reason for being
economically inactive is higher in rural than urban areas for both men and women. In rural
areas, when work is no longer possible, most elderly do not have the resources to look after
themselves and therefore rely on others, particularly their families, for assistance. In urban
areas, many elderly have access to other resources.

46 Socio-economic Characteristics of the Elderly |
Table 3.6 Percentage distribution for reasons for not working of the elderly by age, sex and
place of residence
Reason for not
working
Male Female Total
60+
60-64 65-69 70-74 75-79 80+ 60+ 60-64 65-69 70-74 75-79 80+ 60+
Union
Housework 1.7 2.0 1.4 0.4 0.7 1.3 32.6 24.4 12.7 8.4 3.1 18.2 12.7
Disabled 3.5 2.6 0.8 1.4 0.9 1.8 0.7 0.7 0.5 0.5 0.4 0.6 1.0
Have income 32.1 25.9 22.4 14.9 9.8 21.6 7.9 6.1 5.9 6.8 3.2 6.2 11.2
Ill health 8.3 5.3 6.4 9.3 10.9 7.8 2.6 3.6 4.3 5.9 7.0 4.3 5.5
Dependent 53.4 63.0 68.3 73.8 77.5 66.8 55.9 64.9 76.3 78.5 86.1 70.5 69.3
Seeking job 0.2 0.3 0.3 0.0 0.0 0.2 0.1 0.2 0.0 0.0 0.1 0.1 0.1
Other 0.8 0.9 0.4 0.2 0.2 0.5 0.2 0.1 0.3 0.0 0.1 0.2 0.3
Total 100.0 100.0 100.0 100.0 100.0 100.0 100.0 100.0 100.0 100.0 100.0 100.0 100.0
Number 517 587 733 484 448 2769 1372 1366 1307 854 844 5743 8512
Urban
Housework 1.5 1.5 1.2 0.0 0.0 1.0 31.0 23.0 13.6 7.5 2.5 18.1 12.3
Disabled 4.9 4.2 2.1 1.9 2.2 3.3 1.3 1.6 0.2 0.4 0.7 0.9 1.8
Have income 43.7 37.7 36.2 25.8 17.0 34.5 11.9 9.3 7.5 7.5 3.5 8.5 17.5
Ill health 6.5 3.8 2.9 7.1 5.9 5.0 2.3 2.6 3.4 2.5 5.3 3.0 3.7
Dependent 42.2 50.4 56.4 65.2 74.8 55.0 53.1 63.0 74.9 82.1 87.7 69.0 64.2
Seeking job 0.4 0.8 0.4 0.0 0.0 0.4 0.2 0.4 0.0 0.0 0.4 0.2 0.3
Other 0.8 1.5 0.8 0.0 0.0 0.8 0.2 0.2 0.2 0.0 0.0 0.1 0.4
Total 100.0 100.0 100.0 100.0 100.0 100.0 100.0 100.0 100.0 100.0 100.0 100.0 100.0
Number 263 260 243 155 135 1056 529 508 411 280 284 2012 3068
Rural
Housework 2.0 2.4 1.4 0.6 1.0 1.5 33.6 25.2 12.3 8.9 3.4 18.2 12.9
Disabled 2.0 1.2 0.2 1.2 0.3 0.9 0.4 0.1 0.7 0.5 0.2 0.4 0.5
Have income 20.1 16.5 15.5 9.7 6.7 13.7 5.5 4.3 5.1 6.4 3.0 4.9 7.7
Ill health 10.2 6.4 8.2 10.3 13.1 9.5 2.7 4.2 4.7 7.5 7.9 5.0 6.4
Dependent 65.0 73.1 74.3 77.8 78.6 74.1 57.7 66.0 76.9 76.7 85.4 71.3 72.2
Seeking job 0.0 0.0 0.2 0.0 0.0 0.1 0.0 0.1 0.0 0.0 0.0 0.0 0.0
Other 0.8 0.3 0.2 0.3 0.3 0.4 0.2 0.1 0.3 0.0 0.2 0.2 0.2
Total 100.0 100.0 100.0 100.0 100.0 100.0 100.0 100.0 100.0 100.0 100.0 100.0 100.0
Number 254 327 490 329 313 1713 843 858 896 574 560 3731 5444
| Socio-economic Characteristics of the Elderly 47
The fact that in urban areas, many elderly have access to other resources is reflected in
the second and third ranked reasons for being economically inactive: doing housework (12.7
per cent) and having income (11.2 per cent). Having an income is more commonly cited in
urban areas, while housework is more commonly cited in rural areas. Gender differences are
seen very clearly in the distribution between these two categories. For women aged 60 and
over, undertaking housework was the second ranked reason (18.2 per cent) and having income
was the third ranked reason (6.2 per cent) for not working or looking for a job. In contrast, 21.6
per cent of the elderly male population aged 60 and over cited having an income for not
working, while only 1.3 per cent said that the reasons for not working was undertaking
housework.
Having an income was a much more prevalent reason for not working among the
elderly living in urban areas than in rural areas. A significant proportion of the urban elderly
likely have access to government pensions, allowing them to take care of themselves.
However, this access to pensions is largely confined to males. Irrespective of age or place of
residence, elderly women are much more likely than elderly men to be a dependent. Where
females are not dependent, the main reason they are not working is that they are engaged in
housework, and hence it could be argued that they remain in a type of dependent situation. A
total of 6.5 per cent of the elderly are not working, either because of their being disabled or
being in ill health. This is more pronounced among elderly men, both for those in the younger
age groups and the oldest of the old.
The analysis of the economic situation of the elderly presented in the previous section
has been hampered by the limitations of the data. Future research should focus on reasons for
working, working conditions, type of work, and sources of income. More information is also
required on disability and ill health. Such information is required to fully understand the
support systems of the elderly.
48 Chapter IV |
Chapter IV
Changing Family Structures and Living Arrangements
4.1 Changes in family structure
The ageing of the population of Myanmar is not as dramatic as that being experienced
by other Asian countries. It will, however, remain the dominant change that Myanmar will
experience in its population over the first half of this century. The high proportion of people
never married in the younger generations together with an increase in the trend to remain
single will likely mean that more government support care services will be needed for these
elderly. To ascertain the potential number of elderly in this situation requires detailed
information about changes in family structure and in the living situations of older populations
and their families in order to ensure that the elderly continue to be well cared for.
Changes in the structure and formation of the family are central to discussions of the
dynamics of social change within a country. The structure of the family may be expected to
change drastically asa nation develops. While many older people have children, grandchildren,
and siblings, in countries with very low birth rates, future generations will have few, if any,
siblings. As a result of this trend, people will get less familial care and support as they age. This
in turn has ramifications for providing care to older people.
Since Myanmar society is mostly made up of extended families, every elderly people
receive care from their children, grandchildren, and relatives. It is not uncommon for one child,
often the eldest son or daughter, to remain unmarried in order to take care of their parents in
their old age (Department of Population, Myanmar, 2001, p. 24). In such a family structure,
elders often have authority over family members through control of family resources, such as a
family enterprise or land. The following section attempts to quantify the proportion of elderly
living in this situation.

| Changing Family Structures and Living Arrangements 49
4.1.1 Household size and relationship to head of household
In Myanmar, household size has remained more or less constant at around five people
from 1973 to 2007. The mean household size of the elderly is 5.1 (see Table 4.1), with the
mean household size slightly higher for elderly males than females (5.2 vs. 5.0). The data from
this table also confirm that elderly women are more likely than elderly men to be living in
single-member households.
Table 4.1 Percentage distribution of the relationship to head of
household and size of the household of persons aged 60 and
above by sex
Relationship to Head of household
Male Female Total
Head 92.2 42.0 63.6
Spouse 0.5 37.6 21.6
Son/daughter 0.2 0.6 0.4
Son/daughter in law 0.2 0.0 0.1
Parent 3.8 11.1 7.9
Other relative 2.7 7.8 5.6
None - Relative 0.5 0.9 0.7
Total 100.0 100.0 100.0
Size of Household
1 2.6 4.9 3.9
2 10.6 11.5 11.1
3 13.7 14.0 13.9
4 16.2 15.8 16.0
5 16.5 15.8 16.1
6 14.1 13.5 13.8
7 9.6 9.2 9.4
8 7.1 6.3 6.6
9+ 9.7 8.8 9.2
Total 100.0 100.0 100.0
Mean household size 5.2 5.0 5.1
Number 5847 7715 13562
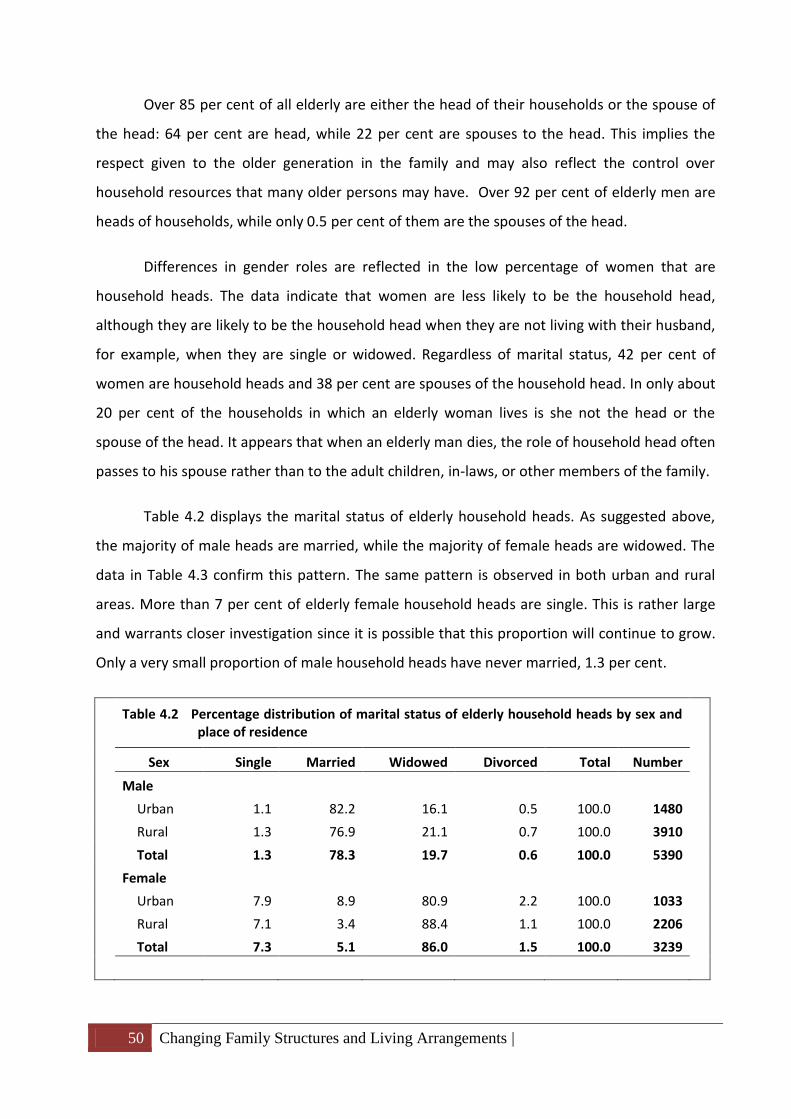
50 Changing Family Structures and Living Arrangements |
Over 85 per cent of all elderly are either the head of their households or the spouse of
the head: 64 per cent are head, while 22 per cent are spouses to the head. This implies the
respect given to the older generation in the family and may also reflect the control over
household resources that many older persons may have. Over 92 per cent of elderly men are
heads of households, while only 0.5 per cent of them are the spouses of the head.
Differences in gender roles are reflected in the low percentage of women that are
household heads. The data indicate that women are less likely to be the household head,
although they are likely to be the household head when they are not living with their husband,
for example, when they are single or widowed. Regardless of marital status, 42 per cent of
women are household heads and 38 per cent are spouses of the household head. In only about
20 per cent of the households in which an elderly woman lives is she not the head or the
spouse of the head. It appears that when an elderly man dies, the role of household head often
passes to his spouse rather than to the adult children, in-laws, or other members of the family.
Table 4.2 displays the marital status of elderly household heads. As suggested above,
the majority of male heads are married, while the majority of female heads are widowed. The
data in Table 4.3 confirm this pattern. The same pattern is observed in both urban and rural
areas. More than 7 per cent of elderly female household heads are single. This is rather large
and warrants closer investigation since it is possible that this proportion will continue to grow.
Only a very small proportion of male household heads have never married, 1.3 per cent.
Table 4.2 Percentage distribution of marital status of elderly household heads by sex and
place of residence
Sex Single Married Widowed Divorced Total Number
Male
Urban 1.1 82.2 16.1 0.5 100.0 1480
Rural 1.3 76.9 21.1 0.7 100.0 3910
Total 1.3 78.3 19.7 0.6 100.0 5390
Female
Urban 7.9 8.9 80.9 2.2 100.0 1033
Rural 7.1 3.4 88.4 1.1 100.0 2206
Total 7.3 5.1 86.0 1.5 100.0 3239

| Changing Family Structures and Living Arrangements 51
Table 4.3 Percentage distribution of households headed by elderly men compared to elderly women (ever and never married) by size of household and place of residence
HH size Men EMW NMW Total
Number of case
Union
1 28.4 59.2 12.4 100.0 532
2 55.9 39.7 4.4 100.0 1091
3 60.5 36.4 3.1 100.0 1280
4 63.4 34.3 2.3 100.0 1400
5 65.5 32.7 1.7 100.0 1326
6 70.1 28.8 1.1 100.0 1071
7 70.0 28.6 1.4 100.0 711
8 72.2 26.8 1.0 100.0 493
9+ 68.0 31.7 0.3 100.0 726
Total 62.5 34.8 2.8 100.0 8630
Urban
1 24.3 57.0 18.7 100.0 107
2 54.8 39.1 6.1 100.0 294
3 56.3 39.3 4.4 100.0 364
4 58.2 38.9 2.8 100.0 388
5 62.9 35.1 2.0 100.0 402
6 69.3 29.6 1.1 100.0 277
7 62.4 36.7 0.9 100.0 218
8 65.5 32.2 2.3 100.0 177
9+ 57.7 42.3 0.0 100.0 286
Total 58.9 37.8 3.3 100.0 2513
Rural
1 29.4 59.8 10.8 100.0 425
2 56.3 39.9 3.8 100.0 797
3 62.1 35.3 2.6 100.0 916
4 65.4 32.5 2.1 100.0 1012
5 66.7 31.7 1.6 100.0 924
6 70.4 28.5 1.1 100.0 794
7 73.4 24.9 1.6 100.0 493
8 75.9 23.7 0.3 100.0 316
9+ 74.8 24.8 0.5 100.0 440
Total 63.9 33.5 2.6 100.0 6117
Note: EMW - Ever-married women; NMW – Never-married women

52 Changing Family Structures and Living Arrangements |
As household size increases, elderly women are less likely than elderly men to be heads
of household (see Table 4.3). Women, either ever- or never married, are most likely to be
household heads when the household size is small. Single-member households are more
common for women who have ever been married, most likely a result of them living alone after
their spouses have died or of having never married. Among large households, the percentage
of women, either ever- or never-married, being the head of household is smaller than for the
respective male populations. This means that when there are other male family members
available, women are unlikely to be the head of their household.
Attention must be paid to the special requirements of elderly female-headed
households. We could hypothesise that elderly female-headed households experience greater
economic hardship than male-headed households, since it appears that most older women
only take the headship when other family members are not available. This is an indication that
households with elderly females as heads have more limited family support. The older age and
lower levels of education of female heads are also likely to contribute to more limited
economic activity.
4.1.2 Proportion of people never married
Table 4.4 shows changes in the proportions of people never married by broad age
group and sex between 1973 and 2007. This table clearly shows that the proportion never
married has increased gradually for both men and women. The increasing proportion of people
never married over the last 30 years will lead to changes in the family structure in Myanmar.
The proportion of never married (PNM) men aged 45-49 and women aged 45-49 rose overall
between 1973 to 2007: 3.5 per cent and 5.9 per cent in 1973, 3.8 per cent and 5.9 per cent in
1983, 4.3 per cent and 9.1 per cent in 1991, and then 7.5 per cent and 14.8 per cent in 2007.
The rising proportion of those never married, combined with a continued rise in the age of
marriage has contributed towards a fall in the level of fertility.

| Changing Family Structures and Living Arrangements 53
Table 4.4 Proportion never married by age, sex and residence 1973-2007
Year Male Female
15-19 20-24 45-49 15-19 20-24 45-49
Union
1973 92.2 55.2 3.5 78.0 35.5 5.9
1983 93.3 60.1 3.8 83.2 42.1 5.9
1991 96.7 69.9 4.3 89.3 56.0 9.1
2001 97.4 75.4 5.7 91.6 64.9 11.8
2007 95.6 76.7 7.5 92.8 67.9 14.8
Urban
1973 93.3 65.8 4.5 81.3 42.8 7.6
1983 92.5 67.7 4.7 85.6 50.5 7.8
1991 97.3 77.1 5.6 92.2 66.5 11.1
2001 97.5 80.3 9.1 92.6 70.9 16.7
2007 96.6 79.5 13.4 93.4 72.1 20.3
Rural
1973 91.9 51.4 3.2 76.9 33.1 5.3
1983 93.6 57.2 3.5 82.3 39.0 5.3
1991 96.5 66.7 3.7 88.0 51.1 8.2
2001 97.3 73.7 4.4 91.3 62.8 9.9
2007 95.7 75.7 5.2 92.7 66.3 12.4
4.2 Living arrangements of the elderly
Living arrangements are an important component of the overall well-being of the
elderly and play a crucial role in the system of familial support. It can provide an indication of
the amount of potential support available to the elderly and the degree to which they may
experience loneliness and social isolation (Andrews & Hennink, 1992). In the absence of well-
developed systems for providing social services to the elderly, the elderly must rely on those
with whom they live in close proximity for economic, social, and physical support as their
economic productivity and health decline (Domingo & John, 1992).
Western industrialised countries have developed social security, pensions, and public
health systems to support older adults to supplement their personal and family resources. In

54 Changing Family Structures and Living Arrangements |
contrast, in many developing countries little government-funded institutional support is
available. Older adults in the developing countries of Africa, Asia, and Latin America often
require social, economic, and physical assistance, but many are ill-equipped to provide for
themselves because of poor health and a lack of private savings (Bongaarts & Zimmer, 2001).
As seen above, older persons in Myanmar rarely live alone. More common is co-
residence with an adult child, usually the daughter. Where a family has older relatives to look
after, the three generation household is the norm. This underlines the mutual support
provided by older persons and adult children within the family. The elderly, particularly older
women, make important contributions in terms of helping with housework, taking care of
grandchildren, and providing guidance and advice.
4.2.1 Co-residence status
It is generally assumed that exchanges (economic and social) among close kin are more
reliable and intensive than with distant kin or non-kin. For the elderly, many of whom need
various kinds of assistance on a daily basis, it may be especially important to live together with
close kin. In fact, parents and children may both benefit from living together. Older adults
receive the social, financial, and health support they require from younger generations. Older
adults assist with the care of younger children or look after the home. In the Asia region, there
are higher rates of co-residence, with nearly two-thirds of both men and women living with
adult children. Although rates of co-residence are high in Africa, where nearly 50 per cent of
older adults live with an adult child, the elderly in Africa are more likely to live alone, be head
of a household, and to live with adults who are not their offspring or spouses.
From the 2007 FRHS, it is possible to reconstruct the living arrangements of the elderly
in Myanmar through looking at their co-residence status, which tells us the number of persons
the elderly are living with, and their relationship to the co-residing person, whether spouse,
children, grandchildren, relatives, or other. Traditionally in Myanmar, the elderly live in the
residence they have occupied throughout their adult lives and at least one adult child lives with
them until their death. This co-residence implies more than just living together: following
Myanmar values, co-residence also involves care and support for the elderly.
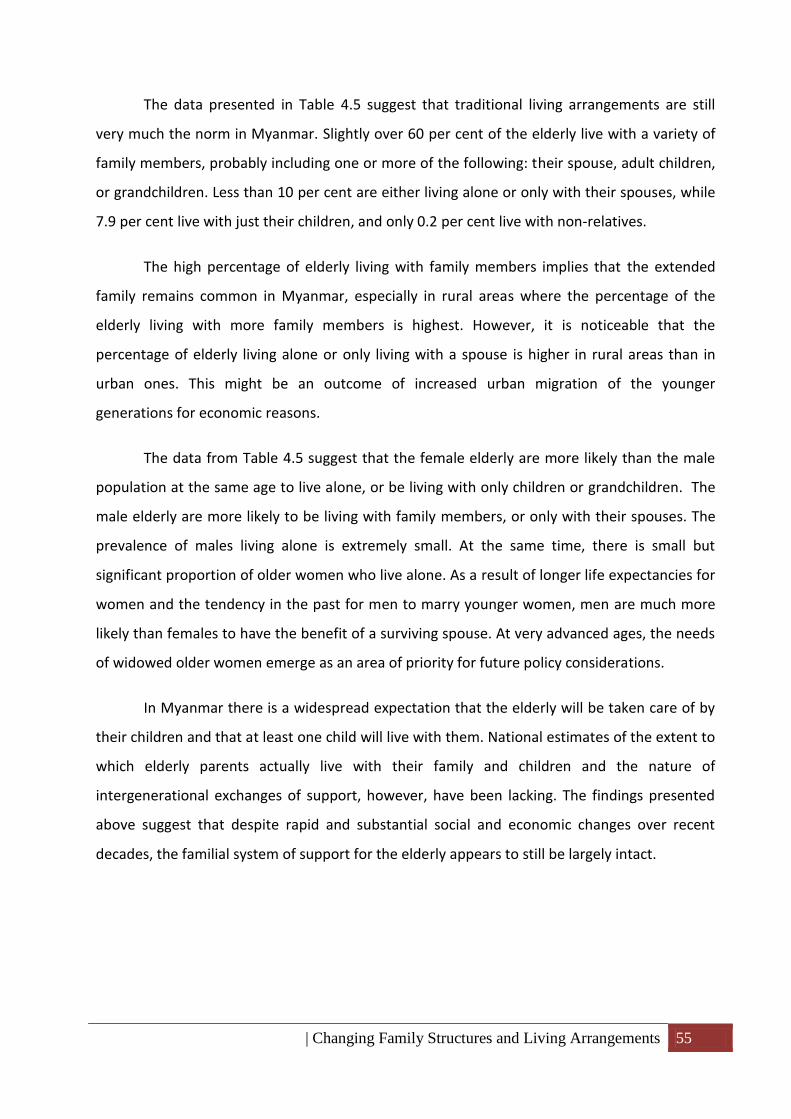
| Changing Family Structures and Living Arrangements 55
The data presented in Table 4.5 suggest that traditional living arrangements are still
very much the norm in Myanmar. Slightly over 60 per cent of the elderly live with a variety of
family members, probably including one or more of the following: their spouse, adult children,
or grandchildren. Less than 10 per cent are either living alone or only with their spouses, while
7.9 per cent live with just their children, and only 0.2 per cent live with non-relatives.
The high percentage of elderly living with family members implies that the extended
family remains common in Myanmar, especially in rural areas where the percentage of the
elderly living with more family members is highest. However, it is noticeable that the
percentage of elderly living alone or only living with a spouse is higher in rural areas than in
urban ones. This might be an outcome of increased urban migration of the younger
generations for economic reasons.
The data from Table 4.5 suggest that the female elderly are more likely than the male
population at the same age to live alone, or be living with only children or grandchildren. The
male elderly are more likely to be living with family members, or only with their spouses. The
prevalence of males living alone is extremely small. At the same time, there is small but
significant proportion of older women who live alone. As a result of longer life expectancies for
women and the tendency in the past for men to marry younger women, men are much more
likely than females to have the benefit of a surviving spouse. At very advanced ages, the needs
of widowed older women emerge as an area of priority for future policy considerations.
In Myanmar there is a widespread expectation that the elderly will be taken care of by
their children and that at least one child will live with them. National estimates of the extent to
which elderly parents actually live with their family and children and the nature of
intergenerational exchanges of support, however, have been lacking. The findings presented
above suggest that despite rapid and substantial social and economic changes over recent
decades, the familial system of support for the elderly appears to still be largely intact.
56 Changing Family Structures and Living Arrangements |
Table 4.5 Percentage distribution of living arrangements of the elderly by selected
characteristics
Background characteristics
Living alone
Spouse only
With child only
With grand-child only
With other
relative only
Non relative
With family
member
With family
and others
Total
60-64 2.7 5.4 7.5 0.5 3.0 0.2 66.5 14.2 100.0
65-69 3.5 6.4 7.9 0.8 2.4 0.2 64.1 14.7 100.0
70-74 4.9 6.5 8.0 1.3 2.3 0.2 61.2 15.7 100.0
75-79 4.8 7.0 8.4 2.0 2.7 0.2 54.9 20.0 100.0
80+ 5.9 4.3 8.5 1.8 2.6 0.1 51.1 25.6 100.0
Male 2.6 7.7 5.0 0.5 1.5 0.1 68.7 13.9 100.0
Female 4.9 4.6 10.2 1.5 3.5 0.2 56.5 18.6 100.0
Urban 2.7 5.2 7.7 0.9 3.5 0.4 56.5 23.1 100.0
Rural 4.5 6.3 8.0 1.1 2.3 0.1 64.0 13.8 100.0
Domain1 3.1 3.3 7.6 1.8 1.5 0.2 64.2 18.2 100.0
Domain2 5.1 6.5 7.0 2.0 1.5 0.1 62.7 15.2 100.0
Domain3 3.7 5.8 8.4 0.5 2.5 0.1 66.1 13.0 100.0
Domain4 3.9 6.1 6.5 1.0 2.6 0.0 61.5 18.3 100.0
Domain5 3.7 5.5 8.7 0.9 3.6 0.4 62.3 14.8 100.0
Domain6 3.5 6.1 10.3 0.8 2.8 0.3 65.4 10.8 100.0
Domain7 3.9 7.6 5.5 1.0 1.0 0.0 64.0 17.0 100.0
Domain8 2.8 5.0 7.5 0.6 3.9 0.4 55.3 24.6 100.0
Domain9 5.3 7.7 7.8 1.4 2.8 0.1 55.8 19.1 100.0
Total 3.9 6.0 7.9 1.1 2.6 0.2 61.7 16.6 100.0
Number 532 808 1077 146 356 25 8372 2246 13562
Domain 1 Kachin, Kayah, Shan states Domain 6 Mandalay region
Domain 2 Kayin, Mon, Tanintharyi regions Domain 7 Rakhine state
Domain 3 Chin state , Sagaing region Domain 8 Yangon region
Domain 4 Bago region Domain 9 Ayeyarwaddy region
Domain 5 Magway region

| Changing Family Structures and Living Arrangements 57
Of the total 31,942 households enumerated in the 2007 FRHS, 32 per cent contained
one or more elderly residents. Table 4.6 shows the percentage of elderly people living with
children age 0-9 years old. The extent of co-residence of an elderly person with a young child
provides an indication of the potential for the elderly to provide childcare to other family
members, typically their grandchildren.
About half of the total elderly population lived with at least one child age 0-9 years old.
The high percentage of elderly living with at least one child age 0-9 years old also reflects the
high percentage of three-generation families. There was very little variation in the proportions
of elderly living with children by age of the elderly. At all ages, about one-half of the elderly
were living in households where there were also young children resident. While this co-
residence does not demonstrate that the elderly were providing childcare, it indicates that
most elderly have the potential to provide such care and hence contribute to the family.
Table 4.6 Percentage of elderly people co-residing with at least one child age 0-4 or 5-9 years old
Age group
60-64 65-69 70-74 75-79 80+ Total
(N=4135) (N=3556) (N=2772) (N=1693) (N=1406) (N=13562)
0-4 24.9 24.5 25.1 22.0 19.3 23.9
5-9 23.9 24.8 26.9 26.3 22.3 24.9
4.2.2 Housing facilities and quality
The 2007 FRHS provides information on housing, such as the source of water for
drinking and other household use, sanitation facilities, access to electricity, and housing
quality. It also provides information on ownership of consumer items such as televisions,
radios, bicycles, and cars. These items can be used to assess the quality and living standard of
the household.

58 Changing Family Structures and Living Arrangements |
Table 4.7 Per cent distribution of housing characteristic and household facilities by broad
age group and place of residence
Housing characteristics
All ages Elderly people 60+
Urban Rural Total Urban Rural Total
Electricity 72.5 19.8 33.8 78.4 21.9 38.7
Source of drinking water
Piped water 22.0 3.8 8.6 21.6 3.7 9.0
Well(protected) 47.0 49.1 48.6 49.5 53.2 52.1
Well(unprotected) 5.3 14.0 11.7 4.1 13.2 10.5
Others 25.7 33.0 31.1 24.9 29.9 28.4
Total 100.0 100.0 100.0 100.0 100.0 100.0
Source of water for household use
Piped water 26.0 4.3 10.1 25.6 4.2 10.5
Well(protected) 38.4 26.2 29.4 39.8 28.2 31.7
Well(unprotected) 21.2 36.9 32.8 21.9 39.0 33.9
Others 14.4 32.5 27.7 12.7 28.6 23.9
Total 100.0 100.0 100.0 100.0 100.0 100.0
Sanitation Facilities
Flush 2.1 0.2 0.7 2.7 0.2 0.9
Water seal 89.8 71.8 76.6 92.0 77.2 81.6
Pit/bucket 6.8 15.2 12.9 4.3 12.7 10.2
None 1.2 12.3 9.4 0.8 9.5 6.9
Other 0.0 0.5 0.4 0.1 0.4 0.3
Total 100.0 100.0 100.0 100.0 100.0 100.0
Main material of roof
Tile/brick 5.7 0.8 2.1 6.7 1.0 2.7
Corrugated sheet 66.3 32.6 41.5 72.3 42.2 51.1
Wood/bamboo 5.1 6.7 6.3 4.2 7.5 6.5
Leaves/dhani/thetke/earth 22.0 57.9 48.4 15.9 47.7 38.2
Others 0.9 2.1 1.8 0.9 1.6 1.4
Total 100.0 100.0 100.0 100.0 100.0 100.0

| Changing Family Structures and Living Arrangements 59
Table 4.7 Continued
Housing characteristics
all ages elderly people 60+
Urban Rural Total Urban Rural Total
Durable goods
Radio 36.5 20.5 24.7 45.6 23.1 29.8
Television 59.0 18.5 29.2 65.2 20.9 34.0
Sewing machine 30.4 14.2 18.5 36.9 16.7 22.7
Bicycle 56.3 44.5 47.6 56.1 44.3 47.8
Car 8.1 1.1 2.9 8.6 1.3 3.5
Tractor/tawlagyi 4.2 41.7 31.7 4.1 47.0 34.2
Bullock cart 1.1 9.4 7.2 0.9 8.1 5.9
Canoe/boat 0.7 1.4 1.2 0.5 1.1 0.9
Number 41522 115016 156538 4032 9530 13562
In Table 4.7, characteristics of households in which the elderly are living are compared
with the characteristics of all households. The table suggests that the living conditions of the
elderly tend, on average, to be somewhat better than the total population, although these
differences are small. Compared to the population of all ages, the elderly are more likely to be
living in households with electricity, better sources of drinking water and better water used in
the household, better sanitation facilities, and better roof materials. However, there is still a
large proportion of the elderly and non-elderly who do not have accessibility to clean water,
for example piped water and well-protected water, especially in rural areas. This lack of a clean
water supply must affect the health status of people at all ages.
When comparing the elderly living in rural and urban areas, those living in urban areas,
as expected, have better housing quality and facilities, with very high percentages having
electricity, piped water, better sanitation facilities, better roof materials, and also a higher
percentage who own durable goods, including televisions, radios, and vehicles.

60 Chapter V |
Chapter V
Policies, Programmes, and Care for the Elderly Population
5.1 Government policies and programmes
Generally, Myanmar customs and social norms are conducive to coping with care of the
aged. Following religious teachings, cultural traditions, and social norms, Myanmar people hold
older people in high regard. To look after older people is considered noble in which people take
pride. Therefore, the affairs of older people do not constitute a serious social problem in
Myanmar. However, this tradition is subject to the impact of economic, social, and cultural
changes, which might shift towards a less favourable situation in which the care of the elderly
is perceived as an extra burden to the family. Such a negative attitude has emerged in many
developing countries, and Myanmar may be no exception.
Myanmar is making concerted efforts to address the problems that may arise from the
growing number of elderly in the future in collaboration with internal, regional and
international organisations following the theme, ‘Towards a society for all ages’. In the
constitution of the Republic of the Union of Myanmar, Article 32(a) states that the Union shall
care for mothers and children, orphans, the children of fallen defence services personnel, the
aged, and the disabled.
In undertaking the development of the social sector, the government has laid down
plans for the care of children, disabled persons, and the aged. The care of older persons in
Myanmar follows a tradition of providing social care, which in turn government policies
reinforce. Myanmar upholds five fundamental principles for elderly persons to enjoy a better
and pleasant life: independence, participation, care, self-fulfilment, and dignity, all of which
have been adopted by the United Nations, while also caring for the aged in accordance with
culture and traditions.
International bodies follow such models for taking care of older persons include home-
care services and volunteer-based services; home-based care; community-based care; group-
home care; day-care centres; and voluntary elderly homes or homes for the aged. Among the
models, home-based care, community-based care service, and day-care centres are especially
| Policies, Programmes, and Care for the Elderly Population 61
suitable for Myanmar as they are cost-effective and are the best ways in ensuring the health
and happiness of the elderly.
Official government policies for the promotion of the welfare of older people include a
variety of measures to be implemented, including to:
a. Form a National Committee for Older People.
b. Establish a network on caring for the elderly within the country and abroad and
to collaborate with other countries in the region, including ASEAN countries.
c. Build a system of providing appropriate interventions for care and support of
the older people in collaboration with NGOs, entrepreneurs, and private donors.
d. Provide older people with the necessary assistance for their health, well-being,
and improving their skills.
e. Organise new homes for the aged and conduct activities for the sustainability of
existing homes for the aged.
f. Implement the model of Republic of Korea and ASEAN Home Care Service
nationwide.
g. Develop community-based home-care services.
h. Develop home-care programmes based on religious institutions
Myanmar has begun to establish the necessary institutional infrastructure for
responding to the issues of an ageing population. The government has provided homes for the
aged and has implemented elderly health-care project and a social security scheme that
provides entitled elderly workers with free medical care and cash benefits. Furthermore, to
raise awareness about the need for care for the older persons, Myanmar observes
‘International Day of Older Persons’ on 1 October.
Pension schemes in Myanmar, as in most Asian countries, mainly apply to those who
have worked for the government and hence cover a relatively small segment of the population,
although the Myanmar government is planning to broaden that coverage. Besides paying
benefits directly to public employees, this system also provides pensions to dependents of
deceased retired persons. In Myanmar, all government workers may serve until the age of 60,

62 Policies, Programmes, and Care for the Elderly Population |
the age for retirement. However, the state may, if necessary, continue to employ skilled and
experienced retired personnel or appoint them as advisors. This enables the retirees to
continue to serve the country by sharing their experience, knowledge, and skills with younger
generations. On retirement from service, these retirees are entitled to a gratuity and pension
as prescribed under the relevant government regulations.
Apart from government service, elderly retirees may also serve in other capacities. A
number of elderly people who have retired from government service now serve in important
positions in NGOs, voluntary organisations, and business firms. Through active involvement in
the social, economic, and religious sectors of the country, this group of elderly are able to
continue to lead an active life in the society.
5.2 Care for the elderly
The Department of Social Welfare (DSW), under the Ministry of Social Welfare, Relief
and Resettlement, undertakes social welfare activities, including care for the aged. Homes for
the aged have been established by religious and voluntary social organisations, for those who
are aged 60 and above and in need of care. The first one, Minkun Home for the Aged was
established in 1914 on Sagaing Hill by Daw Oo Zun.
At present, there are two ways of taking care of older people in Myanmar: homes for
the aged and volunteer-based home-care service. Currently, there are 62 homes for the aged
established by social organisations throughout the country, covering over 2000 older people,
and provide food, clothing, shelter, healthcare services and general care to the elderly so that
they are able to perform their respective religious activities and lead a peaceful life. Moreover,
the Department of Social Welfare provides rice, funds for food, clothing, and salaries to
administrators for these homes for the aged. The number of older persons currently being
taken care are of is over 2000 in the homes for the aged, about 3000 in home care and about
30,000 in community based elderly care programmes.
However, there exist a certain phobia about institutions, be it hospitals or homes, and
people are reluctant to use these facilities. Hence there are few elderly who voluntarily seek
out homes for the aged. Furthermore, there is a negative social image related to people

| Policies, Programmes, and Care for the Elderly Population 63
sending their elderly relatives to such homes and thus people do not use these facilities even
though they might need to, or realise the positive contribution to society of these homes.
Myanmar started implementing the Republic of Korea-ASEAN Home Care for Older
People Project since 2004. The main objectives of this project are to improve the health and
social condition of the poor and lonely older people in order to maintain a pleasant life style by
looking after them in their homes and allowing them to remain integrated into the community.
In this model, a trained volunteer goes to a vulnerable older person’s home to take care of him
or her, individually.
The National YMCA, in collaboration with the DSW, carried out the Phase One of the
Republic of Korea and ASEAN Project in 2004 in Insein and Hlaing Thaya Townships in Yangon
Region. Phase I covered 60 needy older people. The project was a great success because it was
cost-effective and very beneficial, and has proven an effective way of taking care of older
people. Similarly, Phase II (2006-2009) was successfully implemented in 17 targeted townships
in 7 States and Regions. Phase II was organised and supervised by the DSW in collaboration
with such national NGOs as the Myanmar Women’s Affairs Federation (MWAF), the Myanmar
Maternal and Child Welfare Association (MMCWA), the National YMCA, and one international
NGO, World Vision (Myanmar), starting in July 2007.Phase II covered 562 needy people.
At present, the DSW is carrying out the third phase of the ROK-ASEAN Project (2009-
2012) in 27 targeted townships in 8 States and Regions, with new partners, such as National
YWCA, Global Vision (Korea) and Help-Age International (Myanmar).
5.3 Health care and services for the elderly
One’s health deteriorates as one becomes older. Elderly people therefore need more
health care and this burden impacts not only on the family but also on the state. The types of
illness the elderly suffer are different from those of younger persons. Research based on
successive censuses and fertility and reproductive health surveys reveal that about 6.5 per cent
of the economically inactive elderly are disabled or in ill health. Some of these elderly may
depend on spouses, children, relatives, or non-relatives. About 4 per cent of elderly who live
alone may face difficulties in carrying out their daily activities when they are in ill health.

64 Policies, Programmes, and Care for the Elderly Population |
More women are likely to live alone compare to male elderly. The sizeable numbers of
elderly women living alone is the result of an increase in the proportion of women who have
never married, and of the longer life expectancy of women. This group of elderly women may
have special needs when they fall into ill health or are incapacitated.
Care of the elderly is perceived as the responsibility of the family, community, and the
state, and is considered an integral part of the primary health care system. Under the National
Health Plan (NHP) 1993-1996, the health care of the elderly became one of the programs under
the Community Health Care Program, which was continued to the National Health Plan of
1996-2000 and thereafter. As stated in the National Health Policy, the health care of the elderly
project conducts activities related to health in close collaboration, and also in an integrated
manner, with related ministries, organisations, non-governmental organizations and the
community. Any emerging health problem that poses a threat to the health and well-being of
the elderly in Myanmar can be detected early and appropriate measures taken to solve it.
The World Health Organization (WHO) gives support to the Elderly Health Care
Programme implemented by the Ministry of Health. The community-based elderly health care
programme, which was launched in 1994, expands to two to three new townships every year
with technical and financial assistance from WHO. Currently the project covers 82 townships in
13 States and Regions across the country. In the project townships, elderly health care clinics
have been opened in township hospitals, urban health centres, maternal and child health
centres and even in rural health centres. The programme not only provides elderly health care
services but also introduces the concept of active ageing, which is based on the health
promotion approach. The services provided at these clinics include health education sessions,
physical exercise sessions, and the treatment of ailments for elderly people.
The technical support provided by WHO to the elderly health programme includes the
training of health staff, including medical officers, nurses and basic health staff as well as
community volunteers. The WHO project also supports the monitoring of programme
implementation and the supervision of the basic health staff providing elderly health care at
the peripheral level. WHO further provides essential health care equipment and medicines,
such as scales, blood pressure cuffs, stethoscopes, glucometers and test strips, anti-
hypertensive drugs, and multivitamins. Basic health staff, local NGOs, and volunteers such as

| Policies, Programmes, and Care for the Elderly Population 65
community health workers and auxiliary midwives have been trained in basic elderly health
care. Doctors and nurses from local hospitals have also been trained in the case management
of elderly patients.
Health care services are provided by Rural Health Centres, while the Elderly Clinics at
are opened at Rural Health Centres once a week. Basic health staff at the Rural Health Centre,
including health assistants, Lady health visitors, and midwives have been trained to detect
major and minor illnesses of the elderly. They are encouraged to care for minor illnesses and
refer the seriously ill to the nearest township hospital. Building the capacities of these basic
health staff has also been part of the programme, which will help them understand the
underlying causes of illnesses, and also the social, mental, and health problems that the aged
face in order for the staff to better and sympathise with their elderly patients.
Health education and counselling is one mechanism to treat elderly patients, and so has
been included in the trainings with a special emphasis on skills for educating elderly people.
Another task is to train basic health staff in physical activity in order for them to demonstrate
daily exercises to elderly patients.

66 Chapter VI |
Chapter VI
Conclusion and Recommendations
6.1 Conclusion
There has been a significant shift in the structure of Myanmar’s population as a result of
the rapid declines in mortality and fertility. Fertility is unlikely to rise and mortality rates are
expected to improve further, or at least stabilise. All measures of the ageing process show that
the Myanmar population is becoming older, with the proportion of those aged 60 years and
above reaching 8.7 per cent in 2007, compared to 6.0 per cent in 1973. Older persons are
themselves ‘ageing’ and the findings show that the proportion of the oldest old will continue to
rise.
By 2050, it is projected that 22.2 per cent of the population will be aged 60 and over.
For the first time in the history of the country, around 2040, the population of older persons
will exceed the population of children. Some of the features of this ageing in Myanmar are a
shift in the distribution of the aged, with an increasing proportion of the aged being found in
the oldest of the old age groups; an increasing proportion of the aged that are women; and
increasing old age dependency and potential support ratios.
Although the elderly population in urban areas has been increasing, most of the elderly
population is still living in rural areas. Among the elderly population, the proportion of women
is higher than men, especially in the population of the oldest old age group, most of whom are
single or widowed. The literacy rate has been increasing and most of the elderly population in
Myanmar is literate. However, the literacy rate for elderly men is almost double that of elderly
women. The literacy rate for elderly women is especially low in rural areas. Elderly men tend to
be more economically active than elderly women; over half of the elderly men aged 60 year
and over are still in the labour force, while only 26 per cent of elderly women were engaged in
economic activities. For both elderly men and women, the activity rates are much higher in
rural than in urban areas.
| Conclusion and Recommendations 67
Most of the elderly population in the country lives with their unmarried or married
children. The support for the elderly population comes from their individuals saving or from
their families. Despite the changing structure of the family and the higher proportion of people
who have never married, kinship ties in Myanmar remain relatively strong and the care of older
parents as well as older relatives continues to be seen as the responsibility of offspring and
younger relatives.
Government pensions are limited to public employees and social security schemes are
not well established. The social welfare and the old aged welfare projects of the government
are partially directed towards the elderly population. Health care in Myanmar in the future
may focus on older people as the health services they required are very different from those of
others.
Due to the rapid changes in the age-sex structure of society, and in preparation for the
impacts of globalisation, Myanmar should continue to make every effort to maintain its
existing traditions related to the care of the aged, raise public awareness on the importance
that older people play in society, and mobilize government agencies, NGOs, voluntary
organisations, and the community to participate in the care of older persons, and to promote
existing health care services. Data on the elderly in Myanmar are scarce, so demographic
research in the future should pay more attention to the elderly population.
6.2 Policy recommendations
Although there still exist strong norms and values that emphasise care for the elderly, it
is apparent that both demographic and socio-economic changes will place great stress on these
values. Moreover, the ageing of the population will have dramatic effects on local, regional,
and global economies. Most significantly, financial expenditures, the labour supply, and total
savings will be affected. Thus, it is important to recognise, document, and plan for these
changes. Based on the findings from the present research, the following recommendations are
directed to both the government and other organisations:
In providing and strengthening support for the elderly, policies, strategies, and
programmes should be integrated into development planning, with special

68 Conclusion and Recommendations |
attention focused on the needs of women, who form a majority of the older and
oldest old populations.
Preserve traditional family norms and values related to the care of the elderly.
Intergenerational ties should be strengthened in order to preserve the quality of
the relationship between the elderly and younger members of the family.
Encourage active participation of the elderly in the community.
Support employment opportunities that allow elderly workers to play a role in
economic and social development.
Promote healthy life styles for the elderly.
Data collection should incorporate issues that are relevant to planning for an
ageing population, and to provide a better understanding of population ageing
and assessing its impacts.
Conduct more research, both qualitative and quantitative, on the quality of life
of the elderly and use of data for policy formulation, programming and
monitoring and evaluation.

| Conclusion and Recommendations 69
References:
Bongaarts, John. and Zachary Zimmer 2001. Living Arrangements of Older Adults in the
Developing World: An Analysis of DHS Household Surveys. Policy Research Division
Working Paper No. 148. Population Council, New York.
Department of Population, Myanmar. 2009. Country Report of Myanmar Fertility and
Reproductive Health Survey 2007. Ministry of Immigration and Population. Yangon,
Myanmar.
Department of Population and UNFPA, Myanmar. 2005. The Elderly Population in Myanmar:
Trends, Living Conditions, Characteristics and Prospects .Ministry of Immigration and
Population. Yangon, Myanmar.
Department of Population and UNFPA, Myanmar. 2004.Myanmar Fertility and Reproductive
Health Survey 2001, Detailed analysis Report. Ministry of Immigration and Population.
Yangon, Myanmar.
Domingo, Lita J. and John B. Casterline. 1992. Living Arrangements of the Filipino Elderly. Asia-
Pacific Population Journal 7(3): 63-88
Légaré, Jacques, MahamaneIbrahima and Oliver Sossa. 2003. Population Ageing: A Challenge
for Developing Countries. International Federation on Ageing.
Myanmar Deligation. 2007. Country Report of Myanmar submitted to the High Level Meeting
on the Regional Review of the Implementation of the Madrid International Plan of
Action on Ageing, 9-11 October, Macao, China, 2006
United Nations. 2004, The Ageing of the World’s Population, Population Division, Department
of Economic and Social Affairs, United Nations Secretariat
http://www.un.org/esa/socdev/ageing/agewpop.htm
United Nations.2009, Population Ageing and Development 2009.Department of Economic and
Social Affairs, Population Division, New York.
United Nations.2002, World Population Ageing 1950-2050. . Department of Economic and
Social Affairs, Population Division, New York.
World Health Organization to the Second United Nations World Assembly on Ageing, Madrid, Spain,
April 2002.
Top Related