


![Home - TNBR QATS - Efficiency Emissions · 2017-09-13 · [Type here] [Type here] TNB Research Sdn. Bhd. (TNBR) was established as a department in Tenaga Nasional Berhad (TNB), and](https://static.fdocuments.net/doc/165x107/5e6b2f02f2a7f06e0a398a1e/home-tnbr-qats-efficiency-2017-09-13-type-here-type-here-tnb-research.jpg)

Languages
Pages
Legal

TNB HANDBOOK
AGENDA
2
1. INTRODUCTION TO TENAGA
2. INTRODUCTION TO MESI
3. TARIFF
4. BUSINESS STRATEGY & DIRECTION
5. DIVIDEND POLICY
6. FINANCIAL HIGHLIGHTS
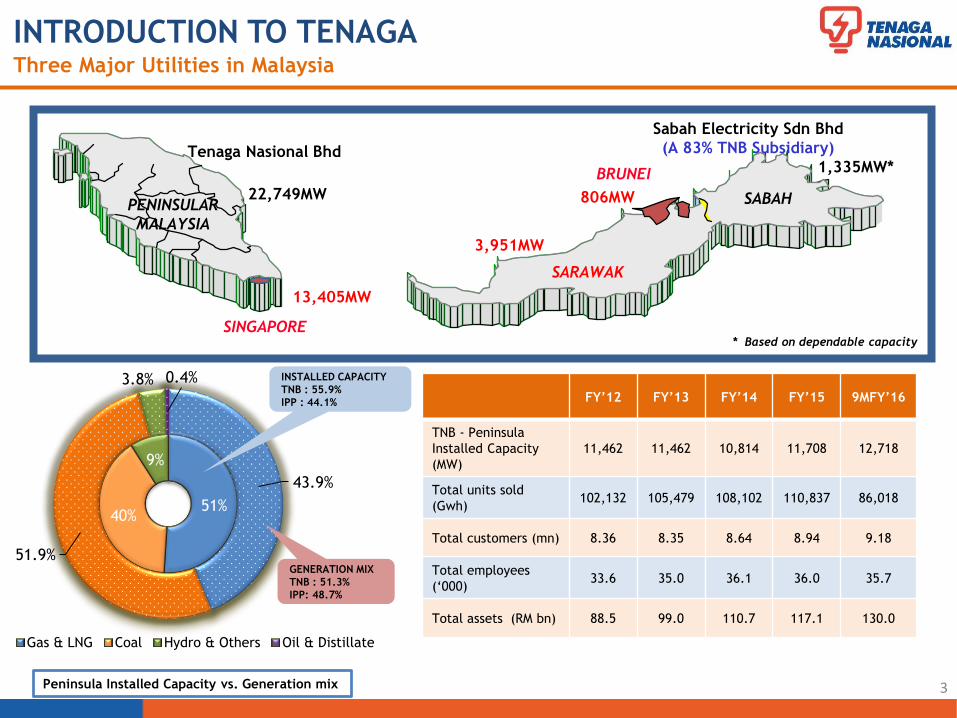
51%40%
9%
43.9%
51.9%
3.8% 0.4%
Gas & LNG Coal Hydro & Others Oil & Distillate
3
PENINSULAR
MALAYSIA
SARAWAK
SABAH
Sabah Electricity Sdn Bhd
(A 83% TNB Subsidiary)Tenaga Nasional Bhd
SINGAPORE
BRUNEI
22,749MW
3,951MW
1,335MW*
806MW
13,405MW
* Based on dependable capacity
Peninsula Installed Capacity vs. Generation mix
INSTALLED CAPACITY
TNB : 55.9%
IPP : 44.1%
GENERATION MIX
TNB : 51.3%
IPP: 48.7%
FY’12 FY’13 FY’14 FY’15 9MFY’16
TNB - Peninsula
Installed Capacity
(MW)
11,462 11,462 10,814 11,708 12,718
Total units sold
(Gwh)102,132 105,479 108,102 110,837 86,018
Total customers (mn) 8.36 8.35 8.64 8.94 9.18
Total employees
(‘000)33.6 35.0 36.1 36.0 35.7
Total assets (RM bn) 88.5 99.0 110.7 117.1 130.0
INTRODUCTION TO TENAGAThree Major Utilities in Malaysia
4
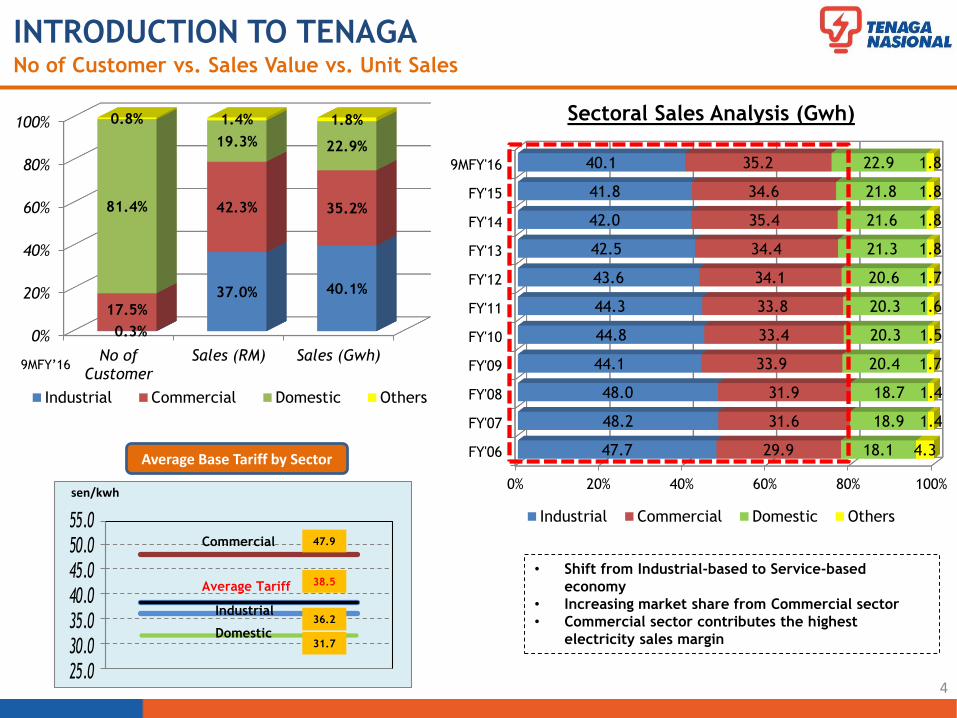
INTRODUCTION TO TENAGANo of Customer vs. Sales Value vs. Unit Sales
0%
20%
40%
60%
80%
100%
No ofCustomer
Sales (RM) Sales (Gwh)
0.3%
37.0% 40.1%
17.5%
42.3% 35.2%81.4%
19.3% 22.9%
0.8% 1.4% 1.8%
Industrial Commercial Domestic Others
0% 20% 40% 60% 80% 100%
FY'06
FY'07
FY'08
FY'09
FY'10
FY'11
FY'12
FY'13
FY'14
FY'15
9MFY'16
47.7
48.2
48.0
44.1
44.8
44.3
43.6
42.5
42.0
41.8
40.1
29.9
31.6
31.9
33.9
33.4
33.8
34.1
34.4
35.4
34.6
35.2
18.1
18.9
18.7
20.4
20.3
20.3
20.6
21.3
21.6
21.8
22.9
4.3
1.4
1.4
1.7
1.5
1.6
1.7
1.8
1.8
1.8
1.8
Industrial Commercial Domestic Others
Sectoral Sales Analysis (Gwh)
• Shift from Industrial-based to Service-based
economy
• Increasing market share from Commercial sector
• Commercial sector contributes the highest
electricity sales margin
9MFY’16
25.030.035.040.045.050.055.0
36.2
47.9
31.7
Industrial
Average Tariff
Commercial
Domestic
sen/kwh
38.5
Average Base Tariff by Sector
5
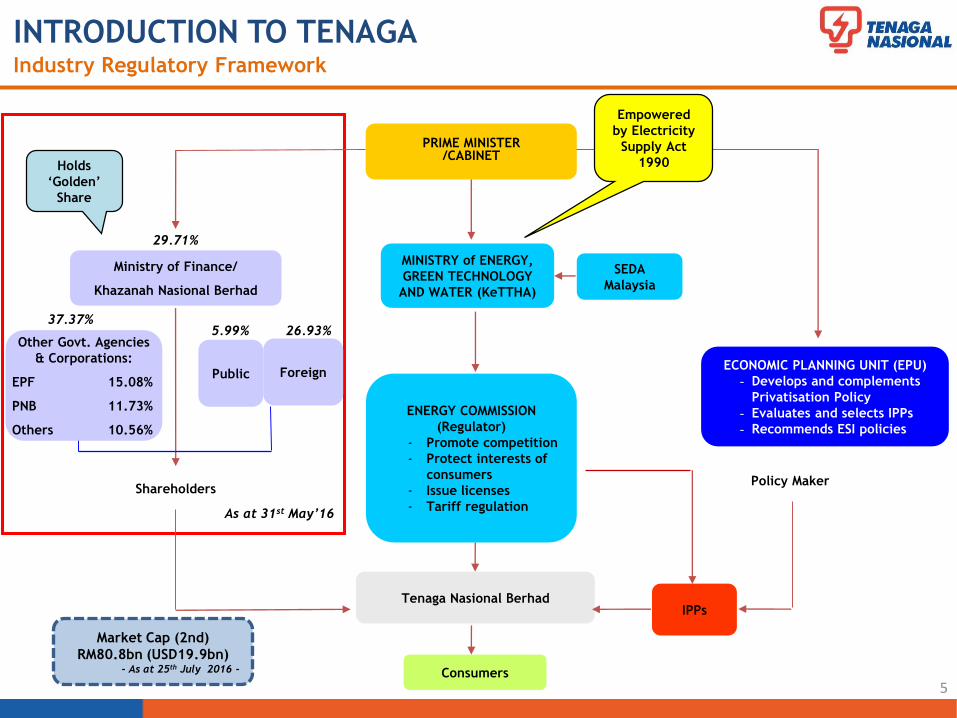
INTRODUCTION TO TENAGAIndustry Regulatory Framework
PRIME MINISTER/CABINET
MINISTRY of ENERGY,
GREEN TECHNOLOGY
AND WATER (KeTTHA)
ENERGY COMMISSION
(Regulator)
- Promote competition
- Protect interests of
consumers
- Issue licenses
- Tariff regulation
Tenaga Nasional Berhad
ECONOMIC PLANNING UNIT (EPU)
- Develops and complements
Privatisation Policy
- Evaluates and selects IPPs
- Recommends ESI policies
Ministry of Finance/
Khazanah Nasional Berhad
ShareholdersPolicy Maker
Other Govt. Agencies
& Corporations:
EPF 15.08%
PNB 11.73%
Others 10.56%
Public
Empowered
by Electricity
Supply Act
1990Holds
‘Golden’
Share
IPPs
Consumers
29.71%
37.37%
Foreign
5.99% 26.93%
SEDA
Malaysia
Market Cap (2nd)
RM80.8bn (USD19.9bn)- As at 25th July 2016 -
As at 31st May’16
AGENDA
6
1. INTRODUCTION TO TENAGA
2. INTRODUCTION TO MESI
3. TARIFF
4. BUSINESS STRATEGY & DIRECTION
5. DIVIDEND POLICY
6. FINANCIAL HIGHLIGHTS
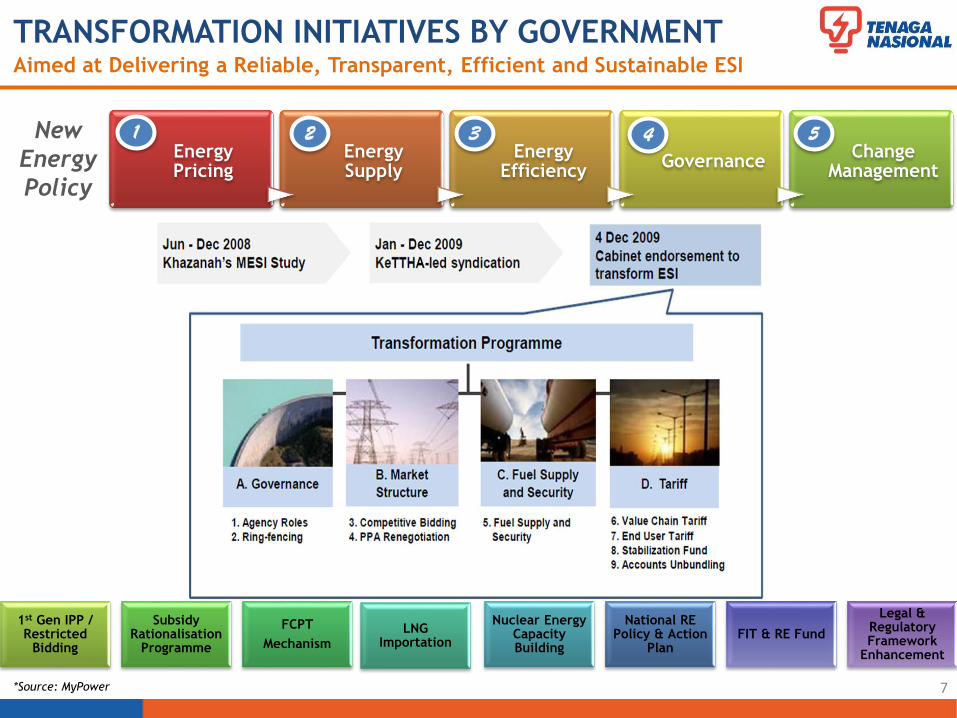
7
TRANSFORMATION INITIATIVES BY GOVERNMENTAimed at Delivering a Reliable, Transparent, Efficient and Sustainable ESI
1st Gen IPP / Restricted
Bidding
Subsidy Rationalisation
Programme
FCPT
MechanismLNG
Importation
Nuclear Energy Capacity Building
National RE Policy & Action
PlanFIT & RE Fund
Legal & Regulatory Framework
Enhancement
*Source: MyPower
Energy Pricing
Energy Supply
Energy Efficiency
GovernanceChange
Management
New
Energy
Policy
1 2 3 4 5
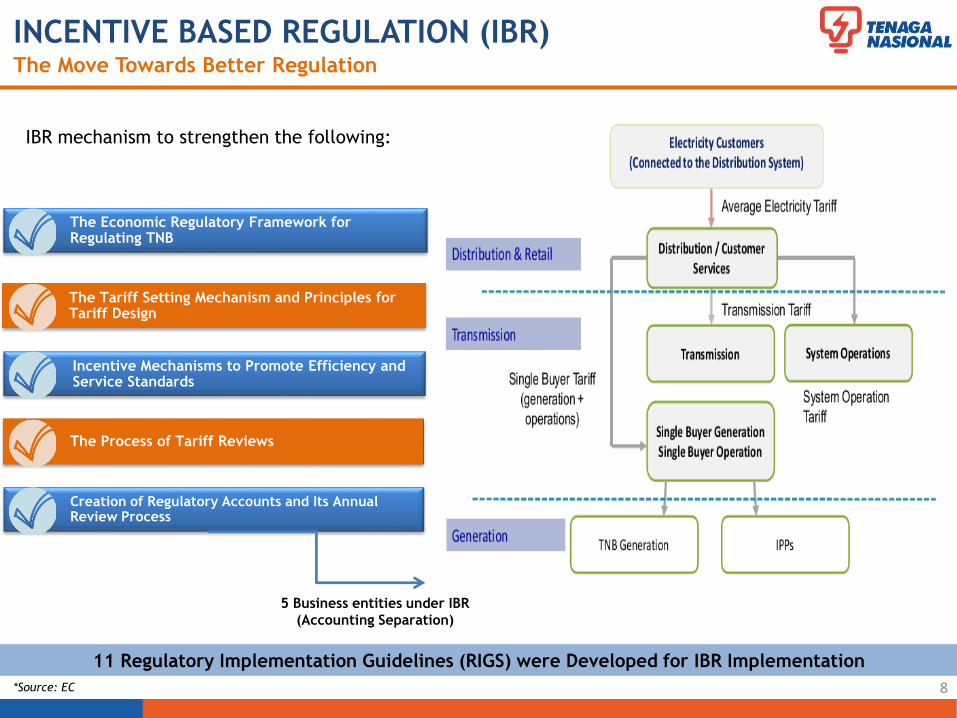
8
INCENTIVE BASED REGULATION (IBR) The Move Towards Better Regulation
11 Regulatory Implementation Guidelines (RIGS) were Developed for IBR Implementation
*Source: EC
The Economic Regulatory Framework for Regulating TNB
The Tariff Setting Mechanism and Principles for Tariff Design
Incentive Mechanisms to Promote Efficiency and Service Standards
The Process of Tariff Reviews
Creation of Regulatory Accounts and Its Annual Review Process
IBR mechanism to strengthen the following:
5 Business entities under IBR
(Accounting Separation)
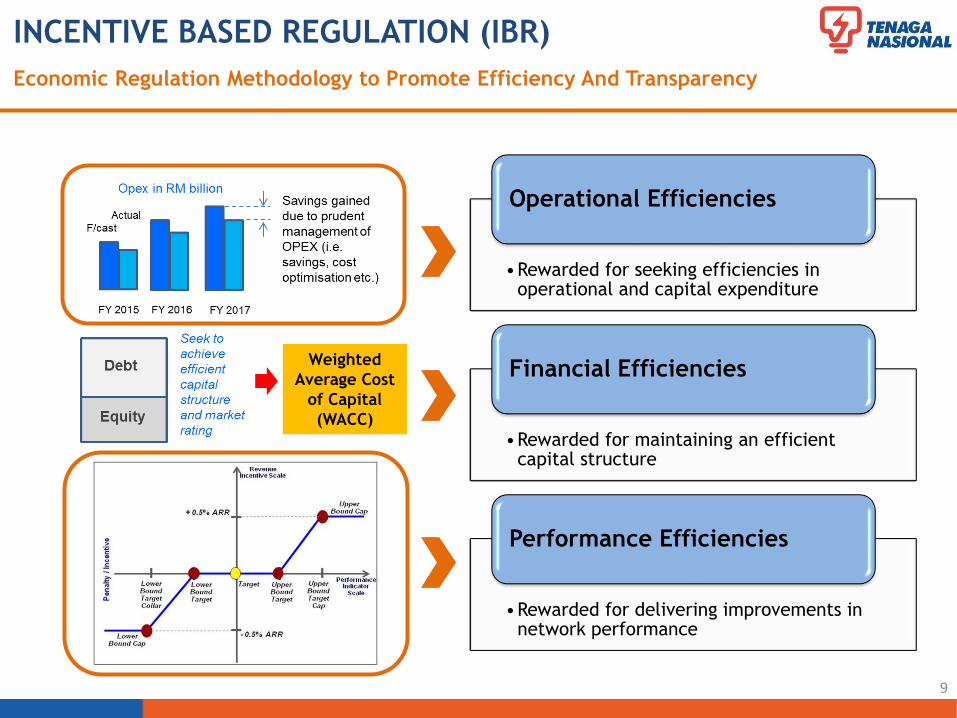
INCENTIVE BASED REGULATION (IBR)
Economic Regulation Methodology to Promote Efficiency And Transparency
•Rewarded for seeking efficiencies in operational and capital expenditure
Operational Efficiencies
•Rewarded for maintaining an efficient capital structure
Financial Efficiencies
•Rewarded for delivering improvements in network performance
Performance Efficiencies
9
Weighted
Average Cost
of Capital
(WACC)

Regulatory WACC for TNB under IBR (FY2014 – 2017) is 7.5%
10*Source: EC
INCENTIVE BASED REGULATION (IBR)
AGENDA
11
1. INTRODUCTION TO TENAGA
2. INTRODUCTION TO MESI
3. TARIFF
4. BUSINESS STRATEGY & DIRECTION
5. DIVIDEND POLICY
6. FINANCIAL HIGHLIGHTS
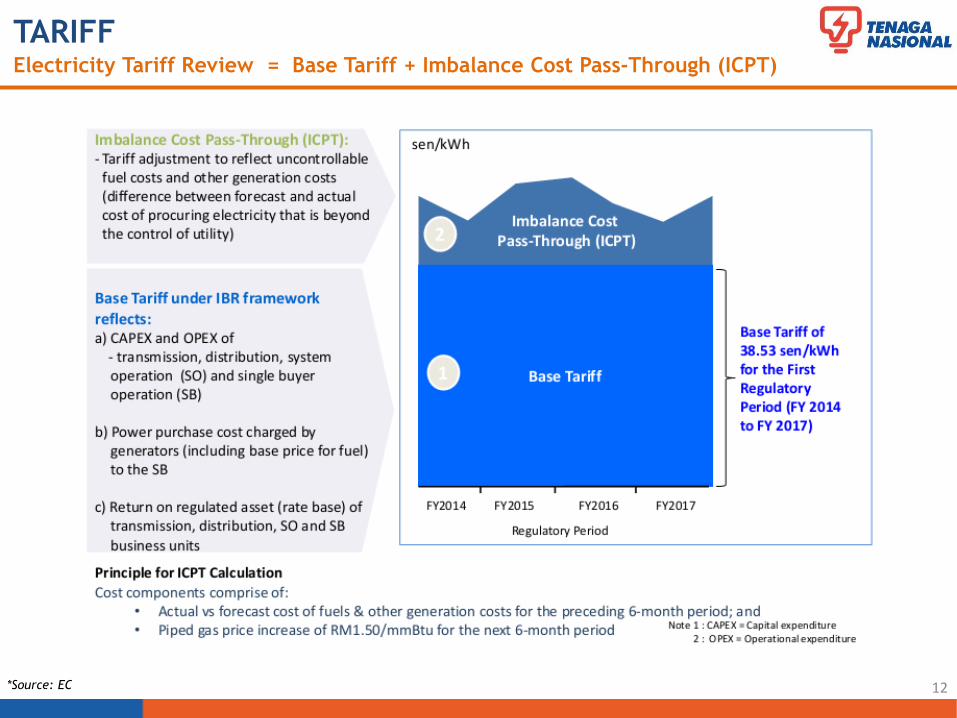
TARIFFElectricity Tariff Review = Base Tariff + Imbalance Cost Pass-Through (ICPT)
12*Source: EC
0.9
3.41
0.170.51
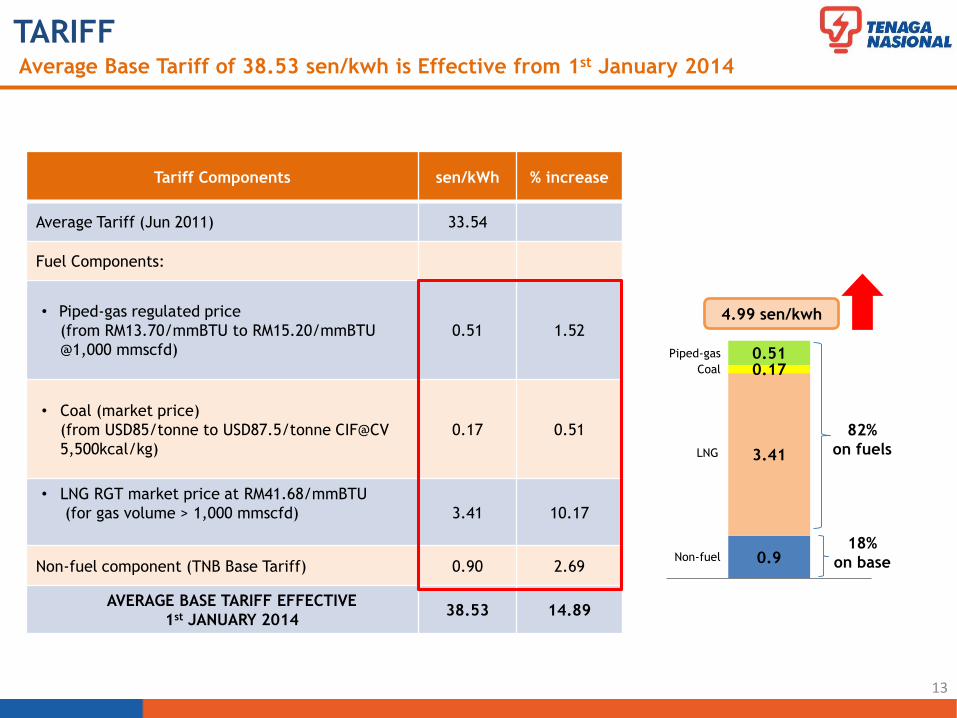
TARIFF
13
Tariff Components sen/kWh % increase
Average Tariff (Jun 2011) 33.54
Fuel Components:
• Piped-gas regulated price
(from RM13.70/mmBTU to RM15.20/mmBTU
@1,000 mmscfd)
0.51 1.52
• Coal (market price)
(from USD85/tonne to USD87.5/tonne CIF@CV
5,500kcal/kg)
0.17 0.51
• LNG RGT market price at RM41.68/mmBTU
(for gas volume > 1,000 mmscfd) 3.41 10.17
Non-fuel component (TNB Base Tariff) 0.90 2.69
AVERAGE BASE TARIFF EFFECTIVE
1st JANUARY 201438.53 14.89
82%
on fuels
18%
on base
4.99 sen/kwh
Piped-gas
Coal
LNG
Non-fuel
Average Base Tariff of 38.53 sen/kwh is Effective from 1st January 2014
14
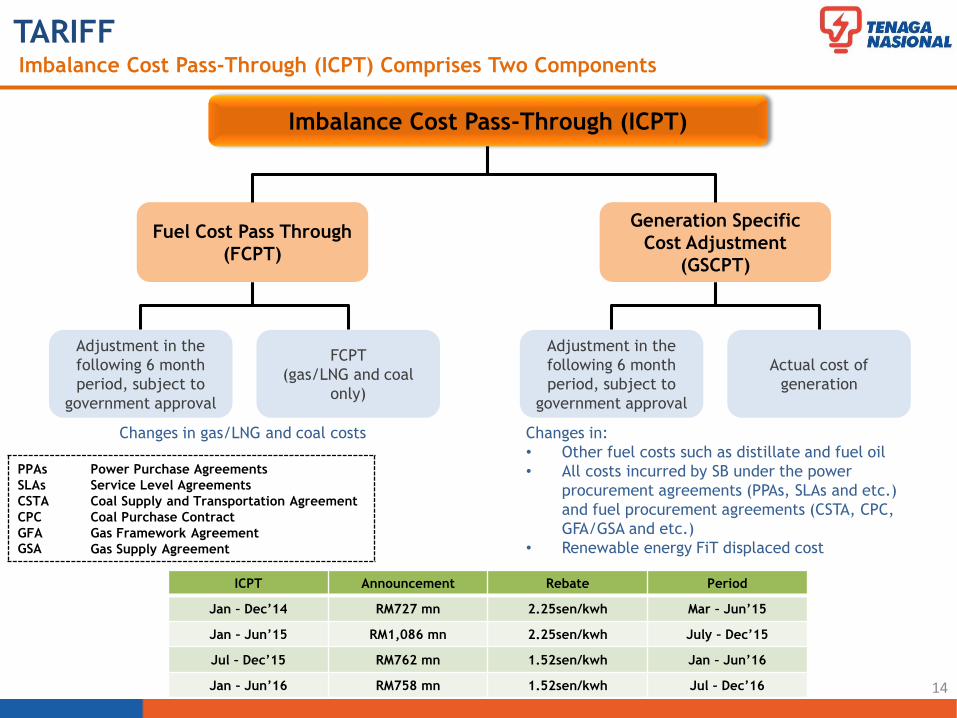
TARIFFImbalance Cost Pass-Through (ICPT) Comprises Two Components
Imbalance Cost Pass-Through (ICPT)
Fuel Cost Pass Through
(FCPT)
Generation Specific
Cost Adjustment
(GSCPT)
Adjustment in the
following 6 month
period, subject to
government approval
FCPT
(gas/LNG and coal
only)
Actual cost of
generation
Adjustment in the
following 6 month
period, subject to
government approval
Changes in:
• Other fuel costs such as distillate and fuel oil
• All costs incurred by SB under the power
procurement agreements (PPAs, SLAs and etc.)
and fuel procurement agreements (CSTA, CPC,
GFA/GSA and etc.)
• Renewable energy FiT displaced cost
Changes in gas/LNG and coal costs
ICPT Announcement Rebate Period
Jan – Dec’14 RM727 mn 2.25sen/kwh Mar – Jun’15
Jan – Jun’15 RM1,086 mn 2.25sen/kwh July – Dec’15
Jul – Dec’15 RM762 mn 1.52sen/kwh Jan – Jun’16
Jan – Jun’16 RM758 mn 1.52sen/kwh Jul – Dec’16
PPAs
SLAs
CSTA
CPC
GFA
GSA
Power Purchase Agreements
Service Level Agreements
Coal Supply and Transportation Agreement
Coal Purchase Contract
Gas Framework Agreement
Gas Supply Agreement
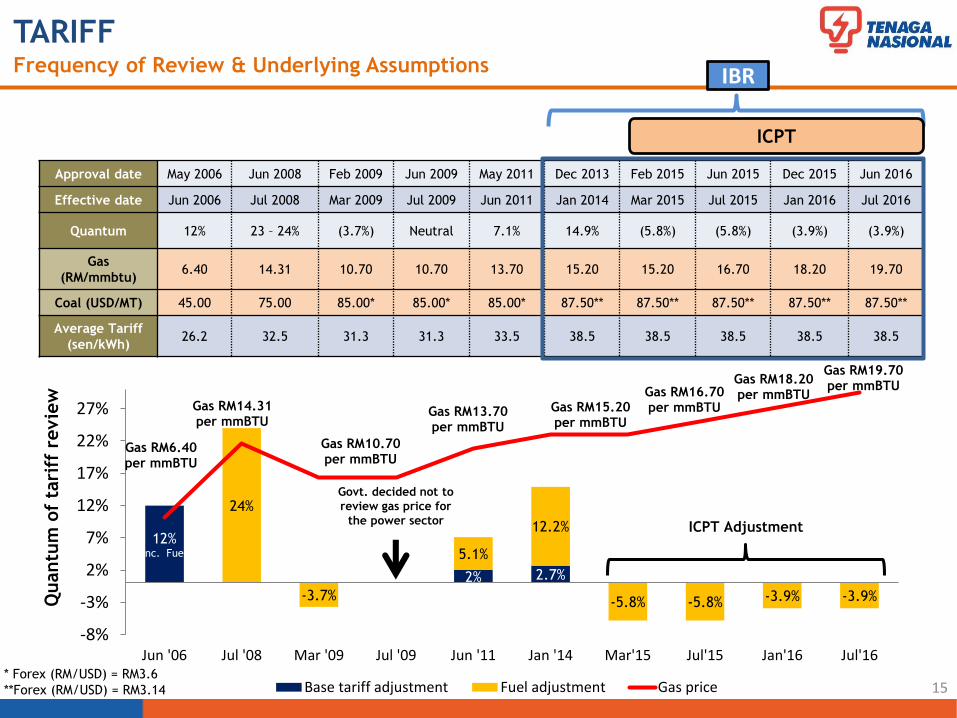
12%(inc. Fuel)
2% 2.7%
24%
-3.7%
5.1%
12.2%
-5.8% -5.8% -3.9% -3.9%
Gas RM6.40per mmBTU
Gas RM14.31per mmBTU
Gas RM10.70per mmBTU
Gas RM13.70per mmBTU
Gas RM15.20per mmBTU
Gas RM16.70per mmBTU
Gas RM18.20per mmBTU
Gas RM19.70per mmBTU
-6
-1
4
9
14
19
-8%
-3%
2%
7%
12%
17%
22%
27%
Jun '06 Jul '08 Mar '09 Jul '09 Jun '11 Jan '14 Mar'15 Jul'15 Jan'16 Jul'16
Quantu
m o
f ta
riff
revie
w
Base tariff adjustment Fuel adjustment Gas price
Govt. decided not to
review gas price for
the power sectorICPT Adjustment
TARIFFFrequency of Review & Underlying Assumptions
15
Approval date May 2006 Jun 2008 Feb 2009 Jun 2009 May 2011 Dec 2013 Feb 2015 Jun 2015 Dec 2015 Jun 2016
Effective date Jun 2006 Jul 2008 Mar 2009 Jul 2009 Jun 2011 Jan 2014 Mar 2015 Jul 2015 Jan 2016 Jul 2016
Quantum 12% 23 – 24% (3.7%) Neutral 7.1% 14.9% (5.8%) (5.8%) (3.9%) (3.9%)
Gas
(RM/mmbtu)6.40 14.31 10.70 10.70 13.70 15.20 15.20 16.70 18.20 19.70
Coal (USD/MT) 45.00 75.00 85.00* 85.00* 85.00* 87.50** 87.50** 87.50** 87.50** 87.50**
Average Tariff
(sen/kWh)26.2 32.5 31.3 31.3 33.5 38.5 38.5 38.5 38.5 38.5
* Forex (RM/USD) = RM3.6
**Forex (RM/USD) = RM3.14
IBR
ICPT
AGENDA
16
1. INTRODUCTION TO TENAGA
2. INTRODUCTION TO MESI
3. TARIFF
4. BUSINESS STRATEGY & DIRECTION
5. DIVIDEND POLICY
6. FINANCIAL HIGHLIGHTS
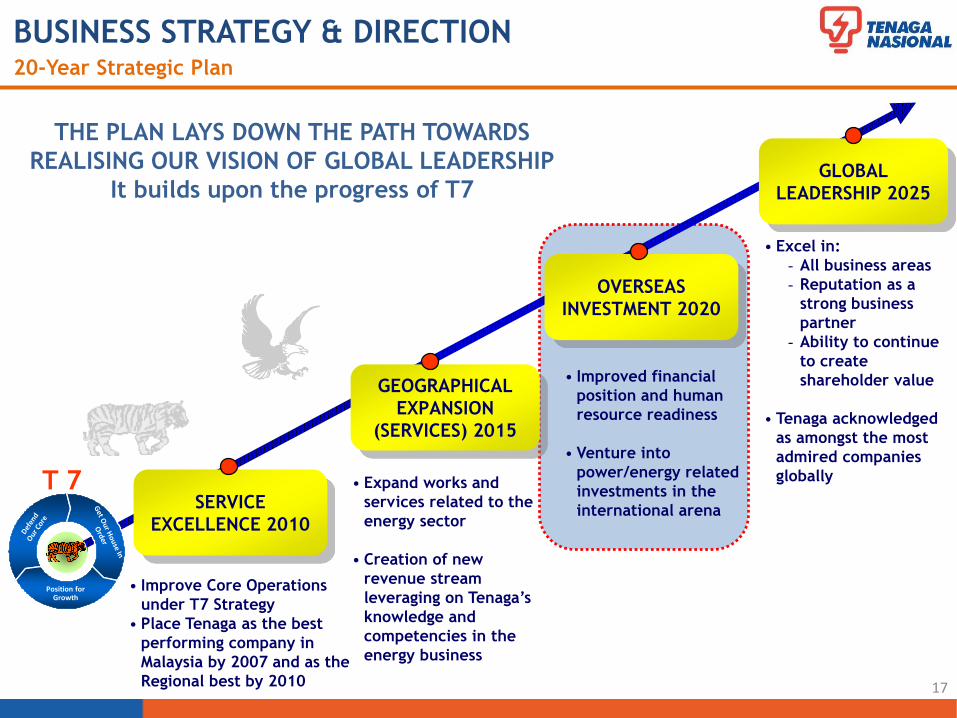
BUSINESS STRATEGY & DIRECTION
17
GEOGRAPHICAL
EXPANSION
(SERVICES) 2015
OVERSEAS
INVESTMENT 2020
GLOBAL
LEADERSHIP 2025
SERVICE
EXCELLENCE 2010
Position for Growth
T 7
• Improve Core Operations
under T7 Strategy
• Place Tenaga as the best
performing company in
Malaysia by 2007 and as the
Regional best by 2010
• Expand works and
services related to the
energy sector
• Creation of new
revenue stream
leveraging on Tenaga’s
knowledge and
competencies in the
energy business
• Improved financial
position and human
resource readiness
• Venture into
power/energy related
investments in the
international arena
• Excel in:
- All business areas
- Reputation as a
strong business
partner
- Ability to continue
to create
shareholder value
• Tenaga acknowledged
as amongst the most
admired companies
globally
THE PLAN LAYS DOWN THE PATH TOWARDS
REALISING OUR VISION OF GLOBAL LEADERSHIP
It builds upon the progress of T7
20-Year Strategic Plan
18
BUSINESS STRATEGY & DIRECTION
TNB
TODAY
TNB TOMORROW
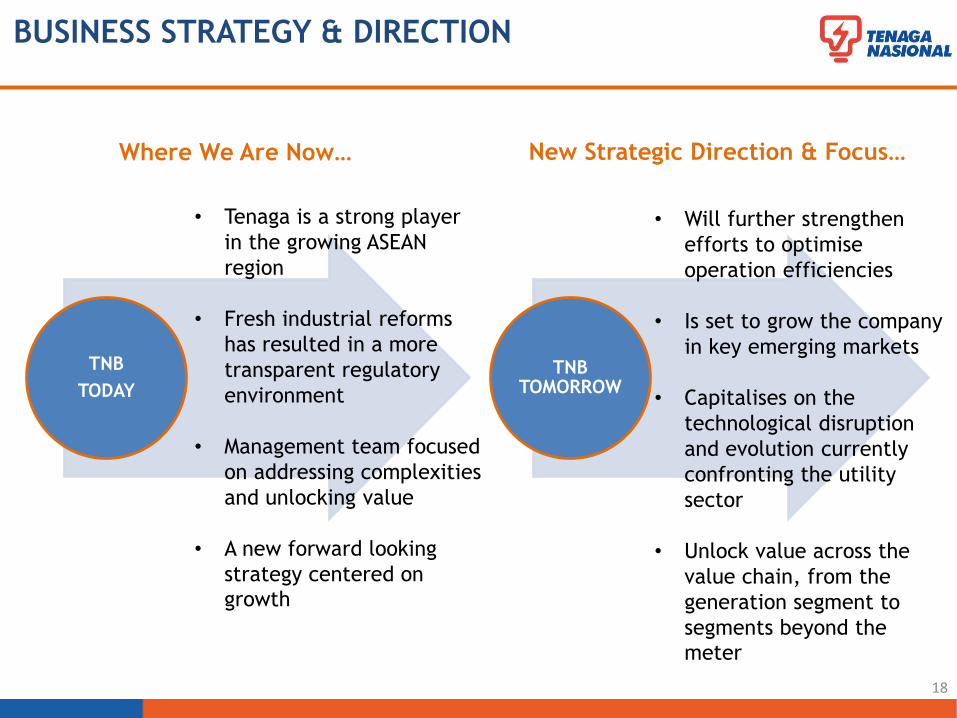
• Tenaga is a strong player
in the growing ASEAN
region
• Fresh industrial reforms
has resulted in a more
transparent regulatory
environment
• Management team focused
on addressing complexities
and unlocking value
• A new forward looking
strategy centered on
growth
Where We Are Now… New Strategic Direction & Focus…
• Will further strengthen
efforts to optimise
operation efficiencies
• Is set to grow the company
in key emerging markets
• Capitalises on the
technological disruption
and evolution currently
confronting the utility
sector
• Unlock value across the
value chain, from the
generation segment to
segments beyond the
meter
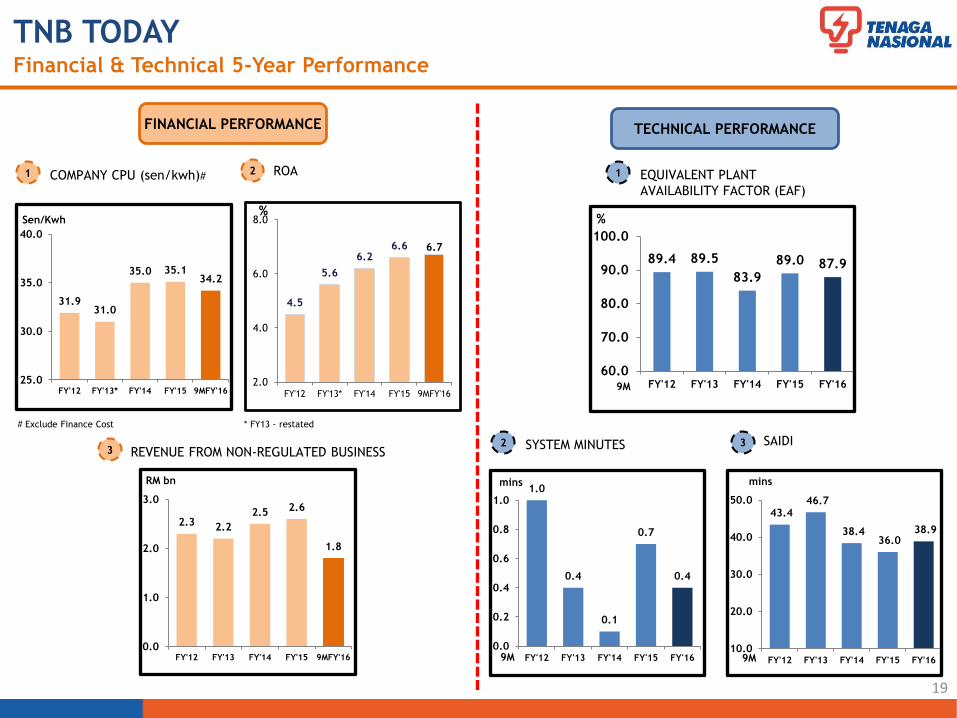
31.931.0
35.0 35.134.2
25.0
30.0
35.0
40.0
FY'12 FY'13* FY'14 FY'15 9MFY'16
4.5
5.6
6.26.6 6.7
2.0
4.0
6.0
8.0
FY'12 FY'13* FY'14 FY'15 9MFY'16
2.3 2.2
2.5 2.6
1.8
0.0
1.0
2.0
3.0
FY'12 FY'13 FY'14 FY'15 9MFY'16
FINANCIAL PERFORMANCE
1
Sen/Kwh
COMPANY CPU (sen/kwh)# ROA2
RM bn
3 REVENUE FROM NON-REGULATED BUSINESS
%
* FY13 - restated
19
TNB TODAYFinancial & Technical 5-Year Performance
# Exclude Finance Cost
SYSTEM MINUTES
TECHNICAL PERFORMANCE
1 EQUIVALENT PLANT
AVAILABILITY FACTOR (EAF)
mins
3
mins
2 SAIDI
89.4 89.5
83.9
89.0 87.9
60.0
70.0
80.0
90.0
100.0
FY'12 FY'13 FY'14 FY'15 FY'16
%
1.0
0.4
0.1
0.7
0.4
0.0
0.2
0.4
0.6
0.8
1.0
FY'12 FY'13 FY'14 FY'15 FY'169M
43.4 46.7
38.4 36.0
38.9
10.0
20.0
30.0
40.0
50.0
FY'12 FY'13 FY'14 FY'15 FY'169M
9M
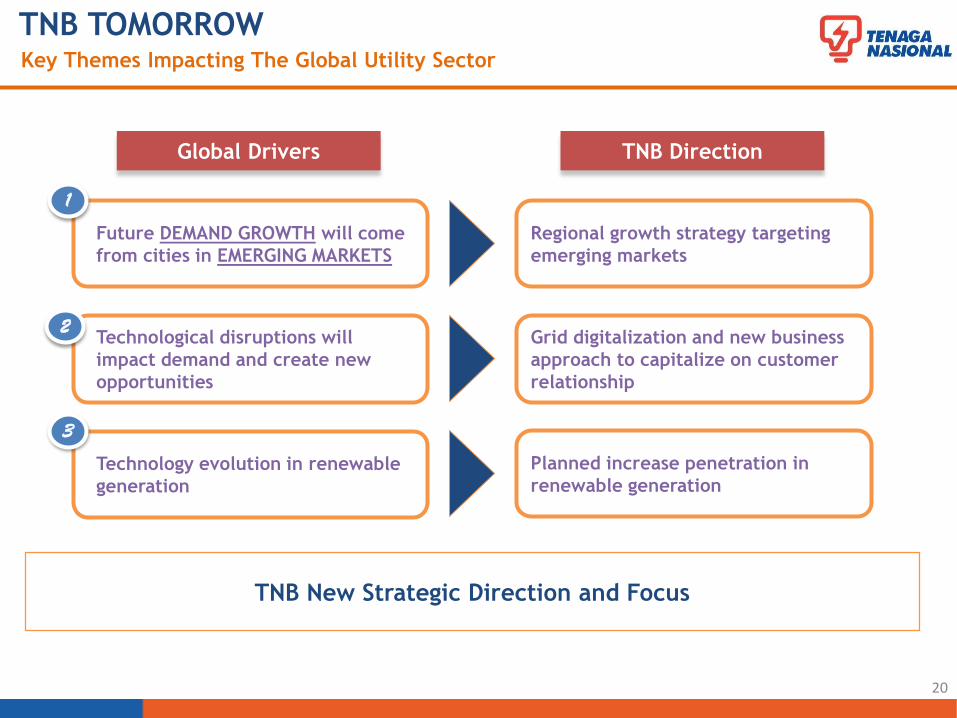
Future DEMAND GROWTH will come
from cities in EMERGING MARKETS
Technological disruptions will
impact demand and create new
opportunities
Technology evolution in renewable
generation
TNB New Strategic Direction and Focus
Regional growth strategy targeting
emerging markets
Grid digitalization and new business
approach to capitalize on customer
relationship
Planned increase penetration in
renewable generation
20
TNB TOMORROWKey Themes Impacting The Global Utility Sector
Global Drivers TNB Direction
1
2
3
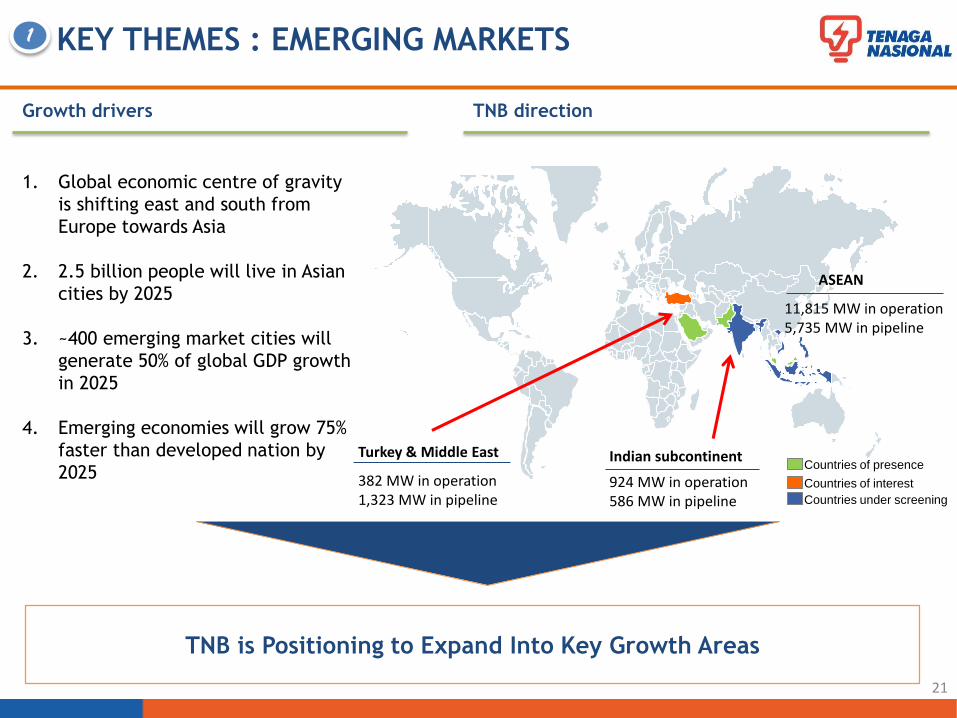
Growth drivers
1. Global economic centre of gravity
is shifting east and south from
Europe towards Asia
2. 2.5 billion people will live in Asian
cities by 2025
3. ~400 emerging market cities will
generate 50% of global GDP growth
in 2025
4. Emerging economies will grow 75%
faster than developed nation by
2025
TNB direction
TNB is Positioning to Expand Into Key Growth Areas
KEY THEMES : EMERGING MARKETS
21
Turkey & Middle East
382 MW in operation1,323 MW in pipeline
ASEAN
11,815 MW in operation5,735 MW in pipeline
Indian subcontinent
924 MW in operation586 MW in pipeline
1
Countries of presence
Countries of interest
Countries under screening
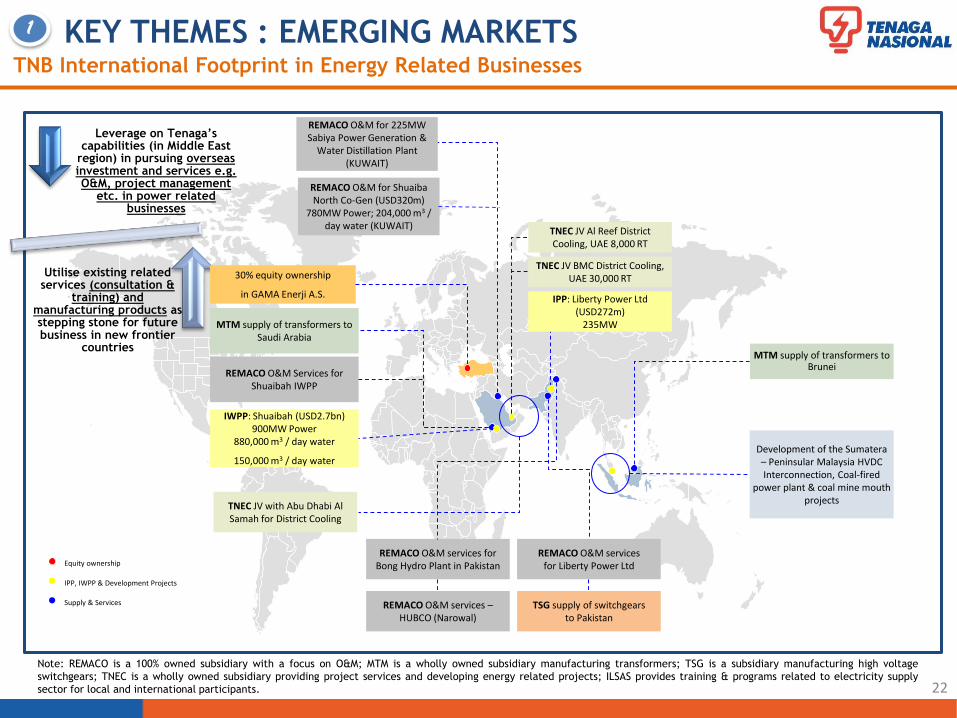
KEY THEMES : EMERGING MARKETSTNB International Footprint in Energy Related Businesses
22
MTM supply of transformers to Saudi Arabia
REMACO O&M Services for Shuaibah IWPP
IWPP: Shuaibah (USD2.7bn) 900MW Power
880,000 m3 / day water
150,000 m3 / day water
TNEC JV Al Reef District Cooling, UAE 8,000 RT
TNEC JV BMC District Cooling, UAE 30,000 RT
IPP: Liberty Power Ltd (USD272m)
235MW
REMACO O&M services for Bong Hydro Plant in Pakistan
REMACO O&M services for Liberty Power Ltd
TSG supply of switchgears to Pakistan
REMACO O&M services –HUBCO (Narowal)
MTM supply of transformers to Brunei
IPP, IWPP & Development Projects
Supply & Services
REMACO O&M for Shuaiba North Co-Gen (USD320m)
780MW Power; 204,000 m3 / day water (KUWAIT)
TNEC JV with Abu Dhabi Al Samah for District Cooling
Development of the Sumatera – Peninsular Malaysia HVDC Interconnection, Coal-fired
power plant & coal mine mouth projects
Note: REMACO is a 100% owned subsidiary with a focus on O&M; MTM is a wholly owned subsidiary manufacturing transformers; TSG is a subsidiary manufacturing high voltage
switchgears; TNEC is a wholly owned subsidiary providing project services and developing energy related projects; ILSAS provides training & programs related to electricity supply
sector for local and international participants.
Leverage on Tenaga’s capabilities (in Middle East
region) in pursuing overseas investment and services e.g. O&M, project management
etc. in power related businesses
Utilise existing related services (consultation &
training) and manufacturing products as stepping stone for future business in new frontier
countries
REMACO O&M for 225MW Sabiya Power Generation &
Water Distillation Plant (KUWAIT)
1
30% equity ownership
in GAMA Enerji A.S.
Equity ownership
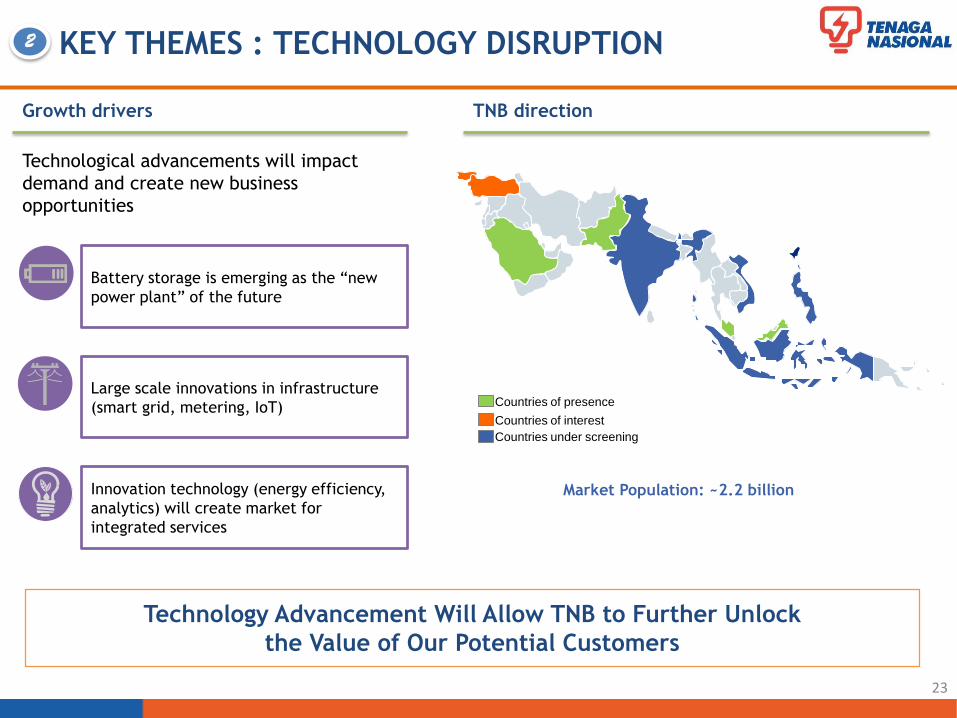
KEY THEMES : TECHNOLOGY DISRUPTION
Growth drivers
Technological advancements will impact
demand and create new business
opportunities
Innovation technology (energy efficiency,
analytics) will create market for
integrated services
Battery storage is emerging as the “new
power plant” of the future
Large scale innovations in infrastructure
(smart grid, metering, IoT)
TNB direction
Market Population: ~2.2 billion
Technology Advancement Will Allow TNB to Further Unlock
the Value of Our Potential Customers
23
2
Countries of presence
Countries of interest
Countries under screening
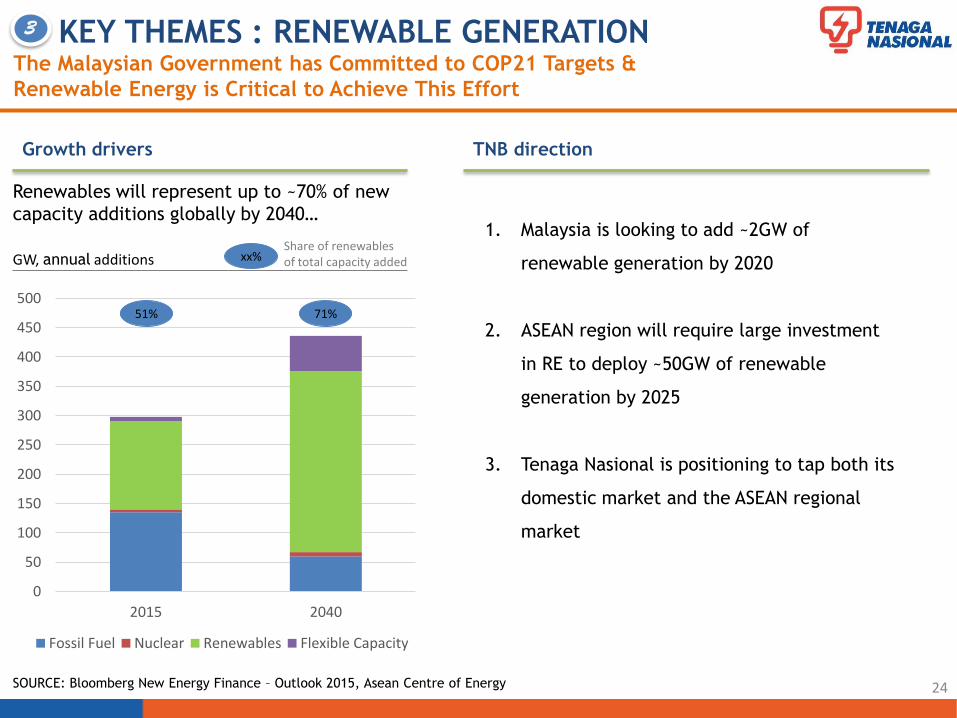
0
50
100
150
200
250
300
350
400
450
500
2015 2040
Fossil Fuel Nuclear Renewables Flexible Capacity
Growth drivers TNB direction
GW, annual additionsShare of renewables of total capacity added
51% 71%
xx%
SOURCE: Bloomberg New Energy Finance – Outlook 2015, Asean Centre of Energy
Renewables will represent up to ~70% of new
capacity additions globally by 2040…1. Malaysia is looking to add ~2GW of
renewable generation by 2020
2. ASEAN region will require large investment
in RE to deploy ~50GW of renewable
generation by 2025
3. Tenaga Nasional is positioning to tap both its
domestic market and the ASEAN regional
market
KEY THEMES : RENEWABLE GENERATION
24
The Malaysian Government has Committed to COP21 Targets &
Renewable Energy is Critical to Achieve This Effort
3
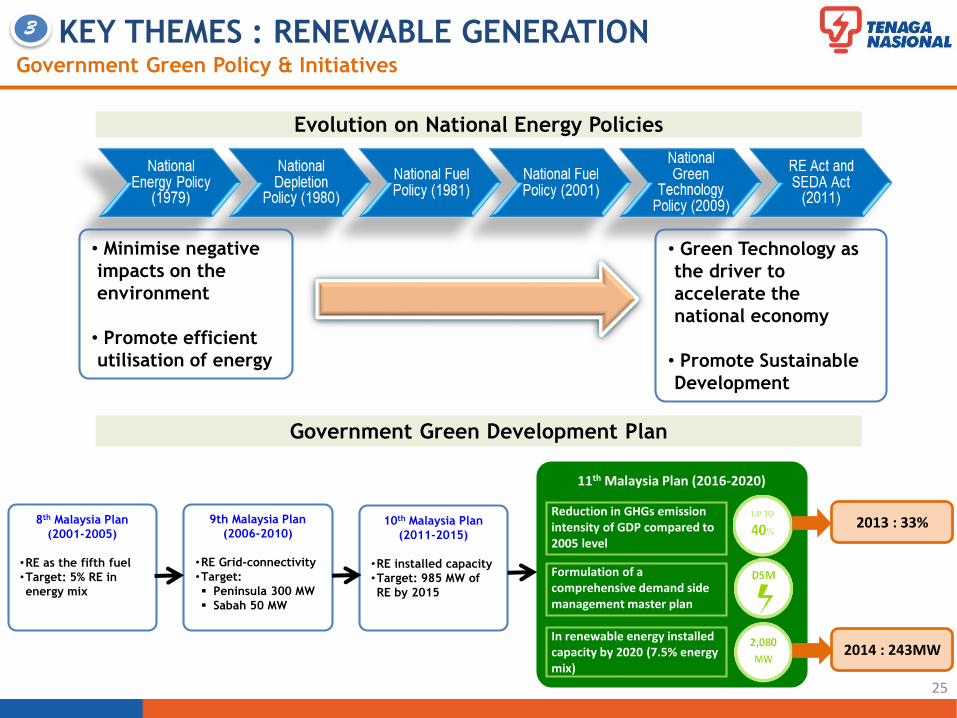
Government Green Policy & Initiatives
Evolution on National Energy Policies
2013 : 33%8th Malaysia Plan
(2001-2005)
•RE as the fifth fuel
•Target: 5% RE in
energy mix
9th Malaysia Plan
(2006-2010)
•RE Grid-connectivity
•Target:
Peninsula 300 MW
Sabah 50 MW
10th Malaysia Plan
(2011-2015)
•RE installed capacity
•Target: 985 MW of
RE by 2015
11th Malaysia Plan (2016-2020)
Reduction in GHGs emission intensity of GDP compared to 2005 level
Formulation of a comprehensive demand side management master plan
In renewable energy installed capacity by 2020 (7.5% energy mix)
2014 : 243MW
• Minimise negative
impacts on the
environment
• Promote efficient
utilisation of energy
• Green Technology as
the driver to
accelerate the
national economy
• Promote Sustainable
Development
Government Green Development Plan
25
3 KEY THEMES : RENEWABLE GENERATION
TNB Green Policy & Initiatives
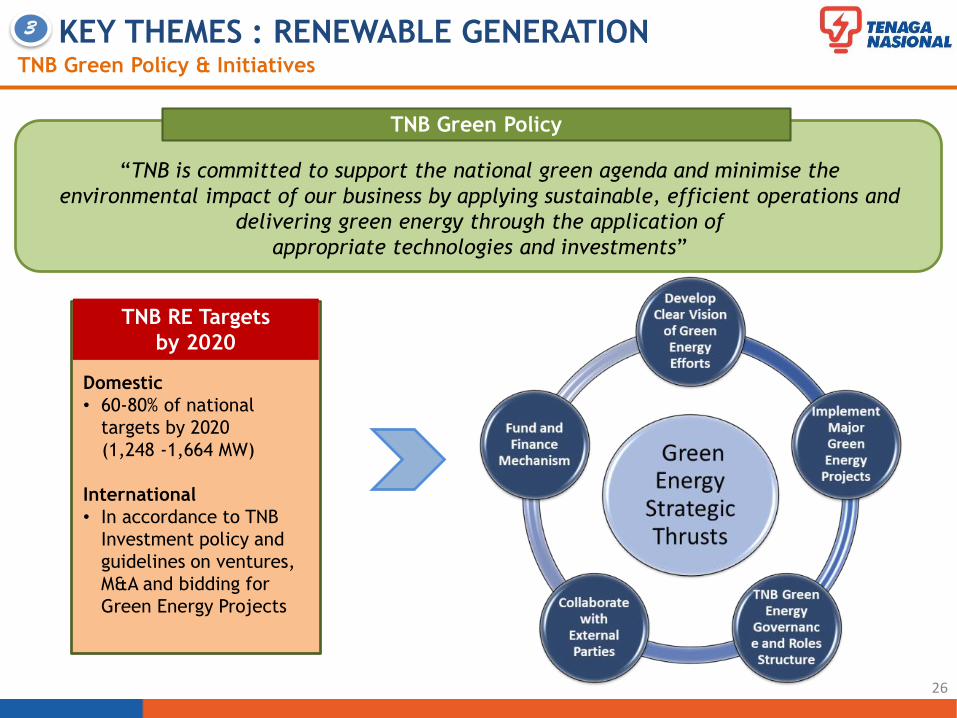
TNB Green Policy
“TNB is committed to support the national green agenda and minimise the
environmental impact of our business by applying sustainable, efficient operations and
delivering green energy through the application of
appropriate technologies and investments”
TNB RE Targets
by 2020
Domestic
• 60-80% of national
targets by 2020
(1,248 -1,664 MW)
International
• In accordance to TNB
Investment policy and
guidelines on ventures,
M&A and bidding for
Green Energy Projects
26
3 KEY THEMES : RENEWABLE GENERATION
TNB Green Policy & Initiatives
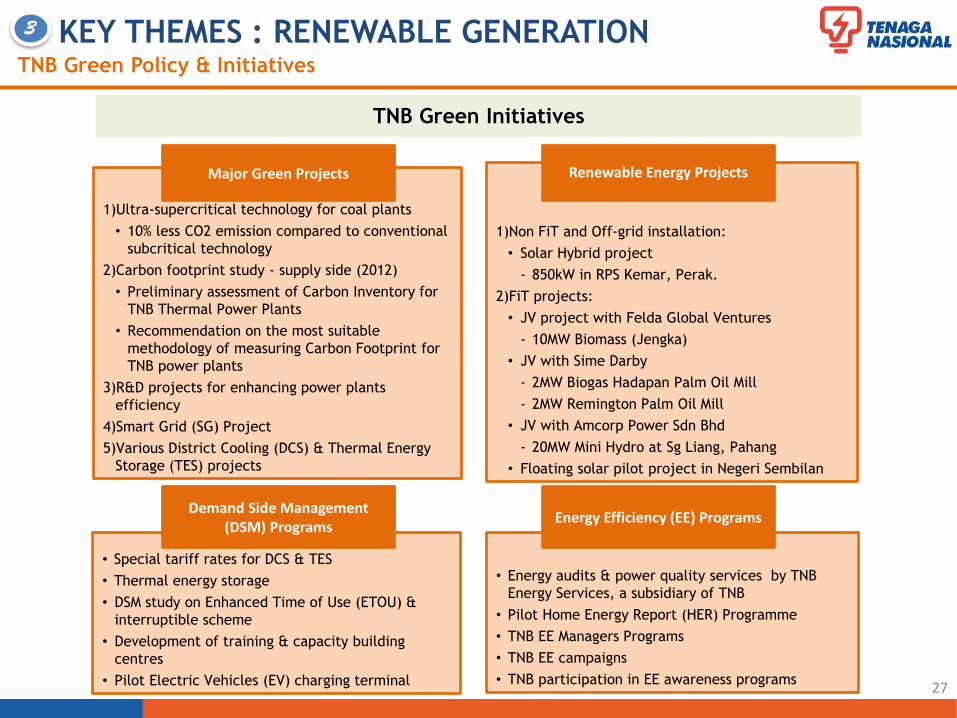
1)Ultra-supercritical technology for coal plants
• 10% less CO2 emission compared to conventional
subcritical technology
2)Carbon footprint study - supply side (2012)
• Preliminary assessment of Carbon Inventory for
TNB Thermal Power Plants
• Recommendation on the most suitable
methodology of measuring Carbon Footprint for
TNB power plants
3)R&D projects for enhancing power plants
efficiency
4)Smart Grid (SG) Project
5)Various District Cooling (DCS) & Thermal Energy
Storage (TES) projects
1)Non FiT and Off-grid installation:
• Solar Hybrid project
- 850kW in RPS Kemar, Perak.
2)FiT projects:
• JV project with Felda Global Ventures
- 10MW Biomass (Jengka)
• JV with Sime Darby
- 2MW Biogas Hadapan Palm Oil Mill
- 2MW Remington Palm Oil Mill
• JV with Amcorp Power Sdn Bhd
- 20MW Mini Hydro at Sg Liang, Pahang
• Floating solar pilot project in Negeri Sembilan
• Special tariff rates for DCS & TES
• Thermal energy storage
• DSM study on Enhanced Time of Use (ETOU) &
interruptible scheme
• Development of training & capacity building
centres
• Pilot Electric Vehicles (EV) charging terminal
• Energy audits & power quality services by TNB
Energy Services, a subsidiary of TNB
• Pilot Home Energy Report (HER) Programme
• TNB EE Managers Programs
• TNB EE campaigns
• TNB participation in EE awareness programs
Renewable Energy ProjectsMajor Green Projects
Energy Efficiency (EE) ProgramsDemand Side Management
(DSM) Programs
27
TNB Green Initiatives
3 KEY THEMES : RENEWABLE GENERATION
AGENDA
28
1. INTRODUCTION TO TENAGA
2. INTRODUCTION TO MESI
3. TARIFF
4. BUSINESS STRATEGY & DIRECTION
5. DIVIDEND POLICY
6. FINANCIAL HIGHLIGHTS
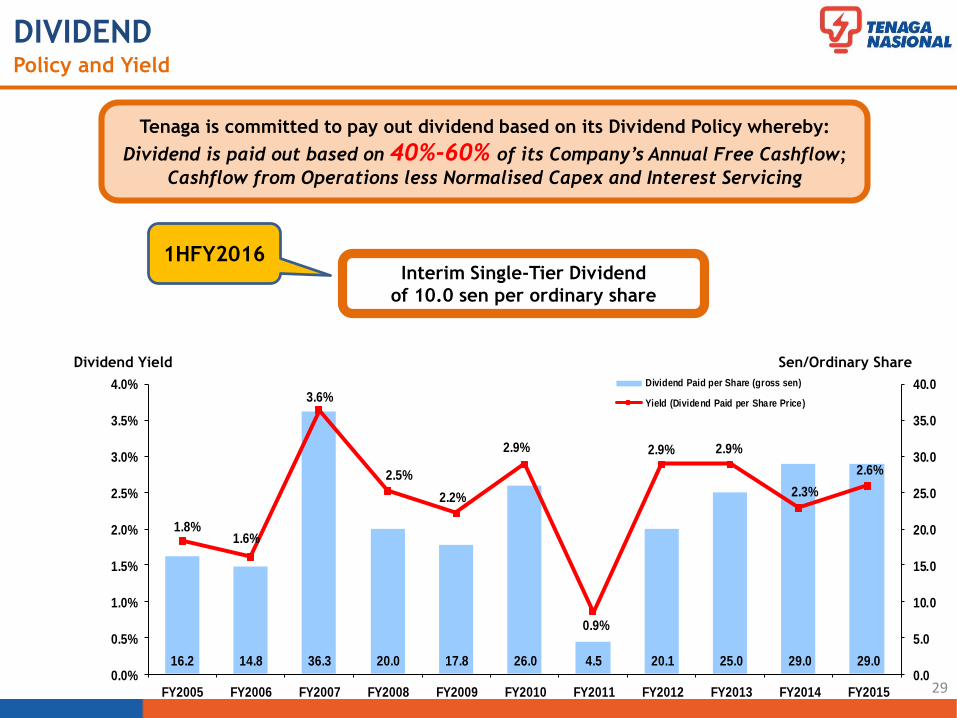
16.2 14.8 36.3 20.0 17.8 26.0 4.5 20.1 25.0 29.0 29.0
1.8%1.6%
3.6%
2.5%
2.2%
2.9%
0.9%
2.9% 2.9%
2.3%
2.6%
0.0
5.0
10.0
15.0
20.0
25.0
30.0
35.0
40.0
0.0%
0.5%
1.0%
1.5%
2.0%
2.5%
3.0%
3.5%
4.0%
FY2005 FY2006 FY2007 FY2008 FY2009 FY2010 FY2011 FY2012 FY2013 FY2014 FY2015
Dividend Paid per Share (gross sen)
Yield (Dividend Paid per Share Price)
DIVIDENDPolicy and Yield
29
Sen/Ordinary Share
Tenaga is committed to pay out dividend based on its Dividend Policy whereby:
Dividend is paid out based on 40%-60% of its Company’s Annual Free Cashflow;
Cashflow from Operations less Normalised Capex and Interest Servicing
Dividend Yield
Interim Single-Tier Dividend
of 10.0 sen per ordinary share
1HFY2016

AGENDA
30
1. INTRODUCTION TO TENAGA
2. INTRODUCTION TO MESI
3. TARIFF
4. BUSINESS STRATEGY & DIRECTION
5. DIVIDEND POLICY
6. FINANCIAL HIGHLIGHTS
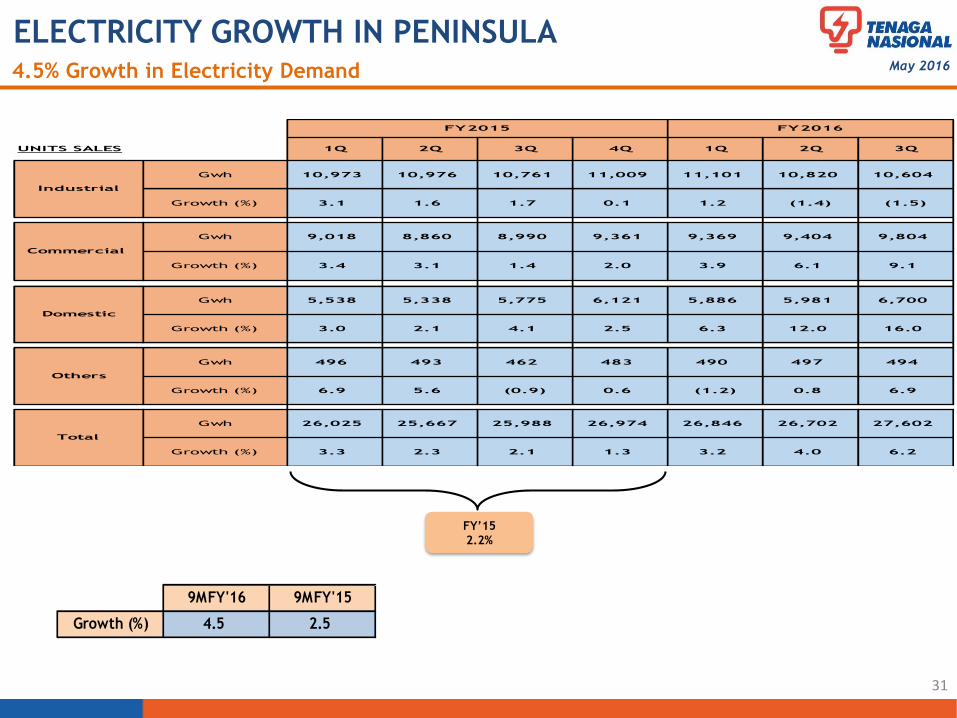
ELECTRICITY GROWTH IN PENINSULA 4.5% Growth in Electricity Demand
31
May 2016
FY’15
2.2%
9MFY'16 9MFY'15
Growth (%) 4.5 2.5
UNITS SALES 1Q 2Q 3Q 4Q 1Q 2Q 3Q
Gwh 10,973 10,976 10,761 11,009 11,101 10,820 10,604
Growth (%) 3.1 1.6 1.7 0.1 1.2 (1.4) (1.5)
Gwh 9,018 8,860 8,990 9,361 9,369 9,404 9,804
Growth (%) 3.4 3.1 1.4 2.0 3.9 6.1 9.1
Gwh 5,538 5,338 5,775 6,121 5,886 5,981 6,700
Growth (%) 3.0 2.1 4.1 2.5 6.3 12.0 16.0
Gwh 496 493 462 483 490 497 494
Growth (%) 6.9 5.6 (0.9) 0.6 (1.2) 0.8 6.9
Gwh 26,025 25,667 25,988 26,974 26,846 26,702 27,602
Growth (%) 3.3 2.3 2.1 1.3 3.2 4.0 6.2
FY2015 FY2016
Total
Industrial
Domestic
Others
Commercial
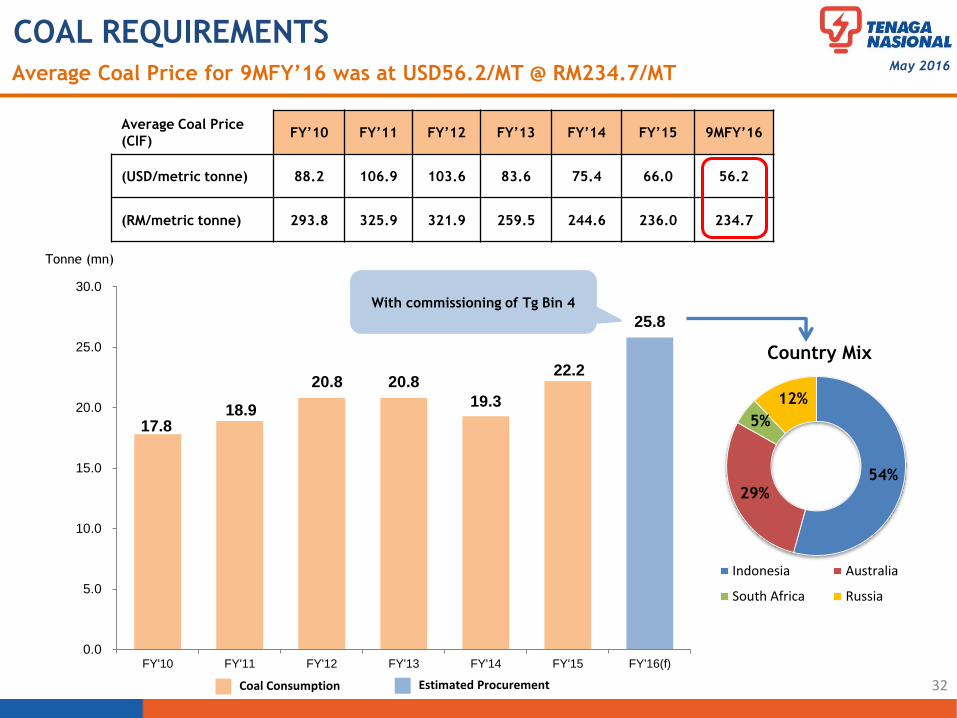
COAL REQUIREMENTSAverage Coal Price for 9MFY’16 was at USD56.2/MT @ RM234.7/MT May 2016
32
Average Coal Price
(CIF) FY’10 FY’11 FY’12 FY’13 FY’14 FY’15 9MFY’16
(USD/metric tonne) 88.2 106.9 103.6 83.6 75.4 66.0 56.2
(RM/metric tonne) 293.8 325.9 321.9 259.5 244.6 236.0 234.7
17.818.9
20.8 20.8
19.3
22.2
25.8
0.0
5.0
10.0
15.0
20.0
25.0
30.0
FY'10 FY'11 FY'12 FY'13 FY'14 FY'15 FY'16(f)
Tonne (mn)
Estimated Procurement
54%29%
5%
12%
Country Mix
Indonesia Australia
South Africa Russia
Coal Consumption
With commissioning of Tg Bin 4
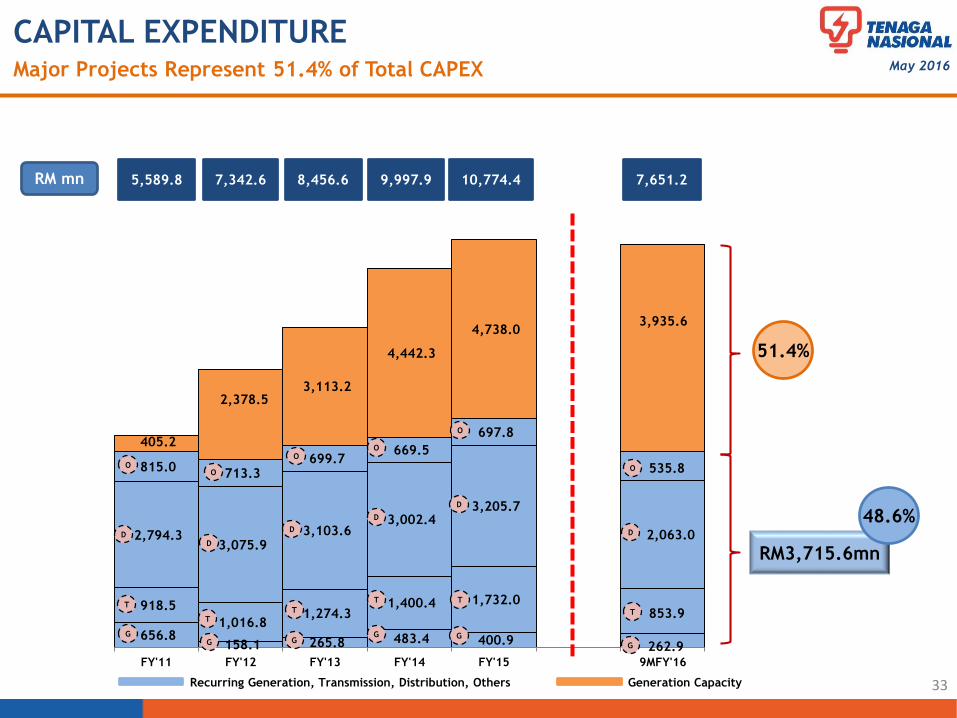
656.8 158.1 265.8 483.4 400.9
918.5
1,016.8 1,274.3
1,400.4 1,732.0
2,794.3 3,075.9
3,103.6 3,002.4
3,205.7
815.0 713.3
699.7 669.5
697.8 405.2
2,378.5 3,113.2
4,442.3
4,738.0
FY'11 FY'12 FY'13 FY'14 FY'15 9MFY'16
CAPITAL EXPENDITUREMajor Projects Represent 51.4% of Total CAPEX
51.4%
5,589.8 7,342.6 8,456.6 9,997.9 10,774.4
Recurring Generation, Transmission, Distribution, Others Generation Capacity
G
T
D
O
G
T
D
O
G
T
D
O
G
T
D
O
G
T
D
O
RM3,715.6mn
48.6%
33
May 2016
262.9
853.9
2,063.0
535.8
3,935.6
7,651.2
G
T
D
O
RM mn
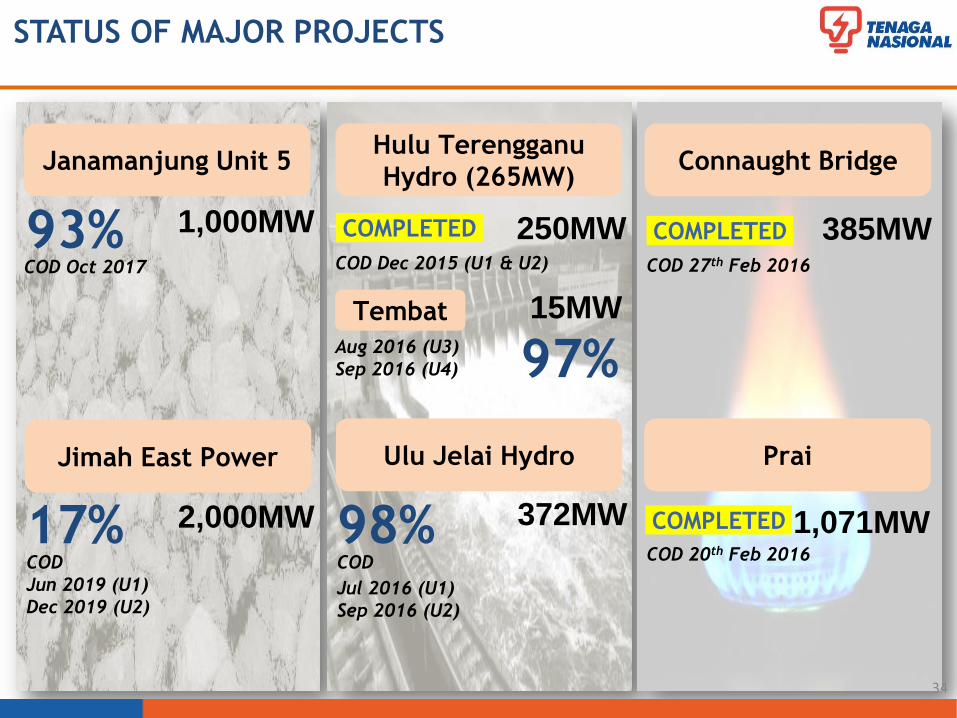
STATUS OF MAJOR PROJECTS
34
COD Oct 2017
1,000MW
Hulu Terengganu
Hydro (265MW)
250MW
Ulu Jelai Hydro
372MW
Prai
1,071MW
Connaught Bridge
385MW COD 27th Feb 2016
COD 20th Feb 2016
Aug 2016 (U3)
Sep 2016 (U4)
COD
Jul 2016 (U1)
Sep 2016 (U2)
COD Dec 2015 (U1 & U2)
COMPLETED COMPLETED
COMPLETED
COD
Jun 2019 (U1)
Dec 2019 (U2)
2,000MW
Janamanjung Unit 5
Jimah East Power
15MW
93%
17%
97%
98%
Tembat
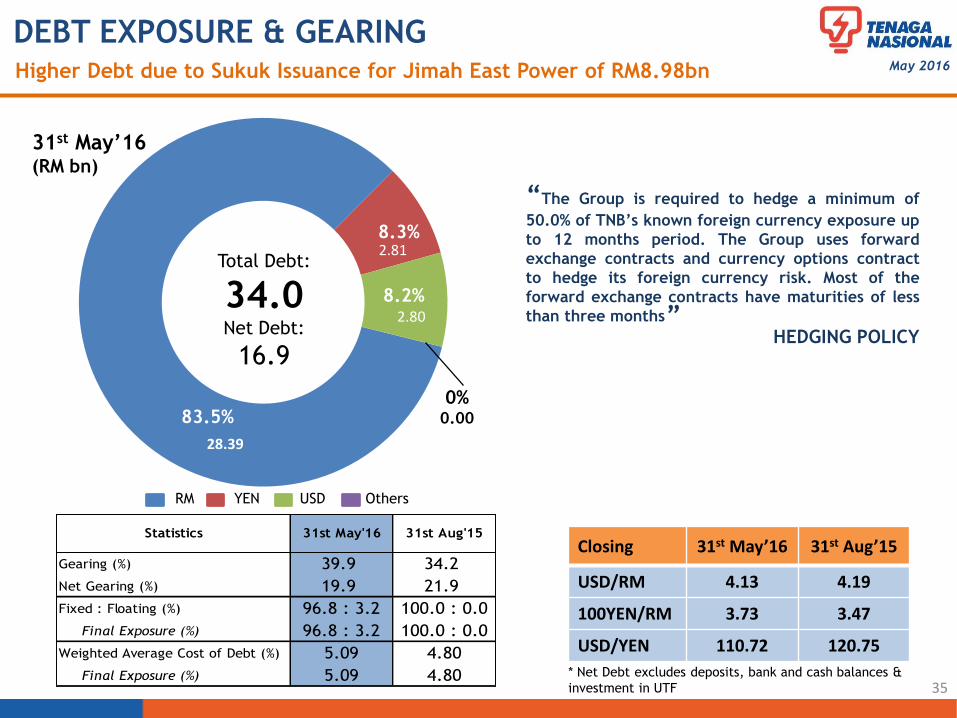
Gearing (%) 39.9 34.2
Net Gearing (%) 19.9 21.9
Fixed : Floating (%) 96.8 : 3.2 100.0 : 0.0
Final Exposure (%) 96.8 : 3.2 100.0 : 0.0
Weighted Average Cost of Debt (%) 5.09 4.80
Final Exposure (%) 5.09 4.80
31st May'16 31st Aug'15Statistics
Higher Debt due to Sukuk Issuance for Jimah East Power of RM8.98bn
DEBT EXPOSURE & GEARING
76.6%
10.3%
12.9%
“The Group is required to hedge a minimum of
50.0% of TNB’s known foreign currency exposure up
to 12 months period. The Group uses forward
exchange contracts and currency options contract
to hedge its foreign currency risk. Most of the
forward exchange contracts have maturities of less
than three months
HEDGING POLICY
35
”
* Net Debt excludes deposits, bank and cash balances &
investment in UTF
May 2016
28.39
2.81
2.80
83.5%
Total Debt:
34.0Net Debt:
16.9
8.3%
8.2%
0%0.00
31st May’16(RM bn)
RM YEN USD Others
Closing 31st May’16 31st Aug’15
USD/RM 4.13 4.19
100YEN/RM 3.73 3.47
USD/YEN 110.72 120.75
DISCLAIMER
All information contained herein is meant strictly for the use of this presentation only
and should not be used or relied on by any party for any other purpose and without the
prior written approval of TNB. The information contained herein is the property of
TNB and it is privileged and confidential in nature. TNB has the sole copyright to such
information and you are prohibited from disseminating, distributing, copying,
re-producing, using and/or disclosing this information.
CONTACT DETAILS
INVESTOR RELATIONS & MANAGEMENT
REPORTING DEPARTMENT
Tenaga Nasional Berhad
4th Floor, TNB Headquarters
No.129, Jalan Bangsar,
59200 Kuala Lumpur, MALAYSIA
Tel : +603 2296 5566
Fax : +603 2284 0095
Email : [email protected]
Website : www.tnb.com.my
IR OFFICERS:
Anida +603 2296 6077 [email protected]
Sherleen +603 2296 6183 [email protected]
Nadia +603 2296 6787 [email protected]
For further enquiries, kindly contact us at:

THANK YOU
Top Related