


Languages
Pages
Legal


Kristin Karleskint, Mohammed Moursy and David Lampert School of Civil & Environmental Engineering Oklahoma State University
Clarice Dyson and Jason FurtadoSchool of MeteorologyUniversity of Oklahoma

Source: https://www.ipcc.ch/publications_and_data/ar4/wg1/en/ch10s10-3-6-1.html
Changes in spatial patterns of precipitation intensity
Annual precipitation divided by number of wet days
Changes in number of consecutive dry days
Areas where the change is statistically significant

Climate changes are predicted to increase the magnitude and frequency of storms and flooding
In addition to destruction of buildings, flood risks pose threats to energy and transportation infrastructure
May/June 2015 storms in OklahomaRoads in OK were submerged in 9” of water
Thousands of OG&E customers experienced power outages in Oklahoma City and Del City
Flooding on the Wichita River (TX) caused 390 homes to be evacuated and 100,000 to go without power
Cumberland levee breached, flooding oil and gas wells and releasing pollution
http://www.nytimes.com/interactive/2016/08/16/us/louisiana-flooding-pictures-maps.html


Recent storms highlighted the flood risks to infrastructure
Need to analyze future flood risks associated with climate change and adapt accordingly
Need forecasts of the future climate and assessments of the existing flood control infrastructure
Risks will be influential in urban areas due to man-made alterations to the landscape, causing lower infiltration and higher surface runoff
The specific objectives of the research are to:Determine probabilities of future extreme storm events (1 in 100 year flood, 30-day extreme rainfall)
Analyze future flood inundation risks to infrastructure in the study area
Evaluate approaches for inundation risk mitigation (detention basins, low impact development, etc.)


• PRISM - Hi-res (4 km) temperature & precipitation data [Daly et al., 2002, 2008]
• Official climatological dataset for USDA.
• Use PRISM to calculate climatological precipitation distributions (e.g., daily, 30-day) for calculating observed thresholds of extremes.
http://www.prism.oregonstate.edu/

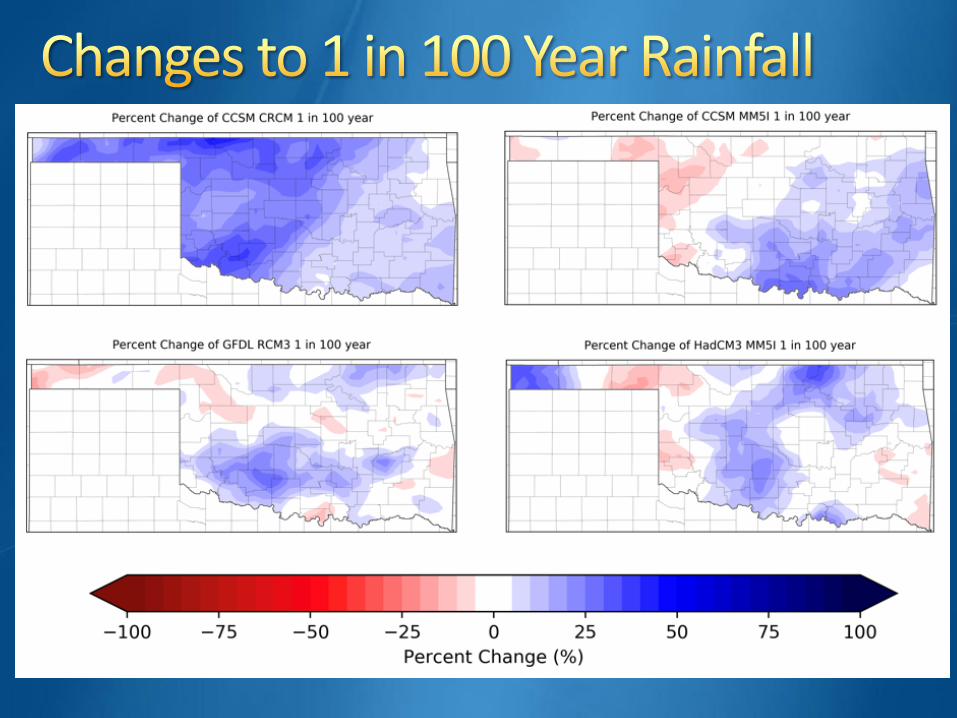
Observed Rainfall Frequency Data from PRISM to determine current 1 in 100 year rainfall

• NARCCAP - Regional climate models run over N. America (50 km resolution) [Mearns et al., 2007].
• Two experiments: Current (1968 - 2000) and Future(2041 - 2070) for comparison
• Total of 24 model-submodelcombinations, each with 30-year samples for analysis.
• Statistics of key variables: e.g., Precipitation, temperature, wind, humidity
http://www.narccap.ucar.edu/data/data-tables.html


12
Land Use Physical Hydrography +
Climate
Hydrology Parameters
Surface Water flow/quality
+
+

SWMM is a distributed, dynamic rainfall-runoff simulation model used for single event or long-term (continuous) simulation of runoff quantity and quality.

Approved for National Flood Insurance Program
Sophisticated representation of stormwaterinfrastructure
Simulation of low impact development
Small time steps (1 min to 1 day)
Single event or continuous simulations (essential for consideration of antecedent soil moisture)
Free and open source (EPA Sponsorship)
Difficult learning curve
Data intensive (climate data, observed hydrology, land use, catchment areas, infrastructure)

Highly urbanized area of approximately half forests/pasture and half developed land


Calibrate SWMM model for a select study area possessing critical infrastructure
Probability distributions of 30-day hourly rainfall for the existing and future climate
Incorporate flood control infrastructure
Impacts and costs of potential mitigation alternatives

Forecast future precipitation events using Climate Change ProjectionQuantify the inundated areasEvaluate inundation mitigation techniques
Storm water Infrastructure (Detention basins)
Porous Concrete
StormTechTM Drainage chambers
Reservoir operations
http://www.tectonica-online.com/products/2687/concrete_high-permeability_hydromedia/
http://www.stormtech.com/developers.html

Additional watersheds/infrastructure
Cost analysis/policy
Low impact development quantification
Water quality Implications of inundation of pollutant sources (contaminated areas, etc.)
Non-point source pollutant loadings)

Southern Plains Transportation Center
Army Corps of Engineers, Tulsa District
Oklahoma Water Resources Board
Oklahoma Department of Transportation
Top Related