


Languages
Pages
Legal

Tiphany Coralie de Bessa
Mecanismos associados à perda da regulação da nox1 NADPH oxidase pela
dissulfeto isomerase proteica em células com ativação sustentada da via ras
Tese apresentada à Faculdade de Medicina da Universidade de São Paulo
para obtenção do título de Doutor em Ciências
Programa de Cardiologia
Orientador: Prof. Dr. Francisco Rafael Martins Laurindo
São Paulo
2018


Tiphany Coralie de Bessa
Mechanisms associated with loss of regulation of NADPH oxidase nox1 by
protein disulfide isomerase in cells with sustained activation of the ras
pathway
Thesis dissertation from Faculty of Medicine, São Paulo university
PhD science Degree
Cardiology Post-graduation Program
Supervisor: Prof. Dr. Francisco Rafael Martins Laurindo
São Paulo
2018

To my grand-father Aurélio De Bessa
Eu gostaria de dedicar essa tese para o meu avô Aurélio De Bessa,
que já não esta mais entre nós. Ele sempre gostou muito de ler,
autodidacta, ele procurava sempre mais conhecimentos nos livros.
Para você avô, com todo meu coração.

Acknowledgment/ Agradecimentos/ Remerciment.
Ao Professor Francisco Laurindo, pela oportunidade, orientação, e por tudo
que eu aprendi observando e trabalhando ao lado dele.
A Hervé Kovacic pour sa supervision, toute son aide. Je le remercie pour
m’avoir donné l’opportunité de travailler au sein de son laboratoire, et d’avoir ouvert
mon horizon et permis de vivre cet incroyable aventure au brésil.
A Pascale et Diane, mes « mamans de laboratoires » qui ont posé les
fondations, et m’ont tout appris sur la paillasse. Merci pour votre soutient et vos
encouragements, qui m’ont fait persévérer jusqu’ici.
Aux copinettes : Nath, Marionette, Soaz et à Hélène pour toute son aide et
son soutient, surtout dans les coups dures.
A toute l’équipe 2 du CRO2, à Ludo pour toute son aide, son amitié, tous les
fous rires mémorables et nos conversations sur les quais de la SNCF. A Allesandra
pour son aide précieuse et sa collaboration sur ce projet. A Françoise pour son
oreille attentive. Vincent, José, Fabrice, François, Gilles, merci.
Para todos os colegas do LBV presentes e passados, Ana Moretti por toda a
ajuda e colaboração; Ana Garipo; Arruda; Carolina nossa gaúcha, amiga de verdade
e sempre voluntária para ajudar; Denise; Fernando; Jessica pela amizade; João
(petit Jean); Maria Bertoline; Leonora; Leonardo por todos os bons conselhos,

incentivos e pela amizade e o exemplo de dedicação. Luciana (e os Pescatores) por
toda a ajuda e carinho que me derem; Thais; Victor por todo o seu trabalho no
laboratório, sua ajuda e mais que tudo a amizade;
E em especial para Patricia e Percília companheiras de doutorado,
laboratório, e casa. Eu considero vocês como minha família do Brasil, sou grata pela
vossas amizades, “Que Tripla! ”
A Juliana, Maìra e Marcela, que abriram as portas da casa delas para uma
portuguesa recém chegada no Brasil e perdida na selva de pedra. Obrigada pelo
carinho a amizade e todos os bons momentos que compartilhamos.
Obrigados a todos por tudo, vocês tornaram essa jornada longe da minha
família, e das minhas raízes, bem mais fácil. Estarei sempre grata a deus de vos ter
encontrado.
A Diana pour son amitié et son soutient depuis la maternelle, ça en fait des
années tout ça, merci ma Didi pour tes encouragements tout au long de ces années.
E mais que tudo queria agradecer a minha família meu Pilar. Principalmente
aos meus pais a quem eu devo tudo e que sempre lutaram para eu ter a melhor
educação possível, e minhas irmãs lindas Laetitia e Marina. Eles sempre me
ajudaram e estiveram do meu lado, apoiando todas as minhas decisões até quando
eu fui mudar-me para outro hemisfério, Obrigado.

Financial support:
This project was support by FAPESP (Fundação de Amparo a Pesquisa do
Estado de São Paulo). Grant: 2013/02070-6 (doctoral scholarship) and 2016/00686-8
(BEPE scholarship), Grant 2009/54764-6 (AP.TEM); and CEPID project Redoxome :
Redox processes in Biomedecine . We were also supported by Fundacao Zerbini and
ARCUS.

Standardization
This thesis is in accordance with standards of the time of it publication:
References: adapted from International Committee of Medical Journals Editors
(Vancouver).
University of Sao Paulo. Faculty of Medicine. Library and Documentation Division.
Guide for dissertations and theses submission. Prepared by Anneliese Carneiro da
Cunha, Maria Julia de A. L. Freddi, Maria F. Crestana, Marinalva de Souza Aragão,
Suely Campos Cardoso, Valéria Vilhena. 3a ed. São Paulo: Library and
Documentation Division; 2011.
Journal abbreviations according to the List of Journals Indexed in Index Medicus.

SUMMARY
1 INTRODUCTION 1
1.1 Correlation between ROS and cancer 2
1.2 NADPH oxidases 3
1.2.1 Nox family and NADPH oxidases complexes 3
1.2.2 Nox NADPH oxidases and cancer 4
1.3 Protein Disulfide Isomerases 6
1.3.1 Protein Disulfide Isomerases in redox signaling and homeostasis 6
1.3.2 Protein Disulfide Isomerases and cancer 9
1.3.3 PDIA1 interact with Nox family NADPH oxidases 9
1.3.4 Protein Disulfide Isomerase and RhoGTPases 11
1.4 Migration in cancer, and Epithelial Mesenchymal Transition 12
1.5 Cancer colorectal 13
2 OBJECTIVES 15
2.1 Principal aim 16
2.2 Specific aims 16
3 MATERIALS AND METHODS 17
3.1 Reagents 18
3.2 Cell Culture 18
3.3 Cell Transfection 18
3.4 Western blot analysis 19
3.5 PDIA1 quantification by ELISA 19
3.6 Measurement of Rac1 and Ras activity 20
3.7 Co-immunoprecipitation experiments 20
3.8 Detection of ROS Production 21
3.9 Lucigenin oxidation assay 21
3.10 PathScan® Intracellular Signaling Array 22
3.11 Cell migration assays spheroids 22

3.12 RNASeq Datamining 23
3.13 Statistical Analyses 23
4 RESULTS 24
4.1 Cell models used in the present study 25
4.2 PDIA1 expression corelate with Ras activation 25
4.3 PDIA1 silencing promotes a dual, Ras-dependent, effect on superoxide
production 28
4.4 PDIA1 silencing sustains superoxide production in HCT116 through Nox1
NADPH oxidase complex 31
4.5 KRas overactivation bypasses PDIA1/ Nox1 regulation by sustaining high Rac1
activity 34
4.6 PDIA1-mediated effects on superoxide generation potentially involves its
interactions with KRas and Rac1 35
4.7 Screening of cell signaling routes affected by PDIA1 silencing highlight GSK3β
and Stat3. 36
4.8 Functional effects of PDIA1 silencing on cell proliferation and migration 40
4.9 Enrichment pathway analysis of protein interaction networks 42
5 DISCUSSION 44
6 SUPPLEMENTARY DATA 51
7 REFERENCES 56
8 CURRICULUM VITAE 64

List of abbreviations
* : stop codon
Ang II: angiotensin II
APC: adenomatous polyposis coli
Ca. : “circa”
CDKN2A: cyclin-dependent kinase Inhibitor 2A
CTNNB1: Catenin beta-1
CRC: colorectal cancer
del: deletion
DHE: dihydroethidium
DMEM: Dulbecco's modified Eagle's medium
DNA: Deoxyribonucleic acid
DNTB: Dinitrothiocyanobenzene
DPI: Diphenyleneiodonium chloride
E-cad: E-Cadherin
ELISA: Enzyme-Linked Immunosorbent Assay
e.g: “exempli gratia”
EGF: Epidermal growth factor
EMT: epithelial-mesenchymal transition
EOH: 2-hidroxyethidiium
ER: endoplasmic reticulum
FBS: fetal bovine serum
FDR: False discovery rate
FPKM: Fragments Per Kilobase Million
fs* : frame shift
GEF: guanine exchange factors
GAP: guanine-activating proteins
GAPDH: Glyceraldehyde 3-phosphate dehydrogenase
GDP: guanosine diphosphate
GO: gene ontology
GSK3β: Glycogen synthase kinase-3 beta
GST-RBD: glutathione S-transferase-Ras binding domain
GTP: Guanosine triphosphate

HBSS: Hanks’ Balanced Salt solution
HPLC: High-performance liquid chromatography
HRP: horseradish peroxidase
IGG: immunoglobulin G
IB: immunoblot
IP: immunoprecipitation
KEGG: Kyoto Encyclopedia of Genes and Genomes database
KRAS: Kirsten rat sarcoma viral oncogene
KRas: Kirsten rat sarcoma viral protein
mRNA: messenger RNA
NAC: N-Acetyl-L-cysteine
Nb : “Nota bene”
Nox: NADPH oxidase isoform (Non-phagocytic oxidase )
NoxA1: Nox Activator 1
NoxA1ds: Nox1 peptide inhibitor
NoxO1: Nox organizer 1
P4HB: Prolyl 4-hydroxylase subunit beta gene name of PDIA1
PACMA: propionic acid carbamoyl methyl amide
PBS: Phosphate Buffered Saline
PDGF: platelet-derived growth factor
PDI: protein disulfide isomerases
pec: peri/epicellular
PK3CA: Phosphatidylinositol-4,5-Bisphosphate 3-Kinase Catalytic Subunit Alpha
PPI: Protein-protein interaction
psi: pound force per square inch, pressure unit
Rac1: Ras-related C3 botulinum toxin substrate 1
RhoGDI: Rho- guanine dissociation inhibitors
RNA: ribonucleic acid
RNAseq: RNA sequencing
ROS: reactive oxygen species
Scrmb : scrambled
SDS-PAGE: sodium dodecyl sulfate polyacrylamide gel electrophoresis
Ser9: serine 9
siRNA: small interfering RNA

si-PDI: si-RNA against PDIA1
si-Nox1: si-RNA against Nox1
SMAD4: SMAD family member 4
SOD: superoxide dismutase
T0: Time 0 hour
T48h: Time 48 hour
TMB: tetramethylbenzidine
Tyr705 : Tyrosine 705
vs.: “versus”
VSMC: vascular smooth muscle cell

List of Figures
Figure 1: Nox family /NADPH oxidases enzymatic complex 4
Figure 2: Structural features of PDIA1 7
Figure 3: RhoGTPas regulation schema. 11
Figure 4: Epithelial-mesenchymal transition schema. 13
Table1: Colon carcinoma cell line characterization and respective mutations. 26
Figure 5: PDIA1 expression corrolate with KRas activation: 27
Figure 6: Role of PDIA1 in oxidant generation 29
Figure 7: Measure of ROS production in Caco2 ,HKE3, HCT116 and HT29-D4. 30
Figure 8: Expression of Nox NADPH oxidase subunits and RhoGTPase-related 32
Figure 9: Effects of PDIA1 silencing in Nox1-dependent superoxide generation by 33
Figure 10: Role of Rac1 in the regulation of PDIA1 – Nox1 axis: 34
Figure 11: PDIA1 co-immunoprecipitation 36
Figure 12: PathScan Assay screening of cell signaling targets 38
Figure 13: Effects of PDIA1 silencing on epithelial phenotype 39
Figure 14: Effects of PDIA1 silencing on spheroid growth / invasiveness 41
Figure 15: Analysis of protein-protein interaction network and functional pathways 43
Figure 16: Model of PDIA1-associated regulation of Nox1 46
Figure s1: Basal superoxide production in HKE3 and HCT116 52
Figure S2: P4HB (PDIA1) gene expression 52
Figure S3: PDIA1 coimmunoprecipitation in HUVEC cells. 53
Figure S4 : PathScan Assay screening of cell signaling targets of PDIA1. 54
Figure S5: Effects of PDIA1 silencing on GSK3 inactivation in HKE3 and HCT116. 55
Supplementary Table1: Effect of PDIA1 silencing in HT29-D4 single cell migration. 55

Resumo
de Bessa TC. Mecanismos associados à perda da regulação da Nox1 NADPH
oxidase pela dissulfeto isomerase proteica em células com ativação sustentada da
via ras [tese]. São Paulo: Faculdade de Medicina, Universidade de São Paulo; 2018.
Dissulfeto isomerase proteica como a PDIA1 tem sido implicada na progressão do
câncer, porém os mecanismos envolvidos ainda não foram claramente identificados.
Previamente, nós demonstramos um importante efeito da PDIA1 induzindo a
superexpressão da Nox1 NADPH oxidase, associada à geração de espécie reativas
de oxigênio (ROS). Uma vez que a perda na regulação de ROS envolve o
crescimento tumoral, nós propusemos que a PDIA1 atua como um mecanismo
regulador proximal na produção de ROS em tumores. No presente estudo, nós
focamos no câncer colorretal (CRC) com distintos efeitos na ativação de KRas.
Resultados provenientes de bancos de dados de RNAsec e validação direta, indicam
um significante aumento na expressão de PDIA1 em CRC com alta ativação
constitutiva da Kras (HCT116) vs. ativação intermediária (HKE3) ou basal (Caco2). A
PDIA1 sustenta a produção de superóxido dependente da Nox1 em CRC;
entretanto, observamos pela primeira vez uma ação dupla da PDIA1 correlacionada
ao nível de ativação da Ras: em células Caco2 e HKE3, experimentos de perda de
função indicam que o PDIA1 sustenta a produção de superóxido dependente de
Nox1; no entanto, em células HCT116, PDIA1 limita a produção de superóxido pela
Nox1. Este comportamento da PDIA1 é associado ao aumento da expressão /
atividade da Rac1. A transfecção do mutante constitutivamente ativo Rac1G12V em
células HKE3 faz com que a PDIA1 se torne restritiva a produção de superóxido
dependente de Nox1, paralelamente, em células HCT116 tratadas com inibidor da
Rac1, PDIA1 se torna favorável à produção de superóxido. Um screening em
importantes vias de sinalização celular em HKE3 mostrou que a perda de função da
PDIA1 promove inativacao da GSK3β em paralelo à diminuicao da ativacao de
Stat3; em HCT116 em estado basal, GSK3β é inativada enquanto Stat3 está ativa, já
o silenciamento da PDIA1 não resulta em nenhum efeito adicional. As implicações
funcionais do silenciamento da PDIA1 incluíram uma diminuição da proliferação e
migração celular em HKE3, não detectável em HCT116. Além disso, a PDIA1 parece
sustentar a transição epitélio-mesenquimal (EMT), uma vez que após o
silenciamento da PDIA1, observamos um aumento da expressão da E-caderina em

HKE3 e uma diminuição em HCT116. Assim, a superativação da Ras se associa a
uma alteração no padrão de regulação da Nox1 pela PDIA1. A supressão do efeito
regulador da PDIA1 pela Kras é provavelmente devido a uma ativação sustentada
da Rac1. Portanto, PDIA1 pode exercer um papel redox-dependente adaptativo
crucial relacionado à progressão tumoral.
Descritores: 1- isomerase de dissulfetos de proteínas; 2- NADPH oxidase; 3-
proteínas ras; 4- espécies de oxigênio reativas; 5- neoplasias; 6- superóxidos; 7-
inibidores da dissociação do nucleotídeo guaninarho-específica; 8- proto-oncogenes;
9- estresse oxidativo.

Abstract
de Bessa TC. Mechanisms associated with loss of regulation of NADPH oxidase
nox1 by protein disulfide isomerase in cells with sustained activation of the ras
pathway [thesis]. Sao Paulo: “Faculdade de Medicina, Universidade de Sao Paulo”;
2018.
Protein disulfide isomerases such as PDIA1 have been implicated in cancer
progression, but the underlying mechanisms are unclear. We showed previously
important PDIA1 effects enabling vascular Nox1 NADPH oxidase expression and
associated generation of reactive oxygen species (ROS). Since deregulated ROS
production underlies tumor growth, we proposed that PDIA1 acts as an upstream
regulatory mechanism of tumor-associated ROS production. We focused on
colorectal cancer (CRC) with distinct levels of KRas activation. Our results from
RNAseq databanks and direct validation indicate significant increase in PDIA1
expression in CRC with constitutive high (HCT116) vs. moderate (HKE3) or basal
(e.g. Caco2) Ras activity. PDIA1 supported Nox1-dependent superoxide production
in CRC; however, we observed for the first time a dual effect correlated with Ras
level activity: in Caco2 and HKE3 cells, loss-of-function experiments indicate that
PDIA1 sustains Nox1-dependent superoxide production; however, in HCT116 cells,
PDIA1 restricted Nox1-dependent superoxide production. This PDIA1 behavior in
HCT116 is associated with increased Rac1 expression/activity. Transfection of
Rac1G12V active mutant into HKE3 cells induced PDIA1 to become restrictive of
Nox1-dependent superoxide; accordingly, in HCT116 cells treated with Rac1
inhibitor, PDIA1 became supportive of superoxide production. Screening of cell
signaling routes affected by PDIA1 silencing showed induced GSK3β inactivation and
parallel decrease of active Stat3 in HKE3 cells; in baseline HCT116 cells, GSK3β
was inactivated and Stat3 active, whereas PDIA1 silencing had no further effect.
Functional implications of PDIA1 silencing included a decrease of cell proliferation
and migration in HKE3, not detectable in HCT116 cells. Also, PDIA1 may support
epithelial-mesenchymal transition (EMT), since after PDIA1 silencing, E-cadherin
expression increased in HKE3 and decreased in HCT116. Thus, Ras overaction
associates with a switched in PDIA1 pattern regulation of Nox1. Ras-induced PDIA1

bypass may involve direct Rac1 activation. Therefore, PDIA1 may be a crucial
regulator of redox-dependent adaptive processes related to cancer progression.
Descriptors: 1- protein disulfide-isomerases; 2- NADPH oxidase; 3- ras proteins; 4-
reactive oxygen species; 5- neoplasms; 6- superoxides; 7- rho-specific guanine
nucleotide dissociation inhibitors; 8- proto-oncogenes; 9- oxidative stress

Résumé
Les protéines disulfides isomérase comme PDIA1 ont été identifié comme étant
impliqué dans les processus de cancérisation et progression tumoral. Toute fois les
mécanismes par lesquels elle serait impliqués non pas été clairement identifiés.
Dans de précédentes études nous avons montré une action importante de PDIA1 sur
l’activation de la NADPH oxydase 1 Nox1 et sur la production de ROS associé a
cette activation, dans les cellules du muscle lisse vasculaire (VSMC). En nous basant
sur l’importance du rôle de la production de ROS dans les processus de
cancérisation et de progression tumoral, et les données obtenu au préalable, sur le
rôle de PDIA1 dans la régulation de Nox1, nous avons émis l’hypothèse PDIA1
pourrait agir en amont para la régulation de la production ROS associé au processus
tumoraux. Pour cela nous avons choisie de travailler avec différentes lignées
cellulaires de cancer colorectal (CRC) qui exprime plusieurs niveaux d’activation de
KRas. Une analyse par bio-informatique nous as permis d’établir une corrélation
entre l’expression de PDIA1 et l’activation de KRas. Cette corrélation a par la suite a
été confirmé par western blot, en effet les cellules qui présente une plus grande
activation de K-ras exprime plus De PDIA1 HCT116> HKE3> Caco2. PDIA1
maintient la production de superoxyde dépendante de Nox1 dans le CRC.
Cependant, pour la première fois nous avons observé une double action de PDIA1
sur la production de superoxyde corrélé a l'activation de KRas: dans les cellules
Caco2 et HKE3, l’inhibition de PDIA1 par si-RNA montre que PDIA1 stimule la
production de superoxyde dépendante de Nox1. Alors que dans les cellules HCT116,
PDIA1 limite la production de superoxyde. Ce comportement de PDIA1 dans
HCT116 est associé à une augmentation de l'expression / activité Rac1. L’expression
du mutant constitutivement actif Rac1G12V dans les HKE3 induit PDIA1 à restreindre
la production de superoxyde dépendant de Nox1. Un screening des l’effets de
l’inhibition de PDIA1 sur les grandes voies de signalisation cellulaire a montré dans
les HKE3 une inactivation parallèle de GSK3ß et Stat3 suite à l’inhibition de PDIA1.
Alors que dans les HCT116, GSK3β semble être inhibé à l’état basal et Stat3 activé,
sans aucun effet de l’inhibition de PDIA1. L'inactivation de PDIA1 induit une
diminution de la prolifération et de la migration cellulaire dans les HKE3, alors que
aucun effet n’est détectable dans les HCT116. De plus nous avons identifiez un
possible rôle de PDIA1 dans la transition épithéliale-mésenchymateuse (EMT),
l’inhibition de PDIA1, induit une augmentation de l'expression de la E-cadhérine dans

les HKE3 alors qu’elle induit une diminution dans les HCT116. La suractivation de
Ras semble induire un changement dans le comportement de PDIA1 dans la
régulation de Nox1. PDIA1 semble avoir rôle important dans la régulation de la
production de ROS et les mécanismes d’adaptation au stress oxydatif permettent la
survie cellulaire.

1 Introduction

Introduction -2
Reactive oxygen species (ROS) are ubiquitous intermediates associated with
partial states of oxygen reduction and comprise free radicals such as superoxide,
nitric oxide, carbonate etc, or associated non-free radicals such as hydrogen
peroxide and peroxynitrite. These intermediates relate to a number of redox-
regulated targets, which include metal compounds or metalloproteins and thiol
compounds, including protein and nonprotein thiols. Understanding the regulation of
ROS metabolism and associated redox cell signaling is essential to advance into the
mechanisms of normal and pathological cell (patho)physiology. Redox dysregulation
has been described and investigated in essentially all types of disease, in particular
chronic-degenerative diseases such as cardiovascular (hypertension,
atherosclerosis), diabetes, neurodegeneration and cancer (1, 2) . However, the
involvement of redox processes in disease is not so straightforward. In fact, the
dysregulation of ROS production does not sum up to a simple imbalance between
oxidant and antioxidants, but is rather the result of loss of equilibrium of in redox
signaling. One can also model oxidative stress as a disrupted redox signaling
modularity (3). Redox signaling is involved in key process such as proliferation,
migration, differentiation, apoptosis and survival; such responses are modulated by
the type of ROS intermediate, amount, cellular sub-compartmentation, enzymatic
source, physiologic cellular context and cell type. In cancer, a significantly enhanced
output of ROS is known to engage into disrupted signaling routes that further support
tumorigenesis or metastasis (1, 4). On the other hand, in some instances, oxidant
processes can suppress tumor propagation(5). Such a dual behavior occurs in many
other diseases. Most mechanisms accounting for enhanced oxidant generation
converge to enzymatic sources of ROS, which include mitochondrial electron
transport and Nox family NADPH oxidases (2). Noxes, in particular, have been
increasingly implicated in the pathophysiology of cancer (6). However, the upstream
mechanisms that govern Nox-dependent processes in cancer cells are unclear, as
follows.
1.1 Correlation between ROS and cancer
ROS production dysregulation is a well-known hallmark of cancerization. ROS
production is uniformely increased in tumor cells when compared to their non-tumoral
cell counterparts. Enhanced ROS production and associated oxidative stress can

Introduction -3
promote cancer initiation by inducing DNA damage, which lead to accumulation of
mutations, genomic instability, and potential oncogenic mutations (1). In addition,
after cancer initiation, sustained moderate fluxes of ROS sustain redox cell signaling
and promote oncogenic hallmarks (7, 8) such as proliferation and migration, two key
processes for tumoral progression, invasiveness, and metastasis formation.
Fibroblasts transfected with proto-oncogene H-Ras mutant exhibit increased ROS
production, leading to cell cancerization (9). Sublethal injection of H2O2 in murine
model of lung cancer enhanced metastasis (10). The main sources of ROS in cancer
cells are mitochondrial ROS due to an increase of cancer cell metabolism and the
enzymatic complex NADPH oxidase activation.
1.2 NADPH oxidases
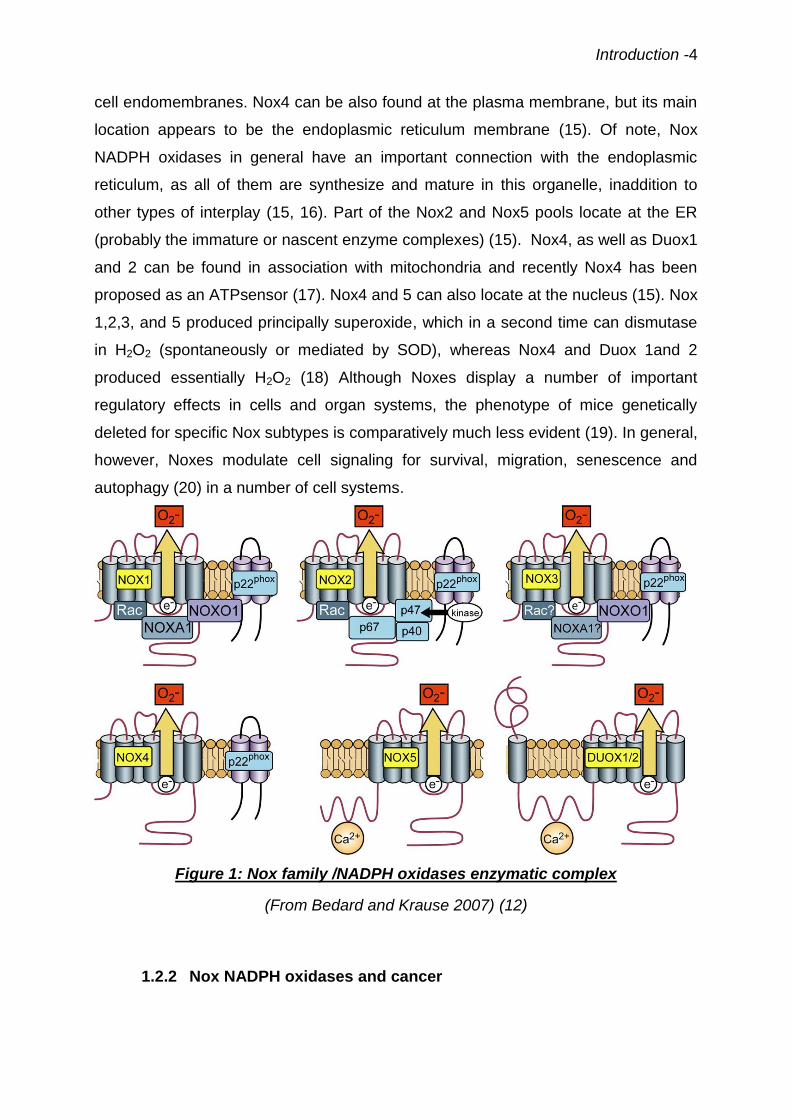
1.2.1 Nox family and NADPH oxidases complexes
NADPH oxidases are enzymatic complex which catalyze oxygen reduction
using NADPH as an electron donor, generating superoxide (O2 • -) and / or hydrogen
peroxide (H2O2). Nox family are the main dedicated sources of ROS involved in
redox cell signaling. The Nox family is composed of 7 isoforms: 5 Nox (Nox1 to 5)
and 2 Duox (Duox1 and 2). All Nox isoforms present different degree of homology
with Nox2, the founding member of the family, discovered originally in phagocytes, in
which they play crucial roles in microbial killing and innate immunity (11). Nox
complexes are formed by a catalytic Nox or Duox subunit, which present a canonical
structure formed by 6 transmembrane domains, plus a specific set of distinct
regulatory subunits (12). The transmembrane regulatory subunit p22phox subunit
regulates the maturation and expression of Nox subunits and stabilizes each
transmembrane complex, except for Nox5; p67phox and its homologue NoxA1
mainly control the complex activation; p47phox or its homologue NoxO1 and
p40phox contribute to the spatial organization of the complex. The Nox1-3 isoforms
also require Rac1 or Rac2, small GTPases important for cytoskeletal regulation and
cell shape. Nox5 and Duox isoforms require calcium for their activation and display
calcium-binding domains, (13, 14) (as illustrated in Fig.1). Nox1,2,3 and 5 are
principally located at the plasma membrane, but they also can be found in the other
Introduction -4
cell endomembranes. Nox4 can be also found at the plasma membrane, but its main
location appears to be the endoplasmic reticulum membrane (15). Of note, Nox
NADPH oxidases in general have an important connection with the endoplasmic
reticulum, as all of them are synthesize and mature in this organelle, inaddition to
other types of interplay (15, 16). Part of the Nox2 and Nox5 pools locate at the ER
(probably the immature or nascent enzyme complexes) (15). Nox4, as well as Duox1
and 2 can be found in association with mitochondria and recently Nox4 has been
proposed as an ATPsensor (17). Nox4 and 5 can also locate at the nucleus (15). Nox
1,2,3, and 5 produced principally superoxide, which in a second time can dismutase
in H2O2 (spontaneously or mediated by SOD), whereas Nox4 and Duox 1and 2
produced essentially H2O2 (18) Although Noxes display a number of important
regulatory effects in cells and organ systems, the phenotype of mice genetically
deleted for specific Nox subtypes is comparatively much less evident (19). In general,
however, Noxes modulate cell signaling for survival, migration, senescence and
autophagy (20) in a number of cell systems.
Figure 1: Nox family /NADPH oxidases enzymatic complex
(From Bedard and Krause 2007) (12)
1.2.2 Nox NADPH oxidases and cancer

Introduction -5
Nox proteins have been described to be involved in initiation and progression
cancer process. Irani et al in 1997 (9) observed after fibroblast transfection with Ras
protooncogene an increase of ROS production responsible for cell transformation.
Moreover, ROS generation and cell transformation were inhibited by treatment with
diphenylene iodonium, a flavoprotein inhibitor. Although this compound is not a
specific Nox inhibitor, this suggested that Noxes complexes could be a possible
source of ROS. Since then, numerous studies correlate Noxes activation with cancer
initiation and progression. For example, in lung and liver cancer, Nox4, and its role in
fibrosis, has been suggested to participate in the cancer process (16). Prostate
cancer and melanomas present high Nox5 expression (21, 22). Nox1 involvement in
inflammatory processes has been highlighted as one of the mechanisms involved in
inflammatory bowel disease cancerization in CRC (6, 22). In HT29-D4 CRC cell line
Nox1-dependent superoxide production support directional migration(23). Moreover,
Laurent and collaborators (24) established a correlation between KRas proto-
oncogene mutation and Nox1 expression in patients, and confirmed those data in
murine models. In NRK (rat kidney fibroblast) cells, the transformation by KRasG12V
requires Nox1 and si-RNA against Nox1 prevents cell transformation. In the same
study, the authors showed that Ras sustain Nox1 up-regulation through the Ras-Raf-
MEK-ERK pathway, since a MEK inhibitor blocked Nox1 up regulation (25). Nox1
activation is important to maintain Ras-induced malignant transformation. However,
Nox1 super-expression alone is not sufficient to induce cell transformation (26). In
Caco2 cells, activation of Ras induces Nox1 expression through MEK-ERK pathway
(27). Importantly, 60% of CRC exhibit a mutation in Ras protooncogene or in one of
its effectors. Ras proteins are GTPases that function as molecular switches
regulating pathways responsible for cell proliferation and survival through canonical
Raf-MEK-ERK and PI3K pathway. Aberrant Ras function is associated with hyper-
proliferative developmental disorders and cancer, associated with a single mutation,
typically at codons 12, 13 or 61. Those mutations favor GTP binding and produce
constitutive Ras activation (28).

Introduction -6
1.3 Protein Disulfide Isomerases
1.3.1 Protein Disulfide Isomerases in redox signaling and homeostasis
One specific family of proteins related to redox signaling and homeostasis is
the Protein Disulfide Isomerase (PDI) family. PDIs are a family of thioredoxin
superfamily thiol oxidoreductase chaperones. The canonical activities of PDIs are
oxidation, reduction or isomerization of protein substrate cysteine thiols during
protein processing at the endoplasmic reticulum (ER) lumen. The prototype of this
family, PDIA1, is a 55kDa U-shaped protein with 4 thioredoxin tandem domains
arranged as a, b, b' and a', plus the C-terminal c-domain (29-31) (Fig.2). Most PDIs
have also a chaperone effect for which the thiol groups are dispensable. Domains a
and a' display redox-active dithiol Cys-X-X-Cys motifs, CGHC in the case of PDIA1.
Domains b and b' display thioredoxin folds without redox-active dithiol domains and
are enriched in hydrophobic residues accounting for substrate binding, as well as for
the bulk of the chaperone activity. The C-terminal sequence Lys-Asp-Glu-Leu (KDEL)
accounts for ER retrieval via mechanisms involving the KDEL receptor. Other PDI
family members have analogous modular structure, but display distinct number and
sequences of redox-active domains (29, 32). The PDIA1 molecule depicts significant
plasticity: reduced PDIA1 has a more contracted shape, while oxidized PDIA1 has
an open configuration, exposing the b and b' substrate-binding domains, which in
parallel enhances PDIA1 chaperone activity (Fig. 2). The concerted action of PDIs
exerts a central role in ER-associated proteostasis and redox balance.

Introduction -7
Figure 2: Structural features of PDIA1
PDIA1 has a U-shaped structure composed of 4 tandem thioredoxin domains, arranged as a-b-b'-a', in which a domains bear thioredoxin redox motifs Cys-X-X-Cys (shown as black circles), Cys-Gly-His-Cys in the case of PDIA1. The b domains depict a thioredoxin fold structure but have no redox cysteine domains and are enriched in hydrophobic residues accounting for substrate-binding; also, the b and b' domains support the redox-independent chaperone activity of PDIA1. The x-linker connecting the b ' and a' domains is relatively unstructured and displays considerable mobility, being the main contributor to PDIA1 plasticity: reduced PDIA1 has a contracted configuration, while oxidized PDIA1 is open and exposes substrate-binding domains, while enhancing its chaperone activity. The c domain bears a C-terminal Lys-Asp-Glu-Leu sequence responsible for ER retrieval via KDEL receptor. (From Romer et al, 2016)(33)
Over the recent years, the importance of PDIA1 location at sites other than the
ER, particularly the peri/epicellular PDIA1 pool (pecPDIA1), has been increasingly
investigated, with a number of (patho)physiological thiol redox-related effects
including regulation of thrombosis in endothelial cells and platelets, viral infection,
metalloproteinase activation and cell adhesion (29, 31, 33). Translocation of PDIA1
to the cell surface and extracellular milieu occurs without any accompanying
detectable damage in plasma membrane, however it can substantially increase upon
cell injury, given the very high intracellular expression of PDIs in general. In

Introduction -8
endothelial cells, pecPDIA1 is estimated as <2% of the total cellular steady-state
PDIA1 levels (34). The precise mechanisms whereby PDIA1 reaches the cell surface
or is secreted extracellularly are yet unclear but involve Golgi-independent routes in
endothelial cells (34). The effects of pecPDIA1 in thrombosis and platelet activation
have been mainly observed from two lines of investigation. First, PDIA1 inhibition
significantly reduces thrombus accumulation and fibrin generation upon endothelial
cell injury in situ or arterial injury in vivo (33, 35-37). Moreover, mice with deletion of
the a'domain of PDIA1 have impaired thrombus generation and the PDI a' domain
cysteines are required for thrombosis-associated integrin signaling. Since mice with
whole genetic PDIA1 deletion are embryonically lethal, similarly to those with
selective deletion of the a domain, this indicates an important housekeeping function
for the a domain, while the thrombosis effect seems more specific for the a' domain
(38). The roles of PDIs in thrombosis have been at the forefront of clinical translation
regarding the fast development of PDI inhibitors (39). Second, one of the major
effects of pecPDIs is their direct regulation of integrin(s), reported in platelets,
endothelial cells and vessel wall (40), with PDIA1 (as well as PDIA3 and PDIA6)
having the main effect of reducing their disulfide bonds, thereby supporting integrin
transition from the extended-moderate affinity to the extended-high affinity
conformation (40, 41). Recently, however, our group was able to detect pecPDIA1-
mediated beta1 or alpha5-integrin oxidation upon short-term mechano-stimulation of
VSMC or endothelial cells, respectively (34) (Tanaka et al, unpublished
observations). Since PDIA1 does not exhibit a membrane-binding or a
transmembrane domain, binding to integrins (e.g., beta3) is likely an important
mechanism of PDIA1 retention in the extracellular space (33).
The ubiquity of PDI expression and their roles described above led us to
hypothesize that PDIs are involved in cancer. In fact, PDIA1 has been reported to be
up regulated in numerous types of cancer (42-46), and support survival and tumoral
progression but the mechanism involved remained unclear, as detailed in the next
section. Evidences support that PDIA1 may be a relevant upstream mechanism
regulating the generation of oxidant species in tumor cells. Conversely, further
understanding the mechanisms associated with PDIA1/Nox convergence may help
understand the roles of PDIA1 in cancer pathophysiology.
Introduction -9
1.3.2 Protein Disulfide Isomerases and cancer
PDI family proteins have been often reported to be up-regulated in several
types of cancer (47). PDIA1 is reportedly over-expressed in melanoma, lymphoma,
hepatocellular carcinoma, brain, kidney, ovarian, prostate and lung cancer (42-46). In
these types of cancer, over-expressed PDIA1 is frequently correlated with
metastasis, invasiveness and drug resistance (48, 49), whereas lower levels of
PDIA1 are associated with a higher survival rate in patients with breast cancer and
glioblastoma (50). In glial cells, breat cancer cells CRC, PDIA1 overexpression has
been suggested as a cancer cell biomarker (50-52). Some studies highlight PDIA1
protective effect in ER stress and in unfolded protein response as a mechanism to
explain the role of PDIA1 in cancer process and drug resistance (53, 54). In parallel,
some studies focus on PDIA1 inhibition as a target for cancer treatment, In ovarian
cancer cells, the propionic acid carbamoyl methyl amide PACMA31, is a nonspecific
PDIA1 inhibitor and its incubation promotes a cytotoxic effect on a set of human
ovarian cancer cells. In mice with human ovarian cancer xenografts, PACMA31
suppresses tumor growth without causing toxicity to normal tissues (42). However,
the mechanisms by which PDIA1 support survival and tumoral progression are still
unclear. As discussed below, previous work from our group highlight a strong
functional convergence between PDIA1 and Nox1. Bearing in mind the importance of
Noxes in cancer progression and initiation and PDIA1 and Nox1 convergence, we
consider PDIA1/Nox1 convergence an important mechanism to be investigated in
order to understand PDIA1 role on Cancer.
1.3.3 PDIA1 interact with Nox family NADPH oxidases
PDIA1 effect on NADPH oxidase complex regulation has been previously
evidenced by our group,(55-57). We showed that PDIA1 is required for Nox1
expression and related superoxide generation in VSMC. PDIA1 silencing and
inhibition (bacitracin, si-RNA, anti-PDI antibody, DTNB) induce a decrease of
angiotensin II (Ang II)-dependent NADPH oxidase activity (55, 57, 58), and a parallel
decrease in Nox1 mRNA expression, without Nox4 mRNA alteration. Furthermore,
PDI silencing reduces Ang II-induced Akt phosphorylation (58) and markedly impair
the PDGF-induced migration of VSMC (57). Acute overexpression of PDIA1 (2-3

Introduction -10
fold) induces an agonist-independent increase in oxidant production and Nox1
protein expression in VSMC (55, 57). In addition, there is a spontaneous increase of
the migration in the basal condition (57). Additional data indicate a similar functional
dependence of NADPH oxidase on PDIA1 in endothelial cells (59) and in intact cells
(60), or cell-free system of human neutrophils (61). The mechanisms by which PDIA1
assists the NADPH oxidase complex are not clearly elucidated. Co-
immunoprecipitation experiments have previously shown evidence of PDIA1 physical
association with Nox1, 2 and 4 and with the regulatory subunit p22phox (in VSMC,
macrophages and neutrophils), suggesting close proximity of PDIA1 with the
assembled Nox complex, although the specific subunit to which PDIA1 was bound is
not clear. One possibility is p47phox, which associates with PDIA1 in neutrophils via
redox mechanisms (61). It is unclear at present whether PDIA1 affects the complex
assembly, subcellular trafficking or location of specific subunits, or even the
proteolytic degradation of these proteins. Considering that overexpression of PDI A1
with mutation in all redox cysteines was still able to acutely activate NADPH oxidase
activity (55), it is possible that a PDIA1 chaperone effect (known to be independent of
redox thiols) may be involved, at least in the context of this model. Our data also
indicate that changes in cellular redox status or NADPH availability are not likely to
be primary factors explaining the effect of PDIA1 on oxidase (58, 59). In fact, PDIA1
does not have characteristics of a redox buffer, considering its peculiar redox
properties and its compartmentalization (62, 63). Moreover, the reactivity of PDIA1
towards hydrogen peroxide is quite slow (64), indicating that PDIA1 is unlikely to be a
mass-effect sensor of oxidant state such as the peroxiredoxins. Rather, PDIs appear
to locally target more specific protein clients (30).

Introduction -11
1.3.4 Protein Disulfide Isomerase and RhoGTPases
Rho GTPases are small G-proteins, acting as "molecular switches" in a
number of cell signaling pathways. Rho-GTPases, in particular, are involved in
cellular processes related to the control of cytoskeletal organization which affect cell
morphology, size, motility, adhesion, migration, cytokinesis, phagocytosis and
vesicular traffic (65). Like all G-proteins, they are regulated by guanine exchange
factors GEF and guanine-activating proteins GAP. GEFs proteins induce GTPase
activation and stimulate signal transduction by catalyzing the exchange of GDP by
GTP. GAPs catalyze the return to inactive form, facilitating the hydrolysis of GTP in
GDP. Different GEFs and GAPs may act specifically for each RhoGTPase (66).
Additional RhoGTPase regulators are the RhoGDIs (Rho- guanine dissociation
inhibitors), which are responsible for RhoGTPase subcellular traffic and repositioning
able to inhibit GDP dissociation from the GTPase and also acting as chaperones
protecting free GTPases in the cytosol from proteolysis. Thus, RhoGDIs modulate
the membrane-cytosol cycle of GTPases and maintain inactive cytosolic GTPases
(67) (Fig.3). Moreover, RhoGDIs addresses inactive GTPases to their specific sites of
activation at the membrane. Together, GEFs, GAPs and GDIs are essential to the
functional regulation of small GTPases.
Figure 3: RhoGTPas regulation schema. From Huveneers & Danen 2009 (68)

Introduction -12
Several evidences point to RhoGTPases as possible targets of the effects of
PDIA1. PDIA1 silencing induced a significant reduction of Rac1 and RhoA activity in
VSMC stimulated with PDGF, without altering the total expression of these proteins.
Is important to notice that these effects were accompanied by cellular disrupted
cytoskeletal remodeling, with stress fiber disorganization, less focal adhesions and
vesicular adhesion structures. In VSMC PDIA1 colocalizes with RhoGDI in the
perinuclear region, and co-immunoprecipitates with Rac1 and RhoA, both in the
presence and absence of PDGF (57). Protein-protein physical interaction networks
PPI analysis using databases and centrality analysis, and gene ontology data
corroborated a strong convergence between PDIA1 and proteins of the small family
GTPases of the Rho family (mainly Rac1 (Nox1 regulatory subunit), RhoA, Cdc42), in
addition to the RhoGDI GTPase regulator (57). Furthermore, a recent study from our
laboratory indicated that the PDI family genes display an intriguing arrangement with
the genes coding for the family of RhoGDI (69). These genes display an extremely
conserved microsyntenic clusterization, e.g., in humans: PDIA1-RhoGDIalpha in
chromosome 17 with 7.1 kB intergenic distance; PDIA2-RhoGDIgamma in
chromosome 16 with 0.14 kB intergenic distance and PDIA8-RhoGDIbeta with 2.9 kB
intergenic distance. This arrangement pattern evolved from tandem duplications in
the last common vertebrate ancestor, but the presence of a microsyntenic PDI close
to a RhoGDI gene is much older, ca. 820million-years. Functionally, PDIA1 protein
physically associates with RhoGDIalpha in endothelial cells (69), extending our
previous findings in the VSMC.
The possibility of physical interactions between PDIA1 and RhoGTPases has
also been explored in the context of other studies, with ongoing results suggestive of
potential direct interaction (unpublished observations). Thus, our group works with
the hypothesis that the interaction with RhoGTPases and their regulators is one of
the central mechanisms of NADPH oxidase and cytoskeletal control by PDIA1. Given
the functional importance and ubiquity of both PDIA1 and RhoGTPase family
proteins, such interactions can have broad and important functional implications.
1.4 Migration in cancer, and Epithelial Mesenchymal Transition
Cancer cell migration is an important process involved in cancer invasiveness
and metastasis formation. The epithelial mesenchymal transition is a key mechanism

Introduction -13
in cell epithelial cell migration (70). EMT can be observed in 3 different situations:
during fetal development process, during woundhealing post-injury, and finally in
tumor invasion. EMT involves numerous biochemical and structural cell changes in
which epithelial cells lose their epithelial characteristics and markers such as E-
Cadherin, Claudins, Occludins, demosplakin and cytokeratins, and switch to a
mesenchymal phenotype, expressing more mesenchymal markers such as N-
Cadherin, Fibronectin, collagen I/II, snail and Vimentin. Cells with a mesenchymal
phenotype are more migratory, invasive, and with a higher resistance to apoptosis.
Polarized Epithelial cell turned rounder and lose part of it anchorage to the matrix,
facilizing cell migration, produce more extracellular matrix and facilitate cell invasion
(70) ( Fig.4 ).
Figure 4: Epithelial-mesenchymal transition schema.
From Kalluri & Weinberg 2009 (70). Epithelial markers were listed in red, and
mesenchymal markers in green.
1.5 Cancer colorectal
According to data from GLOBOCAN of the WHO (http://globocan.iarc.fr), CRC
is the third most common cancer in the world (1.4 million cases diagnosed in 2012),
third in men and the second in women. Those number continues to rise and WHO
predicted that until 2035, 2.4 million cases will be diagnosed per year. still according
to the WHO adenocarcinomas are the most frequent CRC about 95%, and 60% of
CRC present an activating mutation on Ras protooncogene or in its effectors.
Mechanism involved in CRC development are still poorly understood. Considering
that colon cell produced a large amount of ROS and that CRC cells produce more

Introduction -14
ROS than normal cells understand ROS regulation and redox cell signaling in CRC
become an important mechanism to be investigated.
We focused on colorectal cancer cells, since colorectal tissue expresses high
protein expression levels of Noxes in basal/normal condition (71). 60% of CRC
present a mutation in Ras proto-oncogenes or on one of their downstream effectors
(72). Cells with Ras mutations exhibit enhanced generation of ROS (73). Analysis of
samples from patients with colorectal tumors established a correlation with KRras-
activating mutations and elevated Nox1 expression (24). In the present study, we
investigated mechanisms associated with PDIA1/Nox1 convergence in CRC
comparing with or without sustained active Ras pathway.

2 Objectives

Objectives -16
2.1 Principal aim
To investigate mechanisms associated with PDIA1/Nox1 convergence in CRC
comparing with or without sustained active Ras pathway.
2.2 Specific aims
1. To investigate the effect of PDIA1 loss of function on ROS production and
Nox1 activity.
2. To address possible mechanisms underlying the effects of Ras on PDI/Nox1
convergence. Focusing on Rac1 and its RhoGDI.
3. To investigate the functional effect of PDIA1 loss of function focusing on cell
migration (spheroid assay), which is an important process for tumor
progression.

3 Materials and Methods

Materials and Methods -18
3.1 Reagents
Unless otherwise stated, reagents were from Sigma. DPI (10 μM) was from
Merck Millipore; Dihydroethidium (DHE) Molecular Probes ref.D1168; W56 (Rac1
inhibitor) was from TOCRIS 2221. NoxA1ds (Nox1 inhibitor) was synthesized at the
Department of Biophysics, UNIFESP, Sao Paulo, (as described (74)) NoxA1ds
peptide sequence NH3-EPVDALGKAKV-CONH2, Scrambled NoxA1ds peptide
sequence NH3-LVKGPDAEKVA-CONH2 .
3.2 Cell Culture
Human colon carcinoma cell lines, HCT116 and HKE3 are a gentle donation
from MD. Walter Kolch (University College Dublin, Belfield, Dublin 4, Ireland).
HCT116 and HKE3 cells were maintained in Dulbecco’s modified Eagle’s medium
(DMEM) supplemented with 10% fetal bovine serum (FBS) (GIBCO Cell Culture
systems, Invitrogen), at 37°C in a humidified atmosphere with 5% CO2. Caco2 cells
were maintained in DMEM supplemented with 10% FBS and non-essential amino
acids (from sigma, ref.M7145), at 37°C in a humidified atmosphere with 5% CO2.
3.3 Cell Transfection
HKE3 and HCT116, and Caco2 were transiently transfected using Amaxa
nucleofactorTM system from Lonza, using Kit V (ref.VCA-1003) according to
manufacturer's protocols (Nb: HKE3 cells were transfected using the same protocol
as HCT116). For PDIA1 silencing, cells were transfected with 300 nmol of PDIA1
triplex si-RNA (from OriGene) or stealth RNAi medium Universal negative control
(from Invitrogen). All PDIA1 silencing experiments were performed after 72h of
silencing. Overexpression of constitutively active Rac1 was achieved by transfection
of 2µg pCDNA3.1-Rac1 G12V plasmids or 2µg pCDNA3.1empty vector; cells were
analyzed 72h after transfection.
Materials and Methods -19
3.4 Western blot analysis
Equal amounts of protein from lysates were resolved by SDS-PAGE. The
following primary antibodies were used: anti-GAPDH (1/20 000 ref. ab8245) anti-
KRas (1/500 ref.137739); anti-Nox1 (1/1 000 ref.ab121009); anti-NoxA1 (1/1 000
ref.ab68523); anti-NoxO1 (1/1 000 ref.ab34761); anti-Rac1 (1/1 000 ref.ab33186);
anti-RhoGDI (1/2 000 ref.ab53850) from Abcam, anti-GSK3 total (1/1 000 ref.5676);
anti-pGSK3 (1/1 000 ref.9331) from cell signaling, anti-RhoA (1/1 000 ref.SC26C4)
from Santa Cruz Biotechnology, anti-GAPDH (1/20 000, ref.G8795) from Sigma, anti-
KDEL (1/1 000 ref.SPA-827) from stressgen, anti-PDIA1 (1/1 000, clone RL90
ref.MA3-019) from Thermo. The HRP-coupled secondary antibodies were purchased
from Cell Signaling Technology (1/5 000). Fluorescent coupled secondary antibodies
were purchased from Odyssey (1/10 000, anti-mouse ref.926-32212, anti-Rabbit 926-
32223, anti-goat ref.926-32224) and fluorescent immunoblotting were scanned with
the Odyssey near-infrared imaging system.
3.5 PDIA1 quantification by ELISA
For PDIA1 ELISA 2x10⁶ cells was seed in 100mm cell culture dish, 24h after
seeding cell were lysed in 300µL lysis buffer A (Hepes 20mM, NaCl 150mM,
Glicerol10%, Triton 1%, EGTA 1mM, MgCl2 1.5mM). Following cell lysis soluble
PDIA1 antigen was measured using the Human P4HB Pair Set enzyme-linked
immunosorbent assay (ELISA) (Sino Biological Inc) according to the protocol
described by the supplier. Briefly, 96-well microplate was coated with 100 µl per well
of the diluted capture antibody and incubated overnight at 4°C. Thereafter, each
sample was added for 2 h at room temperature. Following, 100 µl of detection
antibody conjugated to horseradish-peroxidase (HRP) was incubated for 2 h at room
temperature. Plates were washed three times after each incubation. Finally, 200 µl of
tetramethylbenzidine (TMB) solution were added for 30 min and optical density of
each well were determined immediately using a microplate reader (SpectraMax 340,
Molecular Devices) set to 450 nm. The values were determined according a standard
curve, and normalized according to the total protein dosage.
Materials and Methods -20
3.6 Measurement of Rac1 and Ras activity
Rac1 activity was assessed by G-lisa (ref.BK128) protocol, as furnished by the
manufacturer Cytoskeleton cells were starved 16h before assay. For the pulldown
assay of activated KRas, cells were starved for 16h and incubated for 10min with
25ng/mL of EGF. Cells were harvested on G-lisa lysis buffer (ref.GL36 from
cytoskeleton) and centrifuged at 12 000g, 10min, 4 °C. Homogenates (600µg) were
incubated for 2h with glutathione S-transferase-Ras binding domain (GST-RBD, to
detect active KRas) previously coupled to glutathione-Sepharose (ref.17-0756-01
from GE Health Care) at 4 °C under gentle agitation. After washing three times
(50mM Tris, pH7.5, 0.5% Triton X-100, 150mM NaCl, 5mM MgCl2), proteins retained
on the resins were released in Laemmli sample buffer and boiled for 5min at 100°C.
Proteins were analyzed by immunoblotting with anti-KRas antibody.
3.7 Co-immunoprecipitation experiments
Cells 10x106 were grown to confluence in 150mm plates, washed 3 times in
PBS buffer and 2ml of lysis buffer (20mM Tris-HCl pH 7.8, 250mM sucrose, 1mM
MgCl2 and 1mM CaCl2) supplemented with protease (1mM PMSF, 1µg/ml leupeptin
and aprotinin) and phosphatase (50mM sodium fluoride, 2mM sodium orthovanadate,
10mM sodium pyrophosphate) inhibitors. Cells kept for 20min over ice were scraped
and collected in a final volume of 5ml. The cell suspension was transferred to a 35ml
nitrogen cavitation bomb for 30min in 400psi nitrogen pressure, on ice. Intact cells,
large debris and nucleus were removed by centrifugation at 1 000g for 10min at 4°C.
Lysates were incubated overnight at 4°C under agitation with 8µg of PDIA1 antibody,
followed by incubation with 70μl of Protein G-coated magnetic beads (ref.28-9513-79
from GE Health Care) for 4h at 4°C. Beads were successively washed in sucrose
buffer to remove contaminating material, resuspended in modified FLAG lysis buffer
(50mM Tris-HCl pH 7.4, 150mM NaCl, 1mM EDTA, 1% Triton X100 and 1% CHAPS)
supplemented with a protease and phosphatase inhibitors. After 1h of incubation at
room temperature, Laemmli sample buffer was added and incubated at room
temperature for additional 1h. KRas was detected by immunoblot.

Materials and Methods -21
3.8 Detection of ROS Production
Intracellular cell ROS production was assessed by HPLC analysis of
dihydroethidium (DHE)-derived oxidation products, as described by Fernandes and
al. in 2007 (75). DHE oxidation produces, among many others, 2 major products: 2-
hidroxyethidiium (EOH), which is representative of superoxide species, and Ethidium,
representative of other oxidant species. Cells were starved for 4h and incubated or
not 2h with 10µM of the Nox1 peptide inhibitor NoxA1ds or 50µM of W56 Rac1
peptide inhibitor. Cells were washed with HBSS without phenol red, Ca2+ and Mg2+,
and incubated for 30min with 100μM DHE, plus the inhibitors, on HBSS without Ca2+
and Mg2+. Cells were washed with cold PBS, harvested in 500µl acetonitrile and
centrifuged (12 000 × g for 10min at 4 °C). The homogenate was dried under vacuum
and analyzed by HPLC with fluorescence detectors (Waters 2475 HPLC, Colum
Synergi 4µ Polar-RP 80A from Allcrom ref.00F-4336-E0). Quantification of DHE,
EOH, and ethidium concentrations was performed by comparison of integrated peak
areas between the obtained and standard curves of each product under identical
chromatographic conditions. EOH and ethidium were monitored by fluorescence
detection with excitation 480nm and emission 580nm, whereas DHE was monitored
by ultraviolet absorption at 245nm. Results were expressed as calculated EOH or
ethidium concentrations (micromolar), normalized for consumed DHE (i.e. initial
minus remaining DHE concentration in the sample).
3.9 Lucigenin oxidation assay
As described previously in de Carvalho et al. 2008 (76) cells were seeded
25x103 cells/well in white opaque 96-well plates 24h after PDIA1 silencing; the next
day cells were starved for 16h, cells were incubated with lucigenin (10µM final) and
NAPDH in DMEM without phenol red, lucigenin oxidation induce chemiluminescence,
detected by a Fluoroscan Ascent FL fluorimeter (Labsystems, France). The signal
was assessed every min for 45 min. The area under the curve was integrated to
express the ROS production during the time of measurements.

Materials and Methods -22
3.10 PathScan® Intracellular Signaling Array
Signaling pathways associated with the effects of PDIA1 loss-of-function were
investigated by the PathScan® Intracellular Signaling Array Kit (ref.7323), which is a
slide-based antibody array optimizing the performance of sandwich immunoassays.
The kit allows the simultaneous detection of 18 signaling molecules (described in
Fig.4) which are either phosphorylated or cleaved. Target-specific capture antibodies
were spotted in duplicate onto nitrocellulose-coated glass slides. Quantification of all
spot intensities was performed using ImageJ software.
3.11 Cell migration assays spheroids
Three-dimensional cell invasion assay was adapted from previously published
works (77, 78). Twenty-four hours after cell transfection with PDIA1 si-RNA cells are
trypsinized, counted and re-suspended in complete medium containing 2.4 mg/ml
methylcellulose. In order to start the experiment with equivalent size T0 spheroids
1 500 cells per well were seed for HKE3 vs. 1 000 for HCT116. The suspension
(100µl) was added into each well of a U-bottom 96-well-plate, allowing the formation
of one spheroid per well. Twenty-four h after plating (T0), spheroids were transferred
to a flat-bottom 24-well-plate coated with 10µg/mL of fibronectin. Pictures were taken
at T0 and T48h in a Olympus microscope, objective 2X. Invasion was quantified by
measuring the area occupied by cells spheroid expansion at T0 and T48h using
ImageJ software. Spheroid expansion was calculated as: (T48h total evasion area –
T0 initial spheroid area)/ T0 initial spheroid area. For the proliferation analysis, 24h
after plating (T0), spheroids stayed on a U-bottom 96-well-plate with methylcellulose
media, and spheroid surface area were measured at T0 and T48h using ImageJ
software. Spheroid growth was calculated as: T48h spheroid area/ T0 spheroid area.
T0 spheroids out of mean size range were exclude from the analysis.

Materials and Methods -23
3.12 RNASeq Datamining
Experiments used: Caco2: SRR1580950, SRR4249634, SRR4249633,
SRR4249636, SRR1581012, SRR4249635. HCT116: SRR1636085, SRR3228429,
SRR5009474, SRR5297165, SRR1636086, SRR3228430, SRR5009521,
SRR5297166, SRR1636087, SRR5009406, SRR5009538, SRR902610. HCT15:
SRR1756568, DRR046626, ERR208903.
Experiments of the lineages listed were retrieved from NCBI's SRA through searches
during the months of November and December 2017. Samples containing metadata
information indicating any type of treatment were discarded. Samples that were
included had indications that they were experimental controls or did not show any
metadata indicating otherwise. Expression correlation analysis of transcripts between
samples was performed using the PoissonDistance and pheatmap functions of the
PoiClaClu (v.1.0.2) and pheatmap (v.1.0.8) R packages. Samples that had very
different behavior in relation to the majority of the same cell line or similar with
different strains other than their own were discarded. That is, according to the
position of the sample in the hierarchical clustering procedure and the distance.
Quality control was done with FastQC (v0.11.5) and MultiQC (v1.0) with default
settings. For sequence mapping, the HiSat2 (v2.0.5) aligner and the preformatted
index of the reference GRCh38 release 84 of the H. sapiens genome from the
Ensembl project was used, including dbSNP (b144) variants, splice site and exon
position information. For transcript assembly, StringTie (v1.3.1c) with strict GRCh38
annotation was used. The transcript data was tested for differential expression with
the BallGown (v2.6.0) package in the R (v3.4.0) environment. A differential
expression relevance cut was used for false discovery rates of less than 0.05,
expression change rates greater than 2, and FPKMs greater than 1 in at least half of
the lineage samples.
3.13 Statistical Analyses
Data are presented as mean ± SD. Comparisons were performed by paired
Student t test, one-way ANOVA with Tukey's multiple comparisons test post-hoc test
using GraphPad Prism 7.0 (GraphPad Software Inc., CA, USA). Significance level
was p≤0.05.

4 Results

Results -25
4.1 Cell models used in the present study
To address the role of PDIA1 in colon cancer and specially on Nox regulation,
we used a set of colon carcinoma cell lines (Caco2, HKE3 and HCT116) in Table 1,
Caco2 colon carcinoma cell line was used as a non-mutated wild-type KRas pathway
control for HKE3 and HCT116 cells. HKE3 and HCT116 are a pair of isogenic cell
lines which differ in KRas activity and expression, being higher in HCT116 vs. HKE3
(Fig.5A) (79). Thus, HKE3 cells work as an appropriate control for HCT116 cells, with
a lower KRas activity and expression.
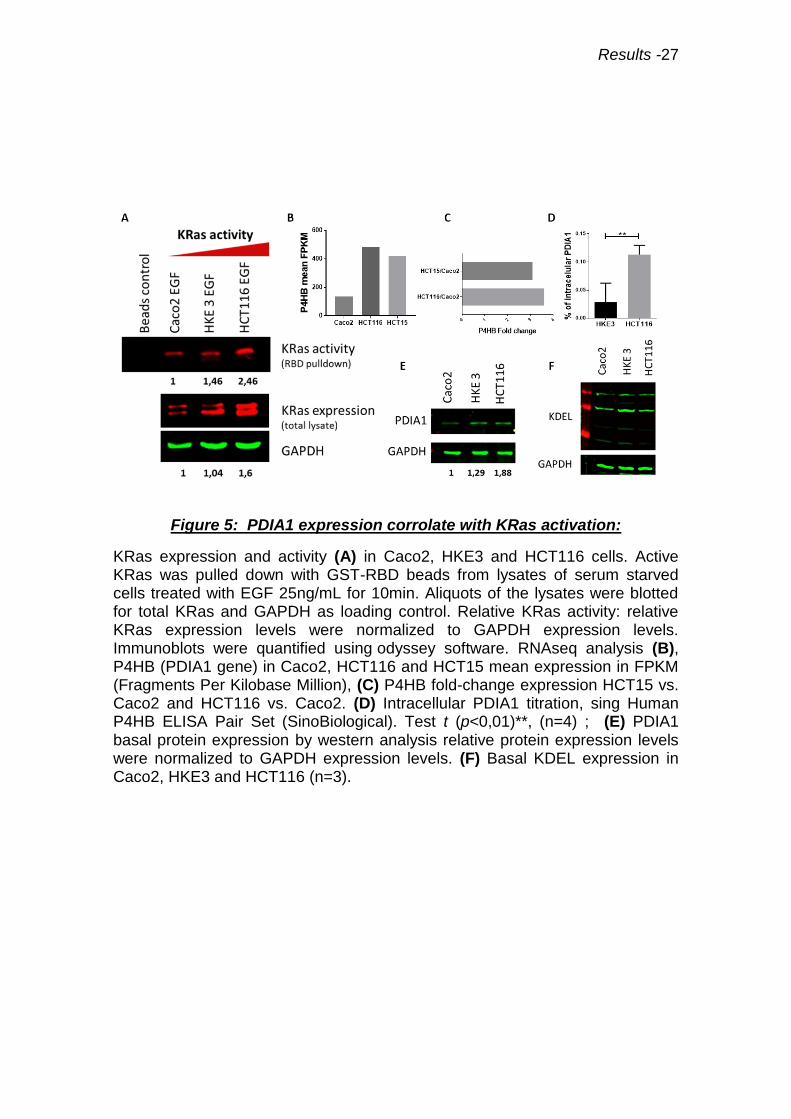
4.2 PDIA1 expression corelate with Ras activation
To address if KRasG13D mutation correlates with increase of PDIA1 expression,
a RNAseq analysis comparing CRC cell lines presenting KRasG13D mutation
(HCT116, HCT15) vs. non-mutated (Caco2) was performed. Our analysis showed
that HCT116 cells express 3.6-fold and HCT15 cells 3.1-fold PDIA1 mRNA vs. Caco2
(Fig.5B, C). However, increased PDIA1 protein expression in HCT116 versus HKE3
or Caco2 was observed by Western blot analysis (for this experiment we load only
5µg of total proteins lysate, higher quantity lead to a PDIA1 saturated signal)
(Fig.5D). This was confirmed through ELISA intracellular PDIA1 titration (Fig.5E). ER
stress was assessed through the expression of KDEL-containing chaperones Grp78
and Grp94 by anti-KDEL western blot analysis. ER stress marker expression showed
no difference among the distinct cell lines, (Fig.5F). As a control, we transfected
primary VSMC with Ras overactivated mutant, and observed an analogous increase
of PDIA1 gene expression vs. empty vector (supplementary data Fig.S2). Thus,
PDIA1 protein expression increases together with increased Ras activation.

Results -26
Table1: Colon carcinoma cell line characterization and respective mutations. Focus on gene of APC adenomatous polyposis coli, BRAF , CDKN2A cyclin-dependent kinase Inhibitor 2A, CTNNB1 Catenin beta-1, PK3CA Phosphatidylinositol-4,5-Bisphosphate 3-Kinase Catalytic Subunit Alpha, SMAD4 SMAD family member 4, KRAS Kirsten rat sarcoma viral oncogene homolog, TP53. All data were obtained from ATCC web site plus above references. *stop codon ; fs* : frame shift ; del : deletion.
Cell line Derived
from Stage APC BRAF CDKN2A CTNNB1 PK3CA SMAD4 KRAS TP53 References
Caco2 Primary tumor
72 yr.-old individual
ND p.G1367* wt wt p.G245A wt wt wt p.E204X
Fogh et al., 1977(80)
Ilyas et al., 1997(81)
Vijaya Chandra et al., 2012(82)
HCT15 Primary tumor
Male DLD1 isogenic cell
Dukes’C p.I1417fs*2 wt wt wt p.E545K p.D549N
wt p.G13D p.S241F Dexter et al.,
1979(83)
HCT116 Primary tumor
48 yr.-old male
Dukes’D wt wt p.R24fs*20 p.S45del p.H1047R wt p.G13D wt Brattain et al.,
1981(84)
HKE3 HCT116 isogenic cell Dukes’D wt wt p.R24fs*20 p.S45del p.H1047R wt
p.G13D p.G12C
wt
Shirasawa et al., 1995(85)
Fasterius et al., 2017(79)
HT29-D4 HT29 clone
Primary tumor
44 yr.-old female
Dukes’C p.E853* p.V600E wt wt p.P449T p.Q311* wt p.R273H
Fogh and Trempe, 1975(86)
Fantini et al., 1986(87)
Results -27
Figure 5: PDIA1 expression corrolate with KRas activation:
KRas expression and activity (A) in Caco2, HKE3 and HCT116 cells. Active KRas was pulled down with GST-RBD beads from lysates of serum starved cells treated with EGF 25ng/mL for 10min. Aliquots of the lysates were blotted for total KRas and GAPDH as loading control. Relative KRas activity: relative KRas expression levels were normalized to GAPDH expression levels. Immunoblots were quantified using odyssey software. RNAseq analysis (B), P4HB (PDIA1 gene) in Caco2, HCT116 and HCT15 mean expression in FPKM (Fragments Per Kilobase Million), (C) P4HB fold-change expression HCT15 vs. Caco2 and HCT116 vs. Caco2. (D) Intracellular PDIA1 titration, sing Human P4HB ELISA Pair Set (SinoBiological). Test t (p<0,01)**, (n=4) ; (E) PDIA1 basal protein expression by western analysis relative protein expression levels were normalized to GAPDH expression levels. (F) Basal KDEL expression in Caco2, HKE3 and HCT116 (n=3).

Results -28
4.3 PDIA1 silencing promotes a dual, Ras-dependent, effect on
superoxide production
To further address the effects of PDIA1 on ROS production, we
investigated the effects of PDIA1 silencing, in superoxide generation assessed
through DHE / HPLC method. PDIA1 silencing led to decreased superoxide
generation in HKE3 and Caco2 (Fig.6A, B), a result in line with our previous
studies in VSMC (57). Whereas, in HCT116 cells, PDIA1 silencing promoted
increased superoxide production. (Fig.6C). These results were confirmed using
the lucigenin reductase assay (Fig.7). Thus, the presence of overactivated Ras
associates with a disrupted pattern of PDIA1-mediated regulation of superoxide
production. Is important to notice that HKE3 and HCT116 have the same basal
ROS production (Suplementary data Fig.S1). However, ER stress marker
expression was unaltered by PDIA1 silencing in HKE3 and HCT116 cells,
indicating that increased superoxide in HCT116 cells was not due to ER stress
(Fig.6D). An analogous effect of PDIA1 was observed in HT29-D4 cells, which
exhibit an activating mutation (V600E) on Braf, a downstream Ras effector;
PDIA1 silencing in these cells associates with increased superoxide production
(Fig.7D).

Results -29
Figure 6: Role of PDIA1 in oxidant generation by colon carcinoma cells with distinct levels of KRas activation:
(A,B,C) ROS production after 72h of PDIA1 Silencing, measured by DHE oxidation detected by HPLC. DHE oxidation produces, among many others, 2 major products: 2-hidroxyethidiium (EOH), which is representative of superoxide species, and Ethidium, representative of other oxidant species. negative si-RNA control, si-PDI: si-RNA against PDIA1 protein. Representative immunoblots of PDI silencing for each cell. t Test (p<0,05)* (p<0,01)**. For Caco2 cells n=3 ; HKE3 cells n=4 ; HCT116 cells n=5. (D) HKE3 and HCT116 KDEL expression 72h after PDIA1 silencing (n=3).

Results -30
Figure 7: Measure of ROS production in Caco2 ,HKE3, HCT116 and HT29-D4 cells.
(A,B,C,D) ROS production , measured by lucigenin oxidation assay scrmb: si-RNA negative control; si-PDI: si-RNA against PDIA1; scrmb+DPI: si-RNA negative control treated with 10µM of DPI (flavoproteins inhibitor); si-PDI+ DPI: si-RNA againt PDIA1 treated with 10µM of DPI; si-PDI + si-Nox1: concomitant PDIA1 and Nox1 silencing; si-PDI + si-Nox1+ DPI : concomitant PDIA1 and Nox1 silencing treated with 10µM of DPI (n=3). t Test (p<0,05)* (p<0,01)**.

Results -31
4.4 PDIA1 silencing sustains superoxide production in HCT116 through
Nox1 NADPH oxidase complex
In order to identify the source of superoxide production in our cells, we
characterized the protein expression of Nox NADPH oxidase complex subunits.
Western blot analysis of Nox1 and Nox4 showed that both catalytic subunits
were more expressed in HKE3 and HCT116 vs. Caco2 control, consistent with
the known correlation between Ras activation and both Noxes (72) (Fig.8B).
when we looked on regulatory Nox subunits modelized in figure 8A, Caco2 cells
expressed significantly more Nox Activator 1 (NoxA1, a p67phox analog) than
HCT116 and HKE3. however, the expression of p67phox did not differ among
each cell type. Interestingly, Nox organizer 1 (NoxO1, a p47phox analog)
expression was significantly higher in HCT116 vs. other cell lines, including
HKE3, while p47phox was expressed in higher level in HKE3 and Caco2
(Fig.8B). focusing on the expression of RhoGTPases and their regulators, we
showed that HCT116 expressed more Rac1 than Caco2 and HKE3, while RhoA
expression showed an inverse pattern, with low expression in HCT116 cells. In
turn, Caco2 expressed less RhoGDIα than HKE3 and HCT116 (Fig.8C). In
addition to protein expression assessment, we addressed Rac1 basal activity
using G-lisa kit, and showed HCT116 cells higher activity Than. HKE3 (Fig.8D).

Results -32
Figure 8: Expression of Nox NADPH oxidase subunits and RhoGTPase-related proteins in colon carcinoma cells with distinct levels of KRas
activation:
(A) Nox1 and Nox4 complex schema. (B) Nox1, Nox4, NoxA1, p67phox, NoxO1 and p47phox basal protein expression by western blot analysis GAPDH protein expression was used as loading control. (C) RhoGDIα, RhoA and Rac1 basal protein expression by western blot analysis GAPDH protein expression was used as loading control. (D) Rac1 basal activity, using Rac1 G-LISA activation assay (cytoskeleton,inc). t test (p<0,05)*, (n=2).
To addressee if Nox1 was a possible source of superoxide in HCT116
cells, we used NoxA1ds a Nox1 peptide inhibitor (74). Incubation with this 10µM
cell-permeable peptide for 2h led to decreased superoxide production in
HCT116, which was statistically significant after PDIA1 silencing. Therefore,
Nox1 complex contributes to superoxide production in HCT116 after PDIA1
silencing (Fig.9A). This data were in line with results in HT29-D4 cells, in which
superoxide increase after PDIA1 silencing was prevented by concomitant Nox1
silencing (Fig.7D). We next addressed whether PDIA1 silencing affected protein
expression of Nox1 or its regulatory subunits. PDIA1 silencing in HKE3 and
HCT116 cells did not alter Nox1, p67phox and Noxo1 protein expression
(Fig.9B). Rac1 protein expression was slightly decreased by PDIA1 silencing in
HKE3, but not HCT116 cells (Fig.9C). Interestingly, PDIA1 silencing promoted
decrease in RhoGDIα protein expression in HKE3 but not in HCT116 (Fig.9B),
Results -33
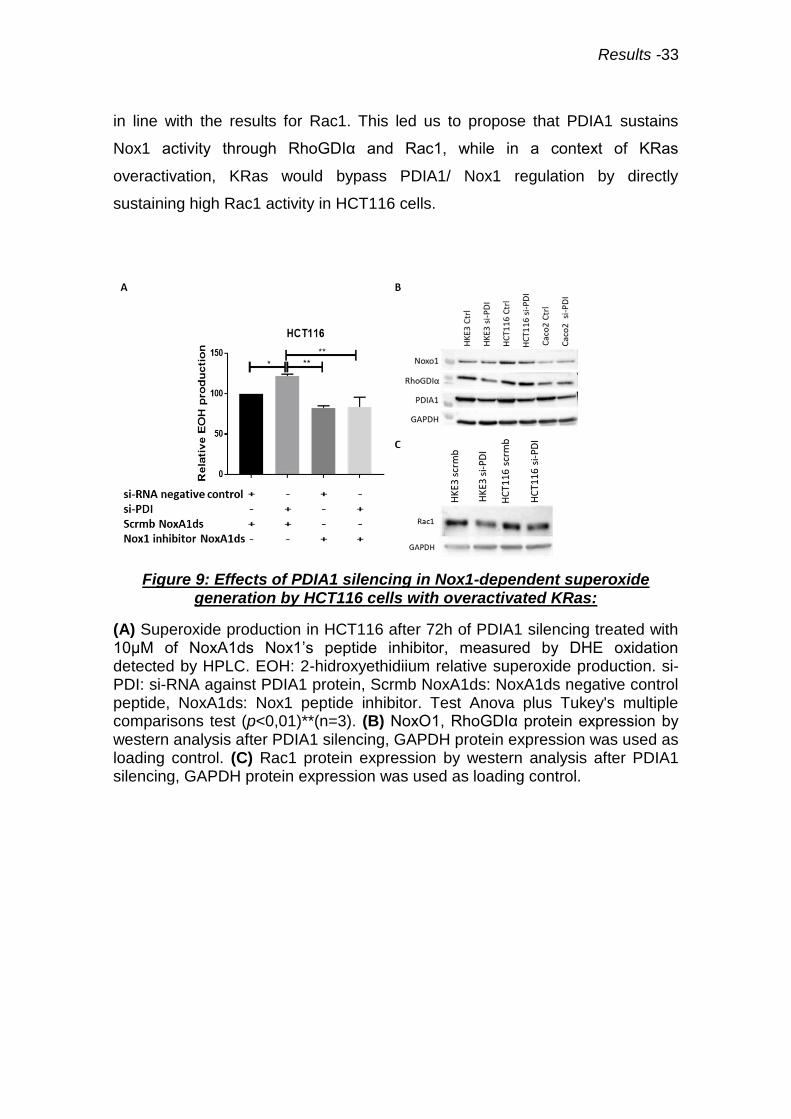
in line with the results for Rac1. This led us to propose that PDIA1 sustains
Nox1 activity through RhoGDIα and Rac1, while in a context of KRas
overactivation, KRas would bypass PDIA1/ Nox1 regulation by directly
sustaining high Rac1 activity in HCT116 cells.
Figure 9: Effects of PDIA1 silencing in Nox1-dependent superoxide generation by HCT116 cells with overactivated KRas:
(A) Superoxide production in HCT116 after 72h of PDIA1 silencing treated with 10µM of NoxA1ds Nox1’s peptide inhibitor, measured by DHE oxidation detected by HPLC. EOH: 2-hidroxyethidiium relative superoxide production. si-PDI: si-RNA against PDIA1 protein, Scrmb NoxA1ds: NoxA1ds negative control peptide, NoxA1ds: Nox1 peptide inhibitor. Test Anova plus Tukey's multiple comparisons test (p<0,01)**(n=3). (B) NoxO1, RhoGDIα protein expression by western analysis after PDIA1 silencing, GAPDH protein expression was used as loading control. (C) Rac1 protein expression by western analysis after PDIA1 silencing, GAPDH protein expression was used as loading control.

Results -34
4.5 KRas overactivation bypasses PDIA1/ Nox1 regulation by sustaining
high Rac1 activity
In order to investigate if Rac1 activation could be responsible for the
sustained Nox1 activation in HCT116 cells, HKE3 were transfected with
Rac1G12V (overactivated Rac1 mutant) in order to mimic HCT116 cells. In
contrast with HKE3 cells without active Rac1 transfection, there was an
increase in superoxide production after 72h of PDIA1 silencing (Fig.10A), such
as in HCT116 cells (Fig.6C). In addition, in HCT116 cells treated with the Rac1
peptide inhibitor W56 (50µM, 2h), there was a decrease in superoxide
production after PDIA1 silencing (Fig.10B). These results suggest that
sustained Rac1 activation may contribute to the switch of PDIA1-dependent
regulation from supporting to limiting superoxide production, respectively in cells
with low-levels vs. overactivated KRas.
Figure 10: Role of Rac1 in the regulation of PDIA1 – Nox1 axis:
(A) ROS production in HKE3 transfected with Rac1G12V after 72h of PDIA1 Silencing treated with 10µM of NoxA1ds Nox1’s peptide inhibitor, measured by DHE oxidation detected by HPLC. EOH: 2-hidroxyethidiium relative superoxide production. Test Anova plus Tukey's multiple comparisons test (p<0,01)** (n=3). (B) ROS production in HCT116 after 72h of PDIA1 Silencing treated with 50µM of W56 Rac1 peptide inhibitor, measured by DHE oxidation detected by HPLC. EOH: 2-hidroxyethidiium relative superoxide production. Test Anova plus Tukey's multiple comparisons test (p<0,05)* (n=4).

Results -35
4.6 PDIA1-mediated effects on superoxide generation potentially
involves its interactions with KRas and Rac1
The results let put forward a new idea in which PDIA1 may act as a
servomechanism, (oscillator) at first supporting, while in parallel posing a limit to
superoxide generation, and these dual effects correlate with differential
activations of Rac1 and KRas. In order to further understand these pathways,
we investigated possible interactions between PDIA1 and both proteins. To
address the interaction between PDIA1 and KRas, we investigated distinct
methods of homogenate separation. Using a technique able to preserve
sensitive protein complexes and/or subcellular microdomains, since we know
that Ras localized in membranes nanoclusters (88). We showed that
immunoprecipitation of PDIA1 yielded enhanced protein amounts in HCT116 vs.
HKE3 and Caco2 cells (Fig.11), consistent with the differences observed in
Figs. 5D and 5E. Moreover, PDIA1 co-immunoprecipitated with KRas (Fig.11) in
all cell types, with an enhanced detectable interaction in HCT116. In the latter,
PDIA1 exhibited detectable interaction with Rac1 (Fig.11). Classical co-
immunoprecipitation protocols failed to show this interaction. Similar interactions
between PDIA1/KRas and PDIA1/Rac1 were also detected in HUVEC
(Supplementary data Fig.S3), while an interaction between PDIA1 and Rac1
was previously detected in VSMC (57). Together, these results provide further
support for roles of KRas and Rac1 as mechanisms explaining the dual effects
of PDIA1 on superoxide generation.

Results -36
Figure 11: PDIA1 co-immunoprecipitation
IP: PDIA1 immunoprecipitation in Caco2, HKE3 and HCT116 cell, IGG: Immunoglobulin control, Input: 1% of total protein lysate, IB: immunoblot against PDIA1, KRas, and Rac1 proteins Tubulin protein expression was used as loading control, (n=2).
4.7 Screening of cell signaling routes affected by PDIA1 silencing
highlight GSK3β and Stat3.
In a second time we performed a screening of the major cell signaling
pathways using PathScan® Intracellular Signaling Array Kit. In order to
underline a mechanism to explain the disruption of PDIA1-mediated regulation
of superoxide generation in colon carcinoma cells with Ras overactivation. The
PathScan®kit is based on sandwich immunoassay principle, which establishes
the activation state of 18 key cell signaling proteins by their specific
phosphorylation or cleavage. This assay was performed in HKE3 and HCT116
cells basal PDIA1 expression vs. PDIA1 silencing (Fig.12). We identified 9
protein alterations (phosphorylations or cleavages) induced by PDIA1 silencing
or due to differences between HKE3 and HCT116: Stat3, p70 S6 ribosomal
protein, HSP27, Bad, PRAS40, PARP, p38, Caspase-3 and GSK3β (Fig.12 and
Supplementary Fig.S4). Among these, the most consistent were
phosphorylations of GSK3β and Stat3. GSK3β (Glycogen synthase kinase-3
beta) is a constitutively active protein kinase inactivated by Ser9
phosphorylation. GSK3β behaves as positive regulator of Stat3 (89). Stat3 is a
transcription factor for many cytokines and growth factor receptors, activated by

Results -37
Tyr705 phosphorylation, which induces its dimerization, nuclear translocation
and DNA binding. Our assay showed that in HKE3 cells PDIA1 silencing
induced Ser9 GSK3β phosphorylation (suggestive of inactivation) and reduced
Tyr705 Stat3 phophorylation, suggesting its lower activation upon PDIA1
silencing. Conversely, in HCT116 cells, Ser9 phosphorylation of GSK3β is
significantly elevated already at baseline and stays elevated upon PDIA1
silencing. Meanwhile, Stat3 Tyr705 phosphorylation is also enhanced at
baseline and remains high after PDIA1 silencing. Results with GSK3β were
validated by Western blot analysis (supplementary data Fig.S5). These results
indicate that GSK3β/Stat3 regulation is disrupted in HCT116 cells. Stat3 is well
known to be regulated by Rac1 (90); we propose this may be a possible
mechanism to sustain Stat3 activation in HCT116 cells.

Results -38
Figure 12: PathScan Assay screening of cell signaling targets of PDIA1 in HKE3 and HCT116 cells.
Total array analysis. All array’s spot were quantified and analyzed using ImageJ software. PDIA1 silencing was checked by immunoblot analysis. Scrmb: si-RNA negative control; si-PDI: si-RNA against PDIA1. ERK1/2 Thr202/Tyr204 Phosphorylation; Stat1 Tyr701 Phosphorylation; Stat3 Tyr705 Phosphorylation; Akt Thr308 Phosphorylation; Akt Ser473 Phosphorylation; AMPKa Thr172 Phosphorylation; S6 Ribosomal Protein Ser235/236 Phosphorylation; mTOR Ser2448 Phosphorylation; HSP27 Ser78 Phosphorylation; Bad Ser112 Phosphorylation; p70 S6 Kinase Thr389 Phosphorylation; PRAS40 Thr246 Phosphorylation; p53 Ser15 Phosphorylation; p38 Thr180/Tyr182 Phosphorylation; SAPK/JNK Thr183/Tyr185 Phosphorylation; PARP Asp214 Cleavage; Caspase-3 Asp175 Cleavage; GSK-3b Ser9 Phosphorylation.

Results -39
Both GSK3β and Stat3 have been strongly involved with tumorigenesis
and metastasis induction, as well as other processes such as EMT (89, 91).
Moreover, Stat3 was described to negatively regulates E- cadherin in CRC (92)
. To gain further insight into these connections, we investigated the effects of
PDIA1 silencing in the expression of E-cadherin, a well-known marker of the
epithelial phenotype. Western blot analysis showed that HCT116 cells
expressed less E-cadherin (that is, enhanced mesenchymal shift) vs. HKE3 and
Caco2 at baseline (Fig.13A). PDIA1 silencing induced an increase in E-cadherin
protein expression in HKE3 cells (Fig.13C), while further decreasing it in
HCT116 (Fig.13D). These results are in line with the disrupted regulation of the
GSK3β/Stat3 axis in the latter. E-cadherin protein expression was unaltered in
Caco2 (Fig.13B), probably due to their APC mutation.
Figure 13: Effects of PDIA1 silencing on epithelial phenotype in colon carcinoma cells with distinct levels of KRas activation:
(A) Basal E-cadherin (E-cad) protein expression by immunoblot GAPDH protein expression was used as loading control, (n=3). (B) E-cadherin protein expression by immunoblot after PDIA1 silencing in Caco2 cells, GAPDH protein expression was used as loading control, (n=2). (C) E-cadherin protein expression by immunoblot after PDIA1 silencing in HKE3 cells, GAPDH protein expression was used as loading control, (n=3). (D) E-cadherin protein expression by immunoblot after PDIA1 silencing in HCT116 cells, GAPDH protein expression was used as loading control, (n=3).

Results -40
4.8 Functional effects of PDIA1 silencing on cell proliferation and
migration
Our results indicate a central role of PDIA1 in the regulation of oxidant
generation in colon carcinoma cells. Since the generation of ROS is tightly
linked to the regulation of cell proliferation, migration and survival, we sought to
investigate functional readouts of PDIA1 effects in tumor dynamics. The
spheroid assay, also termed 3-D culture, can provide information of cell
proliferation and evasion, mimicking tumors and cell escape. The growth of
tumor cell spheroids was investigated by measuring total spheroid area at T0
and T48h, calculated as the ratio T48h spheroid area / T0 initial spheroid area.
HCT116 growth was expectedly higher than that of HKE3 cells. PDIA1 silencing
induced a decrease in spheroid growth for HKE3, but not for HCT116 cells
(Fig.14A, B). To assess cell evasion after spheroid formation, spheroids were
placed on fibronectin 2-D matrix and their areas assessed at T0 and T48h. Cell
evasion was calculated as (T48h total evasion area – T0 initial spheroid area)/
T0 initial spheroid area. PDIA1 silencing promoted a decrease in cell evasion in
HKE3 and no modification in HCT116 (Fig.14C, D). These data are consistent
with results of a 2-D random migration assay in HT29-D4 cells (Supplementary
Data Table S1) and are in line with previous data in VSMC (57).

Results -41
Figure 14: Effects of PDIA1 silencing on spheroid growth / invasiveness in colon carcinoma cells with distinct levels of KRas activation:
Cell three dimensional proliferation assay (A) representative phase-contrast images of spheroid proliferation with or without PDIA1 silencing, pictures were taken at T0 and T48h after spheroids formation on methylcellulose media. (B) Proliferation analysis, spheroid surface area was measure at T0 and T48h, using ImageJ software, 17 up to 27 spheroids were analyzed for each condition. Effect of PDIA1 silencing on cell invasion (C) representative phase-contrast images of spheroid invasion in 2D 10µM fibronectin matrix, pictures were taken at T0 and T48h after spheroids were laid down on matrix. (D). Spheroids 2D invasion analysis, total spheroid extension was measured at T0 and T48h using ImageJ software, 12 up to 17 spheroids were analyzed for each condition. Data were expressed as the mean fold ± S.D, test Anova plus Tukey's multiple comparisons test (p < 0.01)**; (p< 0.0001) **** compared with HKE3 scrmb.

Results -42
4.9 Enrichment pathway analysis of protein interaction networks
To contextualize the results obtained in our investigation, we constructed
a protein-protein interaction network based upon enrichment pathway analysis
based upon our data. Protein-protein interaction networks were fashioned using
String Functional Association Network, in which nodes signify each protein and
edges connecting nodes represent proteins interactions. Interactions among
Nox1, PDIA1, RhoGDIα, Rac1, B-Raf, KRas, GSK3β, STAT3 and E-cadherin
were investigated and confronted to the database (Fig.15A). The network
constructed with these 9 proteins of interest associated with 16 edges, more
than the 4 predicted by the software. Suggesting that these proteins interact
among themselves to a higher degree than expected from an analogous group
of stochastic genome proteins. Such enrichment indicates that these proteins
display some degree of biological connection as a group. Importantly, this
analysis showed Rac1 as a likely hub of interaction with most proteins, with
direct connections to Nox1, RhoGDIα, B-Raf, GSK3β, Stat3, and E-cadherin.
Top ten ranked enriched proteins by KEGG pathway analysis (Fig.15B) showed
five cancer pathways (bars in black) related to our proteins, including pathways
for colorectal cancer. Gene Ontology (GO) analysis (Fig.15C) identified proteins
localized in plasma membrane, focal adhesion, cell periphery and cell junction.

Results -43
Figure 15: Analysis of protein-protein interaction network and functional pathways associated with PDIA1-Nox1 axis and KRas.
(A) Interaction map fashioned with String 10.5 program (http://string-db.org), Network nodes represent proteins of Nox1, PDIA1 (P4HB), RhoGDIα (ARHGDIA), RAC1, BRAF, KRAS, GSK3β (GSK3B), STAT3, E-cadherin (CDH1). Different colored lines displays predicted functional links. Interactions experimentally determined appear in pink, interactions curated from data bases in blue, co-expression were represented in black and text data mining in green. nine nodes with an average node degree of 3.56; number of edges: 16; expected number of edges: 4; average local clustering coefficient: 0.333; PPI enrichment p-value: 2.02e-05. (B) Top ten ranked enriched proteins KEGG pathway analysis. bar graphs show the with –log of FDR (False discovery rate). Hight values correlated to higher probabilities. (C) cellular component Gene ontology (GO) analysis.

5 Discussion
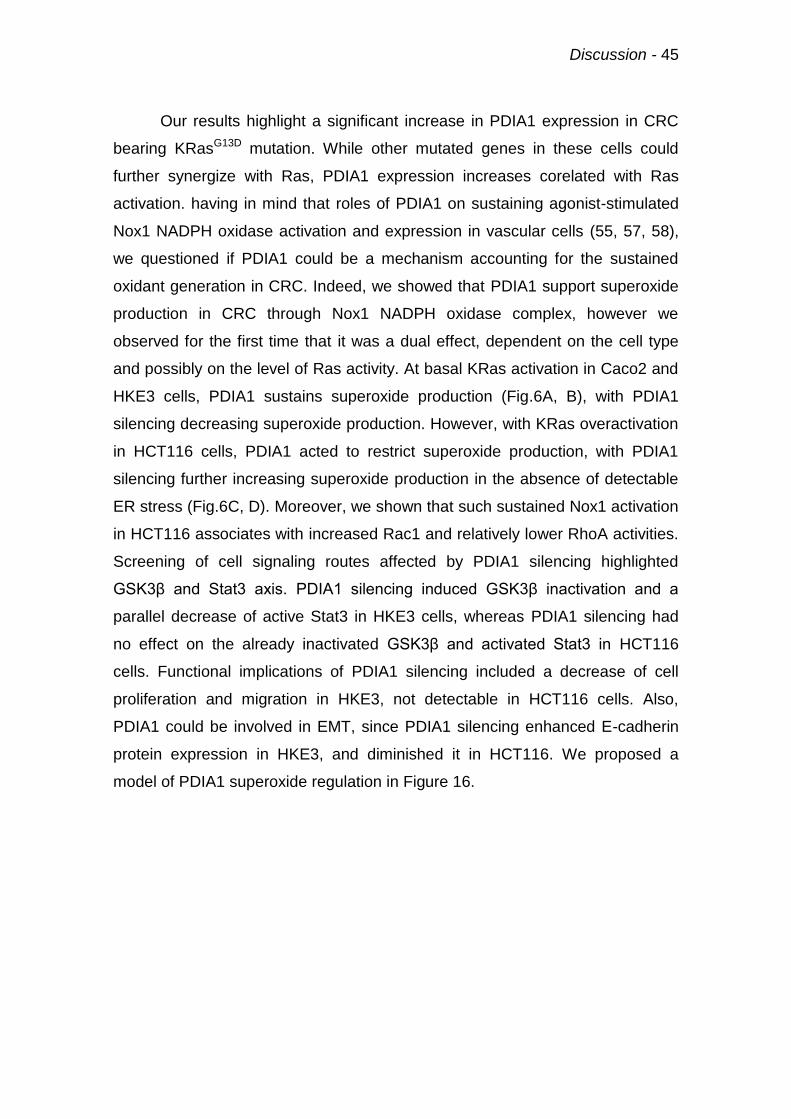
Discussion - 45
Our results highlight a significant increase in PDIA1 expression in CRC
bearing KRasG13D mutation. While other mutated genes in these cells could
further synergize with Ras, PDIA1 expression increases corelated with Ras
activation. having in mind that roles of PDIA1 on sustaining agonist-stimulated
Nox1 NADPH oxidase activation and expression in vascular cells (55, 57, 58),
we questioned if PDIA1 could be a mechanism accounting for the sustained
oxidant generation in CRC. Indeed, we showed that PDIA1 support superoxide
production in CRC through Nox1 NADPH oxidase complex, however we
observed for the first time that it was a dual effect, dependent on the cell type
and possibly on the level of Ras activity. At basal KRas activation in Caco2 and
HKE3 cells, PDIA1 sustains superoxide production (Fig.6A, B), with PDIA1
silencing decreasing superoxide production. However, with KRas overactivation
in HCT116 cells, PDIA1 acted to restrict superoxide production, with PDIA1
silencing further increasing superoxide production in the absence of detectable
ER stress (Fig.6C, D). Moreover, we shown that such sustained Nox1 activation
in HCT116 associates with increased Rac1 and relatively lower RhoA activities.
Screening of cell signaling routes affected by PDIA1 silencing highlighted
GSK3β and Stat3 axis. PDIA1 silencing induced GSK3β inactivation and a
parallel decrease of active Stat3 in HKE3 cells, whereas PDIA1 silencing had
no effect on the already inactivated GSK3β and activated Stat3 in HCT116
cells. Functional implications of PDIA1 silencing included a decrease of cell
proliferation and migration in HKE3, not detectable in HCT116 cells. Also,
PDIA1 could be involved in EMT, since PDIA1 silencing enhanced E-cadherin
protein expression in HKE3, and diminished it in HCT116. We proposed a
model of PDIA1 superoxide regulation in Figure 16.
Discussion - 46
Figure 16: Model of PDIA1-associated regulation of Nox1 in cells with normal or overactivated KRas
Our results show that PDIA1, which has been correlated to sustained
tumor growth and metastasis (48, 49), may play significant roles in regulating
oxidant production particularly at the transition tumorigenicity stage from less to
more aggressive. Such increased aggressiveness correlates with disruption of
PDIA1-mediated oxidant generation, resulting in a PDIA1-supported mechanism
that associates with restricted levels of oxidant generation. Whether this
process is a possible component of a tumoral escape program who deserves
further investigation. ROS production has been described to support either pro
or anti-tumoral effects, depending on the type of ROS, ROS production level,
sources, and associated activated pathways. ROS production is a well-known
hallmark of cancer initiation by inducing DNA damage and genomic instability
(8), and redox signaling can sustaining oncogenic key processes such as
proliferation and migration. e.g Nox1 activation sustain directional cell migration
in CRC (23).On the other hand, high level of ROS can have anti-tumoral effect
by inducing senescence and apoptosis (5). Along the same line, ROS
generation interplays in different ways with responsiveness to anti-cancer
drugs. Supplementation of chemotherapeutic compounds with antioxidant
molecules shows no benefit and can even have deleterious effect on cancer
treatment in patients (93).Besides in animal models, NAC and Vitamin E

Discussion - 47
treatment induce an increase of migration and invasiveness without proliferative
in mice with melanoma, and speed mice primary lung cancer (94, 95). In fact
the efficacy of radiotherapy and some chemotherapeutic compounds depends
on their ability to induce ROS production. In HT29-D4 and Caco2 cells, Nox1
silencing significantly decreases oxaliplatin efficiency (96), while adjuvant ROS-
generating molecules are promising and potentialized chemotherapeutic (73).
On the other hand, sustained ROS production may associate with
chemoresistance. CRC cells resistant to oxaliplatin present an increase of Nox1
basal activity and sustained ROS production supportive of cell survival(97).
Ras proto-oncogene overactivation also presents a dual pattern of
associated ROS-related effects. In Caco2 cells, Ras activation induces Nox1
expression through MEK-ERK pathway and GATA6 transcription factor (27).
Ras overactivation-increased ROS production (9) can lead to senescence and
apoptosis (98, 99), but also to cancer initiation and sustained tumorigenicity
(26). In NRK cells (rat kidney fibroblast), cancer initiation by KRasG12V requires
Nox1, and si-RNA against Nox1 prevents cell transformation, but Nox1
activation is not able to induce transformation alone (26). In parallel, KRasG12V
sustains Nox1 upregulation through the Ras-Raf-MEK-ERK pathway, since
MEK inhibitor blocked Nox1 up regulation (100). Therefore, Nox1 activation is
important to maintain Ras-induced malignant transformation. Mutant
overactivated KRas is also able to induce NRF2 up-regulation, which buffers
cellular oxidant levels but confers resistance to platine compounds(101, 102).
The identification that the supportive vs. inhibitory patterns of PDIA1-dependent
Nox-dependent ROS regulation largely follows the levels of Ras activation is,
therefore, a compelling indication that PDIA1 acts as an upstream determinant
of intracellular redox signaling programs associated with distinct stages of
tumorigenicity. Whether the modulation of PDIA1 activity at these distinct stages
can modify tumor evolution remains to be determined. Interestingly, an
analogous upstream role of PDIA1 in Nox-dependent ROS generation has
recently been described by our group in vascular cells overexpressing an
inducible lentiviral-delivered PDIA1 construct (Fernandes et al, unpublished
data). Early PDIA1 expression (24-48h) promotes Nox1 expression, oxidant
generation and enhanced migratory phenotype, while continued PDIA1

Discussion - 48
expression (up to 72h) switches the cells towards a differentiated phenotype
characterized by concomitant Nox4 expression. In parallel, extracellular PDIA1
acts as a regulator of cytoskeletal mechanosensitive remodeling in VSMC
(103). Together, these data suggest a possible model in which PDIA1 behaves
as an upstream redox-sensitive homeostasis sensor, responsible for the
servomechanism-like behavior described in our study.
The mechanisms involved in PDIA1-dependent modulation of oxidant
generation converge to the RhoGTPase Rac1, as in HCT116 cell KRas mutant
sustain Nox1 activity and superoxide production through enhanced Rac1
activation. Moreover, HKE3 overactivated Rac1 mutant expression induce the
same behavior we found in HCT116 cells, that is, PDIA1-dependent inhibition of
superoxide generation from Nox1. Importantly, since Rac1G12V mutation
probably bypasses its direct regulation by PDIA1, it is possible that the loss of
Rac1 regulation by PDIA1 is a key mechanism underlying the transition from
PDIA1-supported to PDIA1-inhibited ROS generation. In parallel, since Ras
activity correlates with such PDIA1 effects, it can be speculated that Ras-
mediate Rac1 activation underlies PDIA1 bypass and this transition in oxidant
regulation. PDIA1 and Rac1 interaction was previously proposed by us to
explain PDIA1 effects on Nox1-mediated processes, since PDIA1 silencing
significantly disables the associated Rac1 activation and PDIA1 displays
interaction with Rac1 (57). Here we confirmed a similar PDIA1 and Rac1
interaction, both in CRC, and endothelial cells. Moreover, PDIA1 has been
associated with significant effects on cytoskeletal regulation, which is the
hallmark of RhoGTPase effects (30). The importance of PDI-RhoGTPase
convergence is further evident from a recent study from our group showing an
extremely conserved evolutionary pattern of gene clustering involving PDI and
RhoGDI families. Since RhoGDIs are essential regulators of RhoGTPase
activity and PDIA1 closely interacts with RhoGDIalpha (69), RhoGDIs may be a
mechanism whereby PDIA1 regulate Rac1, as indeed suggested by our
expression data (Fig.9B). Overall, Rac1 may thus be at the center of a signaling
hub involving PDIA1, RhoGDIs, Ras and other proteins, as shown in the model
proposed in (Fig.15A), based on protein-protein interaction links from STRING
database.

Discussion - 49
In HCT116 and HT29-D4 cells, in which ROS production increased after
PDIA1 loss of function, we observed an associated cell migration insensitivity to
PDIA1 silencing (Fig14C, D and Table S1). EMT is an important mechanism
how sustain cell migration, and known to associate with ROS production in
breast cancer cells (104). In melanoma, Nox1-derived ROS sustains, and Nox1
inhibition reverts EMT (105). PDIA1 silencing promoted switch to epithelial
phenotype in HKE3 cells, but a switch to mesenchymal phenotype in HCT116
cells. It is possible that PDIA1 supports EMT through its effects on Nox1 and
ROS. Our results are in line with previous reports in hepatocellular carcinoma
showing that PDIA1 supports tumorigenesis by enhancing EMT through GRP78
down- regulation (106). Furthermore, E-cadherin protein expression correlates
with Stat3 activation in CRC (92). Indeed, in our HKE3 cells, PDIA1 silencing
induces Stat3 inhibition and increased E-cadherin expression. Rac1 is known to
sustain Stat3 activation, we believe that Ras-induced sustained Rac1 underlies
the lack of effect of PDIA1 silencing on Stat3 (Fig.12). Of note, Stat3 activation
correlates with Nox1 expression in Acute Respiratory Distress Syndrome(107)
and in early atherosclerosis(108, 109). Overall, the GSK3β/Stat3 axis appear as
an important mechanism to further investigate the pathways whereby PDIA1
interplays with Nox1 activation during Ras overactivation and EMT.
Although our work has not been focused on PDI as a possible
therapeutic target in cancer, since this issue has been focused so much
recently, we will briefly comment on it. Our results suggest that direct effects of
PDI inhibition might be more likely to affect the growth and mesenchymal
transformation of cells at earlier stages to tumor development. On the other
hand, at more advanced stages of tumor growth and/or with larger degree of
Ras overaction, PDI inhibition could offer an indirect way to sensitize cells to
apoptosis or senescence promoted by other therapeutic agents such as
oxaliplatin. PDIA1 and its switched function between sustaining to limiting
superoxide production in CRC cells seems a key mechanism for ROS
regulation in tumor cells.
To conclude, our results in CRC highlight PDIA1 ability to switched
between two different pattern of Nox1-dependent superoxide regulation, which

Discussion - 50
correlates with the level of Ras activation. Ras overactivation seems to bypass
PDIA1 in Nox1 regulation by an independent and possibly direct Rac1
activation. Several studies indicate that primarily adaptive responses, e.g.
senescence, can be hijacked to promote tumor escape responses such as
stemness (110). PDIA1 could be an adaptive mechanism responsible for a
redox switch from a tumor-suppressive to a vicious adaptive program promoting
tumor escape. These results reinforce the emerging potential therapeutic
implications of PDIA1 inhibition against cancer progression.

6 Supplementary Data
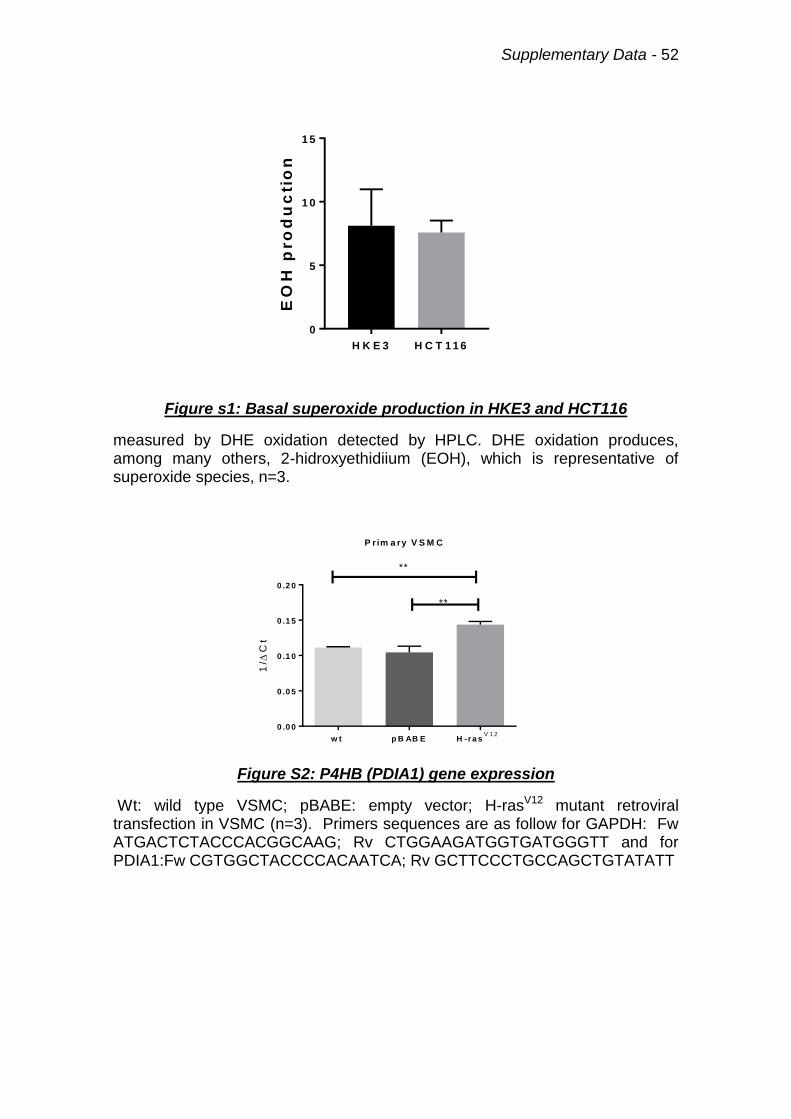
Supplementary Data - 52
H K E 3 H C T 1 1 6
0
5
1 0
1 5
EO
H p
ro
du
cti
on
Figure s1: Basal superoxide production in HKE3 and HCT116
measured by DHE oxidation detected by HPLC. DHE oxidation produces, among many others, 2-hidroxyethidiium (EOH), which is representative of superoxide species, n=3.
w t p B AB E H -r a sV 1 2
0 .0 0
0 .0 5
0 .1 0
0 .1 5
0 .2 0
1/
Ct
**
**
P rim a ry V S M C
Figure S2: P4HB (PDIA1) gene expression
Wt: wild type VSMC; pBABE: empty vector; H-rasV12 mutant retroviral transfection in VSMC (n=3). Primers sequences are as follow for GAPDH: Fw ATGACTCTACCCACGGCAAG; Rv CTGGAAGATGGTGATGGGTT and for PDIA1:Fw CGTGGCTACCCCACAATCA; Rv GCTTCCCTGCCAGCTGTATATT

Supplementary Data - 53
Figure S3: PDIA1 coimmunoprecipitation in HUVEC cells.
IP: PDIA1 immunoprecipitation, IGG: Immunoglobulin control, Input: 1% of total protein lysate, IB: immunoblot against PDIA1, KRas, and Rac1 proteins GAPDH protein expression was used as loading control, (n=1).

Supplementary Data - 54
Figure S4 : PathScan Assay screening of cell signaling targets of PDIA1 in HKE3 and HCT116 cells.
Array’s spot were quantified and analyzed using ImageJ software. PDIA1 silencing was checked by immunoblot analysis. Scrmb : si-RNA negative control; si-PDI: si-RNA against PDIA1. Stat3 Tyr705 Phosphorylation; S6 Ribosomal Protein Ser235/236 Phosphorylation; HSP27 Ser78 Phosphorylation; Bad Ser112 Phosphorylation; PRAS40 Thr246 Phosphorylation; p38 Thr180/Tyr182 Phosphorylation; PARP Asp214 Cleavage; Caspase-3 Asp175 Cleavage; GSK-3b Ser9 phosphorylation.
S ta t3
sig
na
l d
en
sit
y
HK
E3 s
crm
b
HK
E3 s
i-P
DI
HC
T116 s
crm
b
HC
T116 s
i-P
DI
0
2
4
6
8
1 0
S 6 r ib o s o m a l p ro te in
sig
na
l d
en
sit
y
HK
E3 s
crm
b
HK
E3 s
i-P
DI
HC
T116 s
crm
b
HC
T116 s
i-P
DI
0
2
4
6
8
1 0
H S P 2 7
sig
na
l d
en
sit
y
HK
E3 s
crm
b
HK
E3 s
i-P
DI
HC
T116 s
crm
b
HC
T116 s
i-P
DI
0
5
1 0
1 5
B a d
sig
na
l d
en
sit
y
HK
E3 s
crm
b
HK
E3 s
i-P
DI
HC
T116 s
crm
b
HC
T116 s
i-P
DI
0
5
1 0
1 5
2 0
2 5
P R A S 4 0
sig
na
l d
en
sit
y
HK
E3 s
crm
b
HK
E3 s
i-P
DI
HC
T116 s
crm
b
HC
T116 s
i-P
DI
0
1 0
2 0
3 0
4 0
5 0
p 3 8
sig
na
l d
en
sit
y
HK
E3 s
crm
b
HK
E3 s
i-P
DI
HC
T116 s
crm
b
HC
T116 s
i-P
DI
0
2
4
6
8
1 0
P A R P
sig
na
l d
en
sit
y
HK
E3 s
crm
b
HK
E3 s
i-P
DI
HC
T116 s
crm
b
HC
T116 s
i-P
DI
0
2
4
6
8
1 0
C a s p a s e -3
sig
na
l d
en
sit
y
HK
E3 s
crm
b
HK
E3 s
i-P
DI
HC
T116 s
crm
b
HC
T116 s
i-P
DI
0
2
4
6
8
G S K -3
sig
na
l d
en
sit
y
HK
E3 s
crm
b
HK
E3 s
i-P
DI
HC
T116 s
crm
b
HC
T116 s
i-P
DI
0
2 0
4 0
6 0
8 0

Supplementary Data - 55
Figure S5: Effects of PDIA1 silencing on GSK3 inactivation in HKE3 and HCT116.
GSK3β Ser 9 phosphorylation immunoblot after 72h PDIA1 silencing in HKE3 and HCT116. Relative GSK3β Ser9 phosphorylation levels were normalized to total GSK3β expression levels. Immunoblots were quantified using odyssey software.
Supplementary Table1: Effect of PDIA1 silencing in HT29-D4 single cell migration.
Single cell experiment, in HT29-D4 after PDIA1 silencing, HT29-D4 were plated into 24 well-plaques coated with 10mg/ml of fibronectin, in a density of 3x10⁴cells/well. Cells were maintained at 37°C in a humidified atmosphere of 5% CO2 into incubator coupled to a microscope and 2D random migration will be record for 16h. Total distance and Distance to origin are measure using image j manual traking. velocity as velocity= total distance/ time, and persistence as persistence= distance to origin/ total distance.
si-PDIA1
velocity Total distance Distance to origin persistence n=52
mean 0.33 199.36 64.65 0.29
SD 0.16 93.62 62.50 0.18
SEM 0.02 12.98 8.67 0.02
si-ctrl velocity Total distance Distance to origin persistence n=57
mean 0.33 182.58 54.72 0.29
SD 0.17 100.65 39.54 0.13
SEM 0.02 13.33 5.24 0.02

7 References

References - 57
1. Liou GY, Storz P. Reactive oxygen species in cancer. Free Radic Res. 2010;44(5):479-96. 2. Di Meo S, Reed TT, Venditti P, Victor VM. Role of ROS and RNS Sources in Physiological and Pathological Conditions. Oxid Med Cell Longev. 2016;2016:1245049. 3. Jones DP. Redefining oxidative stress. Antioxid Redox Signal. 2006;8(9-10):1865-79. 4. Panieri E, Santoro MM. ROS signaling and redox biology in endothelial cells. Cell Mol Life Sci. 2015;72(17):3281-303. 5. Behrend L, Henderson G, Zwacka RM. Reactive oxygen species in oncogenic transformation. Biochem Soc Trans. 2003;31(Pt 6):1441-4. 6. Roy K, Wu Y, Meitzler JL, Juhasz A, Liu H, Jiang G, et al. NADPH oxidases and cancer. Clin Sci (Lond). 2015;128(12):863-75. 7. Hanahan D, Weinberg RA. The hallmarks of cancer. Cell. 2000;100(1):57-70. 8. Hanahan D, Weinberg RA. Hallmarks of cancer: the next generation. Cell. 2011;144(5):646-74. 9. Irani K, Xia Y, Zweier JL, Sollott SJ, Der CJ, Fearon ER, et al. Mitogenic signaling mediated by oxidants in Ras-transformed fibroblasts. Science. 1997;275(5306):1649-52. 10. Kundu N, Zhang S, Fulton AM. Sublethal oxidative stress inhibits tumor cell adhesion and enhances experimental metastasis of murine mammary carcinoma. Clin Exp Metastasis. 1995;13(1):16-22. 11. Winterbourn CC, Kettle AJ, Hampton MB. Reactive Oxygen Species and Neutrophil Function. Annu Rev Biochem. 2016;85:765-92. 12. Bedard K, Krause KH. The NOX family of ROS-generating NADPH oxidases: physiology and pathophysiology. Physiol Rev. 2007;87(1):245-313. 13. Drummond GR, Selemidis S, Griendling KK, Sobey CG. Combating oxidative stress in vascular disease: NADPH oxidases as therapeutic targets. Nat Rev Drug Discov. 2011;10(6):453-71. 14. Drummond GR, Sobey CG. Endothelial NADPH oxidases: which NOX to target in vascular disease? Trends Endocrinol Metab. 2014;25(9):452-63. 15. Skonieczna M, Hejmo T, Poterala-Hejmo A, Cieslar-Pobuda A, Buldak RJ. NADPH Oxidases: Insights into Selected Functions and Mechanisms of Action in Cancer and Stem Cells. Oxid Med Cell Longev. 2017;2017:9420539. 16. Meitzler JL, Antony S, Wu Y, Juhasz A, Liu H, Jiang G, et al. NADPH oxidases: a perspective on reactive oxygen species production in tumor biology. Antioxid Redox Signal. 2014;20(17):2873-89. 17. Shanmugasundaram K, Nayak BK, Friedrichs WE, Kaushik D, Rodriguez R, Block K. NOX4 functions as a mitochondrial energetic sensor coupling cancer metabolic reprogramming to drug resistance. Nat Commun. 2017;8(1):997. 18. Takac I, Schroder K, Zhang L, Lardy B, Anilkumar N, Lambeth JD, et al. The E-loop is involved in hydrogen peroxide formation by the NADPH oxidase Nox4. J Biol Chem. 2011;286(15):13304-13. 19. Rezende F, Lowe O, Helfinger V, Prior KK, Walter M, Zukunft S, et al. Unchanged NADPH Oxidase Activity in Nox1-Nox2-Nox4 Triple Knockout Mice: What Do NADPH-Stimulated Chemiluminescence Assays Really Detect? Antioxid Redox Signal. 2016;24(7):392-9.
References - 58
20. Clempus RE, Griendling KK. Reactive oxygen species signaling in vascular smooth muscle cells. Cardiovasc Res. 2006;71(2):216-25. 21. Holl M, Koziel R, Schafer G, Pircher H, Pauck A, Hermann M, et al. ROS signaling by NADPH oxidase 5 modulates the proliferation and survival of prostate carcinoma cells. Mol Carcinog. 2016;55(1):27-39. 22. Kita H, Hikichi Y, Hikami K, Tsuneyama K, Cui ZG, Osawa H, et al. Differential gene expression between flat adenoma and normal mucosa in the colon in a microarray analysis. J Gastroenterol. 2006;41(11):1053-63. 23. Sadok A, Bourgarel-Rey V, Gattacceca F, Penel C, Lehmann M, Kovacic H. Nox1-dependent superoxide production controls colon adenocarcinoma cell migration. Biochim Biophys Acta. 2008;1783(1):23-33. 24. Laurent E, McCoy JW, 3rd, Macina RA, Liu W, Cheng G, Robine S, et al. Nox1 is over-expressed in human colon cancers and correlates with activating mutations in K-Ras. Int J Cancer. 2008;123(1):100-7. 25. Laurine E, Gregoire C, Fandrich M, Engemann S, Marchal S, Thion L, et al. Lithostathine quadruple-helical filaments form proteinase K-resistant deposits in Creutzfeldt-Jakob disease. J Biol Chem. 2003;278(51):51770-8. 26. Kamata T. Roles of Nox1 and other Nox isoforms in cancer development. Cancer Sci. 2009;100(8):1382-8. 27. Adachi Y, Shibai Y, Mitsushita J, Shang WH, Hirose K, Kamata T. Oncogenic Ras upregulates NADPH oxidase 1 gene expression through MEK-ERK-dependent phosphorylation of GATA-6. Oncogene. 2008;27(36):4921-32. 28. Bos JL. ras oncogenes in human cancer: a review. Cancer Res. 1989;49(17):4682-9. 29. Hatahet F, Ruddock LW. Modulating proteostasis: peptidomimetic inhibitors and activators of protein folding. Curr Pharm Des. 2009;15(21):2488-507. 30. Soares Moretti AI, Martins Laurindo FR. Protein disulfide isomerases: Redox connections in and out of the endoplasmic reticulum. Arch Biochem Biophys. 2017;617:106-19. 31. Laurindo FR, Pescatore LA, Fernandes Dde C. Protein disulfide isomerase in redox cell signaling and homeostasis. Free Radic Biol Med. 2012;52(9):1954-69. 32. Maattanen P, Kozlov G, Gehring K, Thomas DY. ERp57 and PDI: multifunctional protein disulfide isomerases with similar domain architectures but differing substrate-partner associations. Biochem Cell Biol. 2006;84(6):881-9. 33. Flaumenhaft R, Furie B, Zwicker JI. Therapeutic implications of protein disulfide isomerase inhibition in thrombotic disease. Arterioscler Thromb Vasc Biol. 2015;35(1):16-23. 34. Araujo TL, Zeidler JD, Oliveira PV, Dias MH, Armelin HA, Laurindo FR. Protein disulfide isomerase externalization in endothelial cells follows classical and unconventional routes. Free Radic Biol Med. 2017;103:199-208. 35. Jasuja R, Furie B, Furie BC. Endothelium-derived but not platelet-derived protein disulfide isomerase is required for thrombus formation in vivo. Blood. 2010;116(22):4665-74. 36. Jasuja R, Passam FH, Kennedy DR, Kim SH, van Hessem L, Lin L, et al. Protein disulfide isomerase inhibitors constitute a new class of antithrombotic agents. J Clin Invest. 2012;122(6):2104-13.

References - 59
37. Cho J, Furie BC, Coughlin SR, Furie B. A critical role for extracellular protein disulfide isomerase during thrombus formation in mice. J Clin Invest. 2008;118(3):1123-31. 38. Zhou J, Wu Y, Wang L, Rauova L, Hayes VM, Poncz M, et al. The C-terminal CGHC motif of protein disulfide isomerase supports thrombosis. J Clin Invest. 2015;125(12):4391-406. 39. Bekendam RH, Bendapudi PK, Lin L, Nag PP, Pu J, Kennedy DR, et al. A substrate-driven allosteric switch that enhances PDI catalytic activity. Nat Commun. 2016;7:12579. 40. Essex DW. Redox control of platelet function. Antioxid Redox Signal. 2009;11(5):1191-225. 41. Mor-Cohen R. Disulfide Bonds as Regulators of Integrin Function in Thrombosis and Hemostasis. Antioxid Redox Signal. 2016;24(1):16-31. 42. Xu S, Sankar S, Neamati N. Protein disulfide isomerase: a promising target for cancer therapy. Drug Discov Today. 2014;19(3):222-40. 43. Shin BK, Wang H, Yim AM, Le Naour F, Brichory F, Jang JH, et al. Global profiling of the cell surface proteome of cancer cells uncovers an abundance of proteins with chaperone function. J Biol Chem. 2003;278(9):7607-16. 44. Rho JH, Roehrl MH, Wang JY. Glycoproteomic analysis of human lung adenocarcinomas using glycoarrays and tandem mass spectrometry: differential expression and glycosylation patterns of vimentin and fetuin A isoforms. Protein J. 2009;28(3-4):148-60. 45. Yu SJ, Won JK, Ryu HS, Choi WM, Cho H, Cho EJ, et al. A novel prognostic factor for hepatocellular carcinoma: protein disulfide isomerase. Korean J Intern Med. 2014;29(5):580-7. 46. Beer DG, Kardia SL, Huang CC, Giordano TJ, Levin AM, Misek DE, et al. Gene-expression profiles predict survival of patients with lung adenocarcinoma. Nat Med. 2002;8(8):816-24. 47. Grek C, Townsend DM. Protein Disulfide Isomerase Superfamily in Disease and the Regulation of Apoptosis. Endoplasmic Reticulum Stress Dis. 2014;1(1):4-17. 48. Zhang D, Tai LK, Wong LL, Chiu LL, Sethi SK, Koay ES. Proteomic study reveals that proteins involved in metabolic and detoxification pathways are highly expressed in HER-2/neu-positive breast cancer. Mol Cell Proteomics. 2005;4(11):1686-96. 49. Zong J, Guo C, Liu S, Sun MZ, Tang J. Proteomic research progress in lymphatic metastases of cancers. Clin Transl Oncol. 2012;14(1):21-30. 50. Thongwatchara P, Promwikorn W, Srisomsap C, Chokchaichamnankit D, Boonyaphiphat P, Thongsuksai P. Differential protein expression in primary breast cancer and matched axillary node metastasis. Oncol Rep. 2011;26(1):185-91. 51. Goplen D, Wang J, Enger PO, Tysnes BB, Terzis AJ, Laerum OD, et al. Protein disulfide isomerase expression is related to the invasive properties of malignant glioma. Cancer Res. 2006;66(20):9895-902. 52. Ataman-onal YR, FR), Busseret, Sandrine (Lyons, FR), Charrier, Jean-philippe (Tassin la Demi-Lune, FR), Choquet-kastylevsky, Genevieve (Francheville, FR), inventor; BIOMERIEUX (Marcy l'Etoile, FR) assignee. Protein disulfide isomerase assay method for the in vitro diagnosis of colorectal cancer. United States2016.

References - 60
53. Kranz P, Neumann F, Wolf A, Classen F, Pompsch M, Ocklenburg T, et al. PDI is an essential redox-sensitive activator of PERK during the unfolded protein response (UPR). Cell Death Dis. 2017;8(8):e2986. 54. Lovat PE, Corazzari M, Armstrong JL, Martin S, Pagliarini V, Hill D, et al. Increasing melanoma cell death using inhibitors of protein disulfide isomerases to abrogate survival responses to endoplasmic reticulum stress. Cancer Res. 2008;68(13):5363-9. 55. Fernandes DC, Manoel AH, Wosniak J, Jr., Laurindo FR. Protein disulfide isomerase overexpression in vascular smooth muscle cells induces spontaneous preemptive NADPH oxidase activation and Nox1 mRNA expression: effects of nitrosothiol exposure. Arch Biochem Biophys. 2009;484(2):197-204. 56. Santos CX, Tanaka LY, Wosniak J, Laurindo FR. Mechanisms and implications of reactive oxygen species generation during the unfolded protein response: roles of endoplasmic reticulum oxidoreductases, mitochondrial electron transport, and NADPH oxidase. Antioxid Redox Signal. 2009;11(10):2409-27. 57. Pescatore LA, Bonatto D, Forti FL, Sadok A, Kovacic H, Laurindo FR. Protein disulfide isomerase is required for platelet-derived growth factor-induced vascular smooth muscle cell migration, Nox1 NADPH oxidase expression, and RhoGTPase activation. J Biol Chem. 2012;287(35):29290-300. 58. Janiszewski M, Lopes LR, Carmo AO, Pedro MA, Brandes RP, Santos CX, et al. Regulation of NAD(P)H oxidase by associated protein disulfide isomerase in vascular smooth muscle cells. J Biol Chem. 2005;280(49):40813-9. 59. Laurindo FR, Fernandes DC, Amanso AM, Lopes LR, Santos CX. Novel role of protein disulfide isomerase in the regulation of NADPH oxidase activity: pathophysiological implications in vascular diseases. Antioxid Redox Signal. 2008;10(6):1101-13. 60. Santos CX, Stolf BS, Takemoto PV, Amanso AM, Lopes LR, Souza EB, et al. Protein disulfide isomerase (PDI) associates with NADPH oxidase and is required for phagocytosis of Leishmania chagasi promastigotes by macrophages. J Leukoc Biol. 2009;86(4):989-98. 61. de APAM, Verissimo-Filho S, Guimaraes LL, Silva AC, Takiuti JT, Santos CX, et al. Protein disulfide isomerase redox-dependent association with p47(phox): evidence for an organizer role in leukocyte NADPH oxidase activation. J Leukoc Biol. 2011;90(4):799-810. 62. Meusser B, Hirsch C, Jarosch E, Sommer T. ERAD: the long road to destruction. Nat Cell Biol. 2005;7(8):766-72. 63. Tian G, Xiang S, Noiva R, Lennarz WJ, Schindelin H. The crystal structure of yeast protein disulfide isomerase suggests cooperativity between its active sites. Cell. 2006;124(1):61-73. 64. Peixoto AS, Geyer RR, Iqbal A, Truzzi DR, Soares Moretti AI, Laurindo FRM, et al. Peroxynitrite preferentially oxidizes the dithiol redox motifs of protein disulfide isomerase. J Biol Chem. 2017. 65. Sadok A, Marshall CJ. Rho GTPases: masters of cell migration. Small GTPases. 2014;5:e29710. 66. Schaefer A, Reinhard NR, Hordijk PL. Toward understanding RhoGTPase specificity: structure, function and local activation. Small GTPases. 2014;5(2):6.

References - 61
67. Olofsson B. Rho guanine dissociation inhibitors: pivotal molecules in cellular signalling. Cell Signal. 1999;11(8):545-54. 68. Huveneers S, Danen EH. Adhesion signaling - crosstalk between integrins, Src and Rho. J Cell Sci. 2009;122(Pt 8):1059-69. 69. Moretti AIS, Pavanelli JC, Nolasco P, Leisegang MS, Tanaka LY, Fernandes CG, et al. Conserved Gene Microsynteny Unveils Functional Interaction Between Protein Disulfide Isomerase and Rho Guanine-Dissociation Inhibitor Families. Sci Rep. 2017;7(1):17262. 70. Kalluri R, Weinberg RA. The basics of epithelial-mesenchymal transition. J Clin Invest. 2009;119(6):1420-8. 71. Suh YA, Arnold RS, Lassegue B, Shi J, Xu X, Sorescu D, et al. Cell transformation by the superoxide-generating oxidase Mox1. Nature. 1999;401(6748):79-82. 72. Wu RF, Terada LS. Ras and Nox: Linked signaling networks? Free Radic Biol Med. 2009;47(9):1276-81. 73. Huang YF, Zhu DJ, Chen XW, Chen QK, Luo ZT, Liu CC, et al. Curcumin enhances the effects of irinotecan on colorectal cancer cells through the generation of reactive oxygen species and activation of the endoplasmic reticulum stress pathway. Oncotarget. 2017;8(25):40264-75. 74. Ranayhossaini DJ, Rodriguez AI, Sahoo S, Chen BB, Mallampalli RK, Kelley EE, et al. Selective recapitulation of conserved and nonconserved regions of putative NOXA1 protein activation domain confers isoform-specific inhibition of Nox1 oxidase and attenuation of endothelial cell migration. J Biol Chem. 2013;288(51):36437-50. 75. Fernandes DC, Wosniak J, Jr., Pescatore LA, Bertoline MA, Liberman M, Laurindo FR, et al. Analysis of DHE-derived oxidation products by HPLC in the assessment of superoxide production and NADPH oxidase activity in vascular systems. Am J Physiol Cell Physiol. 2007;292(1):C413-22. 76. de Carvalho DD, Sadok A, Bourgarel-Rey V, Gattacceca F, Penel C, Lehmann M, et al. Nox1 downstream of 12-lipoxygenase controls cell proliferation but not cell spreading of colon cancer cells. Int J Cancer. 2008;122(8):1757-64. 77. Naber HP, Wiercinska E, Ten Dijke P, van Laar T. Spheroid assay to measure TGF-beta-induced invasion. J Vis Exp. 2011(57). 78. Wiercinska E, Naber HP, Pardali E, van der Pluijm G, van Dam H, ten Dijke P. The TGF-beta/Smad pathway induces breast cancer cell invasion through the up-regulation of matrix metalloproteinase 2 and 9 in a spheroid invasion model system. Breast Cancer Res Treat. 2011;128(3):657-66. 79. Fasterius E, Raso C, Kennedy S, Rauch N, Lundin P, Kolch W, et al. A novel RNA sequencing data analysis method for cell line authentication. PLoS One. 2017;12(2):e0171435. 80. Fogh J, Fogh JM, Orfeo T. One hundred and twenty-seven cultured human tumor cell lines producing tumors in nude mice. J Natl Cancer Inst. 1977;59(1):221-6. 81. Ilyas M, Tomlinson IP, Rowan A, Pignatelli M, Bodmer WF. Beta-catenin mutations in cell lines established from human colorectal cancers. Proc Natl Acad Sci U S A. 1997;94(19):10330-4. 82. Chandra SH, Wacker I, Appelt UK, Behrens J, Schneikert J. A common role for various human truncated adenomatous polyposis coli isoforms in the control of beta-catenin activity and cell proliferation. PLoS One. 2012;7(4):e34479.

References - 62
83. DL D, JA B, P C. N,N-dimethylformamide-induced alteration of cell culture characteristics and loss of tumorigenicity in cultured human colon carcinoma cells. Cancer Res. 1979:39: 1020. 84. Brattain MG, Fine WD, Khaled FM, Thompson J, Brattain DE. Heterogeneity of malignant cells from a human colonic carcinoma. Cancer Res. 1981;41(5):1751-6. 85. Shirasawa S, Furuse M, Yokoyama N, Sasazuki T. Altered growth of human colon cancer cell lines disrupted at activated Ki-ras. Science. 1993;260(5104):85-8. 86. jorgen F, Trempe G. Human Tumor Cells In Vitro. Plenum press; 1975. p. p. 115-41. 87. Fantini J, Abadie B, Tirard A, Remy L, Ripert JP, el Battari A, et al. Spontaneous and induced dome formation by two clonal cell populations derived from a human adenocarcinoma cell line, HT29. J Cell Sci. 1986;83:235-49. 88. Abankwa D, Gorfe AA, Hancock JF. Ras nanoclusters: molecular structure and assembly. Semin Cell Dev Biol. 2007;18(5):599-607. 89. Beurel E, Jope RS. Differential regulation of STAT family members by glycogen synthase kinase-3. J Biol Chem. 2008;283(32):21934-44. 90. Simon AR, Vikis HG, Stewart S, Fanburg BL, Cochran BH, Guan KL. Regulation of STAT3 by direct binding to the Rac1 GTPase. Science. 2000;290(5489):144-7. 91. Beurel E, Grieco SF, Jope RS. Glycogen synthase kinase-3 (GSK3): regulation, actions, and diseases. Pharmacol Ther. 2015;148:114-31. 92. Zhou C, Tong Y, Wawrowsky K, Melmed S. PTTG acts as a STAT3 target gene for colorectal cancer cell growth and motility. Oncogene. 2014;33(7):851-61. 93. Lawenda BD, Kelly KM, Ladas EJ, Sagar SM, Vickers A, Blumberg JB. Should supplemental antioxidant administration be avoided during chemotherapy and radiation therapy? J Natl Cancer Inst. 2008;100(11):773-83. 94. Le Gal K, Ibrahim MX, Wiel C, Sayin VI, Akula MK, Karlsson C, et al. Antioxidants can increase melanoma metastasis in mice. Sci Transl Med. 2015;7(308):308re8. 95. Sayin VI, Ibrahim MX, Larsson E, Nilsson JA, Lindahl P, Bergo MO. Antioxidants accelerate lung cancer progression in mice. Sci Transl Med. 2014;6(221):221ra15. 96. Dahan L, Sadok A, Formento JL, Seitz JF, Kovacic H. Modulation of cellular redox state underlies antagonism between oxaliplatin and cetuximab in human colorectal cancer cell lines. Br J Pharmacol. 2009;158(2):610-20. 97. Chocry M, Leloup L, Kovacic H. Reversion of resistance to oxaliplatin by inhibition of p38 MAPK in colorectal cancer cell lines: involvement of the calpain / Nox1 pathway. Oncotarget. 2017;8(61):103710-30. 98. Serrano M, Lin AW, McCurrach ME, Beach D, Lowe SW. Oncogenic ras provokes premature cell senescence associated with accumulation of p53 and p16INK4a. Cell. 1997;88(5):593-602. 99. Donninger H, Calvisi DF, Barnoud T, Clark J, Schmidt ML, Vos MD, et al. NORE1A is a Ras senescence effector that controls the apoptotic/senescent balance of p53 via HIPK2. J Cell Biol. 2015;208(6):777-89. 100. Mitsushita J, Lambeth JD, Kamata T. The superoxide-generating oxidase Nox1 is functionally required for Ras oncogene transformation. Cancer Res. 2004;64(10):3580-5.

References - 63
101. Chio IIC, Jafarnejad SM, Ponz-Sarvise M, Park Y, Rivera K, Palm W, et al. NRF2 Promotes Tumor Maintenance by Modulating mRNA Translation in Pancreatic Cancer. Cell. 2016;166(4):963-76. 102. Tao S, Wang S, Moghaddam SJ, Ooi A, Chapman E, Wong PK, et al. Oncogenic KRAS confers chemoresistance by upregulating NRF2. Cancer Res. 2014;74(24):7430-41. 103. Tanaka LY, Araujo HA, Hironaka GK, Araujo TL, Takimura CK, Rodriguez AI, et al. Peri/Epicellular Protein Disulfide Isomerase Sustains Vascular Lumen Caliber Through an Anticonstrictive Remodeling Effect. Hypertension. 2016;67(3):613-22. 104. Cichon MA, Radisky DC. ROS-induced epithelial-mesenchymal transition in mammary epithelial cells is mediated by NF-kB-dependent activation of Snail. Oncotarget. 2014;5(9):2827-38. 105. Liu F, Gomez Garcia AM, Meyskens FL, Jr. NADPH oxidase 1 overexpression enhances invasion via matrix metalloproteinase-2 and epithelial-mesenchymal transition in melanoma cells. J Invest Dermatol. 2012;132(8):2033-41. 106. Xia W, Zhuang J, Wang G, Ni J, Wang J, Ye Y. P4HB promotes HCC tumorigenesis through downregulation of GRP78 and subsequent upregulation of epithelial-to-mesenchymal transition. Oncotarget. 2017;8(5):8512-21. 107. Carnesecchi S, Dunand-Sauthier I, Zanetti F, Singovski G, Deffert C, Donati Y, et al. NOX1 is responsible for cell death through STAT3 activation in hyperoxia and is associated with the pathogenesis of acute respiratory distress syndrome. Int J Clin Exp Pathol. 2014;7(2):537-51. 108. Gan AM, Pirvulescu MM, Stan D, Simion V, Calin M, Manduteanu I, et al. Monocytes and smooth muscle cells cross-talk activates STAT3 and induces resistin and reactive oxygen species production [corrected]. J Cell Biochem. 2013;114(10):2273-83. 109. Manea SA, Constantin A, Manda G, Sasson S, Manea A. Regulation of Nox enzymes expression in vascular pathophysiology: Focusing on transcription factors and epigenetic mechanisms. Redox Biol. 2015;5:358-66. 110. Milanovic M, Fan DNY, Belenki D, Dabritz JHM, Zhao Z, Yu Y, et al. Senescence-associated reprogramming promotes cancer stemness. Nature. 2017.

8 CURRICULUM VITAE

Curriculum Vitae - 65
Curriculum Vitae
http://lattes.cnpq.br/7364034772424737
EDUCATIONAL BACKGROUND
Since september 2013 : Ph.D. in progress in Cardiology program at
Universidade de São Paulo (Brasil) in partnership with Oncology
program of Aix-Marseille Université (France). Advisor: Francisco Rafael
Martins Laurindo and Hervé Kovacic.
June 2011 : Master of Science at Université de la Méditerranée
(Marseille, France) in «Human pathology. Speciality: oncology,
pharmacology and therapeutics»
June 2009 : Graduation in Biology (major in physiology and
biotechnology) at Université de Provence (Marseille, France)
RESEARCH EXPERIENCE
Since September 2013: PhD project: Mechanisms associated with
loss of regulation of NADPH oxidase Nox1 by protein disulfide
isomerase in cells with sustained activation of the Ras pathway
June 2012- February 2013: Biotechnology engineer at CRO2 UMR
911, Marseille (France)
Sept 2010-Jully 2011: Internship in CRO2 UMR 911, Marseille (France)
supervised by Dr. P.BARBIER and Pr. V.PEYROT Characterization of

Curriculum Vitae - 66
Tau (a Microtubule Associated Protein) oxidation in vitro and in
cellulo.
Feb-June 2010: Internship in CRO2 UMR 911, Marseille (France)
supervised by Dr. P.BARBIER and Pr. V.PEYROT Protocol
development of in vitro oxidation of Tau protein.
April 2009: Internship in CRN2M UMR 6132 CNRS/INRA Marseille
(France) supervised by Pr. A.KASTNER. Staining of respiratory fibres
using Fluoroglod and Fluoro-ruby for the study of their plasticity
after partial spinal cord injury, on rat models.
PUBLICATIONS
1. De Bessa T, Breuzard G, Allegro D, Devred F, Peyrot V, Barbier P.
Tau Interaction with Tubulin and Microtubules: From Purified Proteins to Cells.
Methods Mol Biol. 2017;1523:61-85.
2. Breuzard G1, Hubert P, Nouar R, De Bessa T, Devred F, Barbier P, Sturgis
JN, Peyrot V.. Molecular mechanisms of Tau binding to microtubules and its
role in microtubule dynamics in live cells. Journal of Cell Science , v. 126, p.
2810-2819, 2013.
SUBMITED PUBLICATION
De Bessa Tiphany C., Pagano Alessandra, Moretti Ana I.S. ,Oliveira Percillia
V.S., Kovacic Hervé, Laurindo Francisco R.M. Subverted regulation of Nox1
NADPH oxidase-dependent oxidant generation by protein disulfide isomerase
A1 in colon carcinoma cells with overactivated K-Ras. (In Cell Death & Disease)
INTERNATIONAL COMMUNICATION

Curriculum Vitae - 67
Event : Gordon Research Seminar on Nox Family NADPH Oxidases
(GRS) held 06/04/2016 - 06/05/2016 at Waterville Valley in Waterville Valley NH
United States. (Talk + Poster)
Title : Ras overactivation as a potential mechanism for disrupted protein
disulfide isomerase/Nox1 interaction
Authors : Tiphany De Bessa, Alessandra Pagano, Percíllia V. S. Oliveira ,
Hervé Kovacic, Francisco Laurindo
Event: Gordon Research Conference on Nox Family NADPH Oxidases
held 06/05/2016 - 06/10/2016 at Waterville Valley in Waterville Valley NH
United States. (Poster)
Title : Ras overactivation as a potential mechanism for disrupted protein
disulfide isomerase/Nox1 interaction
Authors : Tiphany De Bessa, Alessandra Pagano, Percíllia V. S. Oliveira ,
Hervé Kovacic, Francisco Laurindo
Event: the 1st EuroTauMeeting the first Meeting devoted to Tau protein
held 27-28/04/2017 at Lille (France). (Poster)
Title : The Microtubule-associated protein Tau as a new putative therapeutic
target in glioblastomas
Authors : A. Pagano, G. Breuzard, F, Parat, A.Tchogandjian, D. Figarella-
Branger, F. Garrouste, T. De Bessa, J. Luis, V. Peyrot, P. Barbier., and H.
Kovacic.
Top Related