


Languages
Pages
Legal

J O U R N A L O F T H E AM E R I C A N C O L L E G E O F C A R D I O L O G Y V O L . 6 4 , N O . 1 , 2 0 1 4
ª 2 0 1 4 B Y T H E A M E R I C A N CO L L E G E O F C A R D I O L O G Y F O U N DA T I O N I S S N 0 7 3 5 - 1 0 9 7 / $ 3 6 . 0 0
P U B L I S H E D B Y E L S E V I E R I N C . h t t p : / / d x . d o i . o r g / 1 0 . 1 0 1 6 / j . j a c c . 2 0 1 4 . 0 1 . 0 8 4
Three-Dimensional Speckle Trackingof the Right Ventricle
Toward Optimal Quantification of Right VentricularDysfunction in Pulmonary HypertensionBenjamin C. F. Smith, MSC,*y Gary Dobson, MDCM, MSC,yz David Dawson, MSC,* Athanasios Charalampopoulos, MD,xJulia Grapsa, MD, PHD,*x Petros Nihoyannopoulos, MD*y
ABSTRACT
Fro
yScAlb
Tru
to
Lis
Yo
Ma
BACKGROUND Quantitative assessment of right ventricular (RV) systolic function largely depends on right ventricular
ejection fraction (RVEF). Three-dimensional speckle tracking (3D-ST) has been used extensively to quantify left ven-
tricular function, but its value for RV assessment has not been established.
OBJECTIVES This study sought to prospectively assess whether 3D-ST would be a reliable method for assessing RV
systolic function and whether strain values were associated with survival.
METHODS Comprehensive 2-dimensional echocardiographic assessment, 3D-ST of the RV free wall, and measurement
of RVEF was performed in 97 consecutive patients with established pulmonary hypertension (PHT) (RVEF 31.4 � 9.6%,
right ventricular systolic pressure [RVSP] 76.5 � 26.2 mm Hg) and 60 healthy volunteers (RVEF 43.8 � 9.4%, RVSP
25.9 � 4.3 mm Hg).
RESULTS Area strain (AS) (�24.3 � 7.3 vs. �30.8 � 7.2; p < 0.001), radial strain (23.2 � 14.4 vs. 34.9 � 18.2; p <
0.001), longitudinal strain (LS) (�15.5 � 3.8 vs. �17.9 � 4.4; p ¼ 0.001), and circumferential strain (CS) (�12.2 � 4.5
vs. �15.7 � 6.1; p < 0.001) were all reduced in patients with PHT, compared with normal individuals. AS and CS strongly
correlated to RVEF (r ¼ 0.851, r ¼ �0.711; p < 0.001). Systolic dyssynchrony index was greater in PHT (0.14 � 0.06 vs.
0.11 � 0.07; p ¼ 0.003) and correlated to RVEF (r ¼ �0.563, p < 0.001). AS (hazard ratio [HR]: 3.49; 95% confidence
interval [CI]: 1.21 to 7.07; p ¼ 0.017), CS (HR: 4.17; 95% CI: 1.93 to 12.97; p < 0.001), LS (HR: 7.63; 95% CI: 1.76 to 10.27;
p ¼ 0.001), and RVEF (HR: 2.43; 95 CI: 1.00 to 5.92; p ¼ 0.050) were significant determinants of all-cause mortality.
Only AS (p ¼ 0.029) and age (p ¼ 0.087) were predictive of death after logistic regression analysis.
CONCLUSIONS PHT patients have reduced RV strain patterns and more dyssynchronous ventricles compared with
controls, which was relatable to clinical outcomes. AS best correlated with RVEF and provides prognostic information
independentofothervariables. (JAmCollCardiol 2014;64:41–51)©2014by theAmericanCollegeofCardiologyFoundation.
S erial echocardiographic examinations allowfor monitoring anatomic and hemodynamicchanges in patients with pulmonary hyper-
tension (PHT). Right ventricular (RV) dysfunctionin PHT is an important predictor of longevity (1),and deterioration in RV systolic function is crucialin patient management and follow-up.
m the *Department of Cardiology, Hammersmith Hospital, Imperial Colle
hool of Medicine, Imperial College, London, United Kingdom; zDepartme
erta, Canada; and the xNational Pulmonary Hypertension Service, Hamm
st, London, United Kingdom. The authors have reported that they have n
disclose.
ten to this manuscript’s audio summary by JACC Editor-in-Chief Dr. Vale
u can also listen to this issue’s audio summary by JACC Editor-in-Chief D
nuscript received July 11, 2013; revised manuscript received January 9, 2
Accurate assessment of RV systolic function ischallenging by any method and more so usingconventional echocardiography. Currently, it is rec-ommended to use basic quantitative methodsto evaluate RV dysfunction (2), though each hasinherent drawbacks, limiting their specificity andreliability (3). Longitudinal strain (LS) of the RV has
ge Healthcare NHS Trust, London, United Kingdom;
nt of Anesthesiology, University of Calgary, Calgary,
ersmith Hospital, Imperial College Healthcare NHS
o relationships relevant to the contents of this paper
ntin Fuster.
r. Valentin Fuster.
014, accepted January 19, 2014.

FIGUR
This vi
free w
free w
ABBR EV I A T I ON S
AND ACRONYMS
2D = 2-dimensional
3D = 3-dimensional
AS = area strain
CS = circumferential strain
LS = longitudinal strain
PHT = pulmonary hypertension
ROC = receiver-operating
characteristic
RS = radial strain
RV = right ventricle/ventricular
RVEF = right ventricular
ejection fraction
RVSP = right ventricular
systolic pressure
ST = speckle tracking
TAPSE = tricuspid annular
plane systolic excursion
Smith et al. J A C C V O L . 6 4 , N O . 1 , 2 0 1 4
3D Speckle Tracking of the RV in PHT J U L Y 8 , 2 0 1 4 : 4 1 – 5 1
42
been measured in 2 dimensions (4–6) in pop-ulations with PHT, but the data are intrinsi-cally limited within the 2-dimensional (2D)slice plane and, therefore, suffers from out-of-plane data loss.
SEE PAGE 52
Three-dimensional speckle tracking (3D-ST) is in principle better, compared with2D-ST, because it is not slice-plane limitedand delivers vectored data in 3 orthogonalplanes from 1 analysis. There are as yet nopublished 3D-ST studies of the RV utilizingthe association of 3D strain with clinicaloutcomes, and there are no suitably scaledstudies of area, radial, or circumferen-tial RV strain in patients with PHT. Inthis study, we hypothesized that: 1) 3D-ST would be a reproducible quantitative
method for assessing RV systolic function; 2) RVstrain may be reduced in patients with PHT; 3) RVstrain may be related to measures of RV systolicfunction and pulmonary pressures; and 4) RV strainmay be related to survival.
E 1 5-Plane View of the 3D Full-Volume Capture of the RV
ew demonstrates the optimized positioning of the tangential long a
all possible and ensuring that the septum was not included. The B-
alls as close to the septum as possible. The A-plane (blue arrowhe
METHODS
Patients were prospectively recruited via referralfrom the National PHT Centre at HammersmithHospital (London, United Kingdom) as part of theirregular diagnostic assessment and follow-up. Diseaseetiology was categorized according to the 2008 DanaPoint Classification (7). All patients with pulmonaryarterial hypertension were treated with an endo-thelin receptor antagonist, a phosphodiesterase-5inhibitor, or intravenous/inhaled prostacyclin ana-logs, or their combination, according to currentguidelines (8).
Criteria for inclusion into the study were measur-able tricuspid regurgitant velocity $2.7 m/s; estab-lished diagnosis of PHT (mean pulmonary arterialpressure from a catheter study of $25 mm Hg); andsinus rhythm. Patients with cardiomyopathy, con-genital heart disease, arrhythmias, or suboptimalimaging were excluded. Asymptomatic healthy vol-unteers also were recruited from the communityas controls and included if they were in sinusrhythm, had normal biventricular systolic and dia-stolic function, had structurally normal valves, andhad measurable tricuspid regurgitation of <2.7 m/s.
xis cuts to incorporate the largest portion of the right ventricular (RV)
plane (green arrowheads) cuts through the anterior and posterior RV
ads) divides the RV free wall into equal sectors. 3D ¼ 3-dimensional.

B
RV
LVA
FIGURE 2 Illustration of Segmentation
The A- and B-planes (as indicated by the red dotted lines in the upper images) correspond
to the longitudinal planes that can be seen in Figure 1 and define the division of the RV into
quadrants. The starred segments were included for analysis. Circles ¼ peak systolic strain
of the corresponding segments on the strain–time curve (lower image). LV ¼ left ventricle;
RV ¼ right ventricle.
J A C C V O L . 6 4 , N O . 1 , 2 0 1 4 Smith et al.J U L Y 8 , 2 0 1 4 : 4 1 – 5 1 3D Speckle Tracking of the RV in PHT
43
Patients were followed up after a minimum of12 months with mortality data and assessed at24 months. All subjects provided informed consent.The study was approved by the responsible ethicscommittee.
Comprehensive echocardiographic examination ofthe RV was performed by a senior echocardiographeraccredited by the British Society of Echocardiographyaccording to the most recent guidelines for the ex-amination of the right heart (2).
ACQUISITION AND ANALYSIS OF 3D FULL-VOLUME
CAPTURES. Two 3D full-volume datasets for the RVwere acquired using the matrix array 3D transducerwith a center frequency of 3 MHz (PST-25SX, ToshibaMedical Systems Europe BV, Zoetermeer, theNetherlands), using the tissue harmonic mode with a4-beat–triggered capture. The image was guided by a5-plane view taken in the apical window and alignedso the entire RV was incorporated into the full-volume dataset. The depth was minimized, so onlythe chamber, walls, and tricuspid annulus filled thevolume.
3D-ST was performed using the Toshiba 3DT speckletracking software on the Toshiba Aplio Artida ultra-sound system (version 3.00). Because the software isdesigned for the left ventricle, a modified methodol-ogy was devised, as detailed in the following text.
The long-axis A-plane was adjusted, cuttingdirectly down the center of the RV, dividing theseptum and RV free wall in half, and through thedistal apical portion. The long-axis B-plane wasaligned as close as possible to the interventricularseptum and through the distal apical portion (Fig. 1),so that the anterior segments (labeled b, c, d inFig. 2) could reliably be differentiated as RV free-wall. The remaining segments labeled (a, e, f inFig 2) were discarded, because they could not reli-ably be differentiated into RV free wall or septum bythe software.
Using the 3DT software and with the cineloopfrozen to the end-diastolic frame, the endocardialborder was manually traced in the biplane views andadjusted in the 3 coronal planes (Fig. 1). The epicardialborder was then adjusted to correspond closely tothe wall thickness. The software then tracked thespeckles from the 3D dataset and calculated strain,volumes, and 3D right ventricular ejection fraction(RVEF). Peak systolic strain was used for analysis.
The systolic dyssynchrony index of the RV freewall was calculated from the segmental area strain(AS) in a similar manner to that described for the leftventricle (9). The time to the minimal AS for eachsegment was recorded and normalized to the cardiac
period. Within each subject, the standard deviation ofthe 7 normalized segmental times was the systolicdyssynchrony index, a measure of dispersion ofcontraction.Sample s ize determinat ion . The determination ofsample size was on the basis of the initial data of28 patients and 10 controls that were previouslyreported (10). The sample size was calculated asn ¼ 97, in order to achieve 90% power with signif-icance of type I error: a ¼ 0.01 and delta value of0.4 (variance 5%) to detect a significant differencein RV strain between patients with PHT and healthyvolunteers.Stat is t i ca l ana lys i s . Data are expressed as themean � SD for normally distributed data, and asmedian with interquartile range when variablesare not normally distributed. Normal distributionof each variable was assessed by a histogram andthe Kolmogorov-Smirnov test. Comparison between 2groups for categorical variables was by Fisher exacttest, and by independent samples t test for contin-uous variables. Correlation between variables wasassessed by Spearman correlation coefficient. The

138 patients with PHT 107 healthy volunteers
41 Excluded 47 ExcludedSub-optimal imaging (29)
Congenital Heart Disease (6)Irregular rhythm (4)
No definitive PHT diagnosis (2)
Sub-optimal imaging (39)Impaired LV systolic function (4)
Congenital Heart Disease (2)Hypertension (1)
Moderate mitral regurgitation (1)
97 patients with PHT + 60 healthy volunteers
FIGURE 3 Patient Flow Diagram
Reasons for excluding patients for suboptimal imaging included poor acoustic
windows, image artefacts, the RV being too large to fit entirely into the 3D
full volume, and poor tracking. PHT ¼ pulmonary hypertension; other
abbreviations as in Figures 1 and 2.
TABLE 1
Age, yrs
Male
RVEF, %
Tricuspid
RVSP, mm
RV end-di
Values are m
RV ¼ rigsystolic pre
Smith et al. J A C C V O L . 6 4 , N O . 1 , 2 0 1 4
3D Speckle Tracking of the RV in PHT J U L Y 8 , 2 0 1 4 : 4 1 – 5 1
44
sensitivity and specificity of strain vector cutoffpoints were decided by the criterion value indicatedby the Youden index from the receiver-operatingcharacteristic (ROC) curve to predict significant RVimpairment (RVEF <40%) and mortality outcome.Kaplan-Meier plots to assess mortality risk were thenformed using the cutoffs found. The contribution offactors to outcome was assessed with logistic regres-sion using a stepwise backward likelihood ratiomethod of regression. The p value above which fac-tors were removed was 0.10. Test–retest reproduc-ibility for radial strain (RS), LS, and circumferentialstrain (CS) was by a Bland-Altman analysis. All testsare double sided, and the cutoff value of statisticalsignificance was 0.05. Statistical analyses were per-formed using SPSS version 17.0 (SPSS, Chicago, Illi-nois), except for the ROC and Kaplan-Meier tests,which were performed using MedCalc version 12.4.0(MedCalc Software, Ostend, Belgium).
Baseline Characteristics of Patients and Healthy Volunteers
Patients(n ¼ 97)
Controls(n ¼ 60) p Value
60.6 � 15.3 40.6 � 12.0 <0.001
34 (35) 24 (40) 0.610
31.4 � 9.6 43.8 � 9.4 <0.001
annular plane systolic excursion, mm 18.7 � 5.3 24.1 � 4.1 <0.001
Hg 76.5 � 26.2 25.9 � 4.3 <0.001
astolic pressure, mm Hg* 21.0 � 9.0 8.0 � 1.9 <0.001
ean � SD or n (%). *Data from a subset of n ¼ 77 patients and n ¼ 38 controls.
ht ventricular; RVEF ¼ right ventricular ejection fraction; RVSP ¼ right ventricularssure.
RESULTS
BASELINE CHARACTERISTICS. Between November2009 and July 2012, 138 PHT patients and107 healthy volunteers were prospectively enrolledinto the study. Forty-one patients and 47 controlswere excluded (Fig. 3), leaving 97 PHT patientsand 60 controls for analysis. The baseline character-istics for both groups are presented in Table 1.Patients were on average older than controls.There were no subjects with severe tricuspid regur-gitation or any degree of pulmonary stenosis. Of thepatients, 60 (62%) were diagnosed with pulmonaryarterial hypertension, 31 (32%) with chronic throm-boembolic PHT, and 6 (6%) secondary to left heartdisease.
On 3D full-volume imaging, the volume rate wasless in the controls than it was for patients (13.7 � 0.8volumes/s vs. 15.1 � 2.6 volumes/s; p < 0.001), butmean resolution did not differ between groups (0.48� 0.06 mm/pixel vs. 0.49 � 0.06 mm/pixel; p ¼ 0.513).
RV STRAIN VALUES. In patients, RV strain was uni-versally reduced for all vectors (Table 2). When strainvectors were plotted against RVEF (Fig. 4), there weremoderate-strong correlations for all strain vectors,with the strongest correlations for AS (r ¼ �0.850, p <
0.001) and CS (r ¼ �0.707, p < 0.001), then LS(r ¼ �0.540, p < 0.001) and RS (r ¼ 0.444, p < 0.001).Looking at the patient population in isolation, AS(r ¼ �0.865, p < 0.001) and CS (r ¼ �0.759, p < 0.001)remained strongly correlative, with lesser relation-ships for LS (r ¼ �0.547, p < 0.001) and CS (r ¼ 0.284,p ¼ 0.005).
Tricuspid annular plane systolic excursion (TAPSE)weakly correlated with LS (r ¼ �0.355, p < 0.001), AS(r ¼ �0.293, p < 0.001), and RS (r ¼ 0.249, p ¼ 0.002)across both arms. For the PHT group alone, therewere slightly better correlations for LS (r ¼ �0.462,p < 0.001), AS (r ¼ �0.366, p < 0.001), and RS(r ¼ 0.269, p ¼ 0.008), with CS reaching statisticalsignificance (r ¼ �0.208, p ¼ 0.043), albeit weaklycorrelative.
Age was only weakly correlative with LS (r ¼ 0.177,p ¼ 0.022) and AS (r ¼ 0.164, p ¼ 0.035) across theentire study population. There were no significantcorrelations for age in patients.
All strain vectors and TAPSE were entered intoa ROC model to predict RVEF <40% (Table 3, Fig. 5).AS >�28.9% best predicted an RVEF<40%, followedby CS >�15.4%.
Right ventricular systolic pressure (RVSP) wasestimated from tricuspid regurgitant velocity in allpatients and controls, and RV end-diastolic pressure
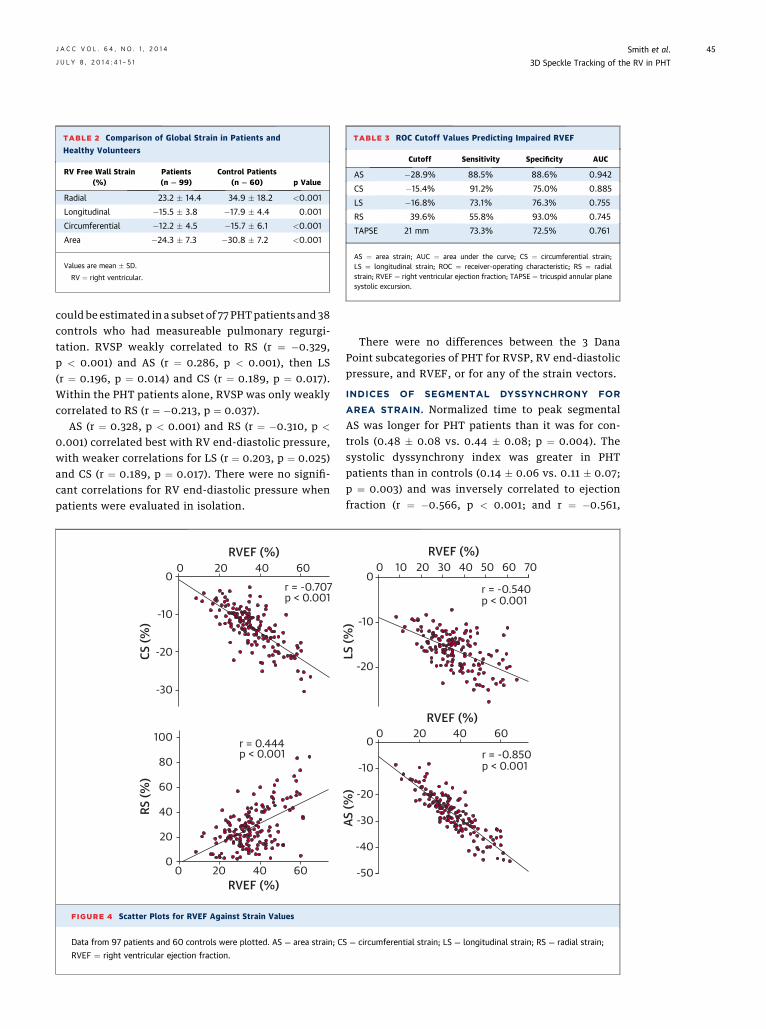
TABLE 2 Comparison of Global Strain in Patients and
Healthy Volunteers
RV Free Wall Strain(%)
Patients(n ¼ 99)
Control Patients(n ¼ 60) p Value
Radial 23.2 � 14.4 34.9 � 18.2 <0.001
Longitudinal �15.5 � 3.8 �17.9 � 4.4 0.001
Circumferential �12.2 � 4.5 �15.7 � 6.1 <0.001
Area �24.3 � 7.3 �30.8 � 7.2 <0.001
Values are mean � SD.
RV ¼ right ventricular.
TABLE 3 ROC Cutoff Values Predicting Impaired RVEF
Cutoff Sensitivity Specificity AUC
AS �28.9% 88.5% 88.6% 0.942
CS �15.4% 91.2% 75.0% 0.885
LS �16.8% 73.1% 76.3% 0.755
RS 39.6% 55.8% 93.0% 0.745
TAPSE 21 mm 73.3% 72.5% 0.761
AS ¼ area strain; AUC ¼ area under the curve; CS ¼ circumferential strain;LS ¼ longitudinal strain; ROC ¼ receiver-operating characteristic; RS ¼ radialstrain; RVEF ¼ right ventricular ejection fraction; TAPSE ¼ tricuspid annular planesystolic excursion.
J A C C V O L . 6 4 , N O . 1 , 2 0 1 4 Smith et al.J U L Y 8 , 2 0 1 4 : 4 1 – 5 1 3D Speckle Tracking of the RV in PHT
45
could be estimated in a subset of 77 PHTpatients and 38controls who had measureable pulmonary regurgi-tation. RVSP weakly correlated to RS (r ¼ �0.329,p < 0.001) and AS (r ¼ 0.286, p < 0.001), then LS(r ¼ 0.196, p ¼ 0.014) and CS (r ¼ 0.189, p ¼ 0.017).Within the PHT patients alone, RVSP was only weaklycorrelated to RS (r ¼ �0.213, p ¼ 0.037).
AS (r ¼ 0.328, p < 0.001) and RS (r ¼ �0.310, p <
0.001) correlated best with RV end-diastolic pressure,with weaker correlations for LS (r ¼ 0.203, p ¼ 0.025)and CS (r ¼ 0.189, p ¼ 0.017). There were no signifi-cant correlations for RV end-diastolic pressure whenpatients were evaluated in isolation.
0
-10
-20
-30
0 20 40 60
100
80
60
60
40
40
20
200
0
p < 0.001r = 0.444
p < 0.001r = -0.707
RVEF (%)
RVEF (%)
CS (%
)RS
(%)
FIGURE 4 Scatter Plots for RVEF Against Strain Values
Data from 97 patients and 60 controls were plotted. AS ¼ area strain; C
RVEF ¼ right ventricular ejection fraction.
There were no differences between the 3 DanaPoint subcategories of PHT for RVSP, RV end-diastolicpressure, and RVEF, or for any of the strain vectors.
INDICES OF SEGMENTAL DYSSYNCHRONY FOR
AREA STRAIN. Normalized time to peak segmentalAS was longer for PHT patients than it was for con-trols (0.48 � 0.08 vs. 0.44 � 0.08; p ¼ 0.004). Thesystolic dyssynchrony index was greater in PHTpatients than in controls (0.14 � 0.06 vs. 0.11 � 0.07;p ¼ 0.003) and was inversely correlated to ejectionfraction (r ¼ �0.566, p < 0.001; and r ¼ �0.561,
0
-10
-20
-10
-20
-30
00 20 40 60
0 20 30 40 60 7010 50
-40
-50
r = -0.850p < 0.001
r = -0.540p < 0.001
RVEF (%)
RVEF (%)
AS (%
)LS
(%)
S ¼ circumferential strain; LS ¼ longitudinal strain; RS ¼ radial strain;

100
80
60
40
20
0100806040200 100806040200
100
80
60
40
20
0
Sens
itivi
ty (%
)
Sens
itivi
ty (%
)
100-Specificity (%) 100-Specificity (%)
ASCSLSRSRVEFTAPSE
FIGURE 5 ROC Curves for Impaired RVEF and Mortality
Receiver-operating characteristic (ROC) curves are shown for impaired RVEF (left) and mortality (right). AS (red), CS (orange), LS (salmon), RS
(sky blue), RVEF (periwinkle blue), TAPSE (slate blue) are shown for 97 patients and 60 controls. TAPSE ¼ tricuspid annular plane systolic
excursion; other abbreviations as in Figure 4.
Smith et al. J A C C V O L . 6 4 , N O . 1 , 2 0 1 4
3D Speckle Tracking of the RV in PHT J U L Y 8 , 2 0 1 4 : 4 1 – 5 1
46
p < 0.001 for patients alone). These data suggest thatpatients with PHT had more dyssynchronous ventri-cles than controls, and that dyssynchrony was relatedto RV dysfunction.
MORTALITY OUTCOME DATA. Mean follow-up timewas 33 � 8 months (14 to 44 months). During this timeframe, 21% of the patients from the PHT arm died (20 of97). Nonsurvivors had reduced AS (�21.2 � 5.8%vs. �25.1 � 7.4%; p ¼ 0.033), CS (�10.1 � 3.1% vs. �12.8� 4.7%; p ¼ 0.020), LS (�13.7 � 3.6% vs. �16.0 � 3.7%;p ¼ 0.016), and RS (17.4 � 11.6% vs. 24.7 � 14.6%; p ¼0.040). There were no significant differences betweensurvivors and nonsurvivors for RVEF, RVSP, TAPSE,and systolic dyssynchrony index.
Strain vectors and RVEF were entered into a ROCmodel to evaluate probability of 24-month mortality(Table 4, Fig. 5). AS, CS, and LS cutoffs most accu-rately predicted mortality. Kaplan-Meier survivalprobability was then assessed using the ROC cutoffvalues (Table 5, Fig. 6). AS, CS, LS, and RVEF weresignificant determinants of all-cause mortality.
TABLE 4 ROC Cutoff Values Predicting 24-Month Mortality
Cutoff Sensitivity Specificity AUC
AS �24.7% 80.0% 53.5% 0.674
CS �9.9% 65.0% 73.2% 0.675
LS �16.1% 90.0% 52.1% 0.700
RS 23.0% 75.0% 50.7% 0.651
RVEF 30.3% 65.0% 59.2% 0.613
TAPSE 18 mm 70.0% 59.4% 0.636
Abbreviations as in Table 3.
TAPSE, RV systolic annular velocity, RVEF, age,sex, and minimum AS were entered as independentvariables into a logistic regression model and pro-cessed using a stepwise backward-likelihood ratiomethod. This resultant model was statistically sig-nificant and contained only AS (p ¼ 0.029) and age(p ¼ 0.087) as predictors of death, suggesting thesuperiority of the 3D-derived AS over other variables.
INTRAOBSERVER VARIABILITY IN PATIENTS AND
CONTROLS. Repeated measures of RS, LS, and CSvalues were performed in 117 of 159 PHT patients andcontrols who had 2 suitable 3D full-volume captures,with intraobserver variability as assessed by Bland-Altman graphs presented (Table 6, Fig. 7). When the 2repeated measures were compared, the most repro-ducible strain vector was LS, then CS, followed by RS.
DISCUSSION
This is the first comprehensive study to our knowl-edge using 3D-ST as a novel quantitative measure
TABLE 5 Kaplan-Meier Cutoffs to Predict Mortality
Chi-Square Hazard Ratio 95% CI p Value
AS >�24.7% 5.71 3.49 1.21–7.07 0.017
CS >�9.9% 11.02 4.17 1.93–12.97 <0.001
LS >�16.1% 10.39 7.63 1.76–10.27 0.001
RS <23.0% 2.53 2.21 0.84–5.07 0.112
RVEF <30.3% 3.85 2.43 1.00–5.92 0.050
TAPSE <18 mm 2.88 2.12 0.89–5.34 0.090
CI ¼ confidence interval; other abbreviations as in Table 3.

1009080706050403020100Su
rviv
al p
roba
bilit
y (%
) 1009080706050403020100Su
rviv
al p
roba
bilit
y (%
) 1009080706050403020100Su
rviv
al p
roba
bilit
y (%
)
1009080706050403020100Su
rviv
al p
roba
bilit
y (%
) 1009080706050403020100Su
rviv
al p
roba
bilit
y (%
) 1009080706050403020100Su
rviv
al p
roba
bilit
y (%
)
0 10 20 30 40 50Months
0 10 20 30 40 50Months
0 10 20 30 40 50Months
0 10 20 30 40 50Months
0 10 20 30 40 50Months
0 10 20 30 40 50Months
AS>-24.7%
AS≤-24.7%
CS>-9.9%
CS≤-9.9% LS≤-16.1%
LS>-16.1%
RS≤23.0%
RS>23.0%
TAPSE≤18mm
TAPSE>18mm
RVEF≤30.3%
RVEF>30.3%
FIGURE 6 Kaplan-Meier Curves for Survival
Survival analysis for all-cause mortality using cutoffs found in the ROC analysis. Abbreviations as in Figures 4 and 5.
J A C C V O L . 6 4 , N O . 1 , 2 0 1 4 Smith et al.J U L Y 8 , 2 0 1 4 : 4 1 – 5 1 3D Speckle Tracking of the RV in PHT
47
of RV function in PHT patients relating to clinicaloutcome. All strain vectors were significantly reducedin PHT patients, with strong associations for AS andCS with RVEF, and with lesser, but still significant,correlations for RS and LS (Central Illustration). Therewere also moderate correlations for AS and LS withTAPSE.
The strong correlative findings for AS and RVEF areinteresting, given that this is a composite vectorrepresenting deformation of the endocardial surface(11) and may prove to be an important addition to theechocardiographic assessment of RV systolic func-tion. Cutoff values for impaired RVEF for AS and CSmight be valuable for risk stratifying patients andhelp with therapeutic decision making.
TABLE 6 Bland-Altman Data for Repeated Measures
Mean SD ICC p Value
LS 0.2012 2.7260 0.8022 <0.0001
CS �0.0015 3.6247 0.7546 <0.0001
RS 0.2886 12.6121 0.7208 <0.0001
ICC ¼ intraclass correlation coefficient; other abbreviations as in Table 3.
Reduced strain is also associated with adverseoutcome (12,13). Fine et al. (13) reported increasedmortality in those with decreased RV LS in a cohort of575 patients referred for echocardiographic assess-ment for PHT. Complementing this, we also foundthat nonsurvivors had significantly reduced strainvalues, not only longitudinally, but also in the trans-verse plane. Radial and circumferential strain for theRV has not previously been reported elsewhere.
Our study also defines cutoff values, which may beclinically relevant for mortality risk, where lower-magnitude strain values below the cutoffs for AS,CS, and LS in particular were associated withconsiderable increases in risk. Consequently, it maybe suggested that improved RV strain may reducemortality. This was illustrated in a cohort of patientswith pulmonary arterial hypertension, where medicaltherapy improved LS in some patients, and a 5%improvement in LS had a >7-fold reduction in mor-tality risk at 4 years (14). Anecdotal evidence fromstudies of bilateral lung transplantation (15) and post-endarterectomy patients (4) suggests physiologicalchanges in RV loading conditions in impaired RVsalso have immediate positive consequences for RVsystolic strain.

5040302010
-50-40-30-20-100
Difference LONG1-LONG2 (%)
Difference CIRC 1-CIRC2 (%)
5040302010
-50-40-30-20-100
5040302010
-50-40-30-20-10
0
Diffe
renc
e RA
D1-R
AD2
(%)
-30 -25 -20 -15 -10 -5 0
-40 -30 -20 -10 -0
0 20 40 60 80 100
Average LONG1 and LONG2 (%)
Average CIRC1 and CIRC2 (%)
Average RAD1 and RAD2 (%)
0.201
-0.001
0.289
FIGURE 7 Bland-Altman Graphs for the Intraobserver Reproducibility forLS, CS, and RS Vectors
Data from 117 patients and controls are shown. LONG1 and LONG2 indicate the
first and second LS measurements, respectively; CIRC1 and 2 indicate the CS
measurements, and RAD1 and 2, the RS measurements. Solid line ¼ mean
difference, dotted lines ¼ �1.96 SD. Abbreviations as in Figures 4 and 5.
Smith et al. J A C C V O L . 6 4 , N O . 1 , 2 0 1 4
3D Speckle Tracking of the RV in PHT J U L Y 8 , 2 0 1 4 : 4 1 – 5 1
48
RV DYSSYNCHRONY IN PHT. Our study demonstratedthat patients with PHT had more dyssynchronous RVcontraction compared with controls, with increaseddyssynchrony for worsening impairment. This is anew way of measuring dyssynchrony in the RV andconfirms previous observations in PHT patients (16).The additional appeal of this measurement is that it iscalculated from AS data already obtained, so in the
future, it could be added into existing analysispackages.
ANATOMY OF THE RV FREE WALL AND STRAIN.
Until recently, strain analysis of the RV has focusedon the longitudinal direction because of the fact thatthe RV free wall is best visualized in the apical view,whereas avoiding transverse strain directions be-cause of its thin cross section. This has been justifiedbecause of the predominant longitudinal arrange-ment of myocardial fibers (17) and the inference thatlongitudinal motion is the predominant contributorto RV systolic function.
In both patients and controls, CS had the smallestmagnitude of the 3 tangential vectors. Anatomically,this makes sense, given that the arrangement of RVmyocardial fibers does not lend itself to circumfer-ential shortening because of the lack of the middlelayer (3). Despite this, the strong association withsystolic impairment may be an important observationin the failing ventricle. It is possible that this reduc-tion in strain is due to circumferential stretch andsubsequent reduction in contractility. Because themyocardial arrangement is oblique in the superficialsubepicardium (17), this finding may signify failure ofthe outer layer to contract circumferentially.
Similarly, RV anatomy may explain the predomi-nance of radial and longitudinal deformation in bothour cohorts. The superficial, obliquely arranged sub-epicardial fibers create an inwards wave-likecontraction (radial axis), whereas the deeper, longi-tudinally arranged subendocardial fibers produce awave-like base-to-apex (longitudinal) contraction(17,18). RS also is said to be the predominant variablein systolic volume variation (19) and had the largestreduction in magnitude for all the strain vectors whenpatients were compared with controls.
RELATION WITH RV SYSTOLIC PRESSURES.
Given the multitude of influences on RV strain, it isnot surprising that the correlations for strain andRV pressures were not as strong as for those offunctional parameters. We found only moderate cor-relations for RV strain vectors and RVSP and RV end-diastolic pressure but a definite difference betweenpatients and controls. This is in line with 2D-STstudies in PHT patients, who demonstrated reducedLS and slightly stronger, but still moderate, correla-tions of LS to RVEF (5,6). As yet, there are no pub-lished data correlating to RS, CS, or AS for the RV.
COMPARISON WITH PREVIOUS 2D STUDIES.
There are no large-scale studies or indexing to sono-micrometry for the categorization of normal RV strainvalues. Instead, normal LS by 2D-ST is derived from ameta-analysis of healthy controls from a series of 5
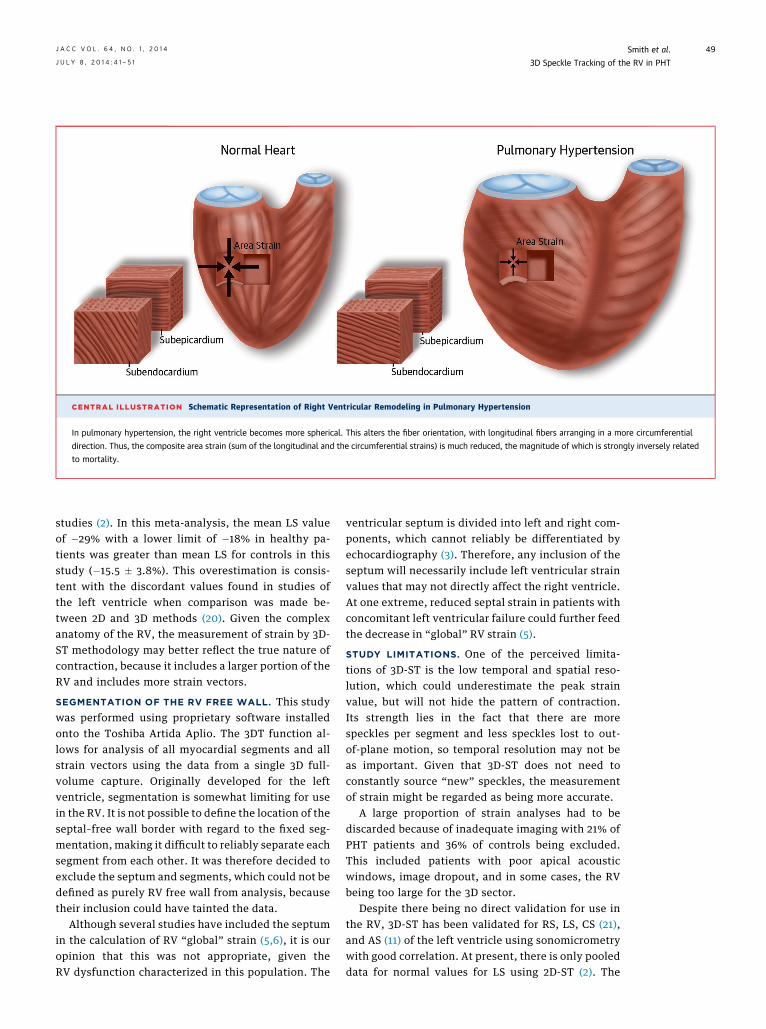
CENTRAL ILLUSTRATION Schematic Representation of Right Ventricular Remodeling in Pulmonary Hypertension
In pulmonary hypertension, the right ventricle becomes more spherical. This alters the fiber orientation, with longitudinal fibers arranging in a more circumferential
direction. Thus, the composite area strain (sum of the longitudinal and the circumferential strains) is much reduced, the magnitude of which is strongly inversely related
to mortality.
J A C C V O L . 6 4 , N O . 1 , 2 0 1 4 Smith et al.J U L Y 8 , 2 0 1 4 : 4 1 – 5 1 3D Speckle Tracking of the RV in PHT
49
studies (2). In this meta-analysis, the mean LS valueof �29% with a lower limit of �18% in healthy pa-tients was greater than mean LS for controls in thisstudy (�15.5 � 3.8%). This overestimation is consis-tent with the discordant values found in studies ofthe left ventricle when comparison was made be-tween 2D and 3D methods (20). Given the complexanatomy of the RV, the measurement of strain by 3D-ST methodology may better reflect the true nature ofcontraction, because it includes a larger portion of theRV and includes more strain vectors.
SEGMENTATION OF THE RV FREE WALL. This studywas performed using proprietary software installedonto the Toshiba Artida Aplio. The 3DT function al-lows for analysis of all myocardial segments and allstrain vectors using the data from a single 3D full-volume capture. Originally developed for the leftventricle, segmentation is somewhat limiting for usein the RV. It is not possible to define the location of theseptal–free wall border with regard to the fixed seg-mentation, making it difficult to reliably separate eachsegment from each other. It was therefore decided toexclude the septum and segments, which could not bedefined as purely RV free wall from analysis, becausetheir inclusion could have tainted the data.
Although several studies have included the septumin the calculation of RV “global” strain (5,6), it is ouropinion that this was not appropriate, given theRV dysfunction characterized in this population. The
ventricular septum is divided into left and right com-ponents, which cannot reliably be differentiated byechocardiography (3). Therefore, any inclusion of theseptum will necessarily include left ventricular strainvalues that may not directly affect the right ventricle.At one extreme, reduced septal strain in patients withconcomitant left ventricular failure could further feedthe decrease in “global” RV strain (5).
STUDY LIMITATIONS. One of the perceived limita-tions of 3D-ST is the low temporal and spatial reso-lution, which could underestimate the peak strainvalue, but will not hide the pattern of contraction.Its strength lies in the fact that there are morespeckles per segment and less speckles lost to out-of-plane motion, so temporal resolution may not beas important. Given that 3D-ST does not need toconstantly source “new” speckles, the measurementof strain might be regarded as being more accurate.
A large proportion of strain analyses had to bediscarded because of inadequate imaging with 21% ofPHT patients and 36% of controls being excluded.This included patients with poor apical acousticwindows, image dropout, and in some cases, the RVbeing too large for the 3D sector.
Despite there being no direct validation for use inthe RV, 3D-ST has been validated for RS, LS, CS (21),and AS (11) of the left ventricle using sonomicrometrywith good correlation. At present, there is only pooleddata for normal values for LS using 2D-ST (2). The
PERSPECTIVES
COMPETENCY IN PATIENT CARE: Patients with
pulmonary hypertension are at risk of developing right
heart failure, and more accurate methods for assess-
ment of RV function could improve clinical outcomes.
COMPETENCY IN MEDICAL KNOWLEDGE:
Evaluation of RV function by echocardiography and
cardiac magnetic resonance imaging is challenging
because the RV walls are thin and the chamber is cres-
cent shaped. Three-dimensional speckle tracking
echocardiography addresses some of the limitations of
these techniques.
TRANSLATIONAL OUTLOOK 1: Speckle tracking
data may help risk stratify patients with pulmonary
hypertension and guide clinical management. Future
studies may permit earlier detection of RV
dysfunction.
TRANSLATIONAL OUTLOOK 2: Proprietary
speckle tracking software has been designed for
evaluation of the left ventricle. Development of
software specifically for assessment of the RV could
improve the diagnostic value of this modality.
Smith et al. J A C C V O L . 6 4 , N O . 1 , 2 0 1 4
3D Speckle Tracking of the RV in PHT J U L Y 8 , 2 0 1 4 : 4 1 – 5 1
50
future use of 3D-ST would benefit from validationusing sonomicrometry as has been done for the leftventricle (21), but this is an invasive measurementthat is not appropriate for use in humans. Moreappropriate might be 3D magnetic resonance imagingtagging for future validation studies.
CONCLUSIONS
This is the first study to our knowledge using 3D-STto characterize RV systolic function in a cohort ofpatients specifically with PHT. The PHT patientpopulation had reduced RV strain and more dyssyn-chronous ventricles than controls. Within the PHTpatient group, those with more abnormal strain valueshad poorer outcomes. Reduced AS, LS, and CS wereassociated with increased mortality risk. The newmeasurement of AS had strong associations withRVEF, whereas only AS and, to a lesser degree, agewere predictors of death, suggesting the superiorityof 3D–derived AS over other variables. Thus, AS maybe an important additional measurement in theassessment of RV systolic function in predictingoutcomes.
ACKNOWLEDGMENT S In addition to the PHTpatients and controls who volunteered for this study,the authors acknowledge the support of the staffin the Hammersmith Hospital EchocardiographyDepartment (London, United Kingdom), with partic-ular thanks to Taryn Coulter, Alejandro Rendon-Sanchez, and Wing-See Cheung, who assisted withpatient recruitment and imaging. The authors alsowould like to thank Willem Gorissen of ToshibaMedical Systems (Zoetermeer, the Netherlands) forproviding technical information.
REPRINT REQUESTS AND CORRESPONDENCE:
Prof. Petros Nihoyannopoulos, Department of Cardi-ology, Hammersmith Hospital, Du Cane Road, Lon-don W12 0HS, United Kingdom. E-mail: [email protected].
RE F E RENCE S
1. Chin KM, Kim NHS, Rubin LJ. The right ventriclein pulmonary hypertension. Coron Artery Dis2005;16:13–8.
2. Rudski LG, Lai WW, Afilalo J, et al. Guidelinesfor the echocardiographic assessment of theright heart in adults: a report from the AmericanSociety of Echocardiography endorsed by theEuropean Association of Echocardiography, aregistered branch of the European Society ofCardiology, and the Canadian Society of Echo-cardiography. J Am Soc Echocardiogr 2010;23:685–713.
3. Sheehan F, Redington A. The right ventricle:anatomy, physiology and clinical imaging. Heart2008;94:1510–5.
4. Dambrauskaite V, Delcroix M, Claus P, et al.Regional right ventricular dysfunction in chronicpulmonary hypertension. J Am Soc Echocardiogr2007;20:1172–80.
5. Meris A, Faletra F, Conca C, et al. Timing andmagnitude of regional right ventricular function: aspeckle tracking-derived strain study of normalsubjects and patients with right ventricular dy-sfunction. J Am Soc Echocardiogr 2010;23:823–31.
6. Pirat B, McCulloch ML, Zoghbi WA. Evaluationof global and regional right ventricular systolicfunction in patients with pulmonary hypertensionusing a novel speckle tracking method. Am JCardiol 2006;98:699–704.
7. Simonneau G, Robbins IM, Beghetti M, et al.Updated clinical classification of pulmonary hyper-tension. J Am Coll Cardiol 2009;54 Suppl:S43–54.
8. Galie N, Hoeper M, Humbert M, et al. Guidelinesfor the diagnosis and treatment of pulmonary hy-pertension. Eur Heart J 2009;30:2493–537.
9. Thebault C, Donal E, Bernard A, et al. Real-timethree-dimensional speckle tracking echocardiog-raphy: a novel technique to quantify global left
ventricular mechanical dyssynchrony. Eur J Echo-cardiogr 2011;12:26–32.
10. Smith B, Grapsa J, Dawson D, et al. Threedimensional speckle tracking of the right ventricle:a method for quantifying global right ventricularsystolic dysfunction in patients with pulmonaryhypertension (abstr). Eur J Echocardiogr 2011;12Suppl 2:ii71.
11. Seo Y, Ishizu T, Enomoto Y, et al. Endocardialsurface area tracking for assessment of regionalLV wall deformation with 3D speckle trackingimaging. J Am Coll Cardiol Img 2011;4:358–65.
12. Haeck ML, Scherptong RW, Ajmone Marsan N,et al. Prognostic value of right ventricular longi-tudinal peak systolic strain in patients with pul-monary hypertension. Circ Cardiovasc Imaging2012;5:628–36.
13. Fine NM, Chen L, Bastiansen PM, et al.Outcome prediction by quantitative right

J A C C V O L . 6 4 , N O . 1 , 2 0 1 4 Smith et al.J U L Y 8 , 2 0 1 4 : 4 1 – 5 1 3D Speckle Tracking of the RV in PHT
51
ventricular function assessment in 575 subjectsevaluated for pulmonary hypertension. Circ Car-diovasc Imaging 2013;6:711–21.
14. Hardegree EL, Sachdev A, Villarraga HR, et al.Role of serial quantitative assessment of rightventricular function by strain in pulmonary arterialhypertension. Am J Cardiol 2013;111:143–8.
15. Dambrauskaite V, Herbots L, Claus P, et al.Differential changes in regional right ventricularfunction before and after a bilateral lungtransplantation: an ultrasonic strain and strainrate study. J Am Soc Echocardiogr 2003;16:432–6.
16. Kalogeropoulos AP, Georgiopoulou VV,Howell S, et al. Evaluation of right intraventricular
dyssynchrony by two-dimensional strain echocar-diography in patients with pulmonary arterialhypertension. J Am Soc Echocardiogr 2008;21:1028–34.
17. Ho SY, Nihoyannopoulos P. Anatomy, echo-cardiography, and normal right ventricular di-mensions. Heart 2006;92 Suppl 1:i2–13.
18. Meier GD, Bove AA, Santamore WP, et al.Contractile function in canine right ventricle. Am JPhysiol 1980;239:H794–804.
19. Carlsson M, Ugander M, Heiberg E, et al. Thequantitative relationship between longitudinal andradial function in left, right, and total heartpumping in humans. Am J Physiol Heart CircPhysiol 2007;293:H636–44.
20. Saito K, Okura H, Watanabe N, et al.Comprehensive evaluation of left ventricular strainusing speckle tracking echocardiography in normaladults: comparison of three-dimensional and two-dimensional approaches. J Am Soc Echocardiogr2009;22:1025–30.
21. Seo Y, Ishizu T, Enomoto Y, et al. Validation of3-dimensional speckle tracking imaging to quan-tify regional myocardial deformation. Circ Car-diovasc Imaging 2009;2:451–9.
KEY WORDS 3-dimensional imaging,echocardiography, pulmonary hypertension,right ventricle, speckle tracking
Top Related