


Languages
Pages
Legal


Threats to Water Quality from Mountain Valley Pipeline and Atlantic Coast Pipeline Water Crossings in Virginia
Evan Hansen Jason Clingerman Meghan Betcher
Downstream Strategies
911 Greenbag Road Morgantown, WV 26508
www.downstreamstrategies.com
February 21, 2018

ii | P a g e
TABLE OF CONTENTS
1. OVERVIEW ..................................................................................................................................................... 1
2. EROSION AND SEDIMENTATION THREATS ..................................................................................................... 4
2.1 ACP CASE STUDY: BACK CREEK, AUGUSTA COUNTY .................................................................................................. 6 2.2 MVP CASE STUDY: LITTLE CREEK AND TOWN OF ROCKY MOUNT, FRANKLIN COUNTY ..................................................... 9
3. DRINKING WATER SUPPLY THREATS ............................................................................................................ 11
3.1 ACP CASE STUDY: CITY OF NORFOLK, SUFFOLK AND ISLE OF WRIGHT COUNTIES ........................................................... 13 3.2 MVP CASE STUDY: CITY OF ROANOKE, ROANOKE AND MONTGOMERY COUNTIES ......................................................... 15
4. TROUT WATER THREATS .............................................................................................................................. 16
4.1 TROUT UNLIMITED ANALYSIS .............................................................................................................................. 16 4.2 ACP CASE STUDY: CALFPASTURE RIVER, AUGUSTA COUNTY ..................................................................................... 17 4.3 MVP CASE STUDY: LITTLE STONY CREEK, GILES COUNTY ......................................................................................... 17
5. ENVIRONMENTAL JUSTICE THREATS ............................................................................................................ 19
5.1 ACP CASE STUDY: CITY OF EMPORIA, GREENSVILLE AND BRUNSWICK COUNTIES ........................................................... 19 5.2 ACP CASE STUDY: CITY OF FRANKLIN, SOUTHAMPTON COUNTY ................................................................................ 20
6. CHESAPEAKE BAY THREATS .......................................................................................................................... 22
7. WETLAND THREATS ..................................................................................................................................... 24
7.1 ACP CASE STUDY: GREAT DISMAL SWAMP, SUFFOLK AND CHESAPEAKE COUNTIES........................................................ 24
8. SUMMARY AND CONCLUSIONS ................................................................................................................... 26
8.1 GENERAL THREATS ........................................................................................................................................... 26 8.2 EROSION AND SEDIMENTATION THREATS............................................................................................................... 26 8.3 DRINKING WATER SUPPLY THREATS ...................................................................................................................... 26 8.4 TROUT WATER THREATS .................................................................................................................................... 26 8.5 ENVIRONMENTAL JUSTICE THREATS ...................................................................................................................... 27 8.6 CHESAPEAKE BAY THREATS ................................................................................................................................ 27 8.7 WETLAND THREATS .......................................................................................................................................... 27
REFERENCES ......................................................................................................................................................... 28

iii | P a g e
TABLE OF FIGURES
Figure 1: The Atlantic Coast and Mountain Valley pipelines ................................................................................ 2 Figure 2: ACP crossings and stream impairments in the vicinity of Back Creek of South Fork River.................... 8 Figure 3: MVP crossings and sediment-related stream impairments near Little Creek and Teels Creek ........... 10 Figure 4: Source water assessment areas crossed by the ACP and MVP ........................................................... 12 Figure 5: ACP crossings and City of Norfolk's source water assessment areas crossed by the ACP ................... 14 Figure 6: The Western Virginia Water Authority’s source water assessment area crossed by the MVP ........... 15 Figure 7: Trout crossing analysis data for Upper Calfpasture River watershed .................................................. 17 Figure 8: Little Stony Creek and nearby streams ................................................................................................ 18 Figure 9: ACP crossings and minority populations near City of Emporia, Virginia ............................................. 20 Figure 10: ACP crossings and minority populations near the City of Franklin, Virginia ...................................... 21 Figure 11: Proposed ACP construction corridor across the Chesapeake Bay watershed ................................... 23 Figure 12: ACP crossings and the Great Dismal Swamp ..................................................................................... 25
TABLE OF TABLES
Table 1: ACP stream crossings in City of Norfolk source water assessment areas ............................................. 13
ABBREVIATIONS
ACP Atlantic Coast Pipeline FEIS Final Environmental Impact Statement FERC Federal Energy Regulatory Commission HDD horizontal directional drilling HUC hydrologic unit code MVP Mountain Valley Pipeline TMDL total maximum daily load TU Trout Unlimited USFWS U.S. Fish and Wildlife Service VCTU Virginia Council Trout Unlimited VDCR Virginia Department of Conservation & Recreation VDEQ Virginia Department of Environmental Quality VDGIF Virginia Department of Game and Inland Fisheries VDOH Virginia Department of Health
Photo credits: Pipeline construction photo on page 1: April Keating. All other pipeline construction photos: Rick Webb. Trout photo: Jason Clingerman. Drinking water treatment plant photo: Kendra Hatcher. Recreation photo: Evan Hansen.
This report was produced on behalf of the Natural Resources Defense Council. The information and results contained herein were produced solely by the authors.

1 | P a g e
1. OVERVIEW
This report assesses threats and likely impacts to waterbodies in Virginia during the construction and operation of the Atlantic Coast Pipeline (ACP) and Mountain Valley Pipeline (MVP), two large natural gas pipelines that, as proposed, would cross rivers and streams over 1,000 times in Virginia.
Specifically, this report focuses on erosion and sedimentation threats, as well as threats to drinking water supplies for cities like Norfolk and Roanoke, trout streams, minority communities like Emporia and Franklin, the Chesapeake Bay, and wetlands like the Great Dismal Swamp.
The ACP would run between Harrison County, West Virginia and Robeson County, North Carolina, a length of approximately 600 miles, while the MVP would run between Wetzel County, West Virginia and Pittsylvania County, Virginia—a length of approximately 300 miles.
Both pipelines in Virginia would be 42 inches in diameter. As illustrated in Figure 1, the ACP would cross three states: West Virginia, Virginia, and North Carolina, and the MVP would cross only West Virginia and Virginia (ACP, 2017a; MVP, 2017).
To construct and bury these sections, operators would timber and clear a 125 foot–wide right-of-way, although construction through water crossings and wetlands would be limited to a 75-foot width (ACP, 2017a; VDEQ, 2017). The permanent easement width would be 75 feet for the ACP (ACP, 2017b) and 50 feet for the MVP (MVP, 2017).
At the Virginia/North Carolina border, the primary line of the ACP would go south, but a lateral line would be built eastward toward Norfolk. The lateral pipeline would be a 20-inch diameter pipe, and its construction right-of-way would be 75 feet wide (ACP, 2017a; VDEQ, 2017).

2 | P a g e
Figure 1: The Atlantic Coast and Mountain Valley pipelines

3 | P a g e
As described in the following sections, threats and likely impacts to waterways in Virginia by the proposed pipelines would be numerous and varied:
• Erosion and sedimentation: Sedimentation of streams would increase because of pipeline construction, even well after construction is complete. While some amount of sedimentation occurs naturally, excess sediment in streams is considered a pollutant, which can impact fish and other aquatic life. In Virginia, impacts would occur in streams that are both pristine and those already impaired by sedimentation.
• Drinking water: Six drinking water assessment areas would be crossed by the two pipelines in Virginia, including over 75 water crossings, some less than one mile from water supply reservoirs and as close as 1.1 miles from water supply intakes.
• Trout waters: Numerous wild, native, and stocked trout streams would be directly impacted by the pipelines, including 73 water crossings deemed highest-concern by Trout Unlimited (TU).
• Environmental justice: The proposed paths of the pipelines cross through or near several disadvantaged communities and could threaten water quality, including drinking water, in these communities.
• The Chesapeake Bay: The ACP’s proposed 864 water crossings in the Chesapeake Bay watershed would make attaining mandated sediment load reductions in the Chesapeake Bay Watershed Agreement more difficult.
• Wetlands: Over 315 acres of Virginia wetlands would be impacted by construction of the two pipelines, including the permanent conversion of over 75 acres of forested wetlands to less desirable wetlands.
Due to these varied impacts, a more detailed analysis of threats should be performed before final permits are issued.

4 | P a g e
2. EROSION AND SEDIMENTATION THREATS
Some of the most significant and visible impacts caused by pipelines are erosion and sedimentation. This section outlines the potential scale of sedimentation impacts and assesses specific waterbody impacts that can be reasonably expected to occur.
While some amount of sedimentation occurs naturally, excess sediment in streams, which is considered a pollutant, will be caused by pipeline construction activities and by erosion of exposed soils after active construction has ended. Construction activities (including pipeline and road construction) necessary for the ACP and MVP would cause erosion and sedimentation, even when best management practices are used. These activities include stream crossings, wetland crossings, and upland pipeline and access road construction. In some cases, pipeline and access road crossings would pollute pristine waters. In others it would exacerbate already-existing impairments tied to sediment.
Increased sedimentation and turbidity—often visible to the naked eye as “muddy” water—have real impacts on aquatic life. According to the Federal Energy Regulatory Commission’s (FERC’s) Final Environmental Impact Statement (FEIS) for the MVP:
“Increased sedimentation and turbidity resulting from in-stream and adjacent construction activities could displace and impact fisheries and aquatic resources. Sedimentation could smother fish eggs and other benthic biota and alter stream bottom characteristics, such as converting sand, gravel, or rock substrate to silt or mud. These habitat alterations could reduce juvenile fish survival, spawning habitat, and benthic community diversity and health. Increased turbidity could also temporarily reduce dissolved oxygen levels in the water column and reduce respiratory functions [for] in-stream biota. Turbid conditions could also reduce the ability for biota to find food sources or avoid prey...Benthic invertebrates and freshwater mussels could also be affected by elevated turbidity and suspended sediments. Although freshwater mussels in the construction zone would be relocated by qualified biologists and in accordance with both West Virginia and Virginia mussel protocols, downstream sessile species could be affected. Aquatic invertebrates, including insect larvae, would generally be unable to avoid work areas.” (FERC, 2017a, p. 4-216-217)
Both pipelines would use some type of open-trench method to cross most streams and wetlands. Regardless of the exact open-trench method utilized, or the care taken during construction, disturbance of the streambank and streambed would cause a marked increase in sedimentation and turbidity.
These impacts can be long-term and lasting. Initially, there are impacts when disturbance begins and when flow is reestablished over the construction area. In the medium-term, moderate (perhaps intermittent) increases in sedimentation and turbidity would continue from the streambed and streambank until revegetation occurs in the area immediately adjacent to the construction site. In the long-term, the sediment contribution from upland pipeline corridors could still result in measurable increases in sedimentation and turbidity, dependent upon soil type, slope, and success of revegetation in the upland corridor. Peer-reviewed journal articles have documented short-, medium-, and long-term impacts to benthic macroinvertebrates and fish; one article documented effects that lasted over four years (Lévesque and Dubé, 2007, citing Armitage and Gunn, 1996).
Clingerman and Hansen (2017) estimated the sedimentation impact expected from ACP crossings in mountainous watersheds in Virginia and West Virginia that were expected to have a high risk of sedimentation from pipeline construction. The crossings include Falls Run of Dutch Creek in the James River watershed in Nelson County, Virginia, and Turkeypen Creek of Kincheloe Creek in Harrison and Lewis counties, West Virginia. For each scenario assessed—pre-construction, during-construction, and post-construction—sedimentation loads were estimated. During-construction sedimentation was estimated to

5 | P a g e
increase by 9,051 percent in Virginia and 805 percent in West Virginia. Post-construction sedimentation was estimated to increase by 319 percent and 31 percent, respectively.
Clingerman and Hansen (2016) also estimated the sedimentation impact expected from the MVP. This analysis focused on two West Virginia watersheds: one expected to have a lower risk (Turtletree Fork of Tenmile Creek of West Fork River in Harrison County) and one expected to have a higher risk (an unnamed tributary to Laurel Creek of the Little Kanawha River in Braxton County) of sedimentation from pipeline construction. For each scenario—pre-construction, during-construction, and post-construction—sedimentation loads were estimated. During-construction sedimentation was estimated to increase by 42 percent and 1,536 percent, respectively. Post construction sedimentation was estimated to increase by 0 percent and 15 percent, respectively. Virginia watersheds would face similar threats from the MVP.
MVP’s FEIS includes a hydrologic analysis of sedimentation of pipeline construction in parts of Virginia and West Virginia (Environmental Solutions & Innovations, 2017). This analysis confirms that pipeline construction causes erosion and sedimentation:
• “…catchments within these subwatersheds are expected to experience increases in sediment yield over baseline conditions during construction, restoration, and operation with the highest expected increases occurring during the construction timeframe for most waterbodies.” (Environmental Solutions & Innovations, 2017, p. 24)
• “Sediment loss from the proposed action will likely be transported into downstream waterbodies; however, predicted total sediment loads demonstrate that these impacts will largely be confined to tributary systems and not larger order rivers…” (Environmental Solutions & Innovations, 2017, p. 24)
• “For most waterbodies studied in this analysis, expected impacts to streams are greatest during the active construction phase of the Project.” (Environmental Solutions & Innovations, 2017, p. 25)
• “Based on this analysis, it is expected that sediment loads and yields will reach a new sediment equilibrium approximately four to five years from the start of the Project…For several streams within the New River drainage, sediment loads in excess of 10 percent over baseline are expected to represent a new sediment equilibrium. (Environmental Solutions & Innovations, 2017, p. 25)

6 | P a g e
FERC’s FEIS for the ACP summarizes similar findings related to increased sedimentation in certain watersheds:
“The [U.S. Forest Service] requested that Atlantic prepare a Soil Erosion and Sedimentation Model Report assessing the extent of sedimentation that could occur within priority subwatersheds within the [Monongahela National Forest] and [George Washington National Forest] during construction. Generally, the model results indicate a substantial increase in soil loss relative to baseline rates for the first year of construction. Soil rates are predicted to be higher where there are steeper slopes and higher soil erodibility values. The model results indicate a decline in soil erosion with time as the construction workspace is restored and becomes revegetated. Although according to the model, the predicted soil erosion rates returned to baseline by the third year, some of the model results were skewed to present a best case scenario, and likely underestimate short-term and long-term sediment loads.” (FERC, 2017b, p. 4-231)
As the above studies confirm, sediment pollution would occur during both the construction and operation phases of the ACP and MVP, at varying levels depending on the watershed. The next section more closely examines the sedimentation threats to certain priority and impaired waterbodies across Virginia.
2.1 ACP case study: Back Creek, Augusta County
Back Creek falls within a 42-square mile Hydrologic Unit Code (HUC)-12watershed,1 which is within the South Fork Shenandoah River HUC-8 watershed. About 4 percent of the pipeline corridor in this watershed would cross very steep slopes, and 62 percent of the corridor would cross highly erodible soils. These conditions, as discussed above, increase susceptibility to higher sedimentation levels.
Additionally, trout are present in this watershed. Wild trout are found in Orebank Creek, while Back Creek and Mills Creek receive stocked trout. TU evaluated the potential impact of the proposed ACP on brook trout resources in Virginia and West Virginia and classified 19 crossings in this watershed as being of highest concern for brook trout impacts (See Section 4.1 for more details). Figure 2 identifies already-existing impairments in the vicinity of Back Creek of South Fork River.
1 The National Hydrography Dataset classifies the nation’s waters into a hierarchical classification system. HUCs are used to define each distinct watershed. HUC-12 watersheds are commonly referred to as subwatersheds that capture local tributary systems of larger HUC-8 watersheds.

7 | P a g e
In addition to the already-impaired conditions in this watershed, the cumulative impacts here could be significant. ACP reports 38 stream crossings by the pipeline in this one watershed. Access roads associated with the ACP would require three stream crossings and one pond crossing. (ACP, 2017c, Table B-1)
The pipeline and access roads would cross the headwaters of Back Creek, including Back Creek, Mills Creek, and Orebank Creek—all of which are already impaired—over 40 times. The disturbance of the streambank and streambed would cause a marked increase in sedimentation and turbidity. These tributary crossings are all within one mile of each other, and these three creeks join together approximately 1.5 miles downstream from the three most-downstream crossing locations. Because these crossings are so close together and have short flow paths to the same point, the cumulative impacts of these crossings would directly impact the already-impaired Back Creek.
Adding to the cumulative instream impacts would be the sediment generated from upslope activities, where the pipeline right-of-way would be cleared and where access roads would be built. Approximately 8.1 miles of pipeline and 1.2 miles of access roads are planned for this small watershed, which would result in approximately 127 acres of total impacts.
The Virginia Department of Environmental Quality (VDEQ) maintains a list of impaired streams across the state that is updated every two years; this list includes Back Creek, Mills Creek, and Orebank Creek (VDEQ et al., 2016 and 2017). Under the Clean Water Act, clean-up plans called total maximum daily loads (TMDLs) are established for impaired streams.
A TMDL has not yet been established for Back Creek’s biological impairment. However, Back Creek flows into South River, and a TMDL for South River’s bacteria and biological impairments was written in 2009. According to a stressor analysis performed in this TMDL, sediment and phosphorus are the most probable stressors causing South River’s biological impairment. The TMDL then allocates sediment loads to meet the TMDL. (Engineering Concepts, 2009) While a more detailed TMDL for the Back Creek watershed, including a stressor analysis, would be needed to definitively tie sediment to Back Creek’s biological impairment, the fact that sediment was tied to South River’s biological impairment indicates that existing sediment loads may also cause the impairment in Back Creek.2
Because of the existing impairments and potential sediment-related pollutant reductions that may be required to return Back Creek to health, additional sediment inputs caused by the ACP would make it less likely that the TMDL would be achieved, which would leave Back Creek in violation of state water quality standards.
As such, impacts by pipeline construction to all impaired waters must be fully assessed.
2 While Mills Creek is also biologically impaired, the source of this impairment is acidity from atmospheric deposition, and Orebank Creek is impaired for pH (VDEQ et al., 2016 and 2017). Therefore, the TMDL discussion focuses on Back Creek.

8 | P a g e
Figure 2: ACP crossings and stream impairments in the vicinity of Back Creek of South Fork River
Sources: Impairments from VDEQ et al. (2016 and 2017). Note: The crossings displayed are those described by ACP (2017c); many of these do not align with the stream segments displayed as they would cross small tributaries that are not mapped.

9 | P a g e
2.2 MVP case study: Little Creek and Town of Rocky Mount, Franklin County
Little Creek falls within a 58-square mile HUC-12 watershed within the Upper Roanoke HUC-8 watershed. The Little Creek watershed makes up only a portion of the referenced HUC-12 watershed, but within this small watershed, the MVP would require 39 total stream crossings. This includes 34 crossings by the pipeline, four crossings by access roads, and one crossing by additional temporary workspace (FERC 2017a, Appendix F). The streams that would be crossed all eventually run into the Blackwater River, the source of the Town of Rocky Mount’s drinking water. Nearly all the crossings in this watershed are within the Town of Rocky Mount’s Source Water Assessment Area. Additionally, 11 wetlands would also be crossed by the pipeline in this watershed (FERC 2017a, Appendix G).
VDEQ has already listed Little Creek and Teels Creek, a tributary to Little Creek, as impaired streams (VDEQ et al., 2016 and 2017). These creeks are biologically impaired, meaning that fewer, less diverse benthic macroinvertebrates were found. These impairments, colored purple in Figure 3, are caused by already-existing excess sediment, among other sources (VDEQ et al., 2016 and 2017).
Given the existing sediment-caused impairment, these streams and the Town of Rocky Mount’s Source Water Assessment Area are highly vulnerable to additional sedimentation produced by construction of the MVP. The upland construction corridor, access road construction, streambank disturbance, and instream crossings would contribute additional sediment to the receiving streams. Because these crossings are so close together and all flow to the same point, the cumulative impacts of these crossings would directly impact Little Creek and potentially the Blackwater River.
Because of the existing impairments and potential sediment-related pollutant reductions that may be required to return Little and Teels Creeks to health, additional sediment inputs caused by the MVP would make it less likely that the TMDLs would be achieved, risking continued noncompliance with state water quality standards.

10 | P a g e
Figure 3: MVP crossings and sediment-related stream impairments near Little Creek and Teels Creek

11 | P a g e
3. DRINKING WATER SUPPLY THREATS
This section outlines specific potential impacts from the ACP and MVP to drinking water sources in Virginia.
Drinking water providers rely on clean source water in rivers and streams to produce clean drinking water at the tap. The ACP and MVP would cause additional sedimentation and turbidity in waterbodies that are sources of drinking water, which complicates drinking water treatment. In addition, should a spill of fuel or other pollutants occur upstream from an intake, the pollutant may flow downstream quickly. For example, a diesel fuel spill occurred at an equipment staging area for a contractor that was grading and seeding the right-of-way for a natural gas pipeline in Virginia. This spill contaminated the drinking water for a community in nearby Monroe County, West Virginia (Adams, 2015).
Risks to drinking water safety such as these are not adequately addressed by FERC’s FEIS for MVP, where no “Source Water Protection Areas for Public Surface Water Supplies” were identified within 0.25 mile of the route (FERC, 2017a). The 0.25-mile distance from drinking water intakes utilized in FERC’s analysis to determine risks to sources of drinking water is dangerously small and should not be relied upon to protect drinking water sources. Pollution from much farther than 0.25 miles can still impact a drinking water intake. For example, a spill from a facility approximately one mile upstream from Charleston, West Virginia’s drinking water intake contaminated water for 300,000 residents in 2014 (Watkins and Ellis, 2014).
Both the ACP and MVP cross waterways upstream and in close proximity to public drinking water intakes. (Figure 4). The MVP would cross two source water assessment areas: (1) Western Virginia Water Authority-Spring Hollow and (2) Town of Rocky Mount-Blackwater River. The ACP would cross the source water assessment areas for four intakes: (1) City of Staunton-Middle River, (2) City of Norfolk-Western Branch Reservoir, (3) City of Norfolk-Lake Prince, and (4) City of Emporia-Meherrin River.
The Virginia Department of Health (VDOH) designates an assessment area for each drinking water source in order to promote source water protection. Although they are not regulatory boundaries, source water assessment areas include the area from which pollution can reach intakes quickly. Thus, additional scrutiny of potential contaminant sources should be undertaken in these areas to protect drinking water. More than 75 water and wetland crossings are located within the six source water protection areas crossed by the ACP and MVP (VDOH, 2018). For example, the Roanoke River would be crossed by the proposed MVP route only 1.1 miles upstream from the likely intake location for Western Virginia Water Authority.3
The next section identifies two specific areas that illustrate the potential for pipeline-related pollution impacts to Virginia drinking water resources. All threatened drinking water areas should be fully assessed.
3 This and other distances in this report are measured to the likely intake locations based on the shapes of the source water assessment areas. Precise intake locations are not public information.

12 | P a g e
Figure 4: Source water assessment areas crossed by the ACP and MVP

13 | P a g e
3.1 ACP case study: City of Norfolk, Suffolk and Isle of Wright counties
The ACP would cross two of Norfolk’s eight source water assessment areas.
The City of Norfolk Department of Utilities serves one million customers in Norfolk, Virginia Beach, and Chesapeake, Virginia. The City of Norfolk gets its raw water from eight reservoirs, two rivers, and four deep wells (City of Norfolk, 2017).
The ACP would cross the source water assessment areas for two of Norfolk’s eight water supply reservoirs: Lake Prince and Western Reservoir. These two reservoirs are successive impoundments of the Western Branch of the Nansemond River. A total of 11 crossings would occur less than a mile from these drinking water sources (Table 1).
Each of these reservoirs would be crossed using horizontal directional drilling (HDD). While HDD is typically accepted as having less environmental impact than open-trench methods, there are still concerns that can arise from HDD, especially from surface spills related to HDD activities. Even though surface water resources are typically less vulnerable using this method, groundwater resources may be impacted by HDD. Three of the City of Norfolk’s deep wells used for source water are within approximately two miles from at least one of the HDD crossings proposed for these reservoirs (City of Norfolk, 2017; ACP 2017b).
Given these close proximities to more than one-third of Norfolk’s drinking water sources, additional risk assessments of the ACP are essential.
Table 1: ACP stream crossings in City of Norfolk source water assessment areas
Stream name
Approximate stream distance
to intake (miles)
Approximate stream distance
to reservoir (miles) Project ID
City of Norfolk-Western Branch UNT to Western Branch Reservoir 0.8 0.05 VA AP-3 0197 UNT to Western Branch Reservoir 0.8 0.05 VA AP-3 0197 UNT to Western Branch Reservoir 1.4 0.2 VA AP-3 0196 UNT to Western Branch Reservoir 2.7 0.2 VA AP-3 0191 UNT to Western Branch Reservoir 2.7 0.2 VA AP-3 0192 UNT to Western Branch Reservoir 2.8 0.1 VA AP-3 0193 UNT to Western Branch Reservoir 2.8 0.1 VA AP-3 0194 City of Norfolk-Lake Prince UNT to Lake Prince 1.2 0.2 VA AP-3 0189 UNT to Lake Prince 2.7 0.6 VA AP-3 0187 UNT to Lake Prince 2.7 0.6 VA AP-3 0188 UNT to Lake Prince 2.7 0.6 VA AP-3 0188
Source: Stream names and project IDs from ACP (2017c), Appendix B-1. Approximate stream distances were estimated using ArcMap. Note: Both the Western Branch Reservoir and the Lake Prince Reservoir would be crossed by the pipeline, but no crossing information is included in Appendix B-1 because HDD would be used.

14 | P a g e
Figure 5: ACP crossings and City of Norfolk's source water assessment areas crossed by the ACP
Source: City of Norfolk source water wells from City of Norfolk (2015); locations are approximate.
15 | P a g e
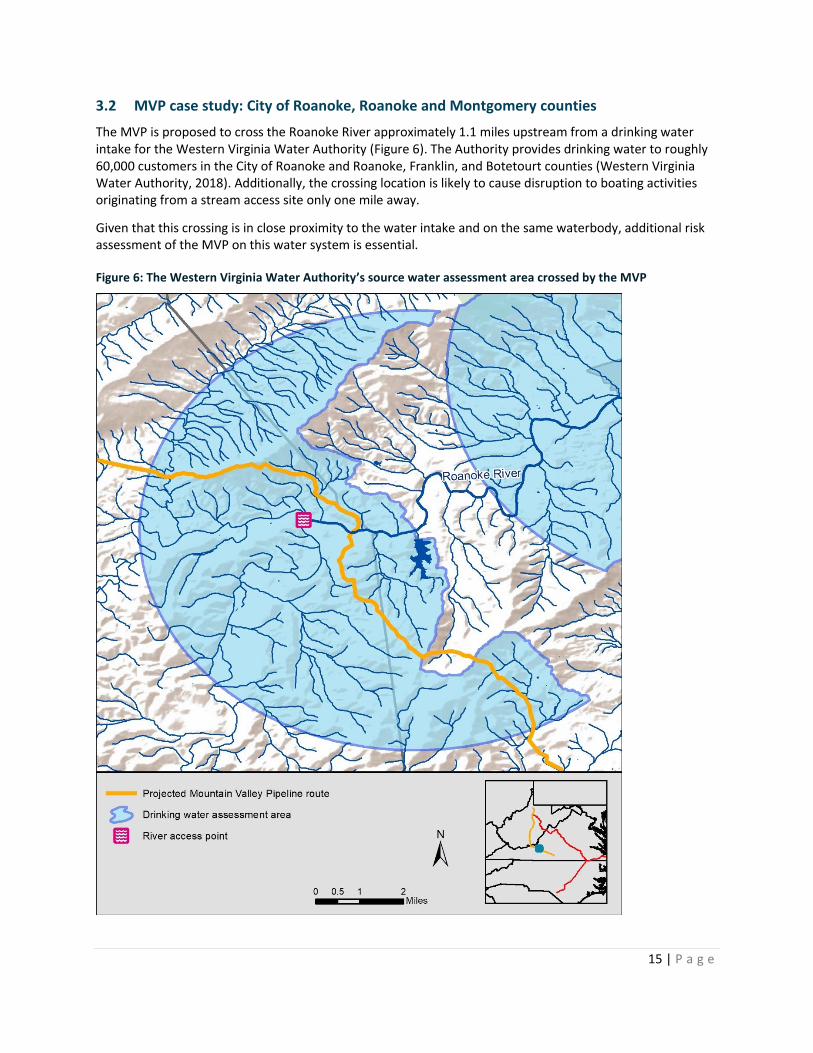
3.2 MVP case study: City of Roanoke, Roanoke and Montgomery counties
The MVP is proposed to cross the Roanoke River approximately 1.1 miles upstream from a drinking water intake for the Western Virginia Water Authority (Figure 6). The Authority provides drinking water to roughly 60,000 customers in the City of Roanoke and Roanoke, Franklin, and Botetourt counties (Western Virginia Water Authority, 2018). Additionally, the crossing location is likely to cause disruption to boating activities originating from a stream access site only one mile away.
Given that this crossing is in close proximity to the water intake and on the same waterbody, additional risk assessment of the MVP on this water system is essential.
Figure 6: The Western Virginia Water Authority’s source water assessment area crossed by the MVP

16 | P a g e
4. TROUT WATER THREATS
Highly-valued trout streams would be impacted by both the ACP and MVP.
Both pipeline routes across Virginia would cross spawning areas for many types of fish, including important trout streams and wild trout spawning areas. In Virginia, there is one native species of trout: the brook trout. Brook trout live and reproduce in only the cleanest, cold streams. Typically, in Virginia, these streams are small, have good forest canopy, and are found in higher elevations or in association with springs.
Rainbow and brown trout have also been introduced to many streams within Virginia. In some of the best streams, even brown and rainbow trout reproduce and survive without supplemental stockings. Wild trout streams containing any of these three trout species are highly regarded among anglers and conservationists, as they represent a nearly pristine aquatic environment and are typically high-quality fisheries.
Accordingly, the Virginia Department of Game and Inland Fisheries (VDGIF) has requested strict adherence to time-of-year restrictions for pipeline construction, which are periods in which no instream work is permissible (VDGIF, 2018a). While these restrictions are important for the protection of aquatic species such as trout, they cannot ensure the complete elimination of impacts. Even when utilizing time-of-year restrictions, muddy water would still cause decreased feeding and increased stress in some fish, including trout, and sedimentation could still impact downstream fish, mussels, and benthic macroinvertebrates.
4.1 Trout Unlimited analysis
To understand the vulnerability and sensitivity of pipeline crossings on trout populations, TU performed an assessment of ACP crossings. In Virginia, the highest-concern and high-concern crossings would occur in Highland, Bath, and Augusta counties and would affect the Back Creek, Middle Jackson River, Upper Jackson River, Middle Cowpasture River, Calfpasture River, and South River watersheds. TU categorized a total of 73 crossings (including access roads and pipelines) as highest-concern crossings in Virginia. These 73 crossings occur within resilient brook trout population patches and likely represent the most viable brook trout habitat patches in the region (Fesenmyer, 2017).
As the analysis further details:
“In Highland County, just outside the boundaries of the George Washington National Forest, the pipeline would cross Jackson River and nearby perennial and intermittent tributaries seven times over the course of two miles. In Bath and Augusta counties, where the project runs through a sliver of land between parcels of land held by the Forest Service, the construction corridor would cross Mill Creek, Hamilton Branch, Calfpasture River, and their tributaries—among them Tizzle Branch, Hodges Draft, Ramseys Draft—42 times over a span of 13 miles. The impact would be much the same further east in Augusta County, where the line would cross Orebank Creek and Back Creek and their tributaries 14 times.” (TU, 2017b)

17 | P a g e
To supplement this assessment of pipeline pollution impacts to priority trout waters, the next section details waterway impacts for two examples.
4.2 ACP case study: Calfpasture River, Augusta County
As noted above, TU identified the headwater portion of the Calfpasture watershed as an area of highest concern for impacts from ACP stream crossings. In this resilient brook trout patch, TU identified 28 highest-concern crossings by the pipeline or access roads. Additionally, there are three more high-concern crossings within the Calfpasture watershed (TU, 2017a).
Given the high number of stream crossings proposed by ACP in a relatively small area considered to be one of the most viable patches of brook trout in Virginia, it is likely that pipeline construction would have a cumulative impact on brook trout populations. This watershed is currently considered to be resilient, but the impacts caused by pipeline construction could threaten that status and cause the area’s brook trout to be more susceptible to other impacts such as development, climate change, drought, or flooding. Recreational angling could also be harmed if brook trout populations are reduced as a result of ACP impacts.
Figure 7: Trout crossing analysis data for Upper Calfpasture River watershed
Source: Map exported from TU (2017a).
4.3 MVP case study: Little Stony Creek, Giles County
Little Stony Creek is a high-quality stream within the Middle New HUC-8 watershed (See Figure 8). It is classified as a “Wild Trout Stream” at a proposed MVP crossing (VDGIF, 2018b) and is in an area that is a popular destination for outdoor recreation, as indicated by the seven recreational stream access sites in the vicinity of this stream. These sites provide access not only to wild trout streams, but also to a segment of Little Stoney Creek designated as an “Exceptional State Water”—also known as a Tier III water—approximately 1.5 miles upstream from the proposed crossing (VDEQ, 2004). Additionally, TU has recently

18 | P a g e
undertaken a project to restore wild and native trout throughout the Little Stony Creek watershed (VCTU, 2015). This restocking program has been successful, and the pipeline crossing could impact and undermine the effort by local groups to restore this stream.
Trout stream areas along the proposed ACP and MVP corridors must be assessed to fully understand all impacts.
Figure 8: Little Stony Creek and nearby streams

19 | P a g e
5. ENVIRONMENTAL JUSTICE THREATS
The ACP and MVP would both be routed near communities with high percentages of minority or economically disadvantaged populations. As such, the potential for these pipelines—and specifically their water crossings—to impact low-income and minority communities is examined in the next section.
5.1 ACP case study: City of Emporia, Greensville and Brunswick counties
The City of Emporia, Virginia is located in Greensville County and has about 5,300 residents. It is made up of approximately 70 percent minorities, and the median household income is about $27,000, with 23 percent of people living in poverty (US Census, 2012; US Census 2017).
Emporia sources its raw drinking water from a 220-acre reservoir that is supplied by the Meherrin River (City of Emporia, 2015). In a 2001 source water assessment, VDOH found this reservoir to be highly susceptible to contamination (City of Emporia, 2015). As such, any additional threats to this reservoir should be closely examined. The ACP would cross the Meherrin River within Emporia’s source water assessment area, approximately 4.7 miles from drinking water intake. This crossing would be constructed using the cofferdam open-trench method (FERC, 2017b). Due to this proximity to Emporia’s water supply and to strengthen Emporia’s ability to respond to any impacts, potential impacts from the ACP should be fully assessed.

20 | P a g e
Figure 9: ACP crossings and minority populations near City of Emporia, Virginia
5.2 ACP case study: City of Franklin, Southampton County
The City of Franklin, Virginia is located in Southampton County and has about 8,300 residents. While the ACP would not be located directly within the City of Franklin, it would pass nearby (Figure 10) and would travel through a census block with a high percentage of minority residents (approximately 73 percent minority). The median household income for the City of Franklin is about $38,000, with 17 percent of people living in poverty (US Census, 2017).
The City of Franklin sources its drinking water from four wells that withdraw groundwater from the Potomac Aquifer (City of Franklin, 2016). In 2017, it was reported that the Potomac Aquifer already has insufficient supply to meet the demands of current and future users (D’Angelo, 2017). The ACP would cross the

21 | P a g e
Blackwater River approximately 4.5 miles downstream from the City of Franklin using the HDD method (FERC, 2017b). This underground crossing has the potential to impact the groundwater resources utilized for drinking water, as it would be located approximately 2.5 miles from the nearest source water well (City of Franklin, 2017). Of the 33 water crossings within two miles of the City of Franklin, 23 would be within the census block dominated by minorities (the area colored red in Figure 10).
Figure 10: ACP crossings and minority populations near the City of Franklin, Virginia
Note: The stream crossing to the north of the pipeline corridor would be crossed by a temporary contractor yard (ACP, 2017b).

22 | P a g e
6. CHESAPEAKE BAY THREATS
The ACP would cross waterways in the Chesapeake Bay watershed 864 times, with 764 of these crossings located within the James River drainage. The extensive cumulative impacts of these numerous crossings could result in high levels of additional sediment transported to the Bay, especially via the James River.
The Chesapeake Bay is the nation’s largest estuary, and many parts of the Bay are already listed as impaired under the Clean Water Act for nutrients and sediment issues. One of the goals in the multi-state Chesapeake Bay Agreement is to “Reduce pollutants to achieve the water quality necessary to support the aquatic living resources of the Bay and its tributaries and protect human health.” (Chesapeake Bay Program, 2014, p. 7)
Specific strategies to achieve this goal include reductions in nutrients and sediment inputs from the entire watershed, according to the Chesapeake Bay TMDL. Sedimentation produced by construction of the ACP, which would stretch 263 miles across the Chesapeake Bay watershed, would make meeting the Bay-wide goals for 2025 more challenging.
As of 2017, Virginia had met its goal of overall sediment reduction within the Chesapeake Watershed Agreement (Chesapeake Progress, 2018). The goal for 2025 includes an additional 53-million–pound reduction in annual sediment transported from Virginia to the Bay. According to Clingerman and Hansen (2017), a single stream crossing in Virginia was expected to create 22,000-pound annual increase in sediment production, even after full revegetation of pipeline construction areas. Given the 864 ACP stream crossings in the Chesapeake Bay watershed, the ACP could result in thousands—or even millions—of additional pounds of annual sediment production. That increased sediment would then be required to be offset by additional sediment reduction practices elsewhere within the Chesapeake Bay watershed.
Given the ACP’s impact on the health of the Bay and Virginia’s ability to meet its sediment pollution reduction goal, specific pollution impacts to the Bay must be further assessed.

23 | P a g e
Figure 11: Proposed ACP construction corridor across the Chesapeake Bay watershed

24 | P a g e
7. WETLAND THREATS
Wetlands are valuable and sensitive waterbodies that would be impacted during both the construction and operation of the MVP and ACP.
The open-trench method that is proposed for most of the ACP and MVP water crossings has potential short- and long-term impacts to the quality and function of wetlands. In addition to the increase in erosion and sedimentation, soil structure alterations and hydrology changes can cause long-term or permanent wetland impacts.
Soil compaction by heavy equipment can cause increased surface water runoff, hinders revegetation, and decreases absorption and infiltration of surface waters. Additionally, the soil removed from the trench, even when properly segregated and returned, may have reduced functionality and vegetative productivity. Further, any incorrect regrading or the installation and maintenance of poor erosion and sedimentation controls can cause significant hydrologic change that leads to partial or complete dewatering of existing wetlands. Additionally, the trench and pipeline can direct water away from wetlands, causing further changes in hydrology that may be permanent. (Kanouff, 2015)
In order to preserve access to a pipeline for safety purposes and to ensure pipeline integrity is not threatened by large tree roots, forested wetlands in a permanent pipeline corridor are converted to herbaceous or shrub-scrub wetlands. This conversion, however, has negative environmental impacts. A wetland that is converted from a forested wetland to either a scrub-shrub or herbaceous wetland will nearly always result in a loss of important wetland functions. The capability of forested wetlands to stabilize soil, store nutrients, and reduce erosion and sedimentation is higher than either scrub-shrub or herbaceous wetlands. Other important functions such as stream shading, core forest area, vegetative biomass, structural diversity, and species diversity (both flora and fauna) are also likely to decrease when a forested wetland is converted to another type of wetland. (Schmid & Company, 2014)
The ACP would cross and impact a total of 310 acres of wetlands across Virginia (FERC, 2017b), and wetland impacts of greater than one-half acre would occur at 133 crossings. Additionally, the project would convert a total of 74.9 acres of forested wetlands in Virginia into lower-value wetlands, either herbaceous or herbaceous/scrub-shrub wetlands. These conversions would occur at 362 crossings, and 32 of the 362 crossings would convert greater than one-half acre from a single wetland (ACP, 2017b).
The MVP would cross and impact a total of 8.3 acres of wetlands across Virginia, four acres of which would remain permanently impacted during pipeline operations. Additionally, the project would convert a total of two acres of forested wetlands in Virginia into lower-value wetlands, either herbaceous or herbaceous/scrub-shrub wetlands (FERC, 2017a).
7.1 ACP case study: Great Dismal Swamp, Suffolk and Chesapeake counties
The largest impact to a single wetlands complex would occur where the ACP is anticipated to cross near the Great Dismal Swamp National Wildlife Refuge. In the immediate vicinity of the Refuge, 22 wetland crossings would impact 75.9 total wetland acres (Figure 12).
These crossings are especially important because these wetlands are hydrologically connected to those in the National Wildlife Refuge, and the pipeline corridor would come as close as 100 feet to the Refuge boundary (FERC, 2017b). In this location, 13 forested wetlands would be crossed, resulting in 21.7 acres of permanent conversion to scrub-shrub or herbaceous wetlands. Six of these forested wetland crossings are large, as they would result in greater than one-half acre of conversion to scrub-shrub or herbaceous wetlands (ACP, 2017b).

25 | P a g e
Further study is needed to fully understand the wetlands impact of the ACP on wetlands, including those of the Great Dismal Swamp.
Figure 12: ACP crossings and the Great Dismal Swamp
Sources: Wetland and stream crossings from ACP (2017a). Wetlands from USFWS (2017). Note: The boundary for the Great Dismal Swamp National Wildlife Refuge in this map is generalized, and the pipeline would not come closer than 100 feet from the boundary (FERC, 2017b).

26 | P a g e
8. SUMMARY AND CONCLUSIONS
8.1 General threats
• The ACP and MVP would cross Virginia streams and wetlands at over 1,000 locations.
8.2 Erosion and sedimentation threats
• Sedimentation would increase significantly during and immediately after construction, and it would continue at levels above baseline on a permanent basis.
• While some amount of sedimentation occurs naturally, excess sediment in streams is considered a pollutant, which would harm fish and other aquatic life both at the crossing and downstream.
• Sedimentation from pipeline construction would impact pristine streams in many locations.
• Sedimentation from pipeline construction would impact streams with biological impairments due to existing sedimentation, which would make it more difficult to meet TMDL allocations.
8.3 Drinking water supply threats
• A total of six source water assessment areas upstream from drinking water intakes would be crossed by the ACP and MVP.
• The MVP would cross the Roanoke River only 1.1 miles upstream from the likely intake location for Western Virginia Water Authority.
• A total of 11 crossings would occur less than a mile from two reservoirs that serve as drinking water sources for Norfolk, Virginia.
• Three of Norfolk’s deep wells used for source water are within approximately two miles from at least one of the HDD crossings proposed by ACP.
• There are more than 35 total crossings within the Town of Rocky Mount’s Source Water Assessment Area.
• Emporia’s drinking water is supplied by a reservoir that VDOH has determined to be highly susceptible to contamination. The Meherrin River is the source of water in this reservoir, and the ACP would cross this river less than five miles upstream from the water intake.
8.4 Trout water threats
• Numerous trout streams—including native, wild, and stocked trout—would be impacted by open-trench crossings in Virginia.
• TU classified 73 crossings as highest-concern in Virginia, meaning that those locations were likely the most viable brook trout patches in the region.
• In the Upper Calfpasture River watershed alone, TU classified 28 crossings as highest-concern for brook trout impacts.

27 | P a g e
• Little Stony Creek, a wild trout stream, would be crossed in close proximity to popular outdoor recreational access areas.
8.5 Environmental justice threats
• Emporia, Virginia, in Greensville County, has a high percentage of minority residents (approximately 70 percent), and the median household income is approximately $27,000, with 23 percent of people living in poverty. The already vulnerable drinking water supply for Emporia would be at higher susceptibility to contamination by construction of the ACP nearby and upstream from the water supply intake.
• Franklin, Virginia, in Southampton County, has a high percentage of minority residents (approximately 73 percent minority), and the median household income is about $38,000, with 17 percent of people living in poverty. The ACP would cross the Blackwater River approximately 4.5 miles downstream from Franklin using the HDD method; this crossing has the potential to impact the groundwater resources utilized for drinking water, as it would be located approximately 2.5 miles from the nearest source water well. Of the 33 water crossings within two miles of Franklin, 23 would be within the census block dominated by minorities.
8.6 Chesapeake Bay threats
• Construction of the ACP would stretch 263 miles across the Chesapeake Bay watershed and would cross waterbodies and wetlands 864 times in the watershed, with 764 of these crossings located within the James River drainage..
• ACP construction would result in additional sediment delivered to the Chesapeake Bay annually, which would make it more difficult to meet Virginia’s 2025 TMDL load reductions.
8.7 Wetland threats
• Over 315 acres of wetlands would be impacted during construction of the ACP and MVP.
• A total of 133 crossings would impact wetlands greater than one-half acre in size.
• Over 75 acres of forested wetlands in Virginia would be permanently converted to herbaceous or herbaceous/scrub-shrub wetlands as a result of ACP and MVP construction.
• The ACP would cross a major wetland complex just outside of the boundary of the Great Dismal Swamp National Wildlife Refuge, impacting over 75 acres of wetlands across 22 wetland crossings. Nearly 22 acres of forested wetlands would be permanently converted in this area.

28 | P a g e
REFERENCES
Adams, D. 2015. Pipeline opponents cite contamination of drinking water supply as cautionary tale. The Roanoke Times. December 3. http://www.roanoke.com/business/news/pipeline-opponents-cite-contamination-of-drinking-water-supply-as-cautionary/article_1172b929-8960-54a6-abdc-1784023dd5b9.html
Armitage, PD and Gunn, RJM. 1996. Differential response of benthos to natural and anthropogenic disturbances in 3 lowland streams. Internationale Revue der Gesamten Hydrobiologie, 81(2), 161–181.
Atlantic Coast Pipeline, LLC (ACP). 2017a. Atlantic Coast Pipeline Project Overview. https://atlanticcoastpipeline.com/resources/docs/resources/acp-project-overview-june-2017.pdf
____________________. 2017b. Atlantic Coast Pipeline, Joint Permit Application: United States Army Corps of Engineers – Norfolk District, Virginia Department of Environmental Quality, and Virginia Marine Resources Commission. July. Prepared by ERM.
City of Emporia. 2015. Annual Drinking Water Quality Report Of the Emporia Filtration Works. http://ci.emporia.va.us/wp-content/uploads/Emporia-2015-draft-CCR.pdf
City of Franklin. 2017. City of Franklin GIS Viewer. http://franklin.mapsdirect.net/Account/Logon Accessed February 9, 2018.
____________________. 2016. Annual Water Quality Report For Calendar Year 2016. http://www.franklinva.com/media/75220/franklin-water-quality-report-proof.pdf
City of Norfolk. 2017. 2017 Water Quality Report. https://www.norfolk.gov/DocumentCenter/View/29440
Chesapeake Bay Program. 2014. Chesapeake Watershed Agreement. https://www.chesapeakebay.net/documents/FINAL_Ches_Bay_Watershed_Agreement.withsignatures-HIres.pdf
Chesapeake Progress. 2018. 2017 and 2025 Watershed Implementation Plans (WIPs): Progress. http://www.chesapeakeprogress.com/clean-water/watershed-implementation-plans
Clingerman, J and Hansen E. 2017. Atlantic Coast Pipeline Sediment Modeling Methodology. Downstream Strategies. Prepared for Appalachian Mountain Advocates. April 6.
____________________. 2016. Mountain Valley Pipeline Sediment Modeling Methodology. Downstream Strategies. Prepared for Appalachian Mountain Advocates. December 16.
D’Angelo, P. A. 2017. Virginia tightens spigot on big water users to stem Potomac Aquifer decline. http://www.fredericksburg.com/news/environment/virginia-tightens-spigot-on-big-water-users-to-stem-potomac/article_46dcc766-36f9-5687-a60f-651f97bd6596.html. Accessed February 8, 2018.
Environmental Solutions & Innovations. 2017. Hydrologic Analysis of Sedimentation, Mountain Valley Pipeline, Jefferson National Forest, Eastern Divide Ranger District. Prepared for: U.S. Department of Agriculture, Forest Service. Prepared on behalf of: Mountain Valley Pipeline. March 1. https://www.ferc.gov/industries/gas/enviro/eis/2017/06-23-17-FEIS/Appendix-O.pdf
Federal Energy Regulatory Commission (FERC). 2017a. Mountain Valley Project and Equitrans Expansion Project, Final Environmental Impact Statement, Volume I. Atlantic Coast Pipeline, LLC, Dominion Energy Transmission, Inc., Docket Nos. CP16-10-000 and CP16-13-000, FERC/FEIS-0272F. June 23. https://www.ferc.gov/industries/gas/enviro/eis/2017/06-23-17-FEIS/Final-Environmental-Impact-Statement.pdf

29 | P a g e
____________________. 2017b. Atlantic Coast Pipeline and Supply Header Project, Final Environmental Impact Statement, Volume I. Atlantic Coast Pipeline, LLC, Dominion Energy Transmission, Inc., Docket Nos. CP15-554-000, CP15-554-001, CP15-555-000, and CP15-556-000, FERC/EIS-0274F. July 21. https://www.ferc.gov/industries/gas/enviro/eis/2017/07-21-17-FEIS/volume-I.pdf
Fesenmyer, K. 2017. Stream Crossings and Brook Trout Resources along the Proposed Atlantic Coast Pipeline. Trout Unlimited Science Program. January 19, 2017. Provided by email by David Kinney, February 8, 2018.Lévesque, L and Dubé, M. 2007. Review of the effects of in-stream pipeline crossing construction on aquatic ecosystems and examination of Canadian methodologies for impact assessment. Environ Monit Assess 132:395–409.
Mountain Valley Pipeline, LLC (MVP). 2017. Mountain Valley Pipeline Project Overview. https://www.mountainvalleypipeline.info/
Schmid & Company. 2014. The Effects of Converting Forest or Scrub Wetlands into Herbaceous Wetlands in Pennsylvania. Prepared for Delaware Riverkeeper Network. http://www.schmidco.com/Leidy_Conversion_Final_Report.pdf
Trout Unlimited (TU). 2017a. Proposed ACP pipeline and brook trout - 12 Jan 2017. Interactive webmap. http://trout.maps.arcgis.com/home/webmap/viewer.html?webmap=7b80f06b36b34701b4c351a9e167bd6f&extent=-80.2231,38.1083,-79.4143,38.4586 Accessed February 2, 2018.
____________________. 2017b. Comments on ACP FEIS. Provided by David Kinney, TU. February 5, 2018.
U.S Census Bureau (US Census). 2017. QuickFacts. https://www.census.gov/quickfacts/fact/table/US/PST045217
U.S. Census Bureau (US Census). 2012. United States Census Block Group Demographics.
U.S. Fish and Wildlife Service (USFWS). 2017. National Wetlands Inventory – Version 2 – Surface Waters and Wetlands Inventory. https://www.fws.gov/wetlands/data/data-download.html
Virginia Council of Trout Unlimited (VCTU). 2015. Little Stony Creek TU restocking project restores two local fisheries. http://virginiatu.org/2015/01/27/little-stony-creek-tu-restocking-project-restores-two-local-fisheries/
Virginia Department of Environmental Quality (VDEQ). 2017. Certification No. 17-001: 401 Water Quality Certification Issued To Mountain Valley Pipeline, LLC. http://www.deq.virginia.gov/Portals/0/DEQ/Water/Pipelines/MVP_Certification_Final.pdf?ver=2017-12-08-130141-433
____________________. 2004. Exceptional State Waters (Tier III). Accessed January 16, 2018. http://www.deq.virginia.gov/Programs/Water/WaterQualityInformationTMDLs/WaterQualityStandards/ExceptionalStateWaters(TierIII).aspx
Virginia Department of Environmental Quality (VDEQ), Virginia Department of Conservation & Recreation (VDCR), and Virginia Department of Health (VDOH). 2017. Virginia Water Quality Assessment 305(b)/303(d) Integrated Report, 2016 (Draft). August. http://www.deq.virginia.gov/Portals/0/DEQ/Water/WaterQualityAssessments/IntegratedReport/2016/ir16_Integrated_Report_Full_Draft.pdf
____________________. 2016. Virginia Water Quality Assessment 305(b)/303(d) Integrated Report, 2014 (Final). May. http://www.deq.virginia.gov/Portals/0/DEQ/Water/WaterQualityAssessments/IntegratedReport/2014/ir14_Integrated_Report_Final.pdf
30 | P a g e
Virginia Department of Game and Inland Fisheries (VDGIF). 2018a. Email from Ernie Aschenbach, Environmental Services Biologist, to Randy Owen, Virginia Marine Resources Commission. Received January 8.
____________________. 2018b. Virginia Trout Fishing. Online mapping application, accessed January 16. https://dgif-virginia.maps.arcgis.com/apps/webappviewer/index.html?id=441ed456c8664166bb735b1db6024e48
Virginia Department of Health (VDOH). Office of Drinking Water. 2018. GIS data for Source Water Assessment Areas within counties crossed by the MVP. Personal communication with author Betcher. January 16.
Watkins, T and Ellis, R. 2014. Bottled water for West Virginia residents plagued by chemical in water supply. CNN. Archived from the original on January 11, 2014. Retrieved January 17, 2017. http://www.cnn.com/2014/01/11/us/west-virginia-contaminated-water/
Western Virginia Water Authority. 2018. General Information. Accessed January 21. https://www.westernvawater.org/about-us/general-information
Top Related