


Languages
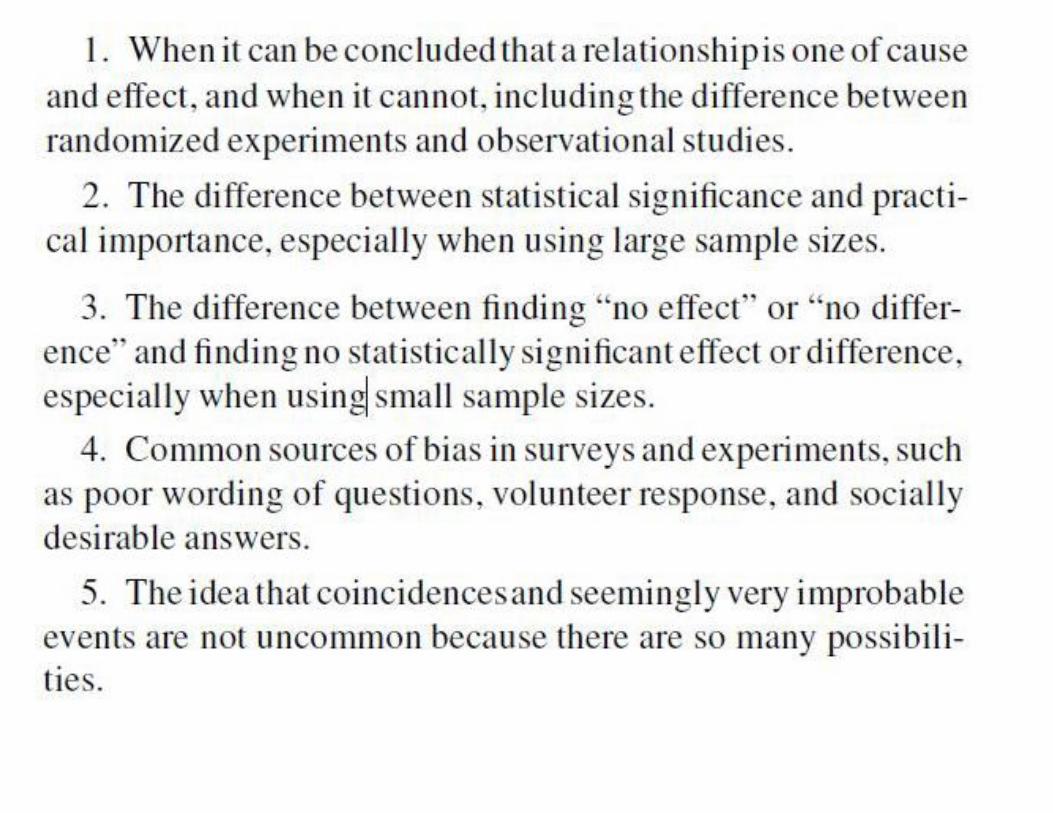
Pages
Legal

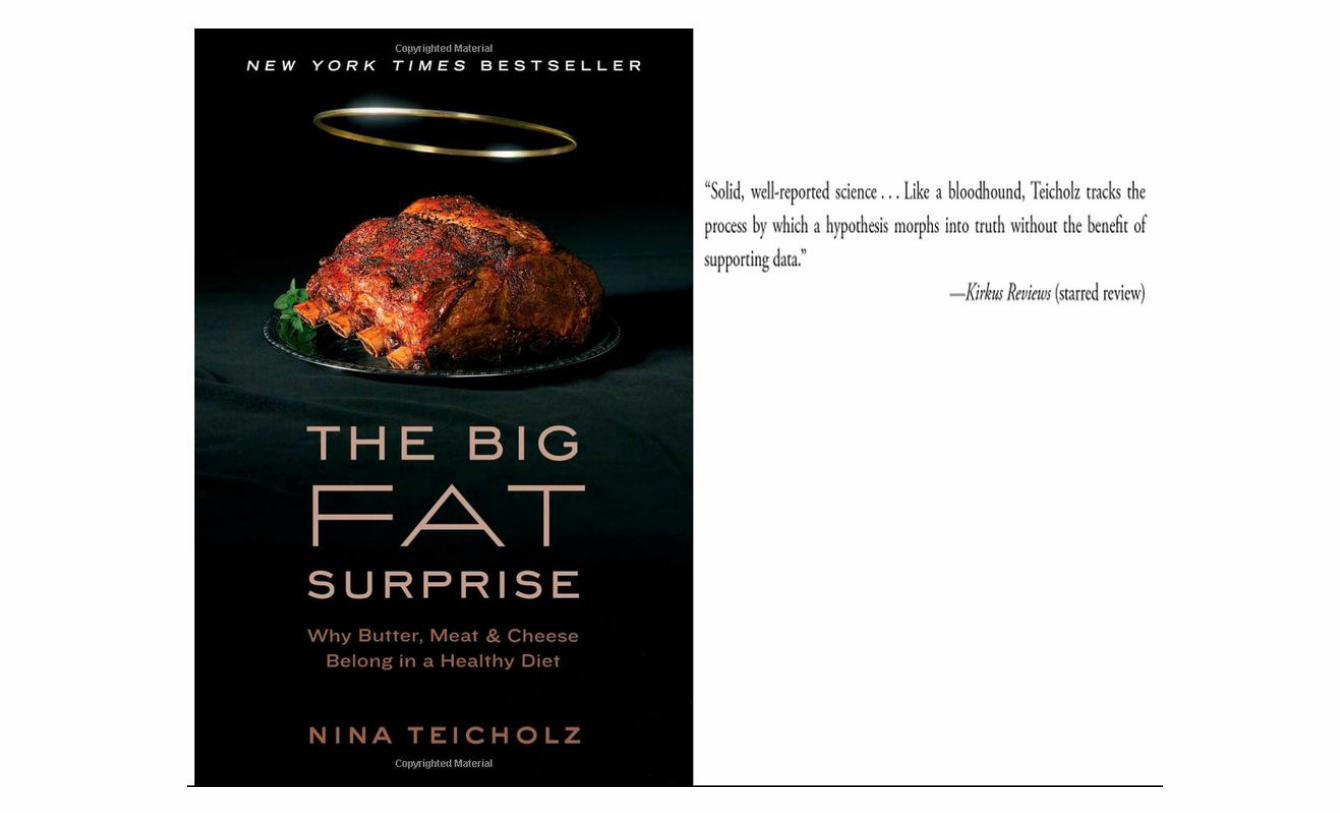
There are three kinds of lies: lies, damned lies and statistics
– Benjamin Disraeli
Prime Minister of Great Britain (1868, 1874-1880)

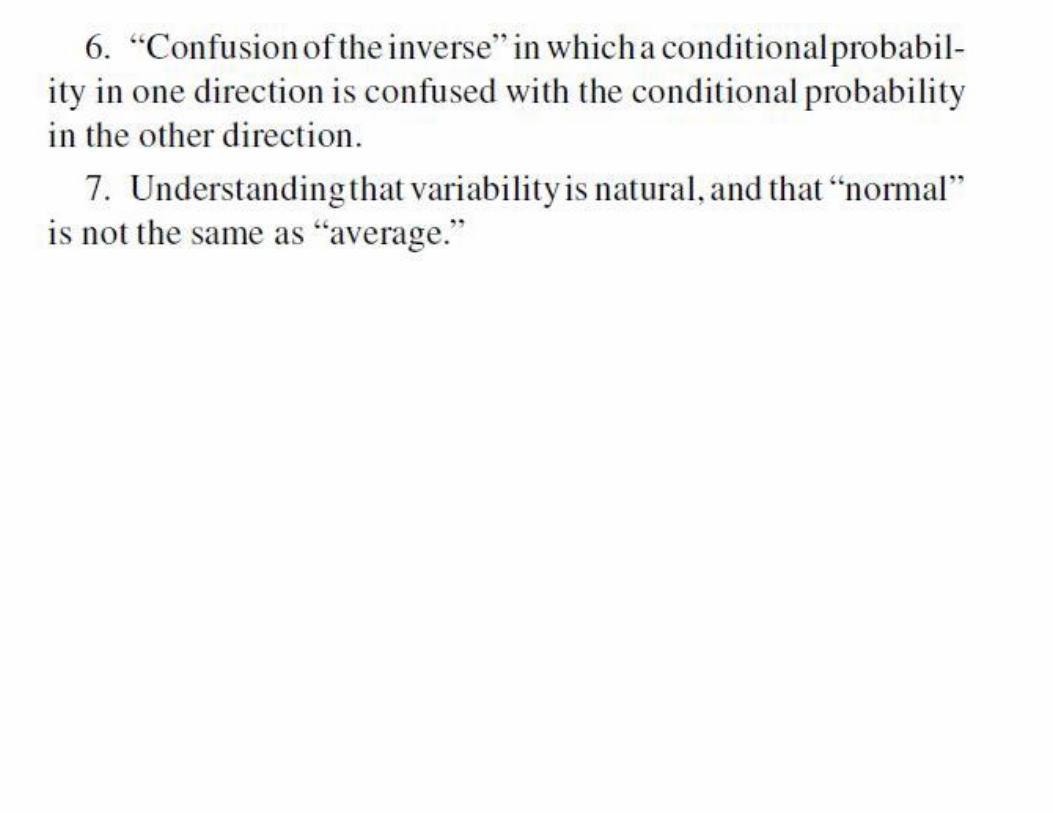
When Statistics Seem to Lie – They’re Answering a Different Question
Georges Monette York University [email protected]


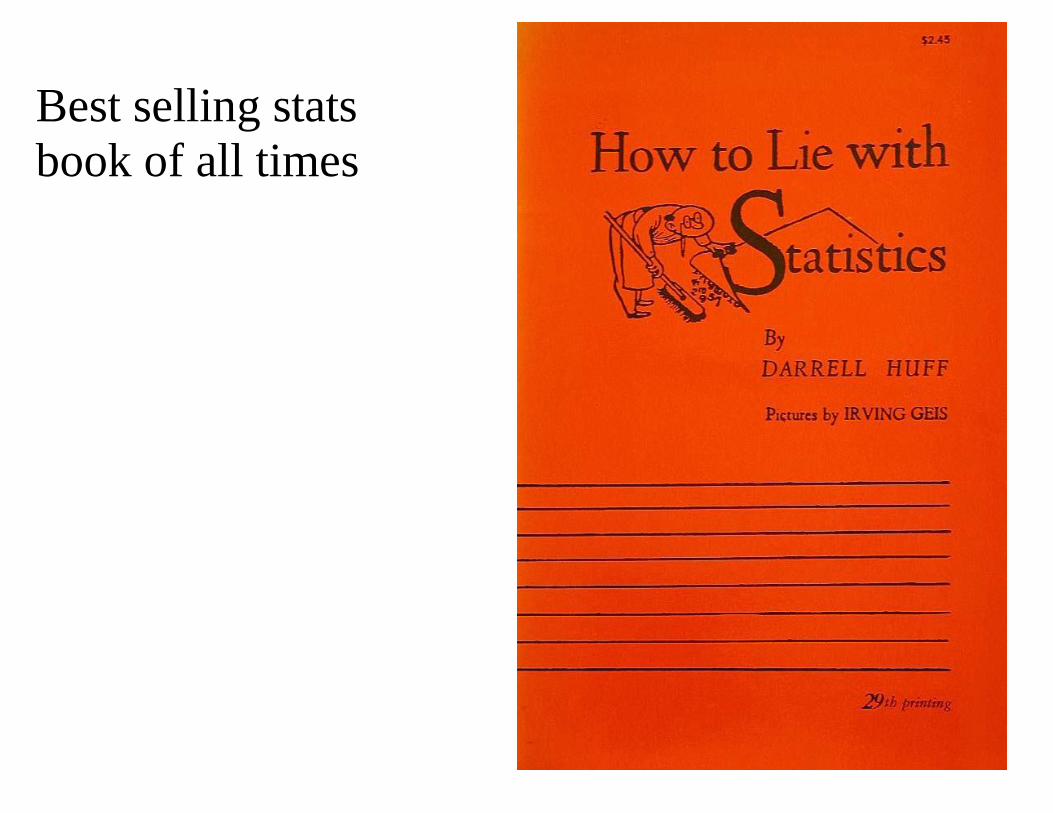
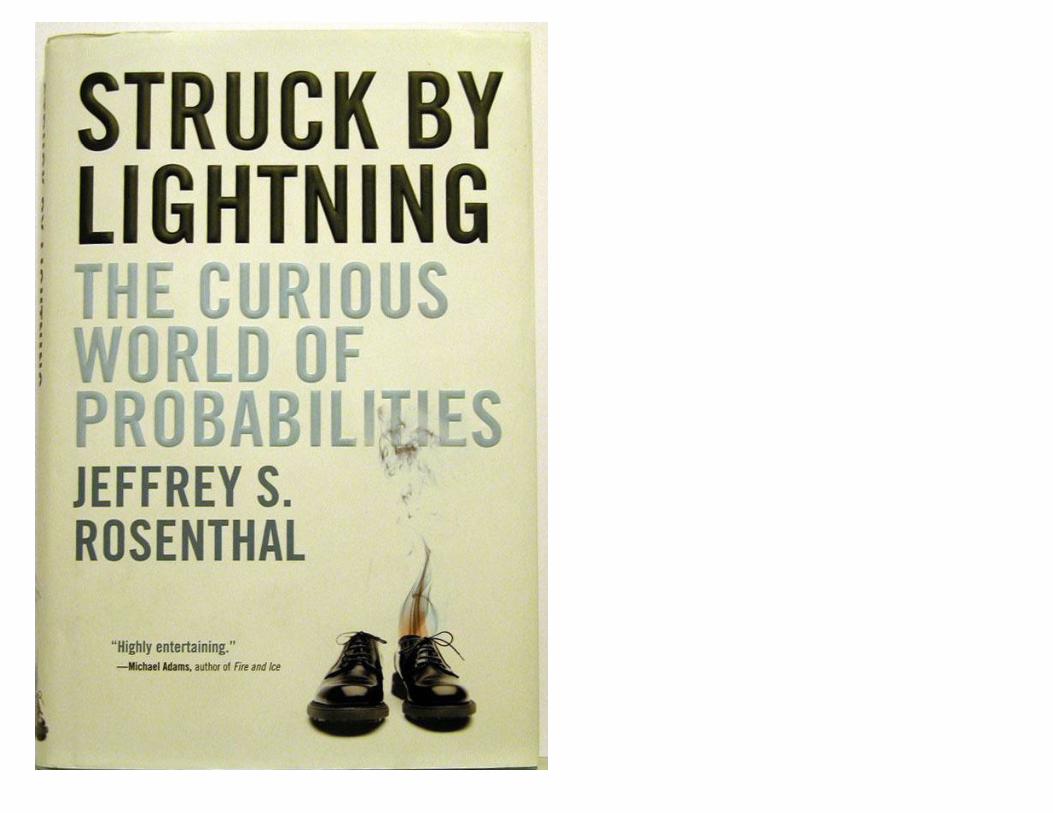
Best selling stats book of all times
Goingfurther:DavidHealy(ofCAMHfame):
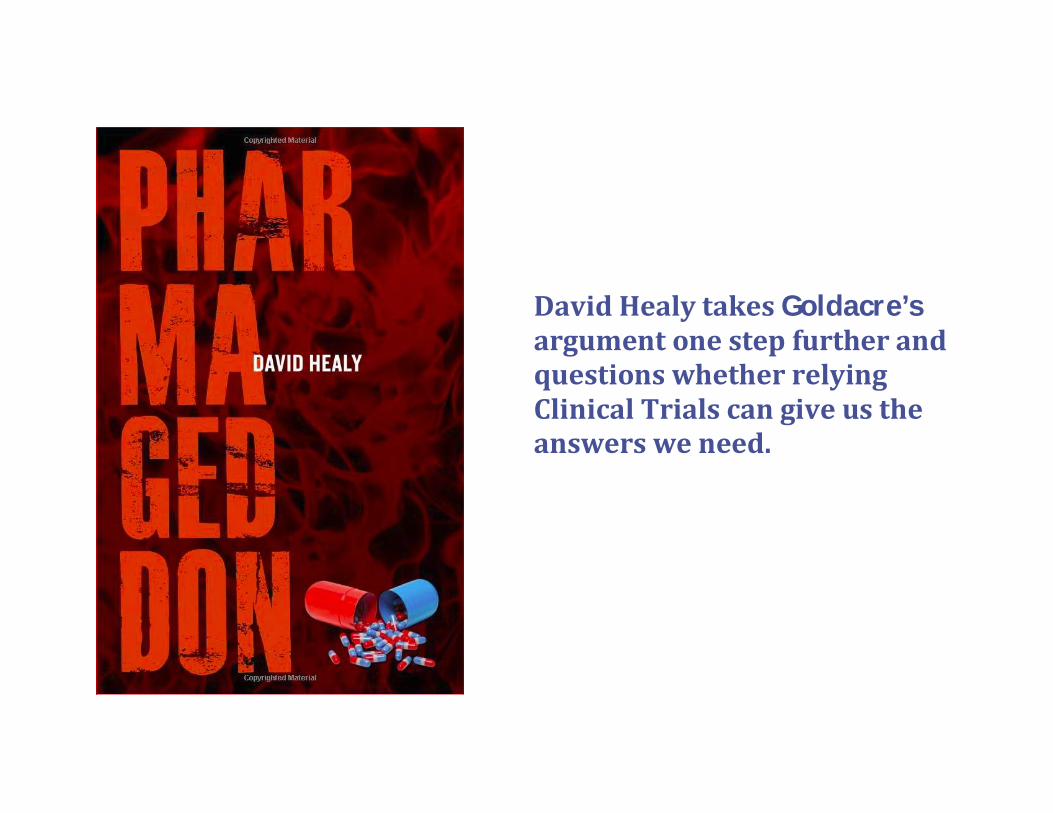
DavidHealytakesGoldacre’sargumentonestepfurtherandquestionswhetherrelyingClinicalTrialscangiveustheanswersweneed.
Statistical thinking will one day be as necessary for efficient citizenship as the ability to read and write.
– H. G. Wells
Misunderstand statistics? Splitting hairs? Does it really matter?
Misunderstand statistics? Splitting hairs? Does it really matter?
A few consequences?The global economic meltdownWrongful murder convictionsDelayed response to health effects of tobaccoPoor health policies and treatment decisions

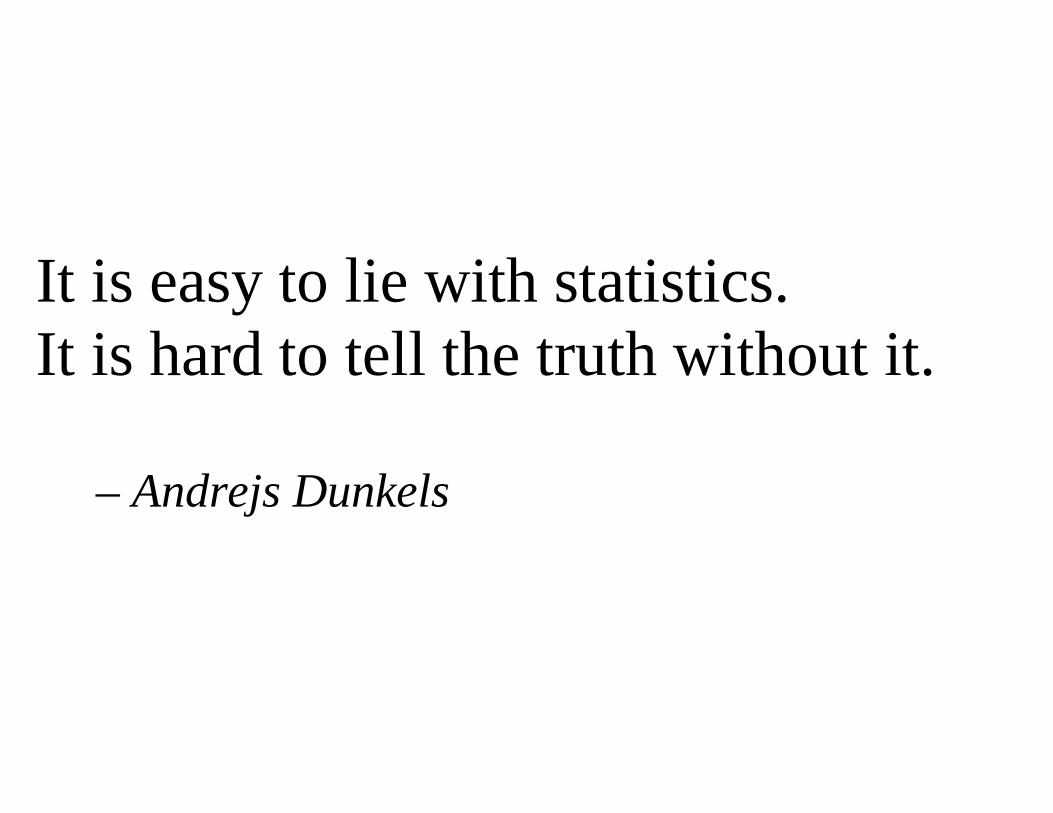
It is easy to lie with statistics. It is hard to tell the truth without it.
– Andrejs Dunkels
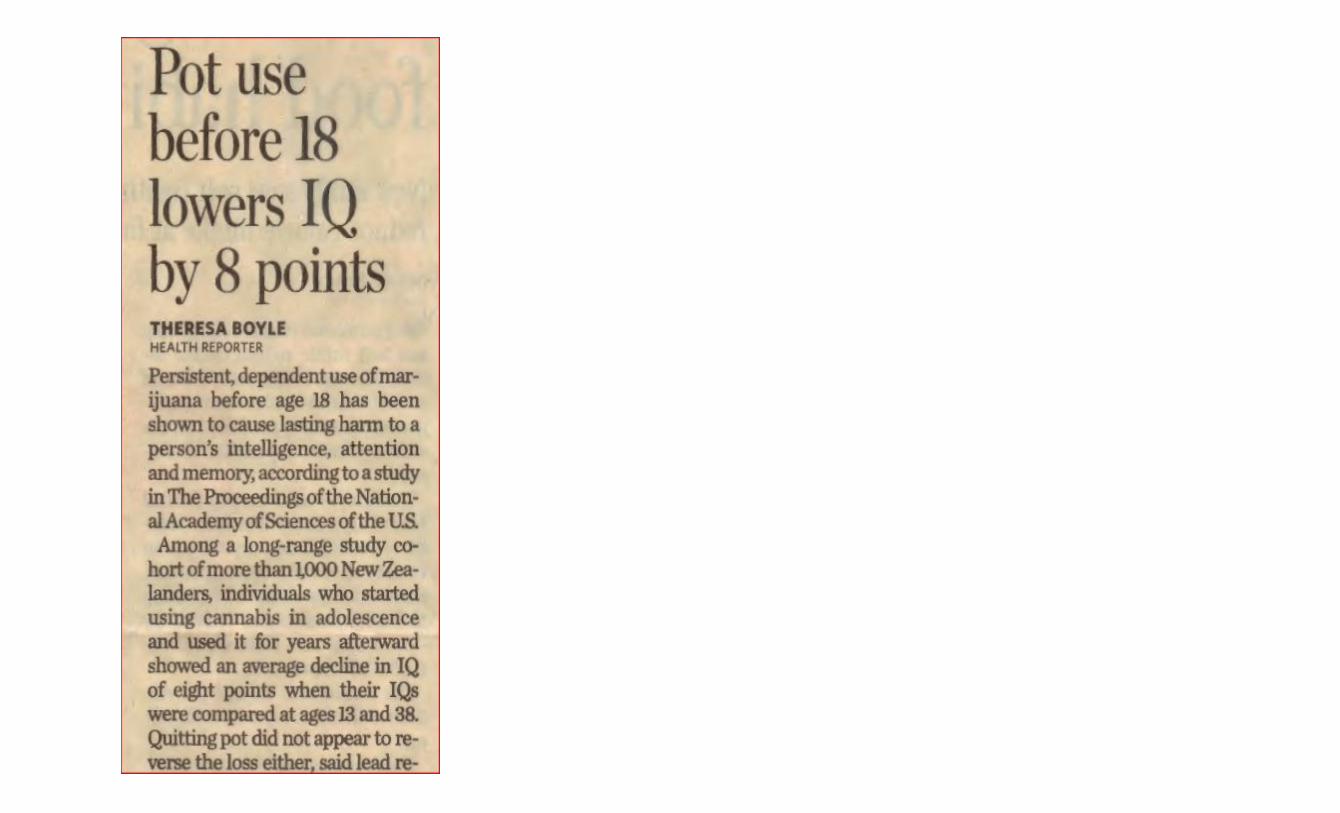
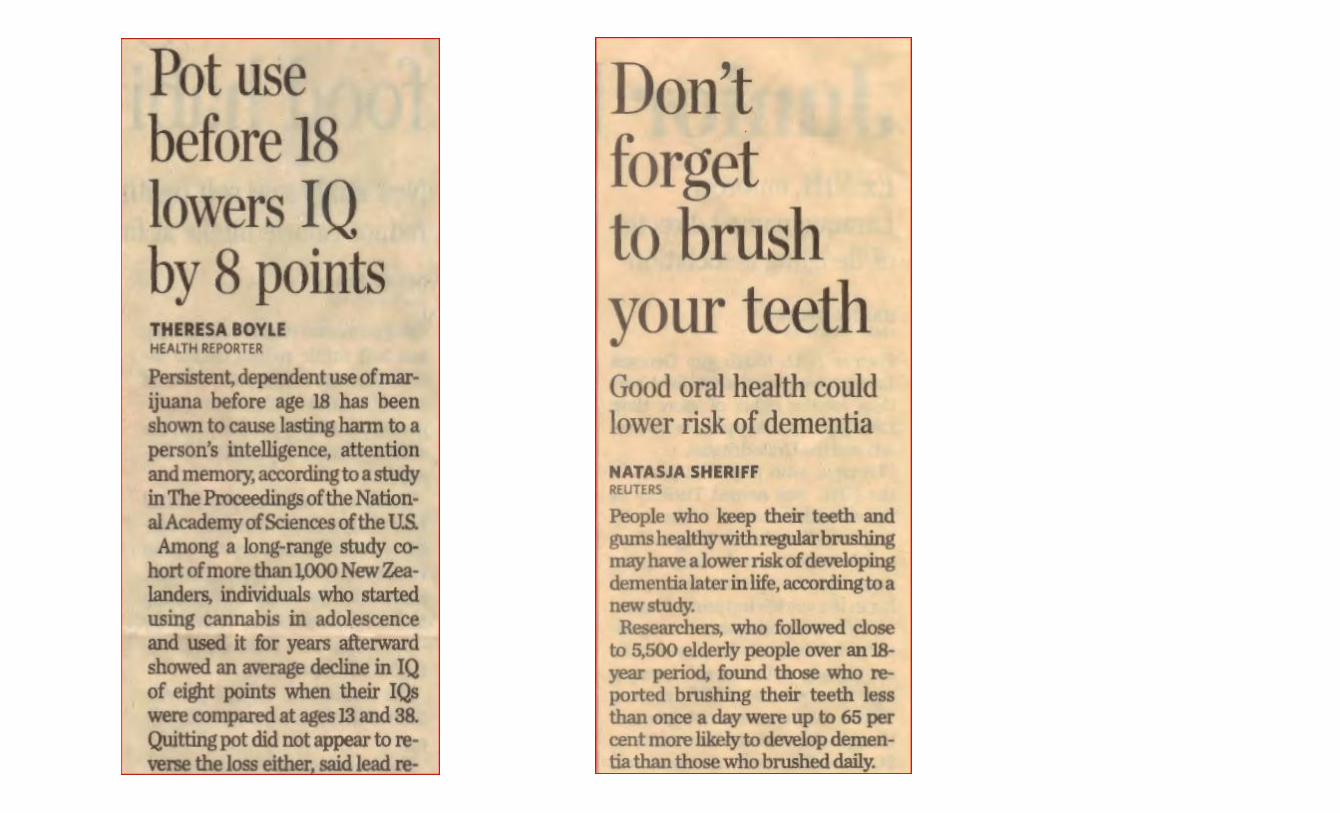
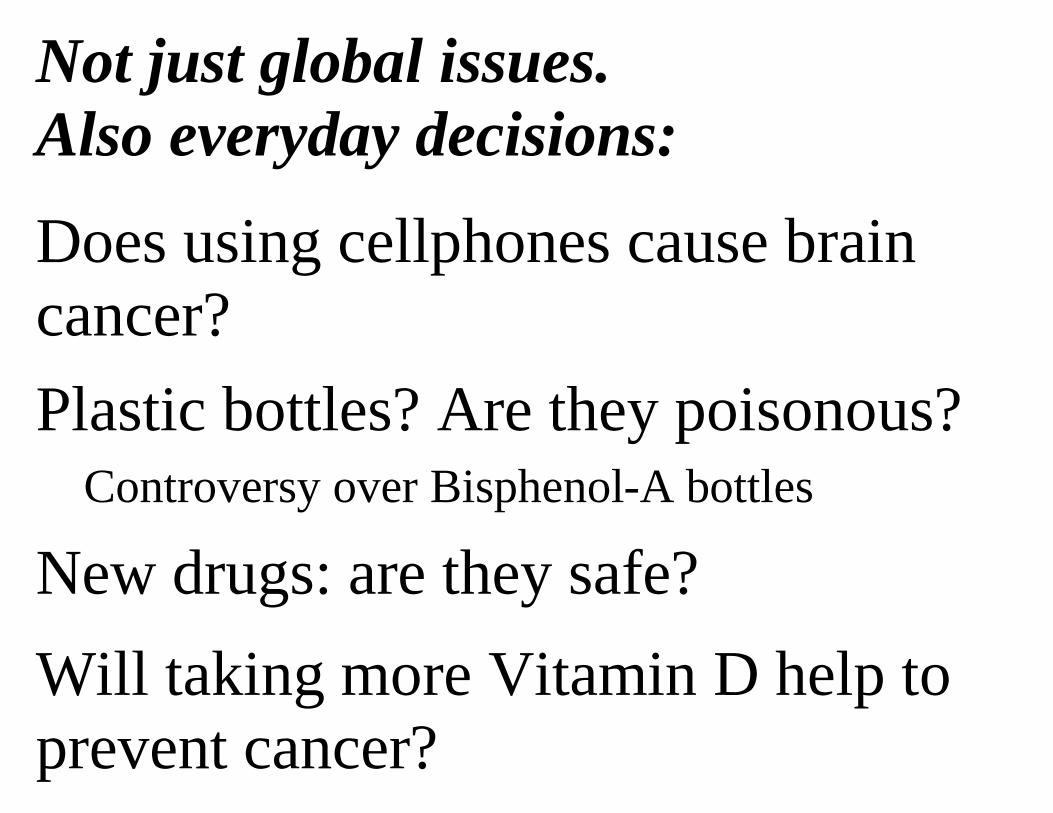
Not just global issues.Also everyday decisions:
Does using cellphones cause brain cancer?Plastic bottles? Are they poisonous?
Controversy over Bisphenol-A bottles
New drugs: are they safe?Will taking more Vitamin D help to prevent cancer?
Most of these issues boil down to asking: Will X cause Y? Why can’t the experts agree?
How do I make a wise decision for myself?
ShouldIorShouldn’tI doX?
DoesdoingXcauseY?
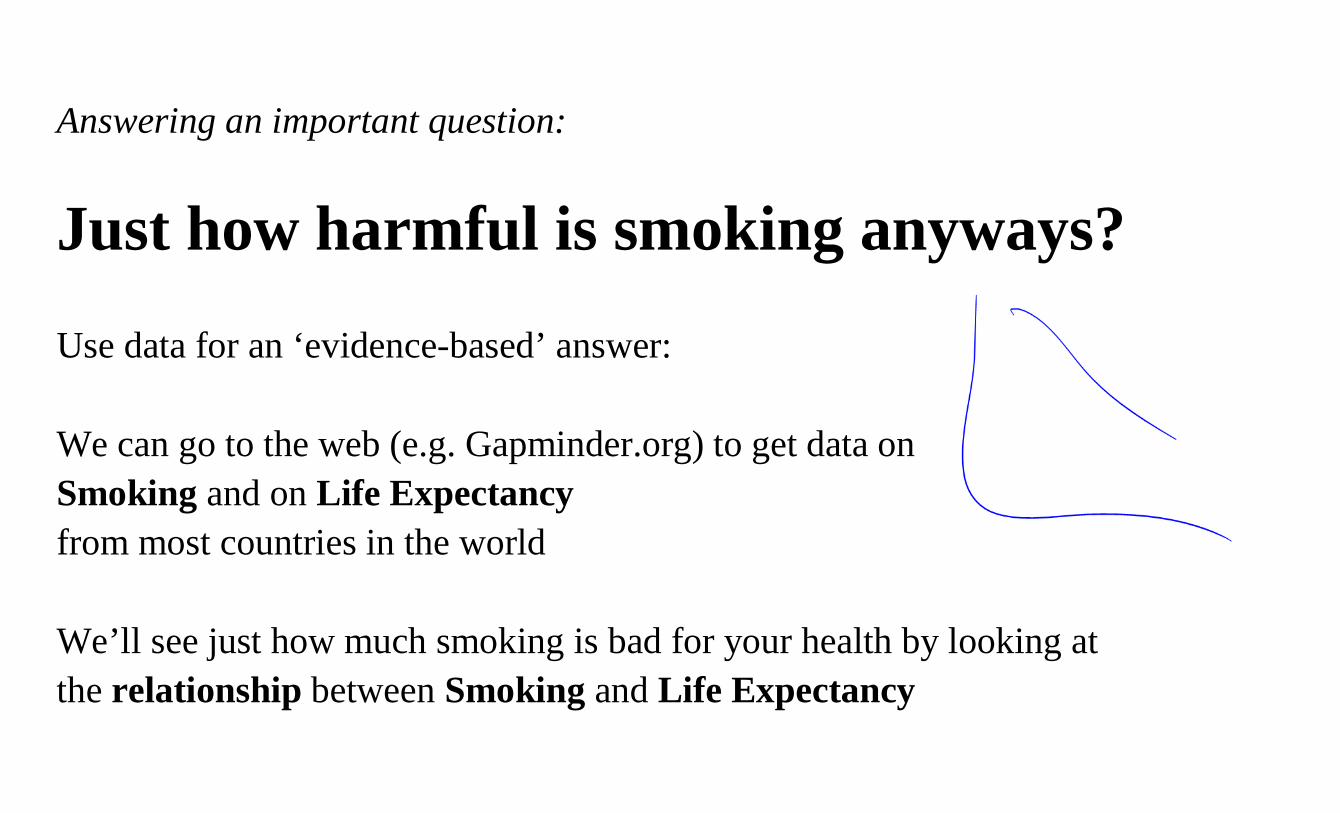
Answering an important question:
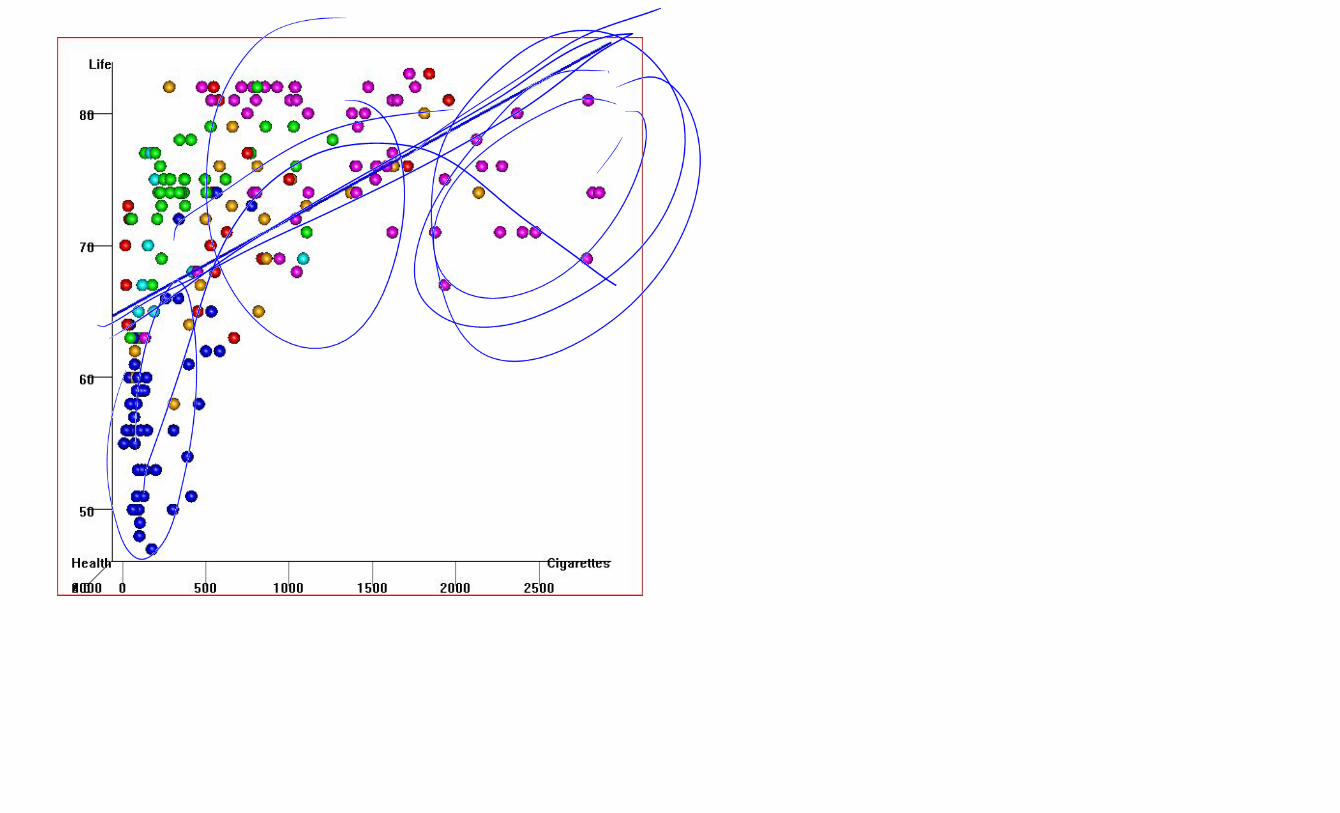
Just how harmful is smoking anyways? Use data for an ‘evidence-based’ answer: We can go to the web (e.g. Gapminder.org) to get data on Smoking and on Life Expectancy from most countries in the world We’ll see just how much smoking is bad for your health by looking at the relationship between Smoking and Life Expectancy
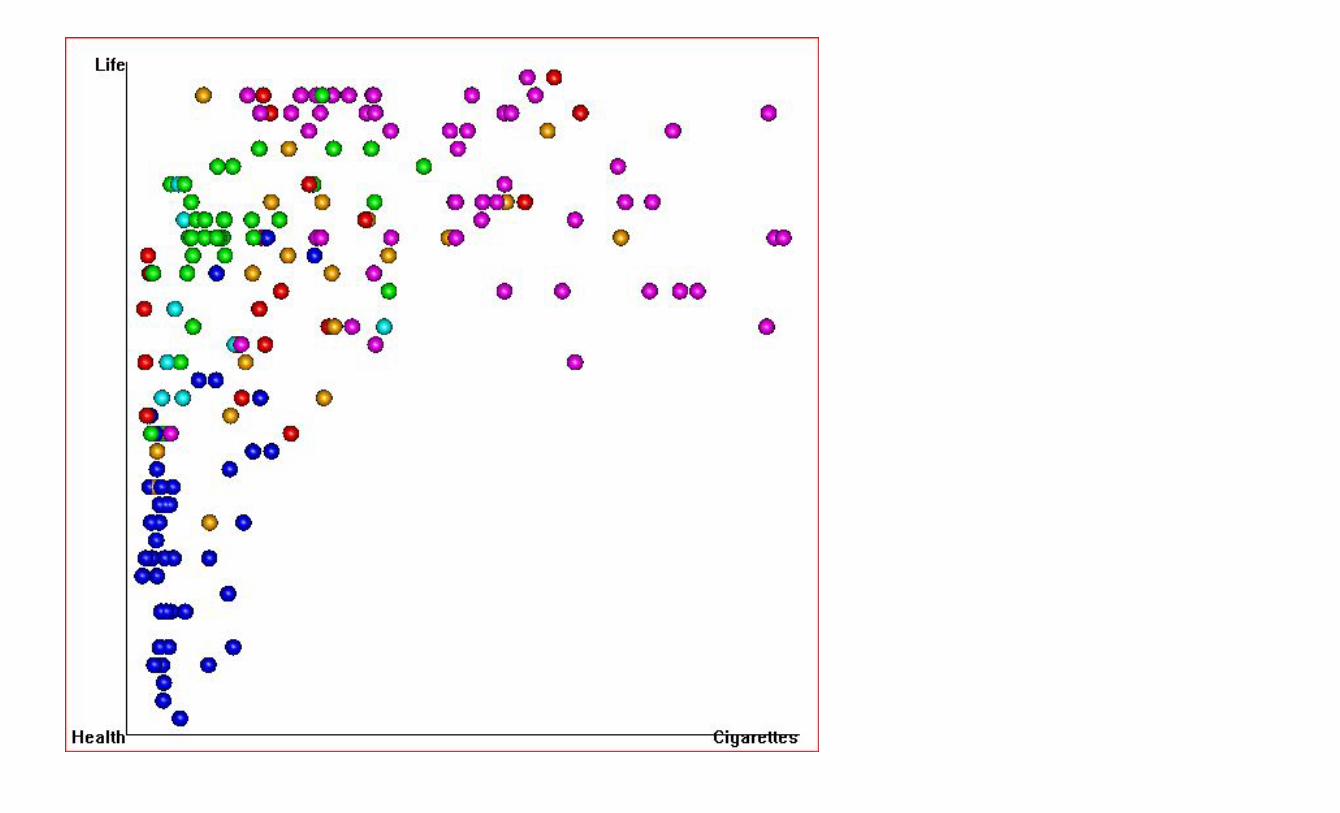
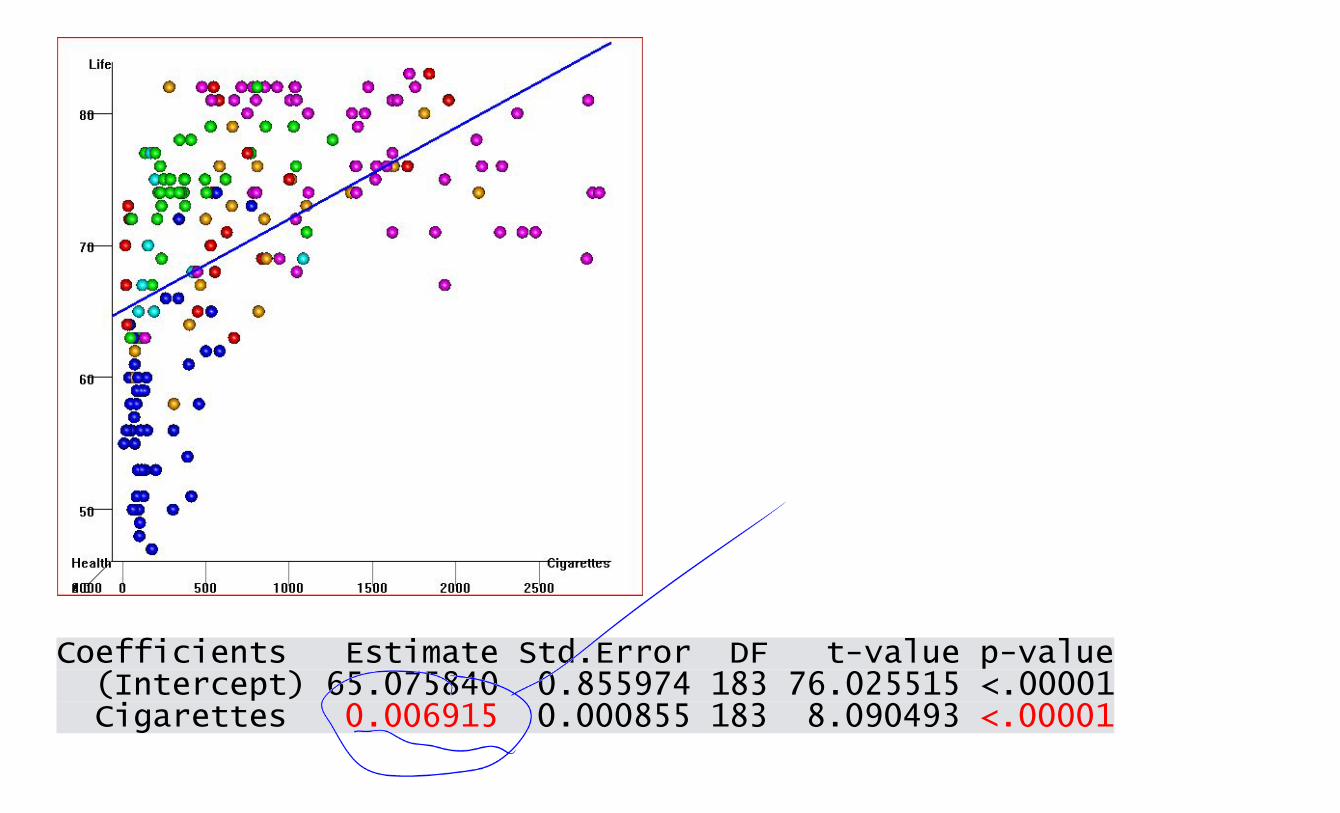
Coefficients Estimate Std.Error DF t-value p-value (Intercept) 65.075840 0.855974 183 76.025515 <.00001 Cigarettes 0.006915 0.000855 183 8.090493 <.00001
Coefficients Estimate Std.Error DF t-value p-value (Intercept) 65.075840 0.855974 183 76.025515 <.00001 Cigarettes 0.006915 0.000855 183 8.090493 <.00001
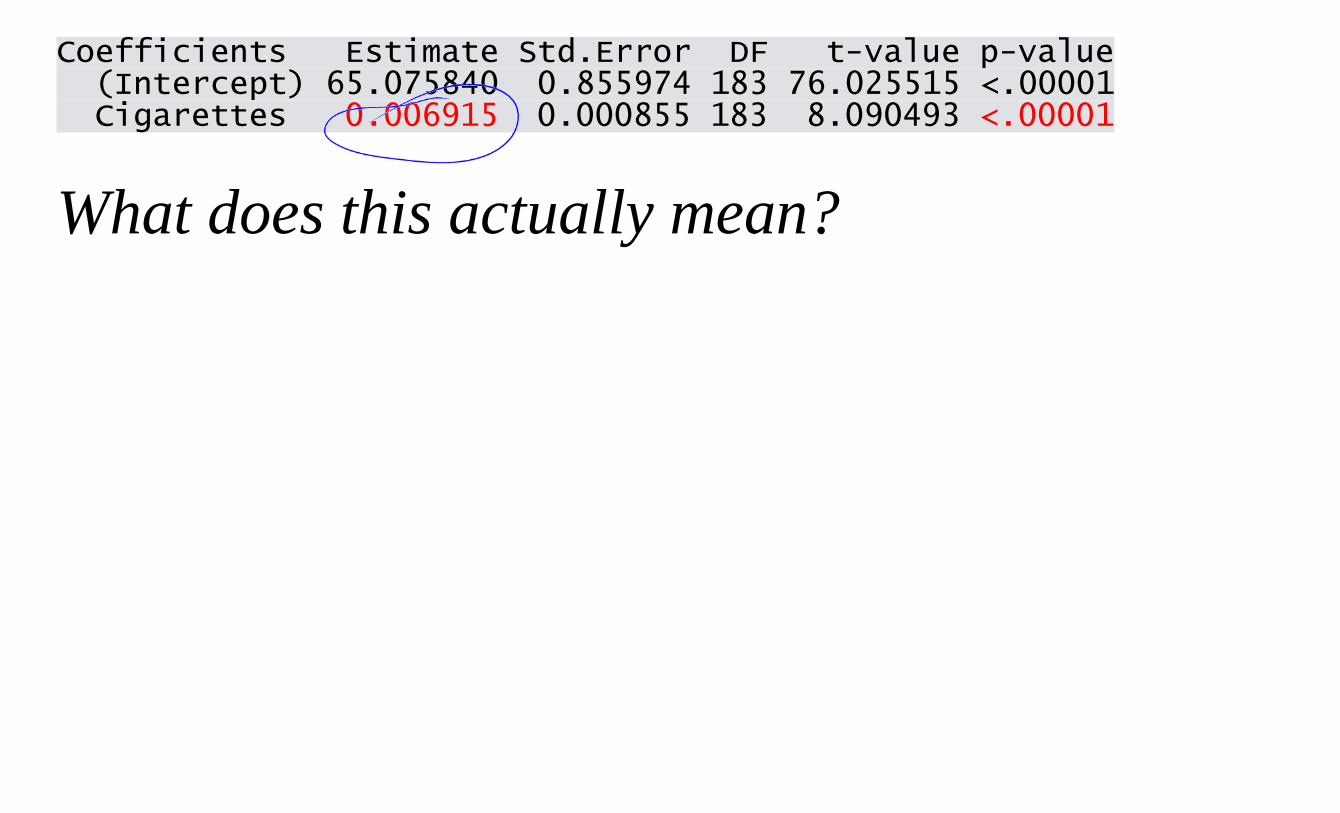
What does this actually mean?
Coefficients Estimate Std.Error DF t-value p-value (Intercept) 65.075840 0.855974 183 76.025515 <.00001 Cigarettes 0.006915 0.000855 183 8.090493 <.00001
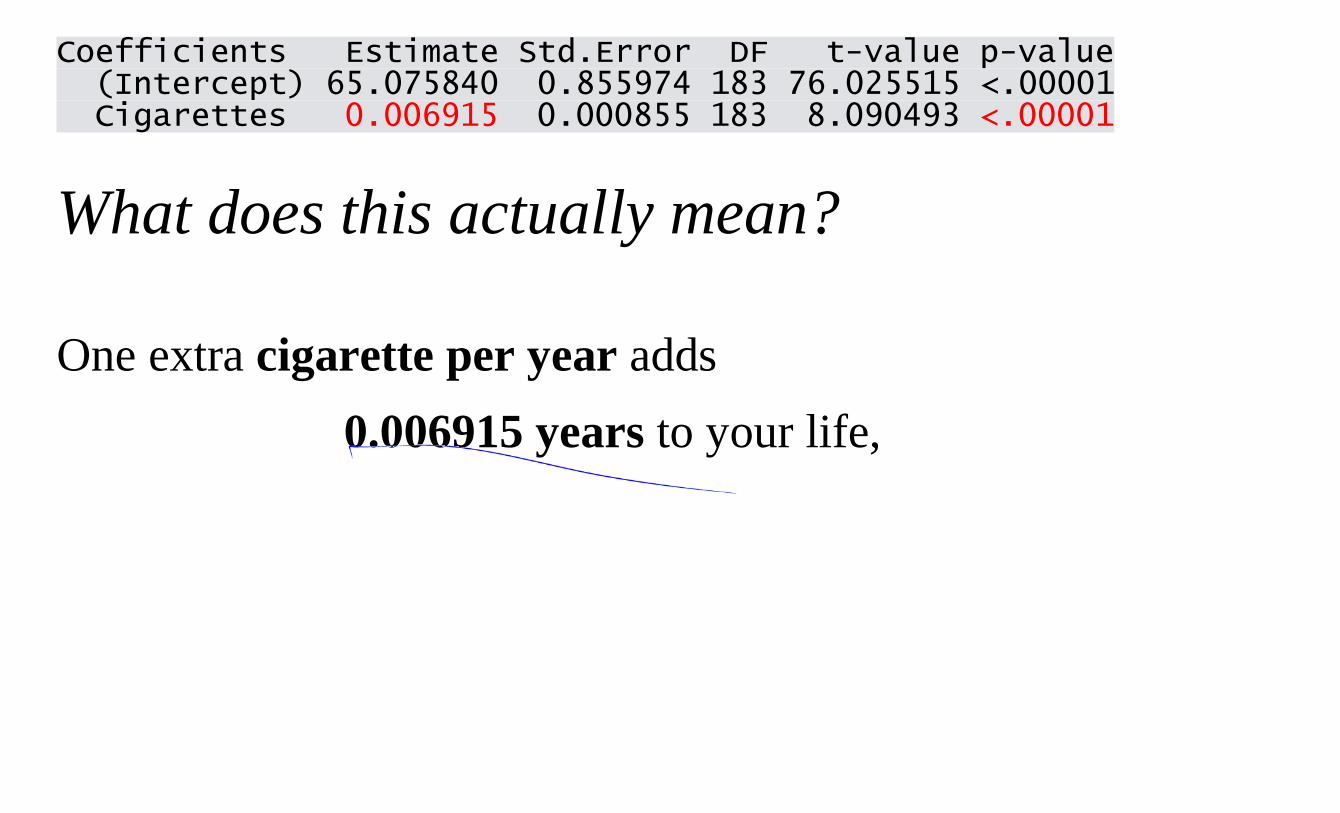
What does this actually mean?
One extra cigarette per year adds 0.006915 years to your life,
Coefficients Estimate Std.Error DF t-value p-value (Intercept) 65.075840 0.855974 183 76.025515 <.00001 Cigarettes 0.006915 0.000855 183 8.090493 <.00001
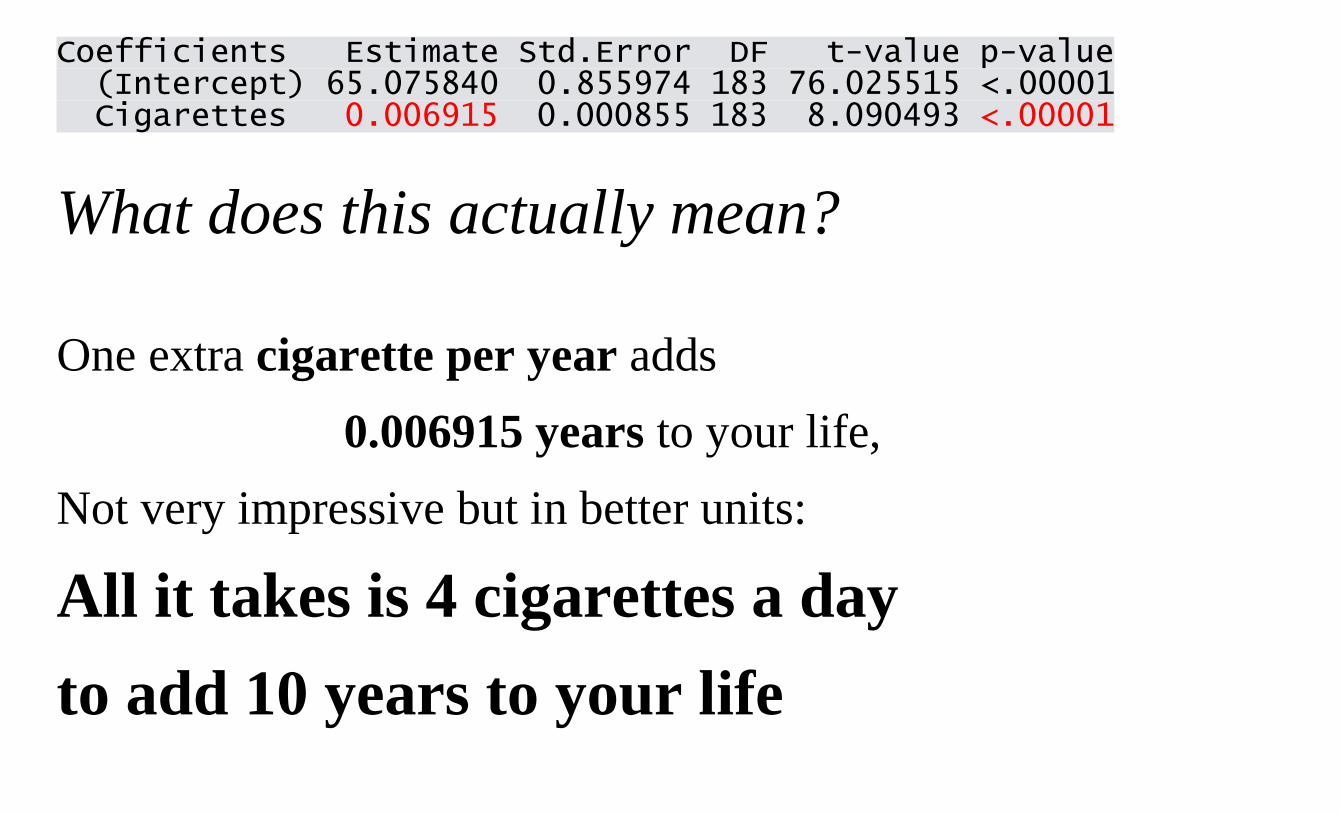
What does this actually mean?
One extra cigarette per year adds 0.006915 years to your life,
Not very impressive but in better units:
All it takes is 4 cigarettes a day to add 10 years to your life
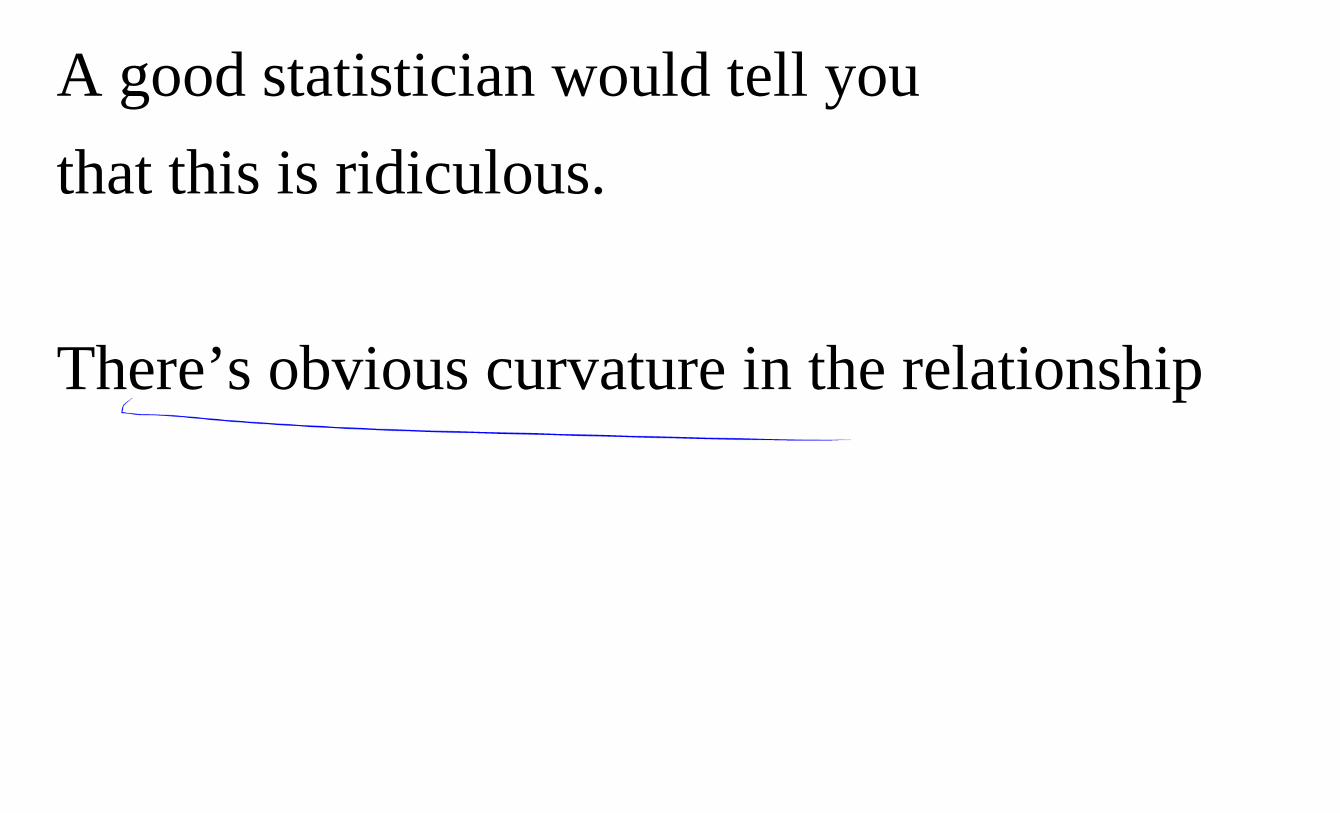
A good statistician would tell you that this is ridiculous. There’s obvious curvature in the relationship
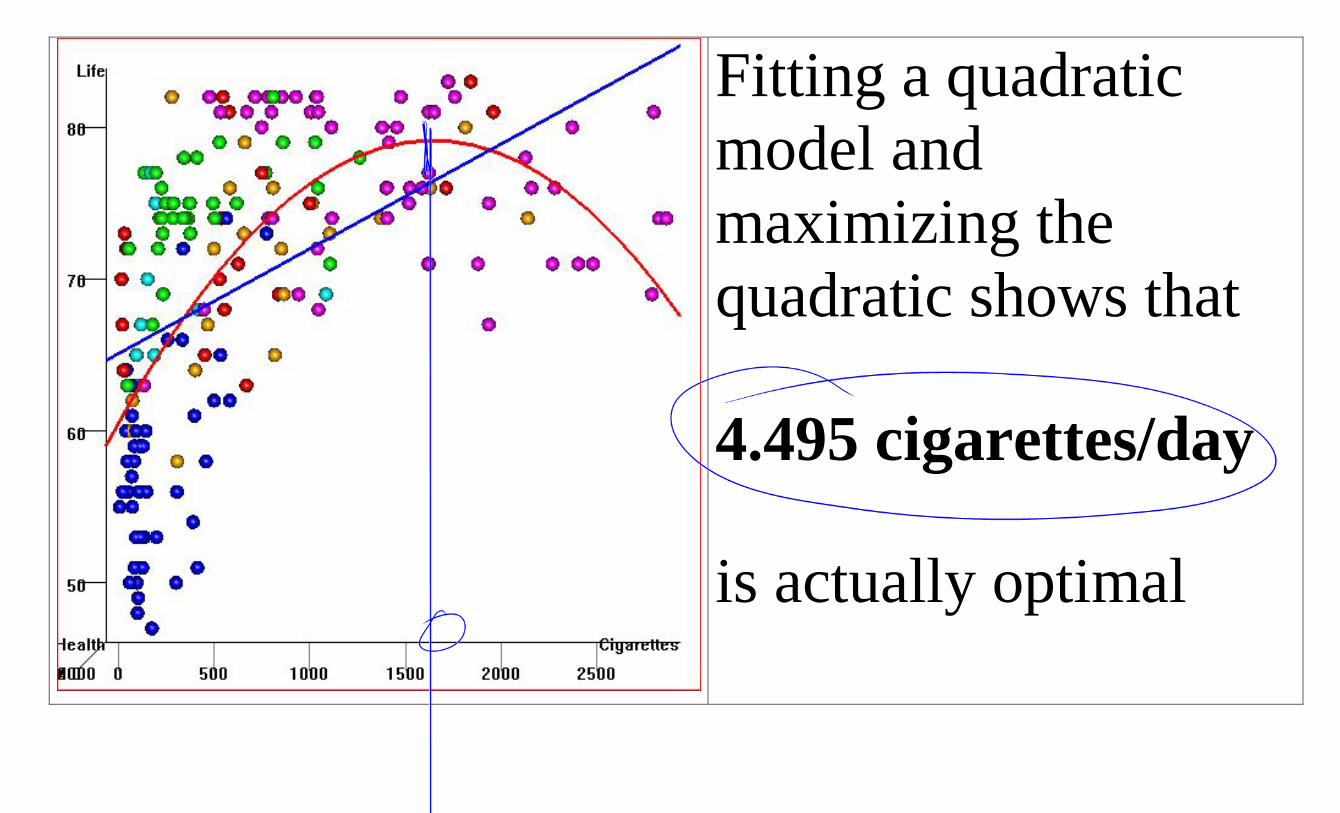
Fitting a quadratic model and maximizing the quadratic shows that
4.495 cigarettes/day
is actually optimal
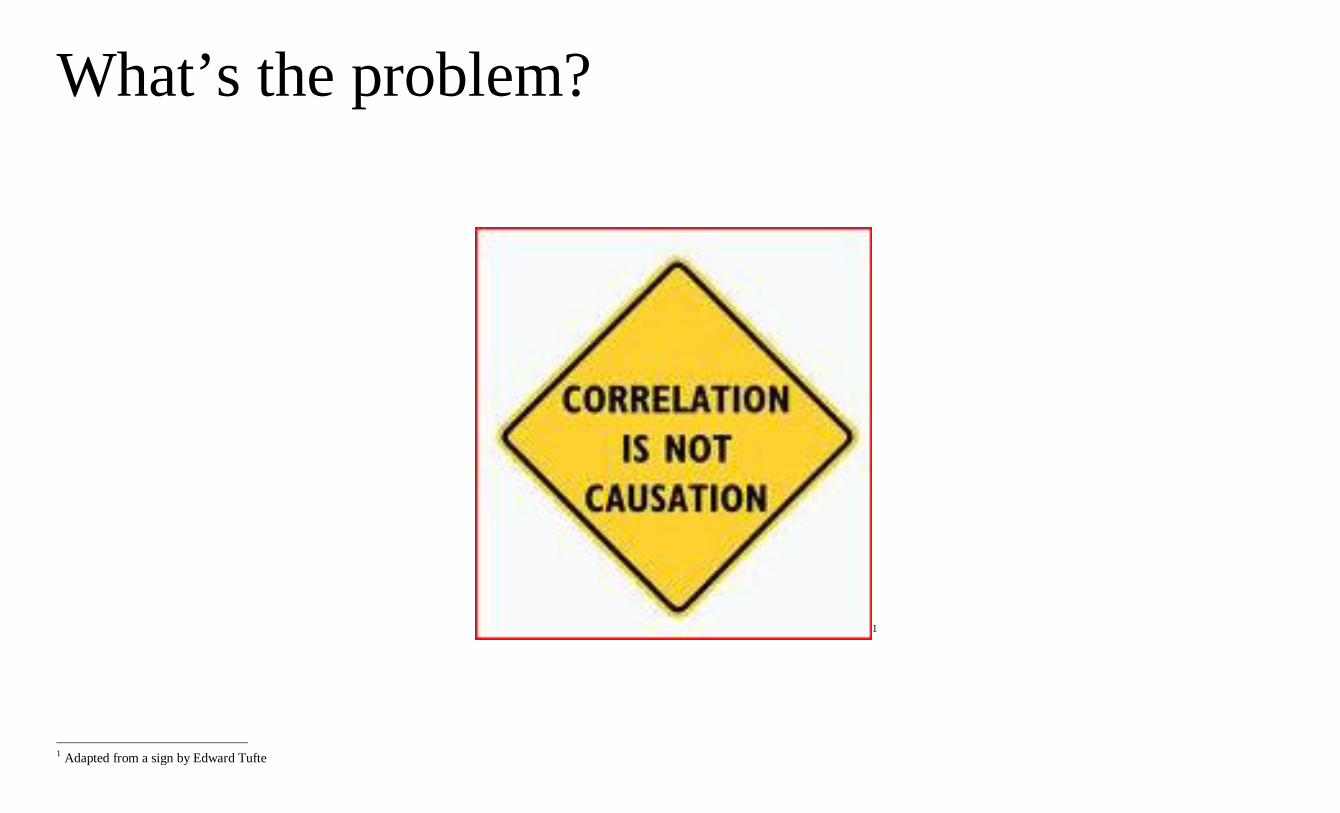
What’s the problem?
1
1 Adapted from a sign by Edward Tufte
Maybe it isn’t smoking that’s responsible for higher life expectancies.
Maybe it's something else –a CONFOUNDING VARIABLE (also called a "LURKING VARIABLE" or "LURKING FACTOR") that causes BOTHhigher life expectancies and higher rates of smoking.
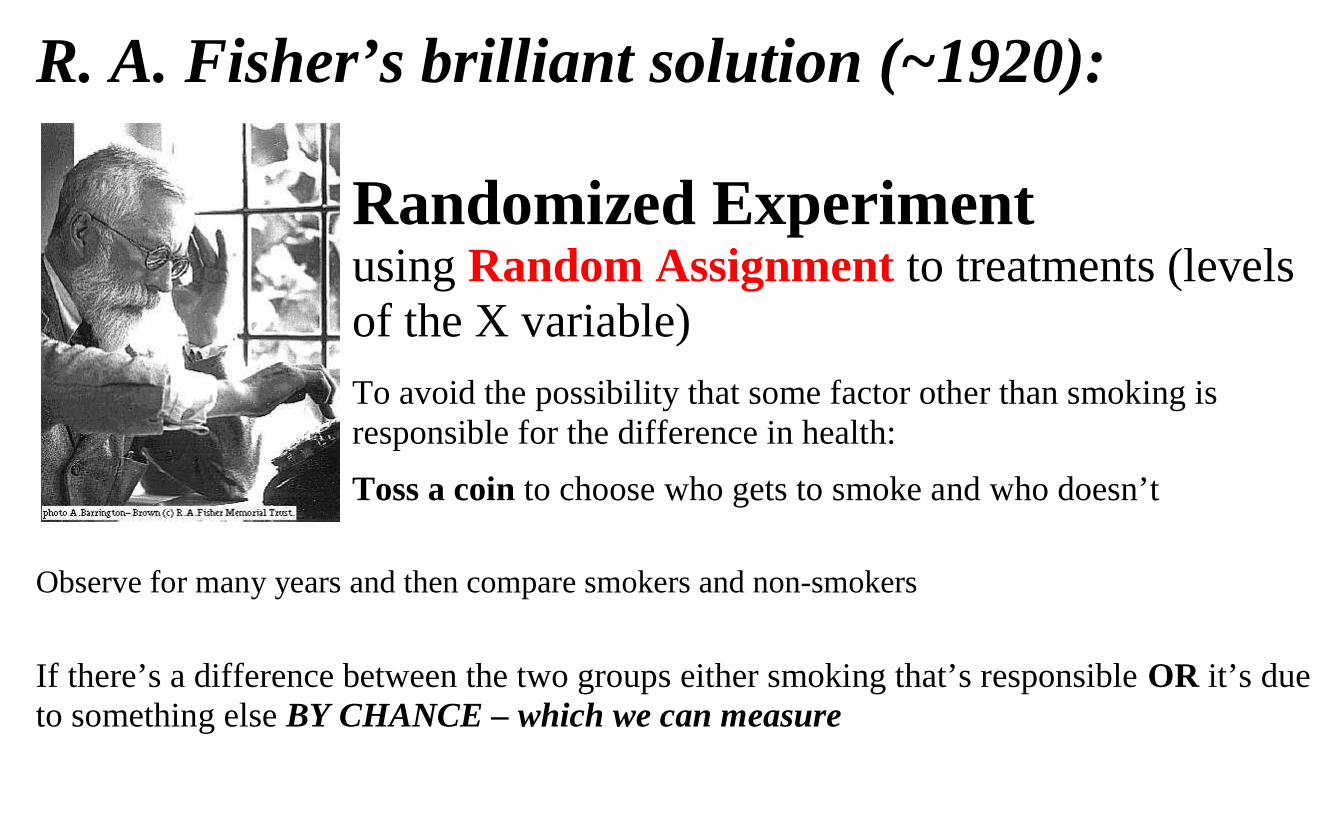
R. A. Fisher’s brilliant solution (~1920): Randomized Experiment using Random Assignment to treatments (levels of the X variable)
To avoid the possibility that some factor other than smoking is responsible for the difference in health:
Toss a coin to choose who gets to smoke and who doesn’t
Observe for many years and then compare smokers and non-smokers If there’s a difference between the two groups either smoking that’s responsible OR it’s due to something else BY CHANCE – which we can measure
If we compare a group of smokers with a group of non-smokers the two groups could be different in all sorts of ways other than the mere fact that one group smokes and the other doesn't. And these other differences could be responsible for differences in health.
Fisher's idea: Make sure the two groups are similar except for chance.
How? Take one group of willing subjects and RANDOMLY
ASSIGN 3 subject to the two ‘treatments’: one randomly selected group smokes for 20 years and the other does not.
3 There are many ways of doing this but the idea is that a RANDOM mechanism, e.g coin flip or random number generator, must be used somewhere.
Should we only use experimental data to determine whether X causes Y?
Problems with experimental data: - too costly - too risky - too long - subjects who are willing and available may not be typical of
target population - observational data already on hand so let's use it - won't give an answer until it's too late - experimental situation not realistic - we can only tell whether assignment to treatment groups
makes a difference. What if subjects don’t comply?
For example: clinical trials are used to assess the effectivenes of drugs but not useful to discover possible rare side-effects. These need to be monitored with observational data when the drug is being used. "Second best" method for causal inference:
Use observational data with care How?
Use observational data and try to control for the possible effects of a confounding factor(s) by measuring it and
1) Analyzing each stratum with similar values for the confounding factor(s). This is called stratification.
OR 2) Building a statistical model in that includes the confounding factor(s) and using multiple regression.
OR 3) Use new advanced methods: propensity score matching,
discontinuity models, etc.
This are no perfect solutions and they all require judgment to assess studies based on these methods: Problems:
1) The confounding factor may be known but may be measured with error so that it is not fully controlled. 2) Some important confounding factors might not be known.
Note that these are NOT problems for randomized experiments.
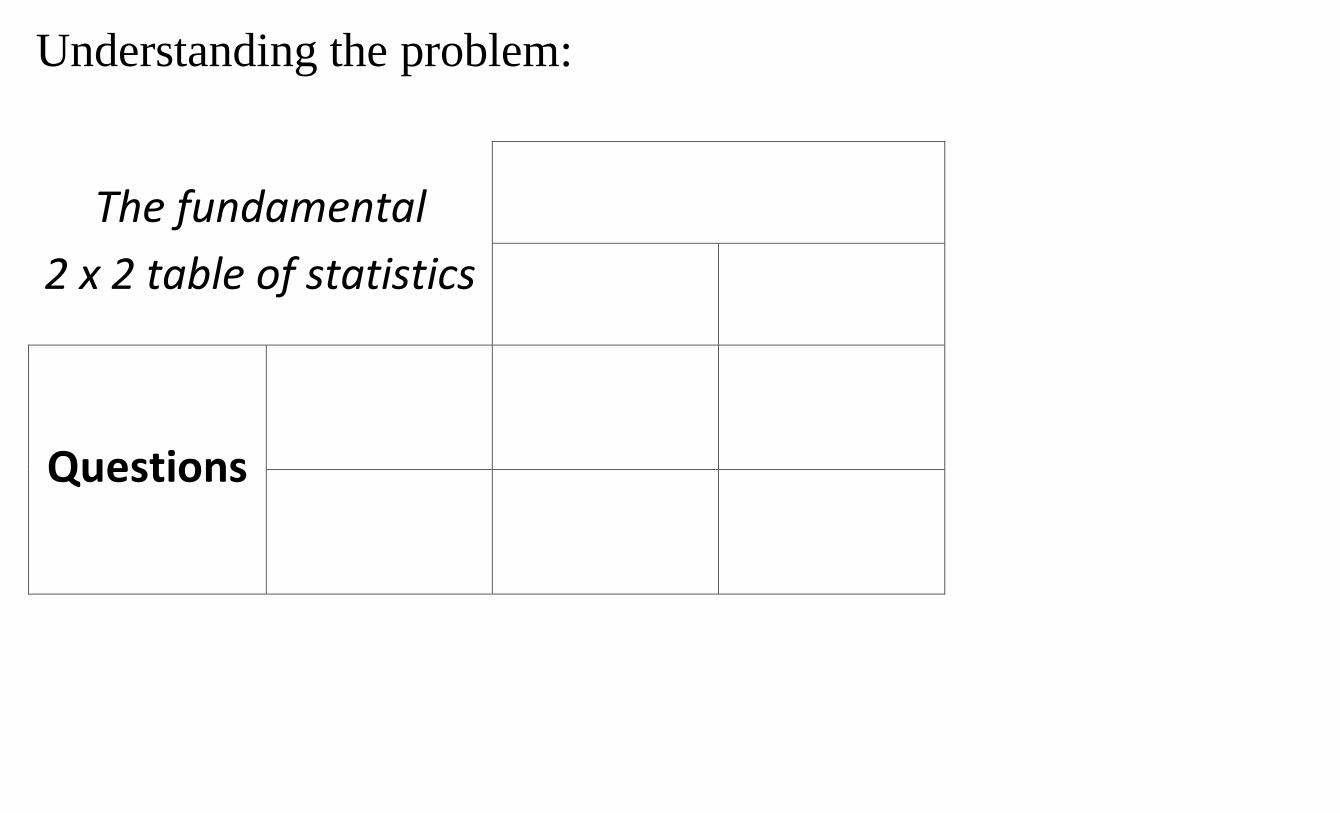
Understanding the problem:
The fundamental 2 x 2 table of statistics
Questions
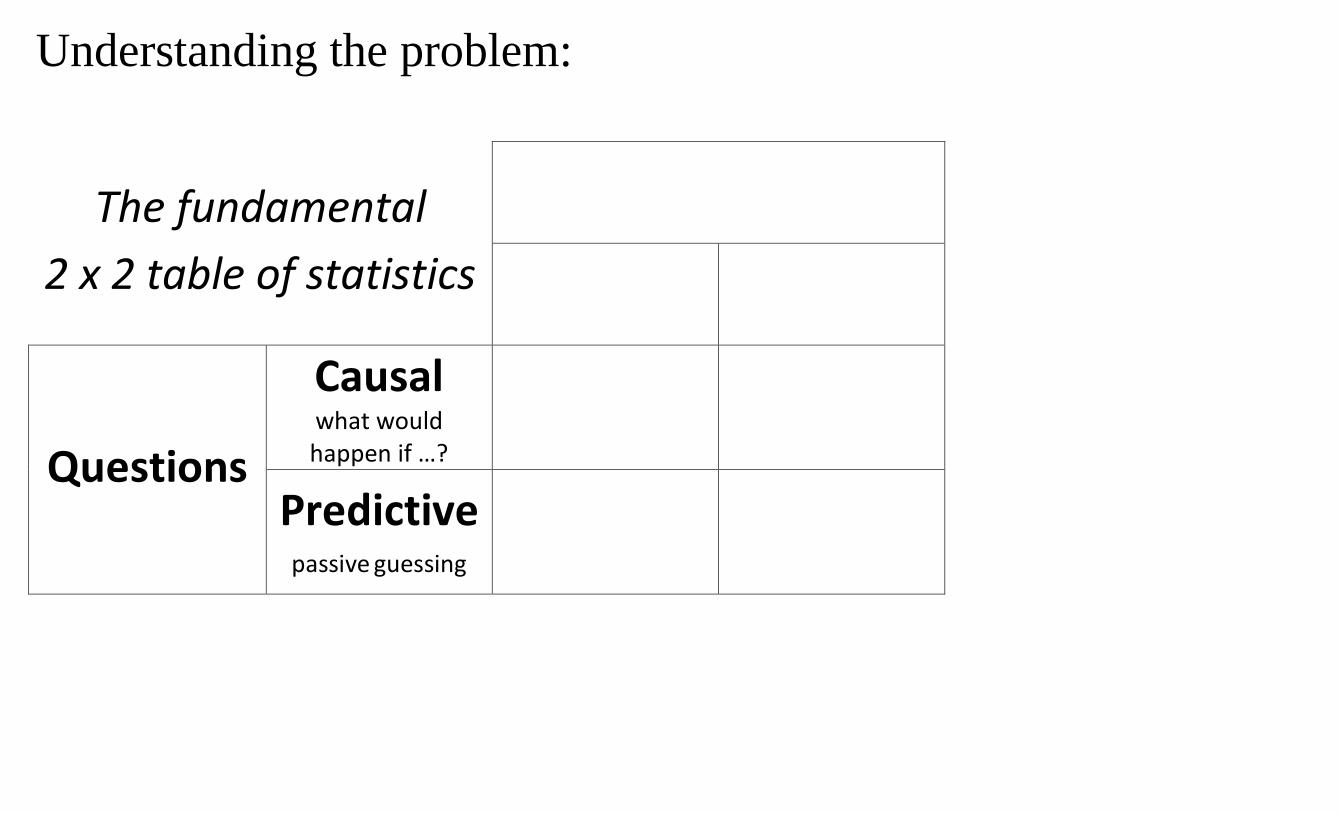
Understanding the problem:
The fundamental 2 x 2 table of statistics
Questions
Causal what would happen if …?
Predictive
passive guessing
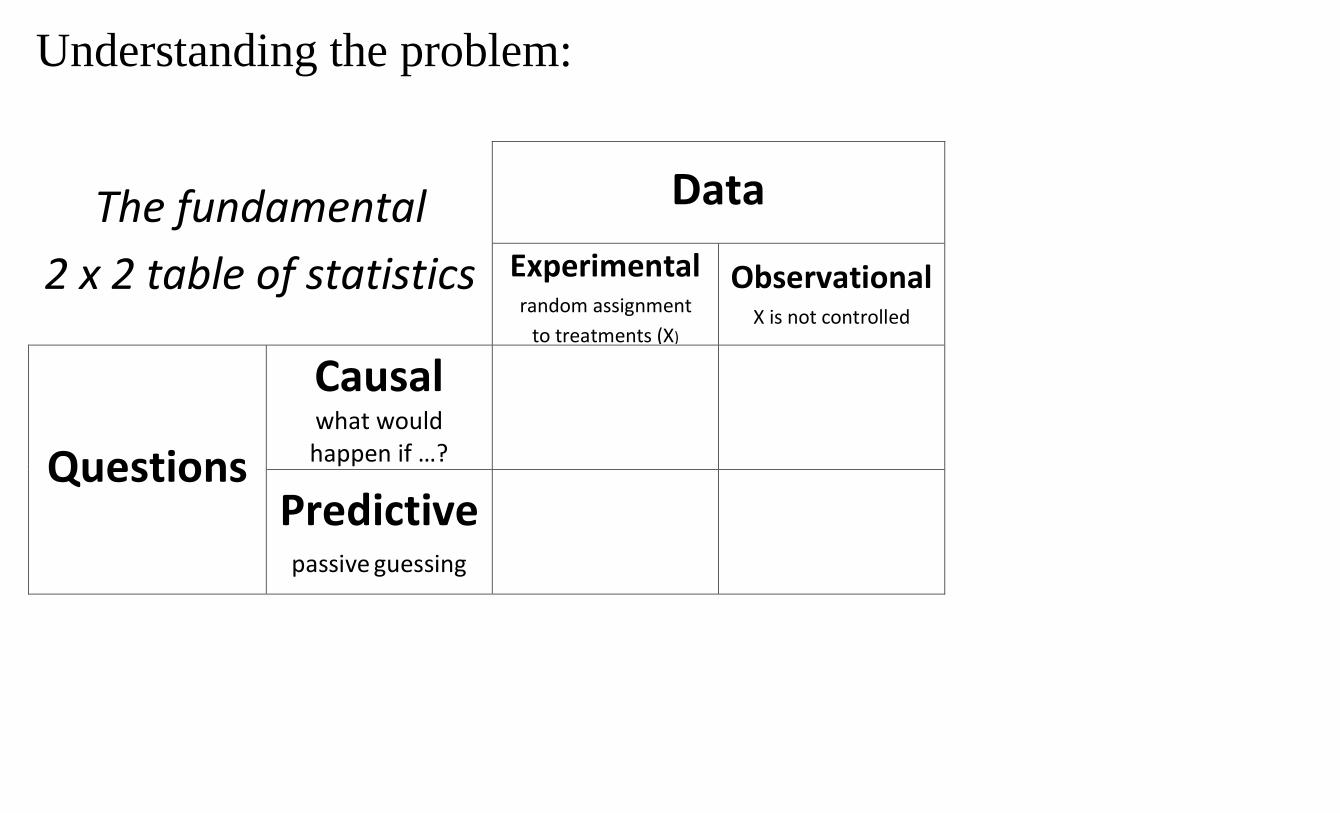
Understanding the problem:
The fundamental 2 x 2 table of statistics
Data Experimental
random assignment to treatments (X)
Observational X is not controlled
Questions
Causal what would happen if …?
Predictive
passive guessing
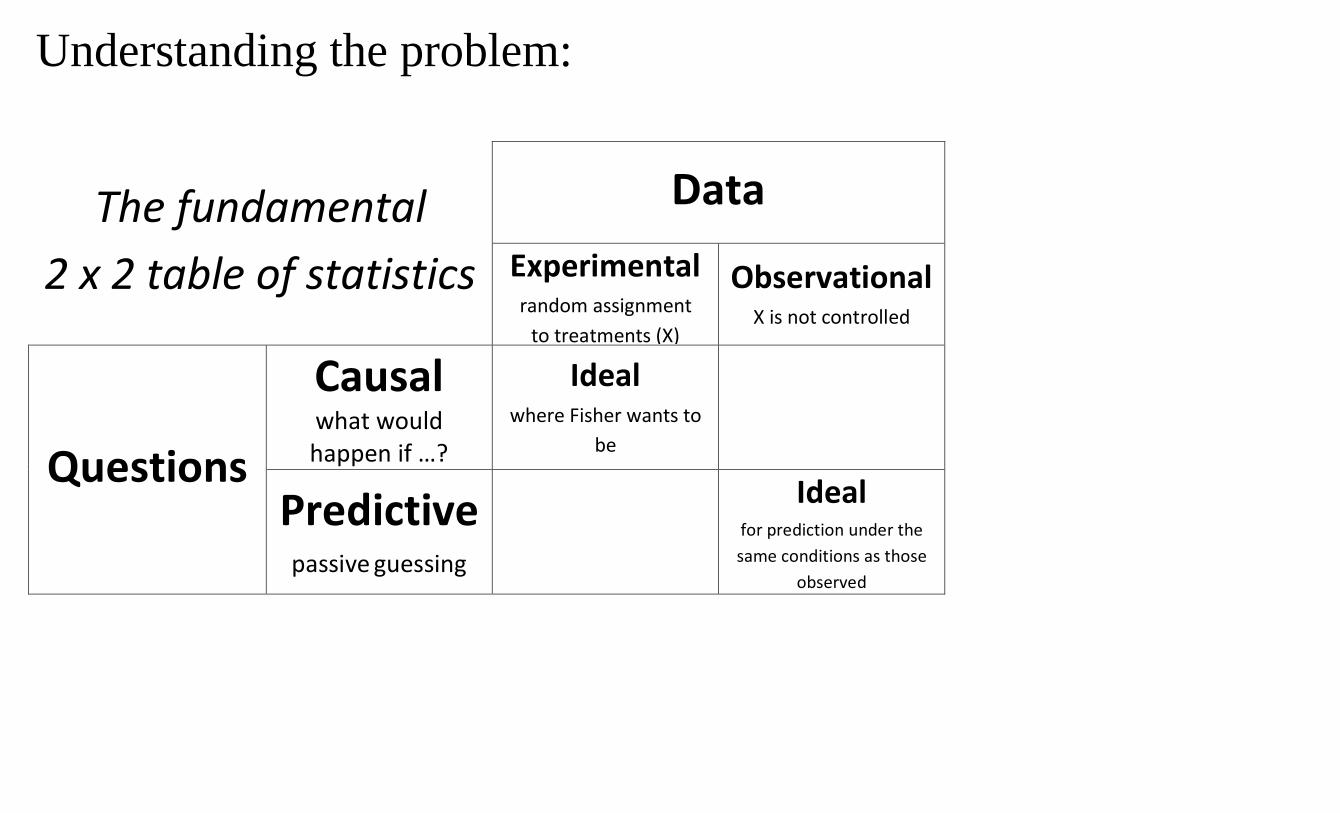
Understanding the problem:
The fundamental 2 x 2 table of statistics
Data Experimental
random assignment to treatments (X)
Observational X is not controlled
Questions
Causal what would happen if …?
Ideal
where Fisher wants to be
Predictive
passive guessing
Ideal for prediction under the same conditions as those
observed
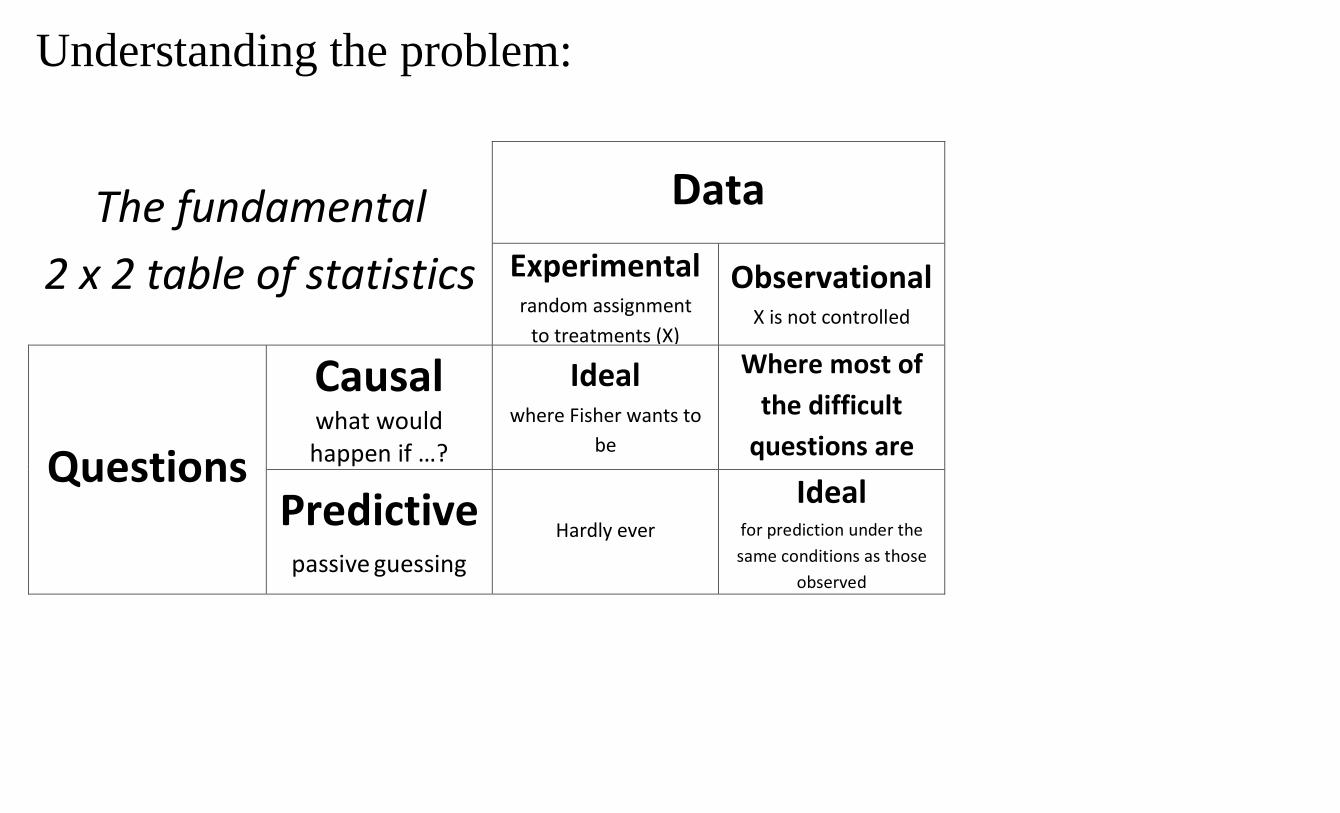
Understanding the problem:
The fundamental 2 x 2 table of statistics
Data Experimental
random assignment to treatments (X)
Observational X is not controlled
Questions
Causal what would happen if …?
Ideal
where Fisher wants to be
Where most of the difficult
questions are
Predictive
passive guessing
Hardly ever
Ideal for prediction under the same conditions as those
observed
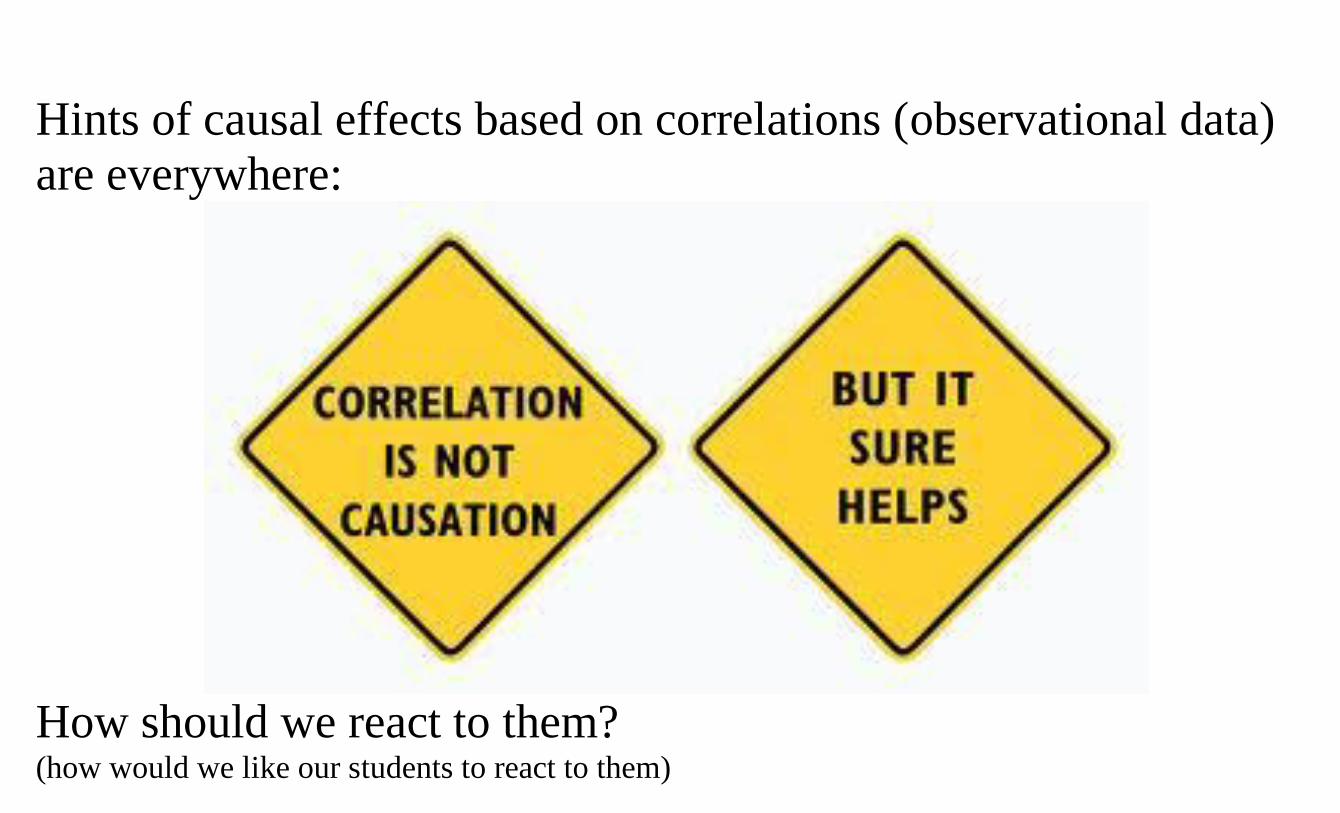
Hints of causal effects based on correlations (observational data) are everywhere:
How should we react to them? (how would we like our students to react to them)
How can we do better than Fisher? Should we even try?
Recent example in the news: People who use sunscreen lotion have a higher risk of skin cancer than people who don’t Should I stop using SSL?
How can we make wise decisions when faced with this kind of information? The solution to the problem involves asking questions more than finding answers! What question do we want to ask? Is the question causal or predictive?
What kind of data do we have? How were people assigned randomly to use more or less SSL? If the answer is yes, then we go on to ask more questions: Were the subjects like me? Did they comply with the random assignment?
If the answer is ‘not randomly’ then we need to think of possible confounding factors. Understanding these issues is important for simple everyday questions. But also for very large questions
Conjectures::
1. Most scientific and social controversies subsist on conflicting interpretations of evidence
2. Most conflicting interpretations of evidence are rooted in difficulties inferring causality from observational data
Caution: Taking a hard line “correlation is not causation” may be as problematic as seeing causation in every correlation.
Caution: Taking a hard line “correlation is not causation” may be as problematic as seeing causation in every correlation. For many important issues, we only have observational data. This is a major challenge for modern Statistics and for the interpretation of scientific evidence. We need to find a balance between extreme skepticism and extreme gullibility.
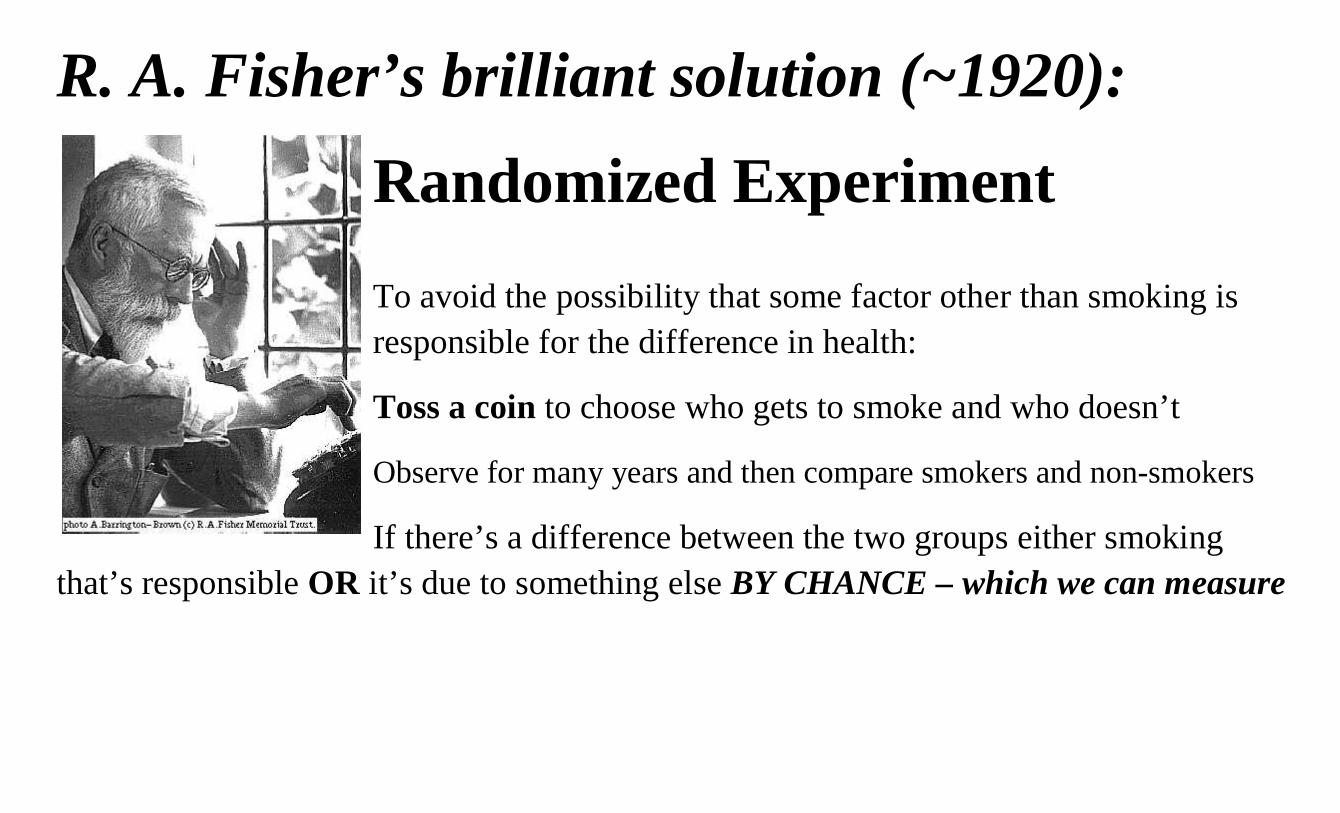
R. A. Fisher’s brilliant solution (~1920):
Randomized Experiment
To avoid the possibility that some factor other than smoking is responsible for the difference in health:
Toss a coin to choose who gets to smoke and who doesn’t
Observe for many years and then compare smokers and non-smokers
If there’s a difference between the two groups either smoking that’s responsible OR it’s due to something else BY CHANCE – which we can measure
What can it mean when a variable X (Smoking) is correlated (associated) with another variable Y (Life Expectancy) in a sample of data
If we compare a group of smokers with a group of non-smokers the two groups could be different in all sorts of ways other than the mere fact that one group smokes and the other doesn't. And these other differences could be responsible for differences in health.
Fisher's idea: Make sure the two groups are similar except for chance. Take one group of willing subjects and RANDOMLY1 split them into two groups: one group smokes for 20 years and the other does not. At the end of 20 years, if one group is healthier than the other it's due to having been allocated to the smoking or to the non-smoking group or it could be due to other differences in the two
1 There are many ways of doing this but the idea is that a RANDOM mechanism, e.g coin flip or random number generator, must be used somewhere.
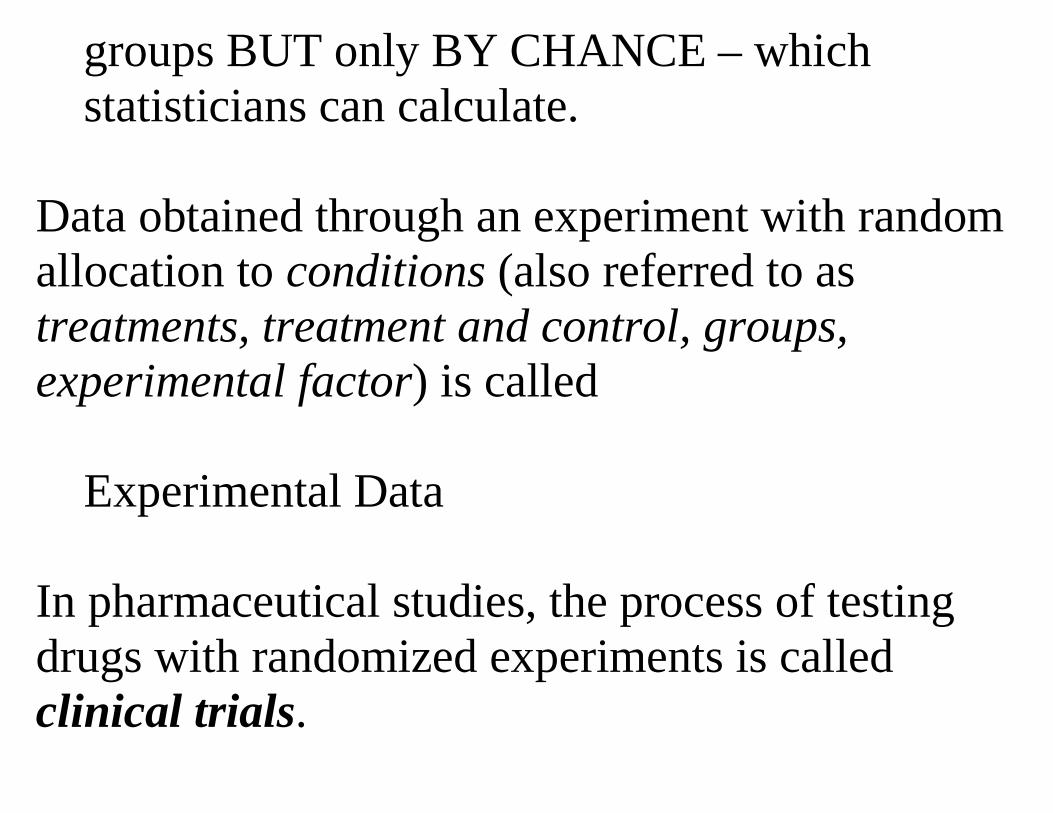
groups BUT only BY CHANCE – which statisticians can calculate.
Data obtained through an experiment with randomallocation to conditions (also referred to as treatments, treatment and control, groups, experimental factor) is called Experimental Data
In pharmaceutical studies, the process of testing drugs with randomized experiments is called clinical trials.
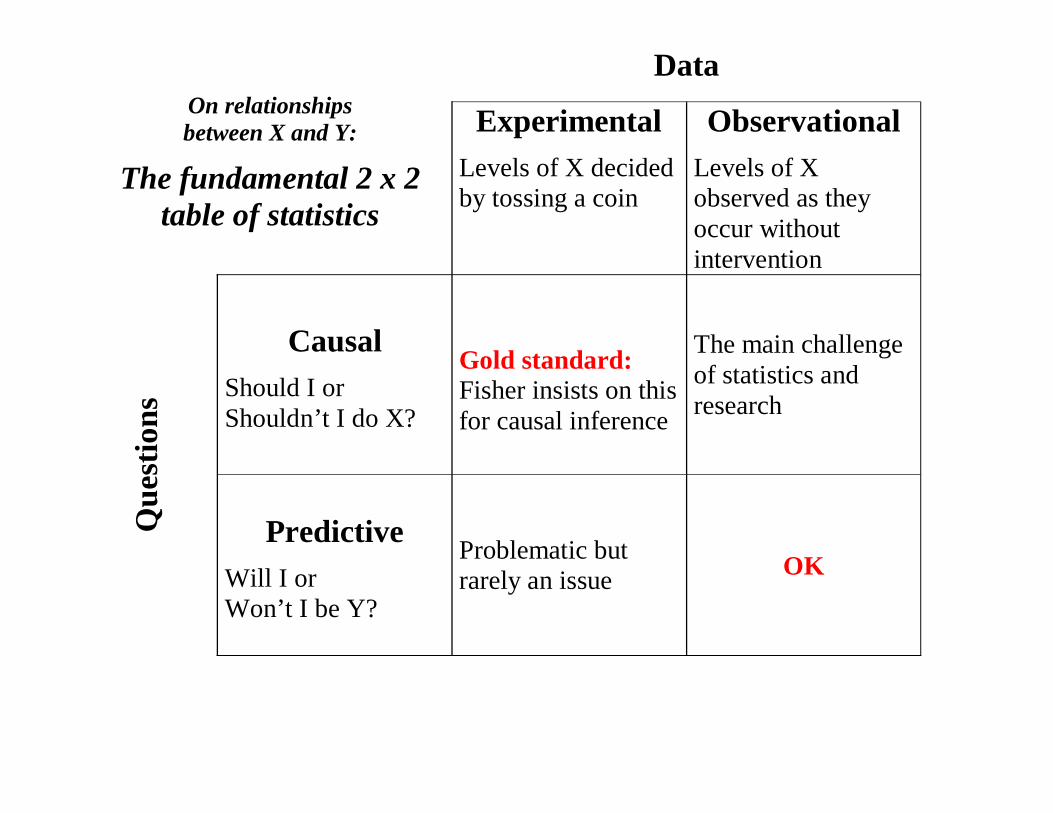
On relationships between X and Y:
The fundamental 2 x 2 table of statistics
Data
ExperimentalLevels of X decided by tossing a coin
ObservationalLevels of X observed as they occur without intervention
Que
stio
ns
CausalShould I or Shouldn’t I do X?
Gold standard:Fisher insists on this for causal inference
The main challenge of statistics and research
PredictiveWill I or Won’t I be Y?
Problematic but rarely an issue OK

DavidHealytakesGoldacre’sargumentonestepfurtherandquestionswhetherrelyingClinicalTrialscangiveustheanswersweneed.
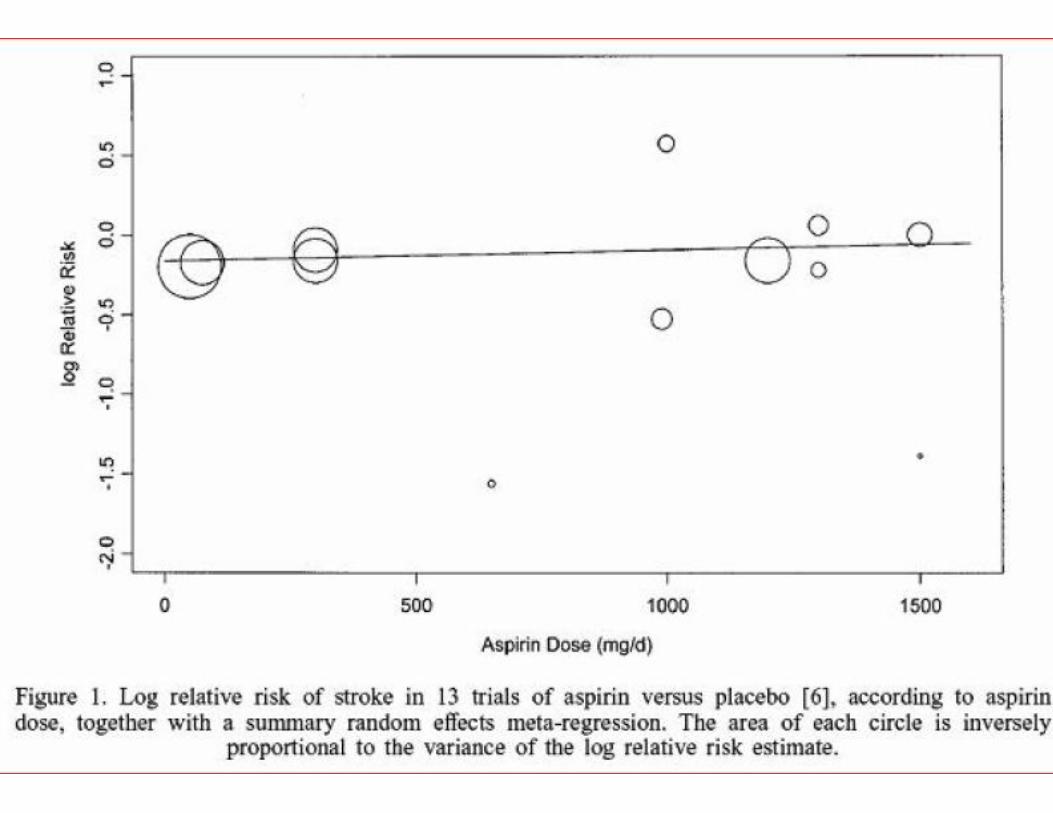
Metaanalysis:Combininginformationfrommanystudies


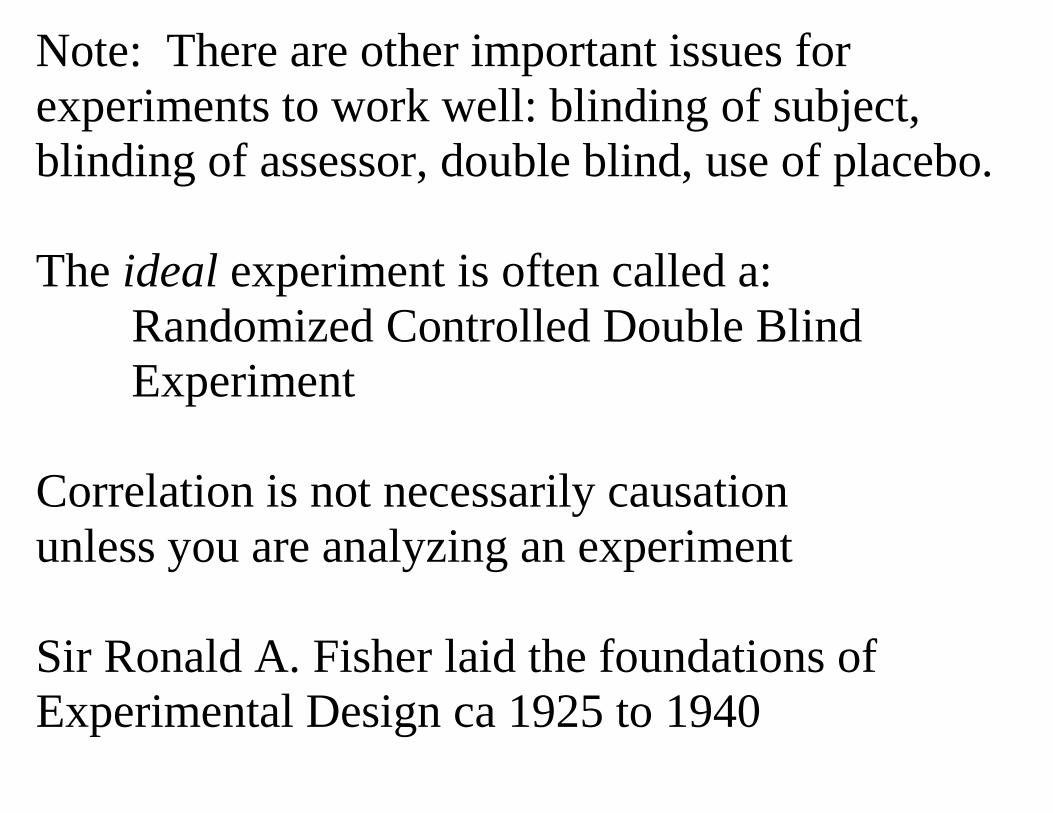
Note: There are other important issues for experiments to work well: blinding of subject, blinding of assessor, double blind, use of placebo. The ideal experiment is often called a:
Randomized Controlled Double Blind Experiment
Correlation is not necessarily causationunless you are analyzing an experiment
Sir Ronald A. Fisher laid the foundations of Experimental Design ca 1925 to 1940
Fisher insisted that only an experiment can determine whether X causes Y. He went so far as to defend tobacco companies in the 50s because there was no experimental evidence that tobacco was harmful, only "observational data". With observational data, X is not controlled by the experimenter. It is just observed as it happens to have been determined naturally. For example, by personal choice to smoke or not smoke.
Should we only use experimental data to determine whether X causes Y?
Problems with experimental data: - too costly - too risky - too long- subjects who are willing and available may
not be typical of target population- observational data already on hand so let's
use it- won't give an answer until it's too late- experimental situation not realistic
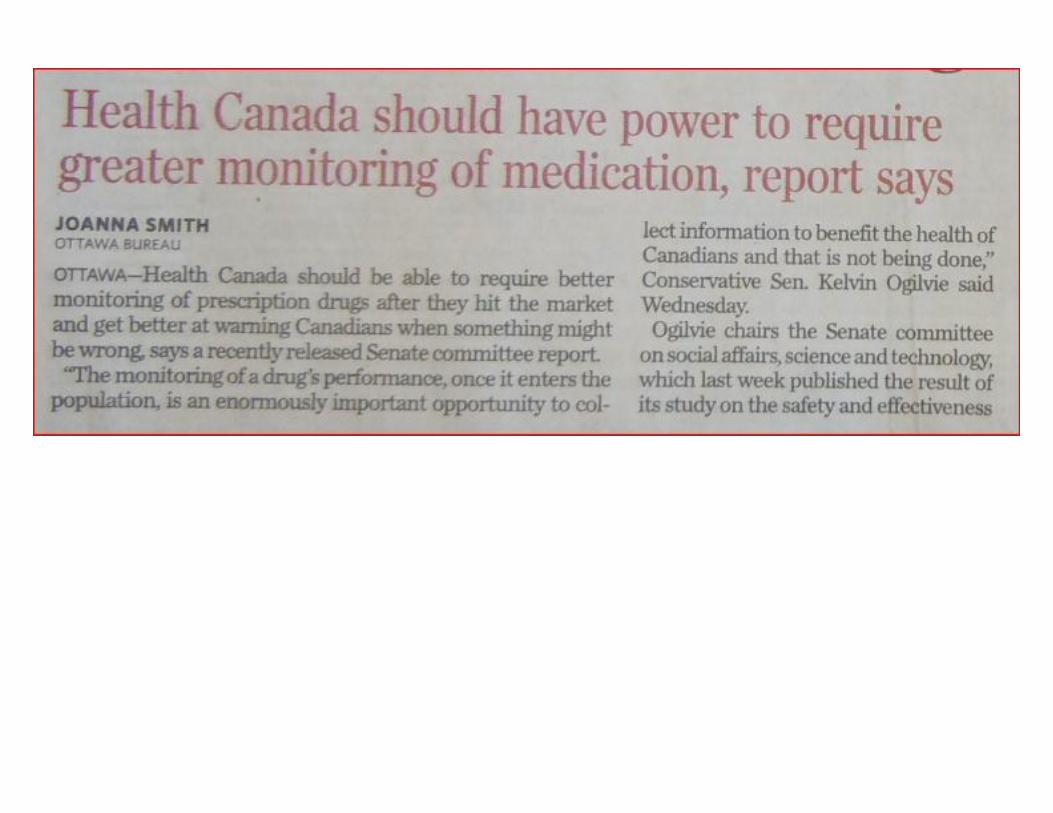
For example: clinical trials are used to assess the effectivenes of drugs but not useful to discover possible rare side-effects. These need to be monitored with observational data when the drug is being used.
"Second best" method for causal inference:
Use observational data with care
How?
Use observational data and try to control for the possible effects of a confounding factor(s) by measuring it and
1) Analyzing each stratum with similar values for the confounding factor(s). This is called stratification.
OR2) Building a statistical model in that includes the confounding factor(s) and using multiple regression.
This is not a perfect solutions and judgment must be used in applying it and in assessing studies based on these methods:Problems:
1) The confounding factor may be known but may be measured with error so that it is not fully controlled. 2) Some important confounding factors might not be known.
Note that these are NOT problems for randomized experiments.
Why does choosing treatments at random work?
The fundamental 2 x 2 table of statistics:
Caution: Taking a hard line “correlation is not causation” may be as problematic as seeing causation in every correlation.
Caution: Taking a hard line “correlation is not causation” may be as problematic as seeing causation in every correlation. For many important issues, we only have observational data.
This is a major challenge for modern Statistics and for the interpretation of scientific evidence
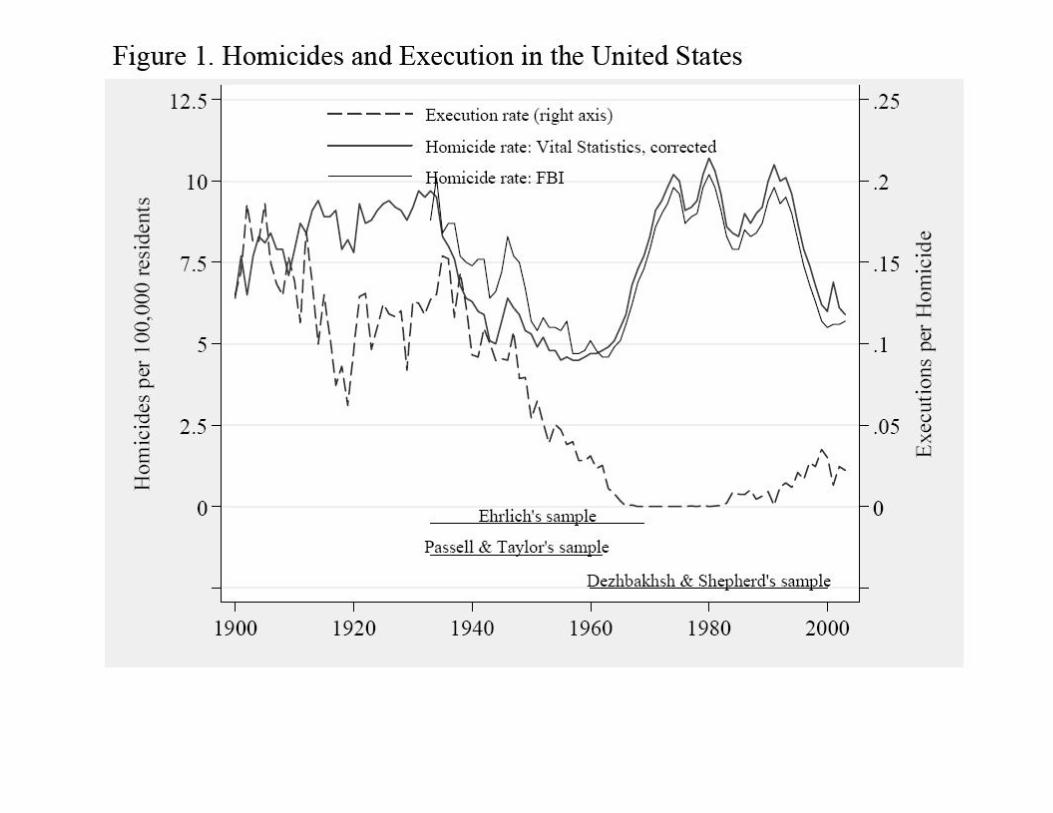
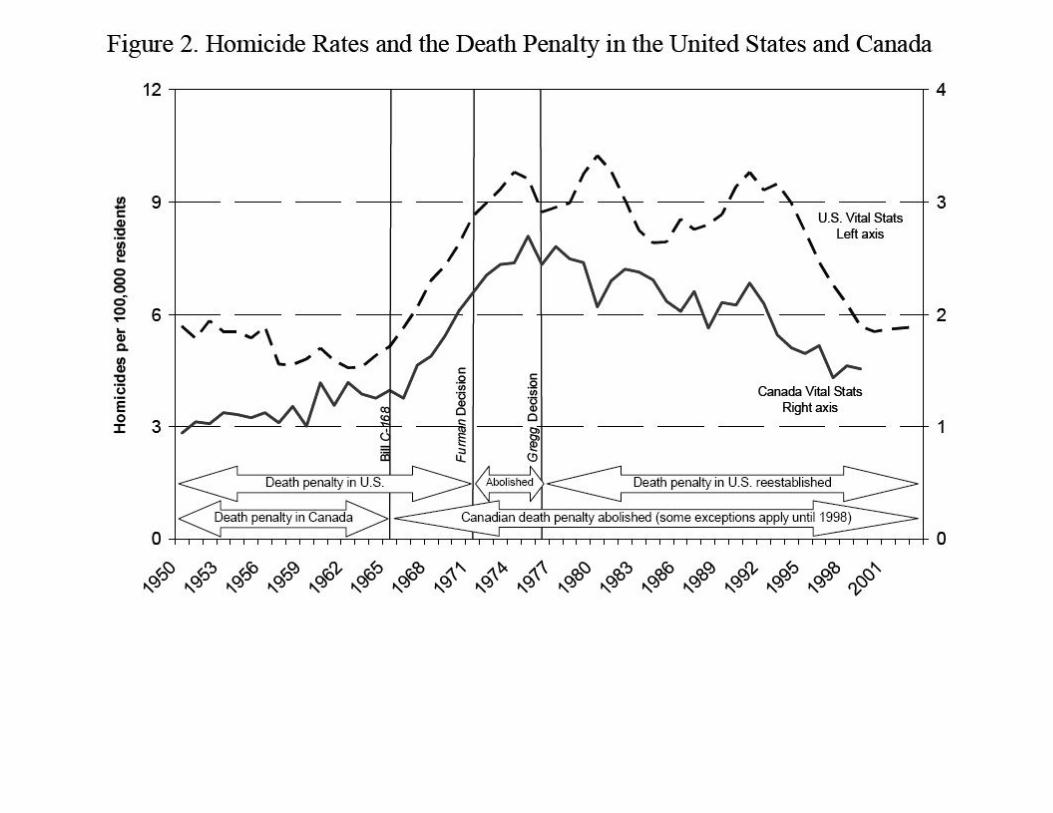
EXAMPLES Public policy: Fighting crime:
Does capital punishment work.

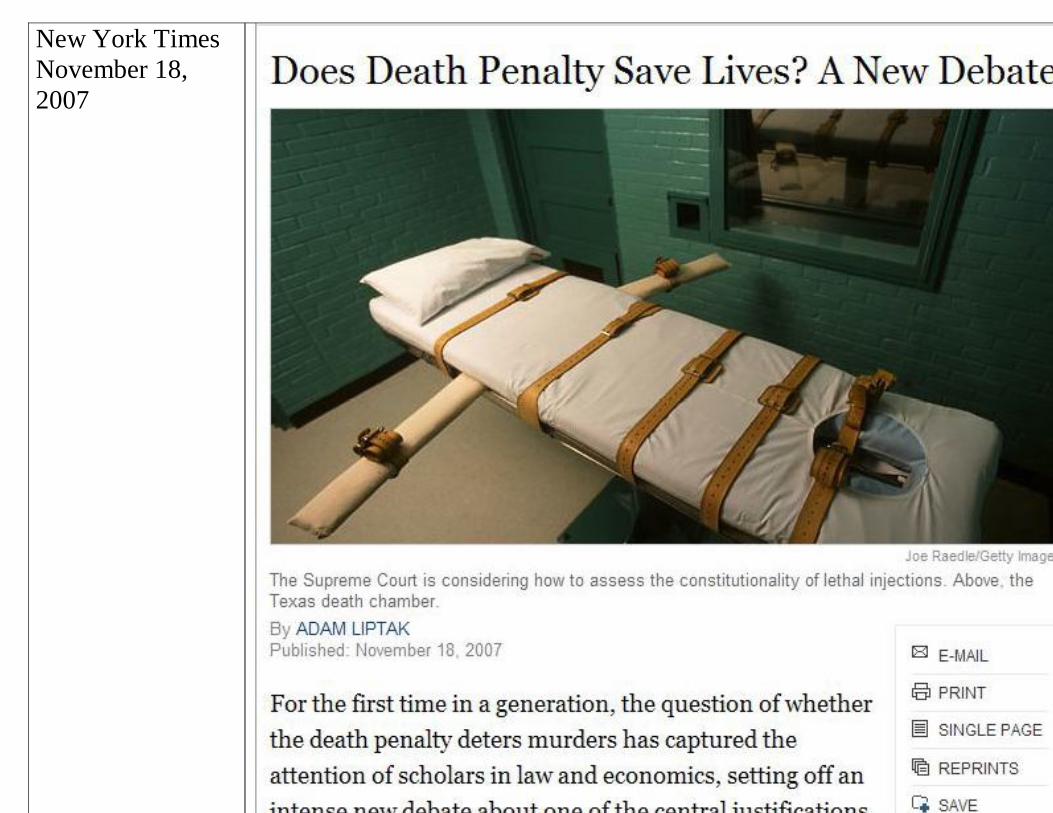
New York TimesNovember 18, 2007
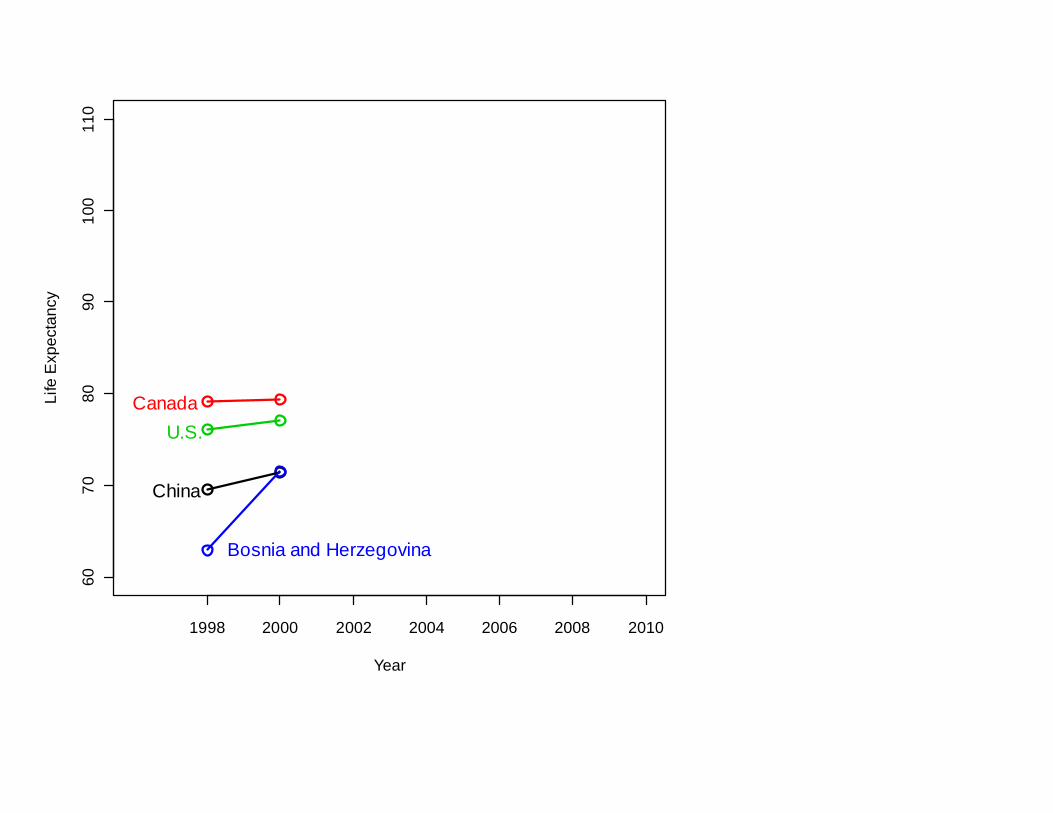
Another common way of thinking that can mislead:
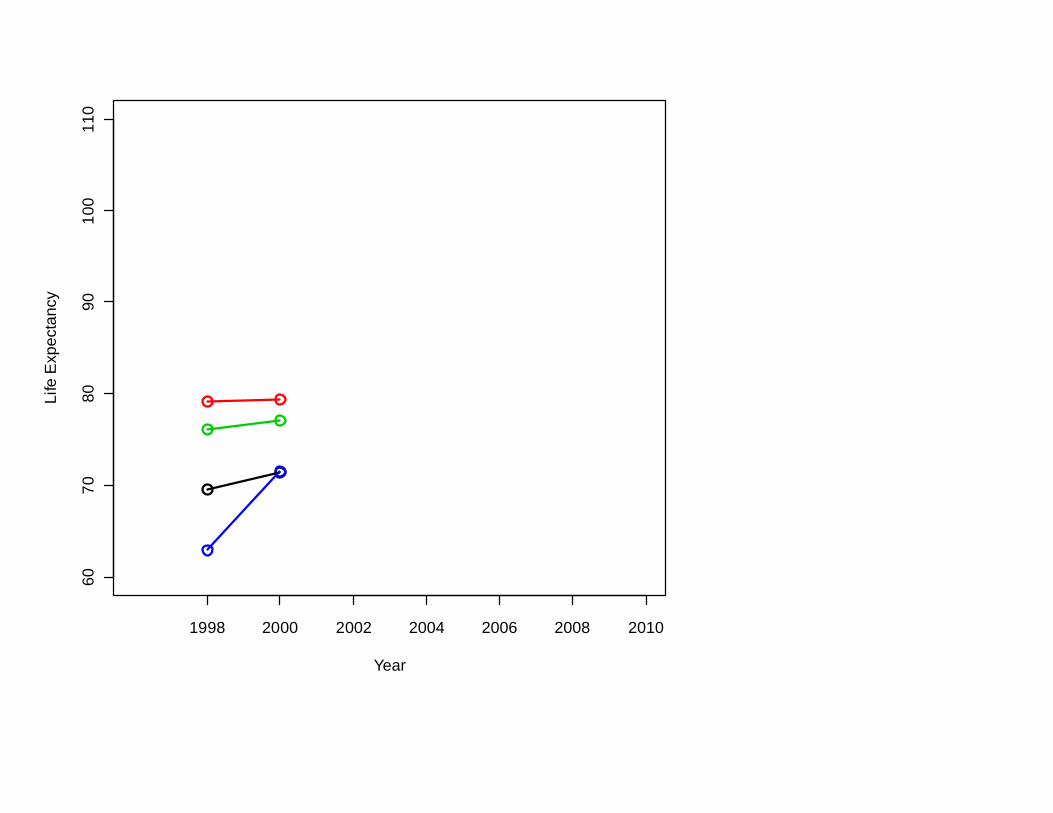
1998 2000 2002 2004 2006 2008 2010
6070
8090
100
110
Year
Life
Exp
ecta
ncy
1998 2000 2002 2004 2006 2008 2010
6070
8090
100
110
Year
Life
Exp
ecta
ncy
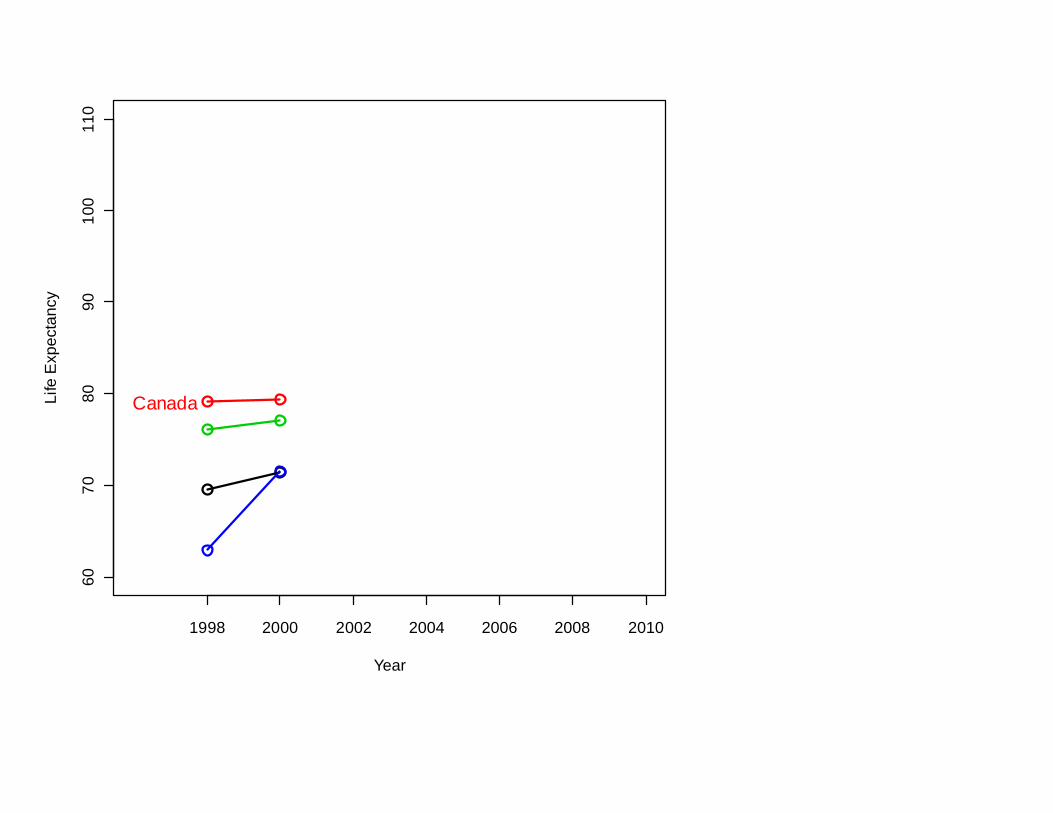
Canada
1998 2000 2002 2004 2006 2008 2010
6070
8090
100
110
Year
Life
Exp
ecta
ncy
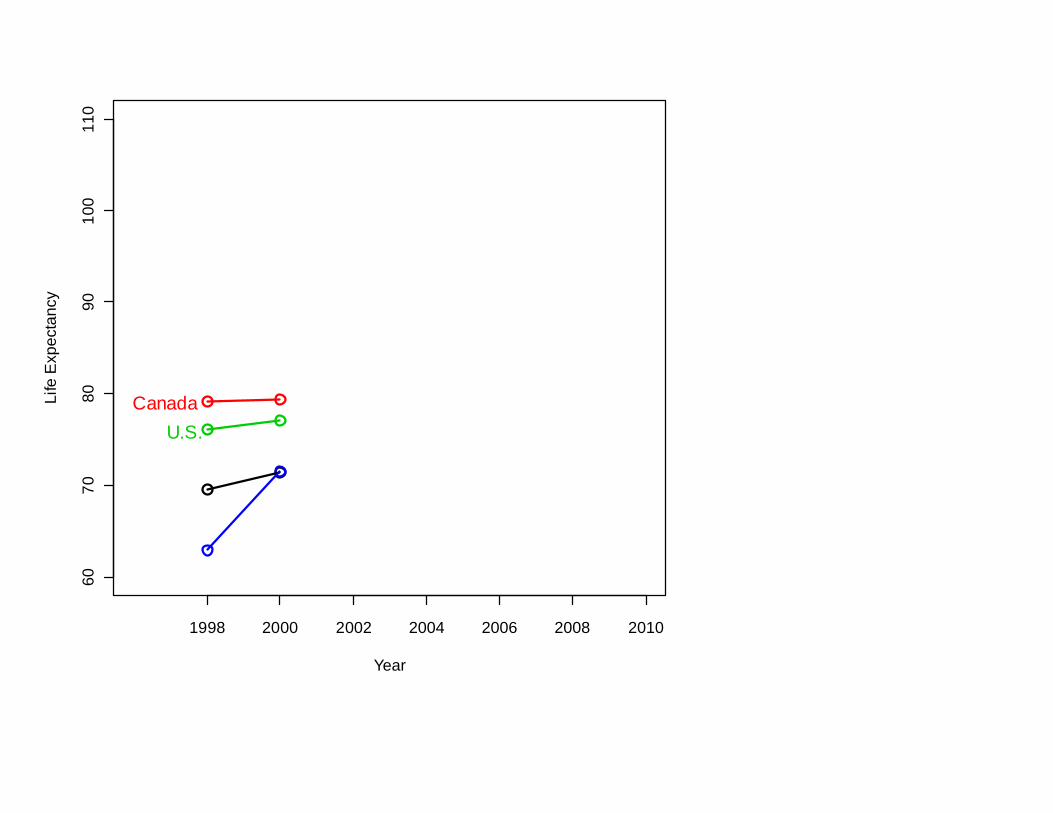
CanadaU.S.
1998 2000 2002 2004 2006 2008 2010
6070
8090
100
110
Year
Life
Exp
ecta
ncy
CanadaU.S.
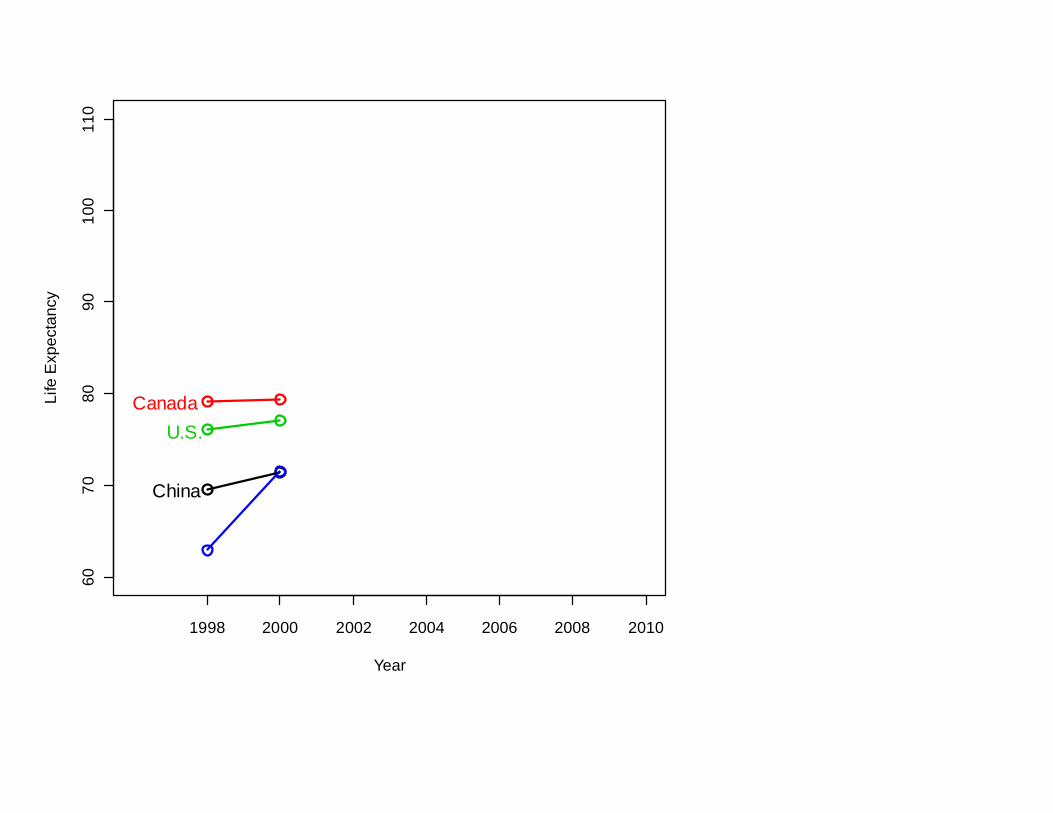
China
1998 2000 2002 2004 2006 2008 2010
6070
8090
100
110
Year
Life
Exp
ecta
ncy
CanadaU.S.
China
Bosnia and Herzegovina
1998 2000 2002 2004 2006 2008 2010
6070
8090
100
110
Year
Life
Exp
ecta
ncy
CanadaU.S.
China
Bosnia and Herzegovina

So: To have a very long life,
move to Bosnia-Herzegovina
1998 2000 2002 2004 2006 2008 2010
6070
8090
100
110
Year
Life
Exp
ecta
ncy
CanadaU.S.
China
Bosnia and Herzegovina
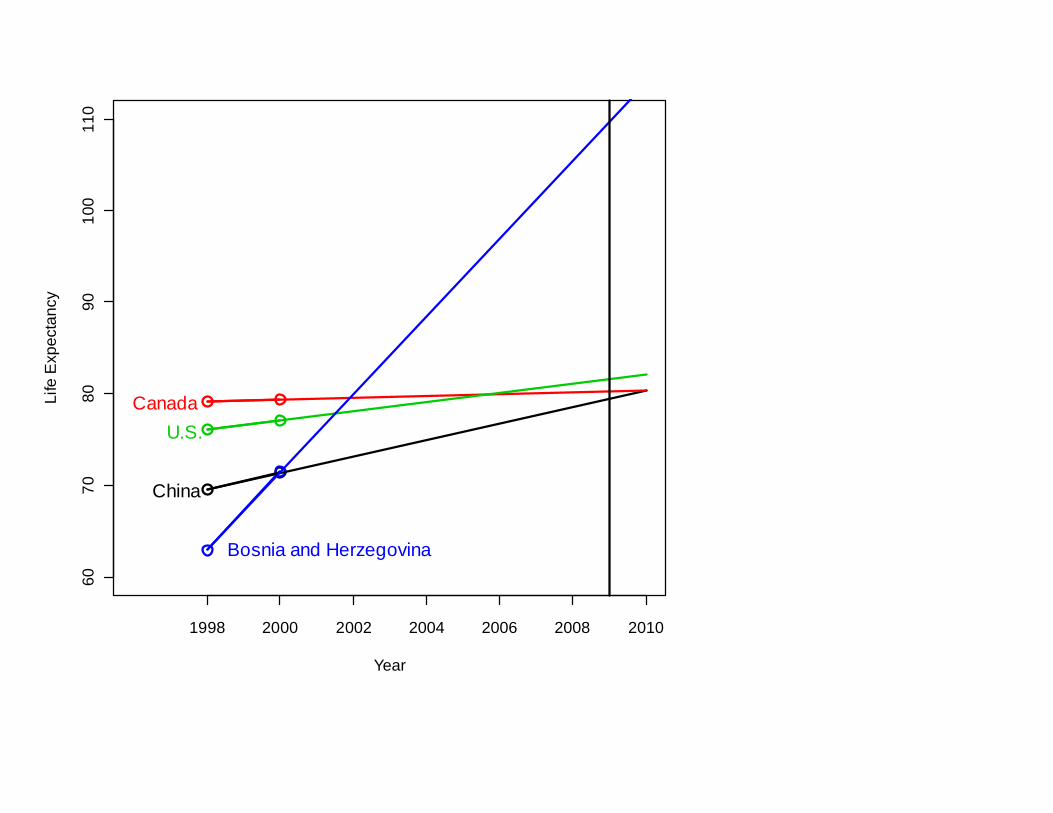
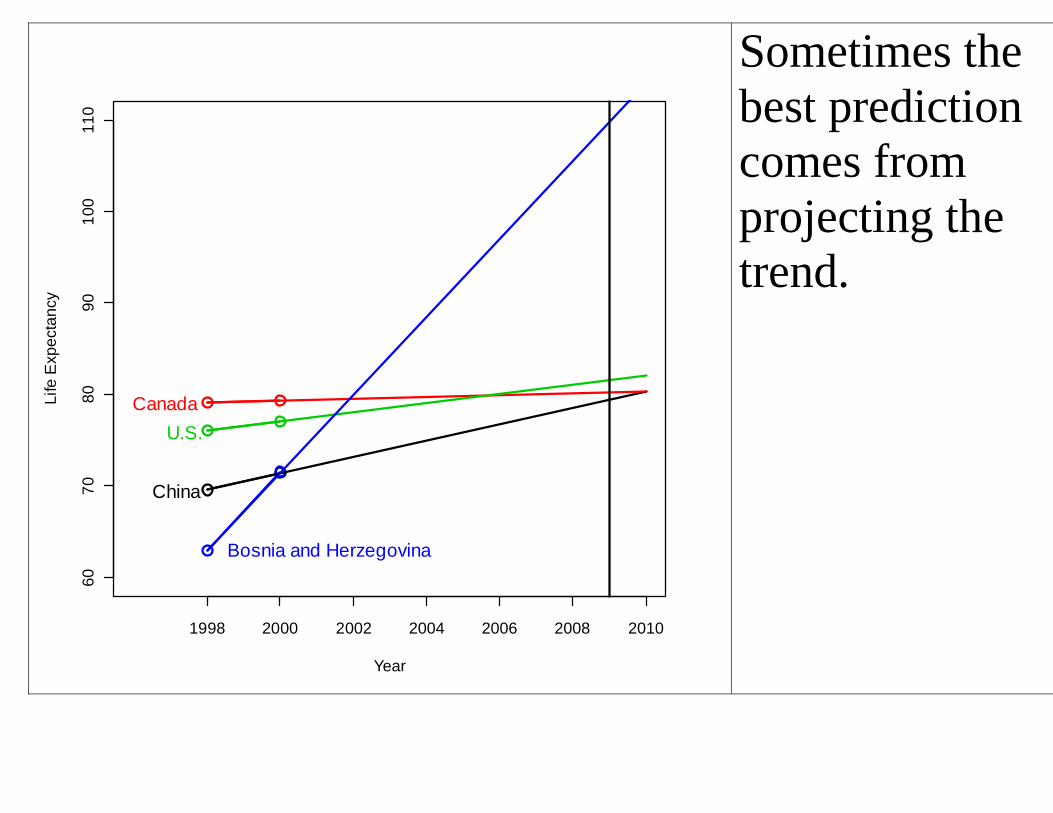
Sometimes the best prediction comes from projecting the trend.
1998 2000 2002 2004 2006 2008 2010
6070
8090
100
110
Year
Life
Exp
ecta
ncy
CanadaU.S.
China
Bosnia and Herzegovina
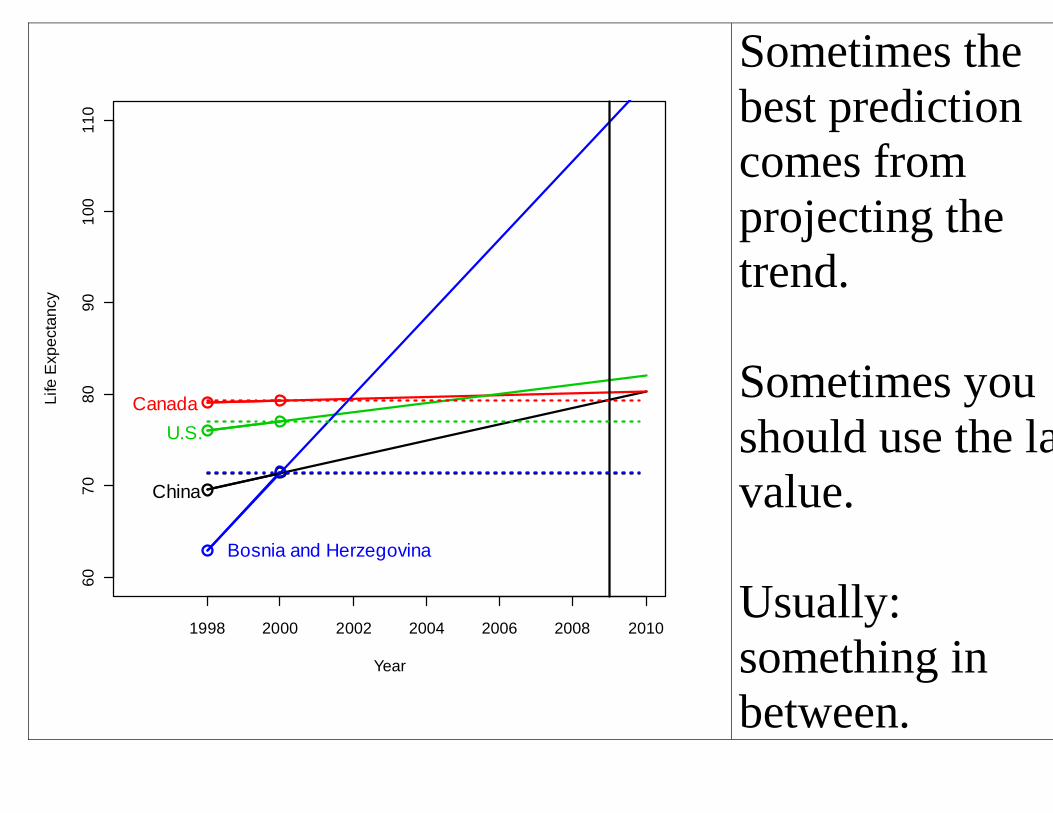
Sometimes the best prediction comes from projecting the trend.
Sometimes you should use the last value.
Usually:something in between.
Do statistics lie? OR is it misuse of statistics that lies? Statistics calculations
Statistics = calculations + statistical reasoning If you take away reasoning, you’re not doing statistics
Statistics is about how NOT TO LIE with data
What do you need to know about Statistics? How can we help students develop the judgment to assess the information they see every day?
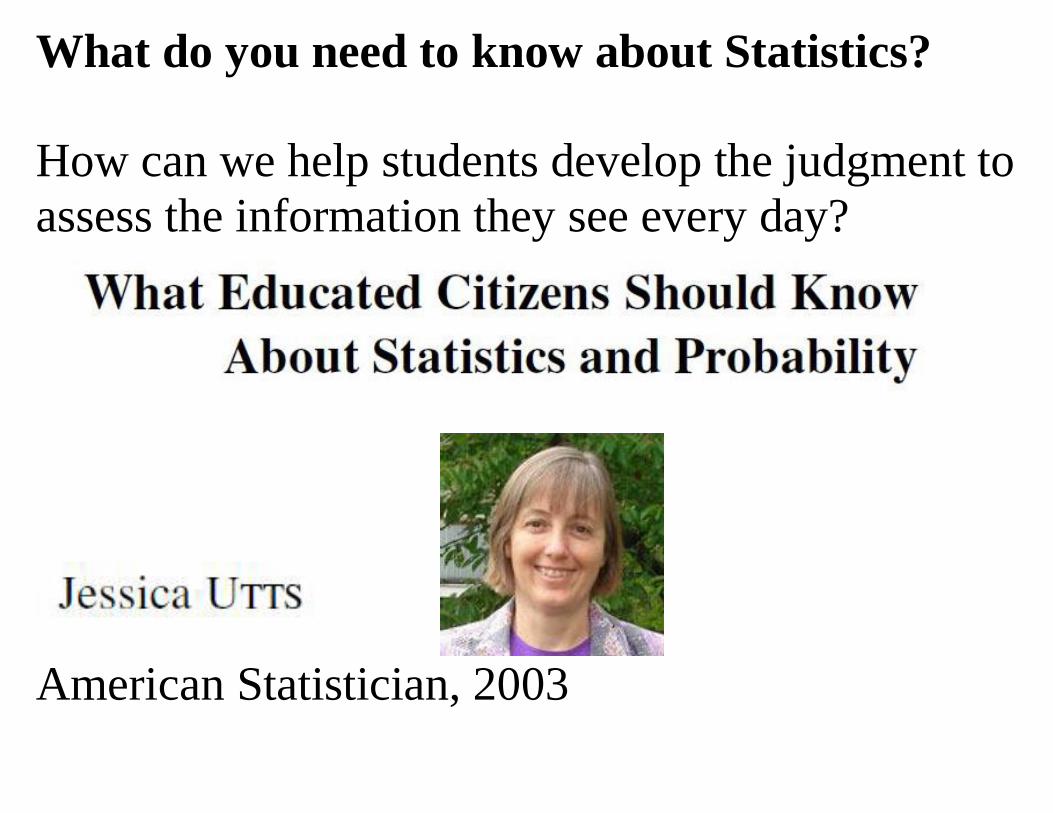
What do you need to know about Statistics? How can we help students develop the judgment to assess the information they see every day?
American Statistician, 2003
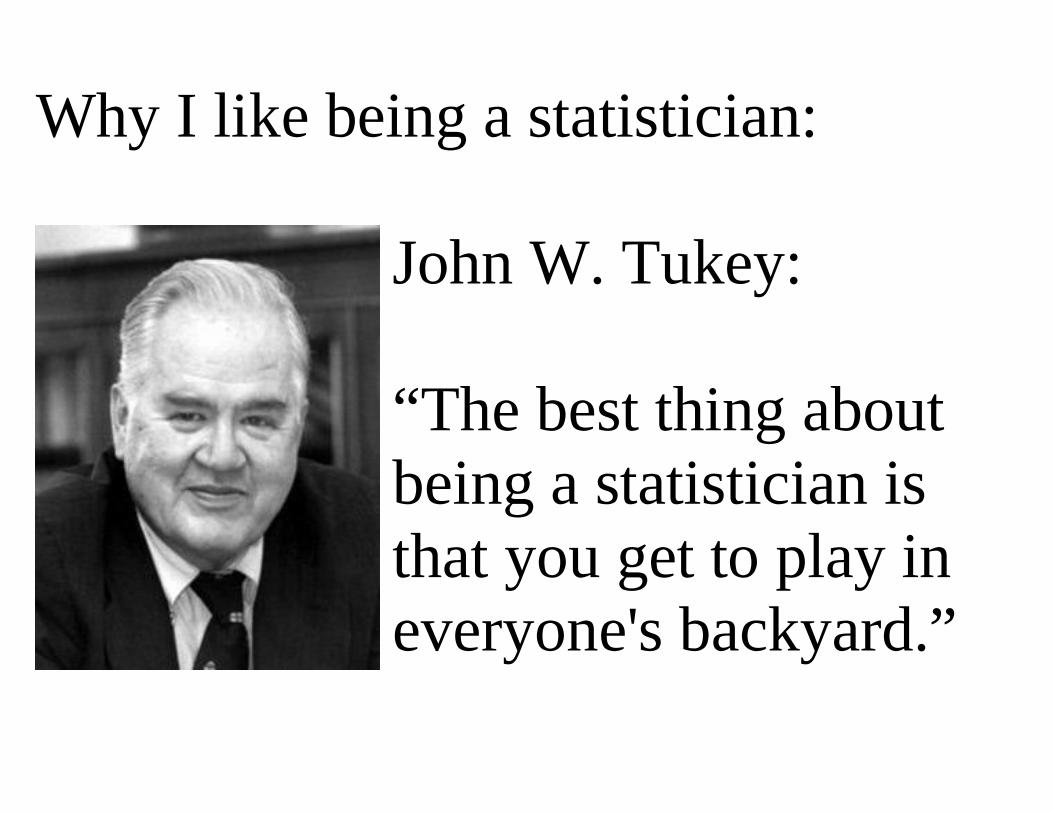
Why I like being a statistician:
Why I like being a statistician:
John W. Tukey: “The best thing about being a statistician is that you get to play in everyone's backyard.”
Some practical advice from a statistician
– A few things I’ve learned recently
Gambling is good

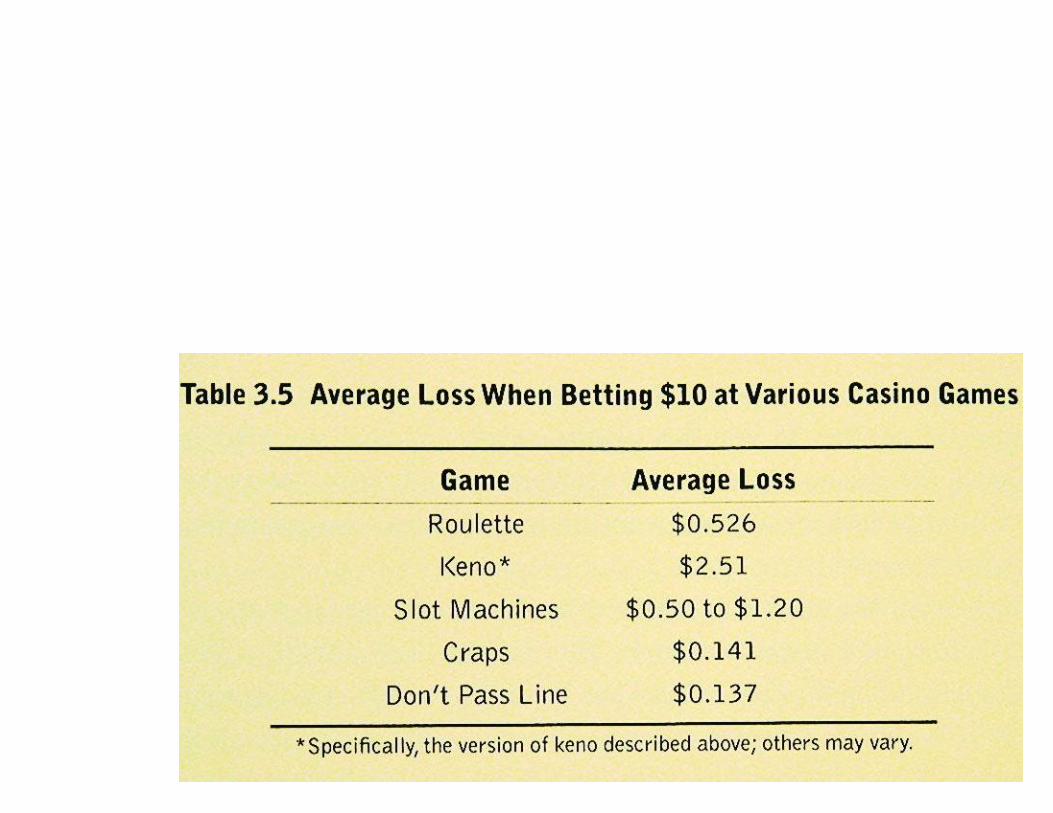


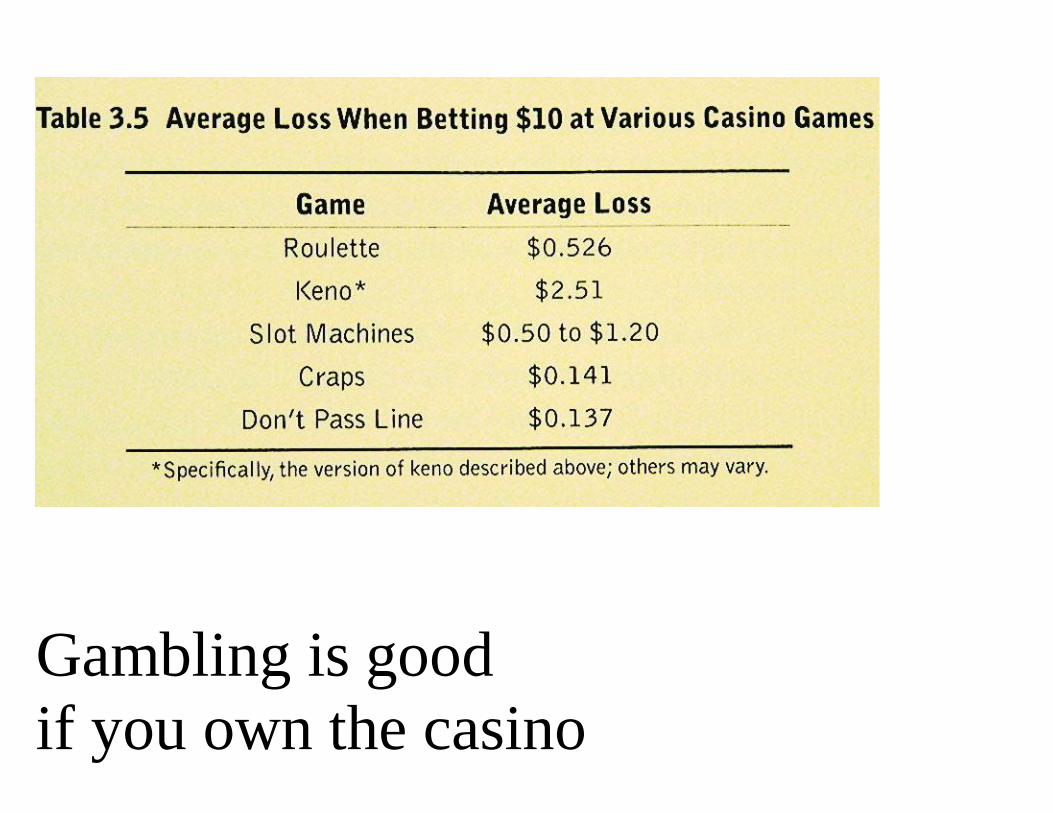
Gambling is goodif you own the casino
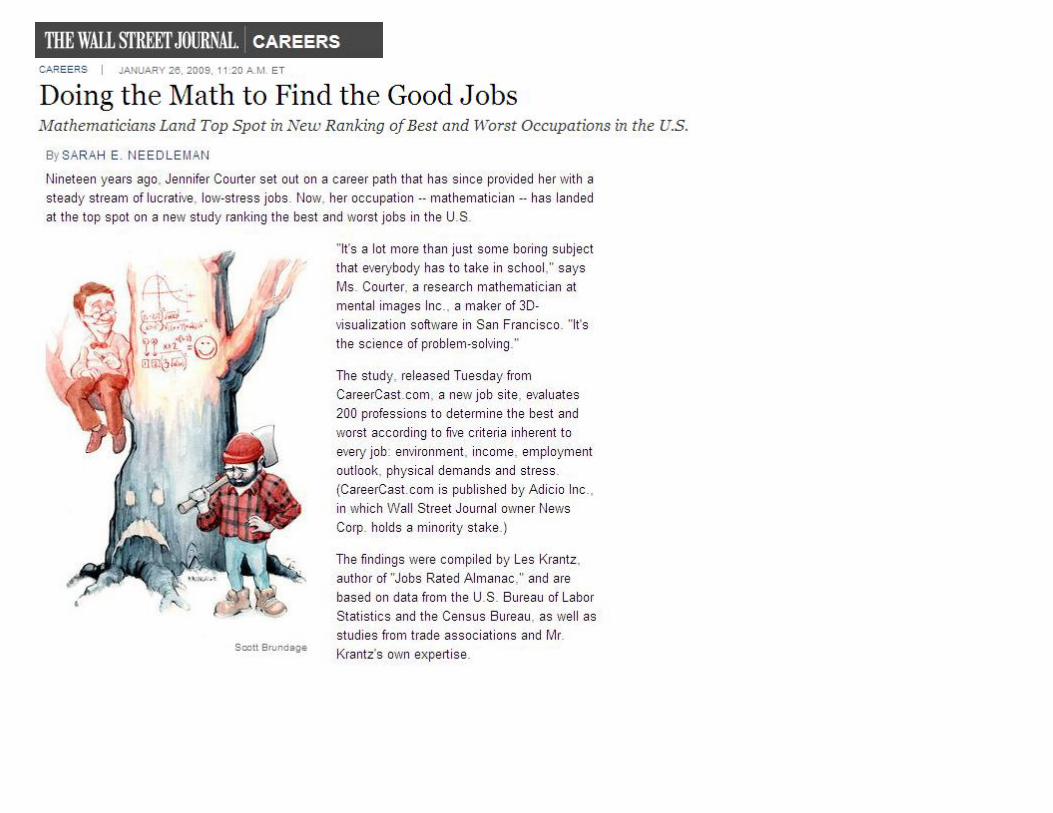
If you are a mathematiciandon’t drive a motorcycle.
If you are a mathematiciandon’t drive a motorcycle.But if you’re an english major it might not be as bad.

Don’t use a cell phonewhile you drive
Observational data with a very clever analysis:


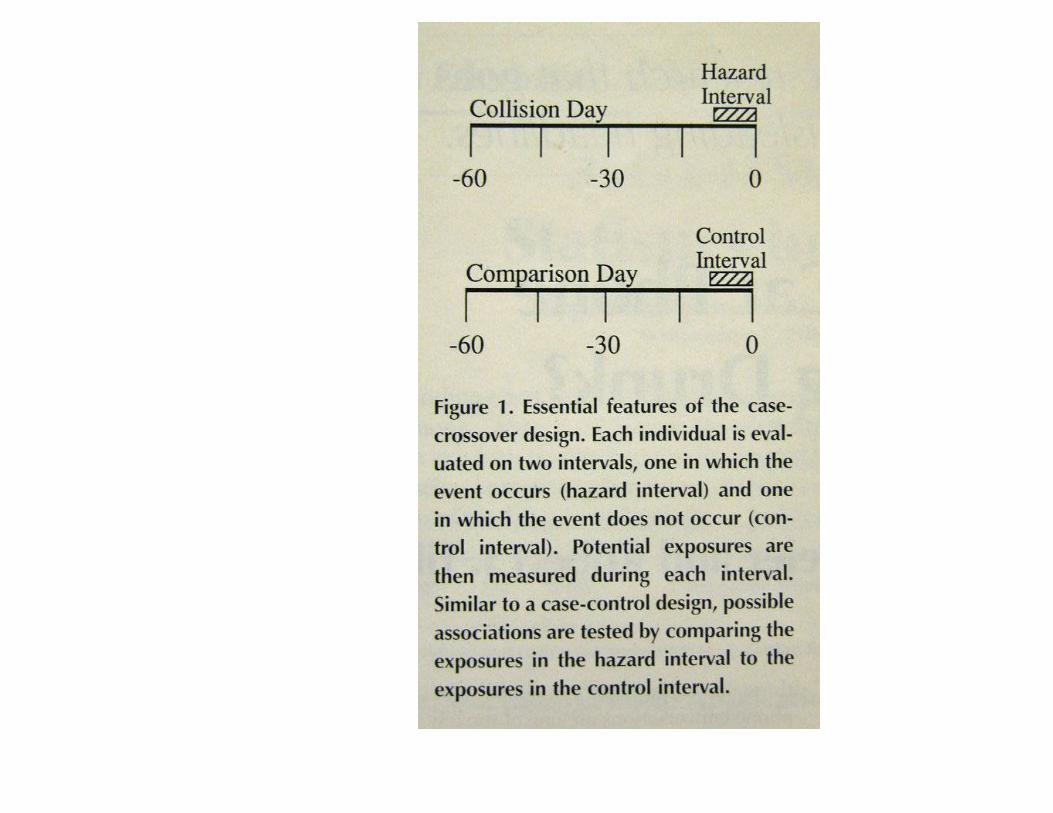
Redelmeier and Tibshirani found aclever solution to this problem:
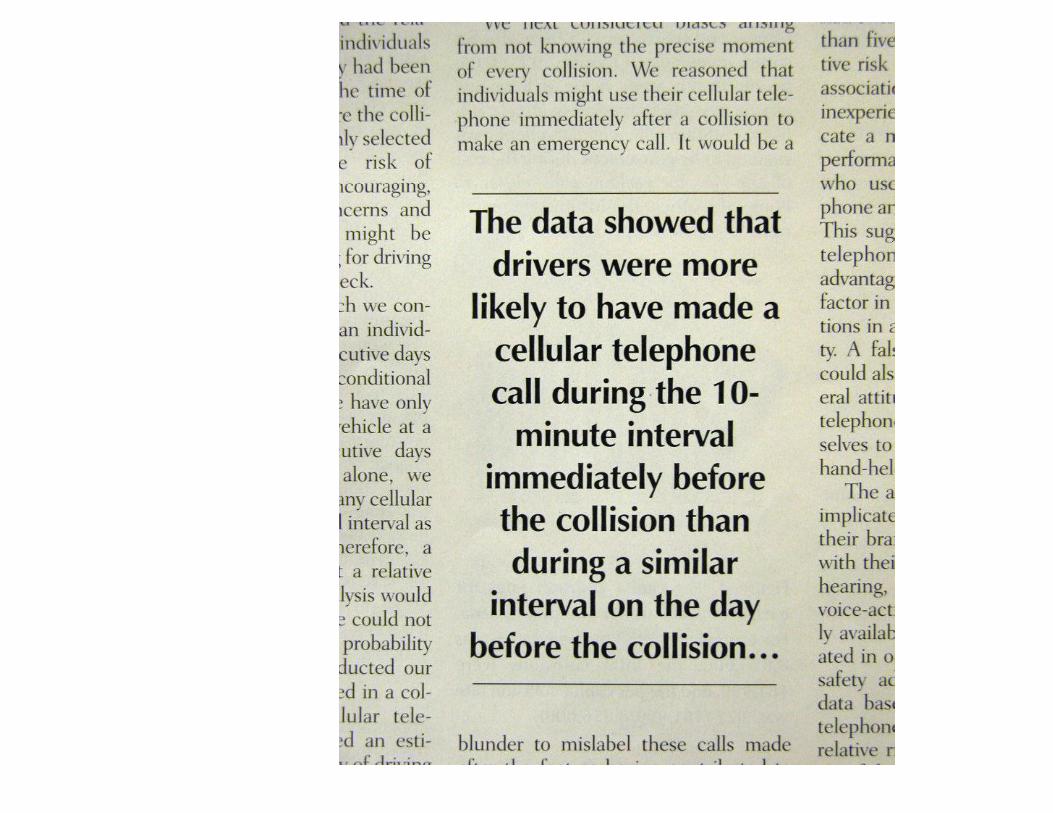
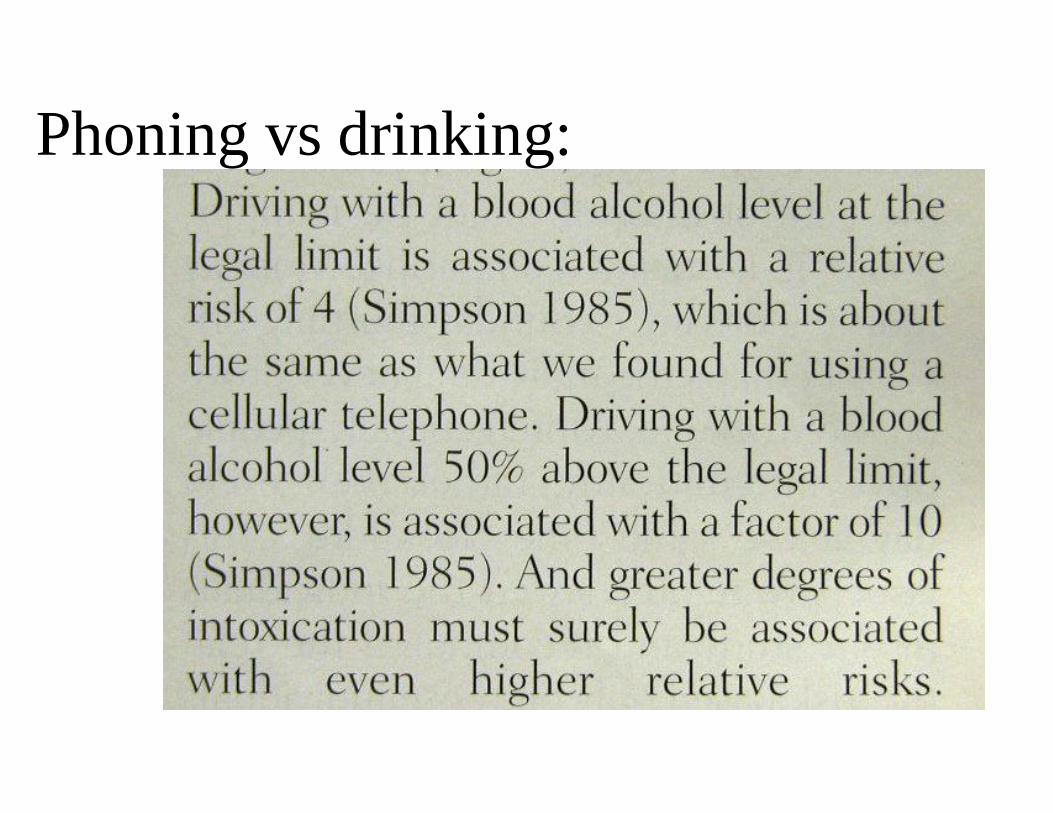
Phoning vs drinking:
Politics may be good for your health
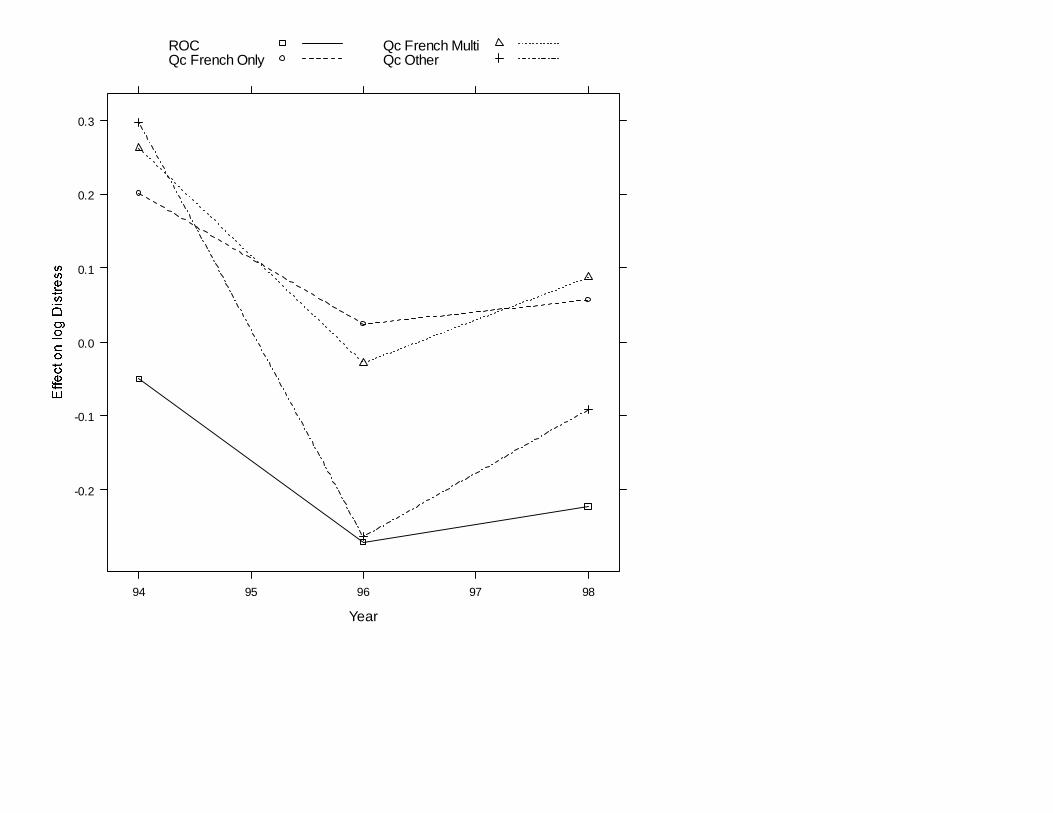
Year
94 95 96 97 98
-0.2
-0.1
0.0
0.1
0.2
0.3
ROCQc French Only
Qc French MultiQc Other
Politics may also be bad for your healthdepending on where you live, what languages you speak and on the outcome of the next referendum

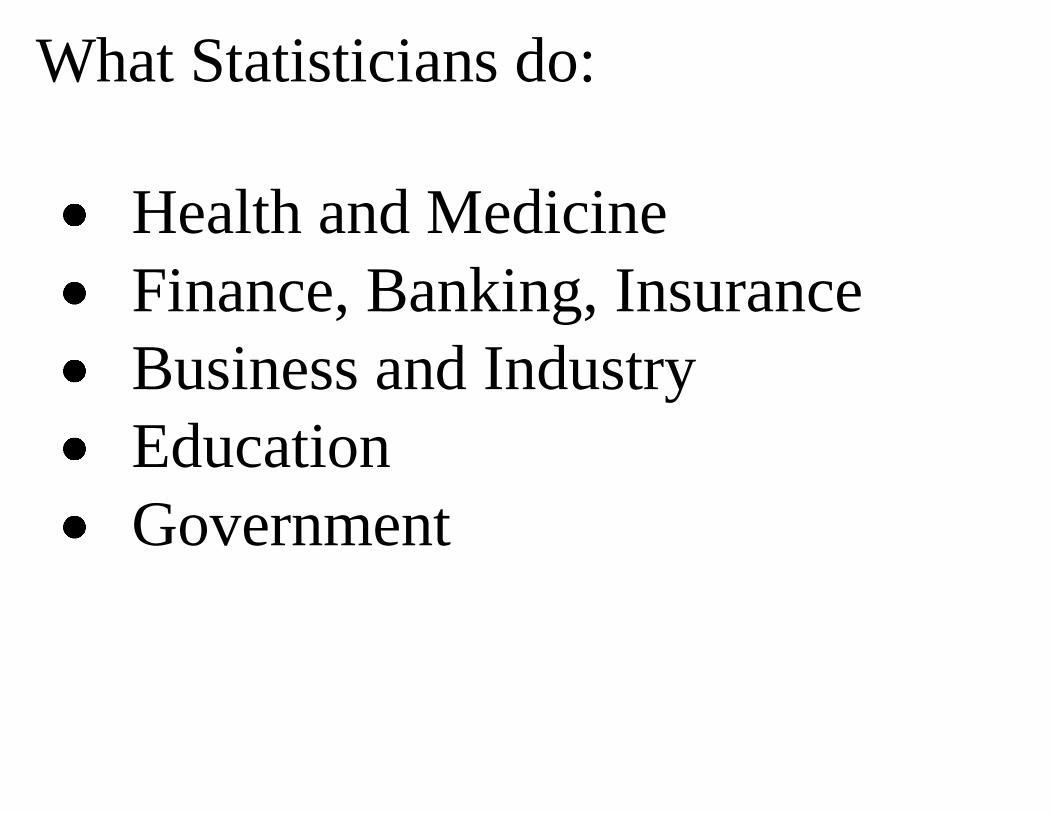
What Statisticians do:
Health and Medicine Finance, Banking, Insurance
Business and IndustryEducationGovernment
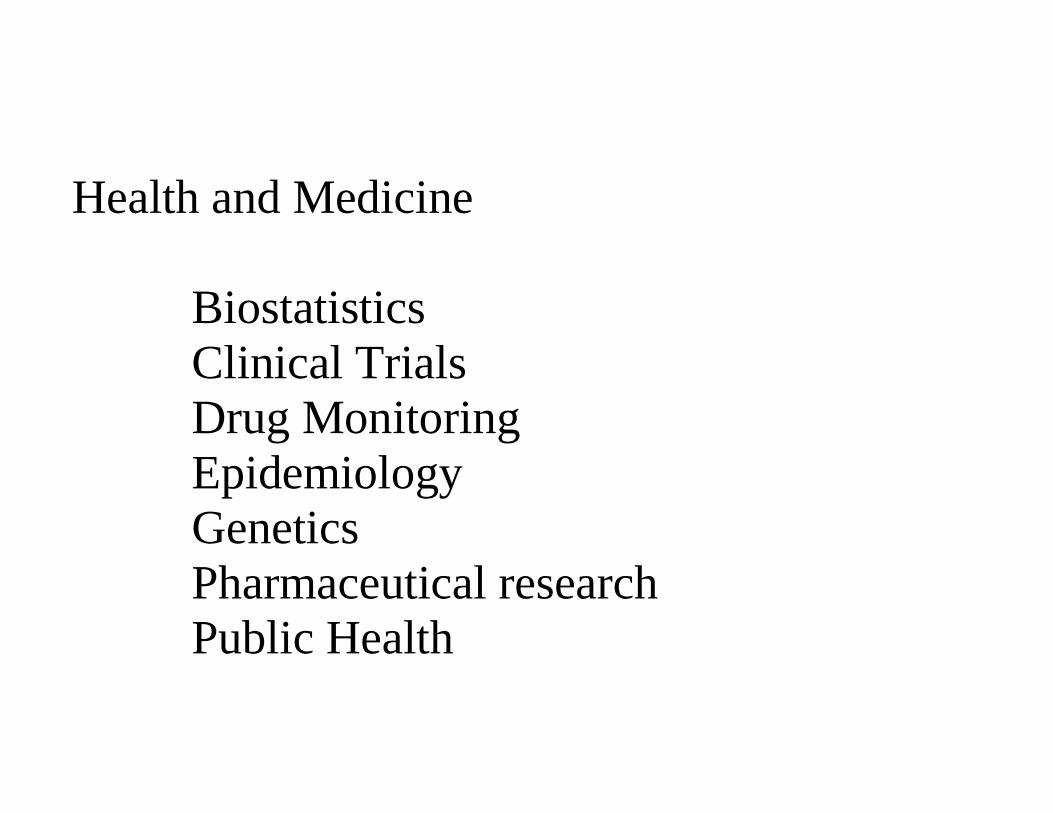
Health and Medicine Biostatistics
Clinical Trials Drug MonitoringEpidemiology Genetics Pharmaceutical researchPublic Health
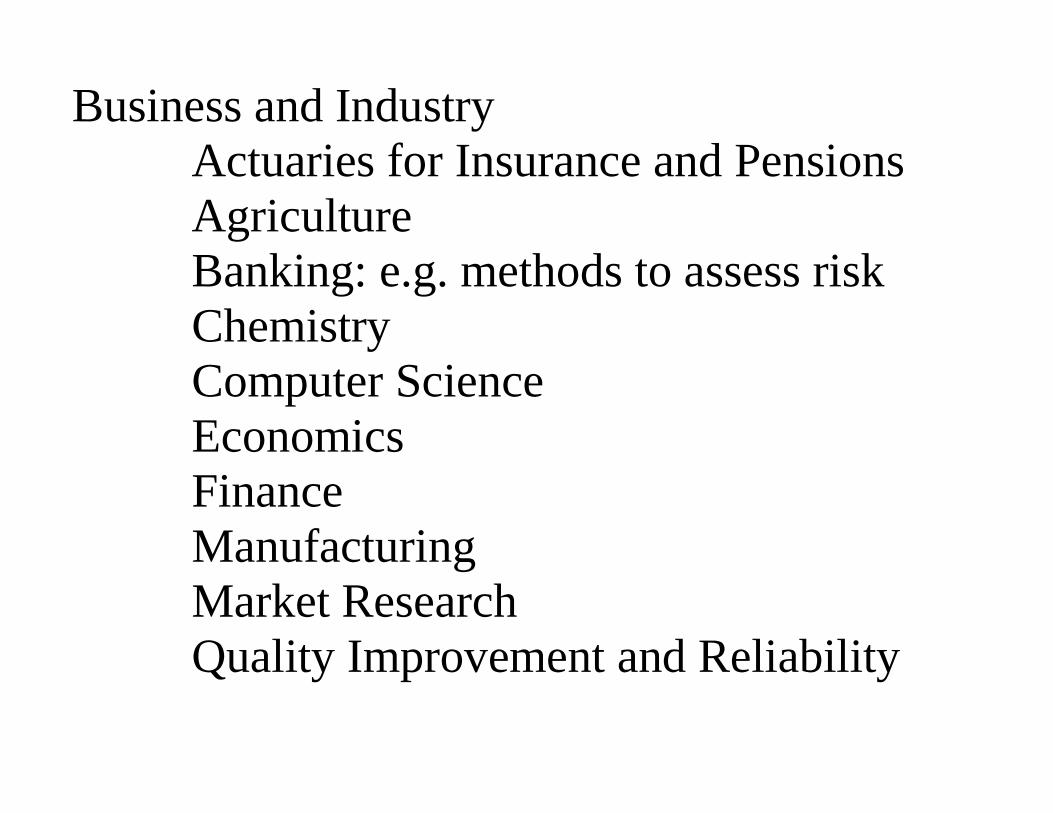
Business and Industry
Actuaries for Insurance and Pensions Agriculture Banking: e.g. methods to assess risk
Chemistry Computer Science
Economics Finance
Manufacturing Market ResearchQuality Improvement and Reliability
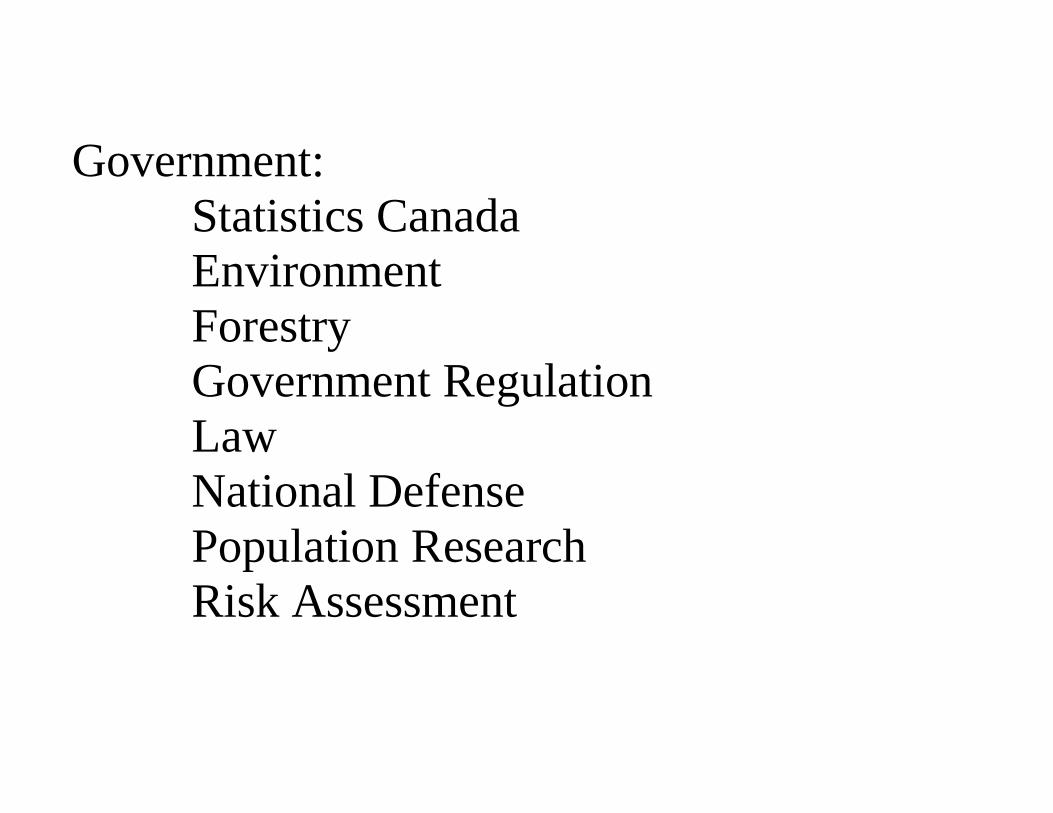
Government: Statistics Canada Environment
Forestry Government Regulation
Law National Defense
Population Research Risk Assessment
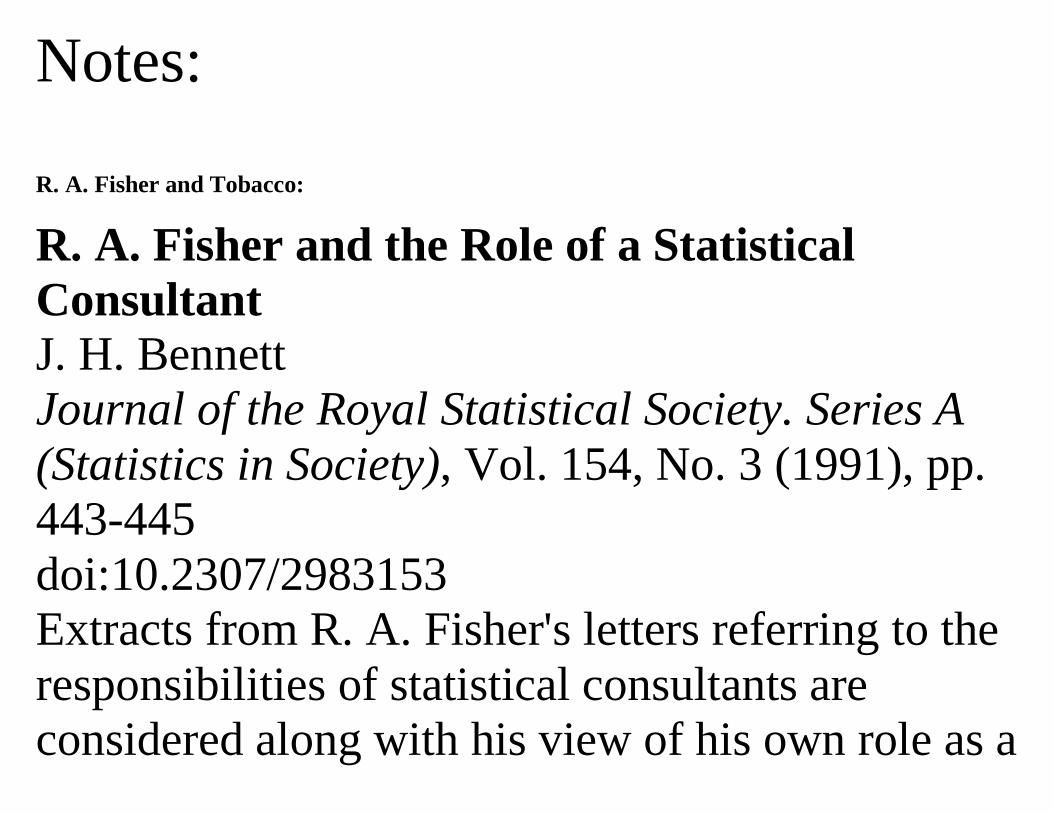
Notes: R. A. Fisher and Tobacco:
R. A. Fisher and the Role of a Statistical Consultant J. H. BennettJournal of the Royal Statistical Society. Series A (Statistics in Society), Vol. 154, No. 3 (1991), pp. 443-445doi:10.2307/2983153Extracts from R. A. Fisher's letters referring to the responsibilities of statistical consultants are considered along with his view of his own role as a
scientific consultant to the Tobacco Manufacturers' Standing Committee in the late 1950s. Contrary to a recent suggestion that Fisher may have been `misrepresenting data on lung cancer while acting as an adviser to the tobacco industry', his letters show that he was very deeply concerned about the possible misrepresentation to consumers of an alleged statistical result. Further, Fisher believed that it is `only by giving students the opportunity of making fine distinctions in the logic of the subject that they can learn to recognize the difference between honest and dishonest work in statistical practice'.
American Journal of Epidemiology Vol. 133, No. 5: 416-425 Copyright © 1991 by The Johns Hopkins University School of Hygiene and Public Health
When Genius Errs: R. A. Fisher and the Lung Cancer Controversy
Paul D. Stolley Clinical Epidemiology Unit, University Pennsylvania School of Medicine 220-L Nursing Education Building, Philaiaphia, PA 19104-6095
R. A. Fisher's work on lung cancer and smoking is critically reviewed. The controversy is placed in the context of his career and personality. Although Fisher made invaluable contributions to the field of statistics, his analysis of the causal associationbetween lung cancer and smoking was flawed by an unwillingness to examine the entire body of data
available and prematurely drawn conclusions. His views may also have been influenced by personal and professional conflicts, by his work as a consultant to the tobacco industry, and by the fact that he was himself a smoker. Text
Top Related