


Languages
Pages
Legal


Research Journal of Chemical Sciences ________________________________________ ISSN 2231-606X
Vol. 1(6), 30-41, Sept. (2011) Res.J.Chem.Sci.
International Science Congress Association 30
The Use of Anion Geochemistry in Mapping Groundwater Facies of
Yola Area NE Nigeria
Gabriel Ike Obiefuna1 and Donatus Maduka Orazulike
2
1Department of Geology, Federal University of Technology, Yola, NIGERIA 2Geology Programme, Abubakar Tafawa Balewa University, Bauchi, NIGERIA
Available online at: www.isca.in (Received 18th April 2011, accepted 09th August 2011)
Abstract
This study was aimed at employing anion geochemistry in mapping groundwater facies in Yola area of Northeastern
Nigeria. The concentration levels of sulphate were analysed using the HACH Spectrophotometer model No DR/2400
whereas those of Cl–, −2
3CO and −3HCO HCO3
– were done by titrimetric method. The results of the analysed dissolved
anions are recorded as −3HCO (16.2 to 19.2 mg/l), Cl
– (0.50 to 0.80 mg/l) and −2
4SO (1.60 to 3.55 mg/l) for the
rainwater and HCO3– (73.30 to 273 mg/l), Cl
– (27.90 to 455.20 mg/l) and SO4
2- (2 to 29.11 mg/l) for the surface water
samples. The shallow groundwater and deep groundwater revealed values of HCO3– (19.90 to 240 mg/l), Cl
– (0 to
170.17 mg/l) and −24SO (0 to 35 mg/l) and HCO3
– (50 to 207 mg/l), Cl
– (0.004 to 159.40 mg/l) and SO4
2- (0 to 64.50
mg/l) respectively. The absence of SO42-
and relatively high concentration of bicarbonate in some of the samples could
be attributed to sulphate reduction. The reaction is believed to take place in the presence of sulphate reducing bacteria
in the soil zone through which recharge water percolates. The absence of some ions such as −23CO and −2
4SO and the
varied concentration levels in others such as Cl– and HCO3
– also affect the types and numbers of mappable facies in
surface water and groundwater systems. Mappable groundwater facies for the different water sources are the
bicarbonate-chloride-sulphate facies for the rainwater and the chloride-sulphate-bicarbonate for the surface water and
groundwater systems respectively. The results further revealed that the groundwater has a local meteoric origin that
evolves towards the composition of sea water. It also suggests that their chemical evolution is associated mainly with
progressive dissolution and/or weathering of minerals along the flow paths.
Key words: Anion geochemistry, groundwater facies, sulphate reduction, Yola area, NE Nigeria.
Introduction
Facies are identifiable parts of different nature belonging to
any genetically related body or system. Hydrochemical
facies are distinct zones that have cation and anion
concentrations describable within defined composition
categories1. Hydrochemical facies can be studied in terms
of anions and cations or both. For instance, Chebotarev2
used anion species only and developed his well-known
sequence which states that all ground waters tend to evolve
chemically toward the composition of seawater. Toth3 used
anion facies development in mapping groundwater
discharge and recharge areas in Canada. Amadi et al4 used
both anion and cation species in mapping the groundwater
facies type housed in a north-south direction of some part
of the Niger Delta region. Although each option may differ
in scope but all are directed towards the definition and
delineation of hydrochemical facies types found in
groundwater flow systems.
Groundwater flow systems has been mapped and
correlated with hydrochemical patterns to varying degrees
using hydrochemical facies. As a result certain broad
relationship between chemical composition and the flow
distribution of groundwater have been established in the
process. Consequently, the mapping of groundwater flow
systems using hydrochemical facies has aided the
separation of potable and non-potable water.
Hence, water quality has been related to the hydraulic
regime (inflow, through flow, outflow) and the type (local,
intermediate, regional) of the flow system5. Finally Egboka
and Amadi8
demonstrated the use of anion geochemistry in
mapping groundwater facies in the Portharcourt area of the
Niger Delta, Nigeria. In this study similar technique was
applied in Yola area of Northeastern Nigeria in using anion
geochemistry in mapping groundwater and surface water
facies.
Study Area: The study area occur at an elevation varying
from 152m to 455m above mean sea level and falls within
the Upper Benue Basin which has a catchment area of
about 203,000km2. It is located within longitudes 12
◦24'E
and 12◦34'E and Latitudes 9
◦11'N and 9
◦24’N and lies about
50km south of the Hawal Massifs. It is bounded to the east
by the Republic of Cameroun and to the west by Ngurore
town. The northern boundary is demarcated by Gokra town
and the southern boundary by the Mandarara town (figures
1). The study area falls within the semi-arid climatic zone
of Nigeria in Sub-Saharan Africa is characterized by two
distinct seasons; a hot dry season lasting from November
to April and a cool rainy season lasting from April to
October. The study area receives summer rainfall from the
south-western monsoon derived from the Gulf of Guinea.
Rainfall during 1963/64-2006/2007 water years averaged
Research Journal of Chemical Sciences _______________________________________________________ ISSN 2231-606X
Vol. 1(6), 30-41, Sept. (2011) Res.J.Chem.Sci.
International Science Congress Association 31
827.7mm per annum while the mean annual
evapotranspiration is about 2384.6 mm.
Material and Methods
A total of forty-three (43) water samples were collected
from forty-three (43) locations between the months of
November and December 2007. Of this forty-three
locations (consisting of 27 groundwater, 11 surface water
and 5 rainwater samples) were sampled. These samples
were designated as SW1 to SW11 for surface water, RW1
to RW5 for rainwater and HW1 to HW45 and BH21 to
BH137 for groundwater samples) respectively (figure 1). A
global positioning system (GPS), Garment 12, was used for
well location and elevation readings. This was supported
by topographic sheets made available from the Ministry of
Lands and Survey, Adamawa State of Nigeria.
The samples were collected in polyethylene bottles after
pumping the sampled wells for about 30 minutes and kept
cool until analyses. This was done to remove groundwater
stored in the well itself and to obtain representative
samples. Various physical parameters were measured in
the field using standard equipments. These include
Temperature and conductivity (DR 2400), dissolved
oxygen (Hach 2400 electronic meter) and pH/Eh (DR 2400
pH meter) measurements were made in the field.
The samples were filtered through a thin polycarbonate
membrane with 0.45µm pore size and subsequently
analyzed in the Laboratory of the Adamawa State Water
Board Yola for HCO3– CO3
2-, Cl
–, SO4
2-, and TDS. The
chemical analyses were based on the standard methods
presented in APHA/AWWA/WPCF9. Results of chemical
analyses in milligrams per litre were converted to values in
milliequivalent per litre and anions balanced against
cations as a control check on the reliability of the analyses
results. All the samples were assessed for charge balance
and were all within the acceptable range of ± 5
The resulting values of (HCO3–+ −2
3CO ) and those of (Cl–
+
SO42-
) were then expressed as percentages of all anions.
The facies of the resulting percentages were then matched
with the guidelines proposed by Back10
whereas the
direction of facies change was determined by fitting the
facies types into the anion diamond field of Domenico11
.
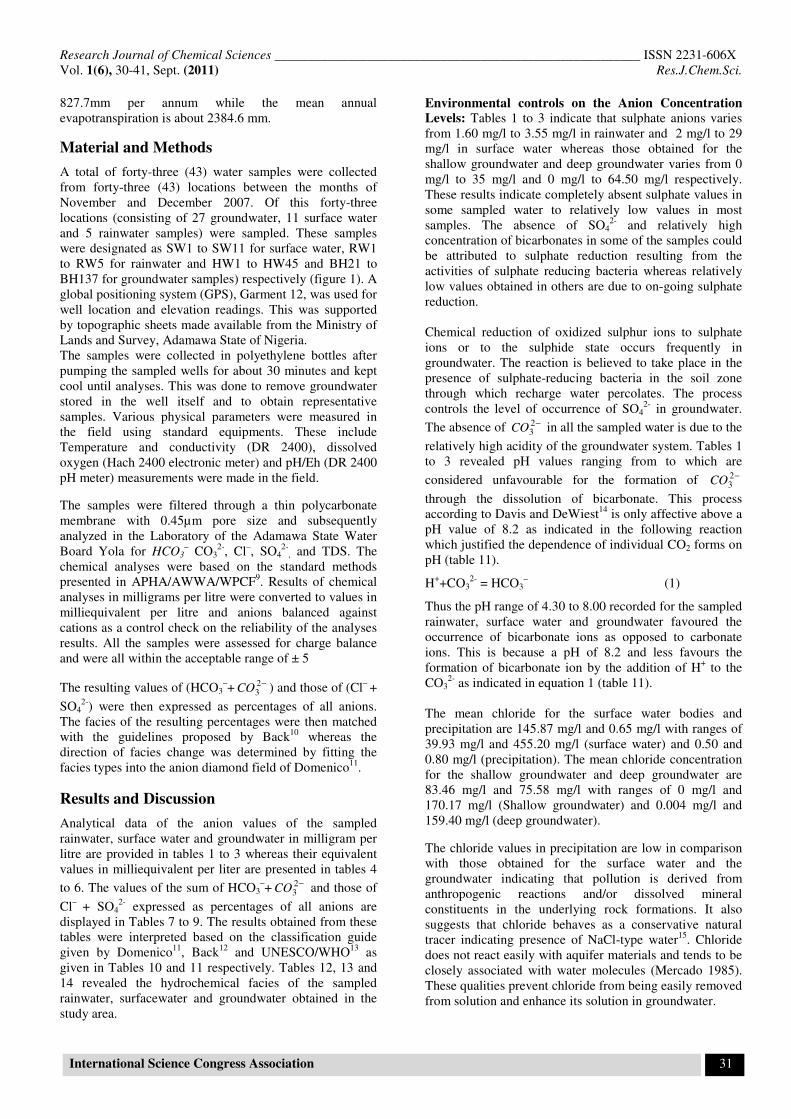
Results and Discussion
Analytical data of the anion values of the sampled
rainwater, surface water and groundwater in milligram per
litre are provided in tables 1 to 3 whereas their equivalent
values in milliequivalent per liter are presented in tables 4
to 6. The values of the sum of HCO3–+ −2
3CO and those of
Cl–
+ SO42-
expressed as percentages of all anions are
displayed in Tables 7 to 9. The results obtained from these
tables were interpreted based on the classification guide
given by Domenico11
, Back12
and UNESCO/WHO13
as
given in Tables 10 and 11 respectively. Tables 12, 13 and
14 revealed the hydrochemical facies of the sampled
rainwater, surfacewater and groundwater obtained in the
study area.
Environmental controls on the Anion Concentration
Levels: Tables 1 to 3 indicate that sulphate anions varies
from 1.60 mg/l to 3.55 mg/l in rainwater and 2 mg/l to 29
mg/l in surface water whereas those obtained for the
shallow groundwater and deep groundwater varies from 0
mg/l to 35 mg/l and 0 mg/l to 64.50 mg/l respectively.
These results indicate completely absent sulphate values in
some sampled water to relatively low values in most
samples. The absence of SO42-
and relatively high
concentration of bicarbonates in some of the samples could
be attributed to sulphate reduction resulting from the
activities of sulphate reducing bacteria whereas relatively
low values obtained in others are due to on-going sulphate
reduction.
Chemical reduction of oxidized sulphur ions to sulphate
ions or to the sulphide state occurs frequently in
groundwater. The reaction is believed to take place in the
presence of sulphate-reducing bacteria in the soil zone
through which recharge water percolates. The process
controls the level of occurrence of SO42-
in groundwater.
The absence of −23CO in all the sampled water is due to the
relatively high acidity of the groundwater system. Tables 1
to 3 revealed pH values ranging from to which are
considered unfavourable for the formation of −23CO
through the dissolution of bicarbonate. This process
according to Davis and DeWiest14
is only affective above a
pH value of 8.2 as indicated in the following reaction
which justified the dependence of individual CO2 forms on
pH (table 11).
H++CO3
2- = HCO3
– (1)
Thus the pH range of 4.30 to 8.00 recorded for the sampled
rainwater, surface water and groundwater favoured the
occurrence of bicarbonate ions as opposed to carbonate
ions. This is because a pH of 8.2 and less favours the
formation of bicarbonate ion by the addition of H+ to the
CO32-
as indicated in equation 1 (table 11).
The mean chloride for the surface water bodies and
precipitation are 145.87 mg/l and 0.65 mg/l with ranges of
39.93 mg/l and 455.20 mg/l (surface water) and 0.50 and
0.80 mg/l (precipitation). The mean chloride concentration
for the shallow groundwater and deep groundwater are
83.46 mg/l and 75.58 mg/l with ranges of 0 mg/l and
170.17 mg/l (Shallow groundwater) and 0.004 mg/l and
159.40 mg/l (deep groundwater).
The chloride values in precipitation are low in comparison
with those obtained for the surface water and the
groundwater indicating that pollution is derived from
anthropogenic reactions and/or dissolved mineral
constituents in the underlying rock formations. It also
suggests that chloride behaves as a conservative natural
tracer indicating presence of NaCl-type water15
. Chloride
does not react easily with aquifer materials and tends to be
closely associated with water molecules (Mercado 1985).
These qualities prevent chloride from being easily removed
from solution and enhance its solution in groundwater.

Research Journal of Chemical Sciences _______________________________________________________ ISSN 2231-606X
Vol. 1(6), 30-41, Sept. (2011) Res.J.Chem.Sci.
International Science Congress Association 32
Table-1
Anion Concentration and pH levels in rainwater and Surface Water Samples of the Study Area
S/N Location Date of
collection
Date of
analysis
Water
table (m)
Parameter
pH SO42-
�����
�����
Cl–
1 Rainwater Yola RW1 15/08/09 15/08/09 Nil 7.40 1.60 Nil 18 0..70
2 Rainwater Yola RW2 15/08/09 15/08/09 Nil 4.30 1.80 Nil 19.20 0.60
3 Rainwater Yola RW3 15/08/09 15/08/09 Nil 7.70 4.50 Nil 16.20 0.65
4 Rainwater Yola RW4 15/08/09 15/08/09 Nil 6.40 2.70 Nil 17.50 0.80
5 Rainwater Yola RW5 15/08/09 15/08/09 Nil 6.20 3.55 Nil 18.73 0.50
6 River Benue SW1 22/11/09 22/11/09 1 7.34 17.00 Nil 148 39.93
7. River Benue SW2 22/11/09 22/11/09 1 7.55 10.00 Nil 183 27.90
8 Lake Geriyo SW3 22/11/09 22/11/09 1 7.70 11.50 Nil 273 227
9 River Benue TPY SW4 22/11/09 22/11/09 1 7.60 22.10 Nil 133 227.6
10 River Benue TPY SW5 22/11/09 22/11/09 1 7.61 2.00 Nil 73.30 284.50
11 River Benue SW6 22/11/09 22/11/09 1 8.00 24.86 Nil 130 40
12 River Benue SW7 22/11/09 22/11/09 1 7.20 20.06 Nil 145 51.31
13 River Benue SW8 22/11/09 22/11/09 1 7.50 29.11 Nil 162 60.00
14 Lake Njuwa SW9 22/11/09 22/11/09 1 7.70 20.50 Nil 57 455.20
15 River Benue SW10 22/11/09 22/11/09 1 7.80 20.21 Nil 153 147.05
16 River Benue SW11 22/11/09 22/11/09 1 7.30 18.34 Nil 48.50 147.05
Table-2
Anion Concentration and pH levels in Shallow Groundwater Samples of the Study Area
S/N Location Date of
collection
Date of
analysis
Water
table (m)
Parameter
pH SO42-
�����
�����
Cl-
1 Lainde HW 1 19-11-09 19-11-09 24.2 6.90 10.10 Nil 61.90 57.90
2 Modire HW 4 19-11-09 19-11-09 23.33 6.60 5.20 Nil 99.50 113.80
3 Girei HW 12 19-11-09 19-11-09 7.27 7.30 12.80 Nil 76 115.0
4 Wuro Chekke 19-11-09 19-11-09 8.00 7.40 0.00 Nil 89.13 85.30
5 Jimeta HW 24 19-11-09 19-11-09 1.40 7.30 0.00 Nil 77.00 110.90
6 Bachure HW25 19-11-09 19-11-09 5.20 6.70 0.00 Nil 51.50 63.30
7. Tofare Buhu HW 36 19-11-09 19-11-09 2.12 6.50 29.80 Nil 92.00 170.17
8 Kabawa 19-11-09 19-11-09 6.70 6.90 17.50 Nil 85.40 112.80
9 Sebore HW 42 19-11-09 19-11-09 12.00 7.10 2.10 Nil 125.00 110.70
10 Yolde Patch II HW45 19-11-09 19-11-09 7.88 7.20 35.00 Nil 41.00 64.90
11 Bajabure Phase II BH21 19-11-09 19-11-09 6.065 7.20 32.50 Nil 93.00 0.00
12 Jambutu BH 37 19-11-09 19-11-09 4.70 7.10 0.90 Nil 240.00 56.89
13 Njobboli BH 117 19-11-09 19-11-09 11.00 7.40 1.50 Nil 103.50 66.90
14 Lainde BH 123 19-11-09 19-11-09 35,00 6.50 16.70 Nil 102.00 132.90
15 Kofare BH 136 19-11-09 19-11-09 16.00 6.90 10.01 Nil 10.90 0.00
16 Yolde Patch II BH137 19-11-09 19-11-09 18.00 6.80 0.00 Nil 82.00 73.90

Research Journal of Chemical Sciences _______________________________________________________ ISSN 2231-606X
Vol. 1(6), 30-41, Sept. (2011) Res.J.Chem.Sci.
International Science Congress Association 33
Table-3
Anion Concentration and pH levels in deep groundwater sample of the study area
S/N Location Date of
collection
Date of
analysis
Water
table (m)
Parameter
pH SO42-
�����
�����
Cl-
1 Sabare HW14 18/11/09 18/11/09 36.40 6.8 21.10 Nil 77.80 113.90
2 Karewa HW 26 18/11/09 18/11/09 60 7.10 0.09 Nil 84.00 57
3 Karewa HW 46 18/11/09 18/11/09 62 7.55 27.5 Nil 104.90 133.60
4 Karewa HW 47 18/11/09 18/11/09 58 6.80 0.35 Nil 53.50 171.50
5 Girei BH7 18/11/09 18/11/09 50 6.60 11.88 Nil 153.30 77.00
6 FUT Yola BH 7 18/11/09 18/11/09 56 6.80 64.50 Nil 207 42.00
7. Jimeta BH 10 18/11/09 18/11/09 46 7.40 25.50 Nil 101 11.02
8 Jimeta BH 75 18/11/09 18/11/09 46 7.50 11.20 Nil 94.90 159.40
9 Jimeta BH 81 18/11/09 18/11/09 48 7.80 0.00 Nil 99.60 65.90
10 Demsawo BH 87 18/11/09 18/11/09 37 7.50 0.83 Nil 109 0.004
11 Yola BH 91 18/11/09 18/11/09 52 7.60 0.02 Nil 50 0.03
Table-4
Anions in meq/l for rainfall and surface water samples
S/N Location/Parameters ��� ���
� ���� Cl
- total
1. Rainwater Yola RW1 0.03331 Nil 0.29502 0.01975 0.34808
2 Rainwater Jimeta RW 2 0.03748 Nil 0.31469 0.01834 0.3691
3 Rainwater Vinikilang RW 3 0.09369 Nil 0.26552 0.01834 0.37755
4 Rainwater FUT Yola RW 4 0.05621 Nil 0.28683 0.02257 0.36561
5 Rainwater Girei RW 5 0.07391 Nil 0.30698 0.01411 0.395
6 River benue SW 1 0.35394 Nil 2.42572 1.12643 3.90609
7 River Benue SW 2 0.2082 Nil 2.99937 0.78706 3.00463
8 Lake Geriyo SW3 0.23943 Nil 4.47447 6.40367 11.11757
9 River Benue TPy SW4 0.46012 Nil 2.17987 6.42060 9.06059
10 River Benue TPY SW5 0.04164 Nil 1.20139 8.02575 9.26878
11 River Benue SW6 0.51759 Nil 2.1307 1.1284 3.77669
12 River Benue SW7 0.41765 Nil 2.37655 1.44746 4.24166
13 River Benue SW8 0.60507 Nil 2.65518 1.6926 4.95385
14 Lake Njuwa SW9 0.42681 Nil 0.93423 12.84119 14.20223
15 River Benue SW10 0.42077 Nil 2.50767 1.24209 4.17053
16 River Benue SW11 0.38184 Nil 0.79492 4.14828 5.32504
Research Journal of Chemical Sciences _______________________________________________________ ISSN 2231-606X
Vol. 1(6), 30-41, Sept. (2011) Res.J.Chem.Sci.
International Science Congress Association 34
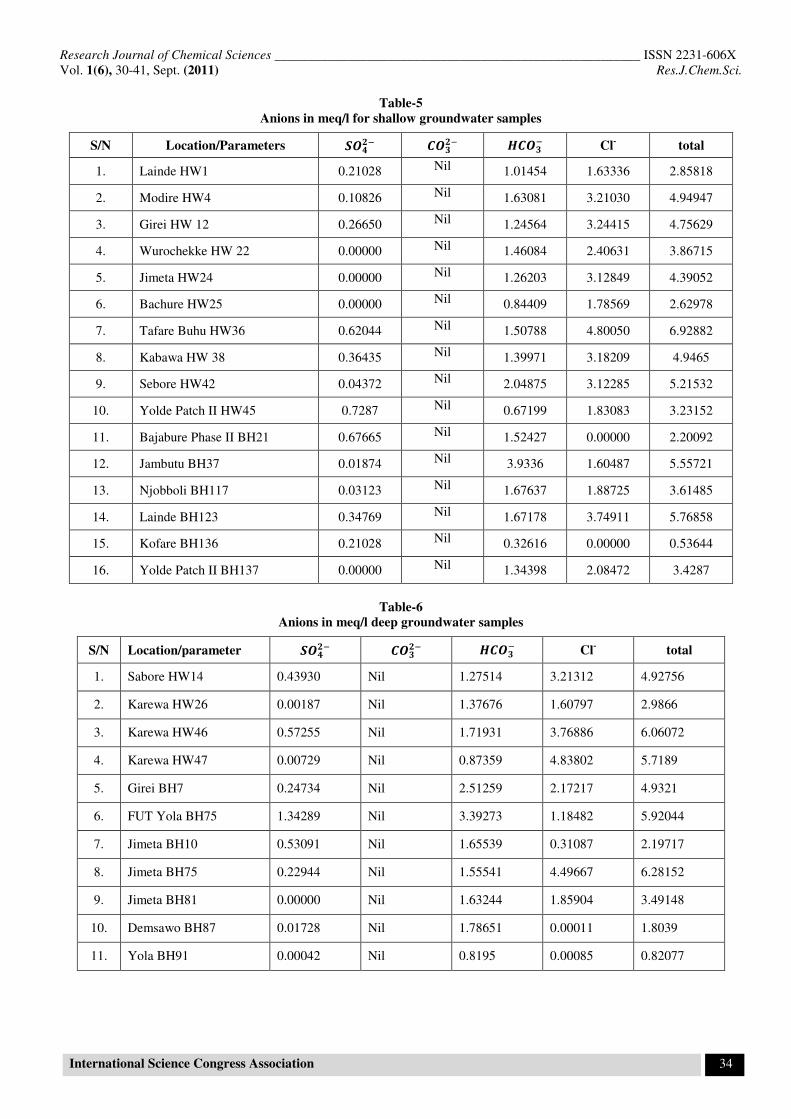
Table-5
Anions in meq/l for shallow groundwater samples
S/N Location/Parameters ��� ���
� ���� Cl
- total
1. Lainde HW1 0.21028 Nil 1.01454 1.63336 2.85818
2. Modire HW4 0.10826 Nil 1.63081 3.21030 4.94947
3. Girei HW 12 0.26650 Nil 1.24564 3.24415 4.75629
4. Wurochekke HW 22 0.00000 Nil 1.46084 2.40631 3.86715
5. Jimeta HW24 0.00000 Nil 1.26203 3.12849 4.39052
6. Bachure HW25 0.00000 Nil 0.84409 1.78569 2.62978
7. Tafare Buhu HW36 0.62044 Nil 1.50788 4.80050 6.92882
8. Kabawa HW 38 0.36435 Nil 1.39971 3.18209 4.9465
9. Sebore HW42 0.04372 Nil 2.04875 3.12285 5.21532
10. Yolde Patch II HW45 0.7287 Nil 0.67199 1.83083 3.23152
11. Bajabure Phase II BH21 0.67665 Nil 1.52427 0.00000 2.20092
12. Jambutu BH37 0.01874 Nil 3.9336 1.60487 5.55721
13. Njobboli BH117 0.03123 Nil 1.67637 1.88725 3.61485
14. Lainde BH123 0.34769 Nil 1.67178 3.74911 5.76858
15. Kofare BH136 0.21028 Nil 0.32616 0.00000 0.53644
16. Yolde Patch II BH137 0.00000 Nil 1.34398 2.08472 3.4287
Table-6
Anions in meq/l deep groundwater samples
S/N Location/parameter ��� ���
� ���� Cl
- total
1. Sabore HW14 0.43930 Nil 1.27514 3.21312 4.92756
2. Karewa HW26 0.00187 Nil 1.37676 1.60797 2.9866
3. Karewa HW46 0.57255 Nil 1.71931 3.76886 6.06072
4. Karewa HW47 0.00729 Nil 0.87359 4.83802 5.7189
5. Girei BH7 0.24734 Nil 2.51259 2.17217 4.9321
6. FUT Yola BH75 1.34289 Nil 3.39273 1.18482 5.92044
7. Jimeta BH10 0.53091 Nil 1.65539 0.31087 2.19717
8. Jimeta BH75 0.22944 Nil 1.55541 4.49667 6.28152
9. Jimeta BH81 0.00000 Nil 1.63244 1.85904 3.49148
10. Demsawo BH87 0.01728 Nil 1.78651 0.00011 1.8039
11. Yola BH91 0.00042 Nil 0.8195 0.00085 0.82077
Research Journal of Chemical Sciences _______________________________________________________ ISSN 2231-606X
Vol. 1(6), 30-41, Sept. (2011) Res.J.Chem.Sci.
International Science Congress Association 35
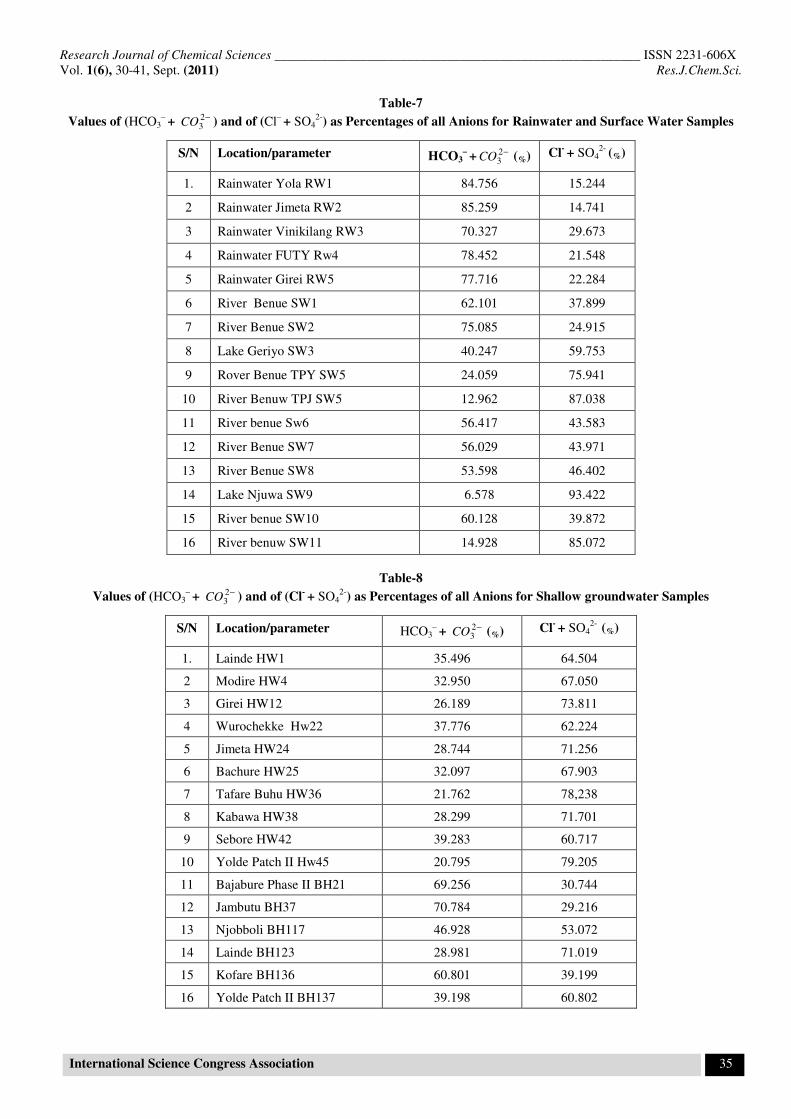
Table-7
Values of (HCO3–
+ −23CO ) and of (Cl
– + SO4
2-) as Percentages of all Anions for Rainwater and Surface Water Samples
S/N Location/parameter HCO3–
+−2
3CO (%) Cl
- + SO4
2- (%)
1. Rainwater Yola RW1 84.756 15.244
2 Rainwater Jimeta RW2 85.259 14.741
3 Rainwater Vinikilang RW3 70.327 29.673
4 Rainwater FUTY Rw4 78.452 21.548
5 Rainwater Girei RW5 77.716 22.284
6 River Benue SW1 62.101 37.899
7 River Benue SW2 75.085 24.915
8 Lake Geriyo SW3 40.247 59.753
9 Rover Benue TPY SW5 24.059 75.941
10 River Benuw TPJ SW5 12.962 87.038
11 River benue Sw6 56.417 43.583
12 River Benue SW7 56.029 43.971
13 River Benue SW8 53.598 46.402
14 Lake Njuwa SW9 6.578 93.422
15 River benue SW10 60.128 39.872
16 River benuw SW11 14.928 85.072
Table-8
Values of (HCO3–
+ −23CO ) and of (Cl
- + SO4
2-) as Percentages of all Anions for Shallow groundwater Samples
S/N Location/parameter HCO3–
+ −23CO (%) Cl
- + SO4
2- (%)
1. Lainde HW1 35.496 64.504
2 Modire HW4 32.950 67.050
3 Girei HW12 26.189 73.811
4 Wurochekke Hw22 37.776 62.224
5 Jimeta HW24 28.744 71.256
6 Bachure HW25 32.097 67.903
7 Tafare Buhu HW36 21.762 78,238
8 Kabawa HW38 28.299 71.701
9 Sebore HW42 39.283 60.717
10 Yolde Patch II Hw45 20.795 79.205
11 Bajabure Phase II BH21 69.256 30.744
12 Jambutu BH37 70.784 29.216
13 Njobboli BH117 46.928 53.072
14 Lainde BH123 28.981 71.019
15 Kofare BH136 60.801 39.199
16 Yolde Patch II BH137 39.198 60.802
Research Journal of Chemical Sciences _______________________________________________________ ISSN 2231-606X
Vol. 1(6), 30-41, Sept. (2011) Res.J.Chem.Sci.
International Science Congress Association 36
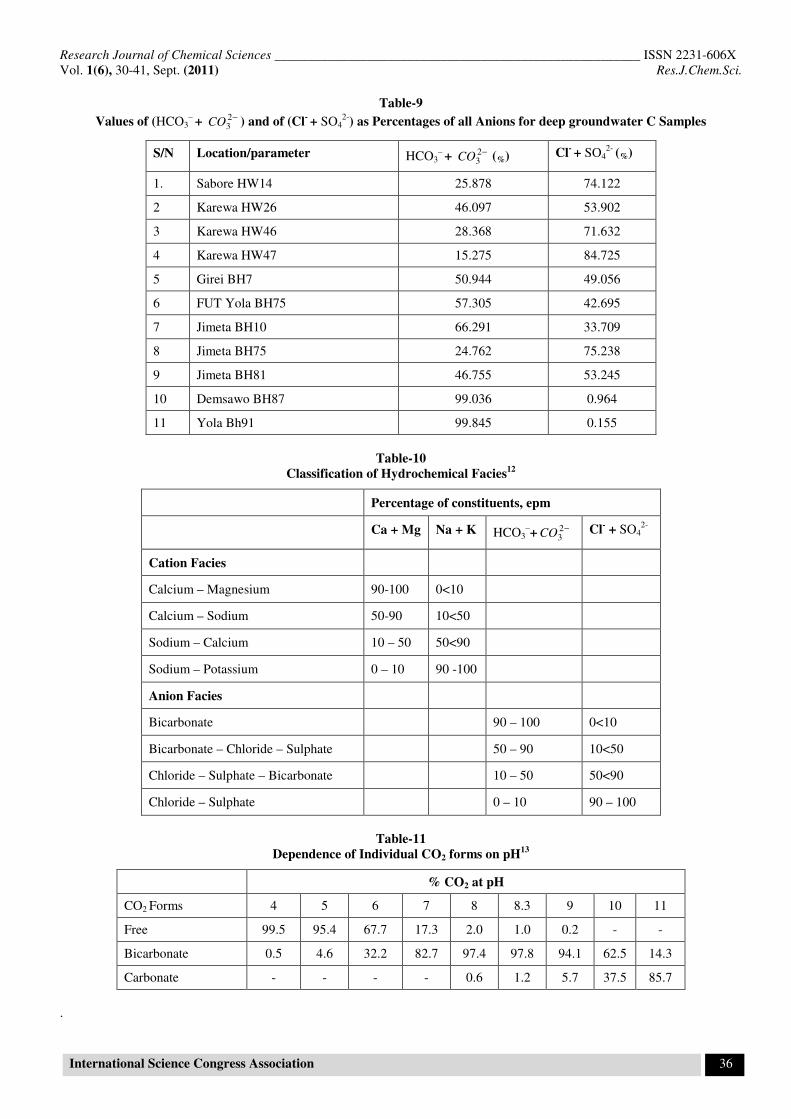
Table-9
Values of (HCO3–
+ −23CO ) and of (Cl
- + SO4
2-) as Percentages of all Anions for deep groundwater C Samples
S/N Location/parameter HCO3–
+ −23CO (%) Cl
- + SO4
2- (%)
1. Sabore HW14 25.878 74.122
2 Karewa HW26 46.097 53.902
3 Karewa HW46 28.368 71.632
4 Karewa HW47 15.275 84.725
5 Girei BH7 50.944 49.056
6 FUT Yola BH75 57.305 42.695
7 Jimeta BH10 66.291 33.709
8 Jimeta BH75 24.762 75.238
9 Jimeta BH81 46.755 53.245
10 Demsawo BH87 99.036 0.964
11 Yola Bh91 99.845 0.155
Table-10
Classification of Hydrochemical Facies12
Percentage of constituents, epm
Ca + Mg Na + K HCO3–+ −2
3CO Cl- + SO4
2-
Cation Facies
Calcium – Magnesium 90-100 0<10
Calcium – Sodium 50-90 10<50
Sodium – Calcium 10 – 50 50<90
Sodium – Potassium 0 – 10 90 -100
Anion Facies
Bicarbonate 90 – 100 0<10
Bicarbonate – Chloride – Sulphate 50 – 90 10<50
Chloride – Sulphate – Bicarbonate 10 – 50 50<90
Chloride – Sulphate 0 – 10 90 – 100
Table-11
Dependence of Individual CO2 forms on pH13
% CO2 at pH
CO2 Forms 4 5 6 7 8 8.3 9 10 11
Free 99.5 95.4 67.7 17.3 2.0 1.0 0.2 - -
Bicarbonate 0.5 4.6 32.2 82.7 97.4 97.8 94.1 62.5 14.3
Carbonate - - - - 0.6 1.2 5.7 37.5 85.7
.
Research Journal of Chemical Sciences _______________________________________________________ ISSN 2231-606X
Vol. 1(6), 30-41, Sept. (2011) Res.J.Chem.Sci.
International Science Congress Association 37
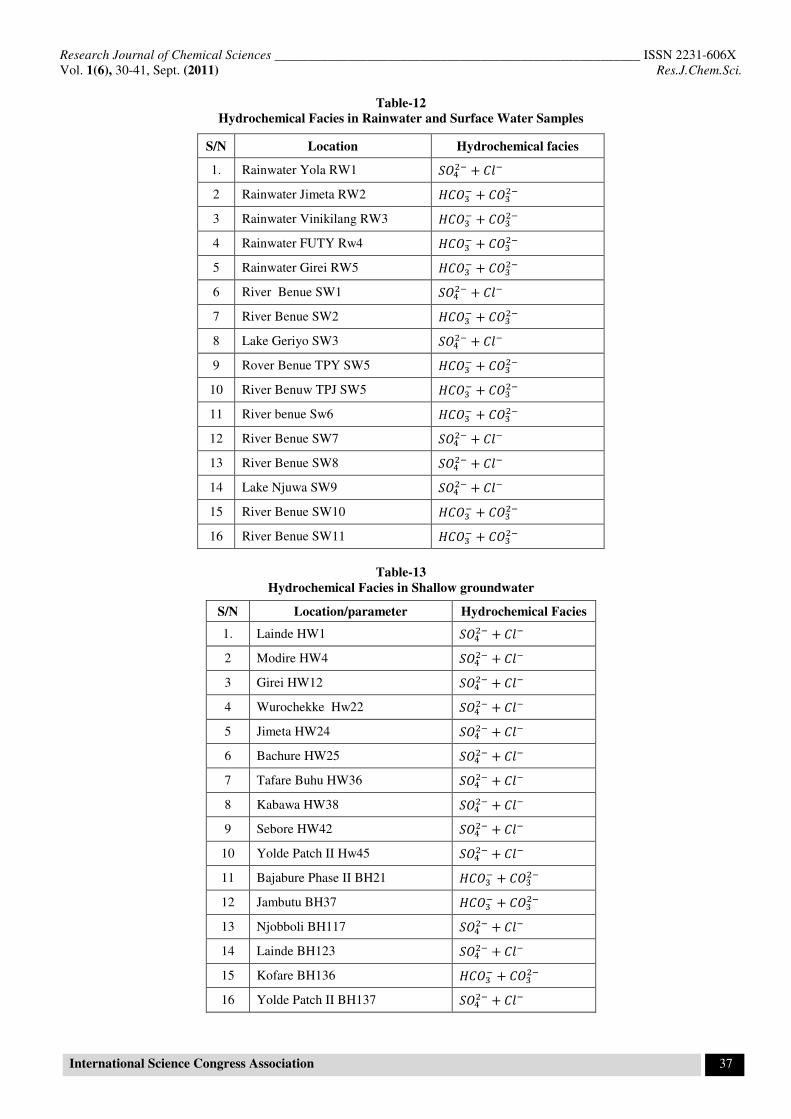
Table-12
Hydrochemical Facies in Rainwater and Surface Water Samples
S/N Location Hydrochemical facies
1. Rainwater Yola RW1 �����+ ��
�
2 Rainwater Jimeta RW2 �����+ ���
��
3 Rainwater Vinikilang RW3 �����+ ���
��
4 Rainwater FUTY Rw4 �����+ ���
��
5 Rainwater Girei RW5 �����+ ���
��
6 River Benue SW1 �����+ ��
�
7 River Benue SW2 �����+ ���
��
8 Lake Geriyo SW3 �����+ ��
�
9 Rover Benue TPY SW5 �����+ ���
��
10 River Benuw TPJ SW5 �����+ ���
��
11 River benue Sw6 �����+ ���
��
12 River Benue SW7 �����+ ��
�
13 River Benue SW8 �����+ ��
�
14 Lake Njuwa SW9 �����+ ��
�
15 River Benue SW10 �����+ ���
��
16 River Benue SW11 �����+ ���
��
Table-13
Hydrochemical Facies in Shallow groundwater
S/N Location/parameter Hydrochemical Facies
1. Lainde HW1 �����+ ��
�
2 Modire HW4 �����+ ��
�
3 Girei HW12 �����+ ��
�
4 Wurochekke Hw22 �����+ ��
�
5 Jimeta HW24 �����+ ��
�
6 Bachure HW25 �����+ ��
�
7 Tafare Buhu HW36 �����+ ��
�
8 Kabawa HW38 �����+ ��
�
9 Sebore HW42 �����+ ��
�
10 Yolde Patch II Hw45 �����+ ��
�
11 Bajabure Phase II BH21 �����+ ���
��
12 Jambutu BH37 �����+ ���
��
13 Njobboli BH117 �����+ ��
�
14 Lainde BH123 �����+ ��
�
15 Kofare BH136 �����+ ���
��
16 Yolde Patch II BH137 �����+ ��
�
Research Journal of Chemical Sciences _______________________________________________________ ISSN 2231-606X
Vol. 1(6), 30-41, Sept. (2011) Res.J.Chem.Sci.
International Science Congress Association 38
Thus the absence of some ions such as −23CO and SO4
2- and
the varied concentration levels of others such as Cl– and
HCO3– affect the types and number of mappable facies in
groundwater systems8.
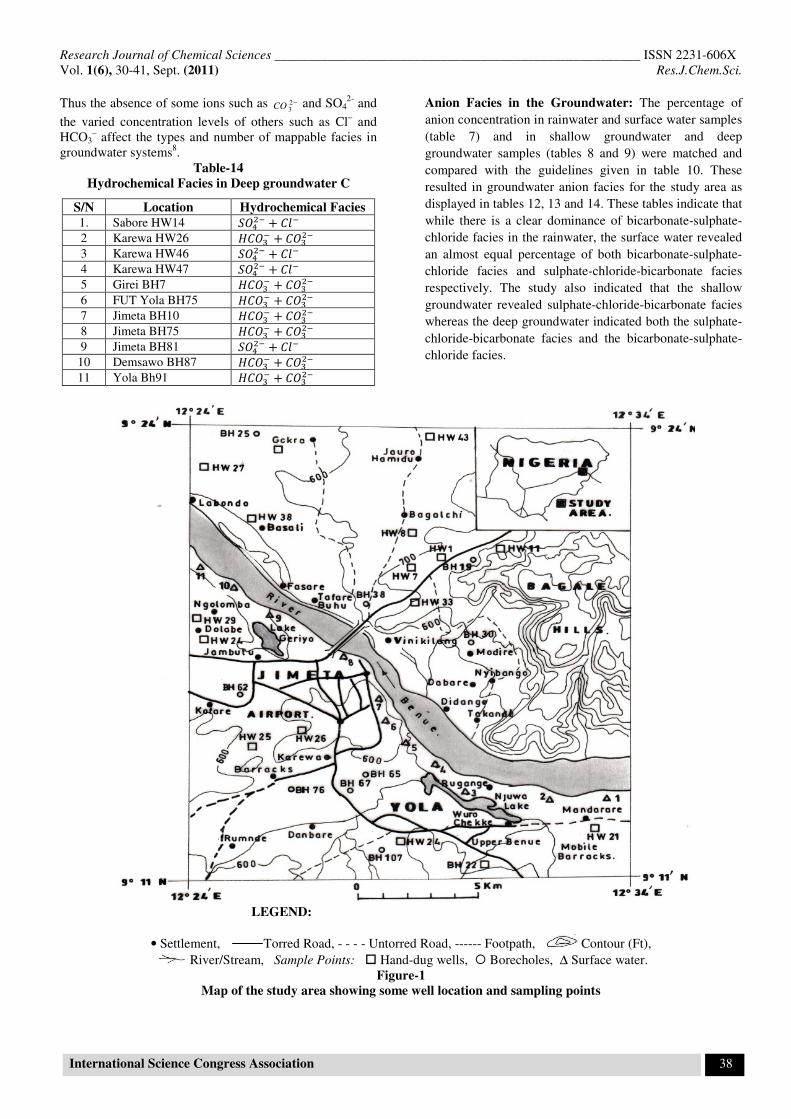
Table-14
Hydrochemical Facies in Deep groundwater C
S/N Location Hydrochemical Facies
1. Sabore HW14 �����+ ��
�
2 Karewa HW26 �����+ ���
��
3 Karewa HW46 �����+ ��
�
4 Karewa HW47 �����+ ��
�
5 Girei BH7 �����+ ���
��
6 FUT Yola BH75 �����+ ���
��
7 Jimeta BH10 �����+ ���
��
8 Jimeta BH75 �����+ ���
��
9 Jimeta BH81 �����+ ��
�
10 Demsawo BH87 �����+ ���
��
11 Yola Bh91 �����+ ���
��
Anion Facies in the Groundwater: The percentage of
anion concentration in rainwater and surface water samples
(table 7) and in shallow groundwater and deep
groundwater samples (tables 8 and 9) were matched and
compared with the guidelines given in table 10. These
resulted in groundwater anion facies for the study area as
displayed in tables 12, 13 and 14. These tables indicate that
while there is a clear dominance of bicarbonate-sulphate-
chloride facies in the rainwater, the surface water revealed
an almost equal percentage of both bicarbonate-sulphate-
chloride facies and sulphate-chloride-bicarbonate facies
respectively. The study also indicated that the shallow
groundwater revealed sulphate-chloride-bicarbonate facies
whereas the deep groundwater indicated both the sulphate-
chloride-bicarbonate facies and the bicarbonate-sulphate-
chloride facies.
LEGEND:
• Settlement, Torred Road, - - - - Untorred Road, ------ Footpath, Contour (Ft),
River/Stream, Sample Points: � Hand-dug wells, � Borecholes, ∆ Surface water.
Figure-1
Map of the study area showing some well location and sampling points
Research Journal of Chemical Sciences _______________________________________________________ ISSN 2231-606X
Vol. 1(6), 30-41, Sept. (2011) Res.J.Chem.Sci.
International Science Congress Association 39
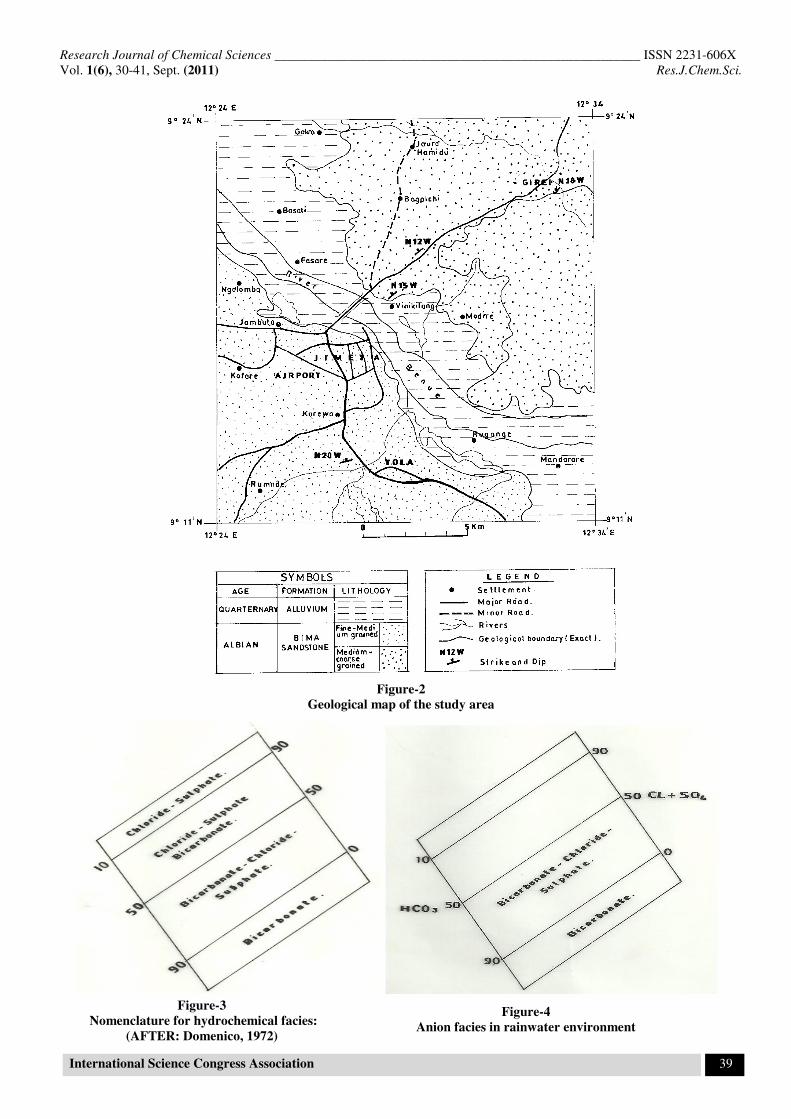
Figure-2
Geological map of the study area
Figure-3
Nomenclature for hydrochemical facies:
(AFTER: Domenico, 1972)
Figure-4
Anion facies in rainwater environment
Research Journal of Chemical Sciences _______________________________________________________ ISSN 2231-606X
Vol. 1(6), 30-41, Sept. (2011) Res.J.Chem.Sci.
International Science Congress Association 40
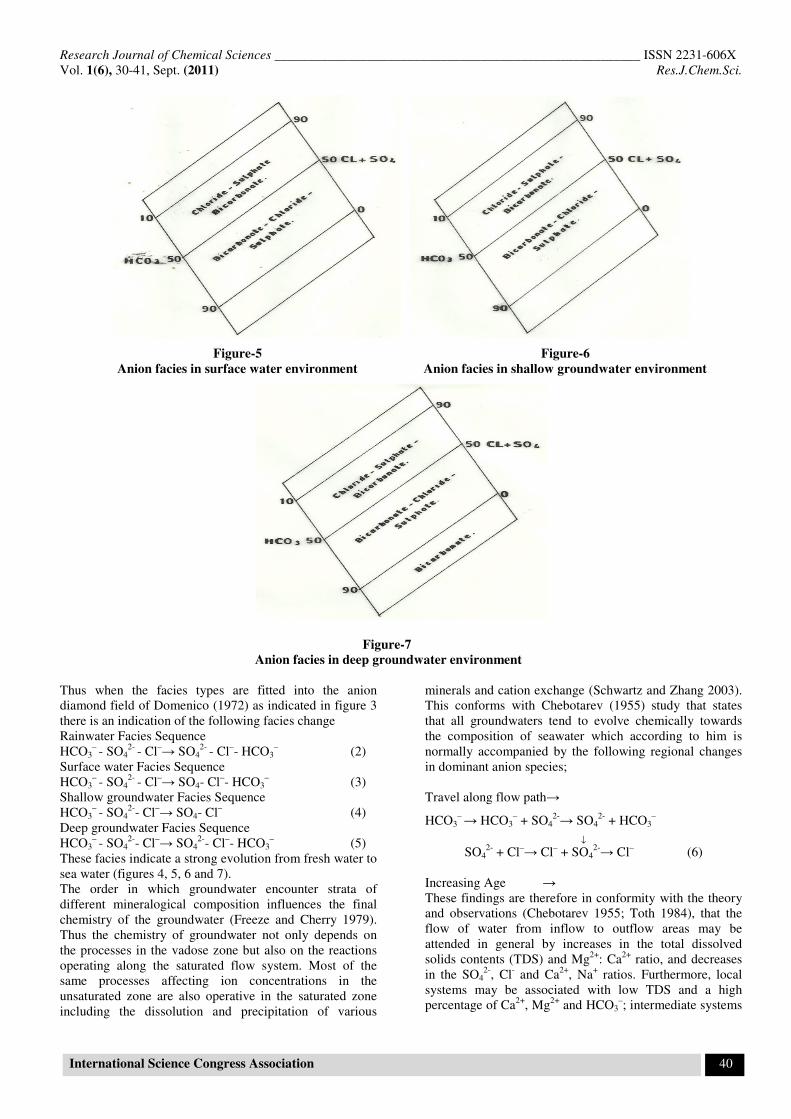
Thus when the facies types are fitted into the anion
diamond field of Domenico (1972) as indicated in figure 3
there is an indication of the following facies change
Rainwater Facies Sequence
HCO3– - SO4
2- - Cl
–→ SO4
2- - Cl
–- HCO3
– (2)
Surface water Facies Sequence
HCO3– - SO4
2- - Cl
–→ SO4- Cl
–- HCO3
– (3)
Shallow groundwater Facies Sequence
HCO3– - SO4
2-- Cl
–→ SO4- Cl
– (4)
Deep groundwater Facies Sequence
HCO3– - SO4
2-- Cl
–→ SO4
2-- Cl
–- HCO3
– (5)
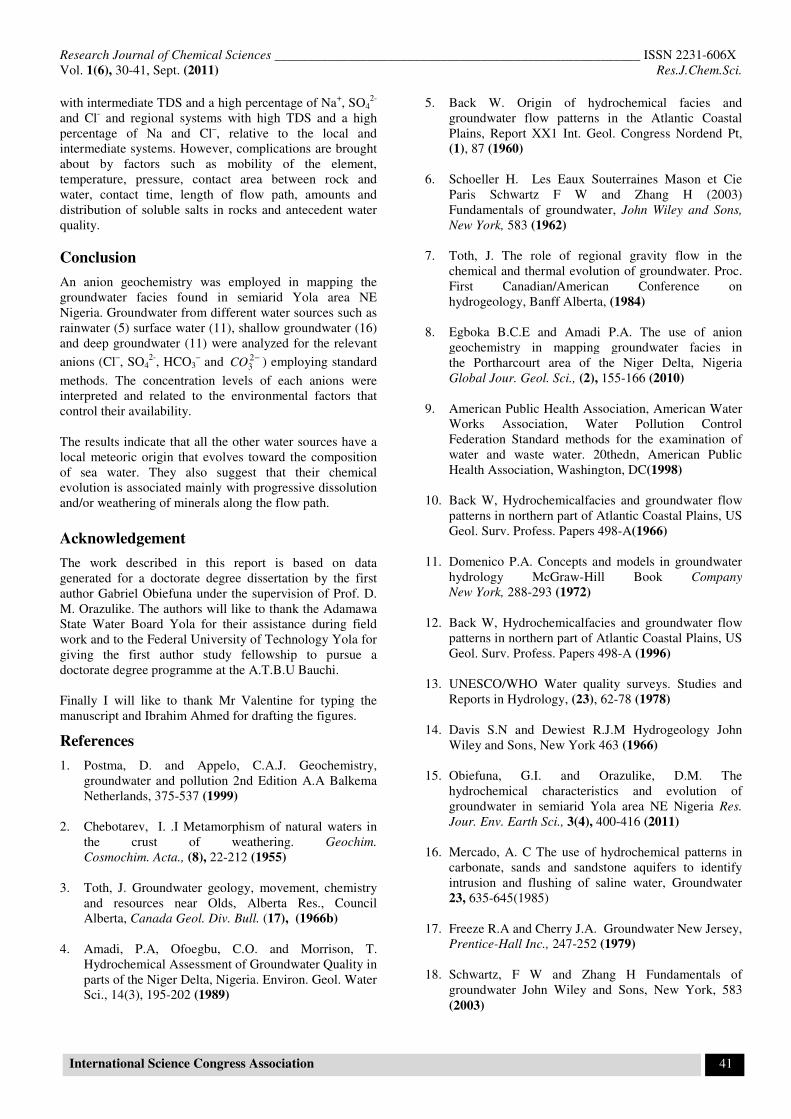
These facies indicate a strong evolution from fresh water to
sea water (figures 4, 5, 6 and 7).
The order in which groundwater encounter strata of
different mineralogical composition influences the final
chemistry of the groundwater (Freeze and Cherry 1979).
Thus the chemistry of groundwater not only depends on
the processes in the vadose zone but also on the reactions
operating along the saturated flow system. Most of the
same processes affecting ion concentrations in the
unsaturated zone are also operative in the saturated zone
including the dissolution and precipitation of various
minerals and cation exchange (Schwartz and Zhang 2003).
This conforms with Chebotarev (1955) study that states
that all groundwaters tend to evolve chemically towards
the composition of seawater which according to him is
normally accompanied by the following regional changes
in dominant anion species;
Travel along flow path→
HCO3– → HCO3
– + SO4
2-→ SO4
2- + HCO3
–
↓ SO4
2- + Cl
–→ Cl
– + SO4
2-→ Cl
– (6)
Increasing Age →
These findings are therefore in conformity with the theory
and observations (Chebotarev 1955; Toth 1984), that the
flow of water from inflow to outflow areas may be
attended in general by increases in the total dissolved
solids contents (TDS) and Mg2+
: Ca2+
ratio, and decreases
in the SO42-
, Cl- and Ca
2+, Na
+ ratios. Furthermore, local
systems may be associated with low TDS and a high
percentage of Ca2+
, Mg2+
and HCO3–; intermediate systems
Figure-5
Anion facies in surface water environment
Figure-6
Anion facies in shallow groundwater environment
Figure-7
Anion facies in deep groundwater environment
Research Journal of Chemical Sciences _______________________________________________________ ISSN 2231-606X
Vol. 1(6), 30-41, Sept. (2011) Res.J.Chem.Sci.
International Science Congress Association 41
with intermediate TDS and a high percentage of Na+, SO4
2-
and Cl- and regional systems with high TDS and a high
percentage of Na and Cl–, relative to the local and
intermediate systems. However, complications are brought
about by factors such as mobility of the element,
temperature, pressure, contact area between rock and
water, contact time, length of flow path, amounts and
distribution of soluble salts in rocks and antecedent water
quality.
Conclusion
An anion geochemistry was employed in mapping the
groundwater facies found in semiarid Yola area NE
Nigeria. Groundwater from different water sources such as
rainwater (5) surface water (11), shallow groundwater (16)
and deep groundwater (11) were analyzed for the relevant
anions (Cl–, SO4
2-, HCO3
– and −2
3CO ) employing standard
methods. The concentration levels of each anions were
interpreted and related to the environmental factors that
control their availability.
The results indicate that all the other water sources have a
local meteoric origin that evolves toward the composition
of sea water. They also suggest that their chemical
evolution is associated mainly with progressive dissolution
and/or weathering of minerals along the flow path.
Acknowledgement
The work described in this report is based on data
generated for a doctorate degree dissertation by the first
author Gabriel Obiefuna under the supervision of Prof. D.
M. Orazulike. The authors will like to thank the Adamawa
State Water Board Yola for their assistance during field
work and to the Federal University of Technology Yola for
giving the first author study fellowship to pursue a
doctorate degree programme at the A.T.B.U Bauchi.
Finally I will like to thank Mr Valentine for typing the
manuscript and Ibrahim Ahmed for drafting the figures.
References
1. Postma, D. and Appelo, C.A.J. Geochemistry,
groundwater and pollution 2nd Edition A.A Balkema
Netherlands, 375-537 (1999)
2. Chebotarev, I. .I Metamorphism of natural waters in
the crust of weathering. Geochim.
Cosmochim. Acta., (8), 22-212 (1955)
3. Toth, J. Groundwater geology, movement, chemistry
and resources near Olds, Alberta Res., Council
Alberta, Canada Geol. Div. Bull. (17), (1966b)
4. Amadi, P.A, Ofoegbu, C.O. and Morrison, T.
Hydrochemical Assessment of Groundwater Quality in
parts of the Niger Delta, Nigeria. Environ. Geol. Water
Sci., 14(3), 195-202 (1989)
5. Back W. Origin of hydrochemical facies and
groundwater flow patterns in the Atlantic Coastal
Plains, Report XX1 Int. Geol. Congress Nordend Pt,
(1), 87 (1960)
6. Schoeller H. Les Eaux Souterraines Mason et Cie
Paris Schwartz F W and Zhang H (2003)
Fundamentals of groundwater, John Wiley and Sons,
New York, 583 (1962)
7. Toth, J. The role of regional gravity flow in the
chemical and thermal evolution of groundwater. Proc.
First Canadian/American Conference on
hydrogeology, Banff Alberta, (1984)
8. Egboka B.C.E and Amadi P.A. The use of anion
geochemistry in mapping groundwater facies in
the Portharcourt area of the Niger Delta, Nigeria
Global Jour. Geol. Sci., (2), 155-166 (2010)
9. American Public Health Association, American Water
Works Association, Water Pollution Control
Federation Standard methods for the examination of
water and waste water. 20thedn, American Public
Health Association, Washington, DC(1998)
10. Back W, Hydrochemicalfacies and groundwater flow
patterns in northern part of Atlantic Coastal Plains, US
Geol. Surv. Profess. Papers 498-A(1966)
11. Domenico P.A. Concepts and models in groundwater
hydrology McGraw-Hill Book Company
New York, 288-293 (1972)
12. Back W, Hydrochemicalfacies and groundwater flow
patterns in northern part of Atlantic Coastal Plains, US
Geol. Surv. Profess. Papers 498-A (1996)
13. UNESCO/WHO Water quality surveys. Studies and
Reports in Hydrology, (23), 62-78 (1978)
14. Davis S.N and Dewiest R.J.M Hydrogeology John
Wiley and Sons, New York 463 (1966)
15. Obiefuna, G.I. and Orazulike, D.M. The
hydrochemical characteristics and evolution of
groundwater in semiarid Yola area NE Nigeria Res.
Jour. Env. Earth Sci., 3(4), 400-416 (2011)
16. Mercado, A. C The use of hydrochemical patterns in
carbonate, sands and sandstone aquifers to identify
intrusion and flushing of saline water, Groundwater
23, 635-645(1985)
17. Freeze R.A and Cherry J.A. Groundwater New Jersey,
Prentice-Hall Inc., 247-252 (1979)
18. Schwartz, F W and Zhang H Fundamentals of
groundwater John Wiley and Sons, New York, 583
(2003)
Top Related