


Languages
Pages
Legal


The Road to Prosperity
What We Need to Do
CogentStrategies
Asa J. Beck, CPAPresident, Cogent Strategies, LLC
Member of Policy Committee, Coalition for a Prosperous America

Asa Beck, Data, and Actions to Take
Cogent Strategies, LLC www.cogentstrategies.com
•CPA, Consultant, Contract CFO•BS Accounting, MS Finance, taught
university level finance•Member Financial Executives
International•Here to inform and motivate to Action•Goal is to show you how to be
prosperous and improve the economy for everyone
•I am here to tell you what actions will do that

What is Happening in the Economy?
Cogent Strategies, LLC www.cogentstrategies.com
•The economy is in a slow uneven recovery
•Banks are improving, but many struggle
•Full time employment is growing slowly
•There will be low growth this quarter•The trade deficit is rising again•The federal deficit is out of control•The dollar is better than Euro, but
weak•Interest rates must rise soon•We can take steps to return to
prosperity
Five Things to Remember! Cogent Strategies, LLC www.cogentstrategies.com
•Have or create a cash reserve•Be cash flow positive•Spend your money close to home, very
close•Federal spending must be fixed quickly•It is all about the industrial base
improving to create jobs and fund government
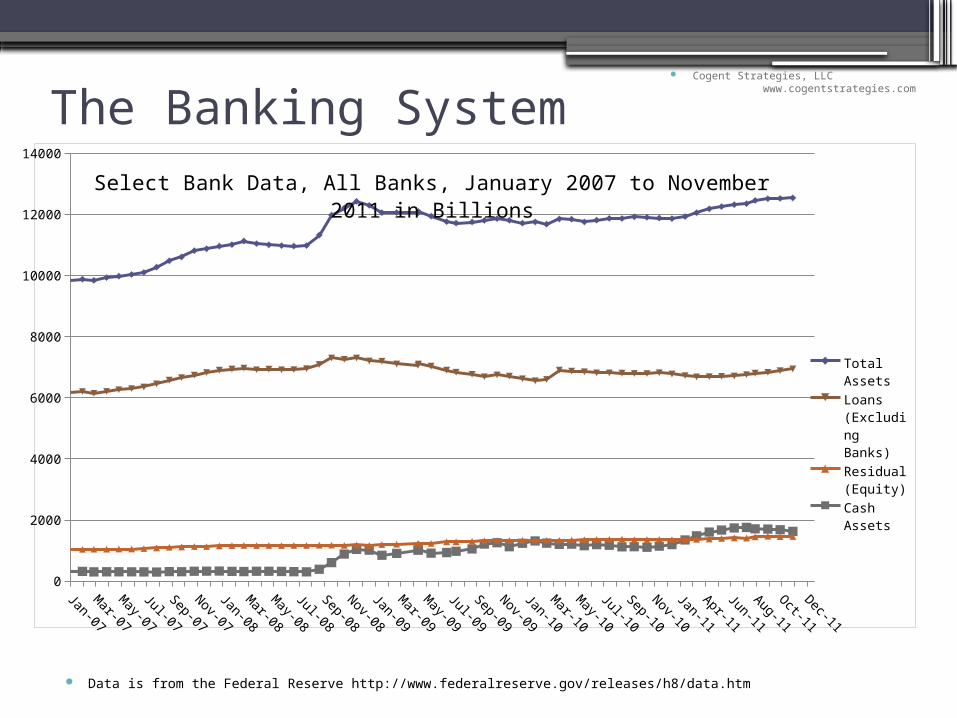
The Banking System Cogent Strategies, LLC www.cogentstrategies.com
Data is from the Federal Reserve http://www.federalreserve.gov/releases/h8/data.htm
0
2000
4000
6000
8000
10000
12000
14000
Total Assets
Loans (Exclud-ing Banks)
Residual (Equity)
Cash Assets
Select Bank Data, All Banks, January 2007 to November 2011 in Billions

Condition of Creditors Improves Cogent Strategies, LLC www.cogentstrategies.com
Charge offs total 1.53% and Delinquencies are 5.61% overall. Data is from the Federal Reserve http://www.federalreserve.gov/releases/chargeoff/
Sep-05 Mar-06 Sep-06 Mar-07 Sep-07 Mar-08 Sep-08 Mar-09 Aug-09 Mar-10 Aug-10 Feb-11 Aug-110
2
4
6
8
10
12
Charge Offs RE LoansCharge off All LoansDelinquencies RE LoansDelinquencies All Loans
Percentage of Loans Charged Off or Delinquent, All Banks, Not Seasonally Adjusted, September 2005 to Sept 2011

FDIC Bank Profits Cogent Strategies, LLC www.cogentstrategies.com
Data is from FDIC http://www.fdic.gov/news/news/press
Dec-04 Jun-05 Dec-05 Jun-06 Dec-06 Jun-07 Dec-07 Jun-08 Dec-08 Jun-09 Dec-09 Jun-10 Dec-10 Jun-11 Dec-11 Jun-12
-50
-40
-30
-20
-10
0
10
20
30
40
50
FDIC Bank Profits in Billions of Dollars
FDIC Bank Profits
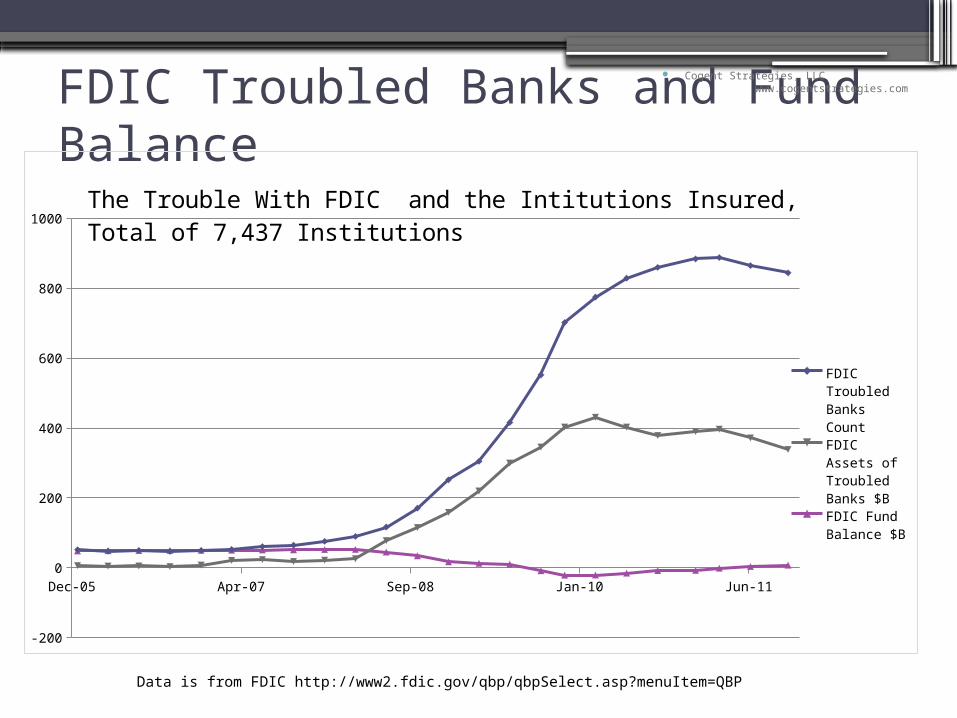
FDIC Troubled Banks and Fund Balance
Cogent Strategies, LLC www.cogentstrategies.com
Data is from FDIC http://www2.fdic.gov/qbp/qbpSelect.asp?menuItem=QBP
Dec-05 Apr-07 Sep-08 Jan-10 Jun-11
-200
0
200
400
600
800
1000
FDIC Troubled Banks CountFDIC As-sets of Troubled Banks $B
FDIC Fund Balance $B
The Trouble With FDIC and the Intitutions Insured, Total of 7,437 Institu-tions

Economic Factors Cogent Strategies, LLC www.cogentstrategies.com
Source : Bureau of Labor Statistics, Current Population Survey http://data.bls.gov/PDQ/servlet/SurveyOutputServlet?request_action=wh&graph_name=LN_cpsbref3
Unemployment is a lagging indicator it is currently 8.5%
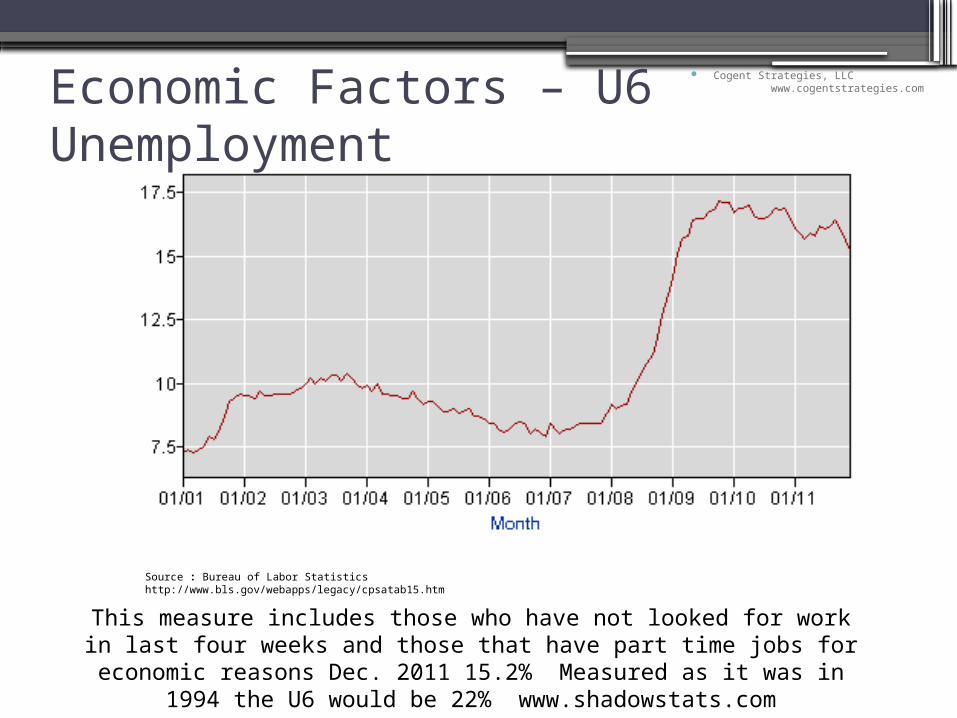
Economic Factors – U6 Unemployment
Cogent Strategies, LLC www.cogentstrategies.com
Source : Bureau of Labor Statistics http://www.bls.gov/webapps/legacy/cpsatab15.htm
This measure includes those who have not looked for work in last four weeks and those that have part time jobs for economic reasons Dec. 2011 15.2% Measured as it was in 1994 the U6 would be 22% www.shadowstats.com

Economic Factors – Manuf. Employment
Cogent Strategies, LLC www.cogentstrategies.com
Source : Bureau of Labor Statistics http://www.bls.gov/iag/tgs/iag31-33.htm
Manufacturing employment has fallen 5.325M jobs in 11 years, but is beginning to rise. The total is 11,790,000 at the end of December

Economic Factors – Total Employment
Cogent Strategies, LLC www.cogentstrategies.com
Source : Bureau of Labor Statistics http://www.bls.gov/webapps/legacy/cpsatab9.htm
Total full time employment has not gone down as much this winter as last
May-05 Oct-06 Feb-08 Jul-09 Nov-10 Apr-12 Aug-13100000
105000
110000
115000
120000
125000 Full Time Employment, not seasonally adjusted
Full Time Employment

Economic Factors – Employment % of Pop
Cogent Strategies, LLC www.cogentstrategies.com
Source : Bureau of Labor Statistics http://www.bls.gov/webapps/legacy/cpsatab9.htm
This looks similar to the full time employment curve and shows new normal
May-05 Oct-06 Feb-08 Jul-09 Nov-10 Apr-12 Aug-1332.00%
33.00%
34.00%
35.00%
36.00%
37.00%
38.00%
39.00%
40.00%
41.00%
42.00%
Percent of Population Employed Full Time January 2007 to Devember 2011
Percent of Population Employed

Economic Factors – How Many Jobs Cogent Strategies, LLC www.cogentstrategies.com
•7.992 M full time jobs lost since Dec of 2007•Not all jobs are equal•Manufacturing Jobs tend to pay better•They also create two support jobs for each one•Replacing the 5.325 M manufacturing jobs lost would create 15.925 M•This replaces the jobs lost and more•Restoring the United States industrial base is the Road to Prosperity
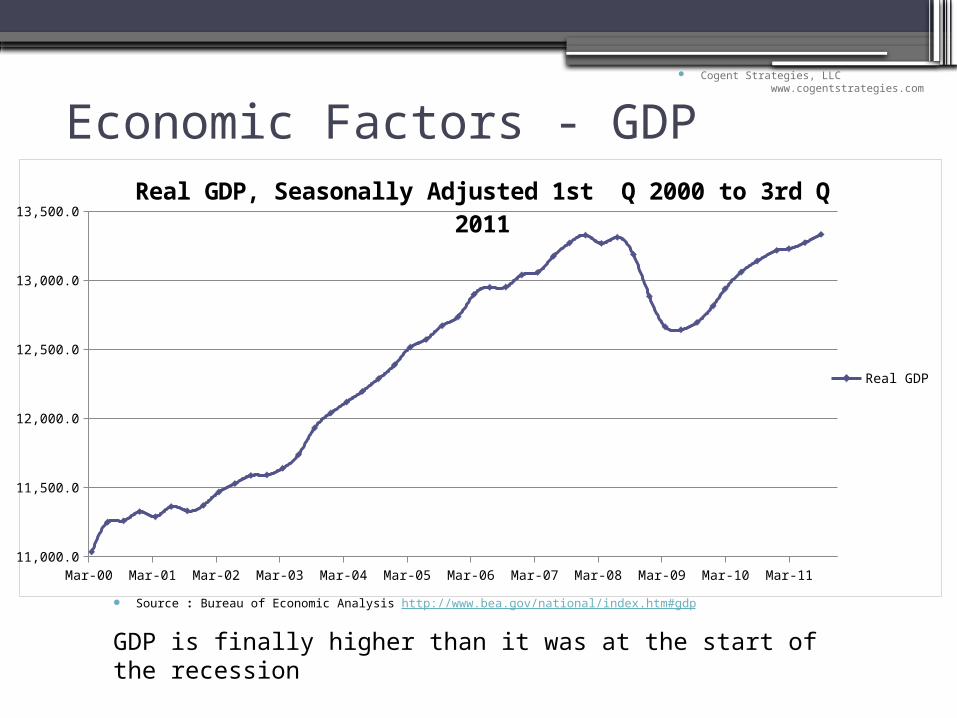
Economic Factors - GDP Cogent Strategies, LLC
www.cogentstrategies.com
Source : Bureau of Economic Analysis http://www.bea.gov/national/index.htm#gdp
GDP is finally higher than it was at the start of the recession
Mar-00 Mar-01 Mar-02 Mar-03 Mar-04 Mar-05 Mar-06 Mar-07 Mar-08 Mar-09 Mar-10 Mar-1111,000.0
11,500.0
12,000.0
12,500.0
13,000.0
13,500.0
Real GDP
Real GDP, Seasonally Adjusted 1st Q 2000 to 3rd Q 2011

Economic Factors – New Home Sales
Cogent Strategies, LLC www.cogentstrategies.com
Source : US Census Bureau http://www.census.gov/const/soldreg.pdf
New home sales are at near record low levels
Apr-04 Oct-04 Apr-05 Oct-05 Apr-06 Oct-06 Apr-07 Oct-07 Apr-08 Oct-08 Apr-09 Oct-09 Apr-10 Oct-10 Apr-11 Oct-110
200
400
600
800
1000
1200
1400
1600
Seasonally Adjusted New Home Sales Annual Rate of Sale

Economic Factors - Manufacturing Cogent Strategies, LLC
www.cogentstrategies.com
Source : US Census Bureau http://www.census.gov/cgi-bin/briefroom/BriefRm
Manufacturing is recovering and it underpins the improvement
Jan-07 Aug-07 Feb-08 Sep-08 Mar-09 Oct-09 May-10 Nov-10 Jun-11350
450
550
650
750
850
950
InventoriesShipmentsUnfilled Orders
Census Bureau Data on Manufacturers' Orders, Inventories, and Shipments January 2007 to November 2011

What Can We Do – Cash and Profits
• Have a cash reserve• If you don’t have one, create one• Hold cash for when interest rates rise• Conserve capital and contain costs• Your business needs to be positive cash flow• Be sure you make a profit• You have survived now prosper

So What Can We Do - Measure Cogent Strategies, LLC www.cogentstrategies.com
Understand your business.• Assess what your customers truly value• Make a new plan based on today’s reality• How are you better than your competition• Have Key Performance Indicators (KPIs)• Measure & adjust, then do it again

• “Do what you should have been doing all along”• Be sure you hold on to your best people
• Train or coach those who are good• Consolidate positions or replace others
• Perform for the short-term, plan for the long-term• Be part of the recovery
Improve your team

• Provides free professional services in law, accounting, management, and Sales/Marketing
• Maximum of three hours for each company from each person in a two month period
• Can help businesses that need a little guidance
• It is their way of giving back to the community• www.denverbusinessadvisors.com• Details are listed on the web site
Denver Business Advisors
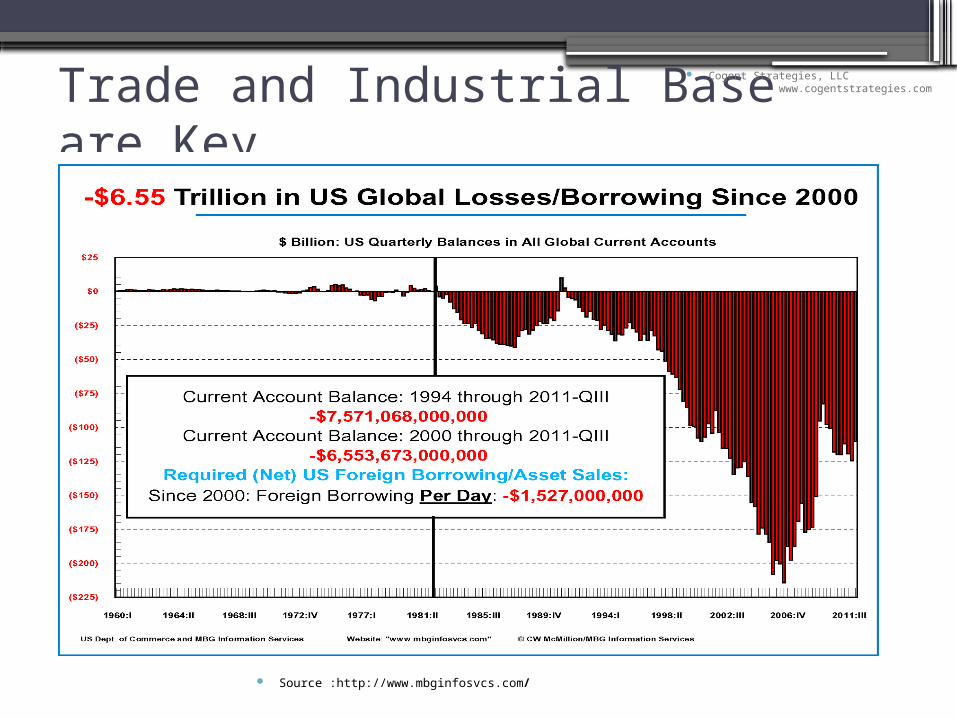
Trade and Industrial Base are Key Cogent Strategies, LLC www.cogentstrategies.com
Source :http://www.mbginfosvcs.com/

We Must Make More of What We Use
Cogent Strategies, LLC www.cogentstrategies.com
From international Monetary fund 1980 to 2008 http://en.wikipedia.org/wiki/File:Cumulative_Current_Account_Balance.png

Trade Balance by Country Cogent Strategies, LLC www.cogentstrategies.com
From United States International Trade Commission http://dataweb.usitc.gov/scripts/cy_m3_run.asp
Country Imports Exports Balance
Millions of Dollars 2010
China $295,544.5 $65,123.9 ($230,420.6)
Mexico$176,308.
7$105,717.
7($70,591.0
)
Canada $224,584.1 $171,695.2 ($52,888.8)
Japan $96,001.8 $47074.3 ($48,927.5)
Germany $69,790.0 $40,229.1 ($29,560.9)
Ireland $28,101.8 $6,969.3 ($21,132.5)
Venezuela $27,339.4 $8,621.5 ($18,717.9)
Nigeria $19,474.0 $3,602.3($15,871.7
)
Italy $26,232.2 $11,202.3($15,029.9
)
Malaysia $23,252.0 $8,911.8($14,340.1
)
Country Imports Exports Balance
Millions of Dollars 2010
Netherlands $15,819.6 $29,168.9 $13,349.3
Hong Kong $3,534.7 $15,219.5 $11,684.7
Australia $7,997.8 $18,243.7 $10,245.9
United Arab Em $1,514.9 $11,154.4 $9,639.5
Belgium $13,736.1 $19,406.8 $5,670.8
Singapore $15,587.9 $19,923.6 $4,335.8
Panama $296.0 $4,063.2 $3,767.2
Turkey $3,648.8 $6,897.9 $3,249.1
Egypt $2,077.7 $5,215.6 $3,137.9
Chile $6,047.2 $8,693.5 $2,646.3

Spend Money Domestically Cogent Strategies, LLC www.cogentstrategies.com
With Weakening Dollar Buy Close to Home• It is not easy, but usually you can• Think of your spending like votes• Japan, Germany, & UK Manufacture, why• Citizens buy in their own self interest
• Food, meat, produce, and dairy• Automobiles, computers, & yard equipment
• As dollar weakens, imports will cost more• The challenge, 90% of spending on USA

Our Borrowing is Out of Control Cogent Strategies, LLC www.cogentstrategies.com
Source : White House Office of Management and Budget http://www.whitehouse.gov/omb/budget/Historicals/ US Census Bureau, Foreign Trade Division http://www.census.gov/foreign-trade/statistics/historical/gands.txt
Estimates for 2011 are from the Office of Management and Budget
19601970
19801990
20002010
(300,000)
200,000
700,000
1,200,000
1,700,000
2,200,000 Trade and Federal Budget Deficits 1960 through
2011
Trade DeficitFederal DeficitCombined Deficits
Years from 1960 through 2011
Mil
lions
of
Doll
ars
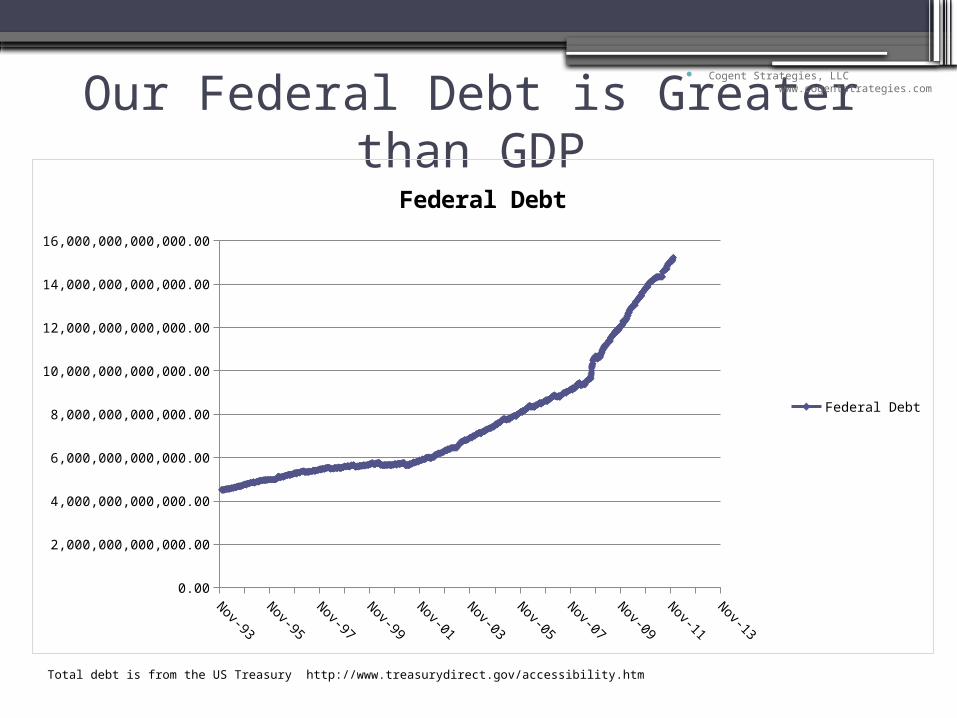
Our Federal Debt is Greater than GDP
Cogent Strategies, LLC www.cogentstrategies.com
Total debt is from the US Treasury http://www.treasurydirect.gov/accessibility.htm
Nov-93
Nov-94
Nov-95
Nov-96
Nov-97
Nov-98
Nov-99
Nov-00
Nov-01
Nov-02
Nov-03
Nov-04
Nov-05
Nov-06
Nov-07
Nov-08
Nov-09
Nov-10
Nov-11
Nov-12
Nov-13
0.00
2,000,000,000,000.00
4,000,000,000,000.00
6,000,000,000,000.00
8,000,000,000,000.00
10,000,000,000,000.00
12,000,000,000,000.00
14,000,000,000,000.00
16,000,000,000,000.00
Federal Debt
Federal Debt
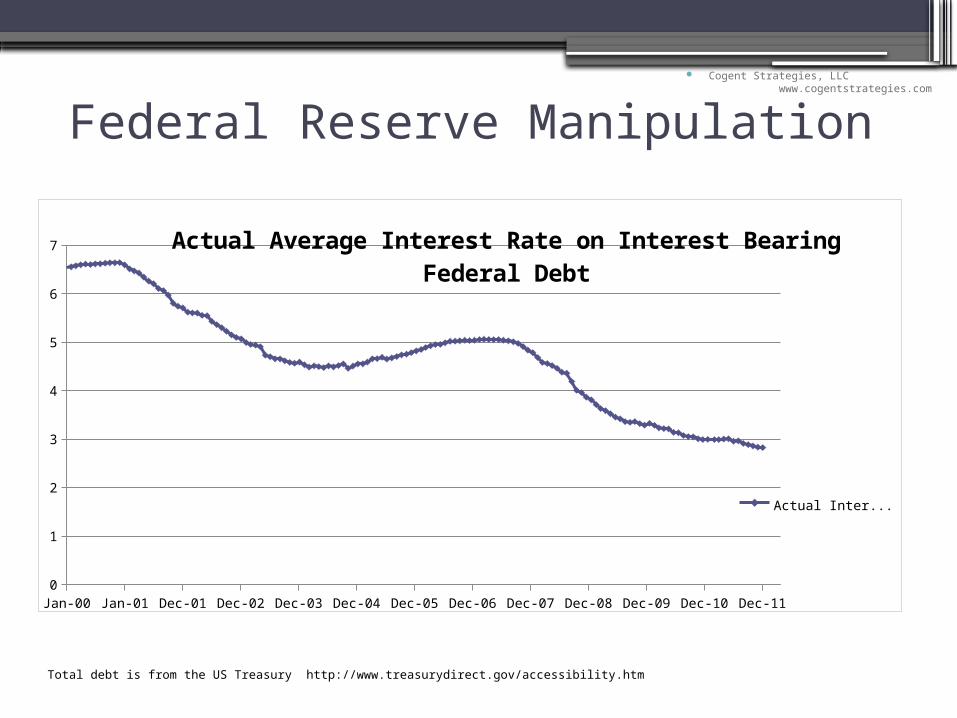
Federal Reserve Manipulation Cogent Strategies, LLC www.cogentstrategies.com
Total debt is from the US Treasury http://www.treasurydirect.gov/accessibility.htm
Jan-00 Jan-01 Dec-01 Dec-02 Dec-03 Dec-04 Dec-05 Dec-06 Dec-07 Dec-08 Dec-09 Dec-10 Dec-110
1
2
3
4
5
6
7 Actual Average Interest Rate on Interest Bearing Federal Debt
Actual Interest R...

Interest Expense is Artificially Low Cogent Strategies, LLC www.cogentstrategies.com
Total debt is from the US Treasury http://www.treasurydirect.gov/accessibility.htm
Jan-00 May-01 Oct-02 Feb-04 Jun-05 Nov-06 Mar-08 Aug-09 Dec-10 20.00
30.00
40.00
50.00
60.00
70.00
80.00
90.00
100.00
ActualAverage RateAt 7%
Interest Per month on Actual National Debt January 2000 to December 2011 with Actual and Alternate Rates
Average rate is from Jan 2000 to Dec 2007 at 5.272%http://www.treasurydirect.gov/NP/NPGateway
Government Policies Impacting Economy
Cogent Strategies, LLC www.cogentstrategies.com
• Demand 90% of our tax money be spent here
• Be active and help drive change• Countries continue to manipulate their
currencies, seek correction HR 639• Border adjustable Value Added Taxes add to
the challenge and can be fixed• Imports need to be held to same standards
of quality and safety as domestic companies• Push back on anything that will raise
expenses or increase debt

US Dollar Will Continue to Weaken Cogent Strategies, LLC www.cogentstrategies.com
Source : US Federal Reserve http://www.federalreserve.gov/releases/h10/Summary/
The value of the US Dollar will continue to fall in relation to other currencies due to are large deficits making imports more expensive and domestic products more competitive over time. This helps domestic producersOnly the hard fall of the Euro has helped this over the last few months.
Mar-00 Jul-01 Dec-02 Apr-04 Sep-05 Jan-07 Jun-08 Oct-09 Feb-1190
95
100
105
110
115
120
125
130
Broad Foreign Exhange Rate, Trade Weighted August 2000 to December 2011

Dollar Weakening Requires Change
Cogent Strategies, LLC www.cogentstrategies.com
• Find a domestic source for products• If they are too expensive buy a little now• Bring any off shoring of jobs back home• Labor is more than just rate it is units too• Getting ahead on labor while unemployment
is high will be viewed later as a smart move• Buy from a US company if you can, but at
least buy US made products

Summary
•Have or create a cash reserve•Be cash flow positive•Spend your money close to home, very close•The challenge 90% of spending on USA•Federal spending must be fixed quickly•Be vocal with your representatives•It is all about the industrial base improving to
create jobs and fund government•Help me spread the word to others
Cogent Strategies, LLC www.cogentstrategies.com

• Questions and Answers• www.cogentstrategies.com• Contact information:
Asa J. Beck, PresidentCogent Strategies, [email protected]
See links on our site for American Products
Cogent Strategies, LLC www.cogentstrategies.com
Top Related