


Languages
Pages
Legal

1
TheRetirementGlidepath:AnInternationalPerspective
JavierEstradaIESEBusinessSchool,DepartmentofFinance,Av.Pearson21,08034Barcelona,Spain
Tel:+34932534200,Fax:+34932534343,Email:[email protected]
Abstract Allindividualsneedtodecidehowmuchtosaveduringtheirworkingyears,howmuchtospendduringretirement,andtheassetallocationoftheirportfolioinbothperiods.Aportfolio’sexposuretostocksandbondsaffectskeyvariables,suchastheprobabilityofportfoliofailure,thedegreeofdownsideprotection,andtheexpectedbequest;howshouldthisexposureevolveduringretirementistheultimate issueexplored inthisarticle.Afterconsideringdeclining‐equity,rising‐equity,andstaticglidepaths,thecomprehensiveinternationalevidencefrom19countriesandtheworldmarketover110yearsconsideredhereultimatelysuggeststhatbothanall‐equityportfolioanda60‐40stock‐bondallocationaresimpleandveryeffectivestrategiesforretireestoimplement.
July,2015
1.Introduction
Saving for retirement and spending during retirement requires individuals to choose
their savings rate, withdrawal rate, and asset allocation. The savings rate concerns the
accumulationperiod,thewithdrawalrateconcernstheretirementordistributionperiod,andthe
assetallocationconcernsbothperiods.Thislastvariableisthemainfocusofthisarticle.
Lifecyclestrategies,onwhichtarget‐datefundsarebased,graduallydecreaseaportfolio’s
exposuretostocks,andincreaseitsexposuretobonds,thusmakingtheportfolio increasingly
conservativeovertime.Awell‐knownexampleofthisapproachisthe‘ageinbonds’rule,which
suggeststhattheproportionofbondsinanindividual’sportfolioshouldbeequaltohisage,and
thatofstocksequalto100minushisage.Thus,anindividualshouldhavea70‐30stock‐bond
allocationwhenheis30anda35‐65allocationwhenheis65.Somevariationsofthisrulehave
been proposed, such as exposure to stocks equal to 110–Age or 120–Age, but their common
characteristicisadeclining‐equityglidepath.1
Thisconventionalwisdom,however,isbeingchallenged.Focusingontheaccumulation
period and using a comprehensive sample of 19 countries and two regions over a 110‐year
period,Estrada(2014a)findsthatstrategiesthatincreasetheexposuretostocksovertime,thus
IwouldliketothankTomAabo,RobArnott,RosyMacedo,JackRader,RawleyThomas,andBillZiembafortheircomments.JavierZazurcaprovidedvaluableresearchassistance.Theviewsexpressedbelowandanyerrorsthatmayremainareentirelymyown.1Dolvinetal(2010)findthatmosttarget‐datefundsimplementsimilarstrategies,mostofthemcloselyresemblingthe120–Agerule.
2
makingtheportfolioincreasinglyaggressive,providebothahigherupsidepotentialandbetter
downsideprotectionthandolifecyclestrategies.Shiller(2005),BasuandDrew(2009),Arnott
(2012),andArnottetal(2013)alsoarguethatarising‐equityglidepathmaybeabetterchoice
forindividualssavingforretirementthanadeclining‐equityglidepath.
Furthermore, focusing on the retirement period, Pfau and Kitces (2014) argue that a
rising‐equityglidepathlowerstheprobabilityoffailurerelativetoadeclining‐equityglidepath.
Putdifferently, if retireesmake theirportfoliosmoreaggressiveover time, theywould face a
lowerprobabilityofrunningoutofmoneythaniftheyfollowedalifecyclestrategy.Interestingly,
however, Pfau and Kitces (2014) side with the conventional wisdom (a declining‐equity
glidepath)duringtheaccumulationperiod,andultimatelyrecommendaU‐shapedglidepath.In
otherwords, theysuggest that individualsshouldgraduallydecrease theirexposure tostocks
(andincreasetheirexposuretobonds)whilesavingforretirement,haveaminimumexposureto
stocks at the time of retirement, and then gradually increase their exposure to stocks (and
decreasetheirexposuretobonds)duringretirement.
Asfarastheretirementperiodisconcerned,thecomprehensiveinternationalevidence
discussedinthisarticlepointsintheoppositedirection;thatis,individualsshoulddecreasetheir
exposuretostocks(andincreasetheirexposuretobonds)duringretirement,thusmakingtheir
portfolios increasingly conservative over time. Interestingly, then, the combined results of
Estrada(2014a)andthosediscussedinthisarticlesuggestthatindividualsshouldimplementan
invertedU‐shapedglidepath;thatis,theyshouldgraduallyincreasetheirexposuretostockswhile
savingforretirement,haveamaximumexposuretostocksatthetimeofretirement,andthen
gradually decrease their exposure to stocks during retirement. This recommendation, that
followsfromathoroughempiricalanalysis,istheoppositeoftheU‐shapedglidepaththatPfau
andKitces(2014)suggest.
That said, the recommendation of an inverted U‐shaped glidepath applies when
consideringonlyrising‐equityanddeclining‐equitystrategies.Estrada(2014a) focuseson the
accumulationperiodandfindssupportforbothanall‐equitystrategyanda60‐40stock‐bond
allocation. This article focuses on the retirement period but the evidence points in the same
direction; that is, it supports a portfolio fully invested in stocks as the best overall strategy
(althoughmanyretireeswouldbereluctanttoimplementit),anda60‐40stock‐bondallocation
asaveryeffectivestrategy(whichmaybepsychologicallyeasierforretireestoimplement).Given
that many individuals may fail to periodically adjust their portfolios in the methodical way
requiredbyrising‐equityordeclining‐equityglidepaths,theall‐equityandthe60‐40strategies
duringboththeaccumulationandtheretirementperiodsseemtohavesimplicityandevidence
ontheirside.
3
The literature on sustainable retirement portfolios, and more specifically on asset
allocationduringretirement,towhichthisarticlecontributesisalmostexclusivelybasedonUS
data. One of themain contributions of this article is to broaden the scope of the analysis by
considering a comprehensive international sample consisting of 19 countries and the world
marketoverthe110‐yearperiodbetween1900and2009.
Therestofthearticleisorganizedasfollows.Section2discussesinmoredetailtheissue
atstakeandsomeoftherelevantcontributionsonthistopic;section3discussestheevidence;
andsection4providesanassessment.Anappendixwithtablesconcludesthearticle.
2.TheIssue
Aretiree’spropermanagementofhisnesteggrequiresacarefulbalancingoftwofinancial
risks.Ontheonehand,theretireemayspendtoomuchandoutlivehissavings;ontheotherhand,
the retireemay unnecessarily lower his lifestyle and end upwith an unintended bequest. A
massiveliteratureonsustainableretirementportfoliosultimatelyseekstoguideretireesonhow
toproperlybalance these risks. It iswidely acknowledged thatBengen (1994) is the seminal
articlethatinspiredthevastamountofresearchproducedonthistopic.
Bengen (1994) pioneered the idea of considering withdrawal rates over all possible
historicalrolling(overlapping)periods.Heaimedtofindhowmanyyearsaportfoliowouldhave
lasted given an initial withdrawal rate and subsequent inflation‐adjusted withdrawals,
performingtheevaluationatthebeginningofeveryyearstartingin1926.2Givena50‐50stock‐
bondallocationhefoundthata3%withdrawalratewouldhaveneverexhaustedaportfolioin
lessthan50years,anda4%withdrawalratewouldhaveneverexhaustedaportfolioinlessthan
33years.Hecalleda5%withdrawalrate‘risky’andwithdrawalrates6%orhigher‘gambling’
becausetheywouldhaveexhaustedaportfoliomuchsoonerovermanyhistoricalperiods.He
alsocalledthe4%withdrawalrate‘safe’becauseitneverexhaustedaportfolioinlessthan30
years,whichhethoughtofastheminimumrequirementofportfoliolongevity.Thiswastheorigin
ofthewell‐knownandwidely‐used‘4%rule.’
2.1.SomeRelevantDifferences
Thevast literature spannedbyBengen (1994)doesnotoffera consensus regarding a
sustainable withdrawal rate for retirees. This is the case because different articles consider
different methodologies, time periods, assets, asset allocations, acceptable failure rates, and
2Theinitialwithdrawalrateisdefinedastheinitialwithdrawalrelativetothevalueoftheportfolioatthebeginningofretirement.Unlessotherwisestated,inthisliteraturea‘withdrawalrate’typicallyreferstotheinitialwithdrawalrate,implicitlyassumingsubsequentinflation‐adjustedwithdrawals.Notethatthisimpliesthatthecurrentwithdrawalrate(thewithdrawalrelativetothevalueoftheportfolioatanypointintime)canfluctuatewidelyovertime.
4
retirementperiods,tonamebutsomedifferences,andthereforereachverydifferentconclusions
both on the sustainability of the 4% withdrawal rate and on the specific withdrawal rate
recommendedtoretirees.
Mostofthearticlesintheliteraturerelyononeoftwomethodologies,historicalrolling
(overlapping) periods andMonte Carlo (or bootstrapping) simulations. Bengen (1994, 1996,
1997)andCooleyetal(1998)areearlyapplicationsofthefirstmethodology;Pye(2000)and
Ameriksetal (2001)areearlyapplicationsof thesecond.Cooleyet al (2003b) compareboth
approaches and find that their results and recommendations sometimes are similar and
sometimesdiffer.Theydonottakesidesonwhichmethodologyisbetterandultimatelyargue
thatwhicheverapproachhappenstomoreaccuratelyreflectthe(unknown)distributionoffuture
returnswillproducethemoreplausibleresultsandrecommendations.
Thearticlesintheliteraturealsodifferintheassetstheyconsider.Althoughmostarticles
focusonstocksandbonds,differenttypesofstocksandbondsanddifferentassetclasseswere
introduced over time. Bengen (1997) considers small‐cap stocks; Pye (2000) considers TIPS;
Cooleyetal(2003a)considerinternational(EAFE)stocks;Guyton(2004)considersvaluestocks;
andCassaday(2006)considersrealestateandcommodities.
Animportantaspect,whichdifferswidelyacrossthearticlesintheliterature,isthefailure
rateconsideredtobeacceptabletoaretiree.Inotherwords,differentwithdrawalratesimply
differentprobabilitiesof portfoliodepletionbefore the endof the retirementperiod, someof
whicharetireemayfindacceptableandsomeofwhichhemaynot.Ononeextreme,Cooleyetal
(2003b,2011)arguethata25%failurerateisreasonable;ontheother,Terry(2003)arguesthat
failure rates 5%or higher are unacceptable. Spitzer et al (2007) plot a relationship between
withdrawalratesandfailureratesandhighlightthata4%withdrawalratecanbethoughtofas
safeaslongasa6%probabilityoffailureisacceptable.
Theretirementperiodsconsideredintheliteraturealsovarywidely.Although30years
seemstobeby farthemostwidely‐usedalternative(andtheoneused in thisarticle),onone
extremeCooleyetal(2005)focusonafive‐yearperiod,andontheotherBlanchettandFrank
(2009)considerupto50years.Somearticlestakeadifferentapproachandbasetheexpected
retirementperiodonmortalitytables,suchasMilevskyandRobinson(2005),StoutandMitchell
(2006),andSheikhetal(2014).
Finally,manyarticlesintheliteratureconsideraninitialwithdrawalrateandsubsequent
inflation‐adjustedwithdrawals,suchasBengen(1994,1996),whopioneeredtheapproach.Many
other articles, however, consider a wide variety of dynamic withdrawal rules, most of them
dependingonportfolioperformance. Someaddsimple floorsandceilings to thewithdrawals,
suchasBengen(2001)andJaconettietal(2013);someaddmorecomplexfloorsandceilings,

5
suchasGuytonandKlinger(2006)andStout(2008);3somemakeperiodicre‐evaluationsoflife
expectancy(Dusetal,2005),theprobabilityoffailure(BlanchettandFrank,2009),orseveral
variables(Sheikhetal,2014);andsomelinkthewithdrawalratetofundamentalvariablessuch
asthecyclically‐adjustedP/Eratio(Kitces,2008;Pfau,2011;andKitcesandPfau,2014).
2.2.TheEvolutionofAssetAllocationDuringRetirement
Mostofthearticlesintheliteratureconsiderdifferentassetallocations.Inhispioneering
article,forexample,Bengen(1994)basesmostofhisdiscussionona50‐50stock‐bondallocation
butalsoconsidersportfolioswith0%,25%,75%,and100%instocks(andtherestinbonds).
Considering different asset allocations, however, is different from considering how the asset
allocationshouldevolveduringretirement,whichisthefocusofthisarticle.4Threepossibilities
areconsideredhere,namely,declining‐equity(DE)strategies,rising‐equity(RE)strategies,and
staticstrategies.
Bengen(1994)doesnotexplicitlyconsidertheevolutionoftheassetallocationduring
retirement, but he does recommend a 50‐75%exposure to stocks and argues that it “can be
maintained throughout retirement.” Bengen (1996), in turn, explicitly considerswhether the
assetallocationshouldbeadjustedduringtheretirementperiod.Moreprecisely,heconsiders
annualreductionsintheallocationtostocksbetween0.5%and3%;findsanegativerelationship
betweentherateofdecreaseoftheallocationtostocksandsustainablewithdrawalrates;and
ultimatelyrecommendstophasedowntheexposuretostocksattheannualrateof1%(asthe
‘ageinbonds’rulewould).Sheikhetal(2014)alsorecommendaDEstrategy,andthereforean
increasingly‐conservativeportfolio,duringretirement.
Unsurprisingly,noteverybodyagreeswiththisrecommendation.Infact,somearguejust
theoppositeandrecommendanREstrategy.SpitzerandSingh(2006,2007)suggestthatretirees
shouldfirstmakewithdrawalsfromthebondportionoftheirportfolios,andstartwithdrawing
from stocks only afterbonds aredepleted.This recommendationwould gradually reduce the
exposuretobondsintheportfolio,thusimplyinganREglidepathandanincreasinglyaggressive
portfolio.PfauandKitces(2014)explicitlycompareDEandREstrategiesduringretirementand
findthatthelatter,whichtheyrecommend,exposeretireestoalowerprobabilityoffailure.
3Itisfarfromclearthatmorecomplexrulesimproveuponsimplerones.Infact,someofthecomplexrulesinthe literatureseemtobemeticulouslydesignedtoworkwell(orbetterthansimpleralternatives) insample.Thisoverfittingofthedataoftenleadstopoorbehavioroutofsample.4Thearticlesthatconsiderdifferentassetallocations,butnotitsevolutionduringtheretirementperiod,tendtoagreethatahigherexposuretostocksismorelikelytosupportahigherwithdrawalrate.Earlyrecommendations, such as Cooley et al (1998), suggest an exposure to stocks of at least 50%;Bengen(1994)recommendsa50‐75%exposure,andMilevskyetal(1997)arguethatmanyretireeswouldbenefitfroma70‐100%exposure.

6
An intermediate possibility is a static or constant‐equity strategy. Blanchett (2007)
considers several types of rising/declining/static‐equity strategies; finds that despite their
simplicitystaticallocationsare“remarkablyefficient”distributionstrategies;andconcludesthat
a60‐40stock‐bondallocationislikelytobeoptimalformostretirees.Cohenetal(2010)argue
thatforanygivenDEstrategy,astaticstrategywithahigherrisk‐adjustedreturncanbecreated
and ultimately recommend a 32‐68 stock‐bond static allocation for retirees. Kitces and Pfau
(2014)alsoconsiderseveraltypesofrising/declining/static‐equitystrategiesandfindthata60‐
40stock‐bondallocationisnearlyoptimalinmostsituations.Theresultsdiscussedinthenext
section also yield support both to static strategies in general and (the all‐equity strategy
notwithstanding)toa60‐40stock‐bondallocationinparticular.
Afinalpossibilityisastrategyinwhichtheexposuretostocksneitherdeclinesorrisesat
apredeterminedratenordoes it remainsconstant; rather, theassetallocation isdynamically
adjusted depending on the value of some observable (technical or fundamental) variable.
Garrison et al (2010), for example, use a 12‐month moving average of large‐cap stocks to
determinewhetheraportfolioshouldbefullyinvestedinbondsorstocks.Pfau(2012),inturn,
uses the cyclically‐adjustedP/E ratio todeterminewhether theexposure to stocks shouldbe
25%,50%,or75%,with therest invested inbonds.Botharticles findsupport foradynamic,
valuation‐basedassetallocationapproach.
3.Evidence
ThevastmajorityoftheevidenceonsustainableretirementportfoliosisbasedonUSdata.
ExceptionsareHoetal(1994)andMilevskietal(1997)thatuseCanadiandata;Dusetal(2005)
thatuseGermandata;andPfau(2010)thatusesasamplesimilartothatusedinthisarticlebut
focusing on thenarrowquestion of the sustainability of the 4% rule.Hence, one of themain
contributionsofthisarticleistoprovideabroadinternationalperspectiveontheimpactofasset
allocationonthesustainabilityofretirementportfolios.
3.1.DataandMethodology
ThesampleconsideredhereistheDimson‐Marsh‐Staunton(DMS)dataset,describedin
detailinDimson,Marsh,andStaunton(2002).Thesamplecontainsannualreturnsforstocksand
governmentbondsoverthe1900‐2009period.Returnsforindividualcountriesarereal(adjusted
bylocalinflation)andinlocalcurrency;returnsfortheworldmarketarereal(adjustedbyUS
inflation)andindollars.Inallcasesreturnsaccountforbothcapitalgains/lossesandcashflows
(dividendsorcoupons).ExhibitA1intheappendixsummarizessomecharacteristicsofallthe
seriesofstockandbondreturnsinthesample.
7
The analysis is based on a $1,000 nest egg at the beginning of retirement, an initial
withdrawalrateof4%,anda30‐yearretirementperiod.Atthebeginningofeachyear,$40are
withdrawn,theportfolioisrebalancedrightaftertothetargetallocationfortheyear,andthenit
compoundsattheobservedreturnofstocksandbondsforthatyear.Thisprocessisrepeatedat
thebeginningofeachyearduringthe30‐yearretirementperiod,attheendofwhichtheportfolio
hasaterminalwealthorbequestthatmaybepositiveor0.5Thefirst30‐yearretirementperiod
is1900‐1929,thenextis1901‐1930,andthelasttwoare1979‐2008and1980‐2009,foratotal
of81rolling(overlapping)periods.
Theanalysisfocusesonthefailurerate,definedastheproportionofthe81retirement
periodsinwhichtheportfolioisdepletedbefore30years;ifhistoryisanyguide,thisfailurerate
shouldbeagoodproxyfortheexpectedprobabilityofportfoliofailure.Theanalysisalsofocuses
onthedistributionofterminalwealthorbequest,whichresultsfromaggregatingthe81wealth
levelsattheendofeachofthe81retirementperiodsconsidered.
3.2.DynamicStrategies
Asalreadydiscussed,DEstrategies featureallocations thatbecomemoreconservative
overtime.Foursuchstrategiesareconsideredhere.Thefirststartsfullyinvestedinstocksand
endsupfullyinvestedinbonds;thatis,itstartswitha100‐0,andendswitha0‐100,stock‐bond
allocation.TheotherthreeDEstrategiesconsideredaresimilar.Theybeginwith90‐10,80‐20,
and70‐30,andrespectivelyendwith10‐90,20‐80,and30‐70stock‐bondallocations.Inallcases,
theassetallocationbetweenthebeginningandtheendofeach30‐yearretirementperiodchanges
annuallyandlinearlyovertime.
ThesefourDEstrategiesareevaluatedagainsttheirmirrors;thatis,REstrategiesthat
startandendwithoppositeallocationstostocksandbonds.Toillustrate,theDEstrategythat
starts fully invested in stocks and ends fully invested in bonds is evaluated against amirror
strategythatstartsfullyinvestedinbondsandendsfullyinvestedinstocks;theDEstrategythat
startswitha90‐10(andendswitha10‐90)stock‐bondallocationisevaluatedagainstamirror
strategythatstartswitha10‐90(andendswitha90‐10)stock‐bondallocation;andsoforth.
Importantly,notethatDEstrategiesandtheirrespectiveREmirrorsspendthesameamountof
timeinvestedinstocksandbondsonlydifferingonwhentheydoso.
ResultsfortheseeightdynamicstrategiesarepresentedinExhibit1fortheUS,theworld
market, and the average country (that is, a cross‐sectional average of all 19 countries in the
sample).Theexhibitreportsfailureratesandsomecharacteristicsofthedistributionofterminal
5Giventhattheanalysisisperformedinrealterms,anannualwithdrawalof$40isequivalenttoaninitialwithdrawalof$40andsubsequentinflation‐adjustedannualwithdrawals.

8
wealth or bequest across the 81 retirement periods considered. Exhibit A2 in the appendix
presentsthesameanalysisonacountry‐by‐countrybasis.
Exhibit1:DynamicStrategiesThisexhibitshowssummarystatisticsforeightdeclining‐equityandrising‐equitystrategiesevaluatedover81rolling30‐yearretirementperiods,beginningwith1900‐1929andendingwith1980‐2009.Allstrategiesconsiderastartingcapitalof$1,000andannualwithdrawalsof$40inrealterms;startinvestedinstocksintheproportionindicatedbytheleftendoftherangesshowninthefirstrow;finishinvestedinstocksintheproportionindicatedbytherightendofthoseranges;andlinearlyshiftbetweenstocksandbonds,rebalancingatthebeginningofeachyear,fromthelefttothe right endof the ranges. The failure rate (Failure) is theproportionof the81 retirementperiods inwhich theportfoliowasdepletedbefore30years.Thestatisticsthatdescribethedistributionofterminalwealthorbequestacrossthe81retirementperiodsincludethemean;median;standarddeviation(SD);averagewealthinthelower1%(P1),5%(P5),and10%(P10)tail;andaveragewealthintheupper1%(P99),5%(P95),and10%(P90)tail.Thethirdpanel(Average)showsaveragesacrossthe19countriesinthesample.ThedataisdescribedinExhibitA1intheappendix.Allfiguresindollarsexceptforfailurerates(in%).
100‐0 0‐100 90‐10 10‐90 80‐20 20‐80 70‐30 30‐70USAFailure 8.6 21.0 6.2 17.3 4.9 11.1 4.9 8.6Mean 1,388 851 1,336 901 1,283 954 1,230 1,009Median 947 171 873 293 908 424 951 527P99 7,017 4,102 6,304 3,958 5,613 4,006 4,950 4,029P95 5,913 3,824 5,493 3,553 5,063 3,468 4,627 3,476P90 4,781 3,579 4,490 3,323 4,233 3,234 3,967 3,185SD 1,412 1,178 1,314 1,108 1,224 1,056 1,146 1,027P1 0 0 0 0 0 0 0 0P5 0 0 0 0 0 0 0 0P10 9 0 14 0 45 0 67 2WorldFailure 14.8 38.3 14.8 38.3 17.3 38.3 18.5 35.8Mean 1,229 593 1,146 638 1,065 685 987 734Median 648 258 672 382 615 439 594 520P99 6,341 2,232 5,817 2,447 5,305 2,669 4,807 2,990P95 5,499 2,175 4,971 2,330 4,555 2,618 4,215 2,913P90 5,039 2,078 4,619 2,213 4,212 2,357 3,819 2,546SD 1,525 739 1,392 740 1,269 765 1,157 814P1 0 0 0 0 0 0 0 0P5 0 0 0 0 0 0 0 0P10 0 0 0 0 0 0 0 0AverageFailure 31.4 49.4 31.1 45.7 31.5 42.8 32.2 39.4Mean 1,330 710 1,267 761 1,204 819 1,139 880Median 579 102 551 169 520 244 511 320P99 12,333 6,239 11,296 6,374 10,397 6,658 9,631 7,100P95 8,991 4,749 8,416 4,923 7,866 5,162 7,315 5,471P90 6,659 3,782 6,278 3,906 5,920 4,101 5,567 4,338SD 2,214 1,254 2,069 1,286 1,933 1,336 1,805 1,402P1 0 0 0 0 0 0 0 0P5 0 0 1 0 1 0 0 0P10 7 0 8 0 8 0 7 0 ConsidertheresultsfortheUSfirst.ThefailureratesfortheDEstrategies(8.6%,6.2%,
4.9%,and4.9%)areinallcasessubstantiallylowerthanthosefortheirrespectiveREmirrors
(21.0%,17.3%,11.1%,and8.6%).Infact,failureratesfortheformerarelessthanhalfthosefor

9
the latter,with theexceptionof the70‐30strategyand itsmirror.Thus,DEstrategiesduring
retirementleadtomuchlowerexpectedprobabilitiesofportfoliofailure.
DEstrategiesalsoaccumulatemorewealthbytheendoftheretirementperiodthando
REstrategies.Thisisthecaseregardlessofwhethertheexpectedbequestisevaluatedwiththe
meanterminalwealth($1,388,$1,336,$1,283,and$1,230versus$851,$901,$954,and$1,009)
orthemedianterminalwealth($947,$873,$908,and$951versus$171,$293,$424,and$527).
Furthermore,inparticularlygoodretirementperiods(thoseoccurringlessthan1%,5%,or10%
ofthetimeandquantifiedbyP99,P95,andP90inExhibit1),DEstrategiesexposeretireestoa
muchhigherupsidepotentialthandoREstrategies.
DEstrategieskeepretireesmoreuncertainabouttheirterminalwealthorbequestthan
doREstrategies,as indicatedbytheir largerstandarddeviations($1,412,$1,314,$1,224,and
$1,146versus$1,178,$1,108,$1,056, and$1,027).6But consider theP1,P5, andP10 figures,
whichrepresenttheaverageterminalwealthduringparticularlybadretirementperiods,defined
asthosethatoccurlessthan1%,5%,or10%ofthetime.ThesefiguresarewhatEstrada(2014b,
2014c)definesaslower‐tailterminalwealth,ameasureoflong‐termriskthatfocusesonextreme
andunlikelyadversescenarios;andinthiscasetheyshowthatDEstrategiesprovidethesameor
betterdownsideprotection(intheformofahigherterminalwealthorbequest)whentailrisks
strikethandoREstrategies.
Forthisreason,itisproblematictoviewDEstrategiesasriskierthanREstrategies.As
arguedbyEstrada(2014b,2014c),standarddeviationisaquestionablemeasureofriskif,relative
toalessvolatilestrategy,amorevolatilestrategyprovidesbothahigherupsidepotentialand
betterdownsideprotectionwhentailrisksstrike,asisthecaseherewhencomparingDEandRE
strategies.Insuchcases,alargerstandarddeviationonlyindicateshigheruncertaintyabouthow
muchbetteroff(notworseoff)aretireewillbeafter30years,whichmaybethoughtofasupside
risk.
Results for theworldmarket are similar. As shown in the ‘World’ panel of Exhibit 1,
relativetoREstrategies,DEstrategieshavesubstantiallylowerfailurerates;accumulatelarger
meanandmedianbequests;havehigherupsidepotentialinparticularlygoodperiods;provide
the samedownsideprotection inparticularlybadperiods;7 andkeep retireesmoreuncertain
abouttheirbequest,butonlyintermsofhowmuchhigher(notlower)itwillbe.
6Notethatthestandarddeviationsreporteddonotassesshowmucharetirementportfoliofluctuatesovertime;rather,theyassessthedispersionofthedistributionofterminalwealthorbequest.Inotherwords,thesestandarddeviationsmeasureuncertaintyaboutthebequest,notthevariabilityofaportfolioduringtheretirementperiod.7Notethatthe0sforallstrategiesintheworst1%,5%,and10%scenariosindicatethatallstrategiesfailatleast10%ofthetime,whichisobviouslyconfirmedbythefailureratesinthefirstrowofthepanel.

10
Finally,asthe‘Average’panelofExhibit1indicates,resultsareonceagainsimilarforthe
averagecountryinthesample.RelativetoREstrategies,DEstrategieshavesubstantiallylower
failurerates,thoughthedifferencesarenotaslargeastheyarefortheUSandtheworldmarket;
accumulatelargermeanandmedianbequests;havehigherupsidepotentialinparticularlygood
periods;provideoverallbetterdownsideprotectioninparticularlybadperiods;andkeepretirees
moreuncertainabouthowmuchhigher(notlower)theirbequestwillbe.Asalreadymentioned,
ExhibitA2intheappendixreportsresultsofasimilaranalysisonacountry‐by‐countrybasis.
3.3.StaticStrategies
ContrarytothefindingsandrecommendationofPfauandKitces(2014)fortheUS,based
on Monte Carlo simulations, the evidence from the comprehensive international sample
consideredhere,basedonhistoricalrollingperiods,suggeststhatindividualsshouldgradually
reducetheirexposuretostocks(andincreasetheirexposuretobonds)duringretirement.Doing
so instead of the opposite would expose retirees to a lower probability of failure, a higher
expectedbequest,ahigherupsidepotential inparticularlygoodperiods,andbetterdownside
protection in particularly bad periods. Should retirees make their portfolios increasingly
conservativeovertimethen?Notnecessarily.
ThefirsttwocolumnsofExhibit2reportaveragesforthefourDE(100‐0,90‐10,80‐20,
and70‐30)andRE(0‐100,10‐90,20‐80,and30‐70)strategiesconsideredinExhibit1.Thenext
threecolumns,labeled60×30,50×30,and40×30,reportresultsforthreestaticstrategiesthat
respectively invest 60%, 50%, and40% in stocks (and the rest in bonds)during the30‐year
retirementperiod,rebalancingtothoseproportionsatthebeginningofeachyear.Thereasonfor
focusingonthesethreestrategiesatthistimeissimplybecausetheyareneithertooaggressive
nor tooconservative;morestaticstrategiesareconsidered in thenextsection.Given that the
strategy that invests60% in stocks displays thebest overall behavior among the three static
strategiesconsideredinthissection,thediscussionthatfollowsisfocusedonitscomparisonto
DEandREstrategies.
Asbefore,considertheUSfirst.The60×30strategyhasalowerfailureratethanboththe
averageDEandtheaverageREstrategiesconsideredhere.Infact,ittiesforthelowestfailure
rateofallthosereportedinExhibit1(thoseforthe80‐20and70‐30strategies)at4.9%.Atthe
sametime,the60×30strategyoutperformsallotherstrategiesintermsoftheexpectedbequest,
withmeanandmedianvaluesof$1,437and$1,155.Intermsofupsidepotentialinparticularly
good periods (P99, P95, and P90), the 60×30 strategy outperforms all theRE strategies, and
underperformsallbutoneoftheDEstrategies,consideredinExhibit1.
11
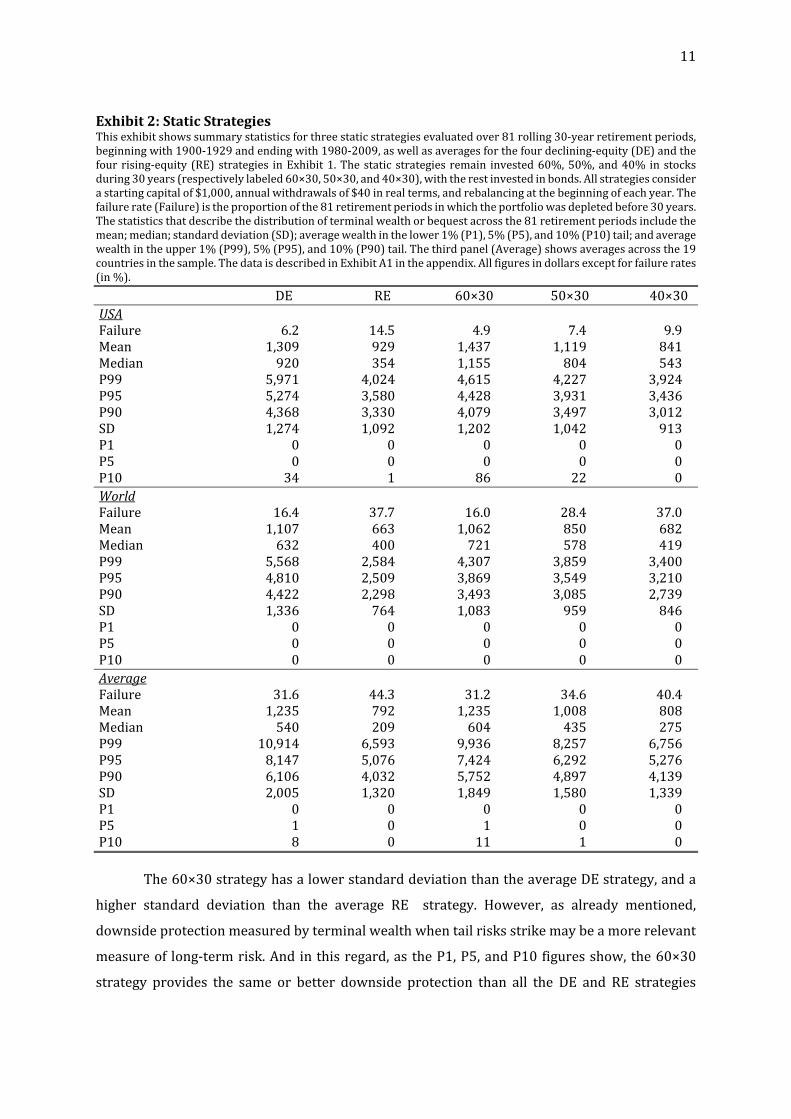
Exhibit2:StaticStrategiesThisexhibitshowssummarystatisticsforthreestaticstrategiesevaluatedover81rolling30‐yearretirementperiods,beginningwith1900‐1929andendingwith1980‐2009,aswellasaveragesforthefourdeclining‐equity(DE)andthefour rising‐equity (RE) strategies inExhibit1.Thestatic strategies remain invested60%,50%,and40% instocksduring30years(respectivelylabeled60×30,50×30,and40×30),withtherestinvestedinbonds.Allstrategiesconsiderastartingcapitalof$1,000,annualwithdrawalsof$40inrealterms,andrebalancingatthebeginningofeachyear.Thefailurerate(Failure)istheproportionofthe81retirementperiodsinwhichtheportfoliowasdepletedbefore30years.Thestatisticsthatdescribethedistributionofterminalwealthorbequestacrossthe81retirementperiodsincludethemean;median;standarddeviation(SD);averagewealthinthelower1%(P1),5%(P5),and10%(P10)tail;andaveragewealthintheupper1%(P99),5%(P95),and10%(P90)tail.Thethirdpanel(Average)showsaveragesacrossthe19countriesinthesample.ThedataisdescribedinExhibitA1intheappendix.Allfiguresindollarsexceptforfailurerates(in%).
DE RE 60×30 50×30 40×30USAFailure 6.2 14.5 4.9 7.4 9.9Mean 1,309 929 1,437 1,119 841Median 920 354 1,155 804 543P99 5,971 4,024 4,615 4,227 3,924P95 5,274 3,580 4,428 3,931 3,436P90 4,368 3,330 4,079 3,497 3,012SD 1,274 1,092 1,202 1,042 913P1 0 0 0 0 0P5 0 0 0 0 0P10 34 1 86 22 0WorldFailure 16.4 37.7 16.0 28.4 37.0Mean 1,107 663 1,062 850 682Median 632 400 721 578 419P99 5,568 2,584 4,307 3,859 3,400P95 4,810 2,509 3,869 3,549 3,210P90 4,422 2,298 3,493 3,085 2,739SD 1,336 764 1,083 959 846P1 0 0 0 0 0P5 0 0 0 0 0P10 0 0 0 0 0AverageFailure 31.6 44.3 31.2 34.6 40.4Mean 1,235 792 1,235 1,008 808Median 540 209 604 435 275P99 10,914 6,593 9,936 8,257 6,756P95 8,147 5,076 7,424 6,292 5,276P90 6,106 4,032 5,752 4,897 4,139SD 2,005 1,320 1,849 1,580 1,339P1 0 0 0 0 0P5 1 0 1 0 0P10 8 0 11 1 0 The60×30strategyhasalowerstandarddeviationthantheaverageDEstrategy,anda
higher standard deviation than the average RE strategy. However, as already mentioned,
downsideprotectionmeasuredbyterminalwealthwhentailrisksstrikemaybeamorerelevant
measureof long‐termrisk.Andinthisregard,astheP1,P5,andP10figuresshow,the60×30
strategy provides the same or better downside protection than all the DE and RE strategies
12
considered here. Thus, the 60×30 strategy has the lowest failure rate, the largest expected
bequest,andprovidesthebestoveralldownsideprotectioninparticularlybadperiods.
Asthe‘World’panelofExhibit2shows,theoverallresultsfortheworldmarketarerather
similartothosefortheUS.The60×30strategyhasalowerfailurerate(16.0%)thanboththe
averageDEandREstrategies,althoughitismarginallyhigherthanthefailurerateofthe100‐0
and 90‐10 strategies (14.8%). It is, however, less than half of the failure rate of all the RE
strategiesreportedinExhibit1.The60×30strategyunderperformssomeDEstrategiesinterms
ofthemeanbequest,butoutperformsallDEandREstrategiesintermsofthemedianbequest.
When(1%,5%,and10%)tailrisksstrike,allthestrategiesconsideredleaveretireeswiththeir
portfoliosdepleted,thusprovidingnodownsideprotectioninparticularlybadperiods.
Finally, as the ‘Average’panelofExhibit2 shows, the resultsareagain similar for the
averagecountryinthesample.Thefailurerateofthe60×30strategy(31.2%)islowerthanthat
oftheaverageDEstrategy(butverymarginallyhigherthanthe31.1%ofthe90‐10strategy),and
substantiallylowerthanthatofalltheREstrategies.The60×30strategyunderperformstwoDE
strategiesintermsofthemeanbequest,butoutperformsallDEandREstrategiesintermsofthe
medianbequest.Andwhen(1%,5%,and10%)tailrisksstrike,the60×30strategyprovidesthe
bestoveralldownsideprotection.
In short, then, a simple static strategy that invests 60% in stocks and 40% in bonds,
rebalancedonceayear,producesthebestoverallperformance.ItdoesnotoutperformallDEand
REstrategiesineverycharacteristicconsidered,butitdoesprovideretireeswiththelowestor
near‐lowest failurerates, thehighestornear‐highestexpectedbequest,goodupsidepotential,
andoverallbestdownsideprotection.
3.4.WhyNot100%Stocks?
Manyretireeswouldviewhavingtheirportfoliofully,orevenheavily,investedinstocks
asaveryriskystrategy,andfewadvisorswoulddaretorecommendit.Althoughriskisintheeyes
ofthebeholder,theinterestingquestioniswhyanall‐equityportfolioisconsideredsucharisky
alternative.Theanswer,infact,isfarfromclear.Toshedlightonthisissue,11staticstrategies
wereconsidered,withallocationstostocksof100%,90%,80%,…,20%,10%,and0%,andthe
restbeinginvestedinbonds.Onlytheresultsforthebestofthesestrategies(asdefinedbelow)
foreachcountryarereportedhere.
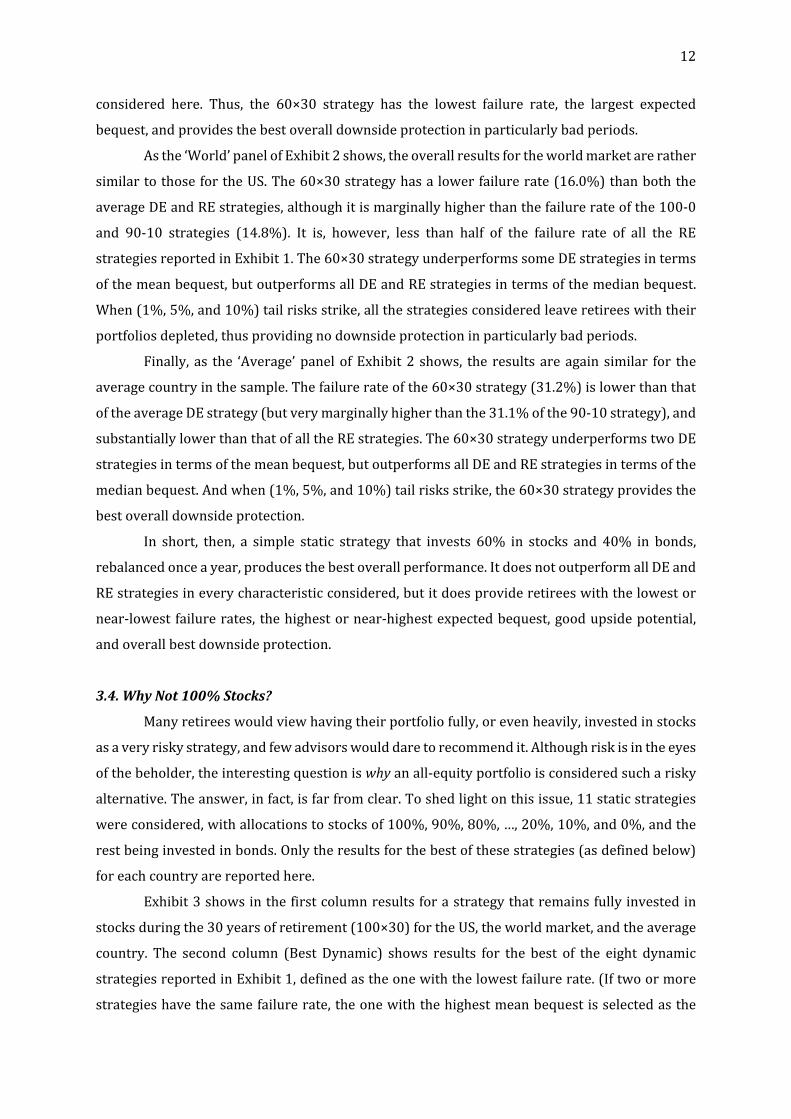
Exhibit3showsinthefirstcolumnresultsforastrategythatremainsfullyinvestedin
stocksduringthe30yearsofretirement(100×30)fortheUS,theworldmarket,andtheaverage
country. The second column (Best Dynamic) shows results for the best of the eight dynamic
strategiesreportedinExhibit1,definedastheonewiththelowestfailurerate.(Iftwoormore
strategieshavethesamefailurerate,theonewiththehighestmeanbequestisselectedasthe

13
beststrategy.)Thethirdcolumn(BestStatic)showsresultsforthebestofthestaticstrategies
mentionedabove,notincludingthestrategythatfullyinvestsinstocks.8Finally,thelastcolumn
showsresults fora strategy that remains invested60% instocksover30years (60×30); this
columnisthesameasthethirdcolumnofExhibit2.ExhibitA4intheappendixreportsresultsof
asimilaranalysisonacountry‐by‐countrybasis.
ConsideragaintheUSfirstandaskwhy(infact,whether)the100×30strategyisriskier
thantheotherstrategiesshownintheexhibit.Relativetothebestdynamicandstaticstrategies
consideredhere,thestrategythatfullyinvestsinstockshasthelowestfailurerate(tiedwiththe
beststaticstrategy,whichinthiscaseis90%investedinstocks)at3.7%;providesthesameor
betterdownsideprotectionwhentailrisksstrike(measuredbyP1,P5,andP10);andprovides
muchhigherupsidepotential(measuredbythemean,median,P90,P95,andP99).Therefore,as
discussedbefore,thehigherstandarddeviationofthisstrategyonlyindicatesuncertaintyabout
howmuchbetteroff(notworseoff)aretireewillbeafter30years.
Resultsfortheworldmarketandtheaveragecountryinthesamplearesimilar.Relative
tothebestdynamicandstaticstrategiesconsideredhere,thestrategythatfullyinvestsinstocks
has the lowest failure rate (6.2% for theworldmarket and 26.4% for the average country),
providesthesameorbetterdownsideprotectionwhentailrisksstrike,andprovidesmuchhigher
upside potential. The only exception to this statement is in terms of downside protection as
measured by P1 for the average country in the sample; in this case, the best static strategy
providesaslightlyhigherterminalwealth($12versus$3fortheall‐equitystrategy).Importantly,
notethatthispanelshowsaveragefiguresforthebeststaticstrategyforeachcountry,andwhich
oneisthebestchangesacrosscountries.9Inotherwords,nosinglestaticstrategycanbesaidto
providebetterdownsideprotectionwhen1%tailrisksstrikethantheall‐equitystrategy.
In short, although a strategy that fully invests a retirement portfolio in stocks can be
perceivedasriskierthanmostalternatives,isthatreallythecase?Isastrategythathasthelowest
probability of failure, provides the same or better downside protection, and higher upside
potentialreallyriskier thanotherstrategiessimplybecausearetiree ismoreuncertainabout
(howmuchhigherwillbe)hisbequest?Ifnot,thenhavingaretirementportfoliofullyinvestedin
stocksisastrategythatshouldbeseriouslyconsideredbyretirees.
Exhibit3:WhyNot100%Stocks?
8Inotherwords,thiscolumnshowsthebestofthe10staticstrategiesthatinvest90%,80%,…,10%,or0%instocks.Thestrategythatinvests100%instocksisshownseparatelyinthefirstcolumn(100×30).9Toillustrate,althoughformostcountriesthebeststaticstrategyis90%instocks,forSwitzerlandandJapanitis50%instocks.Asalreadymentioned,thebeststaticstrategyexcludestheall‐equitystrategy.
14
Thisexhibitshowssummarystatisticsforstrategiesevaluatedover81rolling30‐yearretirementperiods,beginningwith1900‐1929andendingwith1980‐2009.Allstrategiesconsiderastartingcapitalof$1,000,annualwithdrawalsof$40inrealterms,andrebalancingatthebeginningofeachyear.Thefailurerate(Failure)istheproportionofthe81retirementperiodsinwhichtheportfoliowasdepletedbefore30years.Thestatisticsthatdescribethedistributionofterminalwealth or bequest across the 81 retirement periods include themean;median; standard deviation (SD);averagewealthinthelower1%(P1),5%(P5),and10%(P10)tail;andaveragewealthintheupper1%(P99),5%(P95),and10%(P90) tail.Twostrategiesremain100%and60%invested instocksduring30years(respectivelylabeled100×30and60×30),withtherestinvestedinbonds.The‘BestDynamic’strategyistheonewiththelowestfailurerateofallthosereportedinExhibit1;incaseofequalfailurerates,thestrategyselectedistheonewiththehighestmean.The‘BestStatic’strategyistheonewiththelowestfailurerateamongthoseinvested90%,80%,…,10%,or0%instocks;incaseofequalfailurerates,thestrategyselectedistheonewiththehighestmean.Thethirdpanel(Average)showsaveragesacrossthe19countriesinthesample.ThedataisdescribedinExhibitA1intheappendix.Allfiguresindollarsexceptforfailurerates(in%).
100×30 BestDynamic BestStatic 60×30USAFailure 3.7 4.9 3.7 4.9Mean 3,077 1,283 2,607 1,437Median 2,505 908 2,085 1,155P99 11,858 5,613 9,360 4,615P95 10,851 5,063 8,250 4,428P90 9,263 4,233 7,260 4,079SD 2,764 1,224 2,171 1,202P1 0 0 0 0P5 20 0 7 0P10 149 45 149 86WorldFailure 6.2 14.8 7.4 16.0Mean 2,367 1,229 1,968 1,062Median 1,945 648 1,696 721P99 8,641 6,341 6,687 4,307P95 7,708 5,499 6,110 3,869P90 6,944 5,039 5,614 3,493SD 2,062 1,525 1,692 1,083P1 0 0 0 0P5 0 0 0 0P10 46 0 7 0AveragesFailure 26.4 29.3 26.8 31.2Mean 2,360 1,239 1,894 1,235Median 1,304 564 1,084 604P99 18,318 9,999 14,446 9,936P95 13,063 7,800 10,247 7,424P90 10,094 5,948 7,940 5,752SD 3,293 1,922 2,578 1,849P1 3 0 12 0P5 36 1 33 1P10 84 10 71 11
3.5.SomeFurtherConsiderations
Thissectionbrieflyconsidersfiveissuesthatcomplementthediscussionoftheprevious
threesections.First,itisimportanttohighlightonceagainthatthefocusoftheanalysishereis
on the evolution of the asset allocationduring retirement, not on the initialwithdrawal rate,
whichisconsideredtobe4%.Becausewhen1%and5%tailrisksstrikemostofthestrategies
15
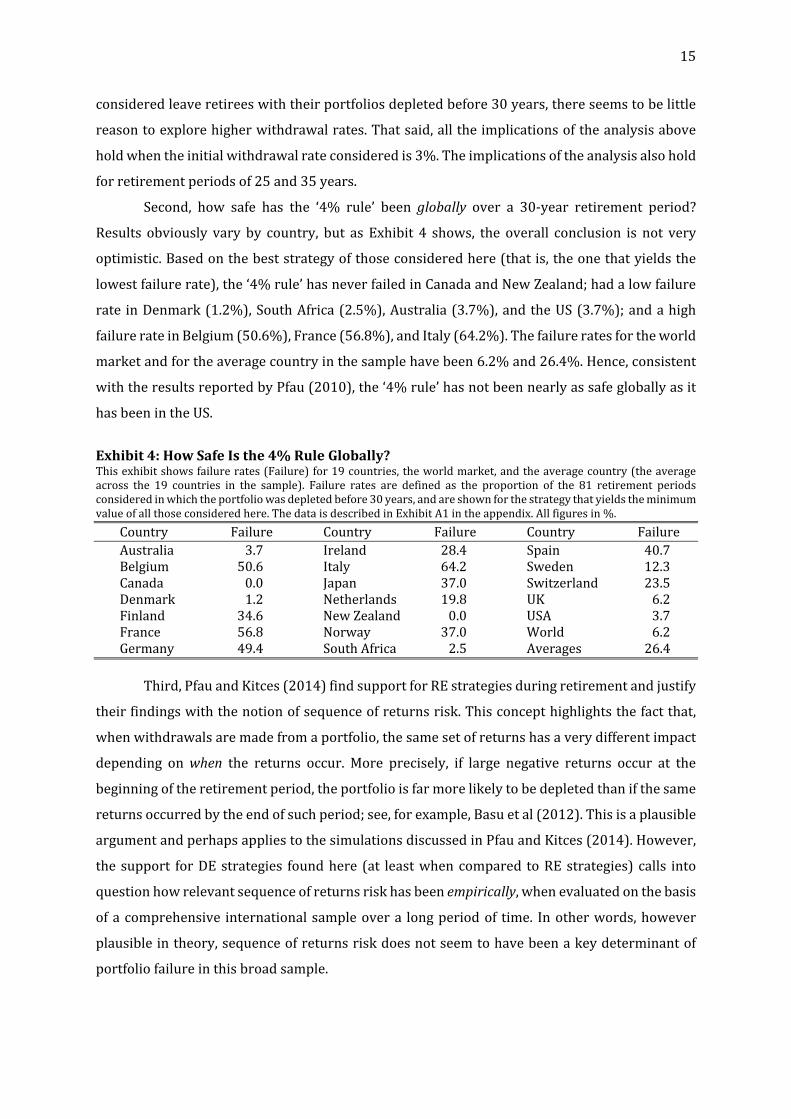
consideredleaveretireeswiththeirportfoliosdepletedbefore30years,thereseemstobelittle
reasontoexplorehigherwithdrawalrates.Thatsaid,alltheimplicationsoftheanalysisabove
holdwhentheinitialwithdrawalrateconsideredis3%.Theimplicationsoftheanalysisalsohold
forretirementperiodsof25and35years.
Second, how safe has the ‘4% rule’ been globally over a 30‐year retirement period?
Results obviously vary by country, but as Exhibit 4 shows, the overall conclusion is not very
optimistic.Basedonthebeststrategyofthoseconsideredhere(thatis,theonethatyieldsthe
lowestfailurerate),the‘4%rule’hasneverfailedinCanadaandNewZealand;hadalowfailure
rate inDenmark(1.2%),SouthAfrica(2.5%),Australia(3.7%),andtheUS(3.7%);andahigh
failurerateinBelgium(50.6%),France(56.8%),andItaly(64.2%).Thefailureratesfortheworld
marketandfortheaveragecountryinthesamplehavebeen6.2%and26.4%.Hence,consistent
withtheresultsreportedbyPfau(2010),the‘4%rule’hasnotbeennearlyassafegloballyasit
hasbeenintheUS.
Exhibit4:HowSafeIsthe4%RuleGlobally?Thisexhibitshowsfailurerates(Failure)for19countries,theworldmarket,andtheaveragecountry(theaverageacross the 19 countries in the sample). Failure rates are defined as the proportion of the 81 retirement periodsconsideredinwhichtheportfoliowasdepletedbefore30years,andareshownforthestrategythatyieldstheminimumvalueofallthoseconsideredhere.ThedataisdescribedinExhibitA1intheappendix.Allfiguresin%.
Country Failure Country Failure Country Failure Australia 3.7 Ireland 28.4 Spain 40.7 Belgium 50.6 Italy 64.2 Sweden 12.3 Canada 0.0 Japan 37.0 Switzerland 23.5 Denmark 1.2 Netherlands 19.8 UK 6.2 Finland 34.6 NewZealand 0.0 USA 3.7 France 56.8 Norway 37.0 World 6.2 Germany 49.4 SouthAfrica 2.5 Averages 26.4 Third,PfauandKitces(2014)findsupportforREstrategiesduringretirementandjustify
theirfindingswiththenotionofsequenceofreturnsrisk.Thisconcepthighlightsthefactthat,
whenwithdrawalsaremadefromaportfolio,thesamesetofreturnshasaverydifferentimpact
depending onwhen the returns occur. More precisely, if large negative returns occur at the
beginningoftheretirementperiod,theportfolioisfarmorelikelytobedepletedthanifthesame
returnsoccurredbytheendofsuchperiod;see,forexample,Basuetal(2012).Thisisaplausible
argumentandperhapsappliestothesimulationsdiscussedinPfauandKitces(2014).However,
thesupport forDEstrategies foundhere (at leastwhencompared toREstrategies)calls into
questionhowrelevantsequenceofreturnsriskhasbeenempirically,whenevaluatedonthebasis
ofacomprehensive internationalsampleovera longperiodof time. Inotherwords,however
plausibleintheory,sequenceofreturnsriskdoesnotseemtohavebeenakeydeterminantof
portfoliofailureinthisbroadsample.

16
Fourth, itmaybeargued that themeanandmedian terminalwealtharecriticalwhen
evaluatingstrategiesduringtheaccumulationperiodbutarefarlessrelevantwhenfocusingon
theretirementperiod.Thismaybesobecauseinthefirstcasethemeanandmedianterminal
wealthmeasurethesizeofthenestegg,whereasinthesecondcasetheymeasurethesizeofan
unintendedbequest.Althoughthismaybeaplausibleargument,itisimportanttokeepinmind
thatallthestrategiesevaluatedhereweresubjecttothesame4%spendingrule.Inotherwords,
everything else equal, including the same levelofwithdrawals, a higher bequest doesmake a
strategymoredesirable.
Finally, note that the asset allocations considered in this article either increase or
decrease the equity exposure at a predetermined rate, or they keep it constant. There is no
attemptheretotietheevolutionoftheassetallocationtothetime‐varyingvaluationofstocks,as
Garrisonetal(2010)andKitcesandPfau(2014)do.Althoughneitherapproachisexcessively
complicated,mostretireesareunlikelytobeabletoproperlyimplementvaluation‐basedasset
allocationunlesstheyarehelpedbyafinancialplanner.
4.Assessment
Whatproportionoftheportfoliotospendandtheportfolio’sassetallocationaretwoof
themost importantdecisionsaretireeneeds tomakeperiodically.Thisarticle focuseson the
latter and at the same time provides some insight on the sustainability of the former. The
recommendationsherearebasedonresultsfromacomprehensiveinternationalsampleof19
countriesandtheworldmarketovera110‐yearperiod.
Pfau and Kitces (2014) compare declining‐equity and rising‐equity strategies during
retirementandrecommendretireestoimplementthelatter.However,theresultsdiscussedhere
point in theoppositedirection; that is,whendecidingexclusivelybetween these two typesof
strategies, retireesshouldchooseadeclining‐equityglidepath. In fact,making theirportfolios
increasingly conservative (rather than aggressive) during retirement would help retirees to
lower the probability of portfolio failure, increase their expected bequest, and obtain better
downsideprotectionwhentailrisksstrike.
Kitces and Pfau (2014) temper their previous enthusiasm for rising‐equity strategies,
arguethatastatic60‐40stock‐bondallocationisnearlyoptimalinmostsituations,andconclude
thatitis“remarkablyeffectiveasaretirementassetallocation.”Similarly,Blanchett(2007)finds
thatdespitetheirsimplicitystaticallocationsare“remarkablyefficient”distributionstrategies
andconcludesthat“theoptimalallocationformostretireesislikelyabalancedportfolio,suchas
a60percentequityand40percentfixedincome/cashallocation.”Theseconclusions,basedon
evidencefromtheUS,pointinthesamedirectionasthosefromthisarticle,basedonevidence
fromacomprehensiveinternationalsample.
17
Moreprecisely, the international evidencediscussedhere suggests that a static 60‐40
stock‐bond allocation would, relative to dynamic and more complicated asset allocation
strategies, leadretireesto face lowerprobabilitiesofportfolio failure,expecthigherbequests,
andobtainbetterdownsideprotectionwhentailrisksstrike.Infact,bothevidenceandsimplicity
support this static strategy, which is particularly relevant for those retirees that may fail to
periodicallyadjusttheirportfoliosinthemethodicalwayrequiredbyrising‐equityordeclining‐
equityglidepaths.Furthermore, thecombinedresults inEstrada(2014a)and thosediscussed
heresupporttheimplementationofthissimplestrategyduringboththeaccumulationandthe
retirementperiods.
Thatsaid,althoughmanyindividualswouldbereluctanttoholdportfoliosfullyinvested
instocks,theevidencedoessupportthisstrategy.Infact,duringboththeaccumulationperiod
(Estrada, 2014a) and the retirement period considered here, an all‐equity strategy generally
outperformsallothers,includingthe60‐40allocation,intermsoftheprobabilityoffailure,upside
potential, and downside protection when tail risks strike. This last variable is particularly
importantbecause,asameasureofrisk,itis(orshouldbe)farmorerelevanttoretireesthan
uncertaintyabouttheirbequestortimevariabilityinthevalueoftheirportfolio.
Thefinancialworldisbecomingincreasinglycomplex,oftenforall thewrongreasons;
andyetsimplestrategies,howeverunderrated,aresometimeshardtobeat.Thiscertainlyapplies
to themanyandvaried recommendations that retireeshave received from financialplanners
overtheyears.Andyetasimple,staticall‐equityportfolioora60‐40stock‐bondallocationare
not only easy for retirees to implement but also supported by the comprehensive evidence
discussedhere.Theirexposuretostocksandbondsisofcoursenottheonlyimportantfinancial
decisionretireesneedtomake,butimplementingasimpleandeffectiveassetallocationcertainly
isagoodstartingpoint.

18
AppendixExhibitA1:SummaryStatisticsThisexhibitshows,fortheseriesofannualreturns,thearithmetic(AM)andgeometric(GM)meanreturn,standarddeviation(SD),semideviationfora0%benchmark(SSD),andlowest(Min)andhighest(Max)returnforallthestockandgovernmentbondmarketsintheDimson‐Marsh‐Staunton(DMS)datasetoverthe1900‐2009period.Returnsforindividualcountriesarereal(adjustedbylocalinflation)andinlocalcurrency;returnsfortheworldmarketarereal(adjustedbyUS inflation) and in dollars. In all cases returns account for both capital gains/losses and cash flows(dividendsorcoupons).Allfiguresin%.
AM GM SD SSD Min Max Stocks Australia 9.1 7.5 18.2 9.3 −42.5 51.5 Belgium 5.2 2.5 23.6 12.6 −57.1 109.5 Canada 7.2 5.8 17.2 8.5 −33.8 55.2 Denmark 6.7 4.9 20.7 8.9 −49.2 107.8 Finland 9.1 5.1 30.3 14.1 −60.8 161.7 France 5.7 3.1 23.5 12.6 −42.7 66.1 Germany 8.1 3.0 32.2 15.1 −90.8 154.6 Ireland 6.5 3.8 23.1 12.2 −65.4 68.4 Italy 6.2 2.1 29.0 15.8 −72.9 120.7 Japan 8.6 3.8 29.8 15.5 −85.5 121.1 Netherlands 7.1 4.9 21.8 10.4 −50.4 101.6 NewZealand 7.6 5.9 19.7 9.2 −54.7 105.3 Norway 7.2 4.1 27.4 11.9 −53.6 166.9 SouthAfrica 9.5 7.2 22.5 9.2 −52.2 102.9 Spain 6.0 3.8 22.1 11.1 −43.3 99.4 Sweden 8.6 6.2 22.8 10.9 −43.6 89.8 Switzerland 6.1 4.3 19.8 10.3 −37.8 59.4 UK 7.2 5.3 20.0 9.9 −57.1 96.7 USA 8.2 6.2 20.3 10.6 −38.0 56.5 World 6.9 5.4 17.7 9.4 −40.4 70.1 Bonds Australia 2.3 1.4 13.2 7.7 −26.6 62.2 Belgium 0.6 −0.1 12.0 8.3 −30.6 40.5 Canada 2.5 2.0 10.4 5.5 −25.9 41.7 Denmark 3.6 3.0 11.6 5.1 −18.2 50.1 Finland 1.0 −0.3 13.7 11.1 −69.5 30.2 France 0.7 −0.2 13.0 9.7 −43.5 35.9 Germany 0.7 −2.0 15.6 12.7 −95.0 62.5 Ireland 2.1 1.1 14.6 7.9 −34.1 61.2 Italy −0.4 −1.6 14.1 11.9 −64.3 28.7 Japan 1.5 −1.2 20.1 15.0 −77.5 69.8 Netherlands 1.8 1.4 9.4 5.2 −18.1 32.8 NewZealand 2.4 2.0 9.0 4.9 −23.7 34.1 Norway 2.4 1.7 12.2 7.0 −48.0 62.1 SouthAfrica 2.2 1.7 10.4 5.9 −32.6 37.1 Spain 2.0 1.4 11.7 7.0 −30.2 53.2 Sweden 3.2 2.5 12.4 6.1 −36.7 68.2 Switzerland 2.5 2.1 9.3 4.3 −21.4 56.1 UK 2.2 1.3 13.6 7.2 −30.7 59.0 USA 2.4 1.9 10.1 5.3 −19.4 35.1 World 2.2 1.7 10.3 5.6 −27.1 31.7
19
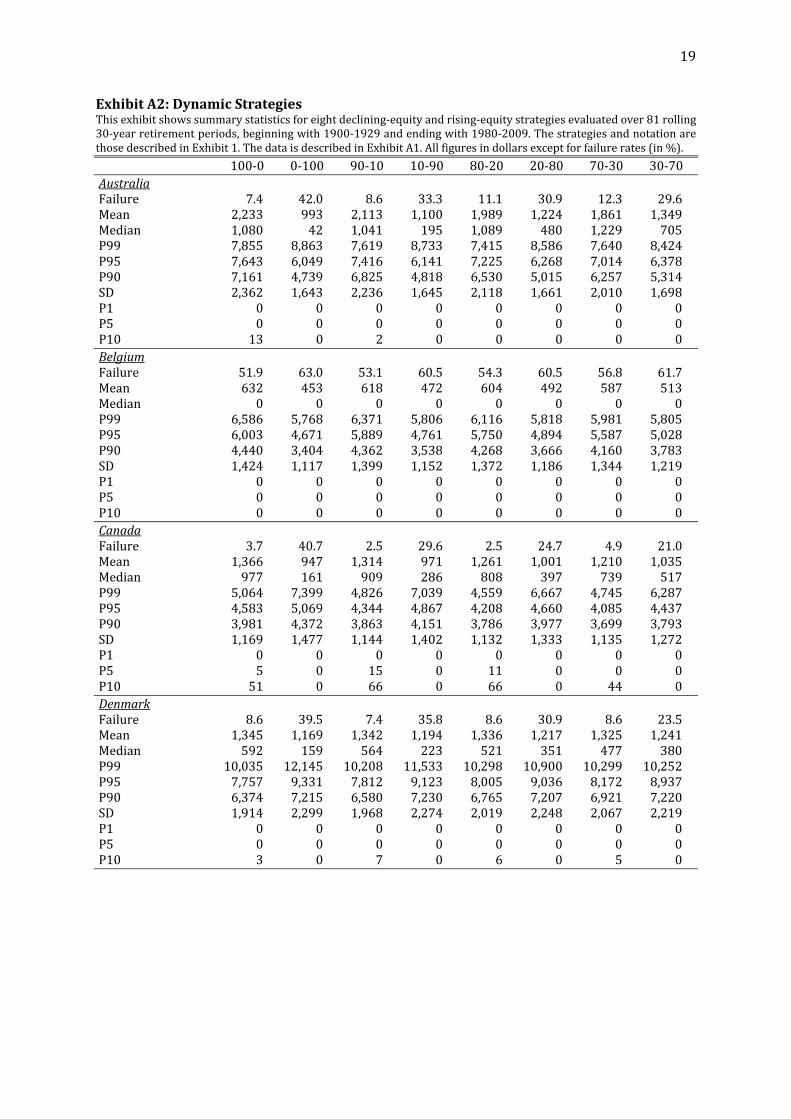
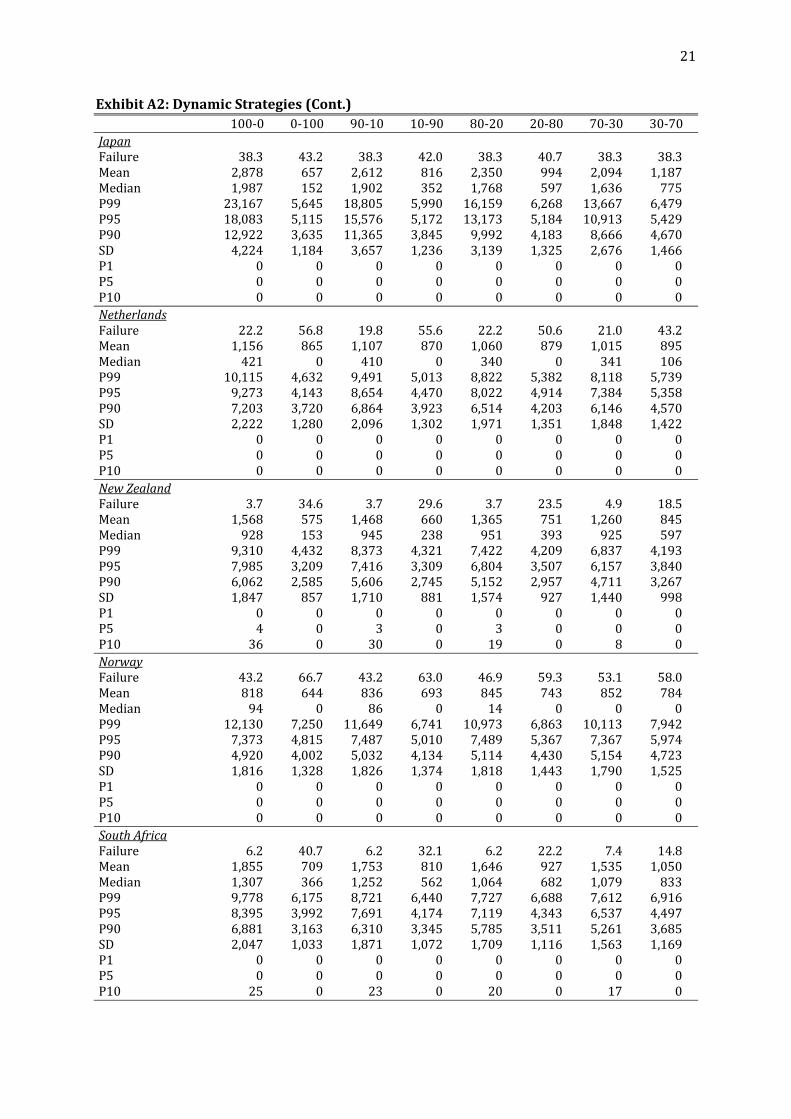
ExhibitA2:DynamicStrategiesThisexhibitshowssummarystatisticsforeightdeclining‐equityandrising‐equitystrategiesevaluatedover81rolling30‐yearretirementperiods,beginningwith1900‐1929andendingwith1980‐2009.ThestrategiesandnotationarethosedescribedinExhibit1.ThedataisdescribedinExhibitA1.Allfiguresindollarsexceptforfailurerates(in%).
100‐0 0‐100 90‐10 10‐90 80‐20 20‐80 70‐30 30‐70AustraliaFailure 7.4 42.0 8.6 33.3 11.1 30.9 12.3 29.6Mean 2,233 993 2,113 1,100 1,989 1,224 1,861 1,349Median 1,080 42 1,041 195 1,089 480 1,229 705P99 7,855 8,863 7,619 8,733 7,415 8,586 7,640 8,424P95 7,643 6,049 7,416 6,141 7,225 6,268 7,014 6,378P90 7,161 4,739 6,825 4,818 6,530 5,015 6,257 5,314SD 2,362 1,643 2,236 1,645 2,118 1,661 2,010 1,698P1 0 0 0 0 0 0 0 0P5 0 0 0 0 0 0 0 0P10 13 0 2 0 0 0 0 0BelgiumFailure 51.9 63.0 53.1 60.5 54.3 60.5 56.8 61.7Mean 632 453 618 472 604 492 587 513Median 0 0 0 0 0 0 0 0P99 6,586 5,768 6,371 5,806 6,116 5,818 5,981 5,805P95 6,003 4,671 5,889 4,761 5,750 4,894 5,587 5,028P90 4,440 3,404 4,362 3,538 4,268 3,666 4,160 3,783SD 1,424 1,117 1,399 1,152 1,372 1,186 1,344 1,219P1 0 0 0 0 0 0 0 0P5 0 0 0 0 0 0 0 0P10 0 0 0 0 0 0 0 0CanadaFailure 3.7 40.7 2.5 29.6 2.5 24.7 4.9 21.0Mean 1,366 947 1,314 971 1,261 1,001 1,210 1,035Median 977 161 909 286 808 397 739 517P99 5,064 7,399 4,826 7,039 4,559 6,667 4,745 6,287P95 4,583 5,069 4,344 4,867 4,208 4,660 4,085 4,437P90 3,981 4,372 3,863 4,151 3,786 3,977 3,699 3,793SD 1,169 1,477 1,144 1,402 1,132 1,333 1,135 1,272P1 0 0 0 0 0 0 0 0P5 5 0 15 0 11 0 0 0P10 51 0 66 0 66 0 44 0DenmarkFailure 8.6 39.5 7.4 35.8 8.6 30.9 8.6 23.5Mean 1,345 1,169 1,342 1,194 1,336 1,217 1,325 1,241Median 592 159 564 223 521 351 477 380P99 10,035 12,145 10,208 11,533 10,298 10,900 10,299 10,252P95 7,757 9,331 7,812 9,123 8,005 9,036 8,172 8,937P90 6,374 7,215 6,580 7,230 6,765 7,207 6,921 7,220SD 1,914 2,299 1,968 2,274 2,019 2,248 2,067 2,219P1 0 0 0 0 0 0 0 0P5 0 0 0 0 0 0 0 0P10 3 0 7 0 6 0 5 0
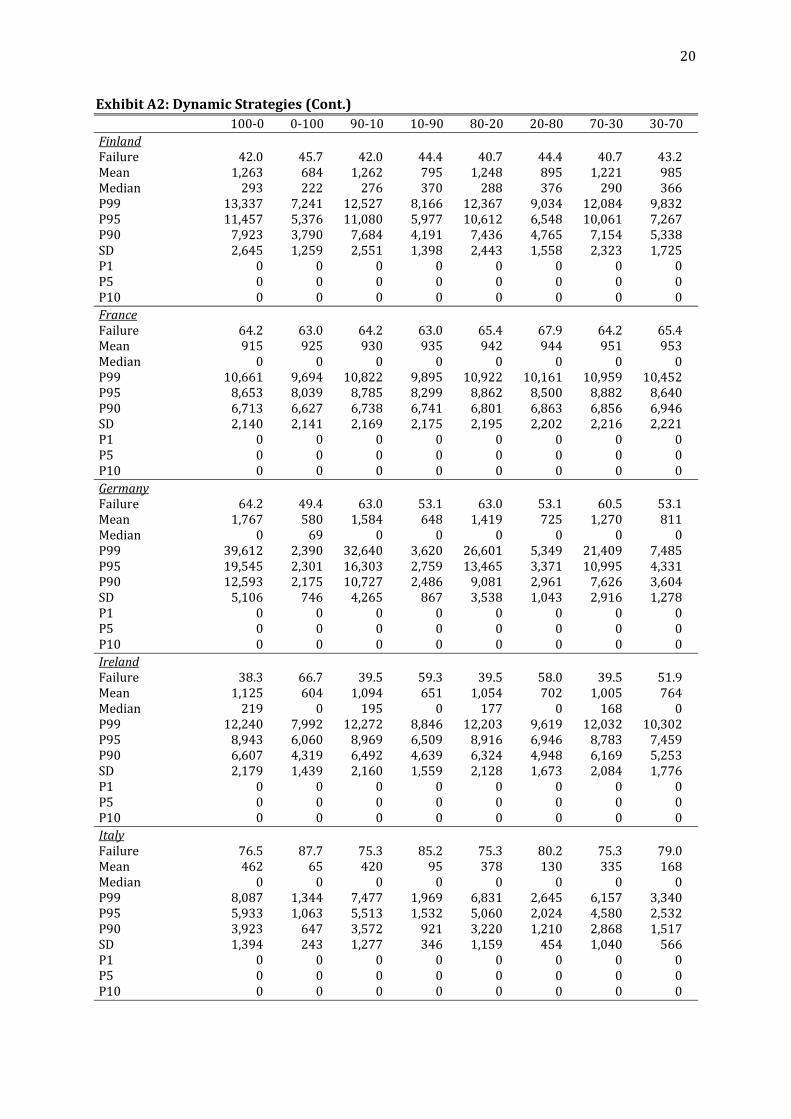
20
ExhibitA2:DynamicStrategies(Cont.) 100‐0 0‐100 90‐10 10‐90 80‐20 20‐80 70‐30 30‐70FinlandFailure 42.0 45.7 42.0 44.4 40.7 44.4 40.7 43.2Mean 1,263 684 1,262 795 1,248 895 1,221 985Median 293 222 276 370 288 376 290 366P99 13,337 7,241 12,527 8,166 12,367 9,034 12,084 9,832P95 11,457 5,376 11,080 5,977 10,612 6,548 10,061 7,267P90 7,923 3,790 7,684 4,191 7,436 4,765 7,154 5,338SD 2,645 1,259 2,551 1,398 2,443 1,558 2,323 1,725P1 0 0 0 0 0 0 0 0P5 0 0 0 0 0 0 0 0P10 0 0 0 0 0 0 0 0FranceFailure 64.2 63.0 64.2 63.0 65.4 67.9 64.2 65.4Mean 915 925 930 935 942 944 951 953Median 0 0 0 0 0 0 0 0P99 10,661 9,694 10,822 9,895 10,922 10,161 10,959 10,452P95 8,653 8,039 8,785 8,299 8,862 8,500 8,882 8,640P90 6,713 6,627 6,738 6,741 6,801 6,863 6,856 6,946SD 2,140 2,141 2,169 2,175 2,195 2,202 2,216 2,221P1 0 0 0 0 0 0 0 0P5 0 0 0 0 0 0 0 0P10 0 0 0 0 0 0 0 0GermanyFailure 64.2 49.4 63.0 53.1 63.0 53.1 60.5 53.1Mean 1,767 580 1,584 648 1,419 725 1,270 811Median 0 69 0 0 0 0 0 0P99 39,612 2,390 32,640 3,620 26,601 5,349 21,409 7,485P95 19,545 2,301 16,303 2,759 13,465 3,371 10,995 4,331P90 12,593 2,175 10,727 2,486 9,081 2,961 7,626 3,604SD 5,106 746 4,265 867 3,538 1,043 2,916 1,278P1 0 0 0 0 0 0 0 0P5 0 0 0 0 0 0 0 0P10 0 0 0 0 0 0 0 0IrelandFailure 38.3 66.7 39.5 59.3 39.5 58.0 39.5 51.9Mean 1,125 604 1,094 651 1,054 702 1,005 764Median 219 0 195 0 177 0 168 0P99 12,240 7,992 12,272 8,846 12,203 9,619 12,032 10,302P95 8,943 6,060 8,969 6,509 8,916 6,946 8,783 7,459P90 6,607 4,319 6,492 4,639 6,324 4,948 6,169 5,253SD 2,179 1,439 2,160 1,559 2,128 1,673 2,084 1,776P1 0 0 0 0 0 0 0 0P5 0 0 0 0 0 0 0 0P10 0 0 0 0 0 0 0 0ItalyFailure 76.5 87.7 75.3 85.2 75.3 80.2 75.3 79.0Mean 462 65 420 95 378 130 335 168Median 0 0 0 0 0 0 0 0P99 8,087 1,344 7,477 1,969 6,831 2,645 6,157 3,340P95 5,933 1,063 5,513 1,532 5,060 2,024 4,580 2,532P90 3,923 647 3,572 921 3,220 1,210 2,868 1,517SD 1,394 243 1,277 346 1,159 454 1,040 566P1 0 0 0 0 0 0 0 0P5 0 0 0 0 0 0 0 0P10 0 0 0 0 0 0 0 0
21
ExhibitA2:DynamicStrategies(Cont.) 100‐0 0‐100 90‐10 10‐90 80‐20 20‐80 70‐30 30‐70JapanFailure 38.3 43.2 38.3 42.0 38.3 40.7 38.3 38.3Mean 2,878 657 2,612 816 2,350 994 2,094 1,187Median 1,987 152 1,902 352 1,768 597 1,636 775P99 23,167 5,645 18,805 5,990 16,159 6,268 13,667 6,479P95 18,083 5,115 15,576 5,172 13,173 5,184 10,913 5,429P90 12,922 3,635 11,365 3,845 9,992 4,183 8,666 4,670SD 4,224 1,184 3,657 1,236 3,139 1,325 2,676 1,466P1 0 0 0 0 0 0 0 0P5 0 0 0 0 0 0 0 0P10 0 0 0 0 0 0 0 0NetherlandsFailure 22.2 56.8 19.8 55.6 22.2 50.6 21.0 43.2Mean 1,156 865 1,107 870 1,060 879 1,015 895Median 421 0 410 0 340 0 341 106P99 10,115 4,632 9,491 5,013 8,822 5,382 8,118 5,739P95 9,273 4,143 8,654 4,470 8,022 4,914 7,384 5,358P90 7,203 3,720 6,864 3,923 6,514 4,203 6,146 4,570SD 2,222 1,280 2,096 1,302 1,971 1,351 1,848 1,422P1 0 0 0 0 0 0 0 0P5 0 0 0 0 0 0 0 0P10 0 0 0 0 0 0 0 0NewZealandFailure 3.7 34.6 3.7 29.6 3.7 23.5 4.9 18.5Mean 1,568 575 1,468 660 1,365 751 1,260 845Median 928 153 945 238 951 393 925 597P99 9,310 4,432 8,373 4,321 7,422 4,209 6,837 4,193P95 7,985 3,209 7,416 3,309 6,804 3,507 6,157 3,840P90 6,062 2,585 5,606 2,745 5,152 2,957 4,711 3,267SD 1,847 857 1,710 881 1,574 927 1,440 998P1 0 0 0 0 0 0 0 0P5 4 0 3 0 3 0 0 0P10 36 0 30 0 19 0 8 0NorwayFailure 43.2 66.7 43.2 63.0 46.9 59.3 53.1 58.0Mean 818 644 836 693 845 743 852 784Median 94 0 86 0 14 0 0 0P99 12,130 7,250 11,649 6,741 10,973 6,863 10,113 7,942P95 7,373 4,815 7,487 5,010 7,489 5,367 7,367 5,974P90 4,920 4,002 5,032 4,134 5,114 4,430 5,154 4,723SD 1,816 1,328 1,826 1,374 1,818 1,443 1,790 1,525P1 0 0 0 0 0 0 0 0P5 0 0 0 0 0 0 0 0P10 0 0 0 0 0 0 0 0SouthAfricaFailure 6.2 40.7 6.2 32.1 6.2 22.2 7.4 14.8Mean 1,855 709 1,753 810 1,646 927 1,535 1,050Median 1,307 366 1,252 562 1,064 682 1,079 833P99 9,778 6,175 8,721 6,440 7,727 6,688 7,612 6,916P95 8,395 3,992 7,691 4,174 7,119 4,343 6,537 4,497P90 6,881 3,163 6,310 3,345 5,785 3,511 5,261 3,685SD 2,047 1,033 1,871 1,072 1,709 1,116 1,563 1,169P1 0 0 0 0 0 0 0 0P5 0 0 0 0 0 0 0 0P10 25 0 23 0 20 0 17 0

22
ExhibitA2:DynamicStrategies(Cont.) 100‐0 0‐100 90‐10 10‐90 80‐20 20‐80 70‐30 30‐70SpainFailure 46.9 61.7 46.9 63.0 48.1 61.7 49.4 59.3Mean 368 327 359 321 351 321 343 324Median 62 0 44 0 18 0 5 0P99 8,692 5,590 8,670 6,134 8,577 6,643 8,414 7,109P95 4,277 3,665 4,290 3,778 4,275 3,910 4,256 4,023P90 2,554 2,583 2,559 2,541 2,550 2,496 2,525 2,454SD 1,122 902 1,119 925 1,109 953 1,093 984P1 0 0 0 0 0 0 0 0P5 0 0 0 0 0 0 0 0P10 0 0 0 0 0 0 0 0SwedenFailure 14.8 39.5 14.8 32.1 12.3 25.9 16.0 19.8Mean 1,963 1,009 1,853 1,060 1,740 1,128 1,629 1,213Median 875 122 846 235 807 343 757 495P99 21,762 8,481 20,252 7,504 18,585 7,697 16,807 9,420P95 16,622 5,857 15,420 6,161 14,154 6,813 12,846 7,596P90 11,895 4,986 11,071 5,160 10,196 5,550 9,285 6,069SD 3,857 1,608 3,560 1,620 3,255 1,714 2,947 1,878P1 0 0 0 0 0 0 0 0P5 0 0 0 0 0 0 0 0P10 0 0 0 0 0 0 0 0SwitzerlandFailure 34.6 24.7 33.3 23.5 30.9 24.7 29.6 24.7Mean 802 705 788 712 775 721 764 729Median 496 322 513 383 534 428 546 520P99 3,699 4,730 3,844 4,676 3,981 4,609 4,110 4,530P95 3,255 3,544 3,202 3,487 3,243 3,477 3,303 3,459P90 2,666 2,822 2,619 2,784 2,603 2,746 2,592 2,701SD 908 929 882 892 859 862 842 842P1 0 0 0 0 0 0 0 0P5 0 0 0 0 0 0 0 0P10 0 0 0 0 0 0 0 0UKFailure 22.2 51.9 23.5 46.9 24.7 42.0 23.5 34.6Mean 1,359 722 1,291 759 1,223 804 1,152 863Median 718 0 614 78 585 173 571 255P99 15,181 4,657 13,753 4,728 12,376 5,362 11,054 6,370P95 9,142 4,103 8,570 4,449 8,002 4,845 7,438 5,283P90 6,916 3,503 6,526 3,692 6,138 3,992 5,752 4,323SD 2,274 1,171 2,115 1,214 1,961 1,277 1,816 1,355P1 0 0 0 0 0 0 0 0P5 0 0 0 0 0 0 0 0P10 0 0 0 0 0 0 0 0
23
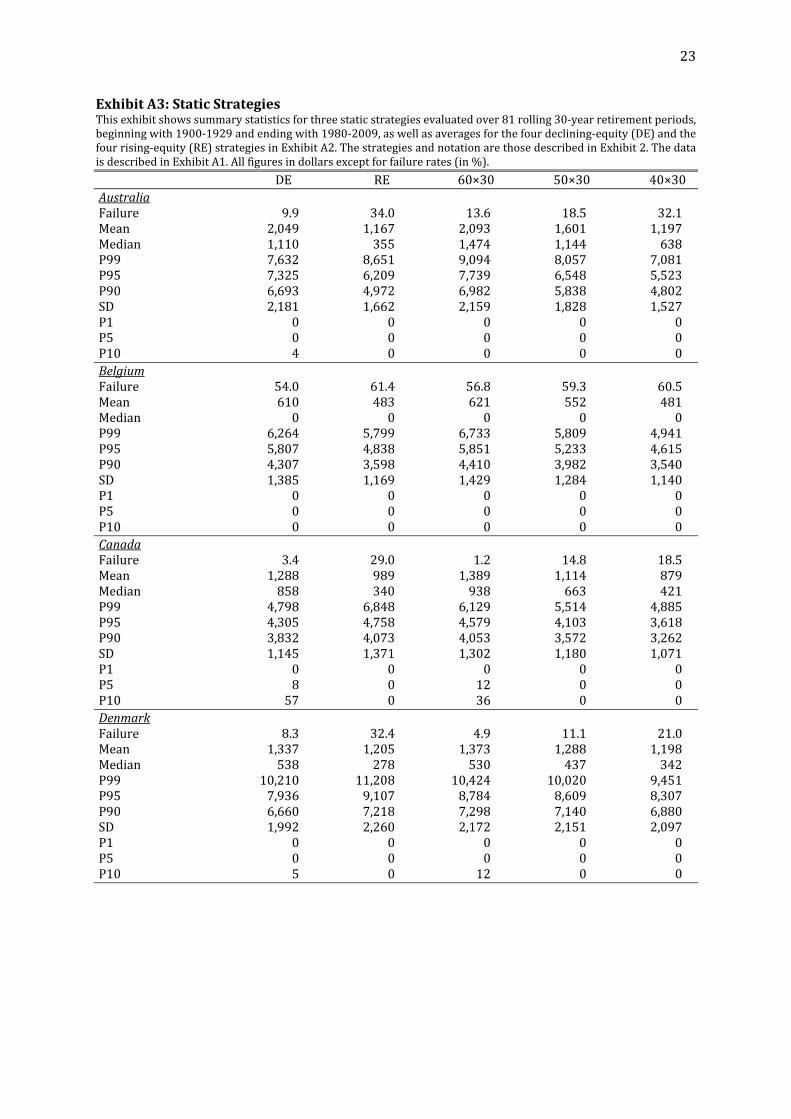
ExhibitA3:StaticStrategiesThisexhibitshowssummarystatisticsforthreestaticstrategiesevaluatedover81rolling30‐yearretirementperiods,beginningwith1900‐1929andendingwith1980‐2009,aswellasaveragesforthefourdeclining‐equity(DE)andthefourrising‐equity(RE)strategiesinExhibitA2.ThestrategiesandnotationarethosedescribedinExhibit2.ThedataisdescribedinExhibitA1.Allfiguresindollarsexceptforfailurerates(in%).
DE RE 60×30 50×30 40×30AustraliaFailure 9.9 34.0 13.6 18.5 32.1Mean 2,049 1,167 2,093 1,601 1,197Median 1,110 355 1,474 1,144 638P99 7,632 8,651 9,094 8,057 7,081P95 7,325 6,209 7,739 6,548 5,523P90 6,693 4,972 6,982 5,838 4,802SD 2,181 1,662 2,159 1,828 1,527P1 0 0 0 0 0P5 0 0 0 0 0P10 4 0 0 0 0BelgiumFailure 54.0 61.4 56.8 59.3 60.5Mean 610 483 621 552 481Median 0 0 0 0 0P99 6,264 5,799 6,733 5,809 4,941P95 5,807 4,838 5,851 5,233 4,615P90 4,307 3,598 4,410 3,982 3,540SD 1,385 1,169 1,429 1,284 1,140P1 0 0 0 0 0P5 0 0 0 0 0P10 0 0 0 0 0CanadaFailure 3.4 29.0 1.2 14.8 18.5Mean 1,288 989 1,389 1,114 879Median 858 340 938 663 421P99 4,798 6,848 6,129 5,514 4,885P95 4,305 4,758 4,579 4,103 3,618P90 3,832 4,073 4,053 3,572 3,262SD 1,145 1,371 1,302 1,180 1,071P1 0 0 0 0 0P5 8 0 12 0 0P10 57 0 36 0 0DenmarkFailure 8.3 32.4 4.9 11.1 21.0Mean 1,337 1,205 1,373 1,288 1,198Median 538 278 530 437 342P99 10,210 11,208 10,424 10,020 9,451P95 7,936 9,107 8,784 8,609 8,307P90 6,660 7,218 7,298 7,140 6,880SD 1,992 2,260 2,172 2,151 2,097P1 0 0 0 0 0P5 0 0 0 0 0P10 5 0 12 0 0

24
ExhibitA3:StaticStrategies(Cont.) DE RE 60×30 50×30 40×30FinlandFailure 41.4 44.4 40.7 43.2 45.7Mean 1,249 840 1,462 1,126 827Median 287 334 529 342 184P99 12,579 8,568 14,529 11,167 8,216P95 10,803 6,292 10,850 8,757 6,752P90 7,549 4,521 8,196 6,371 4,747SD 2,490 1,485 2,606 2,045 1,543P1 0 0 0 0 0P5 0 0 0 0 0P10 0 0 0 0 0FranceFailure 64.5 64.8 61.7 63.0 63.0Mean 935 939 976 959 926Median 0 0 0 0 0P99 10,841 10,050 11,911 10,838 9,681P95 8,796 8,370 9,257 8,749 8,201P90 6,777 6,795 7,195 7,002 6,687SD 2,180 2,185 2,327 2,235 2,113P1 0 0 0 0 0P5 0 0 0 0 0P10 0 0 0 0 0GermanyFailure 62.7 52.2 56.8 56.8 58.0Mean 1,510 691 1,201 1,014 841Median 0 17 0 0 0P99 30,065 4,711 17,985 13,231 9,367P95 15,077 3,190 9,226 7,104 5,314P90 10,007 2,807 6,607 5,231 4,077SD 3,956 984 2,504 1,945 1,482P1 0 0 0 0 0P5 0 0 0 0 0P10 0 0 0 0 0IrelandFailure 39.2 59.0 38.3 43.2 53.1Mean 1,069 680 1,086 889 721Median 190 0 258 98 0P99 12,187 9,190 13,765 11,374 9,186P95 8,903 6,744 9,538 8,275 7,097P90 6,398 4,790 6,546 5,739 5,032SD 2,138 1,612 2,262 1,954 1,670P1 0 0 0 0 0P5 0 0 0 0 0P10 0 0 0 0 0ItalyFailure 75.6 83.0 75.3 76.5 80.2Mean 399 114 287 249 209Median 0 0 0 0 0P99 7,138 2,325 5,549 4,757 3,915P95 5,271 1,788 3,924 3,567 3,116P90 3,396 1,074 2,434 2,174 1,872SD 1,218 402 890 801 693P1 0 0 0 0 0P5 0 0 0 0 0P10 0 0 0 0 0

25
ExhibitA3:StaticStrategies(Cont.) DE RE 60×30 50×30 40×30JapanFailure 38.3 41.0 38.3 37.0 38.3Mean 2,483 914 2,053 1,610 1,239Median 1,823 469 1,407 1,140 1,014P99 17,950 6,096 13,678 9,133 5,704P95 14,436 5,225 10,619 7,133 4,930P90 10,736 4,083 8,850 6,224 4,256SD 3,424 1,303 2,720 1,942 1,383P1 0 0 0 0 0P5 0 0 0 0 0P10 0 0 0 0 0NetherlandsFailure 21.3 51.5 24.7 34.6 44.4Mean 1,085 877 1,164 943 758Median 378 26 446 271 135P99 9,136 5,192 7,851 6,649 5,599P95 8,333 4,721 7,648 6,373 5,191P90 6,682 4,104 6,383 5,373 4,421SD 2,034 1,339 1,905 1,615 1,346P1 0 0 0 0 0P5 0 0 0 0 0P10 0 0 0 0 0NewZealandFailure 4.0 26.5 3.7 12.3 23.5Mean 1,415 708 1,320 1,049 811Median 937 345 914 657 296P99 7,986 4,289 6,176 5,576 5,081P95 7,090 3,467 5,368 4,847 4,251P90 5,383 2,888 4,397 3,903 3,414SD 1,643 916 1,312 1,193 1,056P1 0 0 0 0 0P5 3 0 9 0 0P10 23 0 34 0 0NorwayFailure 46.6 61.7 53.1 55.6 59.3Mean 838 716 949 838 718Median 48 0 0 0 0P99 11,216 7,199 11,668 9,335 7,133P95 7,429 5,291 8,057 6,839 5,691P90 5,055 4,322 5,753 5,068 4,382SD 1,812 1,417 1,955 1,682 1,420P1 0 0 0 0 0P5 0 0 0 0 0P10 0 0 0 0 0S.AfricaFailure 6.5 27.5 6.2 7.4 17.3Mean 1,697 874 1,777 1,298 907Median 1,176 611 1,496 1,083 613P99 8,460 6,555 8,758 7,310 6,029P95 7,435 4,251 6,880 5,364 4,065P90 6,060 3,426 5,460 4,300 3,326SD 1,798 1,098 1,632 1,327 1,070P1 0 0 0 0 0P5 0 0 0 0 0P10 21 0 48 4 0

26
ExhibitA3:StaticStrategies(Cont.) DE RE 60×30 50×30 40×30SpainFailure 47.8 61.4 45.7 51.9 59.3Mean 355 323 386 331 278Median 32 0 34 0 0P99 8,588 6,369 9,379 7,884 6,481P95 4,274 3,844 4,928 4,185 3,476P90 2,547 2,519 2,828 2,449 2,079SD 1,111 941 1,233 1,044 866P1 0 0 0 0 0P5 0 0 0 0 0P10 0 0 0 0 0SwedenFailure 14.5 29.3 16.0 16.0 18.5Mean 1,796 1,103 1,792 1,413 1,081Median 821 299 870 580 398P99 19,352 8,275 16,044 13,086 10,290P95 14,760 6,607 12,615 10,185 7,939P90 10,612 5,441 9,325 7,522 5,977SD 3,405 1,705 2,898 2,357 1,881P1 0 0 0 0 0P5 0 0 0 0 0P10 0 0 0 0 0SwitzerlandFailure 32.1 24.4 27.2 24.7 27.2Mean 782 717 869 745 626Median 522 413 676 586 466P99 3,908 4,636 4,467 4,340 4,178P95 3,251 3,492 3,619 3,398 3,163P90 2,620 2,763 2,924 2,630 2,377SD 873 881 913 827 756P1 0 0 0 0 0P5 0 0 0 0 0P10 0 0 0 0 0UKFailure 23.5 43.8 23.5 24.7 37.0Mean 1,256 787 1,240 1,004 805Median 622 126 749 463 177P99 13,091 5,279 10,027 8,585 7,227P95 8,288 4,670 7,143 6,337 5,560P90 6,333 3,878 5,563 5,018 4,489SD 2,042 1,254 1,717 1,558 1,410P1 0 0 0 0 0P5 0 0 0 0 0P10 0 0 0 0 0
27
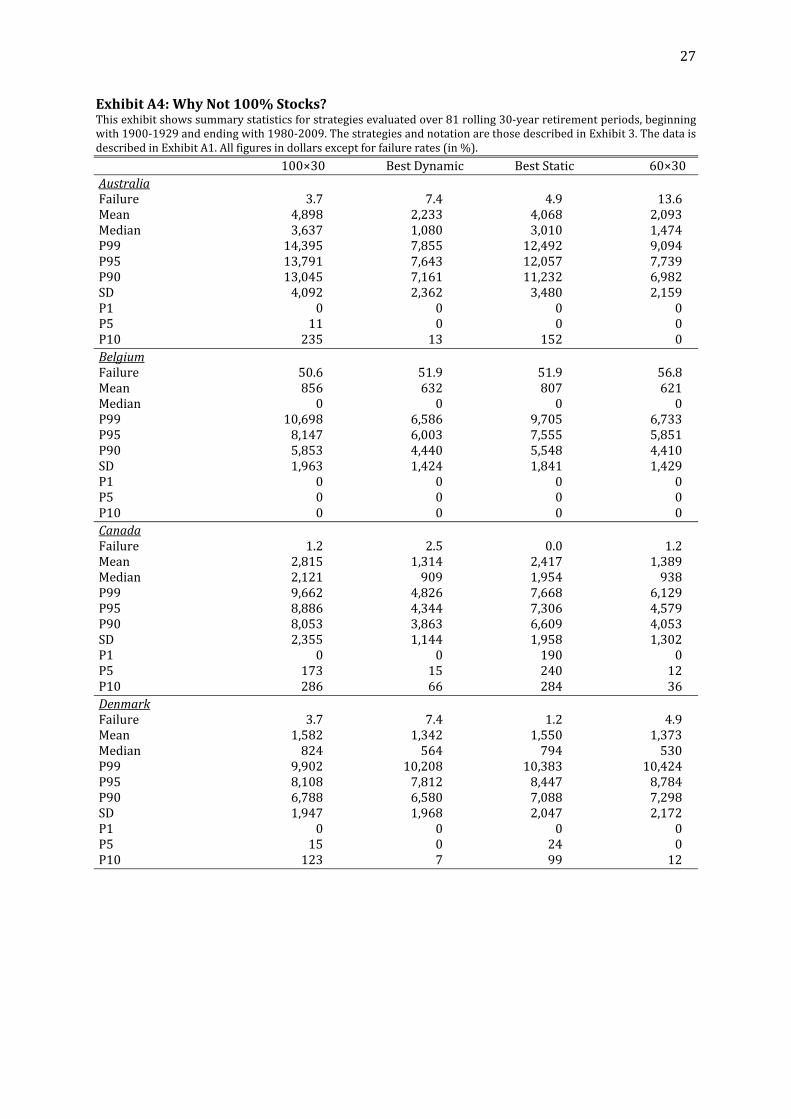
ExhibitA4:WhyNot100%Stocks?Thisexhibitshowssummarystatisticsforstrategiesevaluatedover81rolling30‐yearretirementperiods,beginningwith1900‐1929andendingwith1980‐2009.ThestrategiesandnotationarethosedescribedinExhibit3.ThedataisdescribedinExhibitA1.Allfiguresindollarsexceptforfailurerates(in%).
100×30 BestDynamic BestStatic 60×30AustraliaFailure 3.7 7.4 4.9 13.6Mean 4,898 2,233 4,068 2,093Median 3,637 1,080 3,010 1,474P99 14,395 7,855 12,492 9,094P95 13,791 7,643 12,057 7,739P90 13,045 7,161 11,232 6,982SD 4,092 2,362 3,480 2,159P1 0 0 0 0P5 11 0 0 0P10 235 13 152 0BelgiumFailure 50.6 51.9 51.9 56.8Mean 856 632 807 621Median 0 0 0 0P99 10,698 6,586 9,705 6,733P95 8,147 6,003 7,555 5,851P90 5,853 4,440 5,548 4,410SD 1,963 1,424 1,841 1,429P1 0 0 0 0P5 0 0 0 0P10 0 0 0 0CanadaFailure 1.2 2.5 0.0 1.2Mean 2,815 1,314 2,417 1,389Median 2,121 909 1,954 938P99 9,662 4,826 7,668 6,129P95 8,886 4,344 7,306 4,579P90 8,053 3,863 6,609 4,053SD 2,355 1,144 1,958 1,302P1 0 0 190 0P5 173 15 240 12P10 286 66 284 36DenmarkFailure 3.7 7.4 1.2 4.9Mean 1,582 1,342 1,550 1,373Median 824 564 794 530P99 9,902 10,208 10,383 10,424P95 8,108 7,812 8,447 8,784P90 6,788 6,580 7,088 7,298SD 1,947 1,968 2,047 2,172P1 0 0 0 0P5 15 0 24 0P10 123 7 99 12

28
ExhibitA4:WhyNot100%Stocks?(Cont.) 100×30 BestDynamic BestStatic 60×30FinlandFailure 34.6 40.7 39.5 40.7Mean 2,903 1,248 2,556 1,462Median 837 288 812 529P99 29,086 12,367 25,697 14,529P95 20,459 10,612 17,827 10,850P90 16,321 7,436 14,379 8,196SD 5,155 2,443 4,511 2,606P1 0 0 0 0P5 0 0 0 0P10 0 0 0 0FranceFailure 56.8 63.0 59.3 61.7Mean 862 935 913 976Median 0 0 0 0P99 14,521 9,895 14,195 11,911P95 9,661 8,299 9,826 9,257P90 6,777 6,741 7,035 7,195SD 2,363 2,175 2,405 2,327P1 0 0 0 0P5 0 0 0 0P10 0 0 0 0GermanyFailure 56.8 49.4 56.8 56.8Mean 2,085 580 1,837 1,201Median 0 69 0 0P99 46,868 2,390 38,156 17,985P95 21,440 2,301 17,904 9,226P90 13,908 2,175 11,836 6,607SD 5,829 746 4,832 2,504P1 0 0 0 0P5 0 0 0 0P10 0 0 0 0IrelandFailure 28.4 38.3 29.6 38.3Mean 1,964 1,125 1,747 1,086Median 771 219 616 258P99 24,107 12,240 21,577 13,765P95 14,642 8,943 13,503 9,538P90 10,796 6,607 9,580 6,546SD 3,624 2,179 3,281 2,262P1 0 0 0 0P5 0 0 0 0P10 0 0 0 0ItalyFailure 64.2 75.3 69.1 75.3Mean 470 420 402 287Median 0 0 0 0P99 7,529 7,477 7,269 5,549P95 4,173 5,513 4,293 3,924P90 3,135 3,572 2,836 2,434SD 1,100 1,277 1,043 890P1 0 0 0 0P5 0 0 0 0P10 0 0 0 0

29
ExhibitA4:WhyNot100%Stocks?(Cont.) 100×30 BestDynamic BestStatic 60×30JapanFailure 39.5 38.3 37.0 38.3Mean 4,472 2,878 1,610 2,053Median 1,478 1,987 1,140 1,407P99 45,352 23,167 9,133 13,678P95 36,301 18,083 7,133 10,619P90 26,674 12,922 6,224 8,850SD 8,608 4,224 1,942 2,720P1 0 0 0 0P5 0 0 0 0P10 0 0 0 0NetherlandsFailure 21.0 19.8 22.2 24.7Mean 2,259 1,107 1,681 1,164Median 987 410 836 446P99 14,948 9,491 11,205 7,851P95 13,105 8,654 10,373 7,648P90 10,524 6,864 8,479 6,383SD 3,284 2,096 2,554 1,905P1 0 0 0 0P5 0 0 0 0P10 0 0 0 0NewZealandFailure 0.0 3.7 0.0 3.7Mean 2,579 1,568 2,248 1,320Median 2,378 928 2,063 914P99 7,681 9,310 7,743 6,176P95 6,880 7,985 6,191 5,368P90 6,264 6,062 5,702 4,397SD 1,782 1,847 1,628 1,312P1 51 0 37 0P5 285 4 233 9P10 408 36 331 34NorwayFailure 37.0 43.2 37.0 53.1Mean 1,189 836 1,168 949Median 135 86 96 0P99 20,231 11,649 18,435 11,668P95 11,520 7,487 11,065 8,057P90 7,380 5,032 7,216 5,753SD 2,797 1,826 2,653 1,955P1 0 0 0 0P5 0 0 0 0P10 0 0 0 0S.AfricaFailure 2.5 6.2 2.5 6.2Mean 4,682 1,855 3,789 1,777Median 4,072 1,307 3,333 1,496P99 16,331 9,778 14,167 8,758P95 15,198 8,395 12,784 6,880P90 12,796 6,881 10,375 5,460SD 3,632 2,047 2,971 1,632P1 0 0 0 0P5 181 0 119 0P10 383 25 326 48

30
ExhibitA4:WhyNot100%Stocks?(Cont.) 100×30 BestDynamic BestStatic 60×30SpainFailure 40.7 46.9 42.0 45.7Mean 590 368 547 386Median 154 62 121 34P99 15,292 8,692 13,947 9,379P95 7,738 4,277 7,119 4,928P90 4,328 2,554 3,968 2,828SD 1,971 1,122 1,804 1,233P1 0 0 0 0P5 0 0 0 0P10 0 0 0 0SwedenFailure 17.3 12.3 16.0 16.0Mean 3,664 1,740 3,162 1,792Median 1,932 807 1,530 870P99 27,962 18,585 24,280 16,044P95 22,118 14,154 20,029 12,615P90 17,376 10,196 15,457 9,325SD 5,279 3,255 4,697 2,898P1 0 0 0 0P5 0 0 0 0P10 0 0 0 0SwitzerlandFailure 33.3 23.5 24.7 27.2Mean 1,373 712 745 869Median 1,022 383 586 676P99 5,274 4,676 4,340 4,467P95 4,721 3,487 3,398 3,619P90 4,225 2,784 2,630 2,924SD 1,418 892 827 913P1 0 0 0 0P5 0 0 0 0P10 0 0 0 0UKFailure 6.2 22.2 12.3 23.5Mean 2,514 1,359 2,139 1,240Median 1,925 718 1,628 749P99 16,350 15,181 14,719 10,027P95 10,462 9,142 9,639 7,143P90 8,287 6,916 7,410 5,563SD 2,612 2,274 2,337 1,717P1 0 0 0 0P5 0 0 0 0P10 14 0 0 0
31
ReferencesAmeriks,John,RobertVeres,andMarkWarshawsky(2001).“MakingRetirementIncomeLastaLifetime.”JournalofFinancialPlanning,December,60‐76.Arnott,Robert(2012).“TheGlidepathIllusion.”ResearchAffiliatesFundamentals,September,1‐5.Arnott,Robert,KatrinaSherrerd,andLillianWu(2013).“TheGlidepathIllusion…andPotentialSolutions.”JournalofRetirement,Fall,13‐28.Basu,Anup,andMichaelDrew(2009).“PortfolioSizeEffectinRetirementAccounts:WhatDoesItImplyforLifecycleAssetAllocationFunds?”JournalofPortfolioManagement,Spring,61‐72.Basu, Anup, Brett Doran, and Michael Drew (2012). “Sequencing Risk: A Key Challenge ToCreating Sustainable Retirement Income.” Financial Services Institute of Australia, ResearchReport,October,1‐40.Bengen, William (1994). “Determining Withdrawal Rates Using Historical Data.” Journal ofFinancialPlanning,October,171‐180.Bengen,William(1996).“AssetAllocationforaLifetime.”JournalofFinancialPlanning,August,58‐67.Bengen,William (1997). “Conserving Client PortfoliosDuringRetirement, Part III.” Journal ofFinancialPlanning,December,84‐97.Bengen,William (2001). “Conserving Client PortfoliosDuringRetirement, Part IV.” Journal ofFinancialPlanning,May,110‐119.Blanchett,David(2007).“DynamicAllocationStrategiesforDistributionPortfolios:DeterminingtheOptimalDistributionGlidePath.”JournalofFinancialPlanning,December,68‐81.Blanchett,David,andLarryFrank(2009). “ADynamicandAdaptiveApproach toDistributionPlanningandMonitoring.”JournalofFinancialPlanning,April,52‐66.Cassaday, Stephan (2006). “DIESEL: A System for Generating Cash Flow During Retirement.”JournalofFinancialPlanning,September,50‐65.Cohen,Josh,GrantGardner,andYuan‐AnFan(2010).“ShouldTargetDateFundGlidePathsBeManaged‘To’or‘Through’Retirement?”RussellResearch,April,1‐7.Cooley, Philip, Carl Hubbard, and Daniel Walz (1998). “Retirement Savings: Choosing aWithdrawal Rate That Is Sustainable.” Journal of the American Association of IndividualInvestors,February,16‐21.Cooley, Philip, Carl Hubbard, and Daniel Walz (2003a). “Does International DiversificationIncrease the SustainableWithdrawal Rates from Retirement Portfolios?” Journal of FinancialPlanning,January,74‐80.Cooley,Philip,CarlHubbard,andDanielWalz(2003b).“AComparativeAnalysisofRetirementPortfolioSuccessRates:SimulationVersusOverlappingPeriods.”FinancialServicesReview,12,115‐128.
32
Cooley,Philip,CarlHubbard,andDanielWalz(2005). “RetirementWithdrawals:WhatRate IsSafe When Time Is Short and Uncertain.” Journal of the American Association of IndividualInvestors,January,4‐9.Cooley,Philip,CarlHubbard,andDanielWalz(2011).“PortfolioSuccessRates:WheretoDrawtheLine.”JournalofFinancialPlanning,April,48‐60.Dimson,Elroy,PaulMarsh,andMikeStaunton(2002).TriumphoftheOptimists–101YearsofInvestmentReturns.PrincetonUniversityPress.Dolvin,Steven,WilliamTempleton,andWilliamRieber(2010).“AssetAllocationforRetirement:SimpleHeuristicsandTarget‐DateFunds.”JournalofFinancialPlanning,March,60‐71.Dus,Ivica,RaimondMaurer,andOliviaMitchell(2005).“BettingonDeathandCapitalMarketsinRetirement: A Shortfall Risk Analysis of Life Annuities Versus Phased Withdrawal Plans.”FinancialServicesReview,14,169‐196.Estrada, Javier (2014a). “The Glidepath Illusion: An International Perspective.” Journal ofPortfolioManagement,Summer,52‐64.Estrada,Javier(2014b).“RethinkingRisk.”JournalofAssetManagement,15,4,239‐259.Estrada, Javier (2014c). “Rethinking Risk (II): The Size and Value Effects.” Journal ofWealthManagement,Winter,78‐83.Garrison, Michael, Carlos Sera, and Jeffrey Cribbs (2010). “A Simple Dynamic Strategy forPortfoliosTakingWithdrawals:TheCaseforUsinga12‐MonthSimpleMovingAverage.”JournalofFinancialPlanning,February,51‐61.Guyton, Jonathan (2004). “DecisionRulesandPortfolioManagement forRetirees: Is the ‘Safe’InitialWithdrawalRateTooSafe?”JournalofFinancialPlanning,October,54‐62.Guyton,Jonathan,andWilliamKlinger(2006).“DecisionRulesandMaximumInitialWithdrawalRates.”JournalofFinancialPlanning,March,48‐58.Ho,Kwok,MosheMilevsky,andChrisRobinson(1994).“AssetAllocation,LifeExpectancyandShortfall.”FinancialServicesReview,3,109‐126.Jaconetti,Colleen,FrancisKinniry,andMichaelDiJoseph(2013).“AMoreDynamicApproachToSpendingForInvestorsinRetirement.”VanguardResearch,October,1‐12.Kitces,Michael(2008).“ResolvingtheParadox:IstheSafeWithdrawalRateSometimesTooSafe.”TheKitcesReport,May,1‐13.Kitces,Michael,andWadePfau(2014).“RetirementRisk,EquityGlidepaths,andValuation‐BasedAssetAllocation.”Workingpaper.Milevsky,Moshe,andChrisRobinson(2005).“ASustainableSpendingRateWithoutSimulation.”FinancialAnalystsJournal,November/December,89‐100.Milevsky,Moshe,KwokHo,andChrisRobinson(1997).“AssetAllocationViatheConditionalFirstExit Time or How To Avoid Outliving Your Money.” Review of Quantitative Finance andAccounting,9,53‐70.

33
Pfau,Wade(2010).“AnInternationalPerspectiveonSafeWithdrawalRates:TheDemiseofthe4PercentRule?”JournalofFinancialPlanning,December,52‐61.Pfau,Wade(2011).“CanWePredicttheSustainableWithdrawalRateforNewRetirees?”JournalofFinancialPlanning,August,40‐47.Pfau,Wade (2012). “WithdrawalRates, SavingsRates, andValuation‐BasedAsset Allocation.”JournalofFinancialPlanning,April,34‐40.Pfau,Wade, andMichaelKitces (2014). “ReducingRetirementRiskwithaRisingEquityGlidePath.”JournalofFinancialPlanning,January,38‐48.Pye,Gordon (2000). “Sustainable InvestmentWithdrawals.” Journal of PortfolioManagement,Summer,73‐83.Sheikh,Abdullah,KatherineRoy,andAnneLester(2014).“Breakingthe4%Rule.DynamicallyAdapting Asset Allocation and Withdrawal Rates To Make the Most of Retirement Assets.”JPMorgan,RetirementInsights,February,1‐32.Shiller, Robert (2005). “Life‐Cycle Portfolios as Government Policy.” The Economists’ Voice,volume2,issue1,article14,1‐14.Spitzer, John, and Sandeep Singh (2006). “Extending Retirement Payouts by Optimizing theSequenceofWithdrawals.”JournalofFinancialPlanning,April,52‐61.Spitzer, John, and Sandeep Singh (2007). “Is Rebalancing a Portfolio During RetirementNecessary?”JournalofFinancialPlanning,June,46‐57.Spitzer,John,JeffreyStrieter,andSandeepSingh(2007).“GuidelinesforWithdrawalRatesandPortfolioSafetyDuringRetirement.”JournalofFinancialPlanning,October,52‐59.Stout, Gene (2008). “Stochastic Optimization of Retirement Portfolio Asset Allocations andWithdrawals.”FinancialServicesReview,17,1‐15.Stout, Gene, and JohnMitchell (2006). “Dynamic RetirementWithdrawal Planning.” FinancialServicesReview,15,117‐131.Terry,Rory(2003).“TheRelationBetweenPortfolioCompositionandSustainableWithdrawalRates.”JournalofFinancialPlanning,May,64‐78.
Top Related