


Languages
Pages
Legal


The QIX Engine - under the hood Symbol tables, Bit-stuffed indices and State spaces
HIC – Henric Cronström
27 January, 2016

2
What is the QIX engine? • Back-end in QlikView & Qlik Sense • Same as QlikView engine – but improved
Qlik Engine QlikView 11 client
QIX Engine
QlikView 12 client
Qlik Sense client
Row-based
Columnar + some other optimizations

3
The Seven Principal Engine Components
Script Engine Data
Authorization Logical
Inference Engine
Calculation Engine
Rendering Engine
Export Features
QIX Internal
Database

4
What happens during the script execution?
SQL SELECT * FROM Orders; SQL SELECT * FROM [Order Details]; SQL SELECT * FROM Products;
Read record by record from source Create or Append to Data table Create or Append to Symbol tables
Read record by record from source
Create or Append to Data table Create or Append to Symbol tables
Read record by record from source
Create or Append to Data table Create or Append to Symbol tables
Create Synthetic keys and Tables Define Keys between tables
If the data model is bad, many Synthetic keys will be created. This takes time and eats memory.
The script execution is sequential

5
Data tables and Symbol tables • The Symbol tables contain only distinct field
values: Bit-stuffed indices and their clear-text meanings
• The compressed Data table contains the same number of columns and rows as the source, but is filled with bit-stuffed indices, and thus extremely compact
Symbol Tables
Data Table
6
The Seven Principal Engine Components
Script Engine
Authorization Logical
Inference Engine
Calculation Engine
Rendering Engine
Export Features
QIX Internal Database
Data Symbols

7
Implications of Symbol tables • Many distinct values in a field ► Longer bit-stuffed index and more rows
in the symbol table (more RAM usage and more CPU usage)
– If possible, reduce the number of distinct values. E.g. Time( Floor( Time, 1/24/60 ), ’hh:mm’ )
• Long field values ► Longer values in symbol table (more RAM usage)
– If possible, reduce size of field value. E.g. Autonumber( ProductID & ’|’ & CustomerID & ’|’ & Date )

8
Colors and States • Two Flags:
– Every field value is either Selected or Not Selected – Every field value is either Possible or Not Possible
• These two state flags are independent of each other State
Selection State

• Green with tick mark • Dark gray with tick mark • Dark gray without tick mark • Light gray
= Selected = Selected excluded = Non-selected excluded = Alternative
Colors and States II

Colors and States III
11
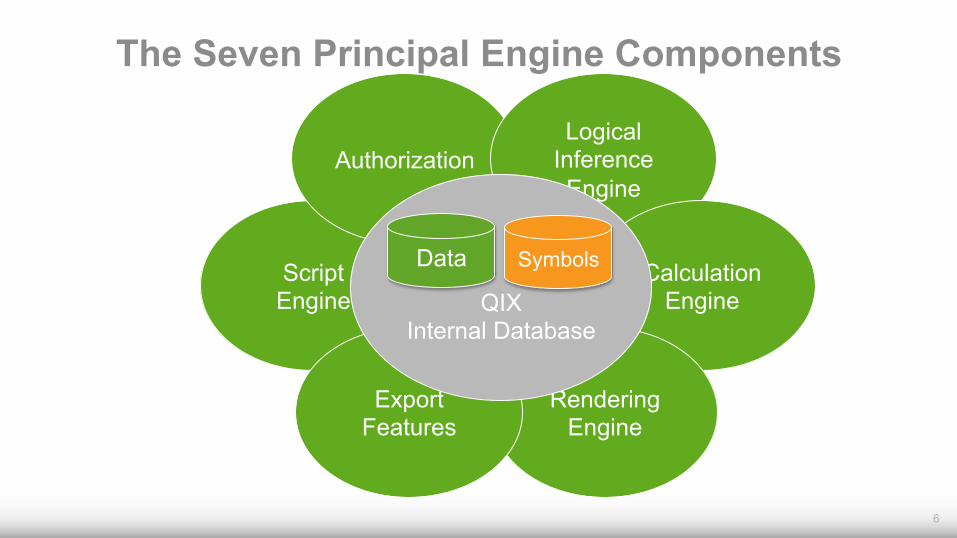
Logical Inference and State Vectors • Every time you click, the states and colors for all field values are
calculated. This is the Logical Inference.
• The states are stored in the State Vectors.
12
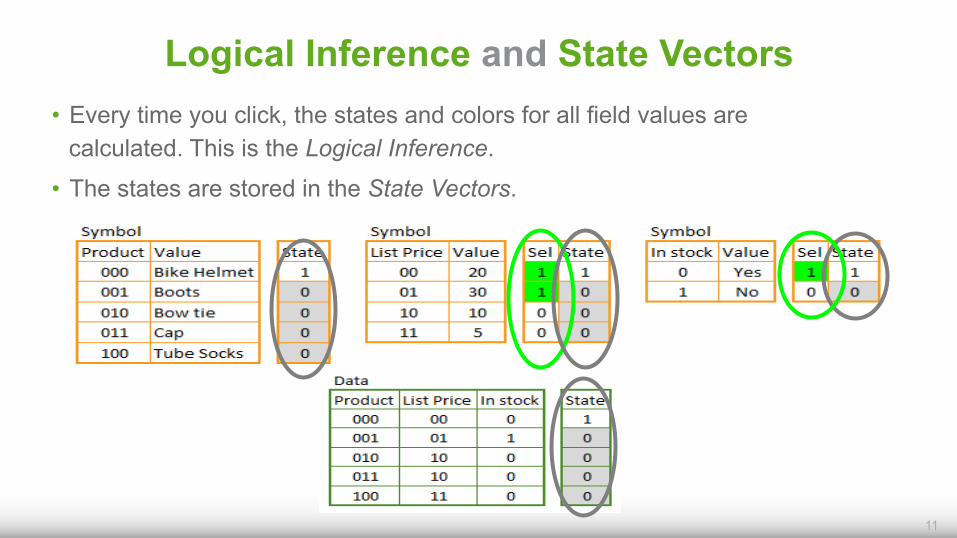
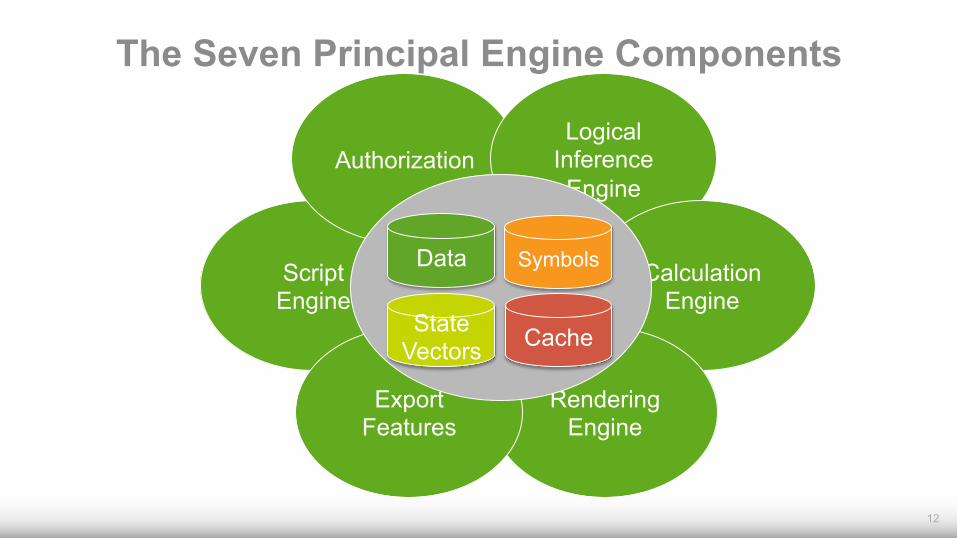
The Seven Principal Engine Components
Script Engine
Authorization Logical
Inference Engine
Calculation Engine
Rendering Engine
Export Features
State Vectors
Data Symbols
Cache

13
Logical Inference
The state evaluation propagates from table to table. The state is stored in the state vectors.

14
Calculations vs Logical Inference
1. Logical inference On
Data model
2. Aggregations in
Transient Hypercubes
(Objects)
QIX Internal Database
Calculation Engine

15
Multithreading
Selection Chart
One or several threads per user
One thread per object
Several threads per chart
List box
Find values or combinations
Chart
Calculate aggregation
Logical inference Calculation engine
Logical inference
Single-threaded!
Possible bottle-neck!
16
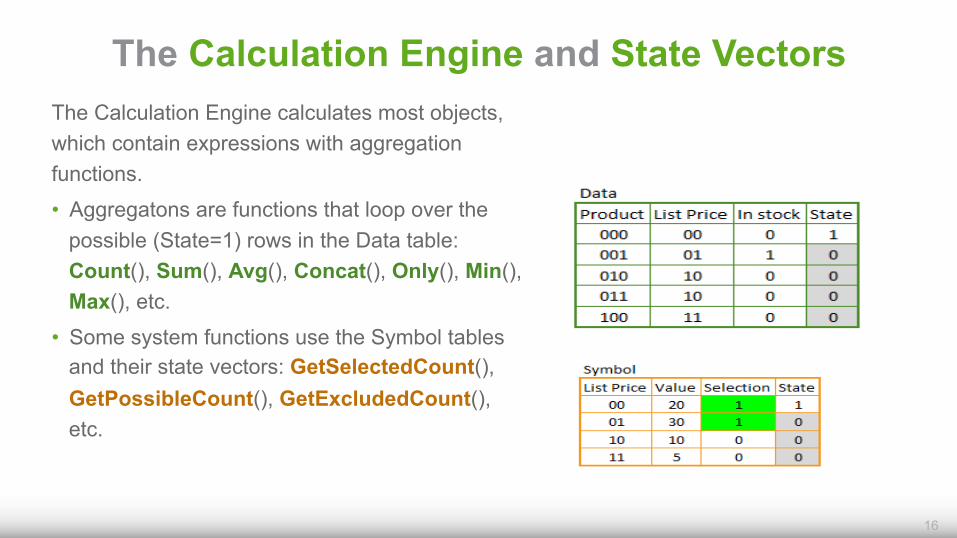
The Calculation Engine and State Vectors The Calculation Engine calculates most objects, which contain expressions with aggregation functions.
• Aggregatons are functions that loop over the possible (State=1) rows in the Data table: Count(), Sum(), Avg(), Concat(), Only(), Min(), Max(), etc.
• Some system functions use the Symbol tables and their state vectors: GetSelectedCount(), GetPossibleCount(), GetExcludedCount(), etc.

17
How does the Calculation Engine work?
• Sum( Quantity ) = ? – Answer: 10. Calculated (aggregated) in the Transactions table.
• Count( Product ) = ?
– Answer: 2. Calculated in the Products table.
• Sum( Quantity*ListPrice ) = ?
– Answer: 42. ( 1*3 + 2*5 + 3*3 + 4*5 ) Calculated in a temporary table: Transactions U Products.
Considerable time single-threaded!
Possible bottle-neck!

18
How does the Calculation Engine work? • The QIX Engine determines which table to use for the
aggregation
• It is determined by the field references inside the aggregation: Sum( Quantity ) g The table with Quantity Sum( ListPrice ) g The table with ListPrice Sum( Quantity * ListPrice ) g A temporary table
• If fields from different tables are used inside the same aggregation, lookup tables or a temporary table is created. This is a single threaded process

19
The Calculation Engine oddities
• Sum( 1 ) = ? (No field references!)
– Answer: Not determined which table to use! • Sum( 0*UnitPrice + 1 ) = ?
– Answer: 4: Calculated in the Transactions table
• Sum( 0*ListPrice + 1 ) = ?
– Answer: 2. Calculated in the Products table
• Sum( 0*UnitPrice + ListPrice ) = ?
– Answer 16: Calculated in a temporary table: Transactions U Products

20
Implications of the Calculation Engine • Field references from different tables ► More RAM usage, more CPU time
– For performance, you may consider moving a number to the ”correct” table, so that the creation of a temporary table is avoided.
• Field references from different tables ► Possibility for incorrect calculations
– Avoid If()-functions. Use Set Analysis instead. E.g. avoid Sum( If( OrderMonth=5, InvoiceAmount ) ) Instead, use Sum( {$<OrderMonth={5}>} InvoiceAmount )
21
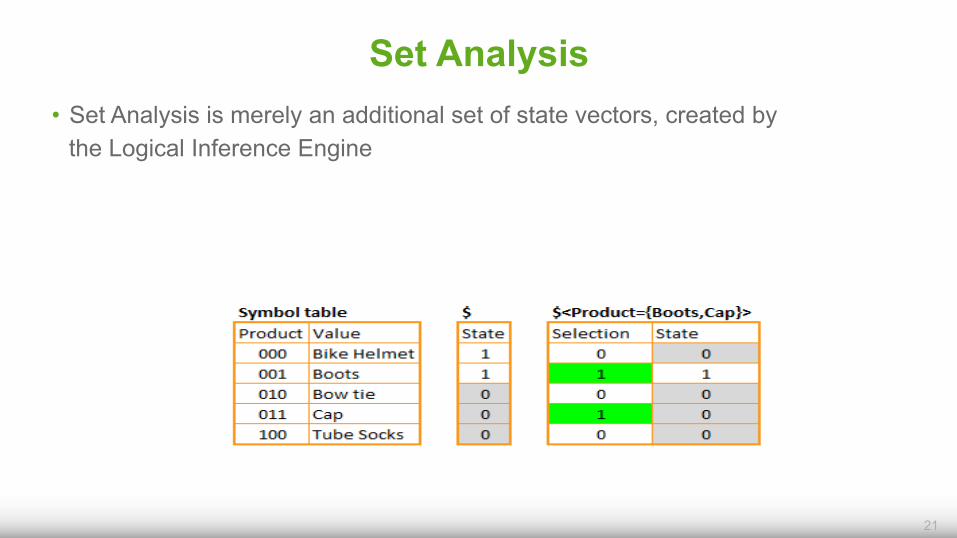
Set Analysis • Set Analysis is merely an additional set of state vectors, created by
the Logical Inference Engine
22
Set Analysis
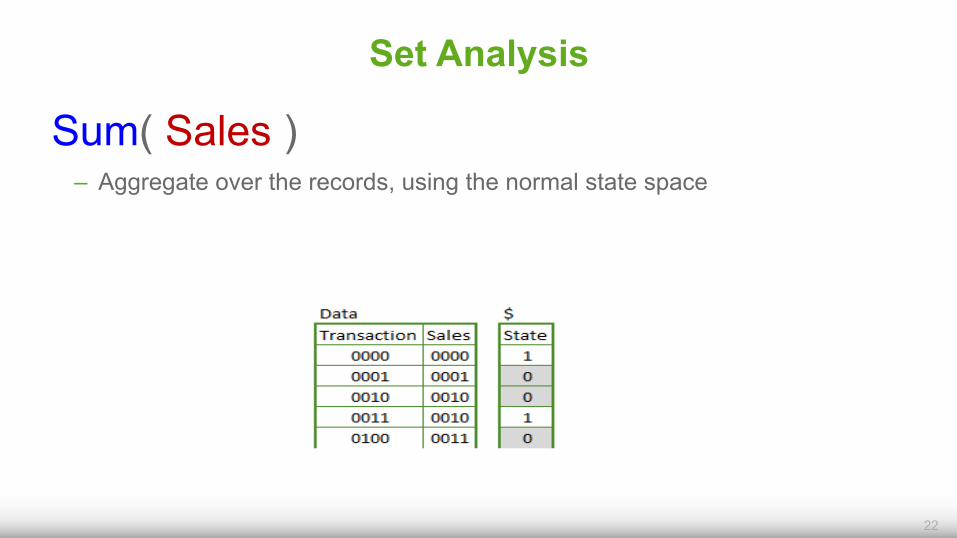
Sum( Sales ) – Aggregate over the records, using the normal state space

23
Set Analysis
Sum( {...} Sales ) – Aggregate over the records, using a different state space
– This first pair of curly brackets define a Record Set: A set of records in a data table.

24
Set Analysis
Sum( {$ <Month=...> } Sales ) – Set modifier: This new state space should be created from the
normal state space, but modified by a selection in Month

25
Set Analysis
Sum( {$<Month= {...} >} Sales ) – This new pair of curly brackets denotes the Element Set:
A set of values in a symbol table.

26
Set Analysis
Sum( {$<Month={ "..." }>} Sales ) – Double quotes denote a search for field values
– Do not use single quotes!

27
Set Analysis
Sum( {$<Month={" <=... "}>} Sales ) – A search string with a relational operator means a numeric
search.

28
Set Analysis
Sum( {$<Month={"<= $(...) "}>} Sales ) – A dollar expansion means that something is inserted before the
parsing of the expression.

29
Set Analysis
Sum( {$<Month={"<=$( =... )"}>} Sales ) – An equals sign inside the dollar expansion means an expression
instead of a variable

30
Set Analysis
Sum( {$<Month={"<=$(= Max(X) )"}>} Sales ) – This expression needs to be an aggregation

31
Implications of Set Analysis • Set Expressions are evaluated by the Logical Inference Engine,
to create an alternative state space.
• It is done before the aggregation made by the Calculation Engine. Hence, a Set Expression cannot be evaluated row-by-row in the chart.
32
Set Analysis
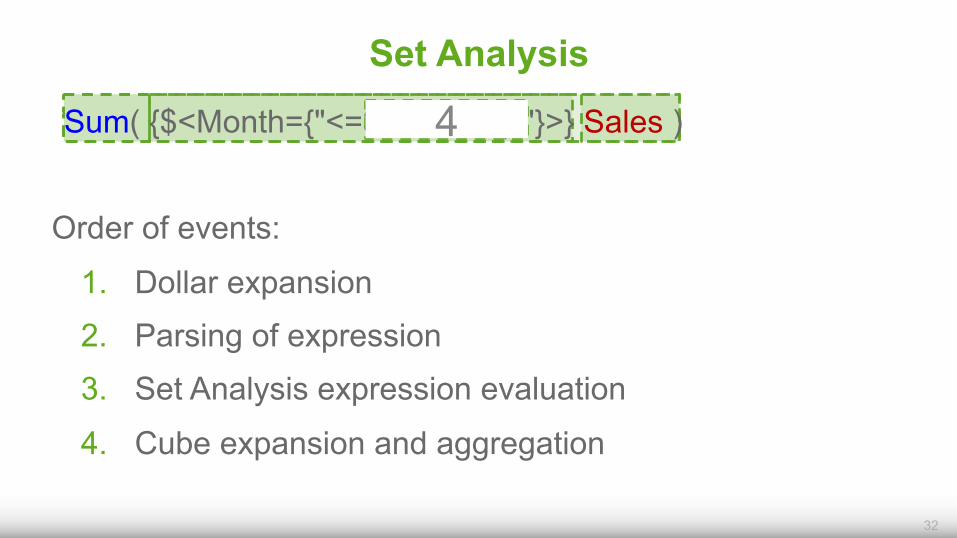
*Sum( {$<Month={"<=$(=Max(X))"}>} Sales )
Order of events:
1. Dollar expansion
2. Parsing of expression
3. Set Analysis expression evaluation
4. Cube expansion and aggregation
4 4
33
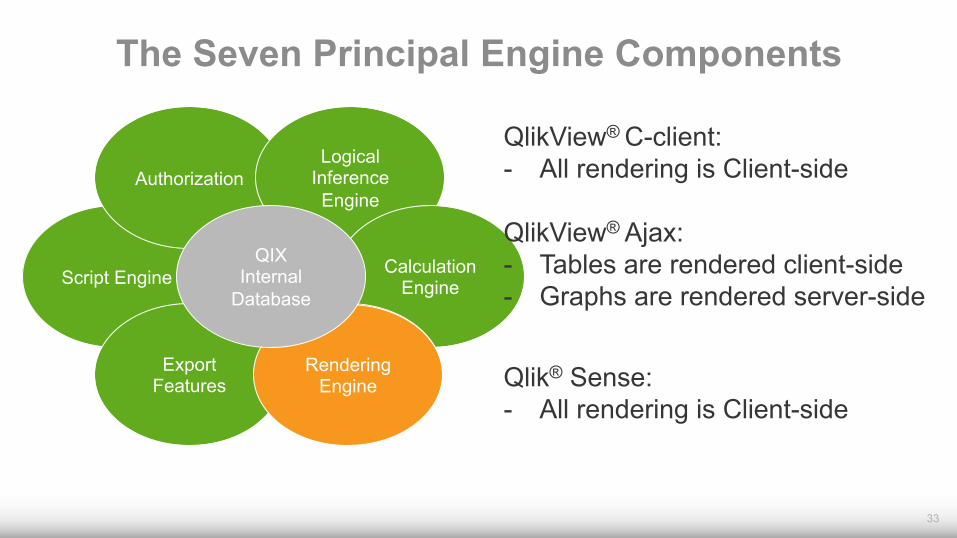
The Seven Principal Engine Components
Script Engine
Authorization Logical
Inference Engine
Calculation Engine
Rendering Engine
Export Features
Rendering Engine
QIX Internal
Database
Qlik® Sense: - All rendering is Client-side
QlikView® C-client: - All rendering is Client-side
QlikView® Ajax: - Tables are rendered client-side - Graphs are rendered server-side

Questions & Answers

Thank You
Top Related