


Languages
Pages
Legal

P O P U L A T I O N A N D D E V E L O P M E N T R E V I E W 24(1) :75–114 (MARCH 1998) 75
The Poverty of Cities inDeveloping Regions
MARTIN BROCKERHOFF
ELLEN BRENNAN
A LONG-STANDING BELIEF in development studies holds that, on the whole,living conditions in developing countries are superior for residents of largecities than for persons living in smaller cities, towns, and villages. The con-cept of big cities as “islands of privilege” (Harrison 1982: 145) is funda-mental to otherwise discrepant theories of modernization, dependency,world systems of cities, and the global division of labor, each of which pos-its long-lasting disadvantages for populations outside of major urban cen-ters.1 It is also supported by evidence from numerous developing countriesof lower child mortality rates, greater income-earning opportunities, less fre-quent and less severe famines, and better access to publicly conferred entitle-ments in big cities than in smaller areas in the era since World War II.
Since the late 1980s, however, the presumed superiority of large cit-ies in developing countries has been widely disputed. One argument, in-formed by evidence of rapid population growth and economic stagnationin many cities, and by perceptions of associated negative externalities im-posed on city environments, asserts deteriorating or relatively unfavorableliving conditions for big-city residents, on average, as compared with con-ditions for inhabitants of smaller cities and towns. Paul Kennedy (1993:26) observes that “Asian, Latin American, and Central American mega-cities of 20 million inhabitants have become increasingly centers of pov-erty and social collapse.”2 The International Labour Organization reportsthat by around 1990, most residents of Bombay, Cairo, and Lagos wereliving in slums (Oberai 1993: 8). Specialists on Latin America (for example,Gilbert 1993) emphasize that the impact of economic restructuring sincethe 1980s, including trade liberalization and economic stabilization mea-sures, has been most severe on residents of major cities as a result of reducedpublic expenditure on (or subsidization of) municipal services, housing, infra-structure, and so forth. Terms used to convey the new situation—“Cities ofDespair” (Kaplan 1996a), “The Giant Diseased City” (Linden 1996)—evoke
76 T H E P O V E R T Y O F C I T I E S I N D E V E L O P I N G R E G I O N S
Dickensian images of London, Manchester, and other industrializing citiesof the mid-1800s.3 Such terms also revive dormant claims of overurbani-zation in developing countries (Davis and Hertz 1954; Hoselitz 1957), withthe modification that human misery in cities, rather than negative conse-quences for national development, is now viewed as the distinct outcomeof this phenomenon.4
Perceptions of decline in living conditions in big cities are buttressedby recent literature that documents substantial and growing inequalitywithin cities; the benefits of city life are experienced by some but not byothers. For example, numerous health studies document rates of morbid-ity and child mortality that are several times higher in slums and periurbanareas than in more privileged neighborhoods (Harpham, Lusty, andVaughan 1988; Stephens 1996; Timæus and Lush 1995). Rapid commer-cialization since the 1980s of informal land markets in many cities has wid-ened disparities in household amenities and increased residential segrega-tion (Payne 1989; UNCHS 1996). Deregulation of labor markets, whileenriching industrial elites, has greatly increased the casual adult workforceand expanded the number of gamines, or working street children, in LatinAmerican cities (Standing 1989; Szanton Blanc 1994), while heighteningunemployment among young adults in cities of West Africa (Lachaud 1994).Such trends invite comparison to inner-city decline and suburban afflu-ence in metropolitan areas of the United States since the 1960s (Frey andSpeare 1988). These apparent patterns have also provoked ominous vi-sions of future cities. For Massey (1996: 410), this entails “escalating crimeand violence punctuated by sporadic riots and increased terrorism as classtensions rise.” For others, big-city inequality fueled by resource scarcity,bounded opportunities, and rising ethnic and religious cleavages portendsurban unrest (Homer-Dixon 1991) and social conditions conducive to na-tional revolution (Kaplan 1996b).
The purpose of this article is to evaluate the extent to which residentsof developing cities with one million or more residents, which we refer toas “big” or “large” cities, do indeed have superior living conditions as com-pared with persons living in smaller settlements.5 Building on the work ofeconomists (Mera and Shishido 1983; Sen 1993), we assess relative well-being across settlements in terms of demographic and social indicators thatreflect basic human needs, primarily infant survival, as well as adequateshelter, nutrition, education, health, and health care. A particular focus on“million-plus” cities, rather than on larger “mega-cities,” is of interest givenpatterns of population concentration in developing countries around 1995:Whereas 8 percent of the urban population resided in agglomerations of10 million or more inhabitants, cities of one million or more encompassed36 percent of the urban population (United Nations 1995a). Our premiseis that, on average, big-city residents enjoyed favorable living conditions in
M A R T I N B R O C K E R H O F F / E L L E N B R E N N A N 77
the late 1980s and early 1990s as compared with other urbanites, as a re-sult of common patterns of supply and demand associated with urban ag-glomeration—that is, in most poor countries, publicly financed services andinfrastructure and the highest incomes are heavily concentrated in the larg-est city. Contradictory findings of overall unfavorable living conditions in largecities can therefore be interpreted, broadly, as confirmation of the aforemen-tioned negative development trends for major cities in recent years.
A second objective of the study is to ascertain the impact of popula-tion size and rate of growth on wellbeing in cities, and whether the effectsof living in a big city are contingent on how rapidly that city has grown inrecent years. This analysis responds to popular concerns over the absorp-tive capacity of urban areas in developing regions (Brown and Jacobson1987; Ehrlich and Ehrlich 1990; Moffett 1994) at a time when the urbanpopulation is growing twice as quickly as total population (United Nations1995a). It is also conducted to test the prevailing view—expressed at the1996 United Nations Global Conference on Human Settlements (HABITATII) and maintained by leading urban scholars (for example, Prudh’homme1994; Richardson 1993)—that problems of cities are not a consequence ofsize or growth (that is, there is no optimal city size or rate of expansion),but are related to the efficiency of urban management, good governance,available revenues, and similar factors.
We draw on a wealth of newly available, nationally representativeurban data from 43 countries representing four geographical regions—LatinAmerica and the Caribbean, sub-Saharan Africa, North Africa and the NearEast, and Asia. Separate analysis of these regions is conducted in light of theirdistinct patterns of recent and projected urban change, as discussed below.
Challenges for big cities: A case of“growing pains”?
Anxiety over the quality of life in big cities is nothing new. For example, atrebling of London’s population in the second half of the nineteenth cen-tury, to over 6 million,
came to be associated in the minds of many politicians and commentatorswith the growth of ‘urban problems’—the spread of slums and disease, thebreakdown of law and order, the increase in infant mortality rates and aplethora of other phenomena—all of which attracted mounting comment andconsternation on the part of the Victorian middle classes. (Saunders 1986: 14)
Such a pejorative view of cities and their poor is echoed, of course, by last-ing images projected by leading social theorists of the day—by Marx’s alien-
78 T H E P O V E R T Y O F C I T I E S I N D E V E L O P I N G R E G I O N S
ated and revolutionary urban proletariat, Durkheim’s cities of moral break-down, Tönnies’s loss of communal sentiment and action (“gemeinschaft”)in the emerging metropolis, Simmel’s anonymous and impersonal urban-ite.6 Negative perceptions of big cities at that time were not entirely unjus-tified. For instance, child mortality rates were higher and life expectancywas lower in cities than in rural areas in Europe and the United States inthe late 1800s, mainly as a result of greater germ transmission in denselypopulated areas (Preston and Haines 1991). These and other disadvantagesof city residents in then-industrializing countries generally subsided, how-ever, with subsequent expansion of social welfare measures, medical in-novation, economic growth, and other developments of modernization.
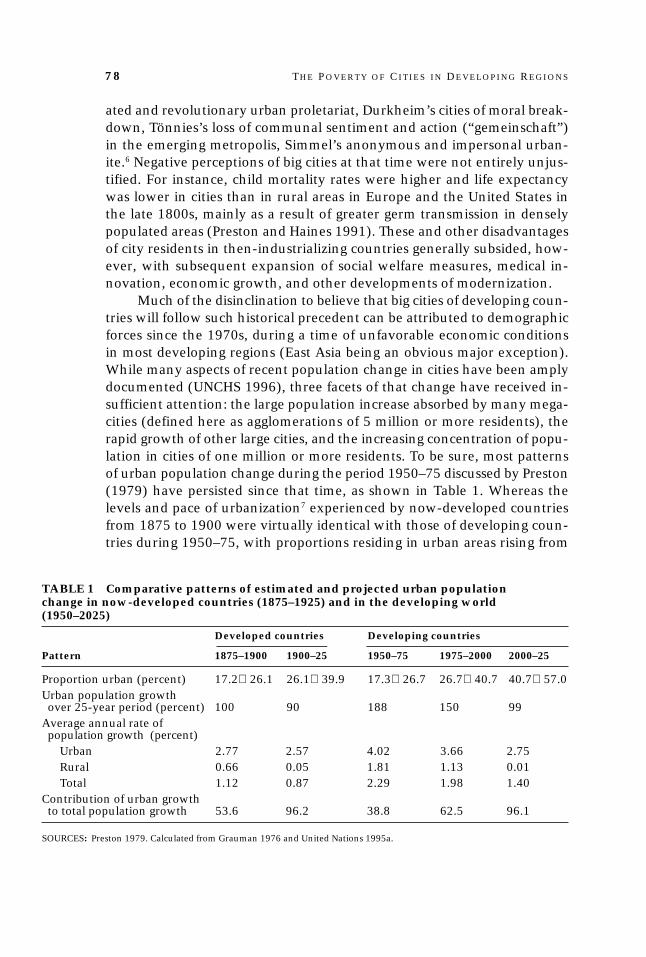
Much of the disinclination to believe that big cities of developing coun-tries will follow such historical precedent can be attributed to demographicforces since the 1970s, during a time of unfavorable economic conditionsin most developing regions (East Asia being an obvious major exception).While many aspects of recent population change in cities have been amplydocumented (UNCHS 1996), three facets of that change have received in-sufficient attention: the large population increase absorbed by many mega-cities (defined here as agglomerations of 5 million or more residents), therapid growth of other large cities, and the increasing concentration of popu-lation in cities of one million or more residents. To be sure, most patternsof urban population change during the period 1950–75 discussed by Preston(1979) have persisted since that time, as shown in Table 1. Whereas thelevels and pace of urbanization7 experienced by now-developed countriesfrom 1875 to 1900 were virtually identical with those of developing coun-tries during 1950–75, with proportions residing in urban areas rising from
TABLE 1 Comparative patterns of estimated and projected urban populationchange in now-developed countries (1875–1925) and in the developing world(1950–2025)
Developed countries Developing countries
Pattern 1875–1900 1900–25 1950–75 1975–2000 2000–25
Proportion urban (percent) 17.2fi26.1 26.1fi39.9 17.3fi26.7 26.7fi40.7 40.7fi57.0Urban population growthover 25-year period (percent) 100 90 188 150 99
Average annual rate ofpopulation growth (percent)
Urban 2.77 2.57 4.02 3.66 2.75Rural 0.66 0.05 1.81 1.13 0.01Total 1.12 0.87 2.29 1.98 1.40
Contribution of urban growthto total population growth 53.6 96.2 38.8 62.5 96.1
SOURCES: Preston 1979. Calculated from Grauman 1976 and United Nations 1995a.
M A R T I N B R O C K E R H O F F / E L L E N B R E N N A N 79
17 to 26 percent, United Nations projections suggest that this consistencyis likely to hold for the subsequent quarter-centuries as well. Much morerapid urban growth in developing countries over these comparable periodscontinues also, though slightly abated from a 25-year increase of almosttwice (188/100 percent) to two-thirds (150/90) higher, partly as a result ofa larger urban population in these countries in 1975 than in 1950.8 As inthe earlier case of now-developed countries, urban growth rates in devel-oping countries are slowly declining, even while they remain very highand several times greater than rural rates. And although over 95 percentof population growth in the developing world between 2000 and 2025 isprojected to occur in urban areas—as compared with less than 40 percentfrom 1950–75—this too is not without precedent, as more than 95 percentof growth in now-developed countries during 1900–25 is estimated to havetaken place in cities and towns (Grauman 1976).9
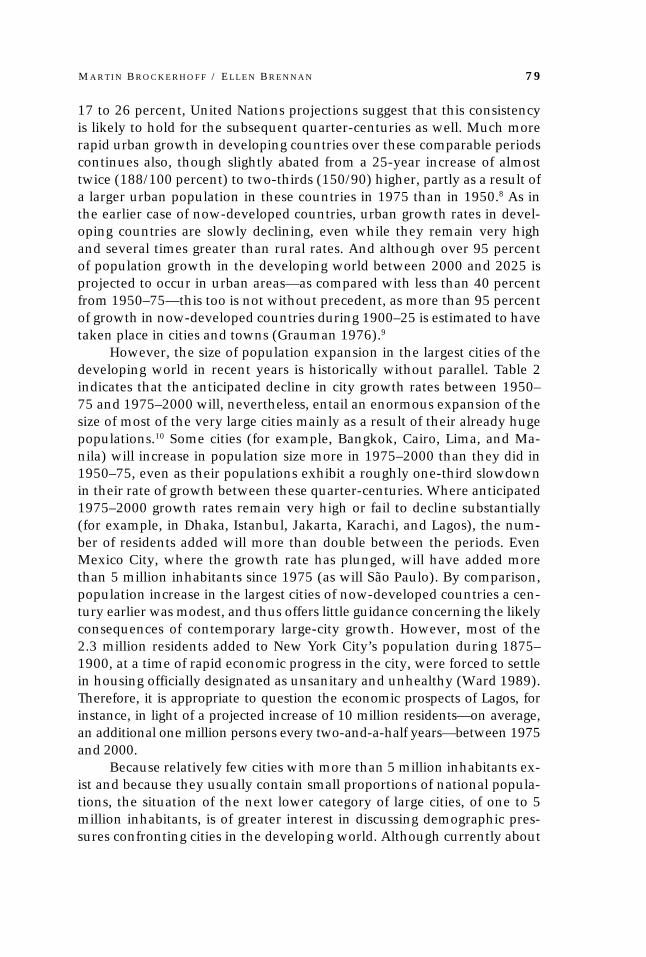
However, the size of population expansion in the largest cities of thedeveloping world in recent years is historically without parallel. Table 2indicates that the anticipated decline in city growth rates between 1950–75 and 1975–2000 will, nevertheless, entail an enormous expansion of thesize of most of the very large cities mainly as a result of their already hugepopulations.10 Some cities (for example, Bangkok, Cairo, Lima, and Ma-nila) will increase in population size more in 1975–2000 than they did in1950–75, even as their populations exhibit a roughly one-third slowdownin their rate of growth between these quarter-centuries. Where anticipated1975–2000 growth rates remain very high or fail to decline substantially(for example, in Dhaka, Istanbul, Jakarta, Karachi, and Lagos), the num-ber of residents added will more than double between the periods. EvenMexico City, where the growth rate has plunged, will have added morethan 5 million inhabitants since 1975 (as will São Paulo). By comparison,population increase in the largest cities of now-developed countries a cen-tury earlier was modest, and thus offers little guidance concerning the likelyconsequences of contemporary large-city growth. However, most of the2.3 million residents added to New York City’s population during 1875–1900, at a time of rapid economic progress in the city, were forced to settlein housing officially designated as unsanitary and unhealthy (Ward 1989).Therefore, it is appropriate to question the economic prospects of Lagos, forinstance, in light of a projected increase of 10 million residents—on average,an additional one million persons every two-and-a-half years—between 1975and 2000.
Because relatively few cities with more than 5 million inhabitants ex-ist and because they usually contain small proportions of national popula-tions, the situation of the next lower category of large cities, of one to 5million inhabitants, is of greater interest in discussing demographic pres-sures confronting cities in the developing world. Although currently about
80 T H E P O V E R T Y O F C I T I E S I N D E V E L O P I N G R E G I O N S
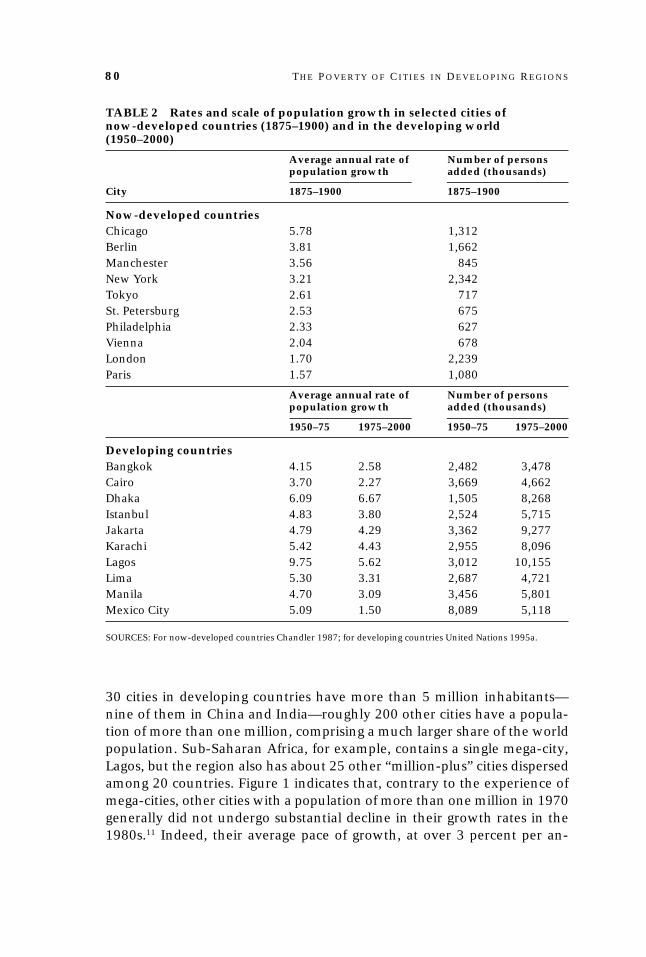
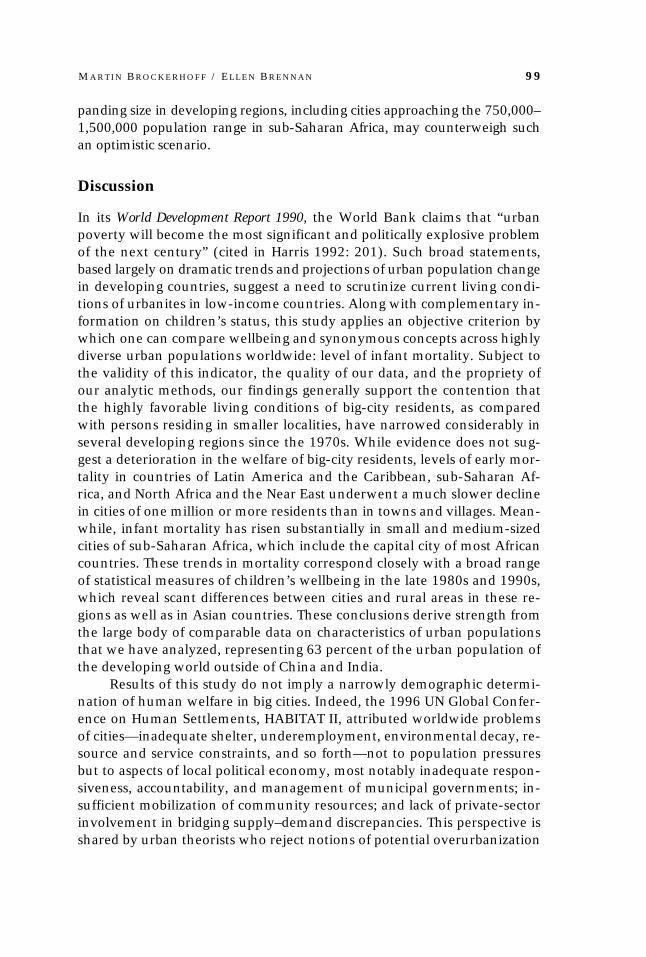
30 cities in developing countries have more than 5 million inhabitants—nine of them in China and India—roughly 200 other cities have a popula-tion of more than one million, comprising a much larger share of the worldpopulation. Sub-Saharan Africa, for example, contains a single mega-city,Lagos, but the region also has about 25 other “million-plus” cities dispersedamong 20 countries. Figure 1 indicates that, contrary to the experience ofmega-cities, other cities with a population of more than one million in 1970generally did not undergo substantial decline in their growth rates in the1980s.11 Indeed, their average pace of growth, at over 3 percent per an-
TABLE 2 Rates and scale of population growth in selected cities ofnow-developed countries (1875–1900) and in the developing world(1950–2000)
Average annual rate of Number of personspopulation growth added (thousands)
City 1875–1900 1875–1900
Now-developed countriesChicago 5.78 1,312Berlin 3.81 1,662Manchester 3.56 845New York 3.21 2,342Tokyo 2.61 717St. Petersburg 2.53 675Philadelphia 2.33 627Vienna 2.04 678London 1.70 2,239Paris 1.57 1,080
Average annual rate of Number of personspopulation growth added (thousands)
1950–75 1975–2000 1950–75 1975–2000
Developing countriesBangkok 4.15 2.58 2,482 3,478Cairo 3.70 2.27 3,669 4,662Dhaka 6.09 6.67 1,505 8,268Istanbul 4.83 3.80 2,524 5,715Jakarta 4.79 4.29 3,362 9,277Karachi 5.42 4.43 2,955 8,096Lagos 9.75 5.62 3,012 10,155Lima 5.30 3.31 2,687 4,721Manila 4.70 3.09 3,456 5,801Mexico City 5.09 1.50 8,089 5,118
SOURCES: For now-developed countries Chandler 1987; for developing countries United Nations 1995a.
M A R T I N B R O C K E R H O F F / E L L E N B R E N N A N 81
num, exceeded that of medium-sized cities of 500 thousand to one millionpersons in 1970, and is projected to remain near this level through the1990s, even as national population growth rates decline steadily (UnitedNations 1995a).12 The question arises whether such sustained rapidgrowth—a near population doubling, on average, between 1970 and 1990—has overstrained the capacity of some of these large cities to accommodatepopulation increase. In any case, as Figure 1 makes clear, claims of a na-scent slowdown of big-city growth in developing regions (for example,Satterthwaite 1996) are premature: Deceleration of growth applies to somemega-cities, but has not been the experience of large cities in general.
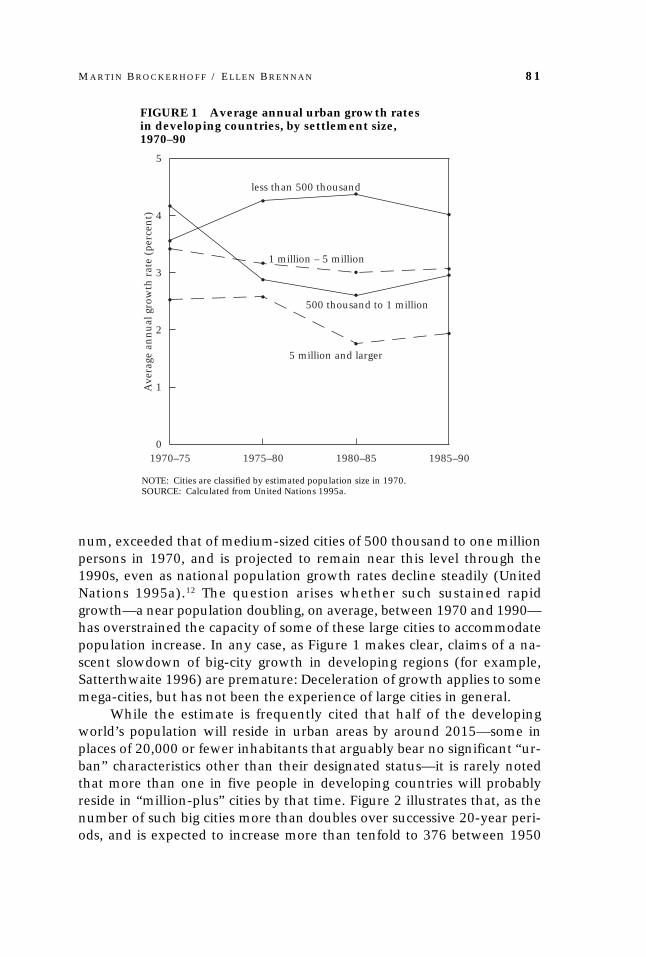
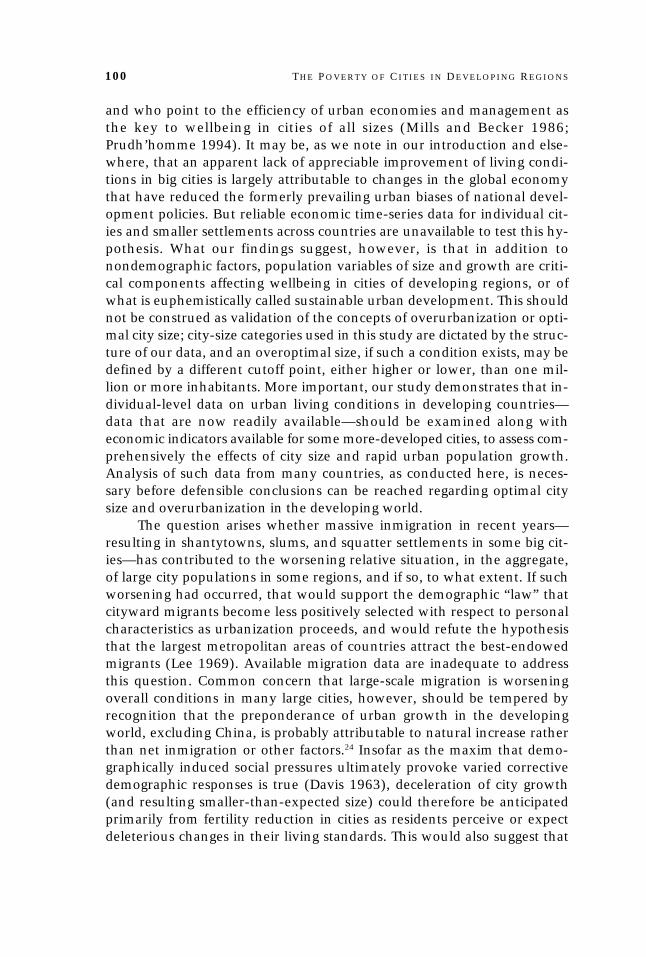
While the estimate is frequently cited that half of the developingworld’s population will reside in urban areas by around 2015—some inplaces of 20,000 or fewer inhabitants that arguably bear no significant “ur-ban” characteristics other than their designated status—it is rarely notedthat more than one in five people in developing countries will probablyreside in “million-plus” cities by that time. Figure 2 illustrates that, as thenumber of such big cities more than doubles over successive 20-year peri-ods, and is expected to increase more than tenfold to 376 between 1950
X
X
X
X
XX
X X
X X
XX
X
XX
X
1970–75 1975–80 1980–85 1985–900
1
2
3
4
5A
vera
ge a
nn
ual
gro
wth
rat
e (p
erce
nt)
less than 500 thousand
1 million – 5 million
500 thousand to 1 million
5 million and larger
FIGURE 1 Average annual urban growth ratesin developing countries, by settlement size,1970–90
NOTE: Cities are classified by estimated population size in 1970.SOURCE: Calculated from United Nations 1995a.
82 T H E P O V E R T Y O F C I T I E S I N D E V E L O P I N G R E G I O N S
and 2010, the percentage-point change in the share of population residingin big cities has increased between successive 20-year periods as well, withan expected marked upsurge during 1990–2010. Whereas the almost uni-versal positive association between urbanization and national economicdevelopment has been well documented and has been argued to apply evento the seemingly contradictory situation of most contemporary Africancountries (Mohan 1995: 148), the relationship between total populationconcentration in large cities and the economic and social wellbeing of mu-nicipal populations remains unexamined. In the many low-income coun-tries where several additional cities of more than one million inhabitantshave emerged since 1970—as in Brazil, India, Iran, Pakistan, South Africa,and most obviously China—and in countries where an increased concen-tration of population in the largest cities has been most pronounced—suchas in Colombia, Dominican Republic, Lebanon, Senegal, and Turkey—it isa matter of speculation whether growing needs and demands for essentialgoods and services implied by increasing municipal populations have beenmet satisfactorily.
A case of management and governance?
Scholarly interest in the costs and benefits associated with city size andgrowth can be dated at least to Sir William Petty, whose essay in 1682deduced, on balance, considerable social gains from a much expanded popu-
1950(N = 34)
1970(N = 82)
1990(N = 174)
2010(N = 376)
0
5
10
15
20
25
30P
erce
nt
of
tota
l p
op
ula
tio
n
Number of cities
3.9
7.8
11.9
19.4
FIGURE 2 Estimated and projected number ofcities with one million or more inhabitants, andthe percentage of total population residingwithin them, developing countries, 1950–2010
SOURCE: United Nations 1995a.
M A R T I N B R O C K E R H O F F / E L L E N B R E N N A N 83
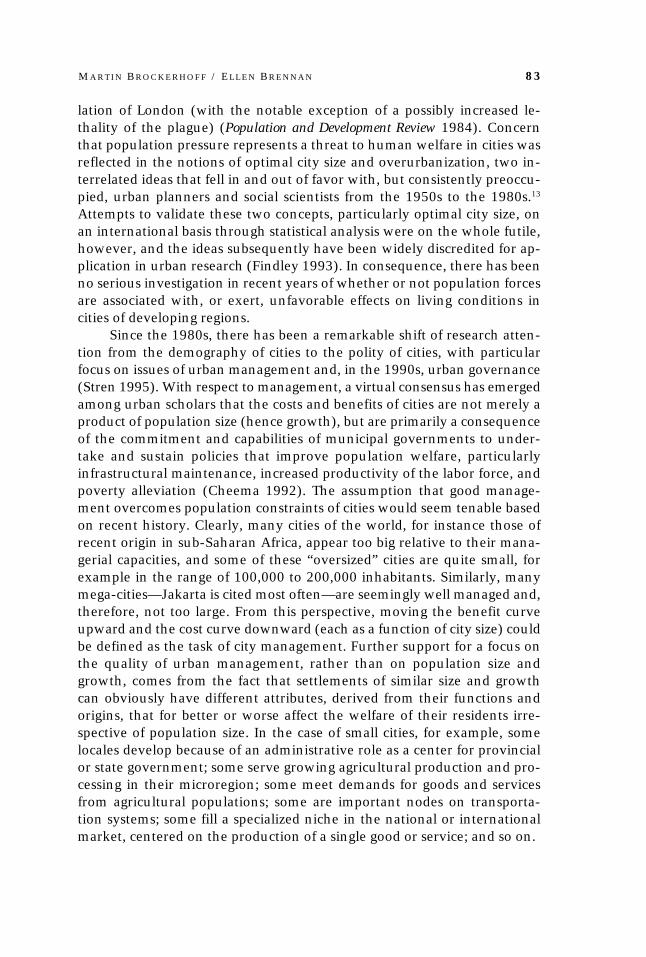
lation of London (with the notable exception of a possibly increased le-thality of the plague) (Population and Development Review 1984). Concernthat population pressure represents a threat to human welfare in cities wasreflected in the notions of optimal city size and overurbanization, two in-terrelated ideas that fell in and out of favor with, but consistently preoccu-pied, urban planners and social scientists from the 1950s to the 1980s.13
Attempts to validate these two concepts, particularly optimal city size, onan international basis through statistical analysis were on the whole futile,however, and the ideas subsequently have been widely discredited for ap-plication in urban research (Findley 1993). In consequence, there has beenno serious investigation in recent years of whether or not population forcesare associated with, or exert, unfavorable effects on living conditions incities of developing regions.
Since the 1980s, there has been a remarkable shift of research atten-tion from the demography of cities to the polity of cities, with particularfocus on issues of urban management and, in the 1990s, urban governance(Stren 1995). With respect to management, a virtual consensus has emergedamong urban scholars that the costs and benefits of cities are not merely aproduct of population size (hence growth), but are primarily a consequenceof the commitment and capabilities of municipal governments to under-take and sustain policies that improve population welfare, particularlyinfrastructural maintenance, increased productivity of the labor force, andpoverty alleviation (Cheema 1992). The assumption that good manage-ment overcomes population constraints of cities would seem tenable basedon recent history. Clearly, many cities of the world, for instance those ofrecent origin in sub-Saharan Africa, appear too big relative to their mana-gerial capacities, and some of these “oversized” cities are quite small, forexample in the range of 100,000 to 200,000 inhabitants. Similarly, manymega-cities—Jakarta is cited most often—are seemingly well managed and,therefore, not too large. From this perspective, moving the benefit curveupward and the cost curve downward (each as a function of city size) couldbe defined as the task of city management. Further support for a focus onthe quality of urban management, rather than on population size andgrowth, comes from the fact that settlements of similar size and growthcan obviously have different attributes, derived from their functions andorigins, that for better or worse affect the welfare of their residents irre-spective of population size. In the case of small cities, for example, somelocales develop because of an administrative role as a center for provincialor state government; some serve growing agricultural production and pro-cessing in their microregion; some meet demands for goods and servicesfrom agricultural populations; some are important nodes on transporta-tion systems; some fill a specialized niche in the national or internationalmarket, centered on the production of a single good or service; and so on.
84 T H E P O V E R T Y O F C I T I E S I N D E V E L O P I N G R E G I O N S
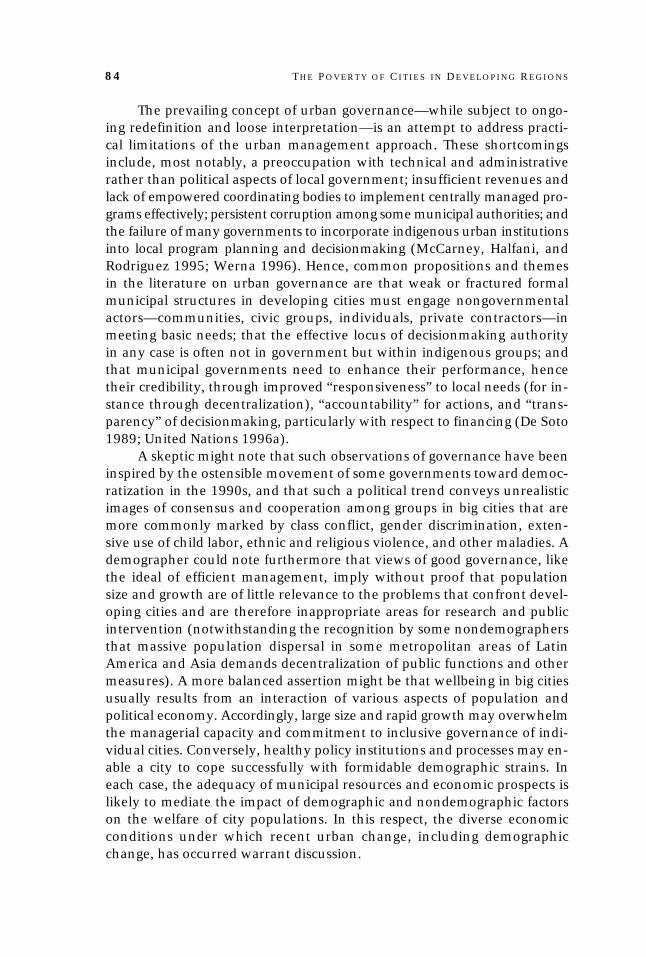
The prevailing concept of urban governance—while subject to ongo-ing redefinition and loose interpretation—is an attempt to address practi-cal limitations of the urban management approach. These shortcomingsinclude, most notably, a preoccupation with technical and administrativerather than political aspects of local government; insufficient revenues andlack of empowered coordinating bodies to implement centrally managed pro-grams effectively; persistent corruption among some municipal authorities; andthe failure of many governments to incorporate indigenous urban institutionsinto local program planning and decisionmaking (McCarney, Halfani, andRodriguez 1995; Werna 1996). Hence, common propositions and themesin the literature on urban governance are that weak or fractured formalmunicipal structures in developing cities must engage nongovernmentalactors—communities, civic groups, individuals, private contractors—inmeeting basic needs; that the effective locus of decisionmaking authorityin any case is often not in government but within indigenous groups; andthat municipal governments need to enhance their performance, hencetheir credibility, through improved “responsiveness” to local needs (for in-stance through decentralization), “accountability” for actions, and “trans-parency” of decisionmaking, particularly with respect to financing (De Soto1989; United Nations 1996a).
A skeptic might note that such observations of governance have beeninspired by the ostensible movement of some governments toward democ-ratization in the 1990s, and that such a political trend conveys unrealisticimages of consensus and cooperation among groups in big cities that aremore commonly marked by class conflict, gender discrimination, exten-sive use of child labor, ethnic and religious violence, and other maladies. Ademographer could note furthermore that views of good governance, likethe ideal of efficient management, imply without proof that populationsize and growth are of little relevance to the problems that confront devel-oping cities and are therefore inappropriate areas for research and publicintervention (notwithstanding the recognition by some nondemographersthat massive population dispersal in some metropolitan areas of LatinAmerica and Asia demands decentralization of public functions and othermeasures). A more balanced assertion might be that wellbeing in big citiesusually results from an interaction of various aspects of population andpolitical economy. Accordingly, large size and rapid growth may overwhelmthe managerial capacity and commitment to inclusive governance of indi-vidual cities. Conversely, healthy policy institutions and processes may en-able a city to cope successfully with formidable demographic strains. Ineach case, the adequacy of municipal resources and economic prospects islikely to mediate the impact of demographic and nondemographic factorson the welfare of city populations. In this respect, the diverse economicconditions under which recent urban change, including demographicchange, has occurred warrant discussion.
M A R T I N B R O C K E R H O F F / E L L E N B R E N N A N 85
Regional distinctions of urban change in aneconomic context
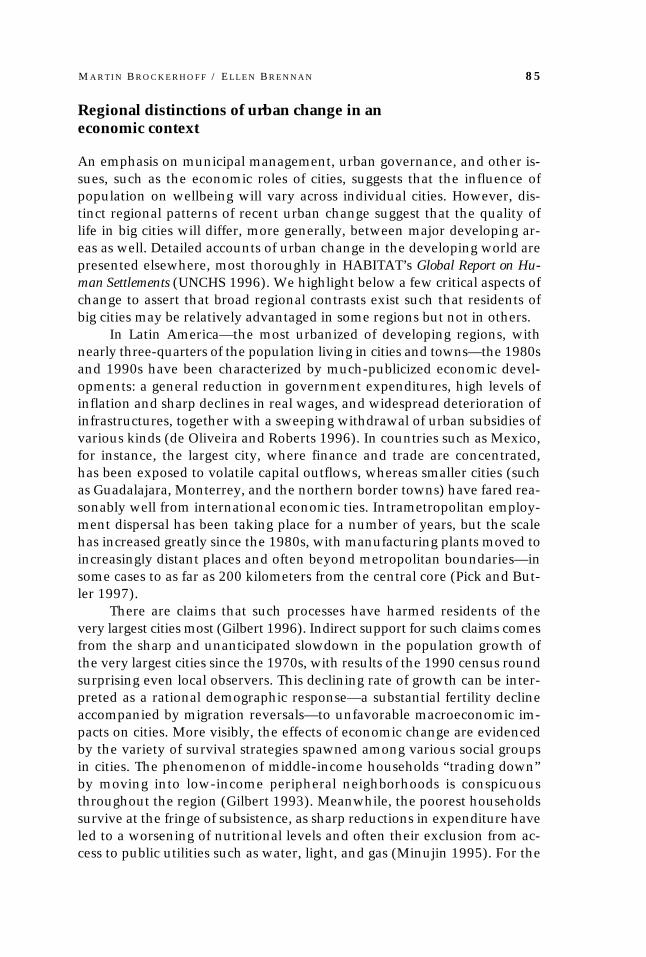
An emphasis on municipal management, urban governance, and other is-sues, such as the economic roles of cities, suggests that the influence ofpopulation on wellbeing will vary across individual cities. However, dis-tinct regional patterns of recent urban change suggest that the quality oflife in big cities will differ, more generally, between major developing ar-eas as well. Detailed accounts of urban change in the developing world arepresented elsewhere, most thoroughly in HABITAT’s Global Report on Hu-man Settlements (UNCHS 1996). We highlight below a few critical aspects ofchange to assert that broad regional contrasts exist such that residents ofbig cities may be relatively advantaged in some regions but not in others.
In Latin America—the most urbanized of developing regions, withnearly three-quarters of the population living in cities and towns—the 1980sand 1990s have been characterized by much-publicized economic devel-opments: a general reduction in government expenditures, high levels ofinflation and sharp declines in real wages, and widespread deterioration ofinfrastructures, together with a sweeping withdrawal of urban subsidies ofvarious kinds (de Oliveira and Roberts 1996). In countries such as Mexico,for instance, the largest city, where finance and trade are concentrated,has been exposed to volatile capital outflows, whereas smaller cities (suchas Guadalajara, Monterrey, and the northern border towns) have fared rea-sonably well from international economic ties. Intrametropolitan employ-ment dispersal has been taking place for a number of years, but the scalehas increased greatly since the 1980s, with manufacturing plants moved toincreasingly distant places and often beyond metropolitan boundaries—insome cases to as far as 200 kilometers from the central core (Pick and But-ler 1997).
There are claims that such processes have harmed residents of thevery largest cities most (Gilbert 1996). Indirect support for such claims comesfrom the sharp and unanticipated slowdown in the population growth ofthe very largest cities since the 1970s, with results of the 1990 census roundsurprising even local observers. This declining rate of growth can be inter-preted as a rational demographic response—a substantial fertility declineaccompanied by migration reversals—to unfavorable macroeconomic im-pacts on cities. More visibly, the effects of economic change are evidencedby the variety of survival strategies spawned among various social groupsin cities. The phenomenon of middle-income households “trading down”by moving into low-income peripheral neighborhoods is conspicuousthroughout the region (Gilbert 1993). Meanwhile, the poorest householdssurvive at the fringe of subsistence, as sharp reductions in expenditure haveled to a worsening of nutritional levels and often their exclusion from ac-cess to public utilities such as water, light, and gas (Minujin 1995). For the
86 T H E P O V E R T Y O F C I T I E S I N D E V E L O P I N G R E G I O N S
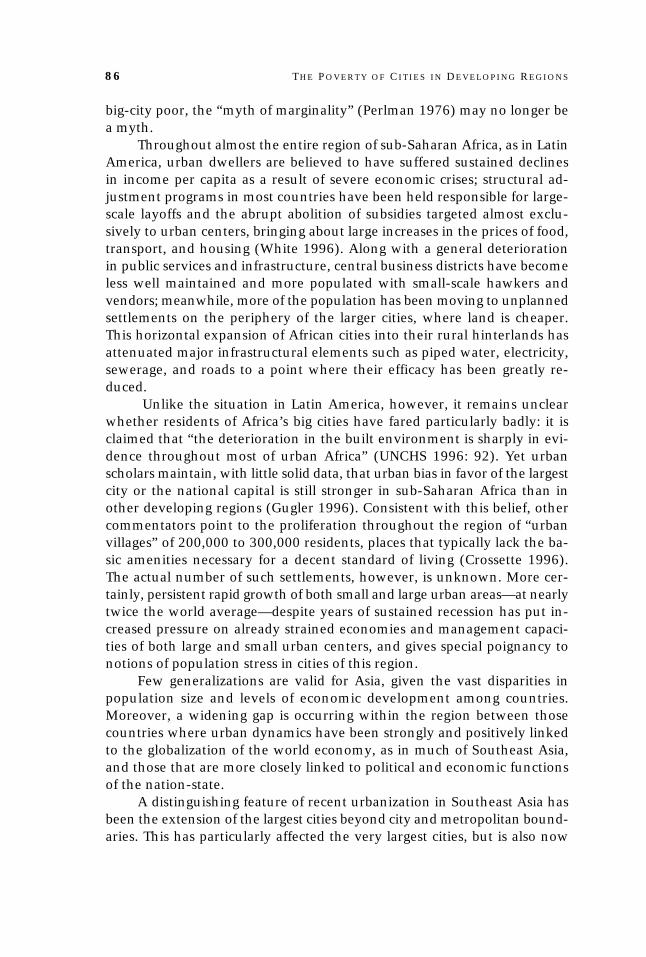
big-city poor, the “myth of marginality” (Perlman 1976) may no longer bea myth.
Throughout almost the entire region of sub-Saharan Africa, as in LatinAmerica, urban dwellers are believed to have suffered sustained declinesin income per capita as a result of severe economic crises; structural ad-justment programs in most countries have been held responsible for large-scale layoffs and the abrupt abolition of subsidies targeted almost exclu-sively to urban centers, bringing about large increases in the prices of food,transport, and housing (White 1996). Along with a general deteriorationin public services and infrastructure, central business districts have becomeless well maintained and more populated with small-scale hawkers andvendors; meanwhile, more of the population has been moving to unplannedsettlements on the periphery of the larger cities, where land is cheaper.This horizontal expansion of African cities into their rural hinterlands hasattenuated major infrastructural elements such as piped water, electricity,sewerage, and roads to a point where their efficacy has been greatly re-duced.
Unlike the situation in Latin America, however, it remains unclearwhether residents of Africa’s big cities have fared particularly badly: it isclaimed that “the deterioration in the built environment is sharply in evi-dence throughout most of urban Africa” (UNCHS 1996: 92). Yet urbanscholars maintain, with little solid data, that urban bias in favor of the largestcity or the national capital is still stronger in sub-Saharan Africa than inother developing regions (Gugler 1996). Consistent with this belief, othercommentators point to the proliferation throughout the region of “urbanvillages” of 200,000 to 300,000 residents, places that typically lack the ba-sic amenities necessary for a decent standard of living (Crossette 1996).The actual number of such settlements, however, is unknown. More cer-tainly, persistent rapid growth of both small and large urban areas—at nearlytwice the world average—despite years of sustained recession has put in-creased pressure on already strained economies and management capaci-ties of both large and small urban centers, and gives special poignancy tonotions of population stress in cities of this region.
Few generalizations are valid for Asia, given the vast disparities inpopulation size and levels of economic development among countries.Moreover, a widening gap is occurring within the region between thosecountries where urban dynamics have been strongly and positively linkedto the globalization of the world economy, as in much of Southeast Asia,and those that are more closely linked to political and economic functionsof the nation-state.
A distinguishing feature of recent urbanization in Southeast Asia hasbeen the extension of the largest cities beyond city and metropolitan bound-aries. This has particularly affected the very largest cities, but is also now
M A R T I N B R O C K E R H O F F / E L L E N B R E N N A N 87
occurring in other cities, such as Bandung in Indonesia, Cebu City in thePhilippines, and Chiang Mai in Thailand (McGee and Robinson 1995).Metropolitan regional growth has sprawled along major expressways andrailroad lines radiating out from urban cores, putting down new towns,industrial estates, housing projects, and other urban forms in areas hith-erto agricultural and rural. As a result, one might hypothesize that dispari-ties in living conditions as existed in the past between residents of corecities and smaller places have declined over time as city economies haveprospered. Such convergence would be reinforced by traditional patternsof circulation or seasonal migration in many countries of the region, inso-far as temporary migration serves to redistribute wealth and income amonglocales.
The largest cities of the Indian subcontinent have displayed a differ-ent pattern, more similar to that of sub-Saharan Africa, with urban growthbeing fueled less by economic dynamism than by rural poverty and con-tinuing high fertility. Many of the largest cities on the subcontinent havefairly stagnant economies, yet, as suggested in Table 2, they have absorbedhuge population increments in recent decades; clearly, the challenge fac-ing a country such as India (and China) is one of magnitude—no statesystem as large as India or China has yet undergone rapid urbanization. InIndia, however, a major surprise in the 1991 census was the significantdecline recorded in the rate of urban population growth relative to theprevious decade—a decline that was apparent at all levels of the urbanstructure. Mohan (1996) has speculated that the lack of jobs, compoundedby a worsening quality of life in urban areas, may have discouraged would-be migrants from searching for better livelihoods in cities. Such a circum-stance would imply actual or perceived superior welfare in smaller areas.Yet most of the thousands of small and medium-sized cities in South Asia,encompassing most of the urban population, do not have dynamic econo-mies. Many became urban centers simply because they incorporated mi-nor administrative functions or served as market towns or centers of localor regional road networks.
Generalization of urban change, and of potential changing fortunesof settlement types, is most problematic in discussion of North Africa andthe Near East, given the diversity of state economies in the region that arevariously dependent on exports or imports of oil and labor, on tourism,industry, foreign assistance, and so forth. One clear consistency is that manyof the largest cities in the region grew between 1970 and 1990 at highrates equaled only in cities of sub-Saharan Africa (United Nations 1995a:Table A.14). Growth rates of some cities would have been higher in theabsence of emigration to less densely populated neighboring countries foremployment. Although timely data are unavailable, the largest cities of somecountries—most notably, Amman in Jordan and Sanaa in Yemen—are re-
88 T H E P O V E R T Y O F C I T I E S I N D E V E L O P I N G R E G I O N S
ported to have been overwhelmed by massive inmigration during recentperiods of political turmoil (for instance, during the Gulf War and the civilwar in Yemen), to the point that severe housing, job, and service crisesemerged (Europa Publications Ltd. 1995). While the World Bank (1995)documents a steep regional decline in gross national product per capitasince 1980, and remittances from emigrant labor generally declined in the1980s (Keely and Tran 1989), the relative impact of these trends on vari-ous settlements within countries of the region remains unexplored.
A central concern of the analyses that follow is how these regionalpatterns of urban change—under very different conditions—correspond totrends and current living conditions in big cities and smaller areas.
Data and methods
Our analyses address two questions. First, are big-city residents advantaged,on average, as compared with other urbanites and villagers in terms ofwellbeing? Second, are observed advantages, or deprivations, related to thepace at which big cities have grown in recent years? To assess differencesin living conditions across different settlement sizes, Demographic andHealth Survey (DHS) data from 43 developing countries are analyzed. Ap-pendix A lists the large cities examined, and Appendix B indicates the coun-tries and survey years (ranging from 1987 to 1995). Because individualanalysis of 43 countries would inhibit generalized testing and comparison,and because presentation of results for so many countries is unwieldy, datahave been pooled according to four geographic regions: Latin America andthe Caribbean, sub-Saharan Africa, North Africa and the Near East, andAsia.14 The number, size, and geographical spread of these countries allowfor firm generalization for the first three regions, but more tentative infer-ence for low-income countries of Asia because China, India, and areas ofthe former Soviet Union are not included in our data set. Because we usedata aggregated by region, we caution that findings from our analyses donot necessarily apply to particular cities of the individual countries.
All Demographic and Health Surveys stratify sampling to obtain na-tionally representative populations of households and reproductive-agewomen in urban and rural areas.15 In countries where geographical areaswere over- or undersampled, individual record weights have been applied,prior to pooling the data, to obtain valid representation of the urban stra-tum at the national level. Application of weights to the stratified data pro-duces a total sample that is representative as well for any subset selectedfrom the sample for analysis.16 For the first set of analyses (examining liv-ing conditions across settlements), we select residents according to size cat-egories identified by the DHS: one million or more persons (big cities), 50thousand to one million inhabitants (small cities), towns of less than 50
M A R T I N B R O C K E R H O F F / E L L E N B R E N N A N 89
thousand population, and rural areas (villages).17 National capitals, whichthe DHS routinely groups with big cities, are classified in this analysis ac-cording to their population size at the time of the survey, as based on (orinterpolated from) United Nations (1995a).
Conceptual and measurement problems have long confounded at-tempts to compare levels of poverty, inequality, and other indicators ofwellbeing and deprivation across low-income settings (World Bank 1990).Whereas lack of accurate and comparable data on income and consump-tion in most countries has been a well-recognized concern—leading to ad-vancement of the Human Development Index (UNDP 1996) and similarcomposite social measures—recent literature questions the possibility of anysuch comparison on grounds that human welfare is a matter of individualpsychological perception (Wratten 1995).
International comparison of human wellbeing may be intractable, butwe maintain with Sen (1993: 40) that “mortality data can be used to . . .identify vital aspects of economic deprivation in particular nations and inspecific groups within nations.”18 Differences in infant mortality among chil-dren born in the five years preceding the DHS in each country are there-fore applied in this study to gauge general disparities in living conditions atthis high level of population aggregation, that is, between settlement typesin global regions.19 Information on early mortality is supplemented by dis-aggregated data on a broad range of social indicators—school enrollment,dwelling facilities, nutritional status, diarrheal episodes, use of preventivehealth care—as manifest among young children. A description of all vari-ables appears in Appendix C. Use of children’s status to indicate welfare atthe areal level is suggested by practical considerations—we lack informa-tion on most of these basic characteristics for the adult population—but isalso guided by reason. Because young children are dependent and essen-tially involuntary social actors, they are exposed not only to their own in-herent disadvantages but also to those of their parents, households, andlocales. Hence examination of children captures deprivation within areasat large.20 Moreover, children represent at least a large minority of the popu-lation in all of the countries examined.
The second set of analyses investigates whether relative conditions ofbig-city residents are related to the pace at which their cities have grown.For these analyses, we augment the DHS data with United Nations esti-mates of average annual population growth rates in the period five to 20years preceding the surveys in cities of 750,000–1,500,000 and more than1,500,000 residents (referred to as medium-sized and giant cities).21 Werestrict analysis to these areas because relatively reliable estimates of growthrates are available only for national capitals and for agglomerations of750,000 or more inhabitants in 1990 (United Nations 1995a). City growthrates in the five years preceding the surveys are not considered because of
90 T H E P O V E R T Y O F C I T I E S I N D E V E L O P I N G R E G I O N S
potential simultaneity bias arising from direct and indirect relationships be-tween infant mortality and population growth. Three average rates of an-nual population growth are examined: less than 3 percent (slow), 3 to 5percent (moderate), and greater than 5 percent (rapid). A full descriptionof the statistical procedure involved in this analysis is presented in Appen-dix D. Because our sample of countries in North Africa and the Near East iscomparatively small, includes relatively few cities of more than 750,000inhabitants, and shows modest variation in the growth rates of these cities,countries of this region have been grouped with countries of Asia to testhypotheses pertaining to city growth rates; the region is referred to as NorthAfrica/Asia.
Are big-city residents disadvantaged?
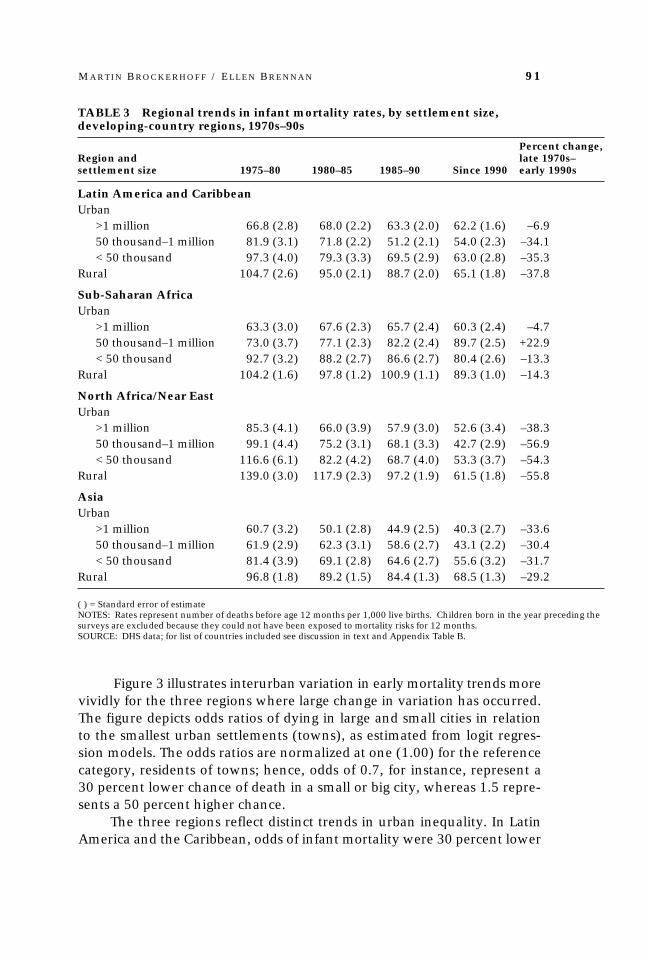
Table 3 presents trends in infant mortality from the late 1970s through theearly 1990s, for urban size categories and for rural areas. Although fewerchildren are represented in 1985–90 and the early 1990s than in earlierperiods because survey dates preceded 1990 in some countries, all ratesare based on urban settlement samples of more than 6,000 and are highlyreliable (that is, have small associated error terms).22
Aggregate infant mortality levels since the late 1970s have barely changedin big cities of Latin America and the Caribbean, with a reduction of aboutfive deaths per 1,000 births (or 7 percent). By comparison, small cities,towns, and rural areas have experienced large declines in the range of 34to 38 percent. Similarly, in sub-Saharan Africa, the early mortality levelsof big cities have remained virtually constant, whereas levels have declinedmodestly in towns and villages. More significant, the infant mortality rateof small cities has risen from 73 per 1,000 to 90 per 1,000 over time. Animplication of such change in urban Africa, as reflected by an inverted-Upattern in rates across urban settlement sizes, and of decreasing discrepan-cies in urban Latin America, as exhibited by an opposite pattern, is thatconventional claims of sharp urban–rural contrasts in living conditions ap-parently are no longer valid for these regions. Indeed, mortality rates nowappear identical in small cities and villages of sub-Saharan Africa and inbig cities and small areas of Latin America. In the North Africa/Near Eastregion, another striking trend is observed: Early mortality has declined sub-stantially in the largest cities over time, but again, much more slowly thanin smaller places. The long-held advantage of urban areas, particularly ofbig cities, in living conditions—found as recently as the 1980s—no longerapplies to much extent in this region either, at least as inferred from thisindicator of population wellbeing. Only in Asia, where our sample of coun-tries is less representative, have mortality differentials between settlementtypes remained stable over time.
M A R T I N B R O C K E R H O F F / E L L E N B R E N N A N 91
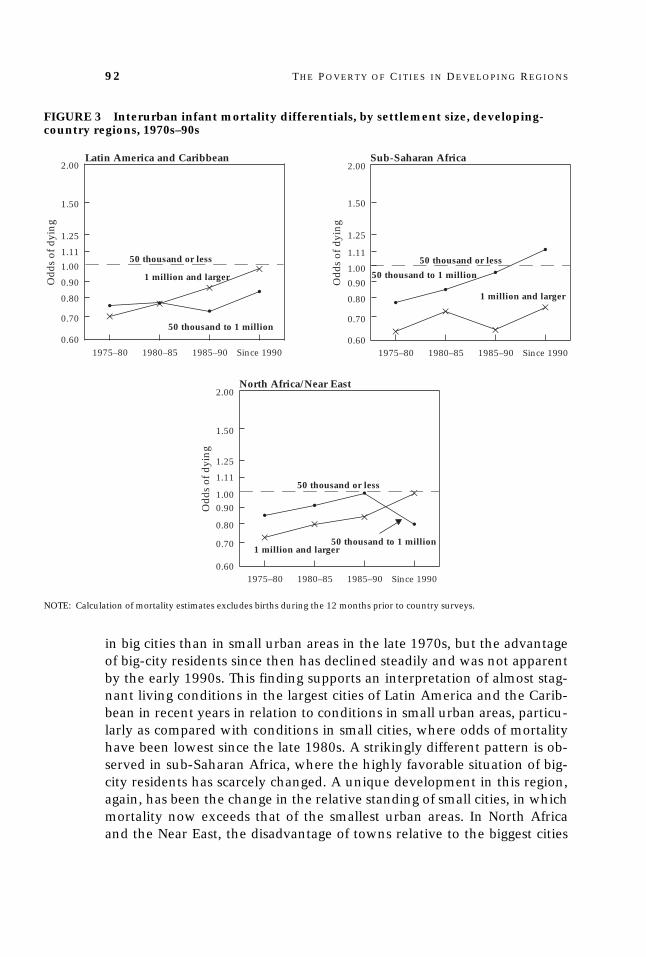
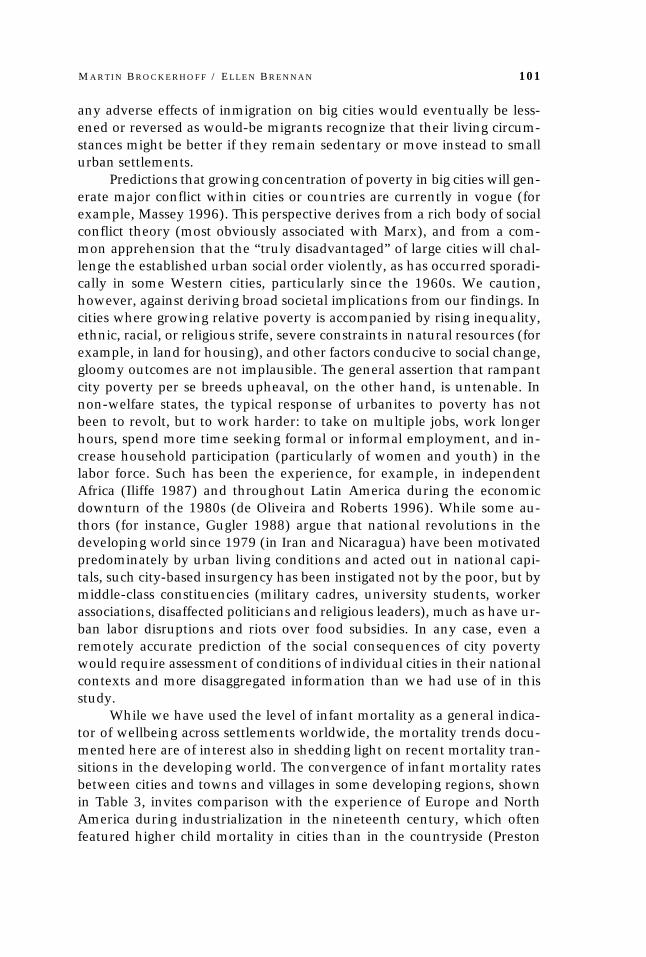
Figure 3 illustrates interurban variation in early mortality trends morevividly for the three regions where large change in variation has occurred.The figure depicts odds ratios of dying in large and small cities in relationto the smallest urban settlements (towns), as estimated from logit regres-sion models. The odds ratios are normalized at one (1.00) for the referencecategory, residents of towns; hence, odds of 0.7, for instance, represent a30 percent lower chance of death in a small or big city, whereas 1.5 repre-sents a 50 percent higher chance.
The three regions reflect distinct trends in urban inequality. In LatinAmerica and the Caribbean, odds of infant mortality were 30 percent lower
TABLE 3 Regional trends in infant mortality rates, by settlement size,developing-country regions, 1970s–90s
Percent change,Region and late 1970s–settlement size 1975–80 1980–85 1985–90 Since 1990 early 1990s
Latin America and CaribbeanUrban
>1 million 66.8 (2.8) 68.0 (2.2) 63.3 (2.0) 62.2 (1.6) –6.950 thousand–1 million 81.9 (3.1) 71.8 (2.2) 51.2 (2.1) 54.0 (2.3) –34.1< 50 thousand 97.3 (4.0) 79.3 (3.3) 69.5 (2.9) 63.0 (2.8) –35.3
Rural 104.7 (2.6) 95.0 (2.1) 88.7 (2.0) 65.1 (1.8) –37.8
Sub-Saharan AfricaUrban
>1 million 63.3 (3.0) 67.6 (2.3) 65.7 (2.4) 60.3 (2.4) –4.750 thousand–1 million 73.0 (3.7) 77.1 (2.3) 82.2 (2.4) 89.7 (2.5) +22.9< 50 thousand 92.7 (3.2) 88.2 (2.7) 86.6 (2.7) 80.4 (2.6) –13.3
Rural 104.2 (1.6) 97.8 (1.2) 100.9 (1.1) 89.3 (1.0) –14.3
North Africa/Near EastUrban
>1 million 85.3 (4.1) 66.0 (3.9) 57.9 (3.0) 52.6 (3.4) –38.350 thousand–1 million 99.1 (4.4) 75.2 (3.1) 68.1 (3.3) 42.7 (2.9) –56.9< 50 thousand 116.6 (6.1) 82.2 (4.2) 68.7 (4.0) 53.3 (3.7) –54.3
Rural 139.0 (3.0) 117.9 (2.3) 97.2 (1.9) 61.5 (1.8) –55.8
AsiaUrban
>1 million 60.7 (3.2) 50.1 (2.8) 44.9 (2.5) 40.3 (2.7) –33.650 thousand–1 million 61.9 (2.9) 62.3 (3.1) 58.6 (2.7) 43.1 (2.2) –30.4< 50 thousand 81.4 (3.9) 69.1 (2.8) 64.6 (2.7) 55.6 (3.2) –31.7
Rural 96.8 (1.8) 89.2 (1.5) 84.4 (1.3) 68.5 (1.3) –29.2
( ) = Standard error of estimateNOTES: Rates represent number of deaths before age 12 months per 1,000 live births. Children born in the year preceding thesurveys are excluded because they could not have been exposed to mortality risks for 12 months.SOURCE: DHS data; for list of countries included see discussion in text and Appendix Table B.
92 T H E P O V E R T Y O F C I T I E S I N D E V E L O P I N G R E G I O N S
in big cities than in small urban areas in the late 1970s, but the advantageof big-city residents since then has declined steadily and was not apparentby the early 1990s. This finding supports an interpretation of almost stag-nant living conditions in the largest cities of Latin America and the Carib-bean in recent years in relation to conditions in small urban areas, particu-larly as compared with conditions in small cities, where odds of mortalityhave been lowest since the late 1980s. A strikingly different pattern is ob-served in sub-Saharan Africa, where the highly favorable situation of big-city residents has scarcely changed. A unique development in this region,again, has been the change in the relative standing of small cities, in whichmortality now exceeds that of the smallest urban areas. In North Africaand the Near East, the disadvantage of towns relative to the biggest cities
II
I
I
XX
X
X
1975–80 1980–85 1985–90 Since 1990
0.60
1.00
2.00
Odds
of
dyi
ng
XX
X
X
I
I
I
I
1975–80 1980–85 1985–90 Since 1990
0.60
1.00
2.00
Odds
of
dyi
ng
II
I
I
X XX
X
1975–80 1980–85 1985–90 Since 19900.60
1.00
2.00
Odds
of
dyi
ng
Latin America and Caribbean Sub-Saharan Africa
North Africa/Near East
1 million and larger
1 million and larger
1 million and larger
50 thousand to 1 million
50 thousand to 1 million
50 thousand to 1 million
50 thousand or less 50 thousand or less
50 thousand or less
2.00
1.50
1.25
1.11
1.00
0.90
0.80
0.70
0.60
2.00
1.50
1.25
1.11
1.00
0.90
0.80
0.70
0.60
2.00
1.50
1.25
1.11
1.00
0.90
0.80
0.70
0.60
FIGURE 3 Interurban infant mortality differentials, by settlement size, developing-country regions, 1970s–90s
NOTE: Calculation of mortality estimates excludes births during the 12 months prior to country surveys.
M A R T I N B R O C K E R H O F F / E L L E N B R E N N A N 93
has decreased substantially since the late 1970s, while the relative stand-ing of small cities has become very favorable since 1990.23
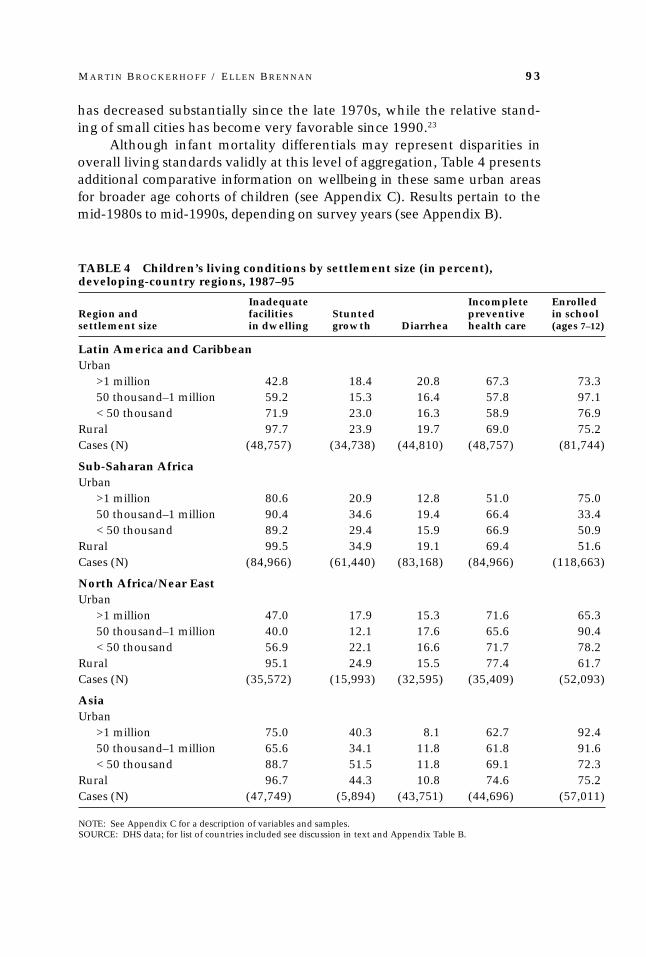
Although infant mortality differentials may represent disparities inoverall living standards validly at this level of aggregation, Table 4 presentsadditional comparative information on wellbeing in these same urban areasfor broader age cohorts of children (see Appendix C). Results pertain to themid-1980s to mid-1990s, depending on survey years (see Appendix B).
TABLE 4 Children’s living conditions by settlement size (in percent),developing-country regions, 1987–95
Inadequate Incomplete EnrolledRegion and facilities Stunted preventive in schoolsettlement size in dwelling growth Diarrhea health care (ages 7–12)
Latin America and CaribbeanUrban
>1 million 42.8 18.4 20.8 67.3 73.350 thousand–1 million 59.2 15.3 16.4 57.8 97.1< 50 thousand 71.9 23.0 16.3 58.9 76.9
Rural 97.7 23.9 19.7 69.0 75.2Cases (N) (48,757) (34,738) (44,810) (48,757) (81,744)
Sub-Saharan AfricaUrban
>1 million 80.6 20.9 12.8 51.0 75.050 thousand–1 million 90.4 34.6 19.4 66.4 33.4< 50 thousand 89.2 29.4 15.9 66.9 50.9
Rural 99.5 34.9 19.1 69.4 51.6Cases (N) (84,966) (61,440) (83,168) (84,966) (118,663)
North Africa/Near EastUrban
>1 million 47.0 17.9 15.3 71.6 65.350 thousand–1 million 40.0 12.1 17.6 65.6 90.4< 50 thousand 56.9 22.1 16.6 71.7 78.2
Rural 95.1 24.9 15.5 77.4 61.7Cases (N) (35,572) (15,993) (32,595) (35,409) (52,093)
AsiaUrban
>1 million 75.0 40.3 8.1 62.7 92.450 thousand–1 million 65.6 34.1 11.8 61.8 91.6< 50 thousand 88.7 51.5 11.8 69.1 72.3
Rural 96.7 44.3 10.8 74.6 75.2Cases (N) (47,749) (5,894) (43,751) (44,696) (57,011)
NOTE: See Appendix C for a description of variables and samples.SOURCE: DHS data; for list of countries included see discussion in text and Appendix Table B.
94 T H E P O V E R T Y O F C I T I E S I N D E V E L O P I N G R E G I O N S
In sum, results in Table 4 are consistent with infant mortality trendsshown in Table 3. In countries of Latin America and the Caribbean, youngchildren in big cities are less likely than children in small cities to havereceived extensive preventive health care directly or through their moth-ers and much less likely to be enrolled in school; they are more likely tohave stunted growth, perhaps reflecting chronic malnutrition, and to haveexperienced diarrhea (which may be an outcome of several other diseasesas well). Most striking is that levels of early schooling, preventive healthcare, and morbidity appear equally unfavorable in the largest cities as insmall villages of the region. In sub-Saharan Africa, unfavorable conditionsare particular to small cities as compared with both big cities and towns.Nutrition and morbidity appear worse in urban settlements of 50 thou-sand to one million than in towns, while two-thirds of children ages 7–12in small cities are not enrolled in school, as compared with half of childrenin smaller settlements. Indeed, these indicators imply that quality-of-life issimilar in small cities of less than one million residents—which in Africainclude the largest city of some of the countries analyzed—to that in smallvillages, which in many countries are typically scattered remotely in thecountryside. As in Latin America, children in the largest cities of NorthAfrica and the Near East are far less likely to be enrolled in school—with35 percent not enrolled—and more commonly experience incomplete pre-ventive health care and poor long-term nutrition than children in smallcities. Meanwhile, in Asian countries, children in large cities, which in-clude several mega-cities, show no remarkable advantage as compared withchildren in small cities, and conditions in rural areas, with the exception ofhousing quality, are not exceptionally disadvantageous.
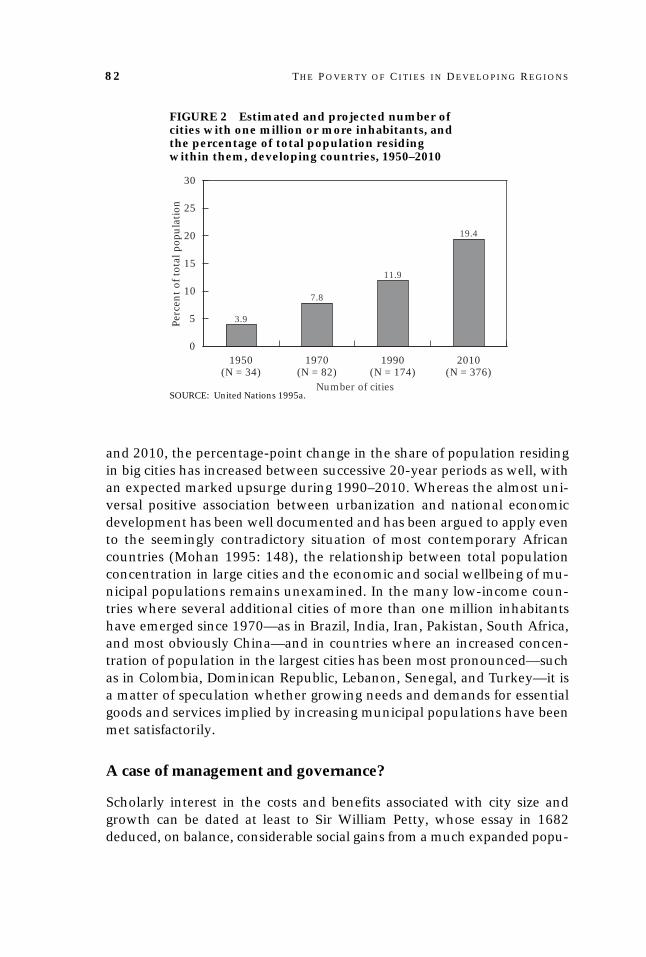
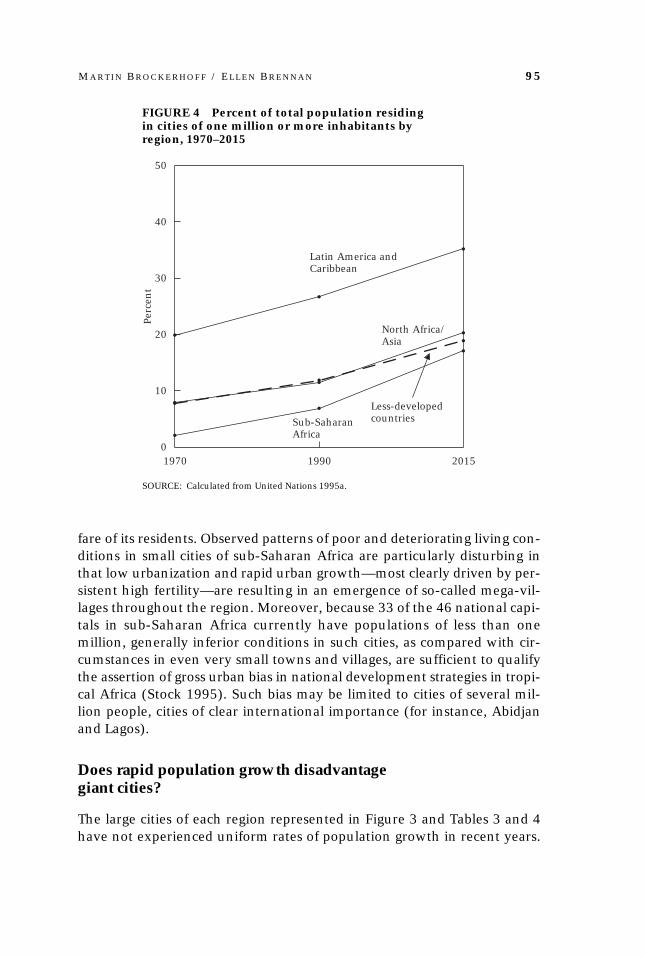
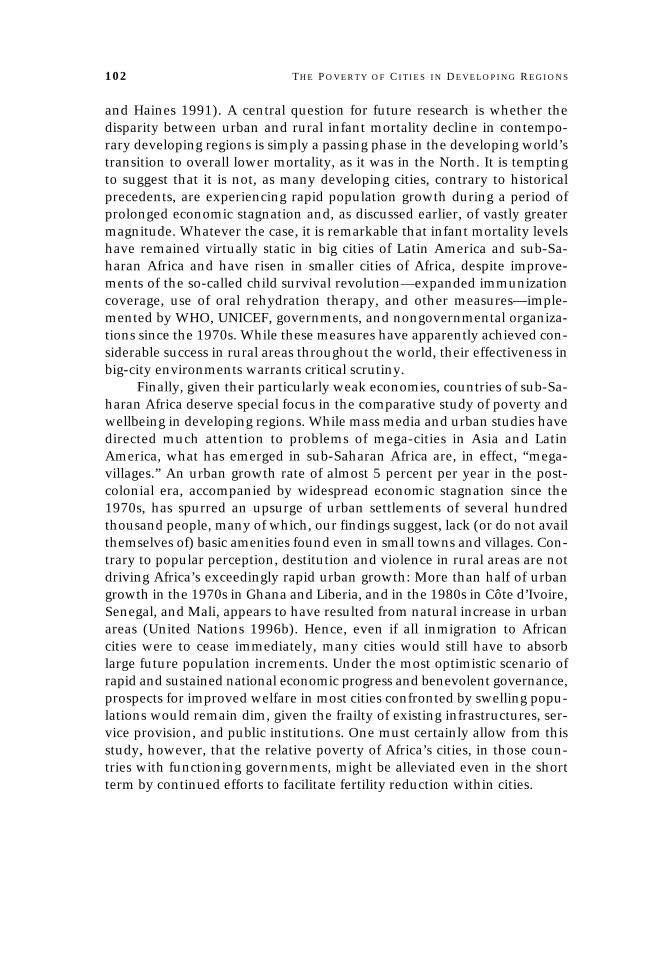
Insofar as generalization from our sample of countries is possible, mor-tality, health, and social indicators clearly uphold the thesis of decliningadvantages of big-city residents, as compared with other urbanites and insome cases even rural residents, in countries of Latin America and the Car-ibbean and North Africa and the Near East. In sub-Saharan African coun-tries, small-city residents have remarkably poor living conditions, while inAsian countries no substantial big-city advantage is detectable. Moreover,mortality trends indicate that living conditions since the late 1970s havenot much improved for big-city residents in Latin America, and have per-haps worsened on the whole for city residents in sub-Saharan Africa. Thesefindings are arguably of greatest relevance to the Latin America and Carib-bean region. Figure 4 illustrates that total population concentration in “mil-lion-plus” cities is roughly twice as high in this region as in other develop-ing regions, at almost 30 percent in 1995, and is projected to increase steadilyin the future and remain much higher than in other developing regions. Aconservative interpretation of results for Asian countries is that no linearrelationship exists between the size of an urban settlement and the wel-
M A R T I N B R O C K E R H O F F / E L L E N B R E N N A N 95
fare of its residents. Observed patterns of poor and deteriorating living con-ditions in small cities of sub-Saharan Africa are particularly disturbing inthat low urbanization and rapid urban growth—most clearly driven by per-sistent high fertility—are resulting in an emergence of so-called mega-vil-lages throughout the region. Moreover, because 33 of the 46 national capi-tals in sub-Saharan Africa currently have populations of less than onemillion, generally inferior conditions in such cities, as compared with cir-cumstances in even very small towns and villages, are sufficient to qualifythe assertion of gross urban bias in national development strategies in tropi-cal Africa (Stock 1995). Such bias may be limited to cities of several mil-lion people, cities of clear international importance (for instance, Abidjanand Lagos).
Does rapid population growth disadvantagegiant cities?
The large cities of each region represented in Figure 3 and Tables 3 and 4have not experienced uniform rates of population growth in recent years.
FIGURE 4 Percent of total population residingin cities of one million or more inhabitants byregion, 1970–2015
X
X
X
X
X
X
X
X
X
X
X
X
1970 1990 20150
10
20
30
40
50
Per
cen
t
Latin America andCaribbean
Sub-SaharanAfrica
North Africa/Asia
Less-developedcountries
SOURCE: Calculated from United Nations 1995a.
96 T H E P O V E R T Y O F C I T I E S I N D E V E L O P I N G R E G I O N S
For example, during 1970–90 population grew approximately twice as fastin Santo Domingo as in Medellin, in Dar es Salaam as in Accra, in Istanbulas in Cairo, and in Dhaka as in Manila. Living conditions in these cities,and changed conditions over time, may be less a consequence of large sizeper se than of how rapidly cities have grown. Variation in the speed ofpopulation growth may, in fact, partly underlie the apparent successful de-velopment patterns of some big cities but not of others.
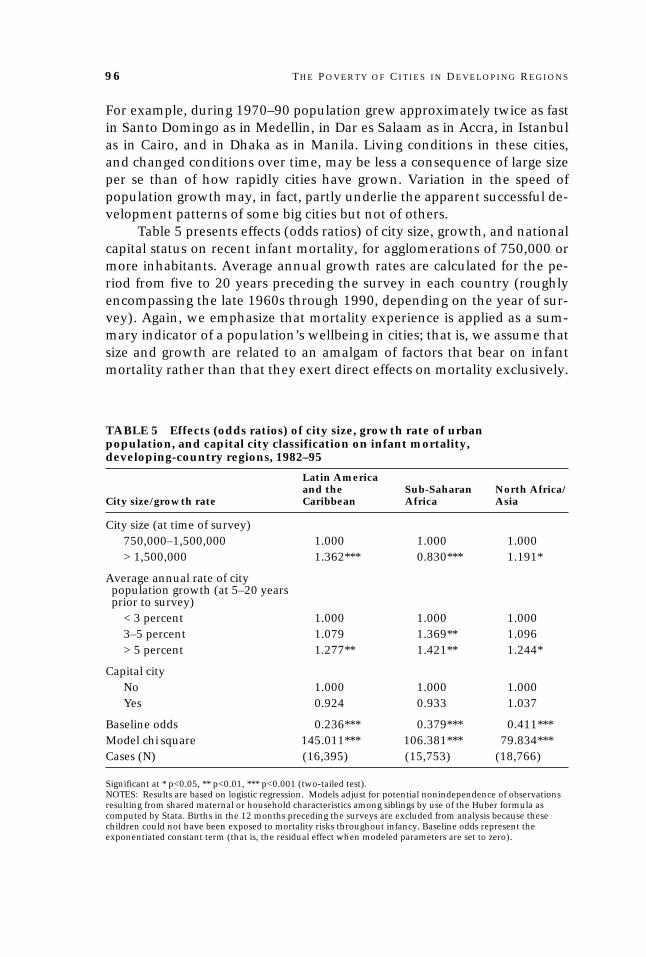
Table 5 presents effects (odds ratios) of city size, growth, and nationalcapital status on recent infant mortality, for agglomerations of 750,000 ormore inhabitants. Average annual growth rates are calculated for the pe-riod from five to 20 years preceding the survey in each country (roughlyencompassing the late 1960s through 1990, depending on the year of sur-vey). Again, we emphasize that mortality experience is applied as a sum-mary indicator of a population’s wellbeing in cities; that is, we assume thatsize and growth are related to an amalgam of factors that bear on infantmortality rather than that they exert direct effects on mortality exclusively.
TABLE 5 Effects (odds ratios) of city size, growth rate of urbanpopulation, and capital city classification on infant mortality,developing-country regions, 1982–95
Latin Americaand the Sub-Saharan North Africa/
City size/growth rate Caribbean Africa Asia
City size (at time of survey)750,000–1,500,000 1.000 1.000 1.000> 1,500,000 1.362*** 0.830*** 1.191*
Average annual rate of citypopulation growth (at 5–20 yearsprior to survey)
< 3 percent 1.000 1.000 1.0003–5 percent 1.079 1.369** 1.096> 5 percent 1.277** 1.421** 1.244*
Capital cityNo 1.000 1.000 1.000Yes 0.924 0.933 1.037
Baseline odds 0.236*** 0.379*** 0.411***Model chi square 145.011*** 106.381*** 79.834***Cases (N) (16,395) (15,753) (18,766)
Significant at * p<0.05, ** p<0.01, *** p<0.001 (two-tailed test).NOTES: Results are based on logistic regression. Models adjust for potential nonindependence of observationsresulting from shared maternal or household characteristics among siblings by use of the Huber formula ascomputed by Stata. Births in the 12 months preceding the surveys are excluded from analysis because thesechildren could not have been exposed to mortality risks throughout infancy. Baseline odds represent theexponentiated constant term (that is, the residual effect when modeled parameters are set to zero).
M A R T I N B R O C K E R H O F F / E L L E N B R E N N A N 97
Results shown in Table 5 suggest that the welfare of city residents indeveloping regions is strongly influenced by both the size and the recentpace of growth of the cities in which they live. Consistent with results ofthe preceding analyses, odds of infant mortality are greater in giant cities(with more than 1.5 million residents) than in medium-sized cities of LatinAmerica and the Caribbean and North Africa/Asia, by 36 percent and 19percent, respectively, whereas in comparative terms residents of giant cit-ies of sub-Saharan Africa experience mortality some 17 percent lower. Fromthis analysis of pooled regional data, it therefore may be appropriate toperceive an urban bias in favor of the very largest cities of tropical Africa ascompared with smaller cities with populations of 750,000–1,500,000. Long-term city growth rates in excess of 5 percent a year have unfavorable ef-fects, raising infant mortality odds by 24 percent in North Africa/Asia, 28percent in Latin America and the Caribbean, and 42 percent in tropicalAfrica. Moderate growth of 3 to 5 percent per annum has adverse resultsin sub-Saharan Africa of almost equal magnitude. Residence in a nationalcapital confers no benefits independent of city size and growth.
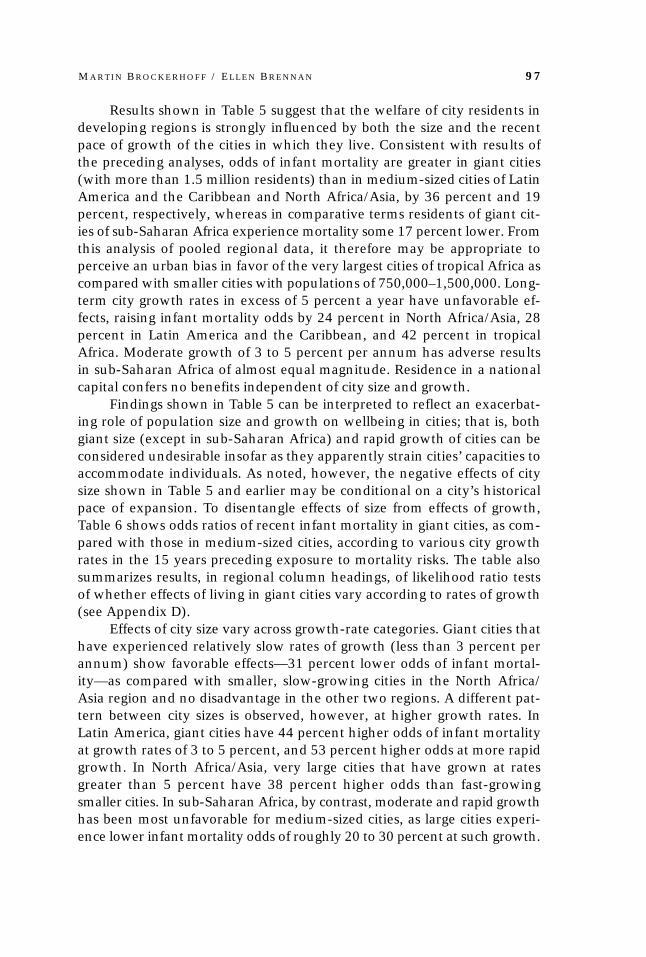
Findings shown in Table 5 can be interpreted to reflect an exacerbat-ing role of population size and growth on wellbeing in cities; that is, bothgiant size (except in sub-Saharan Africa) and rapid growth of cities can beconsidered undesirable insofar as they apparently strain cities’ capacities toaccommodate individuals. As noted, however, the negative effects of citysize shown in Table 5 and earlier may be conditional on a city’s historicalpace of expansion. To disentangle effects of size from effects of growth,Table 6 shows odds ratios of recent infant mortality in giant cities, as com-pared with those in medium-sized cities, according to various city growthrates in the 15 years preceding exposure to mortality risks. The table alsosummarizes results, in regional column headings, of likelihood ratio testsof whether effects of living in giant cities vary according to rates of growth(see Appendix D).
Effects of city size vary across growth-rate categories. Giant cities thathave experienced relatively slow rates of growth (less than 3 percent perannum) show favorable effects—31 percent lower odds of infant mortal-ity—as compared with smaller, slow-growing cities in the North Africa/Asia region and no disadvantage in the other two regions. A different pat-tern between city sizes is observed, however, at higher growth rates. InLatin America, giant cities have 44 percent higher odds of infant mortalityat growth rates of 3 to 5 percent, and 53 percent higher odds at more rapidgrowth. In North Africa/Asia, very large cities that have grown at ratesgreater than 5 percent have 38 percent higher odds than fast-growingsmaller cities. In sub-Saharan Africa, by contrast, moderate and rapid growthhas been most unfavorable for medium-sized cities, as large cities experi-ence lower infant mortality odds of roughly 20 to 30 percent at such growth.
98 T H E P O V E R T Y O F C I T I E S I N D E V E L O P I N G R E G I O N S
Again, this may reflect aforementioned patterns of possible economic andsocial-sector bias in favor of the very largest of Africa’s cities.
Expressed alternatively, examination of odds ratios within each re-gion suggests a strong negative impact of more rapid growth on living con-ditions in giant cities of Latin America and the Caribbean and North Af-rica/Asia, and on living conditions in medium-sized cities of sub-SaharanAfrica. Such effects are formally confirmed by highly significant (p<0.01)results of likelihood ratio tests. Thus, while patterns of disparities betweenlarge and smaller cities presented earlier are observed here as well (albeitfor different size categories), relative disadvantages associated with city sizeare found to depend on city growth rates. For example, the generally highlyunfavorable conditions of giant-city residents in Latin America, as com-pared with those of residents of medium-sized cities, are dependent on (andpresumably partly a result of) the rapid growth of many big cities, exclud-ing some mega-cities, from the 1960s into the 1980s. Insofar as growthrates of most giant and medium-sized cities in the developing countriesrepresented in this study are projected to decline in future (United Nations1995a), one might anticipate improved overall welfare of these city popu-lations as well. Less happily, an increasing number of large cities of ex-
TABLE 6 Effect (odds ratio) of city size on infant mortality for differenturban population growth rates, developing-country regions, 1982–95
Average Latin Americaannual growth and the Sub-Saharan North Africa/rate/city size Caribbeana Africaa Asiaa
< 3 percentCity size (at time of survey)
750,000–1,500,000 1.000 1.000 1.000> 1,500,000 0.889 1.058 0.693*
3–5 percentCity size (at time of survey)
750,000–1,500,000 1.000 1.000 1.000> 1,500,000 1.439** 0.823* 1.110
> 5 percentCity size (at time of survey)
750,000–1,500,000 1.000 1.000 1.000> 1,500,000 1.526* 0.729*** 1.379*
Cases (N) (16,395) (15,753) (18,766)
a Effect of city size varies over growth rate at p>chi2=0.01.Significant at * p<0.05, ** p<0.01, *** p<0.001 (two-tailed test).NOTES: See Appendix D for description of estimation procedure. Results are based on logistic regression.Models adjust for potential nonindependence of observations resulting from shared maternal or householdcharacteristics among siblings by use of the Huber formula as computed by Stata. Births in the 12 monthspreceding the surveys are excluded from analysis because these children could not have been exposed tomortality risks throughout infancy. Average annual growth rate is based on the period from five to 20 yearspreceding survey; it assumes exponential growth.
M A R T I N B R O C K E R H O F F / E L L E N B R E N N A N 99
panding size in developing regions, including cities approaching the 750,000–1,500,000 population range in sub-Saharan Africa, may counterweigh suchan optimistic scenario.
Discussion
In its World Development Report 1990, the World Bank claims that “urbanpoverty will become the most significant and politically explosive problemof the next century” (cited in Harris 1992: 201). Such broad statements,based largely on dramatic trends and projections of urban population changein developing countries, suggest a need to scrutinize current living condi-tions of urbanites in low-income countries. Along with complementary in-formation on children’s status, this study applies an objective criterion bywhich one can compare wellbeing and synonymous concepts across highlydiverse urban populations worldwide: level of infant mortality. Subject tothe validity of this indicator, the quality of our data, and the propriety ofour analytic methods, our findings generally support the contention thatthe highly favorable living conditions of big-city residents, as comparedwith persons residing in smaller localities, have narrowed considerably inseveral developing regions since the 1970s. While evidence does not sug-gest a deterioration in the welfare of big-city residents, levels of early mor-tality in countries of Latin America and the Caribbean, sub-Saharan Af-rica, and North Africa and the Near East underwent a much slower declinein cities of one million or more residents than in towns and villages. Mean-while, infant mortality has risen substantially in small and medium-sizedcities of sub-Saharan Africa, which include the capital city of most Africancountries. These trends in mortality correspond closely with a broad rangeof statistical measures of children’s wellbeing in the late 1980s and 1990s,which reveal scant differences between cities and rural areas in these re-gions as well as in Asian countries. These conclusions derive strength fromthe large body of comparable data on characteristics of urban populationsthat we have analyzed, representing 63 percent of the urban population ofthe developing world outside of China and India.
Results of this study do not imply a narrowly demographic determi-nation of human welfare in big cities. Indeed, the 1996 UN Global Confer-ence on Human Settlements, HABITAT II, attributed worldwide problemsof cities—inadequate shelter, underemployment, environmental decay, re-source and service constraints, and so forth—not to population pressuresbut to aspects of local political economy, most notably inadequate respon-siveness, accountability, and management of municipal governments; in-sufficient mobilization of community resources; and lack of private-sectorinvolvement in bridging supply–demand discrepancies. This perspective isshared by urban theorists who reject notions of potential overurbanization
100 T H E P O V E R T Y O F C I T I E S I N D E V E L O P I N G R E G I O N S
and who point to the efficiency of urban economies and management asthe key to wellbeing in cities of all sizes (Mills and Becker 1986;Prudh’homme 1994). It may be, as we note in our introduction and else-where, that an apparent lack of appreciable improvement of living condi-tions in big cities is largely attributable to changes in the global economythat have reduced the formerly prevailing urban biases of national devel-opment policies. But reliable economic time-series data for individual cit-ies and smaller settlements across countries are unavailable to test this hy-pothesis. What our findings suggest, however, is that in addition tonondemographic factors, population variables of size and growth are criti-cal components affecting wellbeing in cities of developing regions, or ofwhat is euphemistically called sustainable urban development. This shouldnot be construed as validation of the concepts of overurbanization or opti-mal city size; city-size categories used in this study are dictated by the struc-ture of our data, and an overoptimal size, if such a condition exists, may bedefined by a different cutoff point, either higher or lower, than one mil-lion or more inhabitants. More important, our study demonstrates that in-dividual-level data on urban living conditions in developing countries—data that are now readily available—should be examined along witheconomic indicators available for some more-developed cities, to assess com-prehensively the effects of city size and rapid urban population growth.Analysis of such data from many countries, as conducted here, is neces-sary before defensible conclusions can be reached regarding optimal citysize and overurbanization in the developing world.
The question arises whether massive inmigration in recent years—resulting in shantytowns, slums, and squatter settlements in some big cit-ies—has contributed to the worsening relative situation, in the aggregate,of large city populations in some regions, and if so, to what extent. If suchworsening had occurred, that would support the demographic “law” thatcityward migrants become less positively selected with respect to personalcharacteristics as urbanization proceeds, and would refute the hypothesisthat the largest metropolitan areas of countries attract the best-endowedmigrants (Lee 1969). Available migration data are inadequate to addressthis question. Common concern that large-scale migration is worseningoverall conditions in many large cities, however, should be tempered byrecognition that the preponderance of urban growth in the developingworld, excluding China, is probably attributable to natural increase ratherthan net inmigration or other factors.24 Insofar as the maxim that demo-graphically induced social pressures ultimately provoke varied correctivedemographic responses is true (Davis 1963), deceleration of city growth(and resulting smaller-than-expected size) could therefore be anticipatedprimarily from fertility reduction in cities as residents perceive or expectdeleterious changes in their living standards. This would also suggest that
M A R T I N B R O C K E R H O F F / E L L E N B R E N N A N 101
any adverse effects of inmigration on big cities would eventually be less-ened or reversed as would-be migrants recognize that their living circum-stances might be better if they remain sedentary or move instead to smallurban settlements.
Predictions that growing concentration of poverty in big cities will gen-erate major conflict within cities or countries are currently in vogue (forexample, Massey 1996). This perspective derives from a rich body of socialconflict theory (most obviously associated with Marx), and from a com-mon apprehension that the “truly disadvantaged” of large cities will chal-lenge the established urban social order violently, as has occurred sporadi-cally in some Western cities, particularly since the 1960s. We caution,however, against deriving broad societal implications from our findings. Incities where growing relative poverty is accompanied by rising inequality,ethnic, racial, or religious strife, severe constraints in natural resources (forexample, in land for housing), and other factors conducive to social change,gloomy outcomes are not implausible. The general assertion that rampantcity poverty per se breeds upheaval, on the other hand, is untenable. Innon-welfare states, the typical response of urbanites to poverty has notbeen to revolt, but to work harder: to take on multiple jobs, work longerhours, spend more time seeking formal or informal employment, and in-crease household participation (particularly of women and youth) in thelabor force. Such has been the experience, for example, in independentAfrica (Iliffe 1987) and throughout Latin America during the economicdownturn of the 1980s (de Oliveira and Roberts 1996). While some au-thors (for instance, Gugler 1988) argue that national revolutions in thedeveloping world since 1979 (in Iran and Nicaragua) have been motivatedpredominately by urban living conditions and acted out in national capi-tals, such city-based insurgency has been instigated not by the poor, but bymiddle-class constituencies (military cadres, university students, workerassociations, disaffected politicians and religious leaders), much as have ur-ban labor disruptions and riots over food subsidies. In any case, even aremotely accurate prediction of the social consequences of city povertywould require assessment of conditions of individual cities in their nationalcontexts and more disaggregated information than we had use of in thisstudy.
While we have used the level of infant mortality as a general indica-tor of wellbeing across settlements worldwide, the mortality trends docu-mented here are of interest also in shedding light on recent mortality tran-sitions in the developing world. The convergence of infant mortality ratesbetween cities and towns and villages in some developing regions, shownin Table 3, invites comparison with the experience of Europe and NorthAmerica during industrialization in the nineteenth century, which oftenfeatured higher child mortality in cities than in the countryside (Preston
102 T H E P O V E R T Y O F C I T I E S I N D E V E L O P I N G R E G I O N S
and Haines 1991). A central question for future research is whether thedisparity between urban and rural infant mortality decline in contempo-rary developing regions is simply a passing phase in the developing world’stransition to overall lower mortality, as it was in the North. It is temptingto suggest that it is not, as many developing cities, contrary to historicalprecedents, are experiencing rapid population growth during a period ofprolonged economic stagnation and, as discussed earlier, of vastly greatermagnitude. Whatever the case, it is remarkable that infant mortality levelshave remained virtually static in big cities of Latin America and sub-Sa-haran Africa and have risen in smaller cities of Africa, despite improve-ments of the so-called child survival revolution—expanded immunizationcoverage, use of oral rehydration therapy, and other measures—imple-mented by WHO, UNICEF, governments, and nongovernmental organiza-tions since the 1970s. While these measures have apparently achieved con-siderable success in rural areas throughout the world, their effectiveness inbig-city environments warrants critical scrutiny.
Finally, given their particularly weak economies, countries of sub-Sa-haran Africa deserve special focus in the comparative study of poverty andwellbeing in developing regions. While mass media and urban studies havedirected much attention to problems of mega-cities in Asia and LatinAmerica, what has emerged in sub-Saharan Africa are, in effect, “mega-villages.” An urban growth rate of almost 5 percent per year in the post-colonial era, accompanied by widespread economic stagnation since the1970s, has spurred an upsurge of urban settlements of several hundredthousand people, many of which, our findings suggest, lack (or do not availthemselves of) basic amenities found even in small towns and villages. Con-trary to popular perception, destitution and violence in rural areas are notdriving Africa’s exceedingly rapid urban growth: More than half of urbangrowth in the 1970s in Ghana and Liberia, and in the 1980s in Côte d’Ivoire,Senegal, and Mali, appears to have resulted from natural increase in urbanareas (United Nations 1996b). Hence, even if all inmigration to Africancities were to cease immediately, many cities would still have to absorblarge future population increments. Under the most optimistic scenario ofrapid and sustained national economic progress and benevolent governance,prospects for improved welfare in most cities confronted by swelling popu-lations would remain dim, given the frailty of existing infrastructures, ser-vice provision, and public institutions. One must certainly allow from thisstudy, however, that the relative poverty of Africa’s cities, in those coun-tries with functioning governments, might be alleviated even in the shortterm by continued efforts to facilitate fertility reduction within cities.

M A R T I N B R O C K E R H O F F / E L L E N B R E N N A N 103
APPENDIX A Cities of one million or more residents (at time of survey*) includedin the analysis
North Africa/ Latin America andSub-Saharan Africa Near East Asia the Caribbean
Abidjan, Côte d’IvoireAccra, GhanaDakar, SenegalDar es Salaam,Tanzania
Douala, CameroonHarare, ZimbabweIbadan, NigeriaLagos, NigeriaLusaka, ZambiaNairobi, KenyaYaoundé, Cameroon
Adana, TurkeyAlexandria, EgyptAmman, JordanAnkara, TurkeyBursa, TurkeyCairo, EgyptCasablanca, MoroccoIstanbul, TurkeyIzmir, TurkeyKhartoum, SudanRabat, MoroccoShubra El-Khemia,Egypt
Tunis, Tunisia
Bandung, IndonesiaBangkok, ThailandBogor, IndonesiaChittagong, BangladeshDavao, PhilippinesDhaka, BangladeshFaisalabad, PakistanGujranwala, PakistanHyderabad, PakistanJakarta, IndonesiaKarachi, PakistanLahore, PakistanManila, PhilippinesMedan, IndonesiaMultan, PakistanPalembang, IndonesiaPeshawar, PakistanRawalpindi, PakistanSemarang, IndonesiaSurabaja, IndonesiaTanjung Karang,Indonesia
Ujung Pandang,Indonesia
Baranquilla, ColombiaBelém, BrazilBogotá, ColombiaCali, ColombiaFortaleza, BrazilGuadalajara, MexicoGuatemala City,Guatemala
Guayaquil, EcuadorLa Paz, BoliviaLeón de los Aldamas,Mexico
Lima, PeruMedellin, ColombiaMexico City, MexicoMonterrey, MexicoNaucalpan, MexicoPort-au-Prince, HaitiPuebla de Zaragoza,Mexico
Quito, EcuadorRecife, BrazilSalvador, BrazilSantiago de losCaballos, Dom. Rep.
Santo Domingo, Dom.Rep.
*See column 1 in Table Appendix B.

AP
PE
ND
IX B
Av
aila
bil
ity
of
info
rmat
ion
in
43
cou
ntr
y s
urv
eys
Dri
nk
ing
Sch
oo
lH
eigh
t-T
etan
us
Mea
sles
Reg
ion
, co
un
try
,S
ettl
emen
tT
oil
etw
ater
enro
llm
ent
for-
age
imm
un
i-im
mu
ni-
Pre
nat
alan
d s
urv
ey y
ear
size
Ele
ctri
city
faci
liti
esso
urc
e(a
ges
7–12
)(s
tun
tin
g)za
tio
nza
tio
nca
reD
iarr
hea
Su
b-S
ahar
an A
fric
aB
ots
wan
a, 1
988
XX
XX
XX
XX
Bu
rkin
a Fas
o, 1
992–9
3X
XX
XX
XX
XX
XB
uru
ndi, 1
988
XX
XX
XX
XX
XC
amer
oon
, 1991
XX
XX
XX
XX
XX
Cen
tral
Afr
ican
Rep
ubl
ic, 1
994–9
5X
XX
XX
XX
XX
XC
ôte
d’I
voir
e, 1
994
XX
XX
XX
XX
XX
Gh
ana,
1993
XX
XX
XX
XX
XX
Ken
ya, 1
993
XX
XX
XX
XX
XX
Mad
agas
car,
1992
XX
XX
XX
XX
XX
Mal
i, 1
987
XX
XX
XX
XX
XN
amib
ia, 1
992
XX
XX
XX
XX
XX
Nig
er, 1
992
XX
XX
XX
XX
XX
Nig
eria
, 1990
XX
XX
XX
XX
XX
Rw
anda,
199
2X
XX
XX
XX
XX
XSen
egal
, 1992–9
3X
XX
XX
XX
XX
XTan
zan
ia, 1
991–9
2X
XX
XX
XX
XX
XTogo
, 1988
XX
XX
XX
XU
gan
da,
1995
XX
XX
XX
XX
XX
Zam
bia,
1992
XX
XX
XX
XX
XZim
babw
e, 1
994
XX
XX
XX
XX
XX

No
rth
Afr
ica/
Nea
r E
ast
Egy
pt,
1992
XX
XX
XX
XX
XX
Jord
an, 1
990
XX
XX
XX
XX
XX
Moro
cco, 1
99
2X
XX
XX
XX
XX
XN
ort
her
n S
ud
an, 1
989–9
0X
XX
XX
XX
XTu
nis
ia, 1
988
XX
XX
XX
XX
XTu
rkey
, 1993
XX
XX
XX
XX
XX
Yem
en, 1
992
XX
XX
XX
XX
XX
Asi
aB
angl
ades
h, 1
993–9
4X
XX
XX
XX
XX
Indon
esia
, 19
94
XX
XX
XX
XX
XPak
ista
n, 1
990
XX
XX
XX
XX
XX
Ph
ilip
pin
es, 1
993
XX
XX
XX
XX
XTh
aila
nd, 1
98
7X
XX
XX
Lat
in A
mer
ica
and
the
Car
ibb
ean
Bolivi
a, 1
993–9
4X
XX
XX
XX
XX
XN
ort
hea
ster
n B
razi
l, 1
991
XX
XX
XX
XX
XX
Colo
mbi
a, 1
995
XX
XX
XX
XX
XX
Dom
inic
an R
ep.,
1991
XX
XX
XX
XX
XX
Ecu
ador,
1987
XX
XX
XX
XX
Gu
atem
ala,
1995
XX
XX
XX
XX
XX
Hai
ti, 1
994–9
5X
XX
XX
XX
XX
XM
exic
o, 1
987
XX
XX
XX
XX
Par
agu
ay, 1
99
0X
XX
XX
XX
XX
XPer
u, 1
991–9
2X
XX
XX
XX
XX
XTri
nid
ad &
To
bago
, 1987
XX
XX
XX
XX
XX
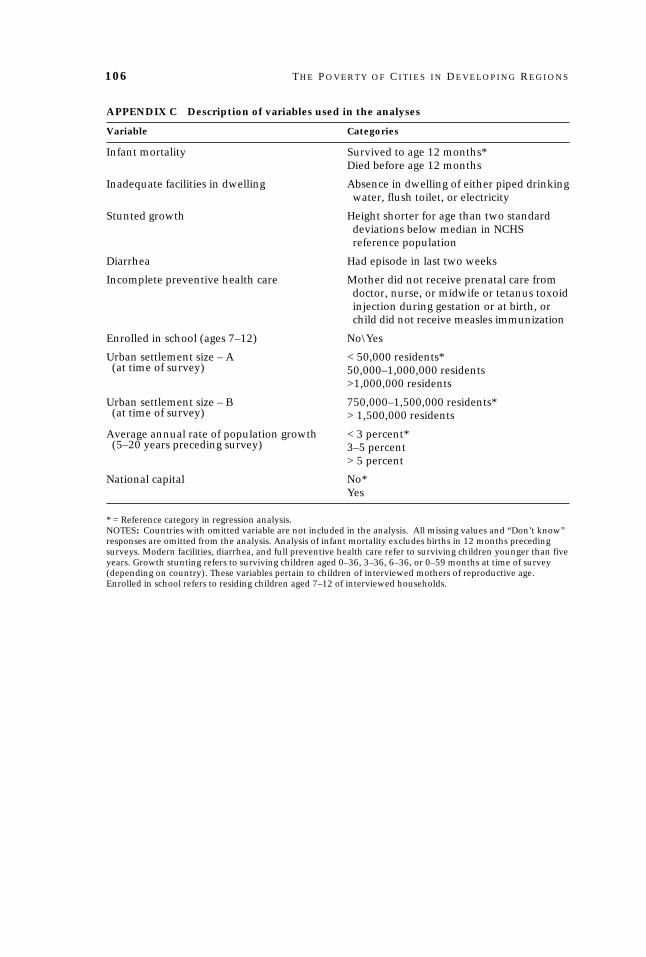
106 T H E P O V E R T Y O F C I T I E S I N D E V E L O P I N G R E G I O N S
APPENDIX C Description of variables used in the analyses
Variable Categories
Infant mortality Survived to age 12 months*Died before age 12 months
Inadequate facilities in dwelling Absence in dwelling of either piped drinkingwater, flush toilet, or electricity
Stunted growth Height shorter for age than two standarddeviations below median in NCHSreference population
Diarrhea Had episode in last two weeks
Incomplete preventive health care Mother did not receive prenatal care fromdoctor, nurse, or midwife or tetanus toxoidinjection during gestation or at birth, orchild did not receive measles immunization
Enrolled in school (ages 7–12) No\Yes
Urban settlement size – A < 50,000 residents*(at time of survey) 50,000–1,000,000 residents
>1,000,000 residents
Urban settlement size – B 750,000–1,500,000 residents*(at time of survey) > 1,500,000 residents
Average annual rate of population growth < 3 percent*(5–20 years preceding survey) 3–5 percent
> 5 percent
National capital No*Yes
* = Reference category in regression analysis.NOTES: Countries with omitted variable are not included in the analysis. All missing values and “Don’t know”responses are omitted from the analysis. Analysis of infant mortality excludes births in 12 months precedingsurveys. Modern facilities, diarrhea, and full preventive health care refer to surviving children younger than fiveyears. Growth stunting refers to surviving children aged 0–36, 3–36, 6–36, or 0–59 months at time of survey(depending on country). These variables pertain to children of interviewed mothers of reproductive age.Enrolled in school refers to residing children aged 7–12 of interviewed households.
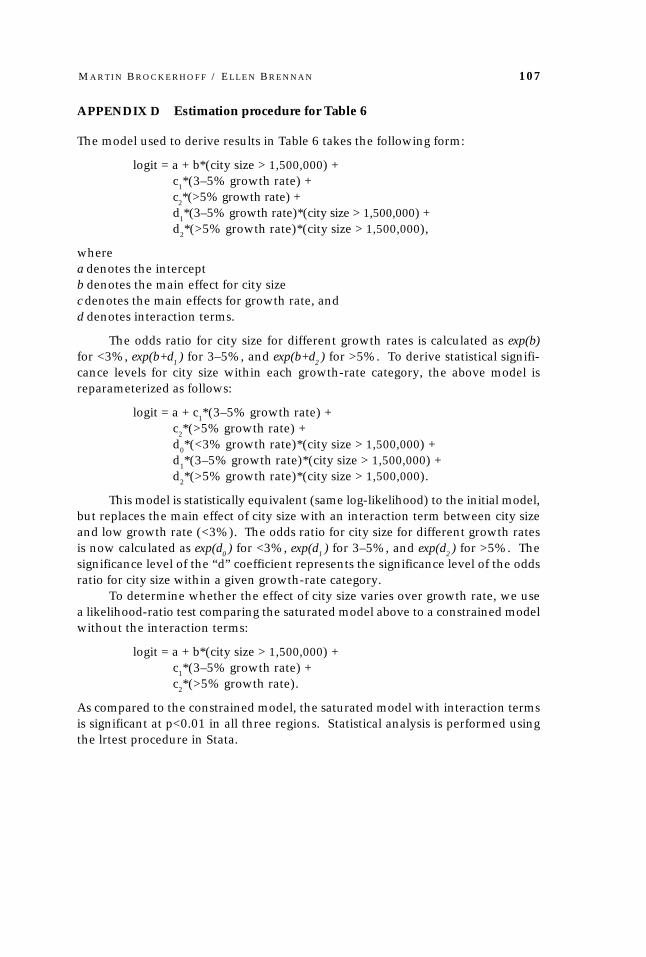
M A R T I N B R O C K E R H O F F / E L L E N B R E N N A N 107
APPENDIX D Estimation procedure for Table 6
The model used to derive results in Table 6 takes the following form:
logit = a + b*(city size > 1,500,000) +c
1*(3–5% growth rate) +
c2*(>5% growth rate) +
d1*(3–5% growth rate)*(city size > 1,500,000) +
d2*(>5% growth rate)*(city size > 1,500,000),
wherea denotes the interceptb denotes the main effect for city sizec denotes the main effects for growth rate, andd denotes interaction terms.
The odds ratio for city size for different growth rates is calculated as exp(b)for <3%, exp(b+d
1 ) for 3–5%, and exp(b+d
2 ) for >5%. To derive statistical signifi-
cance levels for city size within each growth-rate category, the above model isreparameterized as follows:
logit = a + c1*(3–5% growth rate) +
c2*(>5% growth rate) +
d0*(<3% growth rate)*(city size > 1,500,000) +
d1*(3–5% growth rate)*(city size > 1,500,000) +
d2*(>5% growth rate)*(city size > 1,500,000).
This model is statistically equivalent (same log-likelihood) to the initial model,but replaces the main effect of city size with an interaction term between city sizeand low growth rate (<3%). The odds ratio for city size for different growth ratesis now calculated as exp(d
0 ) for <3%, exp(d
1 ) for 3–5%, and exp(d
2 ) for >5%. The
significance level of the “d” coefficient represents the significance level of the oddsratio for city size within a given growth-rate category.
To determine whether the effect of city size varies over growth rate, we usea likelihood-ratio test comparing the saturated model above to a constrained modelwithout the interaction terms:
logit = a + b*(city size > 1,500,000) +c
1*(3–5% growth rate) +
c2*(>5% growth rate).
As compared to the constrained model, the saturated model with interaction termsis significant at p<0.01 in all three regions. Statistical analysis is performed usingthe lrtest procedure in Stata.
108 T H E P O V E R T Y O F C I T I E S I N D E V E L O P I N G R E G I O N S
Support for this research from NICHD Grant1-RO1-HD33718-01, the Mellon Founda-tion, and the Hewlett Foundation is grate-fully acknowledged. The authors thank JohnBongaarts, D. Gale Johnson, John Marcotte,and Harry W. Richardson for their insight-ful comments in preparation of this article.
1 The advantage of cities posited by eachtheory can be summarized as follows. Themodernization framework and its variantsemphasize the initial emergence in cities ofeducated and “rational” (that is, nontradi-tional) industrialists and workers committedto economic growth (Inkeles and Smith1970; Myrdal 1958). As growth proceeds,modern ideals of social and economic equal-ization spread benefits to rural hinterlands(Kuznets 1973), although no time frame isspecified for such diffusion. As articulatedfirst by André Gunder Frank (1967) with ref-erence to Latin America, dependency theoryholds that surplus extraction resulting fromcapitalist expansion in precolonial societiesbenefited city elites within these societies.“Rural underdevelopment and poverty forthe masses were the inevitable outcomes ofthis historical process” (Gilbert and Gugler1982: 16). Similarly, original formulations ofthe world-systems perspective (Wallerstein1974) maintained that the minority share ofthe extracted surplus value not diverted to“core” (that is, more-developed) countries byforeign corporations or through unequaltrade relationships remains concentratedamong the elites of major cities in “periph-eral” countries. One argument of the globaldivision of labor paradigm (Sassen 1994) isthat, along with informal-sector employ-ment, major cities of the South are experi-encing increased employment in high tech-nology and advanced service industriesthrough linkages with cities of the North.
2 Within these regions, however, onlymetropolitan Tokyo has a population this large.
3 Depictions of big-city life in muchAmerican fiction of the time tend to be simi-larly grim, as exemplified by TheodoreDreiser’s Chicago in Sister Carrie (1900) andStephen Crane’s New York in Maggie: A Girlof the Streets (1893).
4 Original theses of overurbanizationwere based on evidence that developingcountries had small ratios of industrial laborto urban population size as compared withratios of now-developed countries in the latenineteenth and early twentieth centuries (atsimilar levels of urbanization). Such evidencewas critiqued, however, as being historicallyand statistically invalid (most notably bySovani 1964 and McGee 1971). The conceptof overurbanization has subsequently beeninterpreted more broadly to denote situa-tions “in which cities cannot adequately pro-vide their rapidly growing populations withbasic services and reasonable job opportu-nities” (Todaro and Stillkind 1983: 196).More specifically, the concept has been sup-ported by arguments that “the provision ofa subsistence minimum is more costly for ad-ditions to urban than rural populations”(Gugler 1982: 183)—due to the higher rela-tive cost of providing urban goods and ser-vices—and more pointedly, that the poorestcity residents suffer disproportionately fromcrime, overcrowding, pollution, and otherhardships imposed by excess city size thatcannot be captured adequately in economicmodels based on aggregate populations(Smith 1987). Where most proponents andcritics of overurbanization conceptions havebeen consistent is in their common failureto base their positions on analysis of primaryand detailed data drawn from populationsrepresentative of a broad range of cities indeveloping countries; conclusions have gen-erally derived, initially, from gross national-level statistics of developing countries, laterfrom studies of cities predominantly locatedin highly industrialized countries, and morerecently from essays unduly informed by asingular dreary outlook (for instance, Linden1993) applied uniformly to conditions in allbig cities. As a result, generalizations thatlarge population size is, on the whole, eitherbeneficial or detrimental to the quality of lifeof municipal populations in developingcountries remain questionable.
5 Cities of one million or more residentsat the time of the survey are identified bythe Demographic and Health Surveys (DHS)
Notes
M A R T I N B R O C K E R H O F F / E L L E N B R E N N A N 109
used for most of the analyses in this study.Because a well-known diversity exists in na-tional definitions of “urban” settlements, aswell as in geographic and administrativeboundaries used to measure populations ofsmall areas, categorization based on popu-lation size in this study obscures such diver-sity, particularly among towns and villages,as well as diversity of population density anddispersion within urban agglomerations.
6 Certainly, however, Marx (1863) pre-dicted the emergence of an urban proletariatprimarily as a function of industrial capitalismoperating in society at large, and most mani-fest in cities, rather than as an outcome of citysize or spatial concentration of population.
7 Urbanization is defined as change inthe proportion of the national population re-siding in urban areas. It should not be con-fused with urban growth, which indicateschange in urban population size independentof any change in rural population.
8 Urban population growth rates dependgreatly on the size of the initial population towhich increments are subsequently added.Very high recent growth rates in some cities,notably cities in sub-Saharan Africa, are clearlyrelated to small populations in earlier years.
9 A major distinction, however, is thatthe 95 percent of population growth occur-ring in urban places probably added about100 million urbanites in the more-developedcountries during 1875–2000, but will add ap-proximately 2 billion people to urban placesin the developing world during 2000–25.
10 Table 2 shows only those ten mega-cities of developing countries included in thefollowing analyses. Their patterns of popu-lation change, however, are representativeof those expected in other mega-cities of theSouth (United Nations 1995a).
11 Growth rates are calculated based onpopulation size in 1970 because meaningfulcomparison of rates is otherwise precludedby graduation of smaller cities to categoriesof larger size. The United Nations (1995a) es-timates that in 1970, less-developed regionscontained 11 cities of more than 5 millionresidents, 71 cities with one to 5 million per-sons, and 90 cities with a population be-tween 500,000 and one million.
12 This projection refutes the notion thatrapid city growth is purely a statistical artifactreflecting small initial population size.
13 In brief, the initial theory of optimalcity size rested on the naive supposition thatall of the economic and social costs and ben-efits associated with different city sizes couldbe aggregated into two smooth functions,one representing costs and the other benefits,presumably expressed in real or imputedmonetary values. Moreover, the theory usu-ally stipulated that the benefit function wasS-shaped, eventually approaching someasymptotic limit, while the cost function wasU-shaped. Given these assumptions, themarginal benefit and marginal cost functionswere bound to intersect at some finite citysize, thus defining the optimal size. The origi-nal version of the theory posited intersec-tion at a relatively small city size, in the100,000–250,000 range, reflecting an idealconcept of a “liveable” city free from con-gestion, pollution, and other negative exter-nalities associated with large population size.In a seminal paper, Alonso (1971) later ad-vanced a modified version, suggesting thateven if the intersection point occurred at amuch larger population size, very large cit-ies would be far beyond the optimal size.Alonso’s argument was straightforward: Ur-ban benefits increase with city size in a lessthan proportional way, while urban costsincrease with city size in a more than pro-portional way. Therefore, there comes apoint at which urban marginal costs becomegreater than urban marginal benefits; thispoint defines an overoptimal size. Alonso’shypotheses have since been contradicted bycase studies and cross-sectional analysis ofcities mainly in industrialized countries (aswell as in Brazil and India), which conclude,on the basis of various measures of economicoutput, that there is no overoptimal city size(Mera 1973; Richardson 1981).
14 A two-step weighting procedure isapplied so that results of analyses of thepooled data represent the experience of in-dividuals at the regional level validly (basedon countries included in the study). First, in-dividuals are weighted so that each DHScountry sample size is equivalent to themean sample size of surveys in that region.
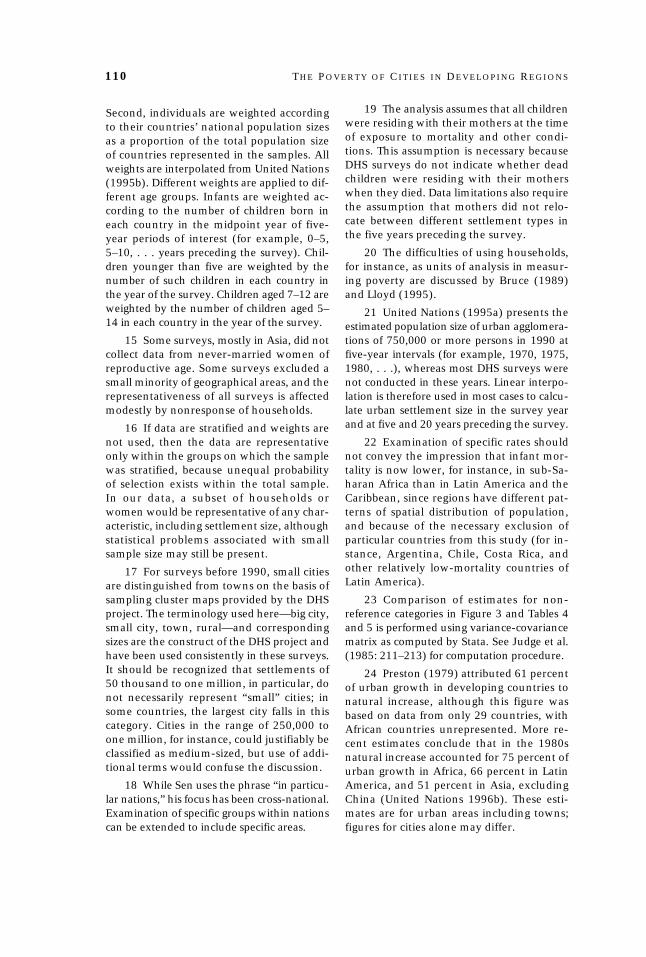
110 T H E P O V E R T Y O F C I T I E S I N D E V E L O P I N G R E G I O N S
Second, individuals are weighted accordingto their countries’ national population sizesas a proportion of the total population sizeof countries represented in the samples. Allweights are interpolated from United Nations(1995b). Different weights are applied to dif-ferent age groups. Infants are weighted ac-cording to the number of children born ineach country in the midpoint year of five-year periods of interest (for example, 0–5,5–10, . . . years preceding the survey). Chil-dren younger than five are weighted by thenumber of such children in each country inthe year of the survey. Children aged 7–12 areweighted by the number of children aged 5–14 in each country in the year of the survey.
15 Some surveys, mostly in Asia, did notcollect data from never-married women ofreproductive age. Some surveys excluded asmall minority of geographical areas, and therepresentativeness of all surveys is affectedmodestly by nonresponse of households.
16 If data are stratified and weights arenot used, then the data are representativeonly within the groups on which the samplewas stratified, because unequal probabilityof selection exists within the total sample.In our data, a subset of households orwomen would be representative of any char-acteristic, including settlement size, althoughstatistical problems associated with smallsample size may still be present.
17 For surveys before 1990, small citiesare distinguished from towns on the basis ofsampling cluster maps provided by the DHSproject. The terminology used here—big city,small city, town, rural—and correspondingsizes are the construct of the DHS project andhave been used consistently in these surveys.It should be recognized that settlements of50 thousand to one million, in particular, donot necessarily represent “small” cities; insome countries, the largest city falls in thiscategory. Cities in the range of 250,000 toone million, for instance, could justifiably beclassified as medium-sized, but use of addi-tional terms would confuse the discussion.
18 While Sen uses the phrase “in particu-lar nations,” his focus has been cross-national.Examination of specific groups within nationscan be extended to include specific areas.
19 The analysis assumes that all childrenwere residing with their mothers at the timeof exposure to mortality and other condi-tions. This assumption is necessary becauseDHS surveys do not indicate whether deadchildren were residing with their motherswhen they died. Data limitations also requirethe assumption that mothers did not relo-cate between different settlement types inthe five years preceding the survey.
20 The difficulties of using households,for instance, as units of analysis in measur-ing poverty are discussed by Bruce (1989)and Lloyd (1995).
21 United Nations (1995a) presents theestimated population size of urban agglomera-tions of 750,000 or more persons in 1990 atfive-year intervals (for example, 1970, 1975,1980, . . .), whereas most DHS surveys werenot conducted in these years. Linear interpo-lation is therefore used in most cases to calcu-late urban settlement size in the survey yearand at five and 20 years preceding the survey.
22 Examination of specific rates shouldnot convey the impression that infant mor-tality is now lower, for instance, in sub-Sa-haran Africa than in Latin America and theCaribbean, since regions have different pat-terns of spatial distribution of population,and because of the necessary exclusion ofparticular countries from this study (for in-stance, Argentina, Chile, Costa Rica, andother relatively low-mortality countries ofLatin America).
23 Comparison of estimates for non-reference categories in Figure 3 and Tables 4and 5 is performed using variance-covariancematrix as computed by Stata. See Judge et al.(1985: 211–213) for computation procedure.
24 Preston (1979) attributed 61 percentof urban growth in developing countries tonatural increase, although this figure wasbased on data from only 29 countries, withAfrican countries unrepresented. More re-cent estimates conclude that in the 1980snatural increase accounted for 75 percent ofurban growth in Africa, 66 percent in LatinAmerica, and 51 percent in Asia, excludingChina (United Nations 1996b). These esti-mates are for urban areas including towns;figures for cities alone may differ.
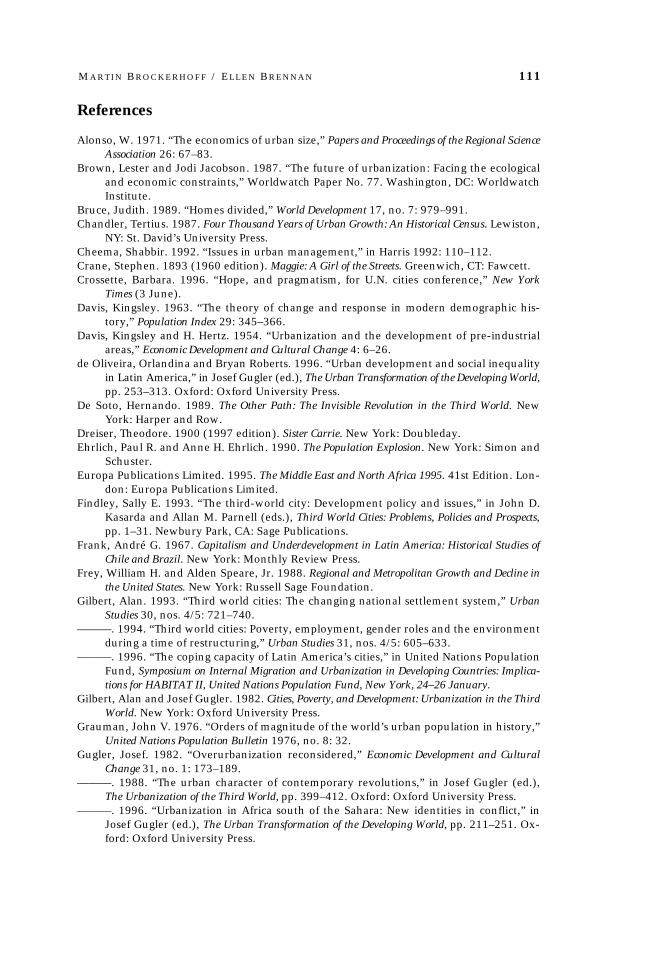
M A R T I N B R O C K E R H O F F / E L L E N B R E N N A N 111
References
Alonso, W. 1971. “The economics of urban size,” Papers and Proceedings of the Regional ScienceAssociation 26: 67–83.
Brown, Lester and Jodi Jacobson. 1987. “The future of urbanization: Facing the ecologicaland economic constraints,” Worldwatch Paper No. 77. Washington, DC: WorldwatchInstitute.
Bruce, Judith. 1989. “Homes divided,” World Development 17, no. 7: 979–991.Chandler, Tertius. 1987. Four Thousand Years of Urban Growth: An Historical Census. Lewiston,
NY: St. David’s University Press.Cheema, Shabbir. 1992. “Issues in urban management,” in Harris 1992: 110–112.Crane, Stephen. 1893 (1960 edition). Maggie: A Girl of the Streets. Greenwich, CT: Fawcett.Crossette, Barbara. 1996. “Hope, and pragmatism, for U.N. cities conference,” New York
Times (3 June).Davis, Kingsley. 1963. “The theory of change and response in modern demographic his-
tory,” Population Index 29: 345–366.Davis, Kingsley and H. Hertz. 1954. “Urbanization and the development of pre-industrial
areas,” Economic Development and Cultural Change 4: 6–26.de Oliveira, Orlandina and Bryan Roberts. 1996. “Urban development and social inequality
in Latin America,” in Josef Gugler (ed.), The Urban Transformation of the Developing World,pp. 253–313. Oxford: Oxford University Press.
De Soto, Hernando. 1989. The Other Path: The Invisible Revolution in the Third World. NewYork: Harper and Row.
Dreiser, Theodore. 1900 (1997 edition). Sister Carrie. New York: Doubleday.Ehrlich, Paul R. and Anne H. Ehrlich. 1990. The Population Explosion. New York: Simon and
Schuster.Europa Publications Limited. 1995. The Middle East and North Africa 1995. 41st Edition. Lon-
don: Europa Publications Limited.Findley, Sally E. 1993. “The third-world city: Development policy and issues,” in John D.
Kasarda and Allan M. Parnell (eds.), Third World Cities: Problems, Policies and Prospects,pp. 1–31. Newbury Park, CA: Sage Publications.
Frank, André G. 1967. Capitalism and Underdevelopment in Latin America: Historical Studies ofChile and Brazil. New York: Monthly Review Press.
Frey, William H. and Alden Speare, Jr. 1988. Regional and Metropolitan Growth and Decline inthe United States. New York: Russell Sage Foundation.
Gilbert, Alan. 1993. “Third world cities: The changing national settlement system,” UrbanStudies 30, nos. 4/5: 721–740.
———. 1994. “Third world cities: Poverty, employment, gender roles and the environmentduring a time of restructuring,” Urban Studies 31, nos. 4/5: 605–633.
———. 1996. “The coping capacity of Latin America’s cities,” in United Nations PopulationFund, Symposium on Internal Migration and Urbanization in Developing Countries: Implica-tions for HABITAT II, United Nations Population Fund, New York, 24–26 January.
Gilbert, Alan and Josef Gugler. 1982. Cities, Poverty, and Development: Urbanization in the ThirdWorld. New York: Oxford University Press.
Grauman, John V. 1976. “Orders of magnitude of the world’s urban population in history,”United Nations Population Bulletin 1976, no. 8: 32.
Gugler, Josef. 1982. “Overurbanization reconsidered,” Economic Development and CulturalChange 31, no. 1: 173–189.
———. 1988. “The urban character of contemporary revolutions,” in Josef Gugler (ed.),The Urbanization of the Third World, pp. 399–412. Oxford: Oxford University Press.
———. 1996. “Urbanization in Africa south of the Sahara: New identities in conflict,” inJosef Gugler (ed.), The Urban Transformation of the Developing World, pp. 211–251. Ox-ford: Oxford University Press.
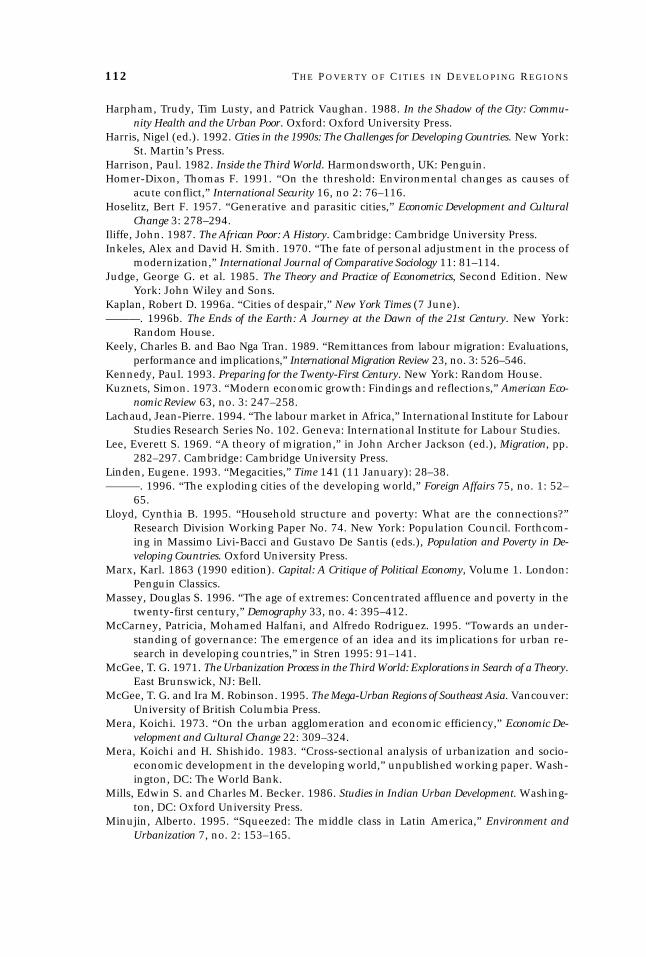
112 T H E P O V E R T Y O F C I T I E S I N D E V E L O P I N G R E G I O N S
Harpham, Trudy, Tim Lusty, and Patrick Vaughan. 1988. In the Shadow of the City: Commu-nity Health and the Urban Poor. Oxford: Oxford University Press.
Harris, Nigel (ed.). 1992. Cities in the 1990s: The Challenges for Developing Countries. New York:St. Martin’s Press.
Harrison, Paul. 1982. Inside the Third World. Harmondsworth, UK: Penguin.Homer-Dixon, Thomas F. 1991. “On the threshold: Environmental changes as causes of
acute conflict,” International Security 16, no 2: 76–116.Hoselitz, Bert F. 1957. “Generative and parasitic cities,” Economic Development and Cultural
Change 3: 278–294.Iliffe, John. 1987. The African Poor: A History. Cambridge: Cambridge University Press.Inkeles, Alex and David H. Smith. 1970. “The fate of personal adjustment in the process of
modernization,” International Journal of Comparative Sociology 11: 81–114.Judge, George G. et al. 1985. The Theory and Practice of Econometrics, Second Edition. New
York: John Wiley and Sons.Kaplan, Robert D. 1996a. “Cities of despair,” New York Times (7 June).———. 1996b. The Ends of the Earth: A Journey at the Dawn of the 21st Century. New York:
Random House.Keely, Charles B. and Bao Nga Tran. 1989. “Remittances from labour migration: Evaluations,
performance and implications,” International Migration Review 23, no. 3: 526–546.Kennedy, Paul. 1993. Preparing for the Twenty-First Century. New York: Random House.Kuznets, Simon. 1973. “Modern economic growth: Findings and reflections,” American Eco-
nomic Review 63, no. 3: 247–258.Lachaud, Jean-Pierre. 1994. “The labour market in Africa,” International Institute for Labour
Studies Research Series No. 102. Geneva: International Institute for Labour Studies.Lee, Everett S. 1969. “A theory of migration,” in John Archer Jackson (ed.), Migration, pp.
282–297. Cambridge: Cambridge University Press.Linden, Eugene. 1993. “Megacities,” Time 141 (11 January): 28–38.———. 1996. “The exploding cities of the developing world,” Foreign Affairs 75, no. 1: 52–
65.Lloyd, Cynthia B. 1995. “Household structure and poverty: What are the connections?”
Research Division Working Paper No. 74. New York: Population Council. Forthcom-ing in Massimo Livi-Bacci and Gustavo De Santis (eds.), Population and Poverty in De-veloping Countries. Oxford University Press.
Marx, Karl. 1863 (1990 edition). Capital: A Critique of Political Economy, Volume 1. London:Penguin Classics.
Massey, Douglas S. 1996. “The age of extremes: Concentrated affluence and poverty in thetwenty-first century,” Demography 33, no. 4: 395–412.
McCarney, Patricia, Mohamed Halfani, and Alfredo Rodriguez. 1995. “Towards an under-standing of governance: The emergence of an idea and its implications for urban re-search in developing countries,” in Stren 1995: 91–141.
McGee, T. G. 1971. The Urbanization Process in the Third World: Explorations in Search of a Theory.East Brunswick, NJ: Bell.
McGee, T. G. and Ira M. Robinson. 1995. The Mega-Urban Regions of Southeast Asia. Vancouver:University of British Columbia Press.
Mera, Koichi. 1973. “On the urban agglomeration and economic efficiency,” Economic De-velopment and Cultural Change 22: 309–324.
Mera, Koichi and H. Shishido. 1983. “Cross-sectional analysis of urbanization and socio-economic development in the developing world,” unpublished working paper. Wash-ington, DC: The World Bank.
Mills, Edwin S. and Charles M. Becker. 1986. Studies in Indian Urban Development. Washing-ton, DC: Oxford University Press.
Minujin, Alberto. 1995. “Squeezed: The middle class in Latin America,” Environment andUrbanization 7, no. 2: 153–165.
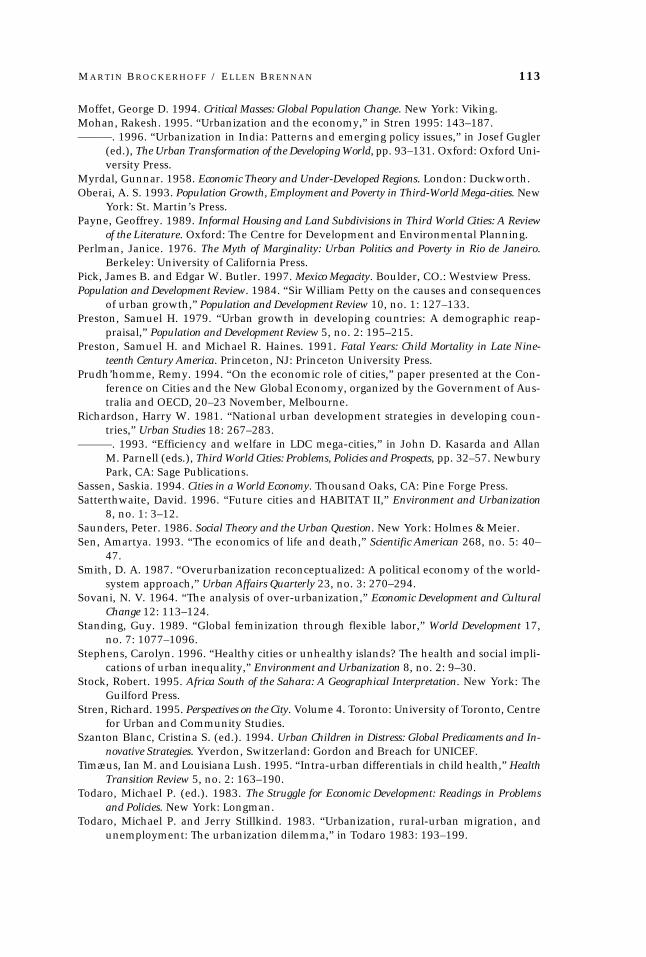
M A R T I N B R O C K E R H O F F / E L L E N B R E N N A N 113
Moffet, George D. 1994. Critical Masses: Global Population Change. New York: Viking.Mohan, Rakesh. 1995. “Urbanization and the economy,” in Stren 1995: 143–187.———. 1996. “Urbanization in India: Patterns and emerging policy issues,” in Josef Gugler
(ed.), The Urban Transformation of the Developing World, pp. 93–131. Oxford: Oxford Uni-versity Press.
Myrdal, Gunnar. 1958. Economic Theory and Under-Developed Regions. London: Duckworth.Oberai, A. S. 1993. Population Growth, Employment and Poverty in Third-World Mega-cities. New
York: St. Martin’s Press.Payne, Geoffrey. 1989. Informal Housing and Land Subdivisions in Third World Cities: A Review
of the Literature. Oxford: The Centre for Development and Environmental Planning.Perlman, Janice. 1976. The Myth of Marginality: Urban Politics and Poverty in Rio de Janeiro.
Berkeley: University of California Press.Pick, James B. and Edgar W. Butler. 1997. Mexico Megacity. Boulder, CO.: Westview Press.Population and Development Review. 1984. “Sir William Petty on the causes and consequences
of urban growth,” Population and Development Review 10, no. 1: 127–133.Preston, Samuel H. 1979. “Urban growth in developing countries: A demographic reap-
praisal,” Population and Development Review 5, no. 2: 195–215.Preston, Samuel H. and Michael R. Haines. 1991. Fatal Years: Child Mortality in Late Nine-
teenth Century America. Princeton, NJ: Princeton University Press.Prudh’homme, Remy. 1994. “On the economic role of cities,” paper presented at the Con-
ference on Cities and the New Global Economy, organized by the Government of Aus-tralia and OECD, 20–23 November, Melbourne.
Richardson, Harry W. 1981. “National urban development strategies in developing coun-tries,” Urban Studies 18: 267–283.
———. 1993. “Efficiency and welfare in LDC mega-cities,” in John D. Kasarda and AllanM. Parnell (eds.), Third World Cities: Problems, Policies and Prospects, pp. 32–57. NewburyPark, CA: Sage Publications.
Sassen, Saskia. 1994. Cities in a World Economy. Thousand Oaks, CA: Pine Forge Press.Satterthwaite, David. 1996. “Future cities and HABITAT II,” Environment and Urbanization
8, no. 1: 3–12.Saunders, Peter. 1986. Social Theory and the Urban Question. New York: Holmes & Meier.Sen, Amartya. 1993. “The economics of life and death,” Scientific American 268, no. 5: 40–
47.Smith, D. A. 1987. “Overurbanization reconceptualized: A political economy of the world-
system approach,” Urban Affairs Quarterly 23, no. 3: 270–294.Sovani, N. V. 1964. “The analysis of over-urbanization,” Economic Development and Cultural
Change 12: 113–124.Standing, Guy. 1989. “Global feminization through flexible labor,” World Development 17,
no. 7: 1077–1096.Stephens, Carolyn. 1996. “Healthy cities or unhealthy islands? The health and social impli-
cations of urban inequality,” Environment and Urbanization 8, no. 2: 9–30.Stock, Robert. 1995. Africa South of the Sahara: A Geographical Interpretation. New York: The
Guilford Press.Stren, Richard. 1995. Perspectives on the City. Volume 4. Toronto: University of Toronto, Centre
for Urban and Community Studies.Szanton Blanc, Cristina S. (ed.). 1994. Urban Children in Distress: Global Predicaments and In-
novative Strategies. Yverdon, Switzerland: Gordon and Breach for UNICEF.Timæus, Ian M. and Louisiana Lush. 1995. “Intra-urban differentials in child health,” Health
Transition Review 5, no. 2: 163–190.Todaro, Michael P. (ed.). 1983. The Struggle for Economic Development: Readings in Problems
and Policies. New York: Longman.Todaro, Michael P. and Jerry Stillkind. 1983. “Urbanization, rural-urban migration, and
unemployment: The urbanization dilemma,” in Todaro 1983: 193–199.
114 T H E P O V E R T Y O F C I T I E S I N D E V E L O P I N G R E G I O N S
United Nations. 1995a. World Urbanization Prospects: The 1994 Revision. New York: UnitedNations.
———. 1995b. World Population Prospects: The 1994 Revision. New York: United Nations.———. 1996a. Habitat Agenda and Istanbul Declaration. Second United Nations Conference
on Human Settlements, Istanbul, Turkey, 3–14 June. New York: United Nations.———. 1996b. World Economic and Social Survey: Trends and Policies in the World Economy. New
York: United Nations.United Nations Center for Human Settlements (UNCHS). 1996. An Urbanizing World: Global
Report on Human Settlements, 1996. Oxford: Oxford University Press for HABITAT.United Nations Development Programme (UNDP). 1996. Human Development Report 1996.
New York: Oxford University Press.Wallerstein, Immanuel M. 1974. The Modern World-System: Capitalist Agriculture and the Ori-
gins of the European World Economy in the Sixteenth Century. New York: Academic Press.Ward, David. 1989. Poverty, Ethnicity, and the American City, 1840–1925: Changing Conceptions
of the Slum and the Ghetto. Cambridge: Cambridge University Press.Werna, Edmundo. 1996. “United Nations agencies’ urban policies and health,” in Sarah
Atkinson, Jacob Songsore, and Edmundo Werna (eds.), Urban Health Research in Devel-oping Countries: Implications for Policy, pp. 11–30. New York: Oxford University Press.
White, Howard. 1996. “Adjustment in Africa: A review article,” Development and Change 27,no. 4: 785–815.
World Bank. 1990. World Development Report 1990. New York: Oxford University Press.———. 1995. World Development Report 1995. New York: Oxford University Press.Wratten, Ellen. 1995. “Conceptualizing urban poverty,” Environment and Urbanization 7, no.
1: 11–36.
Top Related