


Languages
Pages
Legal

THE POLITICAL ECONOMY OF THE MALAYSIAN SUBNATIONAL GOVERNMENTS’ FISCAL
BEHAVIOR
AHMAD ZAFARULLAH ABDUL JALILCollege of Arts and SciencesUniversiti Utara Malaysia
ABSTRACT
This article att empts to shed light on the political economy of the Malaysian state governments’ budgetary behaviour by tailoring hypotheses drawn from recent theoretical literature to the Malaysian institutional context and testing them empirically. The main objective here was to examine whether state governments’ fi scal behaviour can partly be explained by the political att ributes and the institutional characteristics of the government, and of the legislature. In particular, the study analysed whether the incentives for the state governments to observe a prudent spending behaviour have not been undermined by the fact that they have been able to infl uence relevant central government decisions regarding their fi nance. The estimation results showed that states that are over-represented at the executive level tend to have higher spending and defi cits. However, no correlation was found between over-representation at the parliament and state governments’ fi scal outcomes. This can be explained by the fact that in Malaysia, as is frequently the case in developing nations, the legislature is peripheral to the executive in terms of decision-making power.
Keywords: State governments; fi scal behaviour; political economy.
ABSTRAK
Artikel ini membincangkan gelagat fi skal kerajaan negeri di Malaysia dari sudut politik ekonomi. Berdasarkan kepada teori ekonomi politik, penulis cuba untuk menganalisa secara empirikal situasi di Malaysia. Objektif utama artikel ini adalah untuk melihat sejauh mana gelagat fi skal kerajaan negeri di Malaysia dipengaruh oleh atribut politik serta karakteristik institusi kerajaan dan legislatur. Secara lebih khususnya, penulis cuba melihat keupayaan kerajaan negeri untuk mempengaruhi keputusan yang dibuat oleh kerajaan persekutuan dan sejauh mana ianya akan mempengaruhi gelagat fi skal kerajaan negeri. Hasil dapatan kajian menunjukkan negeri yang mempunyai wakil yang
IJ MS 16 (1), 261-283 (2009)
ww
w.ij
ms.
uum
.edu
.my
262 IJ MS 16 (1), 261-283 (2009)
ramai di Kabinet akan mempunyai tingkat perbelanjaan dan defi sit yang lebih tinggi. Walau bagaimanapun, penulis tidak menemui sebarang hubungan yang signifi kan di antara perbelanjaan dan jumlah wakil di Parlimen. Penulis merasakan ini sama seperti kebanyakkan negara-negara membangun yang lain, kuasa membuat keputusan di peringkat kerajaan persekutuan lebih tertumpu di pihak kabinet.
Kata kunci: Kerajaan negeri; gelagat fi skal; ekonomi politik.
INTRODUCTION
The fi rst generation of economic theories of fi scal federalism generated much optimism about decentralisation in the form of bett er improvement in effi ciency, accountability, and governance. However, these theories seemed to be increasingly anachronistic in the face of subnational debt accumulation and bailouts, as well as evidence of corruption and ineffi ciency associated with decentralisation. According to Rodden (2005), the failure of the prevailing literature to describe the reality of decentralisation is due notably to the absence of the political dimension in its analysis. As a result, a new wave of scholarship where political variables are given centre stage has emerged (Bellefl amme & Hindriks, 2003; Besley & Coate, 2003; Bordignon, Cerniglia, & Revelli, 2004; Hindriks & Lockwood, 2005; Persson & Tabellini, 2000). A major assumption underlying the new political economy literature is that politicians are primarily interested in maintaining and enhancing their political careers. Most importantly, in these models, government decisions are viewed as bargains struck among self-interested politicians att empting to form winning coalitions, rather than refl ections on the optimal provision of collective goods or the internalisation of externalities. Consequently, the central government is no longer autonomously able to alter subnational policies as it will have to bargain with subnational governments in order to gain support from all or at least some minimum fraction of them.
This paper highlights the political economy of the Malaysian state governments’ budgetary behaviour by tailoring hypotheses drawn from recent theory literature to the Malaysian institutional context and testing them empirically. The main objective here is to examine whether state governments’ fi scal behaviour can partly be explained by the political att ributes and the institutional characteristics of the government and of the legislature. In particular, it was analysed whether the incentives for the state governments to observe a prudent spending behaviour have not
ww
w.ij
ms.
uum
.edu
.my
IJ MS 16 (1), 261-283 (2009) 263
been undermined due to the fact that they have been able to infl uence relevant central government decisions regarding their fi nance. There are basically two hypotheses that was tested in this study: Do states with the most votes (or the strongest representation) in parliament or in the government have relatively higher spending and run a larger defi cit? And do states that share the same ideological leaning as the central government have relatively higher spending and run a larger defi cit? The reason being, a highly infl uential state in the sense that they are highly represented in the government or share the same political ideology as the central government, face weaker incentives to be fi scally responsible as it has higher probability of obtaining extra allocations from the central government and in case of a crisis, is more likely to be rescued.
The paper is organised as follows. The second section provides a more detailed discussion on the links between political factors and economics, as well as fi scal outcomes at the subnational level by reviewing the work that had been done both by economists and political scientist in this area. Section 3 discusses the econometric approach that was adopted. The results of the estimations is presented and discussed in section 4 and fi nally, section 5 concludes.
A REVIEW OF LITERATURE
In many countries (and in particular federal countries), the structure of the central government includes representation of the subnational units. Theoretical as well as empirical studies pointed to the fact that central government decisions, especially those that concern the interests of subnational units, will be subject to the infl uences of this representation both at the legislative and executive levels. Nevertheless, researchers tend to privilege the former as the main arena where self-interested politicians strike bargains among themselves. This focus on the legislature has given rise to the term “legislative bargaining” which is usually used in complement to other terms such as “logrolling” or “pork-barrel”1. Indeed, representatives of the states or regions at the legislature will engage in a bargaining process among themselves which will usually end up with some of them logrolling their votes in order to achieve passage of pork-barrel projects.
Decision-making concerning distributive policies2 constitutes a good example of legislative bargaining at work. By defi nition, distributive politics is a political decision that concentrates benefi ts in a specifi c
ww
w.ij
ms.
uum
.edu
.my
264 IJ MS 16 (1), 261-283 (2009)
geographic district or region, and fi nances expenditure through generalised taxation3. The fact that these policies are distributive in nature implies that with the majority rule, there will be no voting equilibrium and Condorcet cycles will unavoidably emerge. There are mainly two views regarding the legislative passing of redistributive policies – the minimum winning coalitions and the universal and oversized coalitions. Another strand in the literature of distributive politics consists in testing the “Law of 1/n” proposed by Weingast, Shepsle, and Johnsen (1981), according to whom the level of distributive spending is positively linked with the number of legislators (Balla, Lawrence, Maltzman, & Sigelman, 2002; Huriochi & Lee, 2004; Milesi-Ferett i, Perott i, & Rostagno, 2001; Rodden & Arretche, 2004). The mechanism at work according to the authors is the common pool problem: since each group fully benefi ts from its specifi c spending programme but the burden of taxation is diff used, the cost of public expenditures is not fully internalised by the political decision-makers and thus could lead to greater-than-optimal public expenditures.
The legislature is not the sole channel through which subnational units can exert its infl uences on the central government’s decision-making. In Canada for instance, regions do not have any formal legislative representation. However, it does not prevent some regions from obtaining special treatment from the federal government. For example, in 2004, Ontario was awarded a grant of CAD 5.75 billion in response to Premier McGuinty’s cry that Ontario was paying more than its fair share into the federation. Nevertheless, no such deal was struck, or even discussed with Alberta, where the per capita fi scal transfer was higher than in Ontario.
Cox and McCubbins (1986) presented a model where electoral candidates compete by promising direct redistribution of welfare among the various groups in their constituency. The central insight of the model is that the type of coalition the candidates att empt to build (thus the nature of their distributive politics) will depend on their att itudes toward risk. They showed that risk-averse incumbents tend to invest most heavily in their closest supporters while risk-loving candidates pursue swing districts more aggressively, that is, districts where voters are more likely to evaluate the candidate in terms of actual performance in offi ce. In a closely related paper on campaign spending, Snyder (1989) obtained a similar result – a party that seeks to maximise the probability of winning a majority will spend more on safe districts, that is, where it has an overall advantage because these are more likely to be pivotal in obtaining the
ww
w.ij
ms.
uum
.edu
.my
IJ MS 16 (1), 261-283 (2009) 265
majority. In contrast, Dixit and Londregan (1996) viewed voters as willing to compromise their party affi nities in exchange for particularistic benefi ts. They also showed that candidates will aggressively court the swing voters through this particularistic spending.
Empirical studies usually att ribute to the fi rst model if they fi nd core supporters would benefi t disproportionately and to the second if swing voters are privileged by candidates. Given the theoretical controversy in the existing literature, it is perhaps not surprising that the relevant empirical literature has generated a confusing array of fi ndings. Some US studies support Dixit-Londregan thesis that material benefi ts are disproportionately directed to swing voters (Bickers & Stein, 1996; Herron & Theodos, 2004). Some research in other national sett ings also found that legislators direct resources to electorally pivotal or marginal areas (Case, 2001; Dahlberg & Johansson, 2002). The Cox-McCubbins hypothesis that expenditures are instead concentrated in majority party strongholds, thereby benefi ting core voters, has received empirical support in some US studies (Ansolabehere & Snyder, 2003; Levitt & Snyder, 1995; Balla et al., 2002), as well as a number of those conducted elsewhere (Crisp & Ingall, 2002; Diaz-Cayeros, Magaloni, & Weingast, 2000; Horiuchi & Lee, 2004).
Based on the literature review, it can be seen that there are essentially two mechanisms through which subnational government behaviour may be linked to political institutions:
- through state representative at the central level (legislative bargaining model), and
- through political and ideological partisanship (political partisanship model).
DATA SPECIFICATION AND EMPIRICAL STRATEGY
Data Specifi cation
Our study covers the period of 1982-2002 divided into four periods of four year (1982-1985; 1986-1989; 1995-1998; 1999-2002) and one period of fi ve years (1990-1994). The division of the period was made concordantly with the term of the member of parliament. Indeed, the election at the national level is held every fi ve years and the cabinet is formed once the election result is announced. In Malaysia, during the fi ve-year period,
ww
w.ij
ms.
uum
.edu
.my
266 IJ MS 16 (1), 261-283 (2009)
the members of parliament as well as the members of the cabinet hardly change.
The data on state governments’ expenditures and revenues were obtained from the State Government Financial Statements which are published and made public every year by the Finance/Treasury Offi ce of each state government. The data were combined with political, socio-demographic, as well as economic data from other sources. The political data were mainly obtained from the Election Report prepared by the Election Commission. The data on election results were also obtained from the major newspapers of the country. State demographic and economic characteristics were mainly obtained from the State and District Reports published by the Department of Statistics Malaysia.
Empirical Strategy
The two hypotheses that were tested may be summarised as follows:
H1: States with the most votes (or the strongest representation) in parliament or in the government have relatively higher spending (the legislative bargaining model).
H2: States that share the same ideological leaning as the central government have relatively higher spending (the partisanship model).
The empirical specifi cation was thus as followsSpendingi,t = α.Politicsit + βXit + eit
where Spendingit are log of real per capita expenditure. The variable of interest was Politicsit, which represents various political institutions susceptible of infl uencing the state government’s spending. Vector Xit represents various control variables which are believed determinant in explaining the fi scal behaviour of state governments in Malaysia while eit represents the disturbance term of our model.
The Variable of Interest
In order to test for the fi rst hypothesis, the following variables were used:
• the number of seats allocated to each states in the parliament per capita, and
• the number of members a particular state has in the cabinet per capita.
ww
w.ij
ms.
uum
.edu
.my
IJ MS 16 (1), 261-283 (2009) 267
The number of seats that are allocated to each state in the parliament will represent the level of leverage that a particular state has in the parliament, as the more seats a state has, the more infl uence it will have in the legislative process. The same argument holds for the number of members a state has in the cabinet. A state that is over-represented in the cabinet will have more infl uence on the decisions made at the executive level.
For the second hypothesis, the following variables were used:
• the number of seats (for each state) in the parliament won by the ruling party per capita,
• the percentage of state assembly seats won by the ruling party, and
• the number of votes obtained by the ruling party. The three variables were used because the extent of partisanship of a state with the ruling party can in a way be measured by the number of seats and votes obtained by the ruling party both at the national and state level elections.
The Control Variables
Control variables were introduced mainly based on previous studies on the determinant of public expenditures (Ram, 1987; Heller & Diamond, 1990, Guillaumont & Hua 2000)..
The control variables included lagged value of the dependant variable, log of real per capita revenue (for equation 1), dummy variable representing year before election held, gdp per capita, a dummy variable for states with petrol revenues, proportion of forest area, proportion of “bumiputera” of the total population, urbanisation rate, and proportion of population with tertiary education. The income variable is a proxy for Wagner’s Law according to which an increase in income will lead to an increase in spending. The possible inertia and dynamic process underlying the dependant variables were taken into consideration by including their lagged values. Besides, lagged expenditure/defi cit may be correlated both with current expenditure/defi cit and the political outcomes – the level of current expenditure/defi cit may partly be the result of last period electoral and fi scal outcomes – and hence can be used to test the robustness of the political eff ect. In order to control for the needs and expectations of the population in terms of provision of local
ww
w.ij
ms.
uum
.edu
.my
268 IJ MS 16 (1), 261-283 (2009)
public goods, it was included in the estimation the urbanisation rate as well as the proportion of population with tertiary education. The more educated and/or urbanised, the higher their needs and expectations, and the higher will the state governments’ expenditures will be.
Therefore, these two variables should have a positive eff ect on the level of expenditure and eventually on the defi cit level.
Another implication of a higher urbanisation rate however is the economies of scale that can be gained in the provision of public goods (Mueller 2003). The more urbanised the state government, the cheaper it is to provide public goods. In this case, urbanisation rate should have a negative impact on the level of state governments’ expenditure (and eventually on the defi cit level). There is thus no consensus as to the correct sign of the relation between urbanisation rate and fi scal outcomes. The proportion of bumiputera (the Malays and natives of the country) was included since the Islamic and native laws and customs fall under the responsibilities of the state government. Besides, the proportion of bumiputera of the total population varies across states (from more than 95% in states like Kelantan and Trengganu to less than 50% in states such as Penang). States with a higher proportion of bumiputera in their population will thus incur a higher amount of spending than those with a lower proportion of bumiputera. The was also control for the size and population of the state. It was expected that bigger and more populated states are more expensive to run and thus will lead to higher expenses maintained by the state governments.
Finally, in order to control for specifi c temporal eff ects, it was also introduced in the estimation, three time dummies. The fi rst dummy was not included since it was already included in the estimation of the lagged value of the dependent variable. As discussed above, it was included in the model the lagged values of the dependant variables. Consequently, the usual fi xed-eff ect model can no longer be used since the estimators will not be convergent as the lagged value is correlated with the error term. The potential bias is function of 1/T and the intra-individual estimator is convergent only in the case where T is big. Given the weak temporal dimension of the sample, the bias is potentially big. Besides, past spending decisions may infl uence the current political variables as well as have some infl uence on current spending decisions, if spending patt erns are a trend through time. Consequently, the generalised method of moments (GMM) as developed by Arellano and Bond (1991) was applied. This method will not only help solve the problem of a serially correlated error term, but also those of endogeneity. There are two types of GMM estimators: (1) the diff erence estimator and (2) the system
ww
w.ij
ms.
uum
.edu
.my
IJ MS 16 (1), 261-283 (2009) 269
estimator. A problem with the original Arellano-Bond estimator is that lagged levels are oft en poor instruments for fi rst diff erences. Arellano and Bover (1995) described how, if the original equations are added to the diff erenced system, additional moment conditions can be brought to bear to increase effi ciency. In these equations, predetermined and endogenous variables in levels were instrumented with suitable lags of their own fi rst diff erences.
EMPIRICAL RESULTS
Eff ect on State Government Expenditure and Defi cit
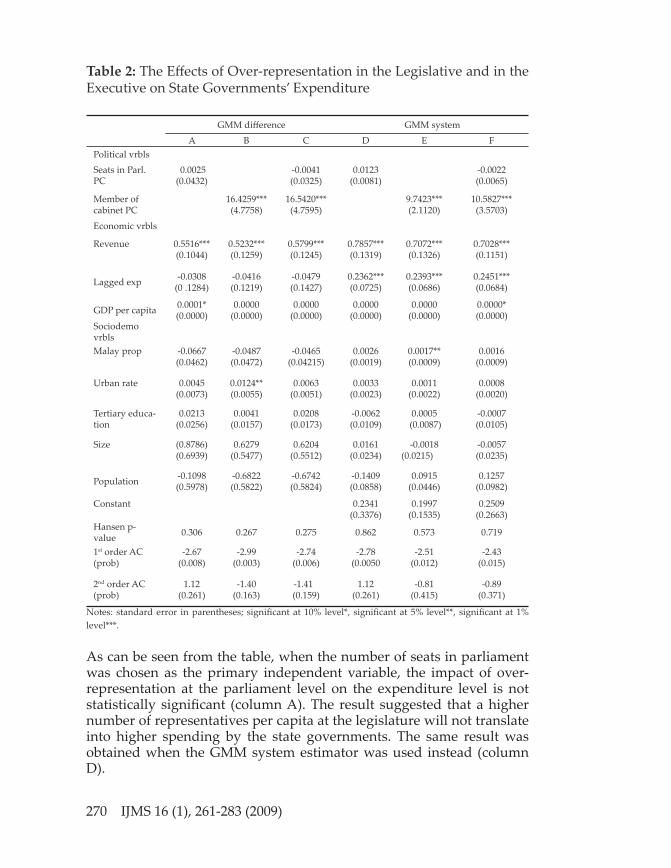
The analysis began with the testing the fi rst hypothesis by estimating the eff ect of over-representation at the parliament on the state government expenditure level. For that, the number of seats allocated to each state in the parliament per capita was used. Table 2 summarises the results of the estimations. The table is divided into two segments – one reporting the results when GMM diff erence was used (column A to C) and the other when the GMM system was employed (column D to F).
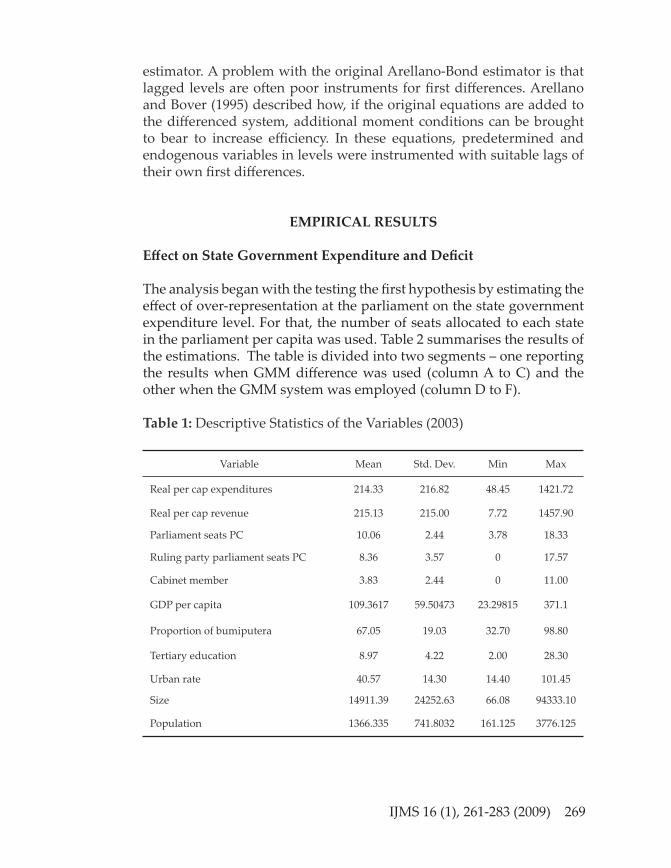
Table 1: Descriptive Statistics of the Variables (2003)
Variable Mean Std. Dev. Min Max
Real per cap expenditures 214.33 216.82 48.45 1421.72
Real per cap revenue 215.13 215.00 7.72 1457.90
Parliament seats PC 10.06 2.44 3.78 18.33
Ruling party parliament seats PC 8.36 3.57 0 17.57
Cabinet member 3.83 2.44 0 11.00
GDP per capita 109.3617 59.50473 23.29815 371.1
Proportion of bumiputera 67.05 19.03 32.70 98.80
Tertiary education 8.97 4.22 2.00 28.30
Urban rate 40.57 14.30 14.40 101.45
Size 14911.39 24252.63 66.08 94333.10
Population 1366.335 741.8032 161.125 3776.125
ww
w.ij
ms.
uum
.edu
.my
270 IJ MS 16 (1), 261-283 (2009)
Table 2: The Eff ects of Over-representation in the Legislative and in the Executive on State Governments’ Expenditure
GMM diff erence GMM system
A B C D E FPolitical vrblsSeats in Parl. PC
0.0025 (0.0432)
-0.0041(0.0325)
0.0123 (0.0081)
-0.0022(0.0065)
Member of cabinet PC
16.4259***(4.7758)
16.5420***(4.7595)
9.7423***(2.1120)
10.5827***(3.5703)
Economic vrbls
Revenue 0.5516*** (0.1044)
0.5232*** (0.1259)
0.5799*** (0.1245)
0.7857*** (0.1319)
0.7072*** (0.1326)
0.7028*** (0.1151)
Lagged exp -0.0308(0 .1284)
-0.0416 (0.1219)
-0.0479 (0.1427)
0.2362*** (0.0725)
0.2393*** (0.0686)
0.2451*** (0.0684)
GDP per capita 0.0001* (0.0000)
0.0000 (0.0000)
0.0000 (0.0000)
0.0000 (0.0000)
0.0000 (0.0000)
0.0000* (0.0000)
Sociodemo vrblsMalay prop -0.0667
(0.0462)-0.0487 (0.0472)
-0.0465 (0.04215)
0.0026 (0.0019)
0.0017** (0.0009)
0.0016 (0.0009)
Urban rate 0.0045 (0.0073)
0.0124** (0.0055)
0.0063 (0.0051)
0.0033 (0.0023)
0.0011 (0.0022)
0.0008 (0.0020)
Tertiary educa-tion
0.0213 (0.0256)
0.0041 (0.0157)
0.0208 (0.0173)
-0.0062 (0.0109)
0.0005 (0.0087)
-0.0007 (0.0105)
Size (0.8786)(0.6939)
0.6279(0.5477)
0.6204(0.5512)
0.0161(0.0234)
-0.0018(0.0215)
-0.0057(0.0235)
Population -0.1098(0.5978)
-0.6822(0.5822)
-0.6742 (0.5824)
-0.1409(0.0858)
0.0915(0.0446)
0.1257(0.0982)
Constant 0.2341 (0.3376)
0.1997 (0.1535)
0.2509 (0.2663)
Hansen p-value 0.306 0.267 0.275 0.862 0.573 0.719
1st order AC (prob)
-2.67 (0.008)
-2.99(0.003)
-2.74 (0.006)
-2.78 (0.0050
-2.51(0.012)
-2.43(0.015)
2nd order AC (prob)
1.12(0.261)
-1.40(0.163)
-1.41 (0.159)
1.12 (0.261)
-0.81(0.415)
-0.89(0.371)
Notes: standard error in parentheses; signifi cant at 10% level*, signifi cant at 5% level**, signifi cant at 1% level***.
As can be seen from the table, when the number of seats in parliament was chosen as the primary independent variable, the impact of over-representation at the parliament level on the expenditure level is not statistically signifi cant (column A). The result suggested that a higher number of representatives per capita at the legislature will not translate into higher spending by the state governments. The same result was obtained when the GMM system estimator was used instead (column D).
ww
w.ij
ms.
uum
.edu
.my
IJ MS 16 (1), 261-283 (2009) 271
In column B and D, the number of members in the cabinet per capita was used as the primary independent variable. As it was shown in the discussion of the political environment in Malaysia, backbenchers do not have much power in the legislature as most, if not all, bills are initiated by the members of the executive. Furthermore, any bills that are tabled in parliament will not necessarily be adopted and promulgated by the parliament. As a result, states have much more to gain from federal policies when they are well or over-represented by the executives. Besides, ministers also have the power of directing porks to their constituents without necessarily having to pass through to the parliament. This expectation seemed to be validated by the estimation result, since it showed that the coeffi cient for cabinet member per capita is highly signifi cant in both the GMM system and GMM diff erence estimators. These estimates indicated that a higher representation by the executives leads to higher spending by state governments.
In column C and F, both the number of members in the cabinet per capita and the number of seats in the parliament were introduced simultaneously in the estimations. While the former continued to be positively associated with the dependant variable, the latt er remained statistically non-signifi cant. These results were taken as suggestive of the fact that there is relatively less power are in the hand of backbenchers. Consequently, the state governments will not be gett ing any signifi cant benefi ts if they are over-represented at the parliament.
As far as the control variables are concerned, only the revenue variable was found to be statistically signifi cant across the estimations. As for the lagged value of the dependent variable, it was found to be signifi cant only when the GMM system was used.
Several tests provided evidence for the validity of the model specifi cation. The Hansen test indicated that the null hypothesis of the validity of the instruments cannot be rejected. Also, tests performed on the diff erenced residuals indicated the presence of fi rst-order serial correlation, but the absence of second-order serial correlation.
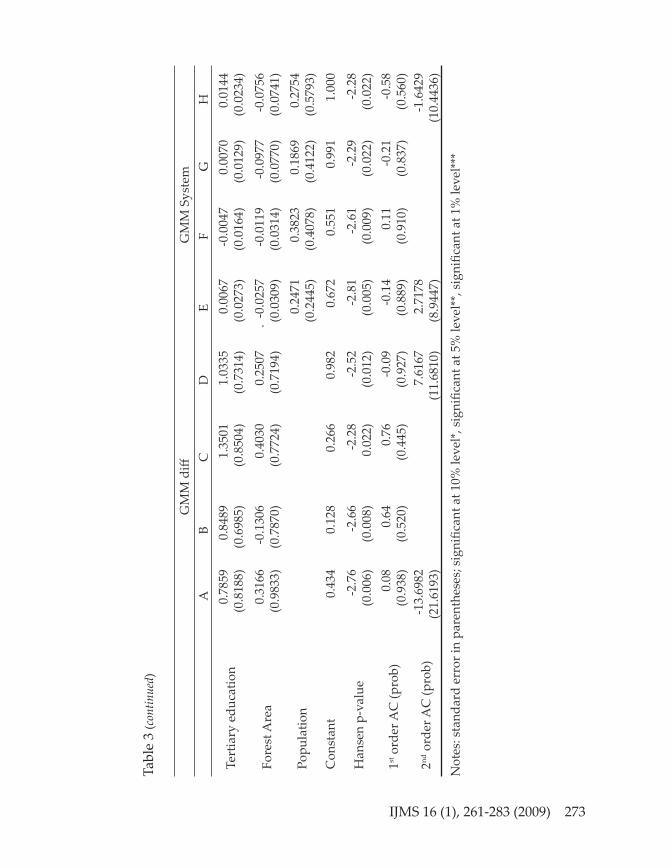
In order to test for the eff ects of ideological leaning on state government spending behaviour, the following variables (fi rst separately and then simultaneously) we introduced in the estimations: the number of seats (for each state) in the parliament won by the ruling party per capita, the percentage of state assembly seats won by the ruling party, and the number of votes obtained by the ruling party. The results are reported in Table 3. Again, both the GMM diff erence (column A to C) and GMM system estimator (column D to F) were used.
ww
w.ij
ms.
uum
.edu
.my
272 IJ MS 16 (1), 261-283 (2009)
Tabl
e 3:
The
Eff e
cts
of Id
eolo
gica
l Lea
ning
on
Stat
e G
over
nmen
ts’ E
xpen
ditu
re
GM
M d
iff G
MM
Sys
tem
AB
CD
EF
GH
Polit
ical
vrb
ls-1
3.69
82
(21.
6193
)7.
6167
(1
1.68
10)
2.71
78
(8.9
447)
-1.6
429
(10.
4436
)
seat
s cn
trl b
y BN
pc
-0.0
041
(0.0
088)
-0.0
009
(0.0
059)
-0.0
004
(0.0
029)
0.00
17
(0.0
028)
Vote
s ob
t by
BN
0.02
37
(0.0
286)
0.03
03*
(0.0
147)
0.00
09
(0.0
066)
-0.0
033
(0.0
058)
Stat
es s
eats
BN
Econ
omic
vrb
ls0.
5593
***
(0.1
685)
0.52
15**
* (0
.153
3)0.
4473
**
(0.1
800)
0.44
49**
(0
.165
0)0.
7929
***
(0.1
023)
0.83
23**
* (0
.125
2)0.
7372
***
(0.0
849)
0.76
53**
* (0
.126
1)
Reve
nue
-0.0
694
(0.1
469)
-0.1
079
(0.2
095)
0.01
16
(0.1
104)
-0.0
858
(0.1
934)
0.23
69**
* (0
.058
9)0.
2533
***
(0.0
679)
0.21
29**
(0
.074
2)0.
2038
**
(0.0
841)
Lagg
ed e
xp0.
0001
(0
.000
0)0.
0002
***
(0.0
0003
)0.
0013
***
(0.0
0003
)0.
0001
***
(0.0
0003
)0.
0000
3 (0
.000
02)
0.00
004*
(0
.000
02)
0.00
003
(0.0
0002
)0.
0000
3 (0
.000
02)
GD
P pe
r cap
ita
Soci
odem
o vr
bls
-0.0
608
(0.0
424)
-0.0
743
(0.0
469)
- -.0
7618
34**
.0
3329
36
-0.0
898*
(0
.047
2)0.
0026
**
(0.0
019)
0.00
35**
(0
.001
2)0.
0023
**
(0.0
007)
0.00
26**
* (0
.000
6)
Mal
ay p
rop
0.01
23
(0.0
081)
0.00
95*
(0.0
044)
0.00
88*
(0.0
048)
0.00
61
(0.0
071)
0.00
33
(0.0
025)
0.00
47
(0.0
031)
0.00
33*
(0.0
017)
0.00
27
(0.0
030)
Urb
an ra
te-0
.000
8 (0
.021
9)0.
0074
(0
.016
7)0.
0025
(0
.016
9)0.
0085
(0
.018
7)-0
.006
2 (0
.010
9)-0
.010
4 (0
.009
6)-0
.005
9 (0
.007
4)-.0
062
(0.0
126)
ww
w.ij
ms.
uum
.edu
.my
IJ MS 16 (1), 261-283 (2009) 273
GM
M d
iff G
MM
Sys
tem
AB
CD
EF
GH
Tert
iary
edu
catio
n0.
7859
(0.8
188)
0.
8489
(0
.698
5)1.
3501
(0
.850
4)1.
0335
(0
.731
4)0.
0067
(0
.027
3)
-0.0
047
(0.0
164)
0.0
070
(0.0
129)
0.01
44
(0.0
234)
Fore
st A
rea
0.31
66(0
.983
3)-0
.130
6 (0
.787
0)
0.40
30
(0.7
724)
0.25
07
(0.7
194)
. -0
.025
7 (0
.030
9)
-0.0
119
(0.0
314)
-0.
0977
(0
.077
0)-0
.075
6 (0
.074
1)
Popu
latio
n0.
2471
(0
.244
5)0.
3823
(0
.407
8)0.
1869
(0
.412
2)0.
2754
(0
.579
3)C
onst
ant
0.43
40.
128
0.26
60.
982
0.67
20.
551
0.99
11.
000
Han
sen
p-va
lue
-2.7
6 (0
.006
)-2
.66
(0.0
08)
-2.2
8 0.
022)
-2.5
2 (0
.012
)-2
.81
(0.0
05)
-2.6
1 (0
.009
)-2
.29
(0.0
22)
-2.2
8 (0
.022
)
1st o
rder
AC
(pro
b)0.
08
(0.9
38)
0.64
(0
.520
)0.
76
(0.4
45)
-0.0
9 (0
.927
)-0
.14
(0.8
89)
0.11
(0
.910
)-0
.21
(0.8
37)
-0.5
8 (0
.560
)
2nd o
rder
AC
(pro
b)-1
3.69
82
(21.
6193
)7.
6167
(1
1.68
10)
2.71
78
(8.9
447)
-1.6
429
(10.
4436
)
Not
es: s
tand
ard
erro
r in
pare
nthe
ses;
sig
nifi c
ant a
t 10%
leve
l*, s
ignifi c
ant a
t 5%
leve
l**,
sign
ifi ca
nt a
t 1%
leve
l***
Tabl
e 3
(con
tinue
d)ww
w.ij
ms.
uum
.edu
.my
274 IJ MS 16 (1), 261-283 (2009)
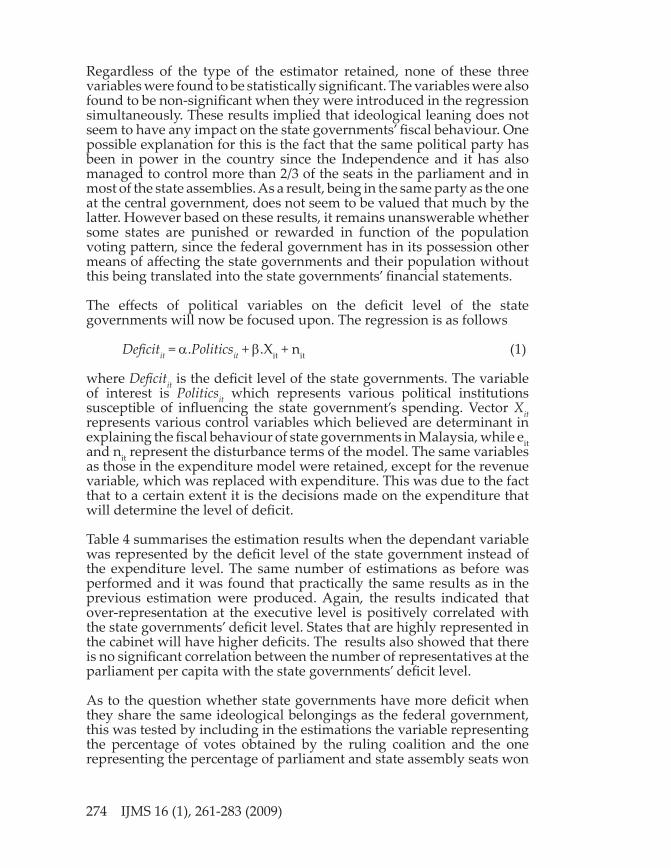
Regardless of the type of the estimator retained, none of these three variables were found to be statistically signifi cant. The variables were also found to be non-signifi cant when they were introduced in the regression simultaneously. These results implied that ideological leaning does not seem to have any impact on the state governments’ fi scal behaviour. One possible explanation for this is the fact that the same political party has been in power in the country since the Independence and it has also managed to control more than 2/3 of the seats in the parliament and in most of the state assemblies. As a result, being in the same party as the one at the central government, does not seem to be valued that much by the latt er. However based on these results, it remains unanswerable whether some states are punished or rewarded in function of the population voting patt ern, since the federal government has in its possession other means of aff ecting the state governments and their population without this being translated into the state governments’ fi nancial statements.
The eff ects of political variables on the defi cit level of the state governments will now be focused upon. The regression is as follows
Defi citit = α.Politicsit + β.Xit + nit (1)
where Defi citit is the defi cit level of the state governments. The variable of interest is Politicsit which represents various political institutions susceptible of infl uencing the state government’s spending. Vector Xit represents various control variables which believed are determinant in explaining the fi scal behaviour of state governments in Malaysia, while eit and nit represent the disturbance terms of the model. The same variables as those in the expenditure model were retained, except for the revenue variable, which was replaced with expenditure. This was due to the fact that to a certain extent it is the decisions made on the expenditure that will determine the level of defi cit.
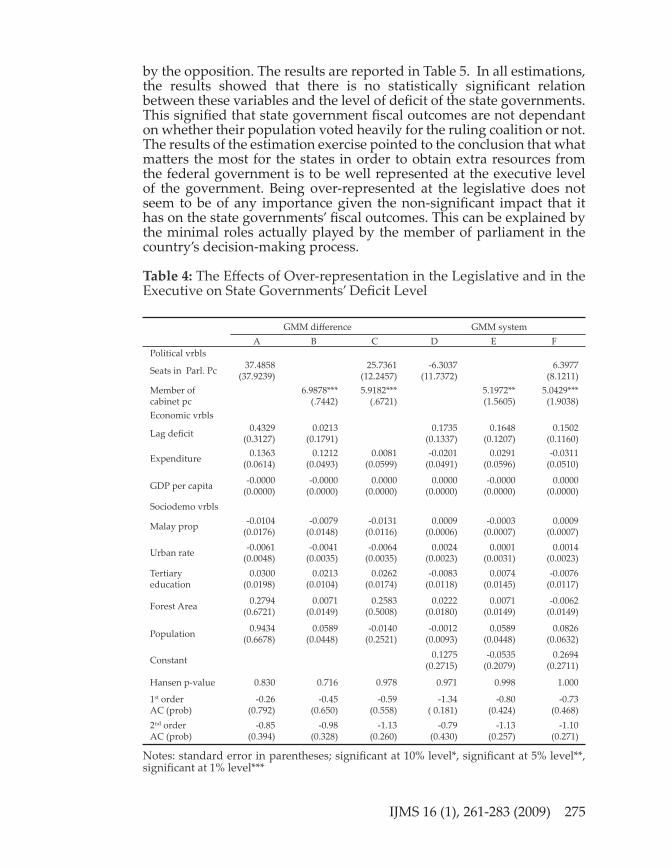
Table 4 summarises the estimation results when the dependant variable was represented by the defi cit level of the state government instead of the expenditure level. The same number of estimations as before was performed and it was found that practically the same results as in the previous estimation were produced. Again, the results indicated that over-representation at the executive level is positively correlated with the state governments’ defi cit level. States that are highly represented in the cabinet will have higher defi cits. The results also showed that there is no signifi cant correlation between the number of representatives at the parliament per capita with the state governments’ defi cit level.
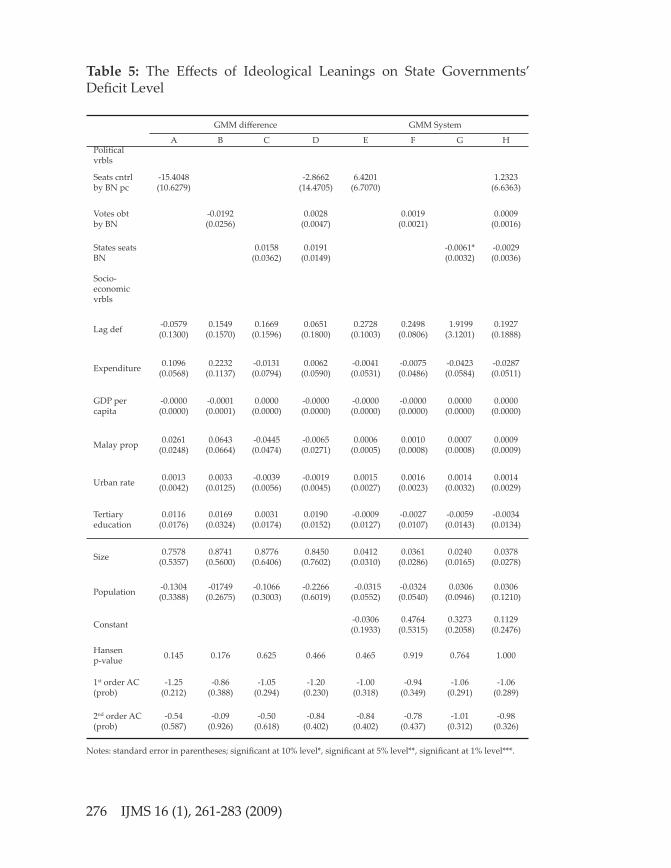
As to the question whether state governments have more defi cit when they share the same ideological belongings as the federal government, this was tested by including in the estimations the variable representing the percentage of votes obtained by the ruling coalition and the one representing the percentage of parliament and state assembly seats won
ww
w.ij
ms.
uum
.edu
.my
IJ MS 16 (1), 261-283 (2009) 275
by the opposition. The results are reported in Table 5. In all estimations, the results showed that there is no statistically signifi cant relation between these variables and the level of defi cit of the state governments. This signifi ed that state government fi scal outcomes are not dependant on whether their population voted heavily for the ruling coalition or not. The results of the estimation exercise pointed to the conclusion that what matt ers the most for the states in order to obtain extra resources from the federal government is to be well represented at the executive level of the government. Being over-represented at the legislative does not seem to be of any importance given the non-signifi cant impact that it has on the state governments’ fi scal outcomes. This can be explained by the minimal roles actually played by the member of parliament in the country’s decision-making process.
Table 4: The Eff ects of Over-representation in the Legislative and in the Executive on State Governments’ Defi cit Level
GMM diff erence GMM systemA B C D E F
Political vrbls
Seats in Parl. Pc 37.4858 (37.9239)
25.7361 (12.2457)
-6.3037 (11.7372)
6.3977 (8.1211)
Member of cabinet pc
6.9878*** (.7442)
5.9182*** (.6721)
5.1972** (1.5605)
5.0429*** (1.9038)
Economic vrbls
Lag defi cit 0.4329 (0.3127)
0.0213 (0.1791)
0.1735 (0.1337)
0.1648 (0.1207)
0.1502 (0.1160)
Expenditure 0.1363 (0.0614)
0.1212 (0.0493)
0.0081 (0.0599)
-0.0201 (0.0491)
0.0291 (0.0596)
-0.0311 (0.0510)
GDP per capita -0.0000 (0.0000)
-0.0000 (0.0000)
0.0000 (0.0000)
0.0000 (0.0000)
-0.0000 (0.0000)
0.0000 (0.0000)
Sociodemo vrbls
Malay prop -0.0104 (0.0176)
-0.0079 (0.0148)
-0.0131 (0.0116)
0.0009 (0.0006)
-0.0003 (0.0007)
0.0009 (0.0007)
Urban rate -0.0061 (0.0048)
-0.0041 (0.0035)
-0.0064 (0.0035)
0.0024 (0.0023)
0.0001 (0.0031)
0.0014 (0.0023)
Tertiary education
0.0300 (0.0198)
0.0213 (0.0104)
0.0262 (0.0174)
-0.0083 (0.0118)
0.0074 (0.0145)
-0.0076 (0.0117)
Forest Area 0.2794 (0.6721)
0.0071 (0.0149)
0.2583 (0.5008)
0.0222 (0.0180)
0.0071 (0.0149)
-0.0062 (0.0149)
Population 0.9434 (0.6678)
0.0589 (0.0448)
-0.0140 (0.2521)
-0.0012 (0.0093)
0.0589 (0.0448)
0.0826 (0.0632)
Constant 0.1275 (0.2715)
-0.0535 (0.2079)
0.2694 (0.2711)
Hansen p-value 0.830 0.716 0.978 0.971 0.998 1.000
1st order AC (prob)
-0.26 (0.792)
-0.45 (0.650)
-0.59 (0.558)
-1.34 ( 0.181)
-0.80 (0.424)
-0.73 (0.468)
2nd order AC (prob)
-0.85 (0.394)
-0.98(0.328)
-1.13 (0.260)
-0.79 (0.430)
-1.13 (0.257)
-1.10 (0.271)
Notes: standard error in parentheses; signifi cant at 10% level*, signifi cant at 5% level**, signifi cant at 1% level***
ww
w.ij
ms.
uum
.edu
.my
276 IJ MS 16 (1), 261-283 (2009)
Table 5: The Eff ects of Ideological Leanings on State Governments’ Defi cit Level
GMM diff erence GMM System
A B C D E F G HPolitical vrbls
Seats cntrl by BN pc
-15.4048 (10.6279)
-2.8662 (14.4705)
6.4201 (6.7070)
1.2323 (6.6363)
Votes obt by BN
-0.0192 (0.0256)
0.0028 (0.0047)
0.0019 (0.0021)
0.0009 (0.0016)
States seats BN
0.0158 (0.0362)
0.0191 (0.0149)
-0.0061* (0.0032)
-0.0029 (0.0036)
Socio-economic vrbls
Lag def -0.0579 (0.1300)
0.1549 (0.1570)
0.1669 (0.1596)
0.0651 (0.1800)
0.2728 (0.1003)
0.2498 (0.0806)
1.9199 (3.1201)
0.1927 (0.1888)
Expenditure 0.1096 (0.0568)
0.2232 (0.1137)
-0.0131 (0.0794)
0.0062 (0.0590)
-0.0041 (0.0531)
-0.0075 (0.0486)
-0.0423 (0.0584)
-0.0287 (0.0511)
GDP per capita
-0.0000 (0.0000)
-0.0001 (0.0001)
0.0000 (0.0000)
-0.0000 (0.0000)
-0.0000 (0.0000)
-0.0000 (0.0000)
0.0000 (0.0000)
0.0000 (0.0000)
Malay prop 0.0261 (0.0248)
0.0643 (0.0664)
-0.0445 (0.0474)
-0.0065 (0.0271)
0.0006 (0.0005)
0.0010 (0.0008)
0.0007 (0.0008)
0.0009 (0.0009)
Urban rate 0.0013 (0.0042)
0.0033 (0.0125)
-0.0039 (0.0056)
-0.0019 (0.0045)
0.0015 (0.0027)
0.0016 (0.0023)
0.0014 (0.0032)
0.0014 (0.0029)
Tertiary education
0.0116 (0.0176)
0.0169 (0.0324)
0.0031 (0.0174)
0.0190 (0.0152)
-0.0009 (0.0127)
-0.0027 (0.0107)
-0.0059 (0.0143)
-0.0034 (0.0134)
Size 0.7578 (0.5357)
0.8741 (0.5600)
0.8776 (0.6406)
0.8450 (0.7602)
0.0412 (0.0310)
0.0361 (0.0286)
0.0240 (0.0165)
0.0378 (0.0278)
Population -0.1304 (0.3388)
-01749 (0.2675)
-0.1066 (0.3003)
-0.2266 (0.6019)
-0.0315 (0.0552)
-0.0324 (0.0540)
0.0306 (0.0946)
0.0306 (0.1210)
Constant -0.0306 (0.1933)
0.4764 (0.5315)
0.3273 (0.2058)
0.1129 (0.2476)
Hansen p-value 0.145 0.176 0.625 0.466 0.465 0.919 0.764 1.000
1st order AC (prob)
-1.25 (0.212)
-0.86 (0.388)
-1.05 (0.294)
-1.20 (0.230)
-1.00 (0.318)
-0.94 (0.349)
-1.06 (0.291)
-1.06 (0.289)
2nd order AC (prob)
-0.54 (0.587)
-0.09 (0.926)
-0.50 (0.618)
-0.84 (0.402)
-0.84 (0.402)
-0.78 (0.437)
-1.01 (0.312)
-0.98 (0.326)
Notes: standard error in parentheses; signifi cant at 10% level*, signifi cant at 5% level**, signifi cant at 1% level***.
ww
w.ij
ms.
uum
.edu
.my
IJ MS 16 (1), 261-283 (2009) 277
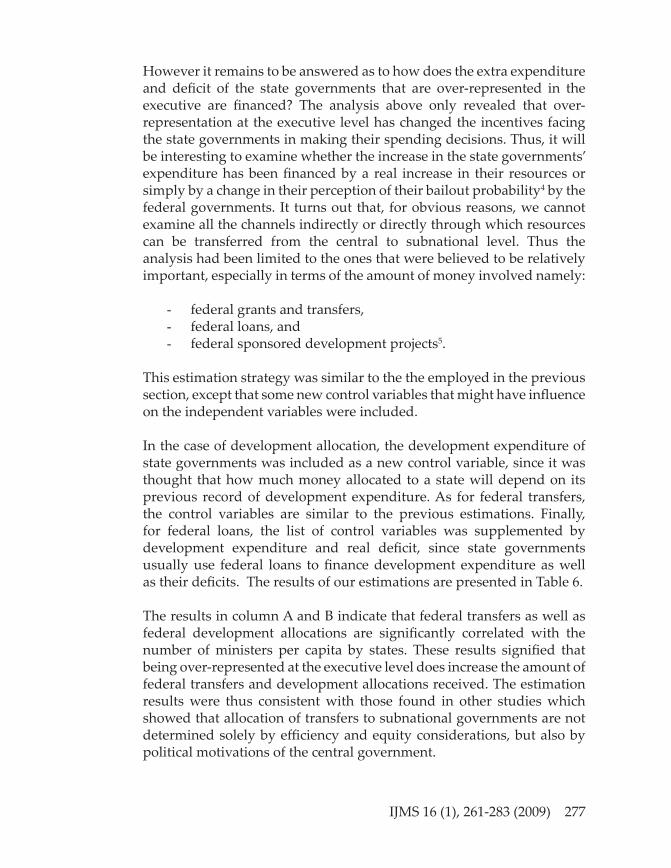
However it remains to be answered as to how does the extra expenditure and defi cit of the state governments that are over-represented in the executive are fi nanced? The analysis above only revealed that over-representation at the executive level has changed the incentives facing the state governments in making their spending decisions. Thus, it will be interesting to examine whether the increase in the state governments’ expenditure has been fi nanced by a real increase in their resources or simply by a change in their perception of their bailout probability4 by the federal governments. It turns out that, for obvious reasons, we cannot examine all the channels indirectly or directly through which resources can be transferred from the central to subnational level. Thus the analysis had been limited to the ones that were believed to be relatively important, especially in terms of the amount of money involved namely:
- federal grants and transfers,- federal loans, and- federal sponsored development projects5.
This estimation strategy was similar to the the employed in the previous section, except that some new control variables that might have infl uence on the independent variables were included.
In the case of development allocation, the development expenditure of state governments was included as a new control variable, since it was thought that how much money allocated to a state will depend on its previous record of development expenditure. As for federal transfers, the control variables are similar to the previous estimations. Finally, for federal loans, the list of control variables was supplemented by development expenditure and real defi cit, since state governments usually use federal loans to fi nance development expenditure as well as their defi cits. The results of our estimations are presented in Table 6.
The results in column A and B indicate that federal transfers as well as federal development allocations are signifi cantly correlated with the number of ministers per capita by states. These results signifi ed that being over-represented at the executive level does increase the amount of federal transfers and development allocations received. The estimation results were thus consistent with those found in other studies which showed that allocation of transfers to subnational governments are not determined solely by effi ciency and equity considerations, but also by political motivations of the central government.
ww
w.ij
ms.
uum
.edu
.my
278 IJ MS 16 (1), 261-283 (2009)
Table 6: The Eff ects of Political Factors on Several Federal Funds Allocations
ADevel. Allocations
BFederal Transfers
CFederal Loans
Cabinet 0.00012**(0.00005)
0.00098*(0.00049)
-0.00308 ** (0.00107)
Parliment seats -0.00021(0.00022)
0.00277(0.00190)
-0.01759 *** (0.00570)
Votes by BN 0.00001(0.00001)
0.00049(0.00069)
0.00168 (0.00134)
Year before election -0.00015*(0.00008)
0.00128(0.00283)
0.00330 (0.01624)
Lagged depdt. Vrbl 0.44807**(0.15181)
0.93862*** (0.01890)
Real defi cit -0.00039** (0.00017)
Real current exp 2.21e-07(1.98e-06)
Development exp 0.00007(0.00019)
0.03562 (0.02426)
GDP -8.55e-06(6.45e-06)
-0.00011(0.00008)
-0.00025 (0.00019)
Urban 0.00008***(0.00002)
0.00014(0.00018)
-0.00173 (0.00117)
Population -0.00906*** (0.00188)
0.00724(0.01359)
-0.07963 ** (0.02967)
Size 1.61e-08(1.64e-08)
-6.80e-08(2.52e-07)
2.41e-08 (1.01e-06)
Constant 0.06991***(0.01474)
-0.07314(0.10622)
0.47686 (0.31420)
Sargan p-value 1.000 1.000 1.000
2nd order AC (prob) 1.14(0.256) 0.91(0.361) -0.47(0.639)Notes: standard error in parentheses; signifi cant at 10% level*, signifi cant at 5% level**, signifi cant at 1% level***.
Surprisingly, contrary to expectations, a negative correlation between cabinet members per capita and level of borrowings was found, which signifi ed that an over-representation in the executive level leads to a decrease in the amount of federal borrowing by the state government. It was also found that there as a signifi cant negative correlation between representation in parliament and level of borrowing. Similar results were
ww
w.ij
ms.
uum
.edu
.my
IJ MS 16 (1), 261-283 (2009) 279
obtained when the growth of federal loans as the independent variable was used instead. One possible explanation for this is that cabinet members as well as the members of parliament may be pressured by the minister of fi nance in order for their states of origin to sett le their loans with the government, and the state government will in turn be pressured by their representatives at the cabinet and the legislature to pay back their loans. As a result, the higher a state is represented at these two institutions, the higher the amount of their loan sett lement, thus the lower their outstanding loans. Besides, it can be argued that since federal loans are usually used for specifi c development projects, they will not have much impact on the expenditure decisions of the state government.
CONCLUSION
The main objective in this paper was to examine whether state governments’ fi scal behaviour in Malaysia can be explained by political and institutional factors. More precisely, it was analysed to see whether state governments that are highly represented at the legislative and executive levels are more likely to have higher expenditure. The eff ects of partisanship on the state government expenditure was also analysed.
The estimation results showed that states that are over-represented at the executive level tend to have higher spending and defi cits. However, there was not any correlation between over-representation at the parliament and state governments’ fi scal outcomes. This can be explained by the fact that in Malaysia, as is frequently the case in developing nations, the legislature is peripheral to the executive in terms of decision-making power. Indeed, not only that, the cabinet members initiated all of the bills tabled in the parliament and thus, they usually have no problem in pushing through their proposals.
The results also showed that ideological belonging does not have any impact on the state governments’ level of expenditure and defi cit. There was not any signifi cant correlation between the level of support won by the ruling party in state elections and the level of the state governments’ expenditure and defi cit. However, these results cannot be interpreted as proof that no states have been victimised because of their support for the opposition since anecdotal evidences clearly show to the contrary. Rather, it is believed that since in the period of study the practice of discrimination has been limited to at most two states at a time, it may not be signifi cant enough to be captured by the empirical analysis.
ww
w.ij
ms.
uum
.edu
.my
280 IJ MS 16 (1), 261-283 (2009)
This study also looked into the question of the mechanisms which the state governments used in order to fi nance their extra expenditure and defi cit. The results found that the amount of federal grants and federal development allocations are signifi cantly correlated with the number of cabinet per capita by states. This signifi ed that higher levels of expenditure and defi cit of the state governments that are over-represented in the executive level are partly fi nanced by the higher amount of federal transfers and development allocations that they receive from the federal government
The policy implication of this study is that any formal rules that may be introduced by the government in order to regulate fi scal relations in federations will not have a substantial impact on subnational governments’ fi scal outcomes if political incentives allow and encourage circumventing these rules. One potential avenue of future investigation is to further explore the role of political institutions and electoral rules. This may provide insight into whether these institutions can be changed to provide bett er incentives for fi scal prudence, or how other institutional rules can be designed to be impervious to political manipulations.
ENDNOTES
1. According to William Safi re (Safi re, 1978, p.553), the phrase pork barrel was “probably derived from the pre-Civil War practice of periodically distributing salt pork to the slaves from huge barrels”. He noted that in a 1919 issue of the National Civic Review, C.C. Maxey wrote “oft entimes the eagerness of the slaves would result in a rush upon the pork barrel, in which each would strive to grab as much as possible for himself. Members of Congress in the stampede to get their local appropriation items into the Omnibus River and harbor bills behaved so much like Negro slaves rushing to the pork barrel that these bills were facetiously styled pork barrel bills and the system which originated them has thus become known as the pork barrel system.”
2. Lowi (1964) classifi ed domestic policy as either “distributive”, “redistributive”, or “regulatory”.
3. Weingast et al. (1981) wrote that “while it is clear that all policies have a geographic incidence of benefi ts and costs, what distinguishes a distributive policy is that benefi ts are geographically targeted...
ww
w.ij
ms.
uum
.edu
.my
IJ MS 16 (1), 261-283 (2009) 281
geography is the hallmark of distributive politics: programs and projects are geographically targeted, geographically fashioned, and may be independently varied. Importantly, geography is also the basis for political organization and representation”.
4. It is plausible to conceive a situation where no extra resources at all have been channeled to the state governments. This is notably the case when a minister from a particular state has stood up with success for the cause of his constituent when the latt er is in a confl ictual situation with the rest of the country. This will then give the impression to the state government that its cause is well defended at the federal level, and this will in some cases lead the state government to be less fi scally responsible as they believe that in case of a problem, the central government will not hesitate to help.
5. The link between an increase of development allocation received by states to an increase in their expenditure and eventually their level of defi cit may not seem as obvious as the one between federal transfers and loans, and the state governments’ fi scal outcomes. It can be argued however that by having more federal sponsored development projects, state governments will be able to decrease their own development expenditure and using this extra money on other posts of expenditure that may otherwise be cancelled due to lack of funds. It can also be argued that some development projects may require some fi nancial participation by the state governments; expenditure that may not have existed if there had been no projects. Besides, since development projects’ main objective is to develop the states, it can be expected that in the future, some fi nancial benefi ts can be reaped by the state governments notably in the form of higher taxes. It is in expectation of this future increase of income that state governments increase their current expenditure.
REFERENCES
Ansolabehere, S., & Snyder, J.M. (2003). Party control of state government and the distribution of public expenditures. Unpublished paper, Departments of Political Science and Economics, Massachusett s Institute of Technology.
Arellano, M., & Bond, S. (1991). Some tests of specifi cation for Panel Data: Monte Carlo evidence and an application to employment equations. Review of Economic Studies, 58(2), 277-297.
ww
w.ij
ms.
uum
.edu
.my
282 IJ MS 16 (1), 261-283 (2009)
Arellano, M., & Bover, O. (1995). Another look at the instrumental variable estimation of error-components models. Journal of Econometrics, 68(1), 29-51.
Balla, S. J., Lawrence, E. D., Maltzman, F., & Sigelman, L. (2002). Partisanship, blame avoidance, and the distribution of legislative pork. American Journal of Political Science, 46, 515–25.
Bellefl amme, P., & Hindriks, J. (2003). Yardstick competition and political agency problems. Social Choice and Welfare, 24(1), 155-69.
Besley, T., & Coate, S. (2003). Centralised versus decentralised provision of local public goods: A political economy approach. Journal of Public Economics, 87, 2611-37.
Bordignon M., Cerniglia, F., & Revelli, F. (2004). Yardstick competition in intergovernmental relationships: Theory and empirical predictions. Economics Lett ers, 83, 325-33.
Bickers, K.N., & Stein, R.M. (1996). The electoral dynamics of the federal pork barrel. American Journal of Political Science, 40(4), 1300–25.
Case, A. (2001). Election goals and income redistribution: Recent evidence from Albania. European Economic Review, 45, 405–23.
Cox, G.W., & McCubbins, M.D. (1986). Electoral politics as a redistributive game. Journal of Politics, 48, 370–89.
Crisp, B., & Ingall, R.E. (2002). Institutional engineering and the nature of representation: Mapping the eff ects of electoral reform in Colombia. American Journal of Political Science, 46(4), 733–48.
Dahlberg, M., & Johansson, E. (2002). On the vote-purchasing behavior of incumbent governments, American Political Science Review, 96(1), 27–40.
Diaz-Cayeros, A., Magaloni, B., & Weingast, B. (2000). Federalism and democratisation in Mexico. Paper presented at the Annual Meeting of the American Political Science Association, Washington, D.C.
Dixit, A., & Londregan, J. (1996). The determinants of success of special interests in redistributive politics. Journal of Politics, 58(4), 1132–55.
Heller, P.S., & Diamond, J. (1990). International comparisons of government expenditure revisited: The developing countries, 1975-86. IMF Occasional Paper 69.
Herron, M.C., & Theodos, B.A. (2004). Government redistribution in the shadow of legislative elections: A study of the Illinois member initiative grants programme. Legislative Studies Quarterly, 29(2), 287–311.
Hindriks, J., & Lockwood, B. (2005). Decentralisation and political accountability: Incentives, separation and voter welfare. CEPR Discussion Paper, 5125.
Horiuchi, Y., & Lee, S. (2004). Regionalism and redistribution in South Korea. Paper presented at the Annual Meeting of the Australasian Political Studies Association, Adelaide.
ww
w.ij
ms.
uum
.edu
.my
IJ MS 16 (1), 261-283 (2009) 283
Levitt , S.D., & Snyder, J.M. (1995). Political parties and the distribution off ederal outlays. American Journal of Political Science, 39(4), 958–80.
Lowi, T. (1964). American business, public policy, case studies and political theory. World Politics, 16, 677-715.
Milesi-Ferett i, G.M, Perott i, R., & Rostagno, M. (2001) Electoral systems and public spending. IMF Working Paper WP/01/22.
Persson, T., & Tabellini, G. (2000). Political economics: Explaining economic policy. Cambrigde: MIT Press.
Mueller, D.C. (2003). Public choice III. New York: Cambridge University Press.
Ram, R. (1987). Wagner’s hypothesis in time-series and cross-cection perspectives: Evidence from real data for 115 countries. The Review of Economics and Statistics, 69, 194-204.
Rodden, J. (2005). The political economy of federalism. In Weingast B. & D. Witt man (Eds). Oxford Handbook of Political Economy. London: Oxford University Press.
Rodden, J., & Arretche, M. (2004). Legislative bargaining and distributive politics in Brazil: An empirical approach. Unpublished paper, MIT.
Safi re, W. (1978). Safi re’s political dictionary. New York: Random House. Snyder, J. (1989). Election goals and the allocation of campaign resources.
Econometrica, 57, 637-60.Weingast B.R., Shepsle, K.A., & Johnsen, C. (1981). The political economy
of benefi ts and costs: A neoclassical approach to distributive policies. Journal of Political Economy, 89, 642-664.
ww
w.ij
ms.
uum
.edu
.my
Top Related