


Languages
Pages
Legal

THE PHOTOVOLTAIC THE PHOTOVOLTAIC TECHNOLOGY TECHNOLOGY
Ing. S. [email protected]
ENEA, Renewable Sources Sector
July 2006
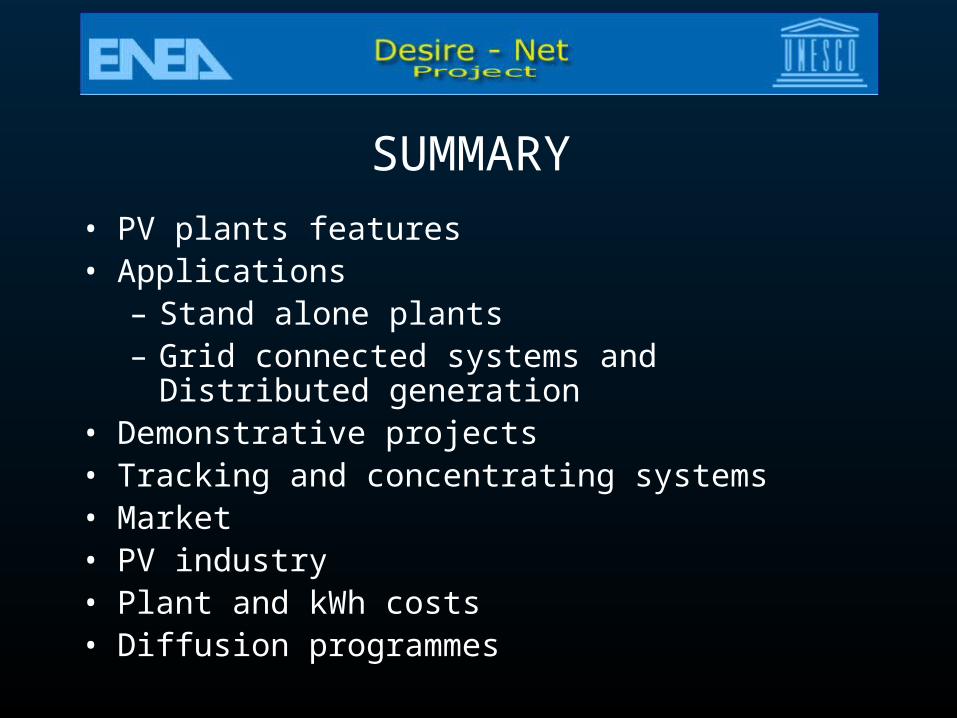
SUMMARY
• PV plants features• Applications
– Stand alone plants– Grid connected systems and Distributed
generation• Demonstrative projects• Tracking and concentrating systems• Market• PV industry• Plant and kWh costs• Diffusion programmes
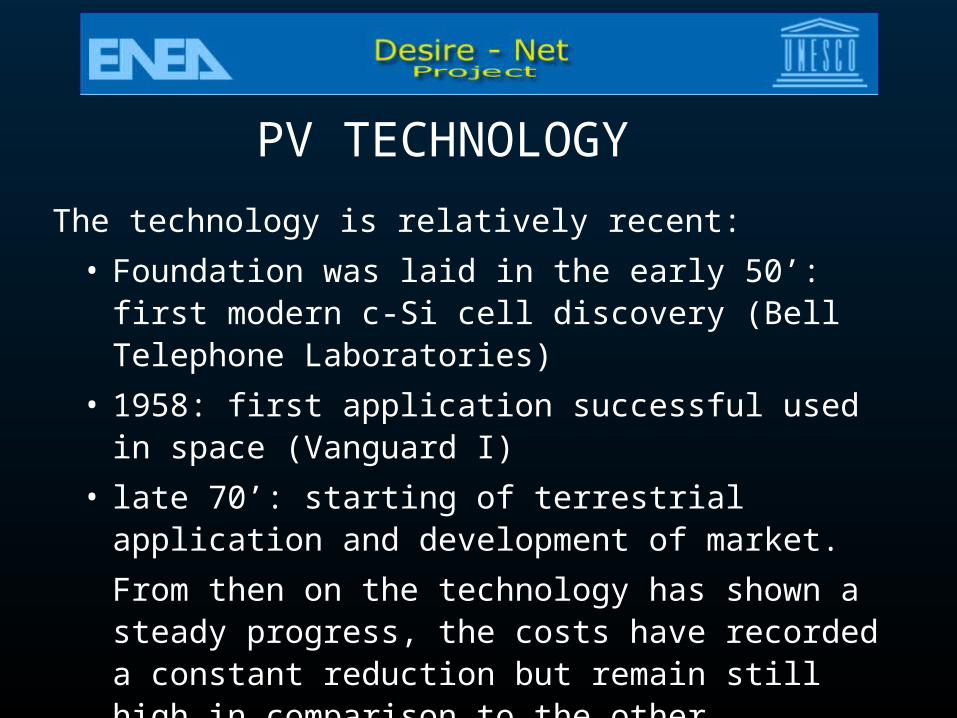
The technology is relatively recent:
• Foundation was laid in the early 50’: first modern c-Si cell discovery (Bell Telephone Laboratories)
• 1958: first application successful used in space (Vanguard I)
• late 70’: starting of terrestrial application and development of market.
From then on the technology has shown a steady progress, the costs have recorded a constant reduction but remain still high in comparison to the other renewable sources
PV TECHNOLOGY

PV ENERGY ADVANTAGES• Use of an inexhaustible and free fuel • Environmentally friendly• Good reliability, higher than wind turbines or diesel
– lasts more than 30 years – low maintenance cost
• Fully automated operation• Low risk
– capital intensive but low O&M costs• Modularity
– the required power is obtained using a number of the same building blocks
• Exploitation of not utilized surfaces capability
– PV can be mounted on roofs, integrated in building skin or installed in marginal areas (deserts)
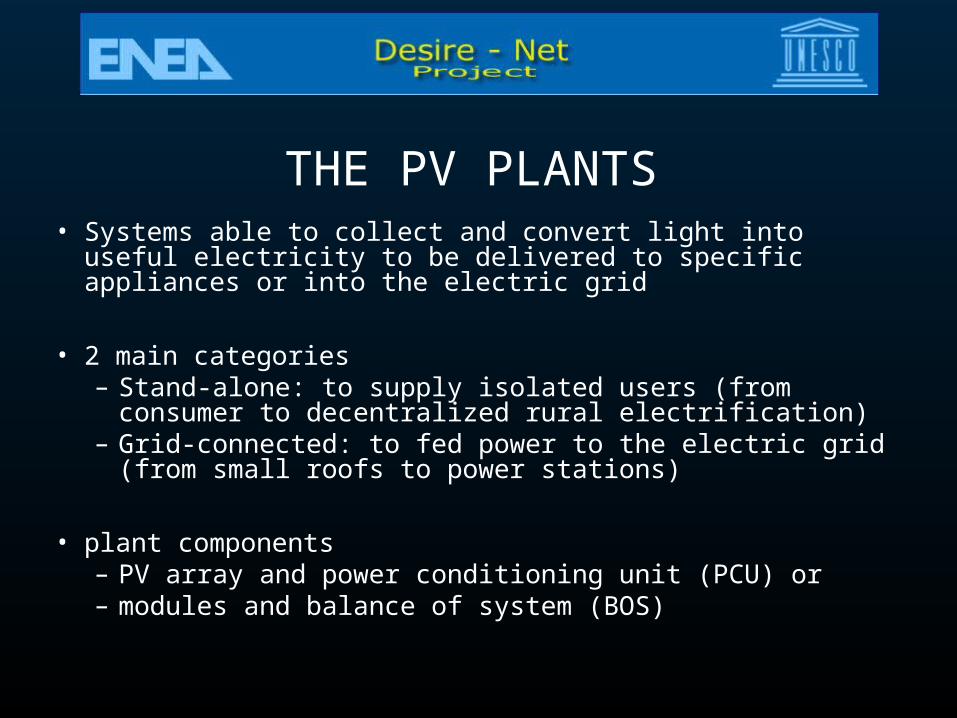
THE PV PLANTS• Systems able to collect and convert light into useful electricity
to be delivered to specific appliances or into the electric grid
• 2 main categories– Stand-alone: to supply isolated users (from consumer to
decentralized rural electrification)– Grid-connected: to fed power to the electric grid (from
small roofs to power stations)
• plant components– PV array and power conditioning unit (PCU) or– modules and balance of system (BOS)

THE COMPONENTS• PV array (Pnom, Vw)
– A number of PV modules– Cables and protection devices– Structure (to support and to expose the module for maximum
light capture) • PCU
– Stand-alone plants• Matches the array output to the load requirements• Manages the storage system
– Grid-connected plants• Convert the dc array output to standard ac power• Fit the PV array output to the grid (MPPT)• Control the quality of the energy supplied to the grid
(distortion and power factor correction)
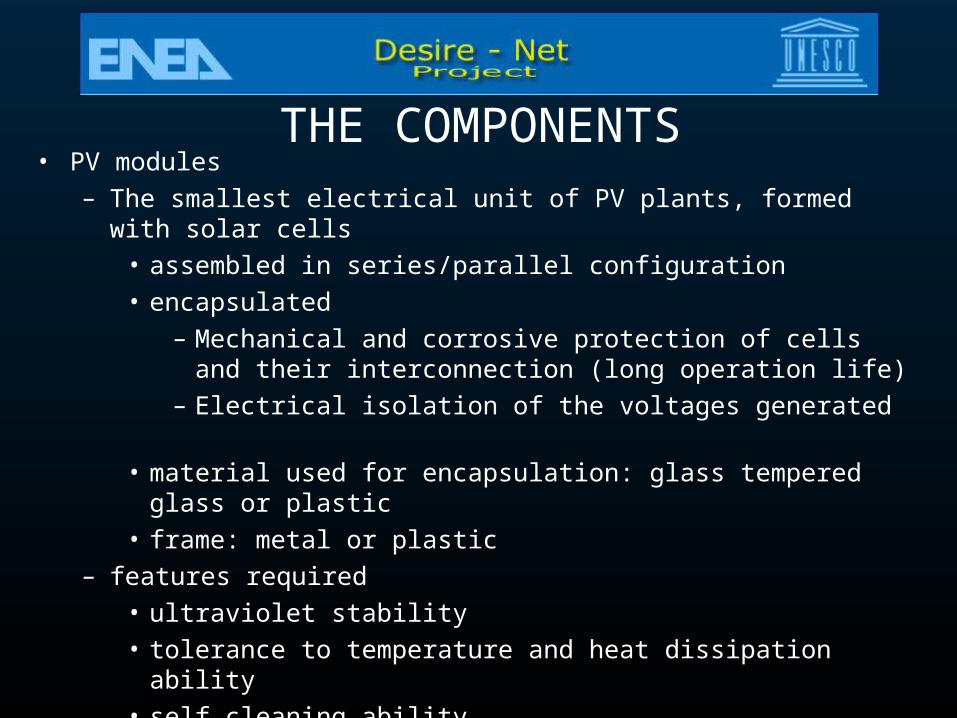
THE COMPONENTS• PV modules
– The smallest electrical unit of PV plants, formed with solar cells • assembled in series/parallel configuration• encapsulated
– Mechanical and corrosive protection of cells and their interconnection (long operation life)
– Electrical isolation of the voltages generated
• material used for encapsulation: glass tempered glass or plastic• frame: metal or plastic
– features required• ultraviolet stability• tolerance to temperature and heat dissipation ability• self cleaning ability

THE COMPONENTS
• BOS– Cabling– Switching and protection devices– Battery– Charge controller– Dc/ac inverter– Module supporting structures– Engineering– Labour to install a turn-key system
STAND ALONE PLANTS
• When well suited:– Remote site far from the grid– Maintenance and fuel expensive (transport)– Reliability is paramount (tlc, signaling)– Simplicity required (remote houses, schools)– Transportability (navigation laps, laptop computers)– Intermittent power acceptable (fans, pumps)– Noise and pollution-sensitive environments (parks)– Reducing fuel consumption (small grids)

STAND ALONE PLANTS• Already competitive with diesel generator for load lower than
few kWh/day• Preferred option for high value applications• Key technology for off-grid application, but further decrease
of cost is essential to facilitate their use• Costs higher then grid connected systems (batteries) but
already with its own nicks market• Applications:
– Domestic– Industrial– Electrification in Developing Countries

DOMESTIC APPLICATIONS• Remote users (economic alternative to utility grid at distance > 1 – 2 km)
– Rural electrification (0,5 – 1,5 kW). light, refrigeration and other low power loads
– Lighting of isolated areas with PV lamps (100 W) or centralized systems (1-10kW)
• Consumer– Watches, calculators (mW), lamps (10 W)

INDUSTRIAL APPLICATIONS • First terrestrial high value applications (PV costs negligible in comparison to the
service provided) • Competitive with other small generating systems
– Telecommunication 0,5 – 10 kW– Cathodic protection 0,5 – 5 kW– Signaling and data acquisition 0,1 – 1 kW– Park-meter or Emergency telephones (highway) 10 – 20 W

ELECTRIFICATION IN DEVELOPING COUNTRIES• 1.7 billion people is aimed to:
– Basic needs: refrigeration and lighting for sanitary use, potable water– Quality of live improvement: lighting in houses streets and schools,
telephone, radio and TV services– Small scale economic development: water for irrigation and livestock,
motorization for small craft and mills
IEA Source

SMALL STAND ALONE PLANTS
PV MODULES
DC LOADS
CHARGE CONTROLLER
BATTERY
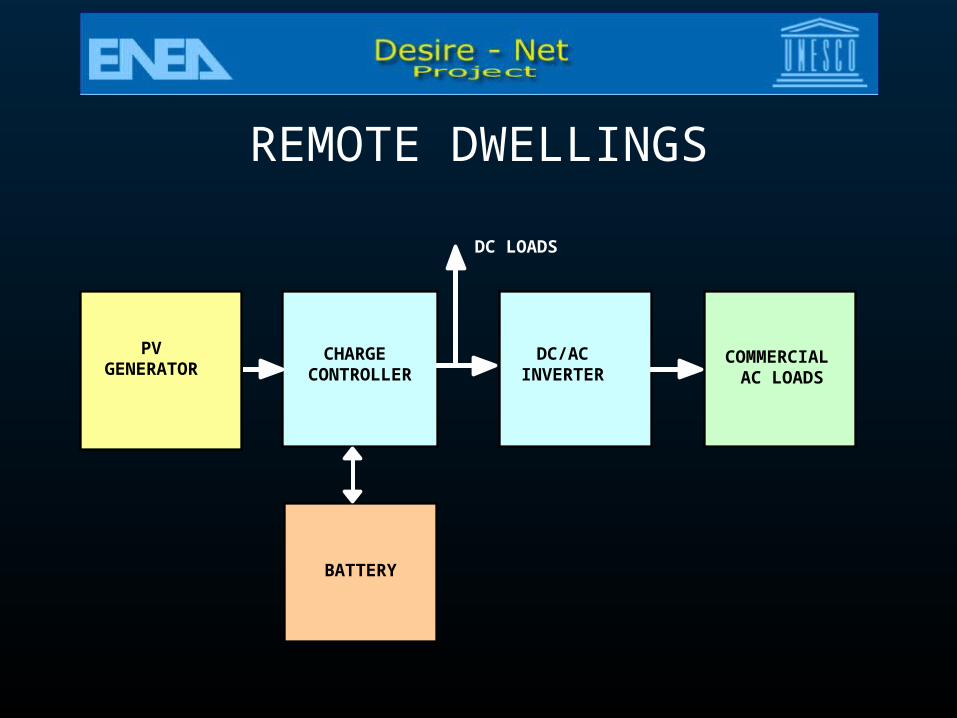
REMOTE DWELLINGS
GENERATOR
CHARGE CONTROLLER
DC/ACINVERTER
PVGENERATOR
BATTERY
COMMERCIAL AC LOADS
DC LOADS

VILLAGE ELECTRIFICATION
GENERATOR
CHARGE CONTROLLER
DC/ACINVERTER
PVGENERATORE
BATTERY RECTIFIER
DIESEL
LOADS

WATER PUMPING
GENERATOR
PUMP(CENTRIFUGAL
OR RECIPROCATING)
DC/ACINVERTER
(FREQUENCY VARIABLE)
PVGENERATORE
CATTLE WATERING
TANK
SPRINK
TANK
GENERATOR
DC PUMP
PVGENERATORE
WATER

GRID CONNECTED SYSTEMS• Not competitive yet, but potentially able to make a substantial contribution
to sustainable electricity production in industrialized countries.
• Applications: – Diffuse generation 1 – 50 kW– Power stations > 1 MW– Grid support (weak feeder lines) 0,5 – 2 MW– Small grid support (islands) 100 – 500 kW
DC/ACINVERTER
PVGENERATORE
LOADS
GRID
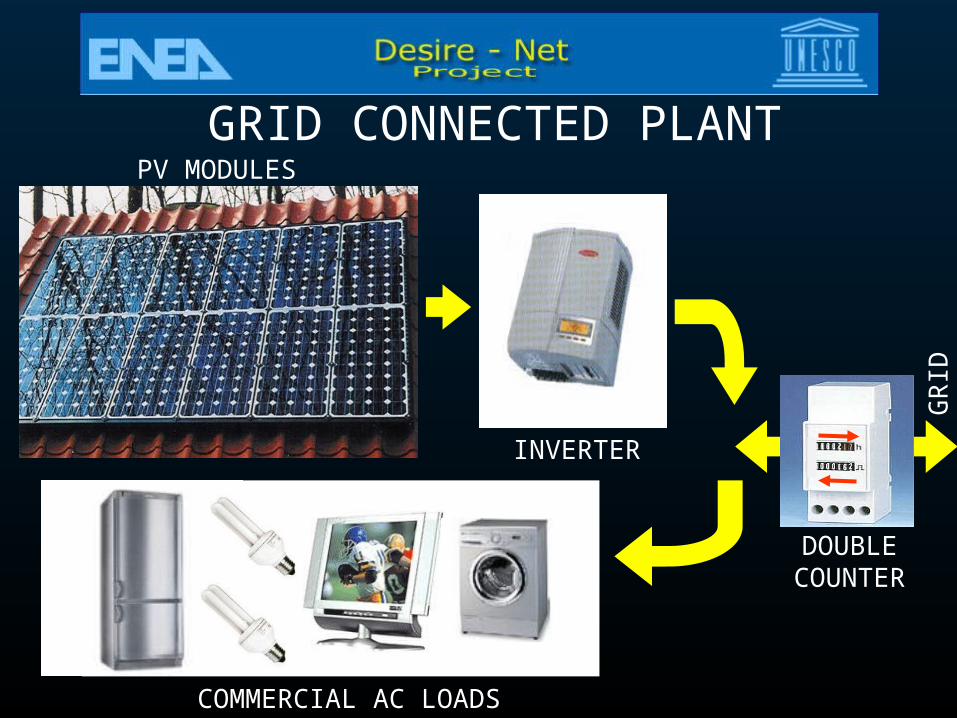
GRID CONNECTED PLANTPV MODULES
DOUBLECOUNTER
COMMERCIAL AC LOADS
INVERTER
GR
ID

DISTRIBUTED GENERATION
• Small size plants (1 – 50 kW) connected to the LV grid (without battery)• Suited to be installed on buildings or other infrastructures (absence of
noise, moving parts, emissions)• Huge potential: south oriented roofs covered with PV could supply
electricity needs in many countries. • PV energy cost: still double with respect to the electricity cost paid by
users

DISTRIBUTED GENERATION ADVANTAGES
– Distributed exploitation of a diffused source– Production at the place of utilization (transmission
losses avoided)– Easy grid connection (battery)– User contribution in technology diffusion– Promotion of energy saving and more efficient
appliance– Exploitation of not utilized surfaces – Positive architectural valence in the urban contest– Possibility to combine energy production with building
envelop functions (saving of traditional building components)
DISTRIBUTED GENERATION IN ITALY
• First installations realised and monitored by ENEA and ENEL (preliminary actions of the Italian Roof-top Programme)
• Aims– to check how proper the identified technical solution
were– to test new components and new design criteria– set up the monitoring network
• Site: Major Italian Universities and Municipalities• In operation since 1999 • Long term performance analysis in progress • Typical plant size: 2 - 3 kW• Applications: roof integration, façade, sunshade

DISTRIBUTED GENERATION SOUND BARRIERS
• Marginal spaces utilization
• Use of noise barrier as supporting structure
• Use of PV module as noise barrier element
• Zig-zag structures to combine noise absorption and production maximization
• Bifacial modules in north-south highway direction
IEA source
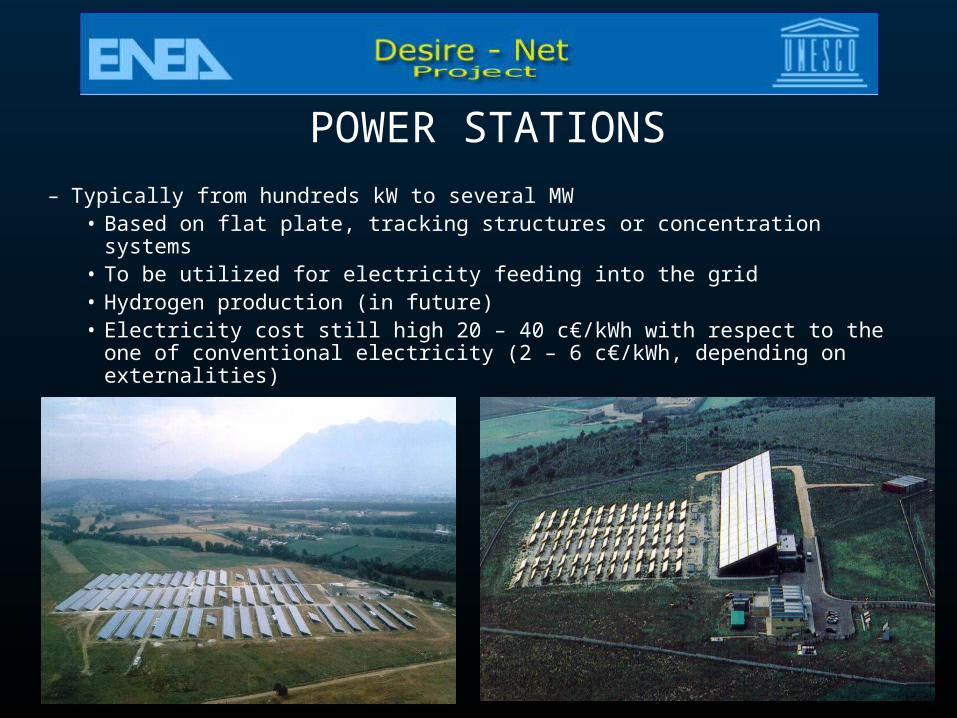
POWER STATIONS
– Typically from hundreds kW to several MW• Based on flat plate, tracking structures or concentration systems• To be utilized for electricity feeding into the grid• Hydrogen production (in future)• Electricity cost still high 20 – 40 c€/kWh with respect to the one of
conventional electricity (2 – 6 c€/kWh, depending on externalities)

GRID SUPPORT– Large size distribution grids
• Medium size systems (0,5 – 2 MW) to strength weak feeder – Small grids (few MW) of small islands (33 in Italy)
• small – medium size plants (100 – 500 kW) to provide a significant contribution (10-30%) to energy production
– Almost cost effective – Fuel saving – Respect of environmental constraints
DEMONSTRATION PLANTSIN ITALY
• Promoted by ENEA, ENEL, PV Industry, Municipalities• Major projects
– PLUG (ENEA)– Serre (ENEL)– Vasto (ANIT)
• First prototypes in operation since 1984 (long term performance analysys still ongoing)
• Typical power: 10 kW – 3 MW• Application: Power stations (0.6-3.3 MW), Small grid
support (200 kW), Water punping (70 kW), Desalination (100 kW), Cold store (45 kW)
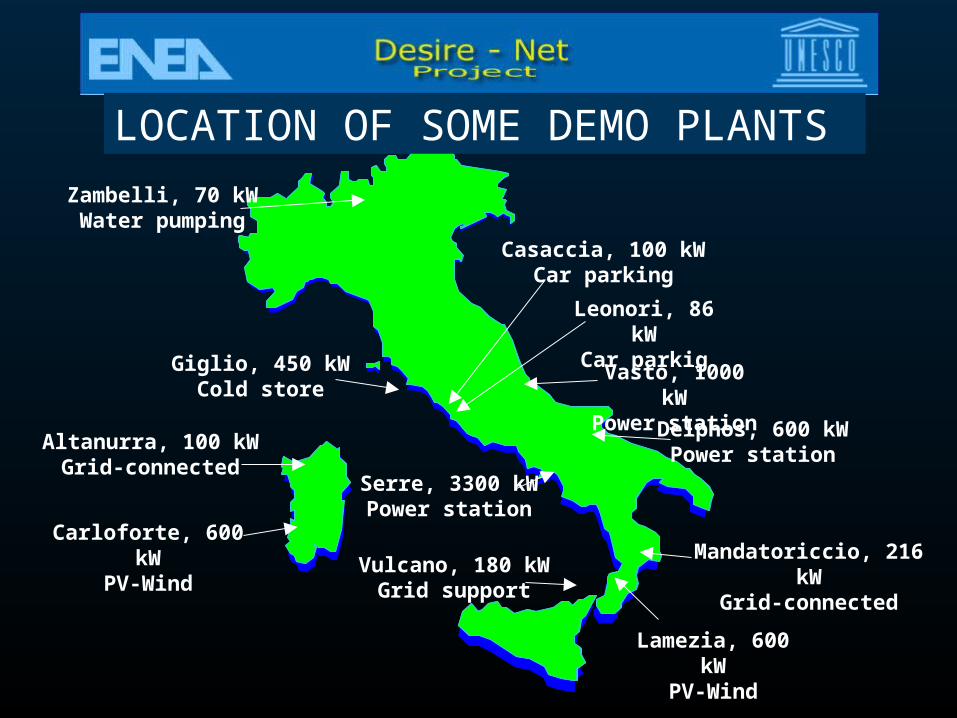
PLANT LOCATION
Delphos, 600 kWPower station
Lamezia, 600 kWPV-Wind
Vasto, 1000 kWPower station
Leonori, 86 kWCar parkig
Altanurra, 100 kWGrid-connected
Carloforte, 600 kWPV-Wind Mandatoriccio, 216 kW
Grid-connectedVulcano, 180 kW
Grid support
Serre, 3300 kWPower station
LOCATION OF SOME DEMO PLANTS
Casaccia, 100 kWCar parking
Zambelli, 70 kWWater pumping
Giglio, 450 kWCold store

PLUG PROJECT• Development of a 100 kW standard plant for medium size applications• Aim: cost minimization
– Standardization and preassembling of components– Modular architecture of systems – Civil works absence
• Applications– Casaccia (preexisting structures exploitation)– Delphos (modular concept)– Alta Nurra (combined use of PV and wind)– Vulcano (high penetration of PV in small grid)
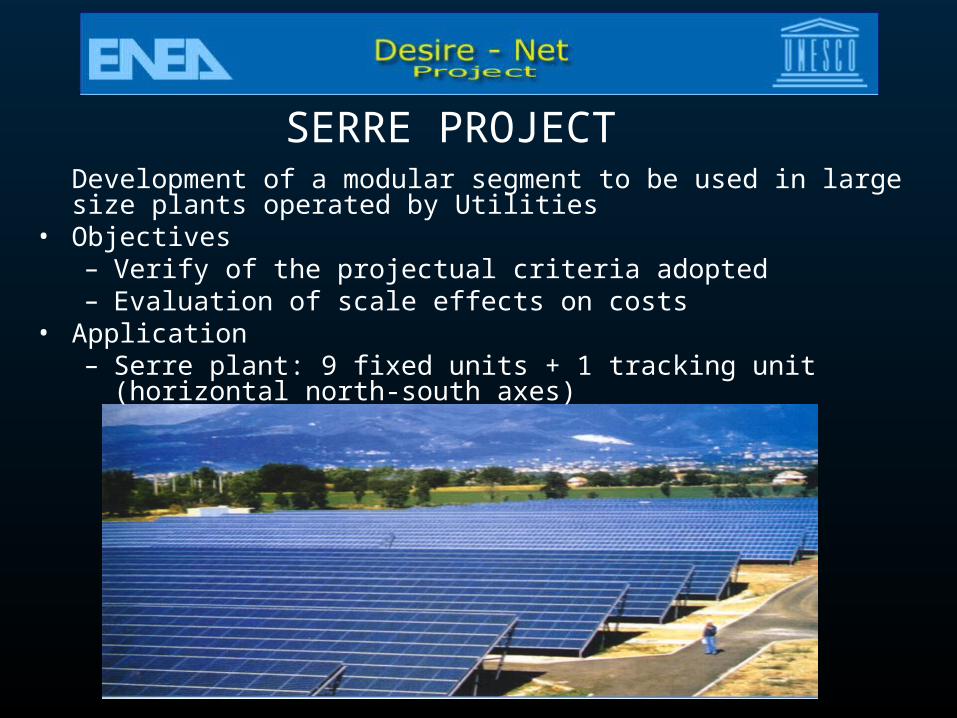
SERRE PROJECT Development of a modular segment to be used in large size plants operated by Utilities
• Objectives– Verify of the projectual criteria adopted– Evaluation of scale effects on costs
• Application– Serre plant: 9 fixed units + 1 tracking unit (horizontal north-south axes)
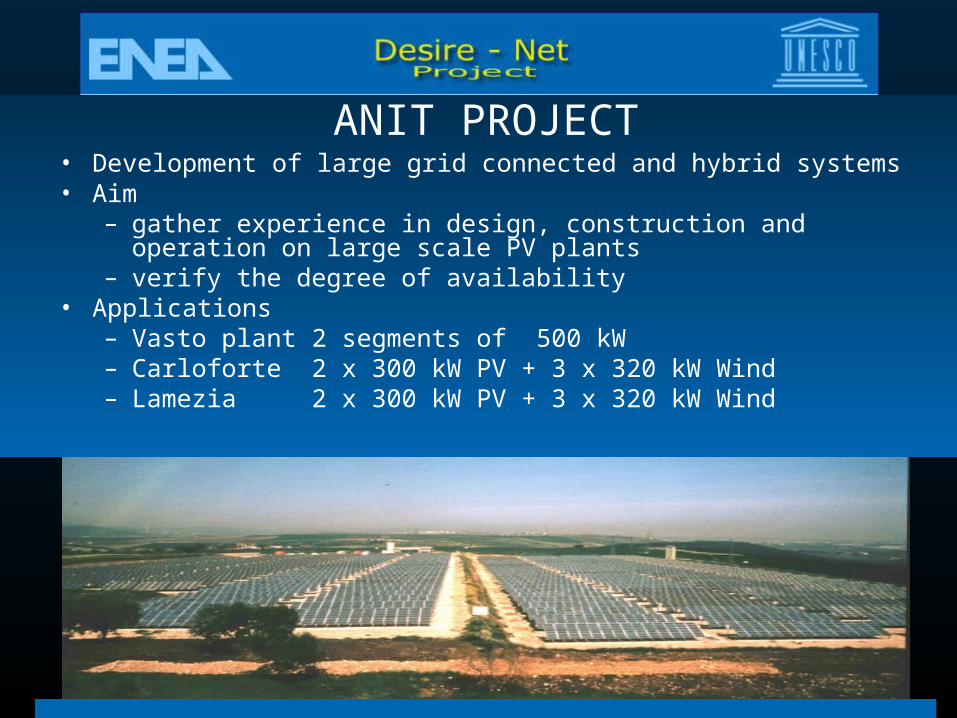
• Development of large grid connected and hybrid systems• Aim
– gather experience in design, construction and operation on large scale PV plants
– verify the degree of availability• Applications
– Vasto plant 2 segments of 500 kW– Carloforte 2 x 300 kW PV + 3 x 320 kW Wind– Lamezia 2 x 300 kW PV + 3 x 320 kW Wind
ANIT PROJECT
ENVIRONMENTAL IMPACT• Negligible pollution during plant operation:
– Chemical: total absence of fumes or emissions (COx, SOx NOx)– Thermal: maximum temperatures < 60°C– Acoustic and electromagnetic : acceptable (if inverter within norm limits
are adopted)
• Complete absence of: – moving parts– waste (components can be recycled)– radiation or scories– circulation of high temperature or pressure fluids
• Emission comparison– PV 30 gCO2 /kWh– Gas 400 gCO2 /kWh– Oil 800 gCO2 /kWh
• CO2 emission avoided = emission avoided for electricity production – emissions related to the construction of the PV plant
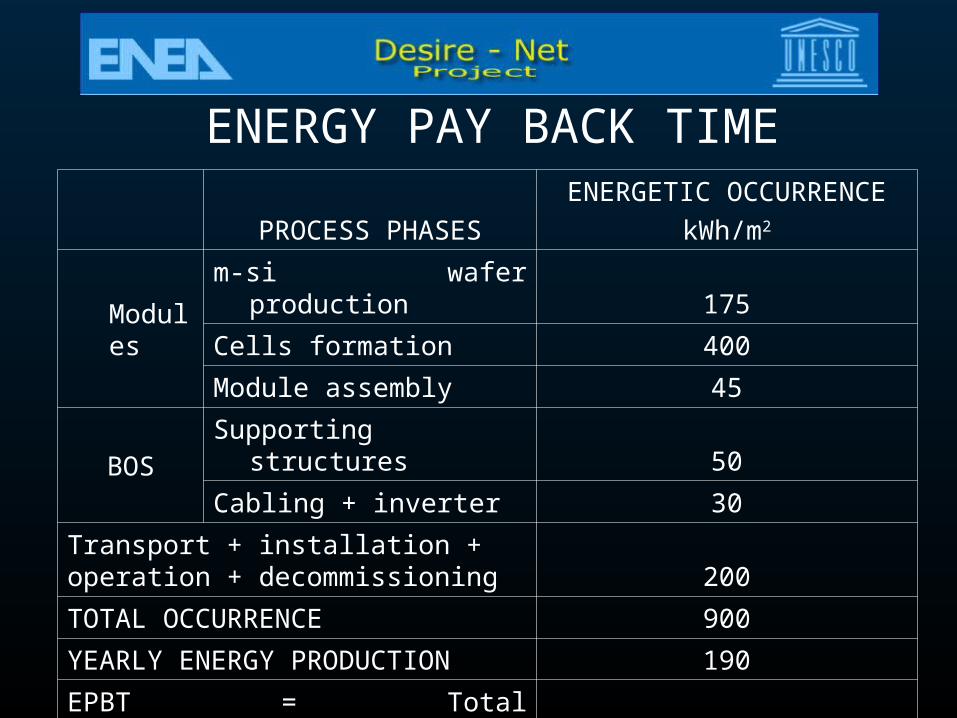
PROCESS PHASES
ENERGETIC OCCURRENCE
kWh/m2
Modules
m-si wafer production 175
Cells formation 400
Module assembly 45
BOSSupporting structures 50
Cabling + inverter 30
Transport + installation + operation + decommissioning 200
TOTAL OCCURRENCE 900
YEARLY ENERGY PRODUCTION 190
EPBT = Total occurrence/yearly E.P. 4.7 years
ENERGY PAY BACK TIME
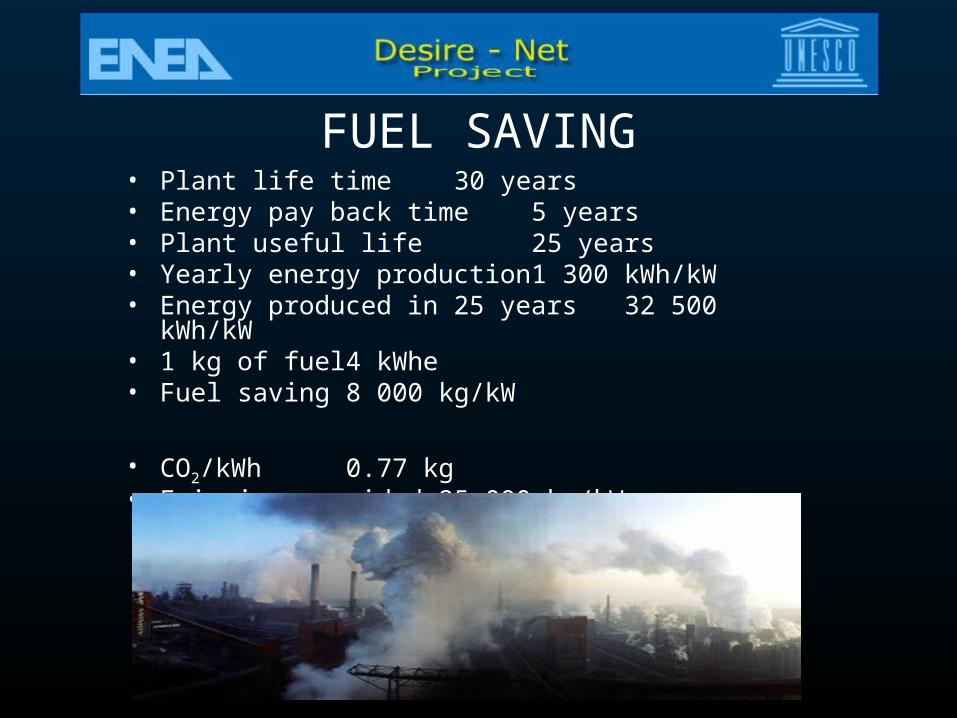
FUEL SAVING• Plant life time 30 years• Energy pay back time 5 years• Plant useful life 25 years• Yearly energy production 1 300 kWh/kW• Energy produced in 25 years 32 500 kWh/kW• 1 kg of fuel 4 kWhe• Fuel saving 8 000 kg/kW
• CO2/kWh 0.77 kg• Emissions avoided 25 000 kg/kW
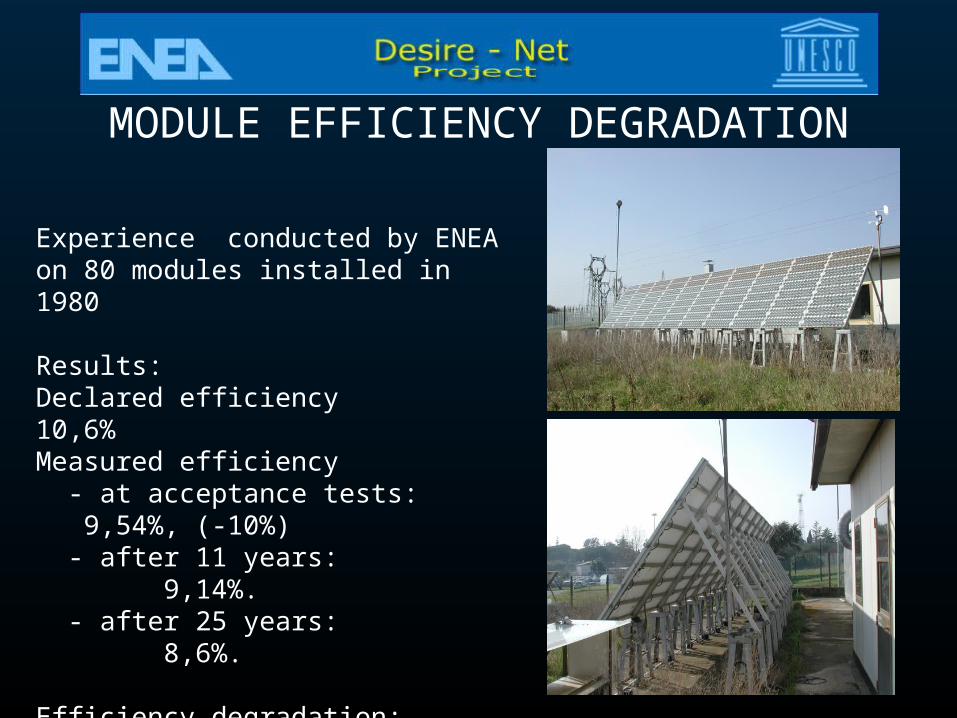
Experience conducted by ENEA on 80 modules installed in 1980
Results:Declared efficiency 10,6% Measured efficiency - at acceptance tests: 9,54%, (-10%) - after 11 years: 9,14%. - after 25 years: 8,6%.
Efficiency degradation: 10% in 25 years Mean degradation rate: 0,4% /year
MODULE EFFICIENCY DEGRADATION

Tedlar detachment or delamination
module browning
Defects detected after 25 years don’t have caused further efficiency degradation with respect to the natural degradation (0,4%/year)
This experience demonstrate that the life time of “old generation”, “glass-tedlar” can be considered around 30 years.
MODULE FAILURES
Tedlar leak
Grid oxidation

ARRAY DEGRADATION• Array degradation factors
– Natural degradation• power degradation • life-limiting wear-out • BOS component failures
– Accidental degradation • due to single-module failure (which does not involve failures of
entire strings)
• data on efficiency and module failures have been collected for many years from 2 arrays (at ENEA research centre)
• the influence of module failure on efficiency degradation was found to be very low if module failure occurs at rate <0.1 %/year
• In this case module replacing could be not urgent – especially in BIPV or remote systems– unless the module failure (such as low-insulation loss) cause
chained failure of entire strings
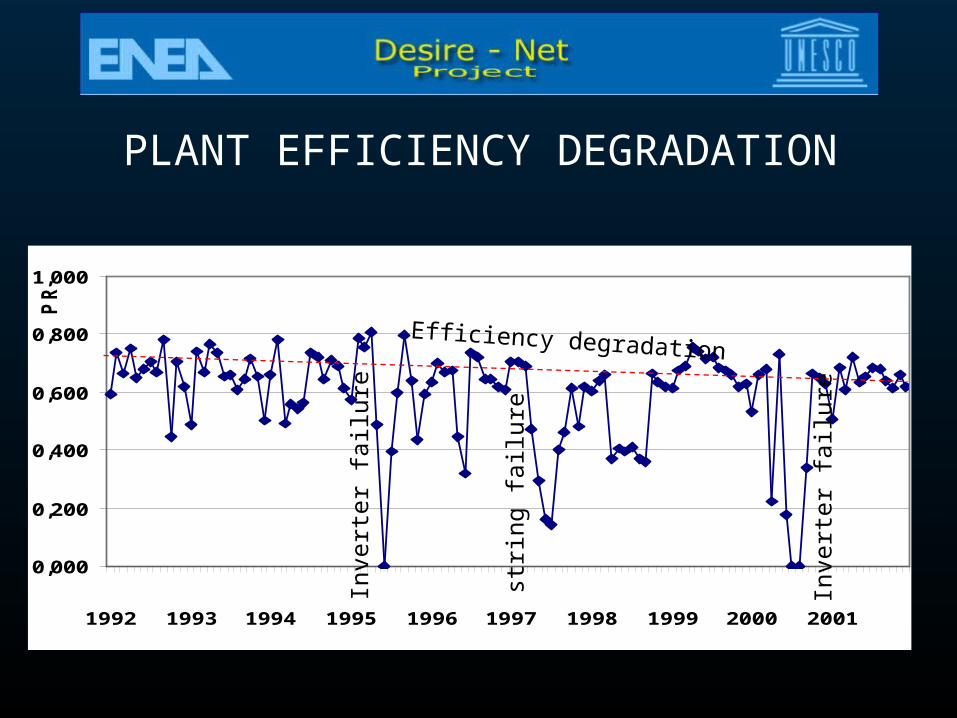
PLANT EFFICIENCY DEGRADATION
0,000
0,200
0,400
0,600
0,800
1,000
Jan1992
Jan1993
Jan1994
Jan1995
Jan1996
Jan1997
Jan1998
Jan1999
Jan2000
Jan2001
PR
Inve
rter
fai
lure
Inve
rter
fai
lure
Efficiency degradation
strin
g fa
ilure

TIPICAL SEQUECE OF EVENTS
0
2
4
6
8
10
12
14
0 5 10 15 20 25 30 35
Years
pla
nt
effi
cien
cy (
%)
Inve
rter
sub
stit
utio
n
Module efficiency degradation (0,4%/a)
Module failure
(infiltration, ossidation,
delamination)
fail
ure
(PV
gen
or in
vert
er)
Syst
em tu
ning

IMPACT ON LAND• Land occupation
– Plant power 1 MW– Yearly energy production 1.300 MWh– Domestic users supplied 600 (in Italy) – Land required 1.5 hectares
• Energy consumption in Italy 300 millions of MWh (land required: 3.000
km2)
• Possibility of using marginal lands or not utilzed areas (20.000 km2 in Italy)
• Integration into existing structures

PV POTENTIAL• Total amount of solar energy on earth surface: 15 thousand times
the world energy consumption
• Technical potential: 4 times the world energy consumption– Unrealistic due the mismatch generation/demand
– Unless PV energy utilized for H2 production (in future)
• South oriented roofs in Europe: electricity needs in Europe

PV AND ARCHITECTURE
• Typologies integrated into architectural structures– Roofs (sloped, horizontal, curved)– Facades– Sun shadings (fixed and mobile)– Glass roofs and curtains– Covering elements– Balustrade
• Typologies integrate into urban infrastructures– shelters (car, bus stop, train station)– Industrial buildings– Noise barriers
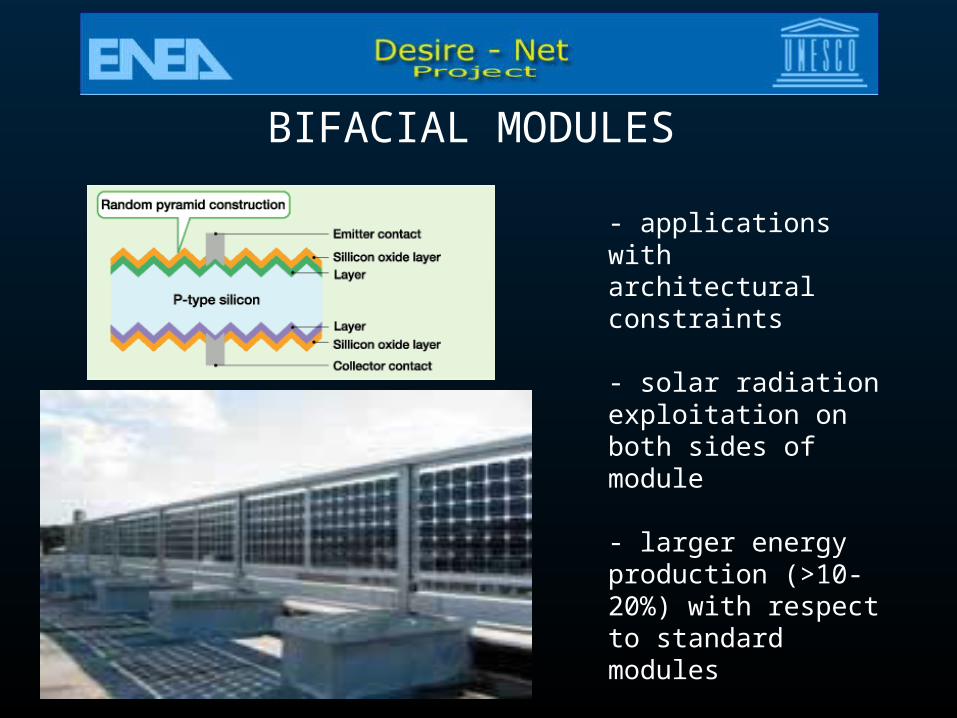
BIFACIAL MODULES
- applications with architectural constraints - solar radiation exploitation on both sides of module - larger energy production (>10-20%) with respect to standard modules
- ease maintenance against snow, dust and bird dropping
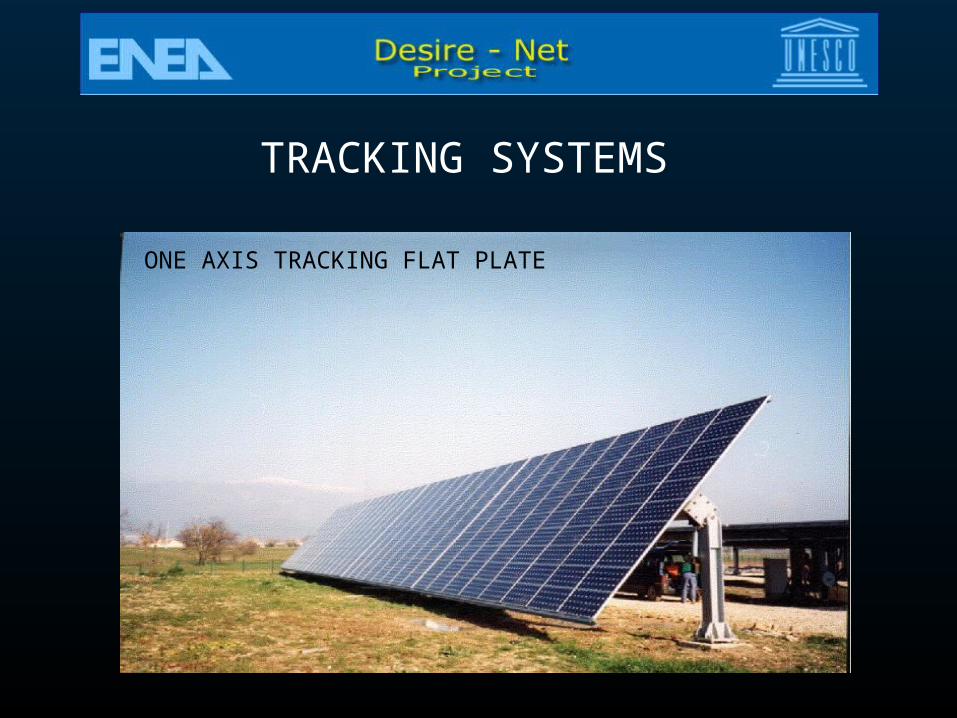
TRACKING SYSTEMS
ONE AXIS TRACKING FLAT PLATE

Tilt=latitude
ONE AXIS TRACKING
north-south axis tracking flat plate
Fixed flat plate (tilt = latitude)
Incident energy > 20%- 25% with respect to fixed plated

TWO AXIS TRACKING

Tilt = latitudine
Sistema piano ad inseguimento su due assi
TWO AXIS TRACKING
2 axis tracking flat plate
Incident energy > 30%- 35% with respect to fixed plated
Fixed flat plate (tilt = latitude)

STRUCTURES COMPARISON
• FIXED– No maintenance– Simple mounting and
transport– content cost– Modest foundations– Less energy collected– modest aesthetical
result
• TRACKING– Maintenance necessity– Exacting transport and
installation – Higher costs– Larger areas required– More energy collected– Harmonious
aesthetical result

CONCENTRATING PV
• The efficiency of cells is higher (30% - 40%)– high concentration factors: 100X – 1.000X (Irr*logIrr)– smaller cells
Solar radiation Solar radiation
PV cell
PV cell
Lens
• PV material (high cost), is partially substituted with mirrors or lenses (lower cost)

CONCENTRATING PVThe incident energy is almost the same with respect to fixed plates systems:only the direct component of light is exploited
Concentrating system
Fixed flat plate (tilt = latitude)

CONCENTRATOR MODULES
- Concentration factor: 100X – 400X- Lens efficiency: 80% - 85%- cell cooling difficulty- Inexpensive polymer lens- lifetime not verified

Dishes
Central tower
Trough system
CONCENTRATORS
- Concentration factor: 1.000X- Mirror efficiency: 85% - 92%- currently high costs- Cooling challenge

PHOCUS PROJECT (PV Concentrators for Utility Scale)
– Aim: assessment of technical and economical feasibility of PV concentration for centralised generation
– Ongoing activities• Optimisation of the most appropriate technologies for solar cells,
optical devices, concentrator modules, tracking system• Development of a 5 kW standard unit
– c-Si cells optimised at 100-400 suns– refractive prismatic lenses
• Experimentation on 5 units
– Planned activities• Development of high efficiency cells• Investigation on optical devices based on Fresnel lenses and
Compound Parabolic Concentrators

CONCENTRATOR MODULE
Optical system(prismatic
lenses)
Structure with separators
Heat sink
PV cells

IEA-TASK 2 PERFORMANCE DATABASE
• Contains information on the technical performance, reliability and costs of 431 monitored PV plants located worldwide. Germany (118), Japan (95), Switzerland (64), Italy (35), France (31),…
• Applications: Stand alone, hybrids, grid connected
• Plant size: from 1 to 3300 kW
• Mounting typologies: facades, flat and sloped roofs, integrated roofs, sound barriers, free-standing
• Performance data collected from 1986 (Japan)
IEA-TASK 2 PERFORMANCE DATABASE• For each plant provide
– General information– Component data and system configuration– Data collected (Irr, Pdc, Pac,..)– Costs– Calculated data (index of performance)
• The user can – select PV system, present monitoring data, calculated results– export these data into spreadsheet programs– check the operational behavior of existing PV plants – get a report on performance results
• Can be downloaded from www.iea-pvps-task2.org

IEA source

EFFICIENCIES AND COSTS
inverter efficiency
82
84
86
88
90
92
94
Vulc1 Delp1 Casac Delp2 Vasto Serre Altan
effic
ienc
y (%
)
PV genearator efficiency
4
6
8
10
Vulc1 Delp1 Casac Delp2 Vasto Serre Altan
effic
ienc
y (%
)
0,6
0,7
0,8
0,9
mea
n ef
f. /
nom
inal
eff.
84 85 91 91 93 94 96
0
5
10
15
20
25
Vulc1 Delp1 Casac Delp2 Vasto Serre Altan
Spec
ific
cost
s (E
uro/
Wp)
plant
module
Costs

INDICES OF PERFORMANCE
0
1
2
3
4
5
1992 1993 1994 1995 1996 1997 1998 1999 2000
Yie
ld a
nd lo
sses
(h/d
)
Ls
Lc
Yf
0
0,2
0,4
0,6
0,8
1992 1993 1994 1995 1996 1997 1998 1999 2000
Per
form
ance
ra
tio
0
2040
6080
100
Ava
ilab
ility
(%)
GLOBAL ECONOMIC SURVEY
• aimed to collect worldwide:– Costs of systems, components, maintenance (during their
life cycle)– Production data and maintenance information
• will allow to:– compare costs of system for different markets in different
countries as well as different sizes of installations– know the true LCA– predict performance life expectancy, mean time between
failure and costs to service and replace parts
• accessible on http://iea.tnc.ch

IEA source

0
500
1000
1500
2000
2500
3000
3500
1992
1993
1994
1995
1996
1997
1998
1999
2000
2001
2002
2003
2004
MW
Grid-connected centralisedGrid-connected distributedOff-grid non-domesticOff-grid domestic
- IEA countries: 2.8 GW- Total: 3.3 GW
- 1.2 MW in 2004- Growth rate: 42%
- Projections for 2005: 4,5 GW
- applications: 70% of small grid connected systems
INSTALLED POWER
Worldwide
IEA countries
IEA source
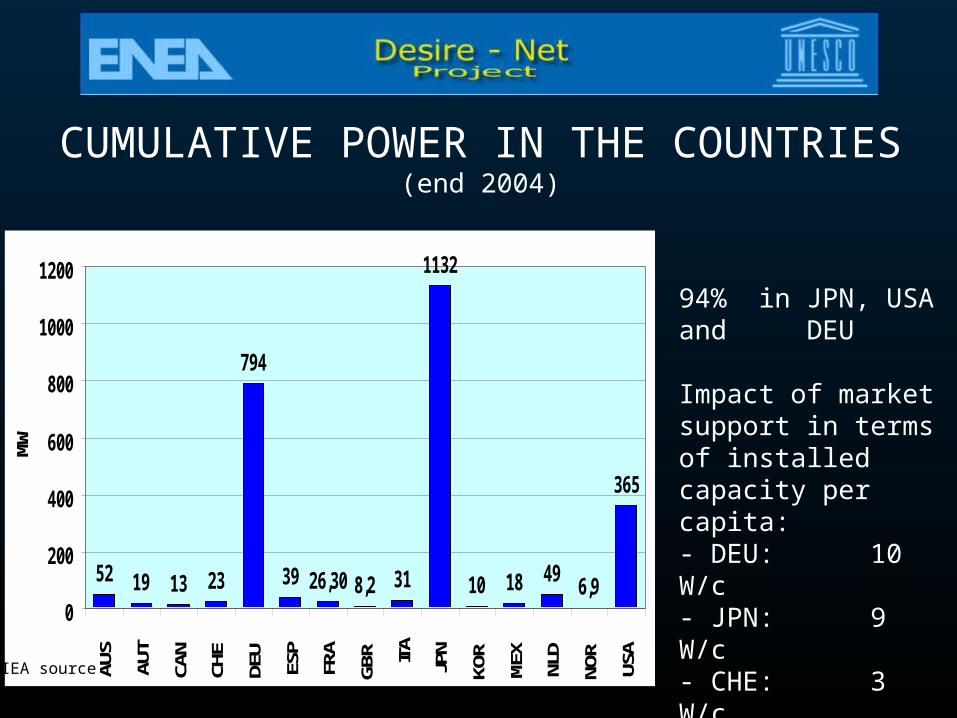
CUMULATIVE POWER IN THE COUNTRIES(end 2004)
52 19 13 23
794
39 26,30 8,2 31
1132
10 18 496,9
365
0
200
400
600
800
1000
1200
AUS
AUT
CAN
CHE
DEU
ESP
FRA
GBR ITA
JPN
KOR
MEX
NLD
NOR
USA
MW
94% in JPN, USA and DEU
Impact of market support in terms of installed capacity per capita:- DEU: 10 W/c- JPN: 9 W/c- CHE: 3 W/c- NLD: 3 W/c- ITA: 0,5 W/c
IEA source

TRENDS IN SOME COUNTRIES
Annual rate growth:
- DEU: 137%Sustained by feed-in tariffs (0.5 €/kWh)
- constant in JPN: 22%, net metering at 0.2 €/kWh + low subsidy on capital costs (10%)
0
50
100
150
200
250
300
350
400
1993
1994
1995
1996
1997
1998
1999
2000
2001
2002
2003
2004
inst
alle
d po
wer
(MW
)
JPN
DEU
USA
NLD
AUS
FRA
AUT
ITA
IEA source

DISTRIBUTION OF APPLICATIONAS
- PV roofs : CHE, DEU, GBR, JPN, NLD
- Vacation cottages: SWE NOR, FIN
-Rural electrification: MEX, FRA
- Commercial applications: USA e AUS
0%
20%
40%
60%
80%
100%
AU
S
AU
T
CA
N
CH
E
DN
K
DE
U
FIN
FRA
GB
R
ISR
ITA
JPN
KO
R
ME
X
NLD
NO
R
PR
T
SW
E
US
AInst
alle
d po
wer
by
appl
icat
ion
(%)
Grid-connected centralizedGrid-connected distributedOff-grid non-domesticOff-grid domestic
IEA source

PV SYSTEM MARKET IN ITALY
Primary applications • Off Grid domestic: 5,3 MW
– rural electrification (5000 isolated households promoted through 80% incentives in the early 80’)
– lighting• Economic industrial applications: 7 MW
– telecommunication– signaling– cathodic protection
• Demonstration (sharply increasing in the 90’): 6,7 MW• Distributed generation, growing over the last year (rooftop
Programme): 17 MW
• TOTAL: 36 MW
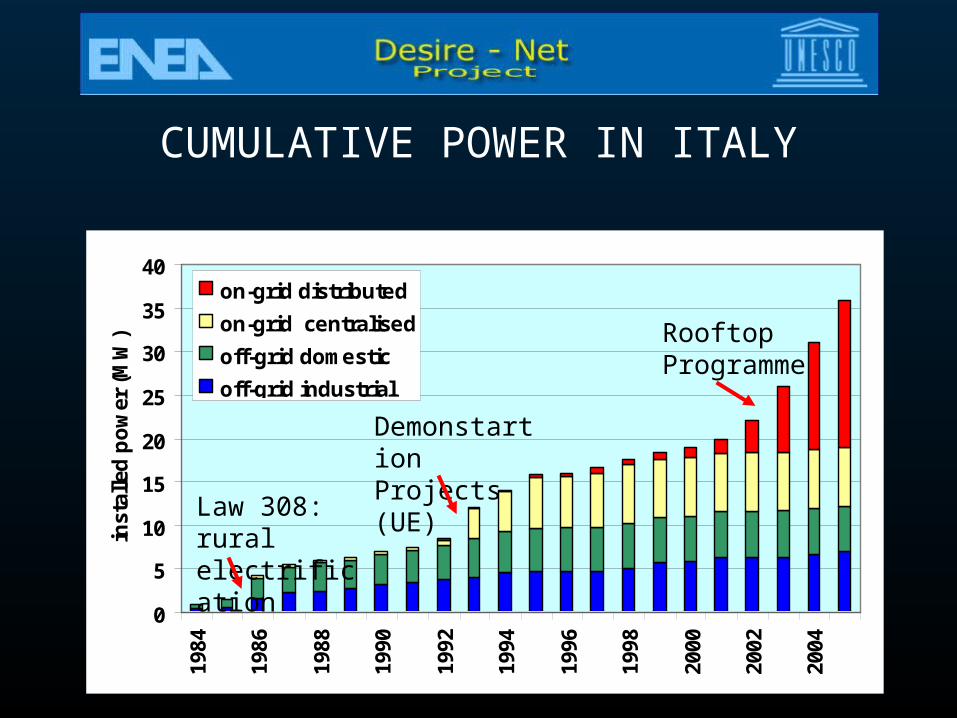
CUMULATIVE POWER IN ITALY
0
5
10
15
20
25
30
35
40
1984
1986
1988
1990
1992
1994
1996
1998
2000
2002
2004
inst
alle
d p
ow
er (
MW
)
on-grid distributed
on-grid centralised
off-grid domestic
off-grid industrial
Law 308: rural electrification
Rooftop Programme
DemonstartionProjects (UE)
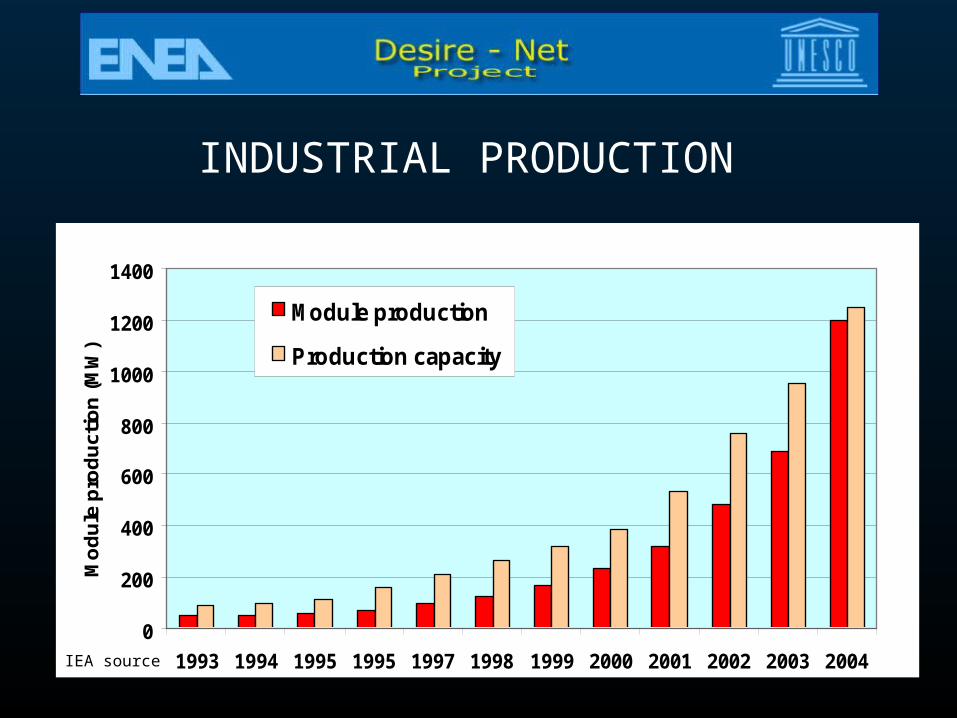
INDUSTRIAL PRODUCTION
0
200
400
600
800
1000
1200
1400
1993 1994 1995 1995 1997 1998 1999 2000 2001 2002 2003 2004
Mo
du
le p
rod
uct
ion
(M
W)
Module production
Production capacity
IEA source

INDUSTRIAL PRODUCTION
• World module production in 2004 : 1200 MW (700 in 2003). Only IEA countries: 1070 MW
• Average growth : 60%– JPN: 70 % (50% of the world production)– DEU: 66% (second producer)– CHI: 400% (100 MW in 2004)– ESP: second producer in Europe – FRA and ITA: continue to lose market shares
• Production capacity growth: 17%– DEU: awaited expansion not fulfilled yet– USA: capacity reduction (abroad production)

MODULE PRODUCTION BY REGIONS (year 2004)
0
100
200
300
400
500
600
700
Japan USA Europe Rest
mod
ule
prod
uctio
n (M
W)
Othera-Si
c-Si
IEA source
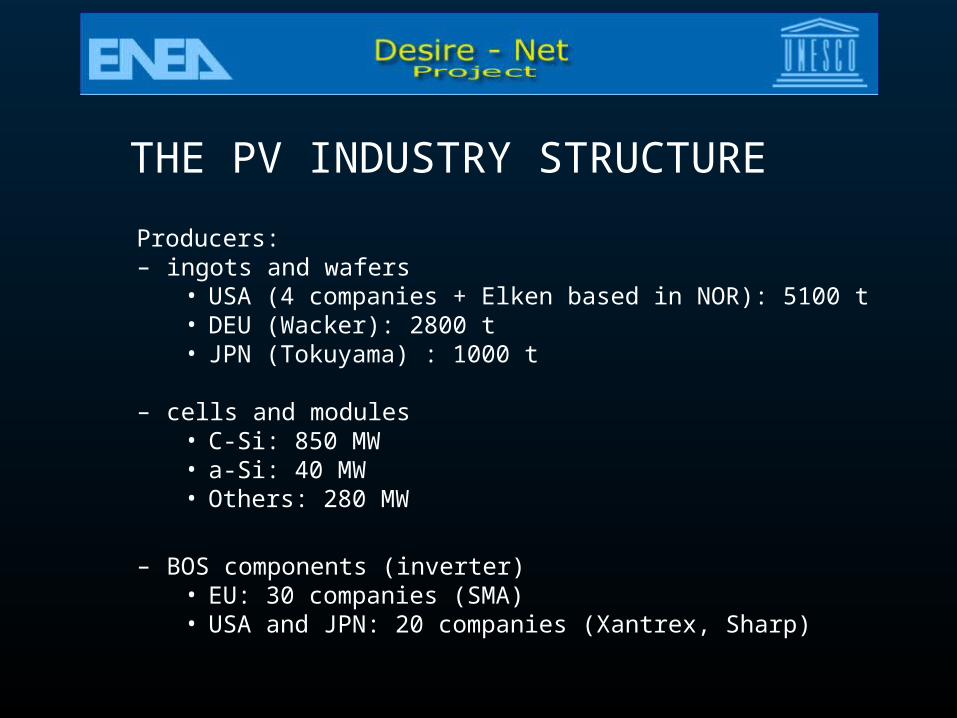
THE PV INDUSTRY STRUCTURE
Producers:– ingots and wafers
• USA (4 companies + Elken based in NOR): 5100 t • DEU (Wacker): 2800 t • JPN (Tokuyama) : 1000 t
– cells and modules• C-Si: 850 MW• a-Si: 40 MW• Others: 280 MW
– BOS components (inverter)• EU: 30 companies (SMA)• USA and JPN: 20 companies (Xantrex, Sharp)

THE PV INDUSTRY STRUCTURE
– Vertically integrated companies (from ingots to cells)• Kyocera (JPN), BP Solar, Shell Solar, Photowatt
– Company attempting to commercialize new processes• Silicon ribbon: RWE Schott• String ribbon: Evergreen Solar• Micro spherical silicon tech.: Canadian Spheral Solar Power• Silver cells: Australia Origin Energy
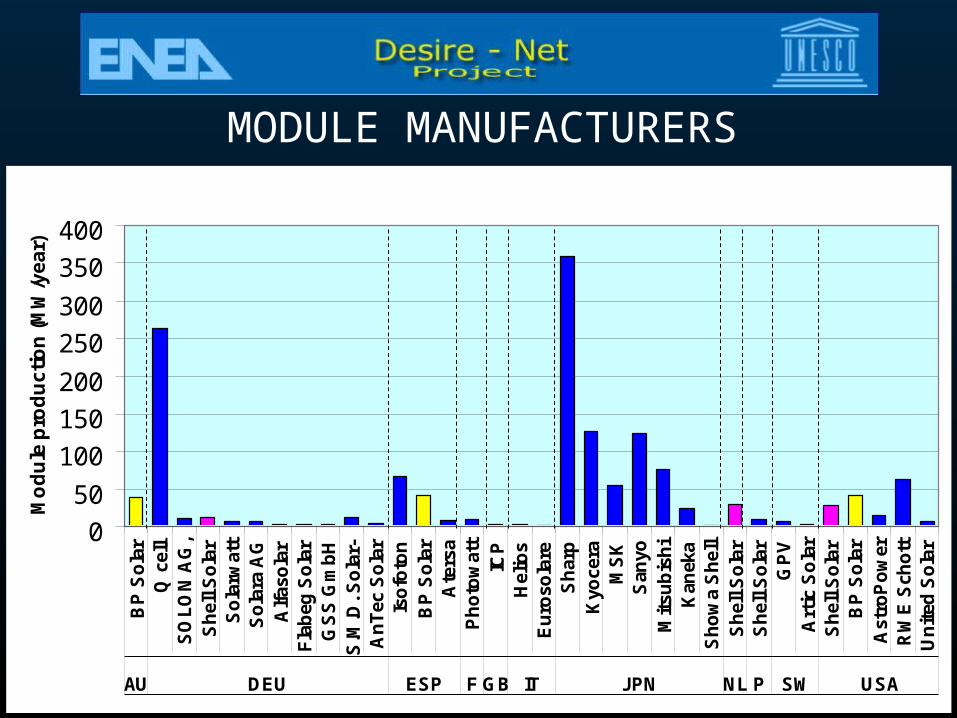
0
50
100
150
200
250
300
350
400
BP
So
lar
Q c
ell
SO
LO
N A
G,
Sh
ell S
ola
rS
ola
rwat
tS
ola
ra A
GA
lfas
ola
r F
lab
eg S
ola
rG
SS
Gm
bH
S.M
.D. S
ola
r-A
nT
ec S
ola
rIs
ofo
ton
BP
So
lar
Ate
rsa
Ph
oto
wat
tIC
PH
elio
sE
uro
sola
reS
har
pK
yoce
raM
SK
San
yoM
itsu
bis
hi
Kan
eka
Sh
ow
a S
hel
lS
hel
l So
lar
Sh
ell S
ola
rG
PV
Art
ic S
ola
rS
hel
l So
lar
BP
So
lar
Ast
roP
ow
erR
WE
Sch
ott
Un
ited
So
lar
AU DEU ESP F GB IT JPN NL P SW USA
Mo
du
le p
rod
uc
tio
n (
MW
/ye
ar)
MODULE MANUFACTURERS

ITALIAN PV INDUSTRY
• 2 major module manufacturer– Enitecnologie (ENI, Italy’s oil and gas giant)
• Mono and multi-crystalline silicon cell and module production• Production capacity: 9 MW/year (4.2 MW last year)
– Helios Technology• Fabrication of cells and modules from mono-crystalline silicon
wafers• Production capacity: 10 MW/year (7 MW last year)
• Some small companies assembling and encapsulating tailor-made modules (facades, windows, coloured cells). Capacity: 10 MW/y
• 5 companies manufacturing small and medium size inverters, for on-grid and off-grid applications
• 100 specialist PV companies offering consultancy, design, installation services and component delivery (some of them constituting “GIFI”, the Italian PV Firm Group)
0%
20%
40%
60%
80%
100%
1998 1999 2000 2001 2002 2003 2004
other
a-Si
c-Si
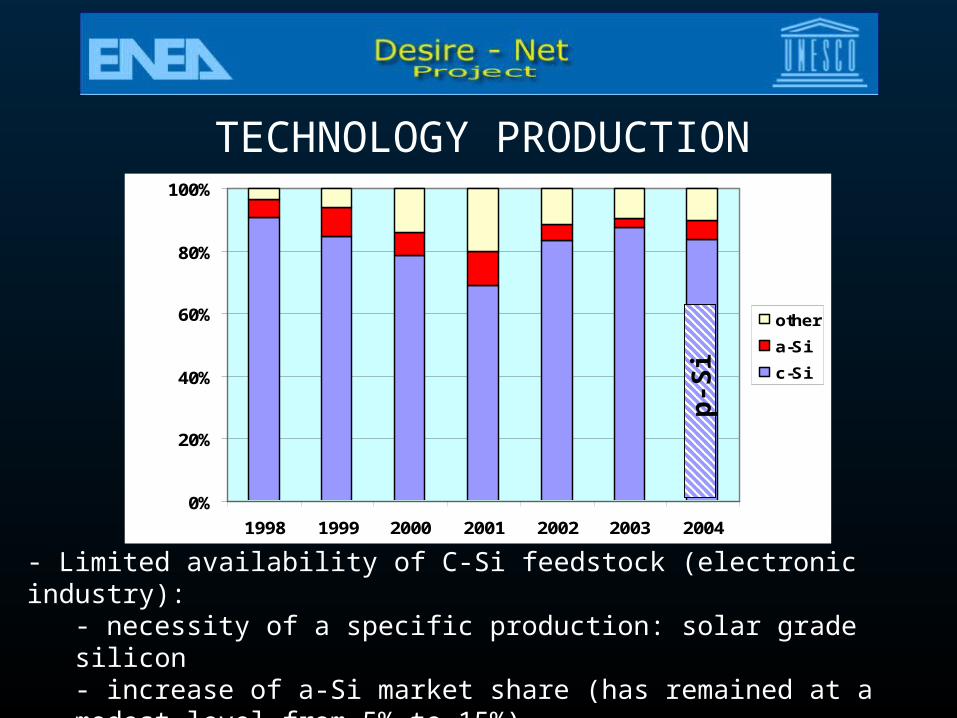
p-S
i
- Limited availability of C-Si feedstock (electronic industry):- necessity of a specific production: solar grade silicon- increase of a-Si market share (has remained at a modest level from 5% to 15%)- Material reduction (Si utilization is still relatively low) and efficiency increase- Concentration (use small area, high efficiency cells)
TECHNOLOGY PRODUCTION

PV INDUSTRY
• Actions to be taken:– Development of a sustainable market driven by incentives
(implementation of deployment measures)– Rules clear and appropriate (overcome barriers related to
regulations, standards, safety)– budget adequate for R&D and activities coordination– Strengthen joint initiatives between research and industry– Adopt instruments to encourage investment– Promote BIPV through the development of PV components to be
used in buildings– Ensure the Si availability matter at acceptable costs– Optimize the recycling process– Cooperation with other high tech sectors (flat panel display, micro
electronics, nanotechnologies

MARKET EXPECTATIONSTUDY COMPARISON
0
200
400
600
800
1000
1200
1400
1600
1800
2000
2000 2002 2004 2006 2008 2010
year
mo
du
le p
rod
uc
tio
n (
MW
)
Bayer (15%)
Kyocera (18%)
Strategies Unlimited (23%)
+60%
+40%
Growth rate)

MODULE PRICES EVOLUTION
19
11,37
53,2 3,2 1,40
5
10
15
20
1970 1980 1990 2000 2010 2020year
(€/W)
- Modules prices 3.5 €/W- Module prices increased:
- tightening of Si supply- more order in the books of manufacturers than they could fill in
- Cost reduction (to 1.5-2 €/ in 2010)can be achieved by
- market growth (scale effect)- research efforts (new materials, manufacturing process optimization)
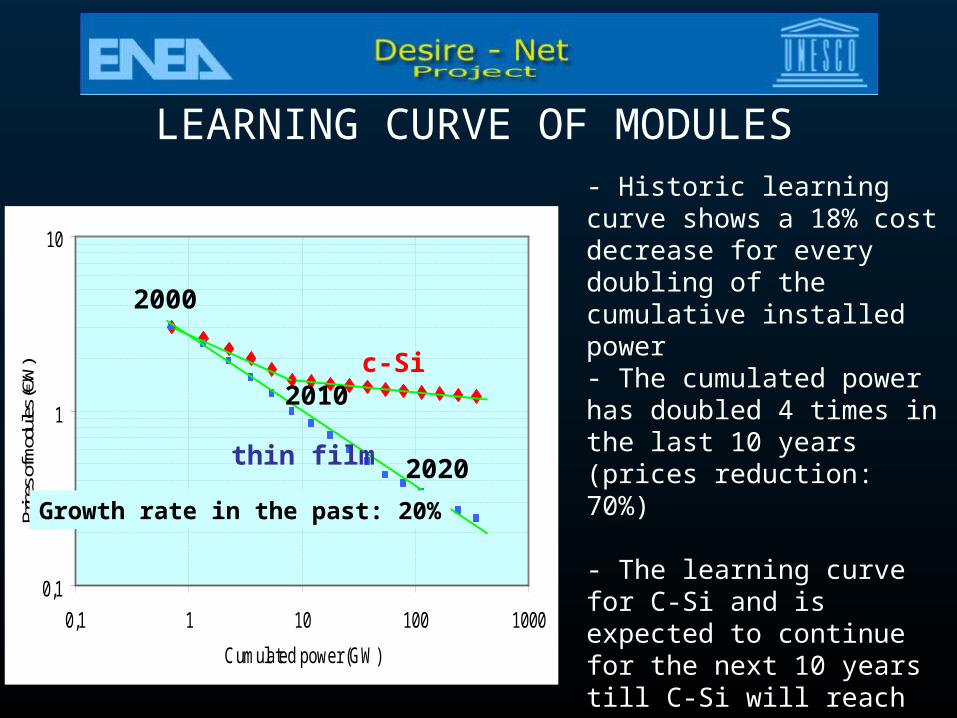
LEARNING CURVE OF MODULES
0,1
1
10
0,1 1 10 100 1000
Cumulated power (GW)
Price
s of m
odul
es (€
/W)
thin film
c-Si
2000
2010
2020
Growth rate in the past: 20%
- Historic learning curve shows a 18% cost decrease for every doubling of the cumulative installed power- The cumulated power has doubled 4 times in the last 10 years (prices reduction: 70%)
- The learning curve for C-Si and is expected to continue for the next 10 years till C-Si will reach its saturation value: 1€/W- thin films have the potential to extend learning curve beyond C-Si limit (less material and energy in the process, simpler and highly efficient process

PRICES OF MODULES AND SYSTEMS IN SOME COUNTRIES
0
5
10
15
20
25
30
35
40
45
1992
1993
1994
1995
1996
1997
1998
1999
2000
2001
2002
2003
2004
Indi
cativ
e pr
ices
(€/W
)
systems
modules
- Module prices: 3-4,5 €/W
- GCS: 5-7 €/W
- slight increase in prices over the previous year - learning curve of systems: shows a 15%-20% cost decrease (BOS cost decrease is along with module cost reduction)IEA Source
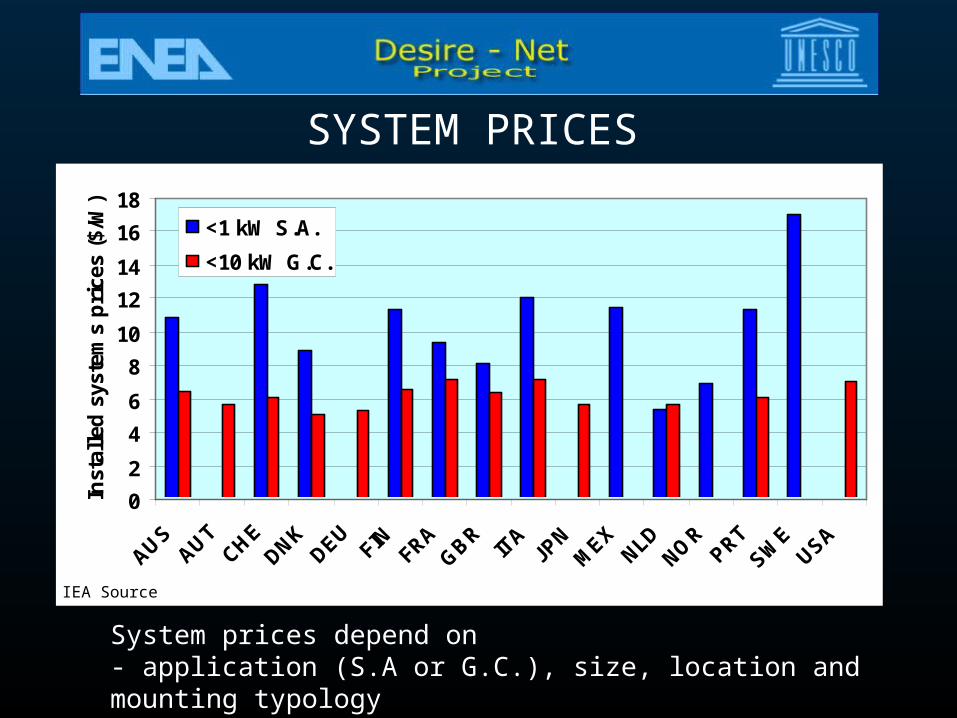
SYSTEM PRICES
0
2
4
6
8
10
12
14
16
18
AUSAUT
CHEDNK
DEUFIN
FRAGBR
ITA
JPN
MEX
NLDNO
RPRT
SWE
USA
Inst
alle
d s
yste
ms
pri
ces
($/W
)
<1 kW S.A.
<10 kW G.C.
System prices depend on- application (S.A or G.C.), size, location and mounting typology- dedicated design, technical specification
IEA Source

PRICES IN ITALY
Modules
Year 2002 2003 2004 2005
€/W 3.5 – 4.3 3.1 – 3.9 2.9 – 3.7 3.2 - 4
Systems
Category Application €/Wp
Off-grid (< 1 kWp) Lamps, Rural electrification,Industrial applications
10 - 13
On grid (< 10 kWp) Rooftops 6 – 8
On-grid (>10 kWp) Distributed generation 5.5 - 7

COST DISTRIBUTIONsmall G.C. plants
PV modules (4000 €/kW)51%
manpower (1400 €/kW)18%
supporting structures (400
€/kW)5%
cables and accessories (400
€/kW)5%
engineering (700 €/kW)
9%
inverter (900 €/kW)12%
65% in large size plants

COSTS IN S.A. SYSTEMS
• COSTS PROPORTIONAL TO THE SIZE OF THE PLANT– PV modules 3,6 €/W– Cables and accessories 0,4 €/W– Supporting structures 35 €/m2– Site preparation 10 €/m2– dc/dc converter (charge controller)0,3 – 0,6 €/W
• COSTS PROPORTIONAL TO THE SIZE OF THE BATTERY– Battery housing 80 €/kWh– battery 200 €/kWh * N° of replacements
• COSTS PROPORTIONAL TO THE SIZE OF THE MAXIMUM LOAD– inverter 400 - 700 €/kW

THE PV ENERGY COST
CkWh = (Ci*A + Cm) / E
• Ci: investment cost – 6 - 7 €/W (grid-connected)– 10 – 12 €/kW (stand alone)
• A: capital recovery factor = r / (1- (1+r)-T)– r: interest rate (3 %)– T: system life span (30 years)
• Cm: annual maintenance cost (50 – 200 €/kW)• E: yearly energy production (1000 – 1300 kWh/kW)
• CkWh:– 0,3 – 0,35 €/kWh (grid-connected)– 0,5 – 0,7 €/kWh) (stand alone)

COST OF THE kWh
0,000,050,100,150,200,250,300,350,400,45
1,00 2,00 3,00 4,00 5,00 6,00 7,00
PV plant cost ($/W)
kWh
co
st (
$) 2010Rome
Palermo
For typical system prices (6 €/W)corresponds 0,3 to 0,34 €/kWh, depending on location (Solar radiation)
Analysis show that system prices may reduce to 3.5 €/W (0,17-0,2 €/kWh), comparable with the price of energy paid by the end user
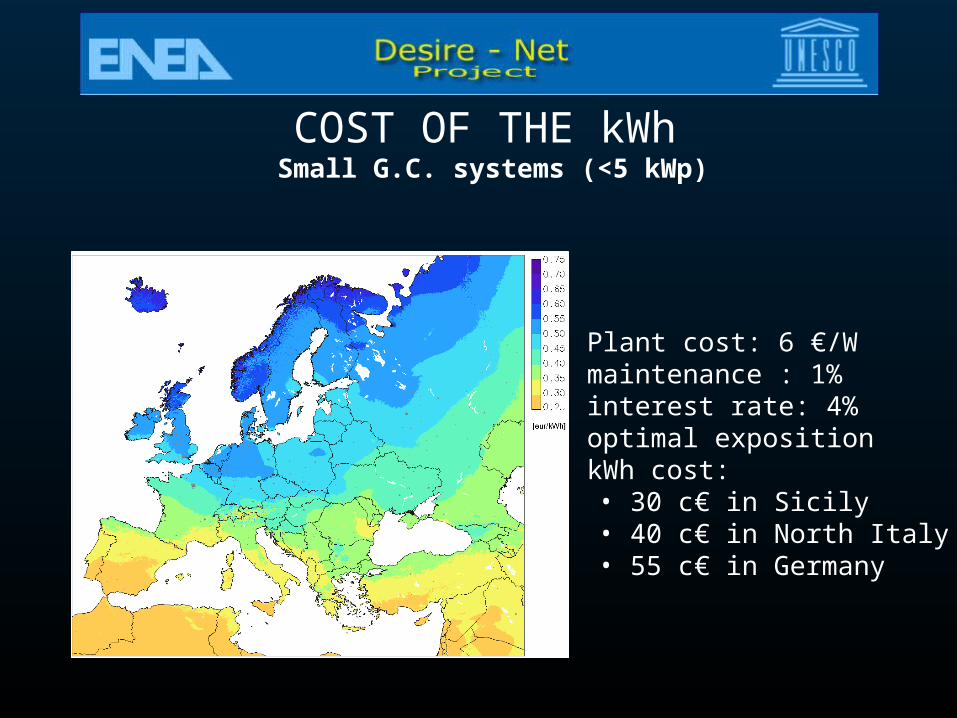
COST OF THE kWh Small G.C. systems (<5 kWp)
• Plant cost: 6 €/W• maintenance : 1% • interest rate: 4%• optimal exposition• kWh cost:
• 30 c€ in Sicily• 40 c€ in North Italy• 55 c€ in Germany
0
0,2
0,4
0,6
0,8
1
1,2
1,4
0,3 3 5 10 20 50 100 300
Daily load (kWh/day)
Elec
trici
ty c
ost (
$/kW
h)
PV 10 $/W
PV 2 $/W
PV 5 $/W
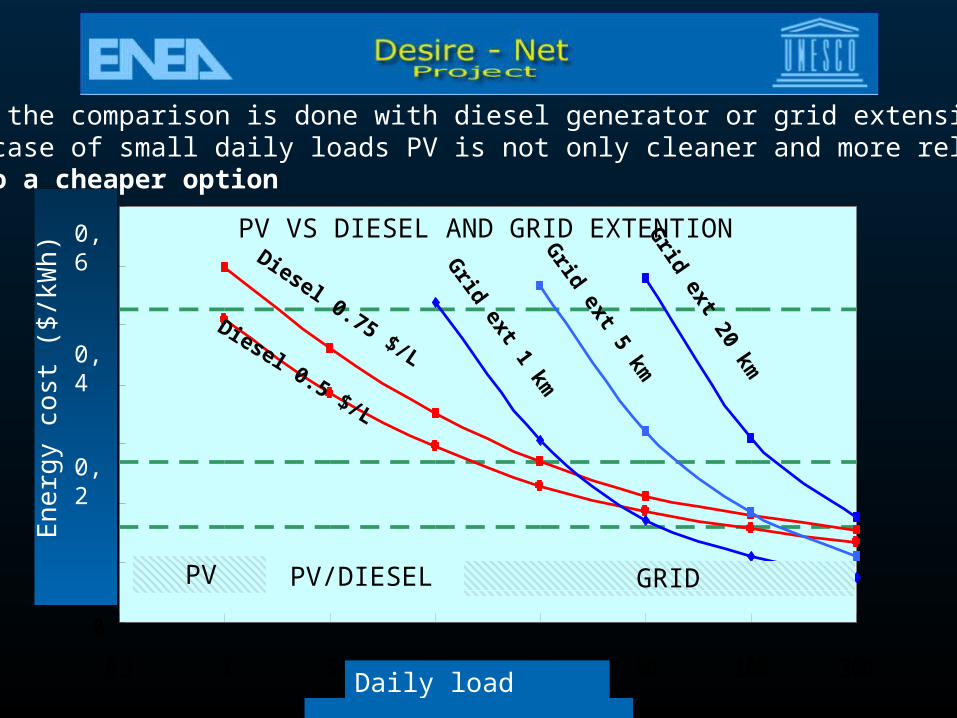
For SAS the comparison is done with diesel generator or grid extension.In the case of small daily loads PV is not only cleaner and more reliable, but also a cheaper option
Diesel 0.75 $/LDiesel 0.5 $/L
Grid ext 1 km
Grid ext 5 km
Grid ext 20 km
0,6
0,4
0,2
En
erg
y c
ost
($
/kW
h)
Daily load (kWh/day)
GRIDPV PV/DIESEL
PV VS DIESEL AND GRID EXTENTION
0
0,2
0,4
0,6
0,8
1
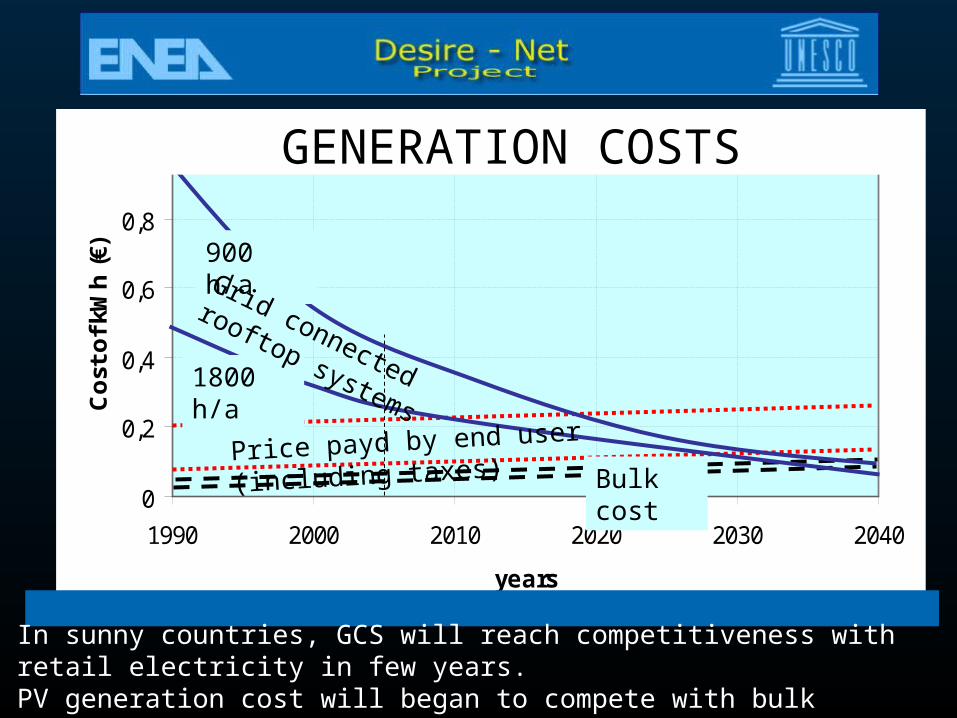
1990 2000 2010 2020 2030 2040
years
Co
st o
f kW
h (
€)
Price payd by end user (including taxes)
Bulk cost
900 h/a
1800 h/a
Grid connected rooftop
systems
GENERATION COSTS
In sunny countries, GCS will reach competitiveness with retail electricity in few years.PV generation cost will began to compete with bulk production only within 20 years

PAY-BACK TIMETime necessary to have NVA = 0Net value (actualized): NVA = CFA – (Ci – Contribution on c.c.)
Cashflow (actualized): CFA = Pi * (1+r)-i
Proceed: Pi = Ep*CkWh – Cm (1+r)-i : actualization factorr: interest rate
-2.500
-2.000
-1.500
-1.000
-500
-
500
1.000
1 3 5 7 9 11 13 15 17 19
anni
VA
N (
€/k
W) Payback time
yearsNet
val
ue a
ctua
lized
(€/
kW)

0
5
10
15
20
25
10 15 20 25 30 35 40 45 50 55 60
feed-in tariffs (c€/kWh)
Pa
y b
ack
tim
e (
yea
r)
c.c.=75% c.c.= 60%
c.c.= 0%
c.c.= 20%
Feed-in tariff
Rooftop programme
MIXED INCENTIVES
-8.000
-6.000
-4.000
-2.000
0
2.000
4.000
6.000
1 3 5 7 9 11
13
15
17
19 21
23
25
27
29
years
VA
N
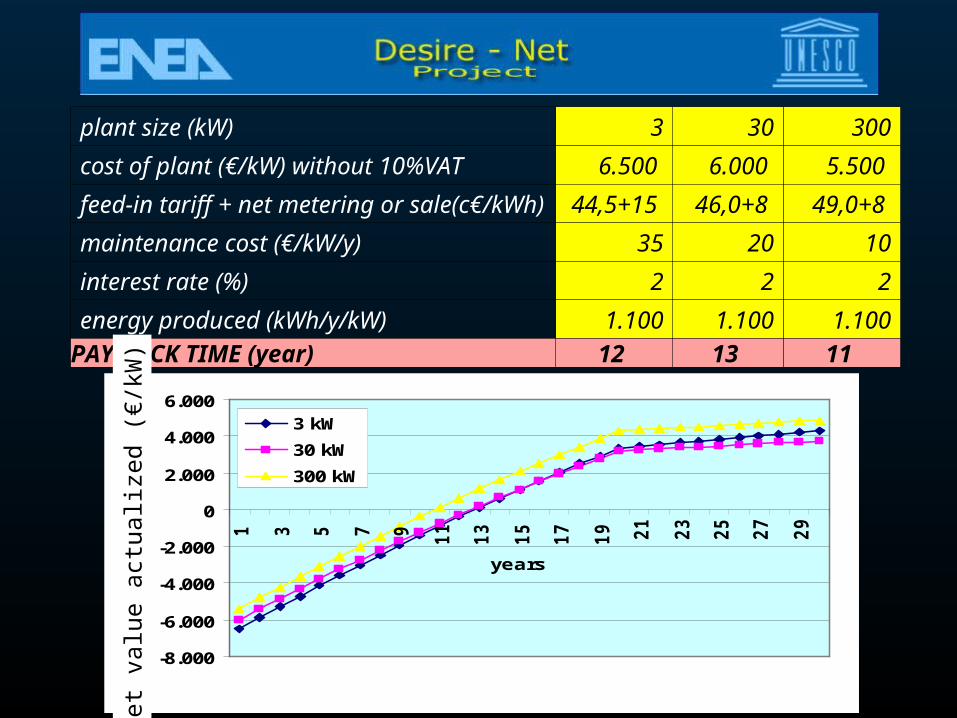
3 kW
30 kW
300 kW
plant size (kW) 3 30 300
cost of plant (€/kW) without 10%VAT 6.500 6.000 5.500
feed-in tariff + net metering or sale(c€/kWh) 44,5+15 46,0+8 49,0+8
maintenance cost (€/kW/y) 35 20 10
interest rate (%) 2 2 2
energy produced (kWh/y/kW) 1.100 1.100 1.100
PAY BACK TIME (year) 12 13 11
Net
val
ue a
ctua
lized
(€/
kW)

ADDED VALUE
• Electric– Grid parameters improvement (peak, transmission losses)– Emergency
• Environmental– Emission reduction, acid rain prevention
• Architectural– Building functions (heat and noise insulation water and fire
protection electromagnetic reflection)• Socio-economic
– Induced employment– Resource diversification– Technological transfer
COSTS AND ADDED VALUE
-40
-20
0
20
40
60
80
100
120
kWh
co
st
added value
incentivs
effective cost
present future
conventional energy
appa
rent
cos
t
appa
rent
e co
st
incentives
42
28
14
0
-14
kWh
cost
(c€
/kW
h)

PV PROS AND CONS• HIGH COST
At present is not realistic to recourse to this technology for– Energy source diversification– Significant emission reduction
• INTRINSIC FEATURES– Among the RES is the most attractive and promising for local and diffuse
electricity production (medium and long term)
• HIGH STRATEGIC VALUE– National Governments have launched important Programs increasing
• Market• Production capacity• R&D efforts

INCENTIVESCountry Initiatives
ITALY Roof top programme almost completed (17 MW). Feed-in tariff launched in September 2005 (from 50 to 60 c€/kWh). 80 MW/year
FRANCE Public subsidy: 57% of installed cost. Budget: 18,9 M€
GERMANY Feed-in law amended (50 c€/kWh + soft loans). Budget in 2004: 250 M€. Installed power 1400 MW
SPAIN Feed-in tariffs ranging from 40 to 70 c€/kWh. Total capacity 150 MW
UK Major Demonstration Programme. Budget 31 MGBP. Grants: 50%
JAPAN Incentives on capital cost reduced to 5-10%. Budget 40 M€. Installed power 1400 MW. Target 5 GW by 2010
USA Subsidy and tax credit in California, Arizona, New Jersey, New York and North Carolina for a total budget of 180 M$
CHINA National Township Electrification Program: 660 villages (16 MW) + 10 000 (265 MW) by 2010
INDIA Solar PV Demonstration and Utilisation Program: 325 000 SHS installed with grant support

NATIONAL PROGRAMS
• STRATEGY AND MOTIVATION– Market growth (allowing companies to plan their
investments)– Technology diffusion– PV industries reinforcement– Definition of continuative R&D programs– New job opportunities
• FINAL GOAL– Economic competitiveness achievement
• Scale factor• Development of most competitive components

NATIONAL PROGRAMS
0
200
400
600
800
1000
1200
1400
1994 1995 1996 1997 1998 1999 2000 2001 2002 2003 2004
MU
SD
Market Stimulation
Demonstration
R & D
Public budget• Over a decade public spending has increased from year to year
• Spending initially focused on R&D
• Spent on market stimulation increased in 2001
• Market stimulation started to decrease in 2004
IEA source
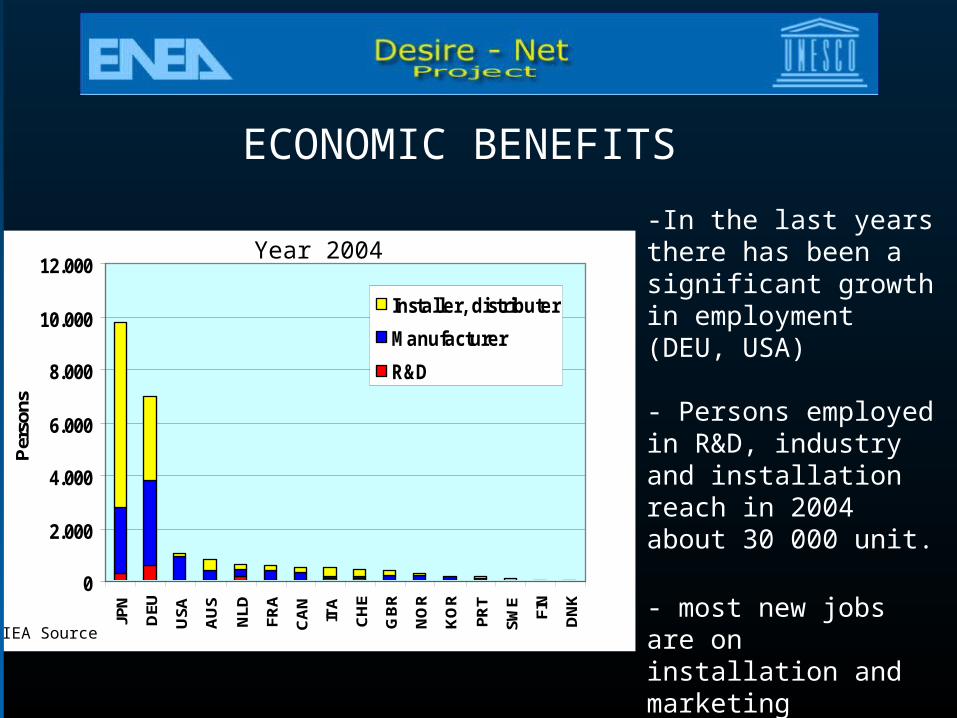
ECONOMIC BENEFITS
0
2.000
4.000
6.000
8.000
10.000
12.000
JPN
DEU
USA
AU
S
NLD
FRA
CA
N
ITA
CH
E
GB
R
NO
R
KO
R
PRT
SWE
FIN
DN
K
Per
sons
Installer, distributer
Manufacturer
R&D
-In the last years there has been a significant growth in employment (DEU, USA)
- Persons employed in R&D, industry and installation reach in 2004 about 30 000 unit.
- most new jobs are on installation and marketing
- component production tend to move towards low cost base economy
Year 2004
IEA Source
ITALIAN PV PROGRAMME
• Strategic goals– PV cost decrease– Development of national competitive industries– Local development – New job opportunities
• Relevant results– 38 MW of total cumulative PV power installed– National roof-top and feed-in Programmes– Big effort in RD&D– Competitive industrial system (production capacity 30 MW/y)– Growth of popular acceptance for PV

R&D ORGANIZATIONS IN ITALY
Organisation R&D areaENEA (Casaccia, Portici) c-Si, a-Si, a-Si/c-Si
heterostructures
Institute for Certification (CESI)
GaAs (space/terrestrial applications)
University of Milan c-Si
University of Ferrara c-Si
University of Parma Compound films
National Council for Scientific Research (Bari)
a-Si
National Council for Scientific Research (Bologna)
c-Si, a-Si/c-Si heterostructures
ENEA R&D ACTIVITIES
• Systems and components
– Small grid connected plants• Characterisation of BIPV modules and ageing tests• Development of innovative inverters• Inverter characterisation and pre-qualification• Grid interface device tests
– Hybrid systems
– Medium size plants• Experimentation and long term performance analysis

ITALIAN ROOF-TOP PROGRAMME
• Started on March 2001
• Small grid connected BIPV plants
• Economic incentives: only on investment cost (up to 75%)
• Maximum investment cost allowed: 7 – 8 €/W
• Public funds: 115 M€
• Total investments: 175 M€ (23 MW expected)
• Starting phase (tune procedures and check people consensus)– National Programme
• 21 Regional Programmes
DECREE 387/03
• Put into effect the EU Directive 77/2001/CE in the Italian legislation and forecasts:– an annual increase of 0,35% in “green sources” share
obligation, from current 2%; – procedure simplification for plant installation and grid
connection;– advertising campaigns;– facilitations for small renewable source plants up to 20 kW
• Forecasts dedicated support measures for PV that include:– fixed feed-in tariffs, decreasing over time, for different
installations and a purchase obligation by the utilities.
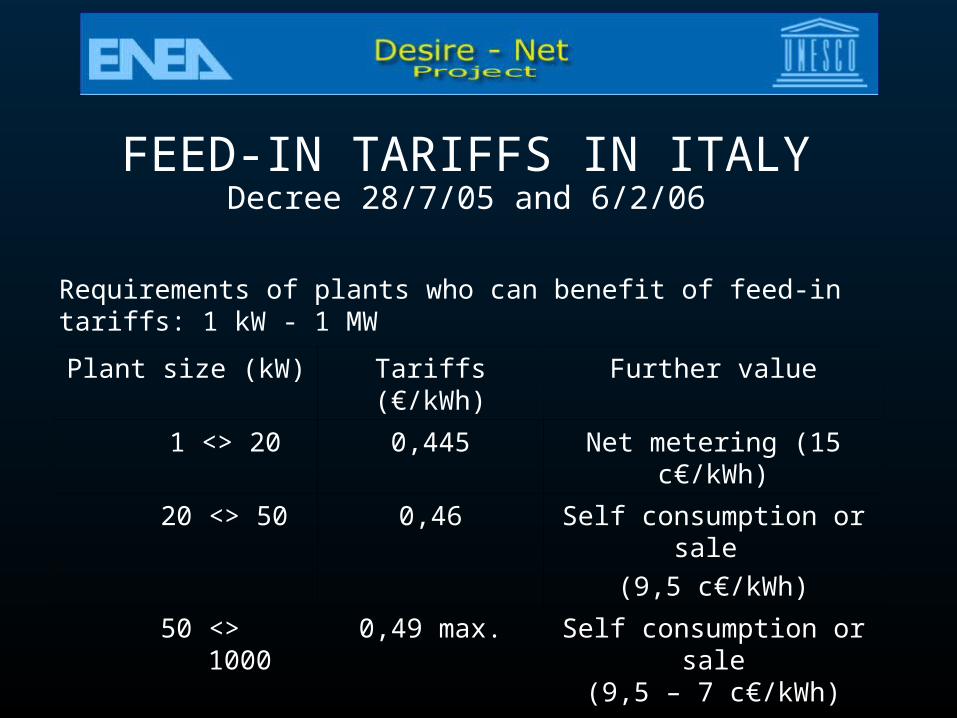
FEED-IN TARIFFS IN ITALYDecree 28/7/05 and 6/2/06
Plant size (kW) Tariffs (€/kWh) Further value
1 <> 20 0,445 Net metering (15 c€/kWh)
20 <> 50 0,46 Self consumption or sale
(9,5 c€/kWh)
50 <> 1000 0,49 max. Self consumption or sale(9,5 – 7 c€/kWh)
Requirements of plants who can benefit of feed-in tariffs: 1 kW - 1 MW

FEED-IN TARIFF IN ITALY
– Duration of the support : 20 years
– Maximum Power to be supported: 500 MW
• 360 MW (< 50 kWp) + 140 MWp (> 50 kWp)
– Annual limit: 80 MW
– Final target at 2015: 1 GW
– Tariff reduction:5%/year
– Tariff increased of 10% for BIPV– Resources for the allocation of feed-in tariffs are covered by
the revenue of the A3 component of the electric tariff (3 €/Year/user)

APPLICATIONS SUBMITTED IN 2005
• Admitted applications within September: 2.914 (79% of submitted)– 2.868 P<50 kW (60,6 MW)– 46 P>50 kW (27 MW)
• Admitted applications within December: 6.207 (75% of submitted) – 6.137 P<50 kW (134,7 MW)– 70 P>50 kW (43,7 MW)
• Cumulated power in 2005: 266 MW
• Most active regions: Apulia, Sicily, Campania.

SUPPORT INCENTIVES COMPARISON
CAPITAL COSTS FEED-IN TARIFFS
End user Citizen, public organization (limited capital)
Investors, builders, commercial subjects (cash flow availability)
Management Public Bodies (Regions, Ministry)
Electric Utilities
Economic consideration
To overcome economic barrier in s.a or g.c. applications
To internalize externalities of traditional sources
Problems Don’t encourage investment for PV
Impact on the market depends on tariff value

CONCLUSIONS
• Although impressive progress have already been made, the early stage of PV development indicates a large margin of growth.
In the next 10-20 years is expected:– Efficiency 10-25% (35%: concentrators), lifetime 40 years– Electricity cost from PV: 5-15 c€/kWh– Components based on abundant non toxic materials– Implementation of new concepts (III generation)– BIPV in all new building (net producer)– Multi MW in deserts (hydrogen production)– Cumulated power: 200-400 GW– Jobs created: 300 000– Electricity to 100 million families

CONCLUSIONS
• In order to achieve the expected aims is necessary:– Define the strategies and the goals– Develop policy initiatives– Balance the efforts in R&D with the PV potential– Accelerate the transfer from research to production– Overcome the barriers (technical, standardization, financing,
market)– Strength the cooperation among sectors (electronics, buildings,
nanotechnologies)– Develop sustainable support measures (decreasing)– Foster the connection among R&D, Industry and Policy
Top Related