


Languages
Pages
Legal

gy. 93(1):52-65, 2012
The origin of recently established red fox populations in the United States: translocations or natural range expansions?
MARK J. STATHAM, BENJAMIN N. SACKS, KEITH B. AUBRY, JOHN D. PERRINE, AND SAMANTHA M. WISELY*
Division of Biology, 116 Ackert Hall, Kansas State University, Manhattan, KS, USA (MJS, SMW)
Canid Diversity and Conservation Lab, 248 CCAH, Veterinary Genetics Laboratory, University of California, Davis,
One Shields Avenue, Davis, CA 95618, USA (MJS, BNS)
United States Department of Agriculture Forest Service, Pacific Northwest Research Station, 3625 93rd Ave. SW, Olym
pia, WA 98512, USA (KBA)
Biological Sciences Department, 275 Fisher Hall, California Polytechnic State University, San Luis Obispo, CA 93407,
USA (JDP)
Present address of SMW: Wildlife Ecology and Conservation and Ordway-Swisher Biological Station, Conservation
Genetics and Molecular Ecology Lab, 110 Newins-Ziegler Hall, University of Florida, Gainesville, FL 62611, USA
* Correspondent: [email protected]
Red foxes (Vulpes vulpes) are native to boreal and western montane portions of North America but their origins are unknown in many lowland areas of the United States. Red foxes were historically absent from much of the
East Coast at the time of European settlement and did not become common until the mid-1800s. Some early
naturalists described an apparent southward expansion of native foxes that coincided with anthropogenic habitat
changes in the region. Alternatively, red foxes introduced from Europe during Colonial times may have become
established in the east and subsequently expanded their range westward. The red fox also was absent historically from most lowland areas of the western United States. Extant populations of red foxes in those areas are
considered to have arisen from intentional introductions from the east (and by extension are putatively
European), escapes or releases from fur farms, or range expansions by native populations. To test these
hypotheses we compared mitochondrial DNA sequences (cytochrome b and D-loop) from 110 individuals from
6 recently established populations to 327 native (primarily historical) individuals from Eurasia, Alaska, Canada,
the northeastern United States, and montane areas in the western contiguous United States, and to 38 individuals
from fur farms. We found no Eurasian haplotypes in North America, but found native haplotypes in recently
established popUlations in the southeastern United States and in parts of the western United States. Red foxes
from the southeastern United States were closely related to native populations in eastern Canada and the northeastern United States, suggesting that they originated from natural range expansions, not from
translocation of European lineages, as was widely believed prior to this study. Similarly, recently established
populations in the Great Basin and in western Oregon originated primarily from native populations in western
montane regions, but also contained a few nonnative North American haplotypes. In contrast, populations in
western Washington and southern California contained nonnative, highly admixed stock that clearly resulted
from intracontinental translocations. Several common haplotypes in these populations originated in regions where fur-farm stocks originated. Although European red foxes translocated to the eastern United States during Colonial times may have contributed genetically to extant populations in that region, our findings suggest that
most of the matrilineal ancestry of eastern red foxes originated in North America.
Key words: fur farm, mitochondrial DNA, museum samples, phylogeography, red fox, translocation, Vulpes vulpes
© 2012 American Society of Mammalogists
DOl: 1O.1644/ll-MAMM-A-033.l
www .m"mm,logy.ocg � 52
February 20 12 STATHAM ET AL.-ORIGIN OF RED FOX POPULATIONS IN USA 53
_ Holarctic clade
Eastern lineage
D MOllntain lineage
120'W
45' N
25' N
100'W SO'W
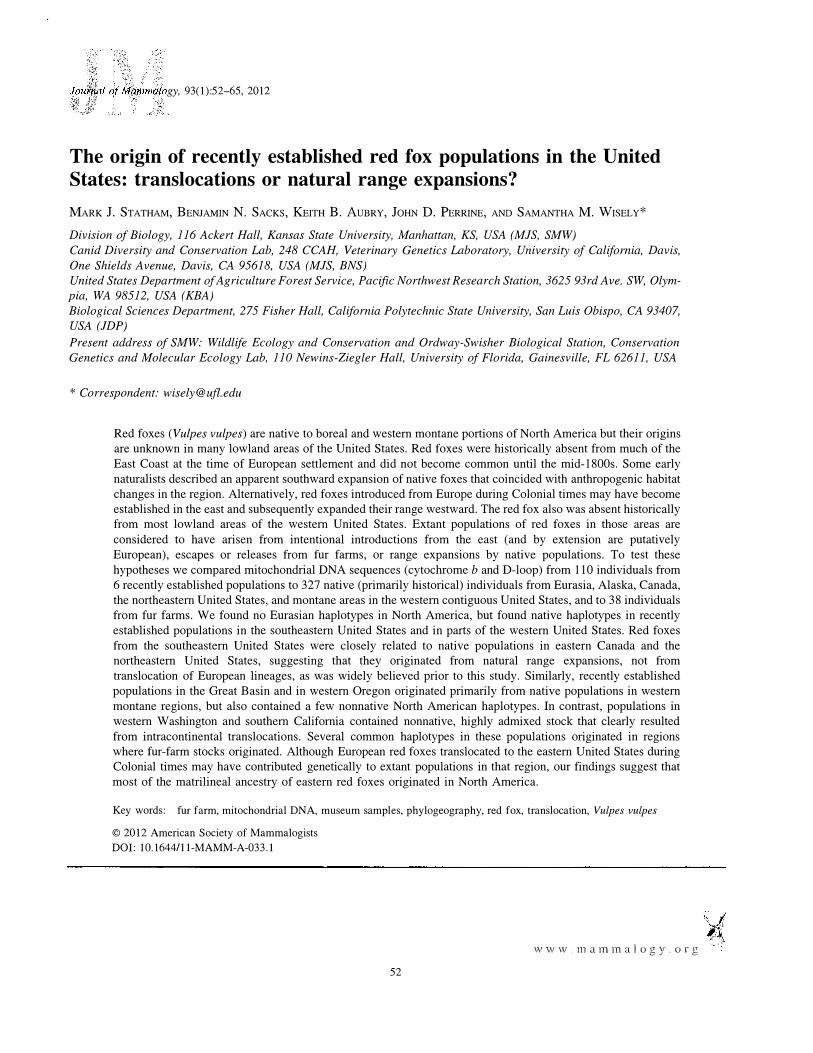
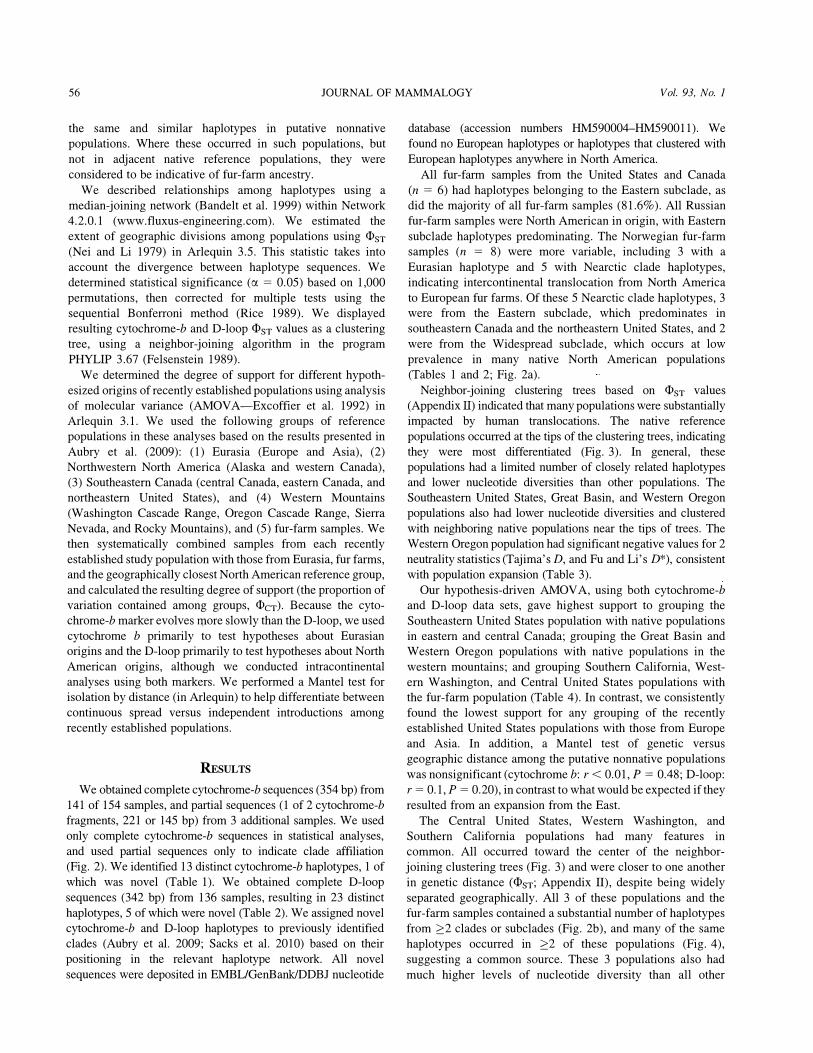
FIG. I.-Approximate geographic distribution of North American red fox mitochondrial DNA lineages prior to European settlement modified from Aubry et al. (2009). The Eastern and Mountain lineages together comprise the Nearctic clade, which is restricted to North America. The Nearctic clade contains 3 subclades: Eastern, Mountain, and Widespread. The Mountain subclade makes up the majority of haplotypes within the Mountain lineage, whereas the Eastern subclade makes up the majority in the Eastern lineage; remaining haplotypes in both regions belong to the Widespread subclade. The Holarctic clade is distributed from Europe through Asia to Alaska and western Canada. The Holarctic and Eastern lineages overlap in western Canada, which is represented with gray and black diagonal lines. The area depiCted for the Mountain subclade represents the distribution of native montane populations.
The red fox (Vulpes vulpes) is the world's most widely
distributed terrestrial carnivore (Lariviere and Pasitschniak
Arts 1996); its range has increased substantially in modem times due to expansion of native populations associated with
habitat alterations (Lloyd 1980; Nowak 1991) and anthropo
genic translocations (Long 2003). Whether origins of a
particular population are natural or anthropogenic often is
obscured by morphological similarity of even anciently
diverged red fox lineages. For example, it remains unclear
and contentious whether red foxes from the eastern United
States originated from in situ range expansion from the north or
intercontinental translocation of European foxes, which di
verged from common ancestry 400,000 years ago and were
once considered distinct species (Aubry et al. 2009; Churcher
1959; Kamler and Ballard 2002). Identifying the origins of red
fox populations is important to conservation efforts aimed at
endangered native populations and protection of endangered
prey populations impacted by nonnative red foxes. Given the
cryptic differences among native and nonnative populations,
genetic tools are essential for understanding phylogeographic
histories (Larsen et a1. 2005; S¢nsteb¢ et a1. 2008). Here, we
focus on North American populations, particularly those
established in the lowland areas of the contiguous United
States.
Prior to European settlement, native populations of the red
fox in North America comprised 3 evolutionarily divergent
lineages that occurred primarily in the boreal forests of Canada and Alaska and the subalpine parklands and alpine
meadows of montane regions in the western contiguous United
States (Fig. 1; Aubry et a1. 2009, but see Sacks et al. 2010).
During the last or Wisconsin ice age, the Mountain and
Eastern lineages (see Aubry et a1. 2009) became isolated south
of the ice sheets in the contiguous United States in forested
refugia of the Rocky Mountains, Cascade Range, and Sierra
Nevada (hereafter, the western mountains) and in the eastern
contiguous United States (hereafter, the East). These 2
lineages, which currently dominate red fox populations in
the western mountains and in eastern Canada, together
comprise the Nearctic clade. The 3rd phylogenetically distinct
lineage, the Holarctic clade, was isolated in unglaciated
portions of Alaska and the Yukon during the last glaciation,
and is the dominant lineage in Alaska and western Canada.
The Nearctic and Holarctic clades diverged about
400,000 years ago and represent 2 separate colonization
events by the red fox across the Bering Land Bridge from
Eurasia during Pleistocene glaciations (Aubry et a1. 2009).
During the past 300 years, humans have dramatically
altered many habitats in the contiguous United States and
54 JOURNAL OF MAMMALOGY Vol. 93, No.1
implemented both inter- and intracontinental translocations of
red foxes (Aubry 1984; Bailey 1936b; Lewis et al. 1999; Nowak
1991; Whitlow and Hall 1933). Consequently, it has been
unclear (and biologists have long debated) whether recently
established red fox populations in North America originated
from natural range expansions or anthropogenic transloca
tions (Aubry 1983, 1984; Churcher 1959; Grinnell
et al. 1937; Kamler and Ballard 2002; MacPherson 1965;
Newberry 1857). The emergence of red fox populations in new
locations of North America occurred during 2 distinct time
periods: those that appeared in the eastern United States during
the Colonial era (approximately 1650-1800), and those that
appeared in various parts of the western contiguous United
States (hereafter, the West) during the 20th century (Aubry
1984; Kamler and Ballard 2003; Lewis et al. 1999; Seton 1929).
Red foxes were reportedly absent from much of the East
during Colonial times, and did not become common in that
region until the mid-1800s (Churcher 1959; Rhoads 1903).
Some early naturalists described an apparent southward range
expansion by populations of native red foxes that had been
restricted previously to the northeastern United States and
southeastern Canada. They hypothesized that this shift in the
red fox's southern range boundary was driven by the conversion
of hardwood forests to farmlands by European settlers, and
resulting changes in competitive interactions with the gray fox
(Urocyon cinereoargenteus-Audubon and Bachman 1849;
Baird 1857; Newberry 1857). In particular, Audubon and
Bachman (1849) described the serial emergence and increase of
red foxes from southern New York and possibly northern
Pennsylvania southward into Virginia, North Carolina, South
Carolina, and, by 1840, northern Georgia, along the Appala
chian Mountains. Newberry (1857) described a similar trend
from eastern Canada southward into the Midwest. On the other
hand, red foxes imported from Europe during the mid-1700s for
hunting purposes provided another potential source of colonists
to the changing landscape of the Eastern Seaboard, leading
other naturalists to surmise that the' 'east American Red-fox is
probably a mongrel ... " (Rhodes 1903: 145) or as Seton
(1929:475) later put it, that the European red fox "has mixed
with the native Red fox and the offspring spread and increased
through the forest region as it was opened up ... . "
Churcher's (1959) morphometric study of North American
and Eurasian red foxes provided the 1st empirical evidence for
evaluating the extent to which European ancestry might
influence eastern red fox populations. Churcher (1959) found
that certain dental and cranial characteristics varied c1inally
from Europe through North America, via Beringia, and that
European red foxes were most distinct from those in eastern
North America (i.e., that they represented opposite ends
of a morphological continuum), indicating that eastern red
fox populations were derived primarily from native North
American ancestry. Nonetheless, some contemporary research
ers have presumed that modern red fox populations in the east
are primarily European in origin (Kamler and Ballard 2002).
During the 20th century, red fox popUlations arose in
several areas in the West where they were absent historically.
With the exception of an ecologically distinct subspecies
endemic to the Sacramento Valley of California (Sacks et al.
2010), red foxes native to the West were thought to have been
restricted to the subalpine parklands and alpine meadows of the
western mountain ranges (Aubry 1983, 1984; Grinnell
et al. 1937). Populations of unknown origin began appearing
outside these ecologically restricted areas during the 1900s
(Aubry 1983, 1984; Fichter and Williams 1967; Kamler and
Ballard 2002; Lewis et al. 1999; Verts and Carraway 1998).
Most recently established popUlations of the red fox in the West
were hypothesized to have originated from translocations from
the East or from the escape or release of fur-farm animals that
were presumably imported primarily from Prince Edward
Island, Canada, or southern Alaska (Aubry 1983, 1984; Balcom
1916; Laut 1921; Lewis et al. 1999; Petersen 1914; Westwood
1989). However, others hypothesized that the recent (after 1940)
colonization of previously unoccupied habitats in southern Idaho
(Fichter and Williams 1967) and in the Willamette Valley in
Oregon (Verts and Carraway 1998) could partly or fully reflect
natural range expansions by native populations or increases in
density by previously undetected native populations. In the
Central Valley of California, where the native Sacramento
Valley red fox (V. v. patwin) is contiguous with a population of
nonnative red foxes, the 2 populations interbreed within a
narrow hybrid zone, suggesting the possibility of admixture in other locations as well (Sacks et al. 2011).
Based on their extensive review of the topic, Kamler and
Ballard (2002) hypothesized that post-Colonial range expan
sions resulted primarily from the dispersal of introduced
European red foxes throughout the East, whereas range
expansions that occurred during the 20th century resulted
from the gradual expansion westward of these putatively
nonnative red foxes. They further hypothesized that European
red foxes have expanded into the native red fox range and
"likely replaced native red foxes throughout all northern
boreal regions ... ." Thus, they proposed that, with the
exception of montane populations in the West, most North
American red foxes are of European ancestry.
Because of strong phylogenetic differences among native
North American and Eurasian red fox populations (Aubry
et al. 2009), sequence data from mitochondrial DNA (mtDNA)
can be used to test these hypotheses. We used mtDNA
analyses to investigate the ancestry of populations of red foxes
in the contiguous United States that apparently became
established after European settlement. In partiCUlar, we tested
the following hypotheses: red foxes in the eastern United
States are of European descent or stem from native
populations in northern Appalachia or southeastern Canada;
and red fox popUlations in lowland areas of the western United
States stem from fur farms, a wave of expansion from the east,
or range expansion by nearby native popUlations.
MATERIALS AND METHODS
Sample collection.-We investigated the ongms of red
foxes in 6 geographical units (hereafter referred to as
February 20 12 STATHAM ET AL.-ORIGIN OF RED FOX POPULATIONS IN USA 55
populations) in the contiguous United States. Populations 1
and 2 occupy areas south of the range of native red foxes in
North America (Fig. 1) and did not appear in those areas until
after European settlement: (1) Southeastern United States
(Arkansas, Georgia, Indiana, North Carolina, Oklahoma,
Texas, and West Virginia; n = 18) and (2) Central United
States (Iowa, Kansas, Minnesota, North Dakota, and South
Dakota; n = 13). We considered these popUlations as distinct
because they have marked differences in body size, and are
classified as separate subspecies (Bailey 1936b; Hall and
Kelson 1959; Merriam 1900). The remaining 4 populations
were more recently established ( < 100 years ago) in the West:
(3) Western Washington (lowland areas in Washington west of
the Cascade Range; n = 23), (4) Western Oregon (lowland
areas in Oregon west of the Cascade Range; n = 13), (5) Great
Basin (lowland areas in Oregon and Washington east of the
Cascade Range, in Idaho south of the Snake River plain, and
in Nevada; n = 28); and (6) Southern California (lowland
areas south of the American River in California; n = 21). We
also included 38 samples from red fox fur farms in the United
States, Canada, Norway, and Russia.
Most of our samples were nasal turbinate bones (n = 66), skin
snips (n = 7), or frozen tissues (n = 20) obtained from museum
specimens collected from 1885 to 1991 (Appendix I). Several
modem samples were from frozen or dried tissue (n = 25) or
buccal swabs (n = 4). Additionally, we used 8 previously
extracted DNA samples from Norwegian farmed red foxes
provided by D.l. Vage (Norwegian University of Life Sciences),
and sequences from 24 domesticated Russian silver foxes known
to have originated from fur farms (Statham et al. 2011).
To reference native North American populations, we used
previously published cytochrome-b and D-Ioop haplotypes
from Alaska (n = 69), Canada (n = 72), and the western
mountains (n = 94), which were primatily museum specimens
collected in the late 1800s and early 1900s, augmented with
modern samples proven to reflect continuous ancestry (Aubry
et al. 2009; Sacks et al. 2010). We included 7 additional
samples from the northeastern United States and southeastern
Canada in the native data set from eastern Canada because all
were from the historical range of native red foxes, most were
collected during the 1800s prior to the advent of fur farming,
and all have native North American haplotypes. To reference
European populations, we used cytochrome-b haplotypes
collected from wild populations throughout continental
Europe (n = 47) and Britain (n = 10-Aubry et al. 2009;
C. Edwards and C. Soulsbury, in litt.; Frati et al. 1998), and 8
D-Ioop haplotypes from continental Europe (Aubry et al.
2009). To reference Asian popUlations, we used cytochrome-b
and D-Ioop haplotypes from China, Mongolia, and eastern
Siberia (n = 21-Aubry et al. 2009). Insufficient numbers of
published European D-loop haplotypes homologous to our
342-base pair (bp) fragment (see below) were available for
inclusion in formal analyses; however, we compared our
sequences to overlapping portions of European (n = 74-
Valiere et al. 2003) and Asian (n = 88-Inoue et al. 2007)
D-Ioop haplotypes available in GenBank.
Laboratory procedures.-We extracted DNA from histor
ical samples (turbinates and skin snips) at Kansas State
University following a phenol-chloroform extraction proce
dure described in Wisely et al. (2004) in a designated ancient
DNA laboratory. We followed rigorous protocols to control
for contamination of historical samples with modern DNA or
polymerase chain reaction products (Aubry et al. 2009). We
extracted tissue samples and buccal swabs using a DNeasy
Blood and Tissue kit (Qiagen, Inc., Valencia, California) in
separate modern DNA laboratories as described previously
(Perrine et al. 2007; Sacks et al. 2010).
We amplified the 5' portion of the cytochrome-b gene and
the D-Ioop, and purified and sequenced polymerase chain
reaction products as described previously (Aubry et al. 2009;
Perrine et al. 2007; Sacks et al. 2010). We used Chromas
version 1.45 (Technelysium Pty. Ltd., Helensvale, Australia),
and Sequencher version 4.2 (Gene Codes, Inc., Ann Arbor,
Michigan) to visualize chromatograms, and MegaAlign
(DNASTAR, USA, Madison, Wisconsin) to align sequences.
Data analyses.-We based our analyses on a 354-bp portion
of the cytochrome-b gene, and a 342-bp portion (including
insertions and deletions) of the D-Ioop (Aubry et al. 2009;
Perrine et al. 2007; Sacks et al. 2010). We translated the
cytochrome-b sequences into amino acid sequences to ensure
that they encoded for a continuous polypeptide.
Introduced populations often show genetic signatures of
admixture, founder effects, and recent popUlation expansion
(Kidd et al. 2009; Kolbe et al. 2004; Noren et al. 2005; Senn and
Pemberton 2009). Therefore, we used contrasting patterns of
haplotype and nucleotide diversity to detect these signatures in
recently established red fox popUlations. We estimated
haplotype diversity (h) and nucleotide diversity (rr-Nei
1987) using Arlequin 3.5 (Excoffier and Lischer 2010). We
used 3 neutrality statistics to detect signatures of past
demographic events on population growth or stability using
Arlequin 3.5 and DnaSP version 5 (Rozas et al. 2003). Tajima's
(1989) D statistic compares the number of nucleotide
differences between sequences in a sample (rr) and the number
of differences between segregating sites (8). Fu and Li's (1993)
D* is based on the difference between the number of single
occurring mutations in a population and the total number of
mutations. Fu and Li's (1993) F* is based on the difference
between the average number of nucleotide differences between
pairs of sequences and the number of singleton mutations. For a
stable and randomly mating population, all 3 statistics are
expected to be 0; negative values indicate an excess of low
frequency polymorphisms, suggesting population expansion,
whereas positive values indicate an excess of intermediate
frequency polymorphisms (Zhu et al. 2007), suggesting
secondary contact between 2 or more distinct lineages (Fredsted
et al. 2007). We calculated these statistics for the D-Ioop, which
has greater variability than cytochrome b, and is assumed to be
neutrally evolving. We used DnaSP version 5 to calculate
Strobeck's (1987) S, an index of admixture, which is
characteristic of populations originating from multiple sources.
We also used the data from the fur-farm samples to screen for
56 JOURNAL OF MAMMALOGY Vol. 93, No. 1
the same and similar haplotypes in putative nonnative
populations. Where these occurred in such populations, but
not in adjacent native reference populations, they were
considered to be indicative of fur-farm ancestry.
We described relationships among haplotypes using a
median-joining network (Bandelt et al. 1999) within Network
4.2.0.1 (www.fluxus-engineering.com). We estimated the
extent of geographic divisions among populations using <l>ST (Nei and Li 1979) in Arlequin 3.5. This statistic takes into
account the divergence between haplotype sequences. We
determined statistical significance (a. = 0.05) based on 1,000
permutations, then corrected for multiple tests using the
sequential Bonferroni method (Rice 1989). We displayed
resulting cytochrome-b and D-Ioop <l>ST values as a clustering
tree, using a neighbor-joining algorithm in the program
PHYLIP 3.67 (Felsenstein 1989).
We determined the degree of support for different hypoth
esized origins of recently established populations using analysis
of molecular variance (AMOVA-Excoffier et al. 1992) in
Arlequin 3.1. We used the following groups of reference
populations in these analyses based on the results presented in
Aubry et al. (2009): (1) Eurasia (Europe and Asia), (2)
Northwestern North America (Alaska and western Canada),
(3) Southeastern Canada (central Canada, eastern Canada, and
northeastern United States), and (4) Western Mountains
(Washington Cascade Range, Oregon Cascade Range, Sierra
Nevada, and Rocky Mountains), and (5) fur-farm samples. We
then systematically combined samples from each recently
established study population with those from Eurasia, fur farms,
and the geographically closest North American reference group,
and calculated the resulting degree of support (the proportion of
variation contained among groups, <l>CT). Because the cyto
chrome-b marker evolves qlore slowly than the D-Ioop, we used
cytochrome b primarily to test hypotheses about Eurasian
origins and the D-Ioop primarily to test hypotheses about North
American origins, although we conducted intracontinental
analyses using both markers. We performed a Mantel test for
isolation by distance (in Arlequin) to help differentiate between
continuous spread versus independent introductions among
recently established populations.
RESULTS
We obtained complete cytochrome-b sequences (354 bp) from
141 of 154 samples, and partial sequences (1 of 2 cytochrome-b
fragments, 221 or 145 bp) from 3 additional samples. We used
only complete cytochrome-b sequences in statistical analyses,
and used partial sequences only to indicate clade affiliation
(Fig. 2). We identified 13 distinct cytochrome-b haplotypes, 1 of
which was novel (Table 1). We obtained complete D-Ioop
sequences (342 bp) from 136 samples, resulting in 23 distinct
haplotypes, 5 of which were novel (Table 2). We assigned novel
cytochrome-b and D-Ioop haplotypes to previously identified
clades (Aubry et al. 2009; Sacks et al. 2010) based on their
positioning in the relevant haplotype network. All novel
sequences were deposited in EMBLIGenBanklDDBl nucleotide
database (accession numbers HM590004-HM590011). We
found no European haplotypes or haplotypes that clustered with
European haplotypes anywhere in North America.
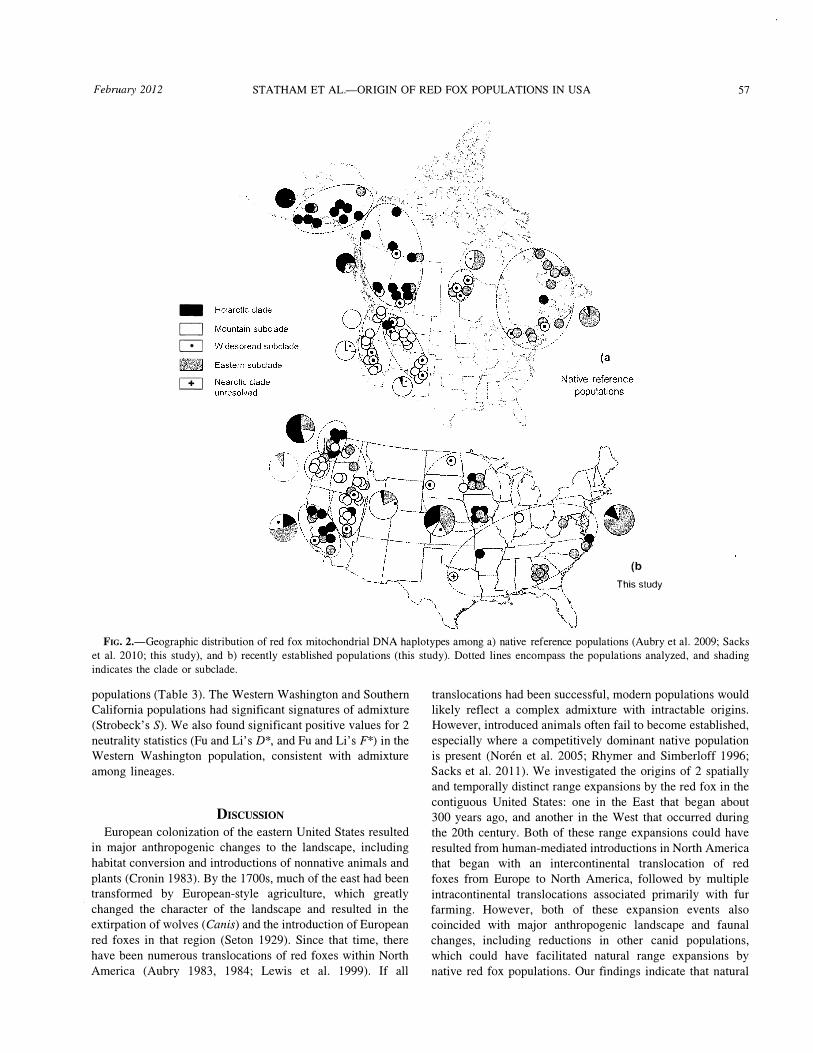
All fur-farm samples from the United States and Canada
(n = 6) had haplotypes belonging to the Eastern subclade, as
did the majority of all fur-farm samples (81.6%). All Russian
fur-farm samples were North American in origin, with Eastern
subclade haplotypes predominating. The Norwegian fur-farm
samples (n = 8) were more variable, including 3 with a
Eurasian haplotype and 5 with Nearctic clade haplotypes,
indicating intercontinental translocation from North America
to European fur farms. Of these 5 Nearctic clade haplotypes, 3
were from the Eastern subclade, which predominates in
southeastern Canada and the northeastern United States, and 2
were from the Widespread subclade, which occurs at low
prevalence in many native North American populations
(Tables 1 and 2; Fig. 2a).
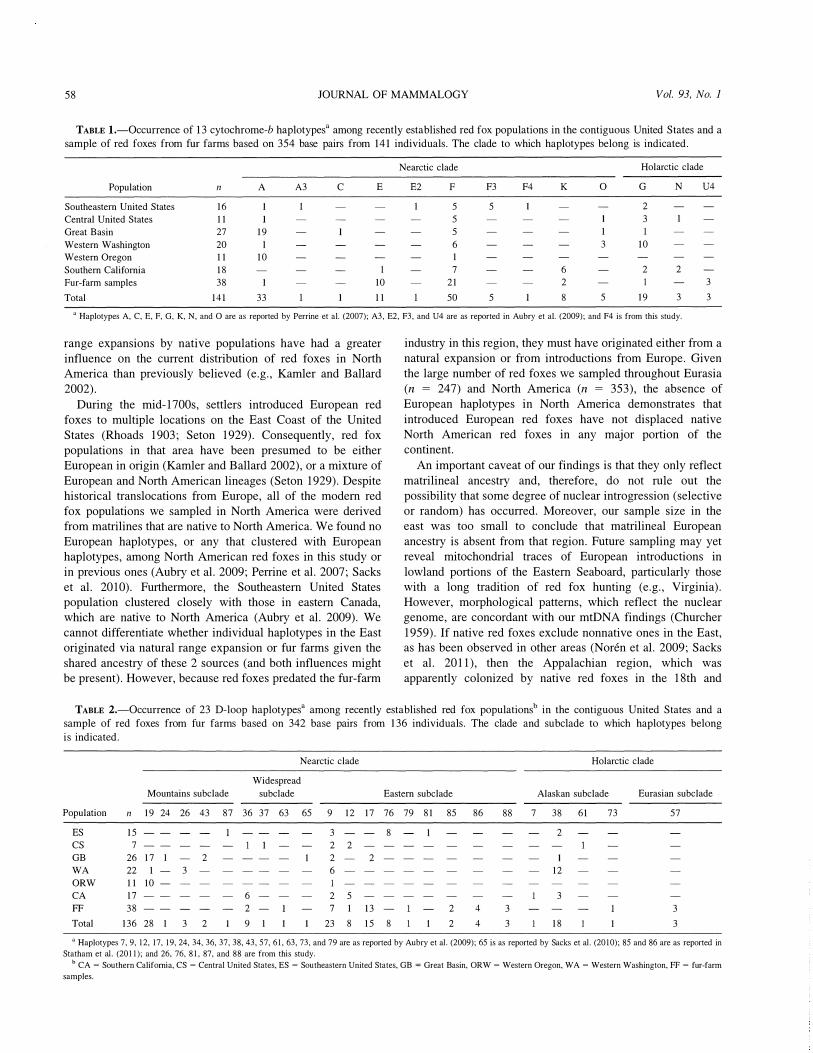
Neighbor-joining clustering trees based on <l>ST values
(Appendix IT) indicated that many populations were substantially
impacted by human translocations. The native reference
populations occurred at the tips of the clustering trees, indicating
they were most differentiated (Fig. 3). In general, these
populations had a limited number of closely related haplotypes
and lower nucleotide diversities than other populations. The
Southeastern United States, Great Basin, and Western Oregon
populations also had lower nucleotide diversities and clustered
with neighboring native populations near the tips of trees. The
Western Oregon population had significant negative values for 2
neutrality statistics (Tajima's D, and Fu and Li's D*), consistent
with population expansion (Table 3).
Our hypothesis-driven AMOV A, using both cytochrome-b
and D-Ioop data sets, gave highest support to grouping the
Southeastern United States population with native populations
in eastern and central Canada; grouping the Great Basin and
Western Oregon populations with native populations in the
western mountains; and grouping Southern California, West
ern Washington, and Central United States populations with
the fur-farm population (Table 4). In contrast, we consistently
found the lowest support for any grouping of the recently
established United States populations with those from Europe
and Asia. In addition, a Mantel test of genetic versus
geographic distance among the putative nonnative populations
was nonsignificant (cytochrome b: r < 0.01, P = 0.48; D-Ioop:
r = 0.1, P = 0.20), in contrast to what would be expected if they
resulted from an expansion from the East.
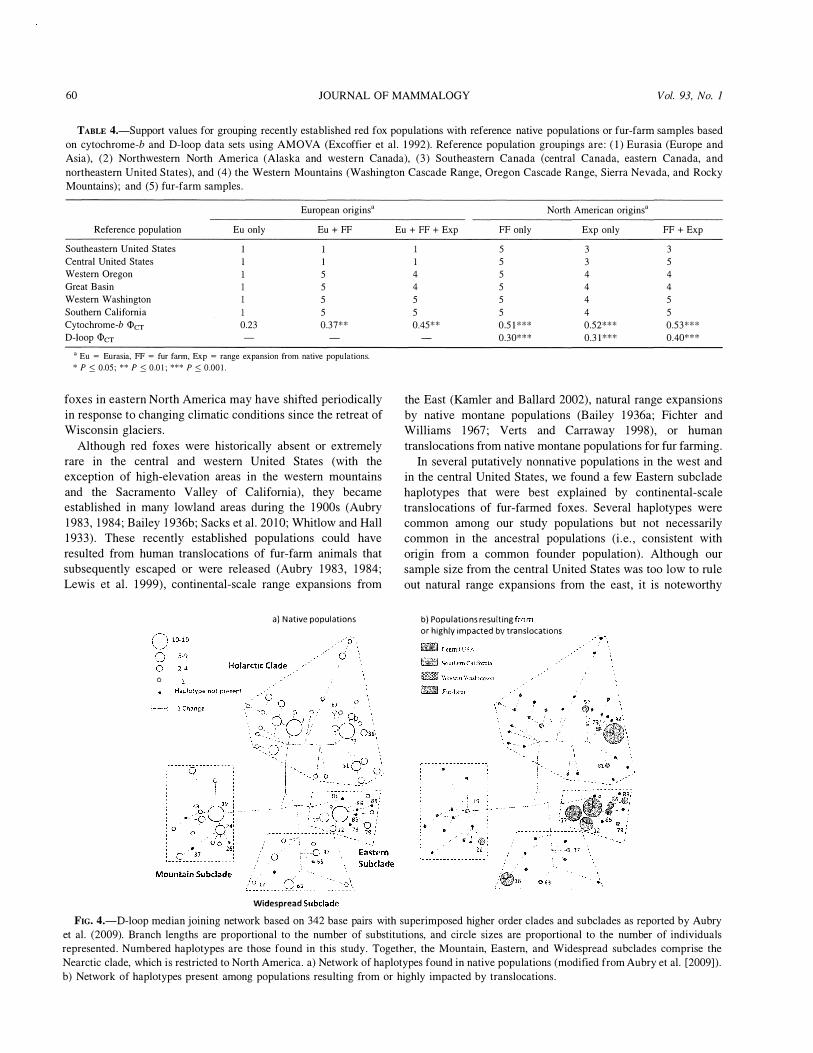
The Central United States, Western Washington, and
Southern California popUlations had many features in
common. All occurred toward the center of the neighbor
joining clustering trees (Fig. 3) and were closer to one another
in genetic distance (<l>ST; Appendix II), despite being widely
separated geographically. All 3 of these populations and the
fur-farm samples contained a substantial number of haplotypes
from 2:2 clades or subclades (Fig. 2b), and many of the same
haplotypes occurred in 2:2 of these populations (Fig. 4),
suggesting a common source. These 3 populations also had
much higher levels of nucleotide diversity than all other
February 20 12 STATHAM ET AL.-ORIGIN OF RED FOX POPULATIONS IN USA 57
-
D 8
-
m
(b This study
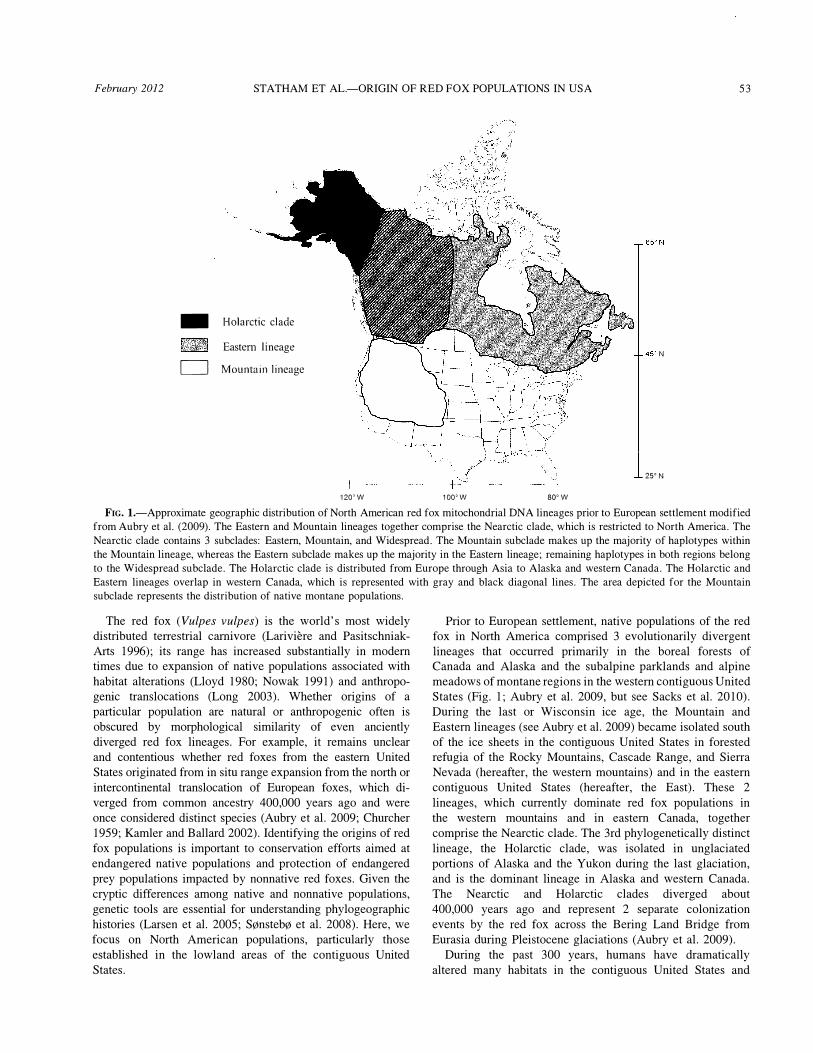
FIG. 2.-Geographic distribution of red fox mitochondrial DNA haplotypes among a) native reference populations (Aubry et al. 2009; Sacks et al. 2010; this study), and b) recently established populations (this study). Dotted lines encompass the populations analyzed, and shading indicates the clade or subclade.
populations (Table 3). The Western Washington and Southern
California populations had significant signatures of admixture
(Strobeck's S). We also found significant positive values for 2
neutrality statistics (Fu and Li's D*, and Fu and Li's F*) in the
Western Washington population, consistent with admixture
among lineages.
DISCUSSION European colonization of the eastern United States resulted
in major anthropogenic changes to the landscape, including
habitat conversion and introductions of nonnative animals and
plants (Cronin 1983). By the 1700s, much of the east had been
. transformed by European-style agriculture, which greatly
changed the character of the landscape and resulted in the
extirpation of wolves (Canis) and the introduction of European
red foxes in that region (Seton 1929). Since that time, there
have been numerous translocations of red foxes within North
America (Aubry 1983, 1984; Lewis et al. 1999). If all
translocations had been successful, modem populations would
likely reflect a complex admixture with intractable origins.
However, introduced animals often fail to become established,
especially where a competitively dominant native population
is present (Noren et al. 2005; Rhymer and Simberloff 1996;
Sacks et al. 2011). We investigated the origins of 2 spatially
and temporally distinct range expansions by the red fox in the
contiguous United States: one in the East that began about
300 years ago, and another in the West that occurred during
the 20th century. Both of these range expansions could have
resulted from human-mediated introductions in North America
that began with an intercontinental translocation of red
foxes from Europe to North America, followed by multiple
intracontinental translocations associated primarily with fur
farming. However, both of these expansion events also
coincided with major anthropogenic landscape and faunal
changes, including reductions in other canid populations,
which could have facilitated natural range expansions by
native red fox populations. Our findings indicate that natural
58 JOURNAL OF MAMMALOGY Vol. 93, No. 1
TABLE l.-Occurrence of 13 cytochrome-b haplotypesa among recently established red fox populations in the contiguous United States and a sample of red foxes from fur farms based on 354 base pairs from 141 individuals. The clade to which haplotypes belong is indicated.
Nearctic clade Holarctic clade
Population n A A3 C E E2 F F3 F4 K 0 G N U4
Southeastern United States 16 5 5 2 Central United States 11 5 3 Great Basin 27 19 5 1 Western Washington 20 6 3 10 Western Oregon 11 10 1 Southern California 18 7 6 2 2 Fur-farm samples 38 10 21 2 3
Total 141 33 11 50 5 8 5 19 3 3
• Haplotypes A, C, E, F, G. K, N, and 0 are as reported by Perrine et al. (2007); A3, E2, F3, and U4 are as reported in Aubry et al. (2009); and F4 is from this study.
range expansions by native populations have had a greater
influence on the current distribution of red foxes in North
America than previously believed (e.g., Kamler and Ballard
2002).
During the mid-1700s, settlers introduced European red
foxes to multiple locations on the East Coast of the United
States (Rhoads 1903; Seton 1929). Consequently, red fox
populations in that area have been presumed to be either
European in origin (Kamler and Ballard 2002), or a mixture of
European and North American lineages (Seton 1929). Despite
historical translocations from Europe, all of the modem red
fox populations we sampled in North America were derived
from matrilines that are native to North America. We found no
European haplotypes, or any that clustered with European
haplotypes, among North American red foxes in this study or
in previous ones (Aubry et al. 2009; Perrine et al. 2007; Sacks
et al. 2010). Furthermore, the Southeastern United States
population clustered closely with those in eastern Canada,
which are native to North America (Aubry et al. 2009). We
cannot differentiate whether individual haplotypes in the East
originated via natural range expansion or fur farms given the
shared ancestry of these 2 sources (and both influences might
be present). However, because red foxes predated the fur-farm
industry in this region, they must have originated either from a
natural expansion or from introductions from Europe. Given
the large number of red foxes we sampled throughout Eurasia
(n = 247) and North America (n = 353), the absence of
European haplotypes in North America demonstrates that
introduced European red foxes have not displaced native
North American red foxes in any major portion of the
continent.
An important caveat of our findings is that they only reflect
matrilineal ancestry and, therefore, do not rule out the
possibility that some degree of nuclear introgression (selective
or random) has occurred. Moreover, our sample size in the
east was too small to conclude that matrilineal European
ancestry is absent from that region. Future sampling may yet
reveal mitochondrial traces of European introductions in
lowland portions of the Eastern Seaboard, particularly those
with a long tradition of red fox hunting (e.g., Virginia).
However, morphological patterns, which reflect the nuclear
genome, are concordant with our mtDNA findings (Churcher
1959). If native red foxes exclude nonnative ones in the East, as has been observed in other areas (Noren et al. 2009; Sacks
et al. 2011), then the Appalachian region, which was
apparently colonized by native red foxes in the 18th and
TABLE 2.-0ccurrence of 23 D-loop haplotypesa among recently established red fox populationsb in the contiguous United States and a sample of red foxes from fur farms based on 342 base pairs from 136 individuals. The clade and subclade to which haplotypes belong is indicated.
Population
ES
CS
GB
WA
ORW
CA
FF
Total
Mountains subclade
Nearctic clade
Widespread
subclade Eastern subclade
n 19 24 26 43 87 36 37 63 65 9 12 17 76 79 81 85 86
15 7
26 17 1 2 22 1 - 3 11 10-17 38
136 28 1 3 2
6 2 -
9 1
3 2 2 2 6
2 5
2
7 1 13
8
23 8 15 8
2
2
4
4
Holarctic clade
Alaskan subclade Eurasian subclade
88 7 38 61
3
3
2
12
3
18
73 57
3
3
, Haplotypes 7, 9, 12, 17, 19, 24, 34, 36, 37, 38, 43, 57, 61, 63, 73, and 79 are as reported by Aubry et aJ. (2009); 65 is as reported by Sacks et aJ. (2010); 85 and 86 are as reported in
Statham et al. (2011); and 26, 76, 81, 87, and 88 are from this study.
b CA = Southern California, CS = Central United States, ES = Southeastern United States, GB = Great Basin, ORW = Western Oregon, WA = Western Washington, FF = fur-farm
samples.
February 20 12 STATHAM ET AL.-ORIGIN OF RED FOX POPULATIONS IN USA 59
Europe
A.Ia----' .....
Washington Cascade
Range
Oregon Cascade Range
Western Canada
a) Cytochrome b
Alaska
Washington Cascade
Ranga
Sierra
Europe
Asi.
Western Canada
b) D-loop
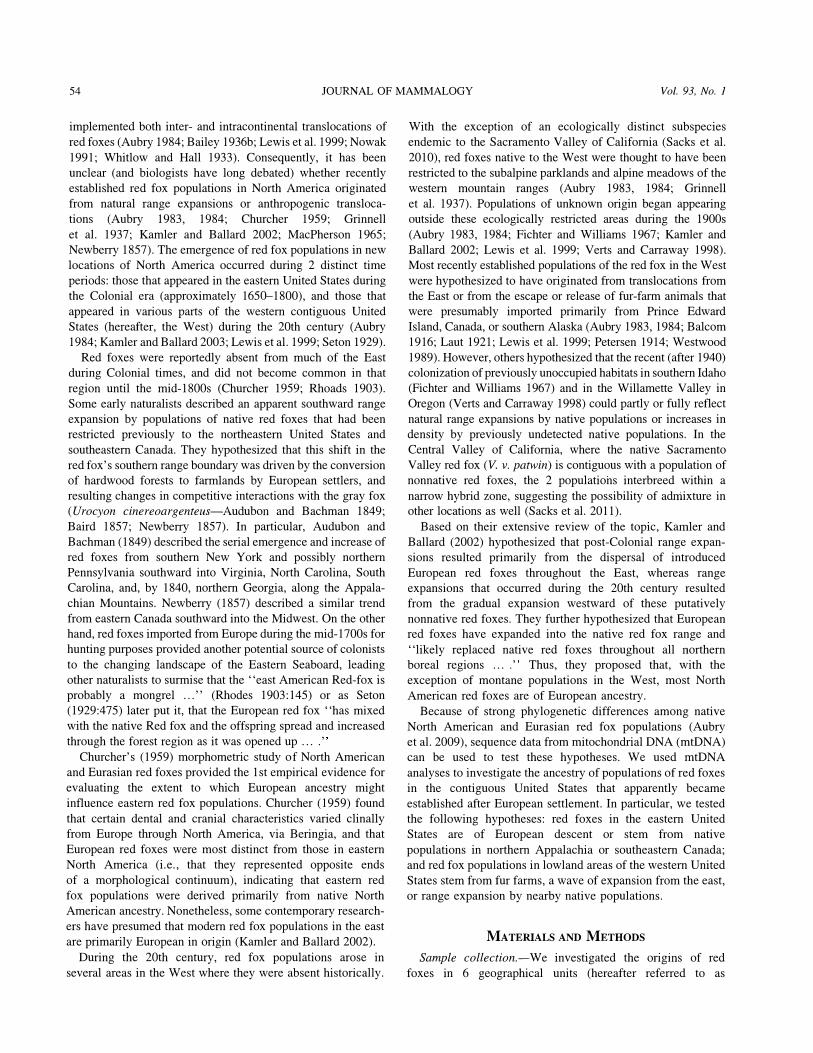
FIG. 3.-Unrooted neighbor-joining clustering tree based on pairwise <I>ST values between 17 sampling localities (Appendix II). The lengths of the lines are proportional to the degree of genetic distance among sampling localities . a) Based on a 354-base pair (bp) segment of the cytochrome-b gene from 453 red foxes . b) Based on a 342-bp segment of the D-loop from 350 red foxes.
19th centuries (Audubon and Bachman 1849), could pose a
barrier to the westward movement of nonnative foxes from
coastal regions. Regardless of these caveats, and barring the
unlikely possibility of systematic selection against European
mitochondrial haplotypes in North America, it seems clear
from our findings in this study and others of North American
red fox mtDNA (Aubry et al. 2009; Perrine et al. 2007; Sacks
et al. 2010, 2011) that contemporary North American red fox
populations reflect primarily native ancestry. These findings
clearly refute the conclusions of Kamler and Ballard (2002)
that contemporary North American red foxes in lowland areas
of the Pacific coastal states and throughout most of the
historical range of native red foxes are of European ancestry.
The use of diagnostic nuclear markers will be needed to
fully investigate the potential for traces of genetic introgres
sion by introduced European red foxes into North American
populations. However, several lines of evidence give reason to
doubt that much of the genome will prove to be of European
ancestry. For example, analyses of certain dental and cranial
characteristics indicate greater divergence between European
and eastern North American red foxes than between European
and Alaskan red foxes (Churcher 1959). In addition, red foxes
from the East are among the smallest in North America, and
considerably smaller than those found in Sweden, England,
and France (Cavallini 1995; Lloyd 1980; Merriam 1900),
which were the 3 European sources of Colonial introductions
to the United States (Long 2003). Moreover, Baird (1857)
reported that red foxes from the southeastern and northeastern
United States were similar morphologically, but differed
substantially from European red foxes in muzzle length,
pelage features, and other external characteristics. A series of
climatic warming and cooling cycles occurred in North
America during the Holocene (Dorf 1959), and fossils of the
red fox have been found in the upper Midwest that date to the
early and middle Holocene (10,000-4,000 years ago), and as
far south as Georgia that date to the late Holocene (500-
4,000 years ago [Faunmap Working Group 1996]). These
records suggest that the southern range boundary of native red
TABLE 3.-Within-population statistics for 6 recently established red fox populations in the contiguous United States and a sample of red foxes from fur farms , based on mitochondrial cytochrome-b and D-loop data sets . Tajima's (1989) D, and Fu and Li's (1993) D* and F* are neutrality statistics , where departures from zero can indicate expansion (negative) or secondary contact between 2 or more lineages (positive). Significant Strobeck's (1987) S-values indicate admixture from multiple source populations. The neutrality statistics and Strobeck's S-values were only given for the D-loop data set.
Cytochrome b D-loop Fu and Fu and
Population n No. haplotypes h 7t n No. haplotypes h 7t Tajima's D Li's D* Li's F* Strobeck's S
Southeastern United 16 7 0.83 0.0068 15 4 0.47 0.0107 -0.86 -0.21 -0.51 0.14 States
Central United States 11 5 0.76 0.0083 7 5 0.90 0.0177 -0.49 -0.58 -0.65 0.68 Great Basin 27 5 0.48 0.0024 26 7 0.62 0.0131 -1.20 -1.02 -1.26 0.25 Western Washington 20 4 0.67 0.0080 22 4 0.64 0.0183 2.16 1.52** 1.87** 0.004** Western Oregon 11 2 0.18 0.0005 11 2 0.17 0.0030 -1.85** -2.32* -2.50 0.34 Southern California 18 5 0.75 0.0088 17 5 0.79 0.0192 1.44 1.52 1.73 0.041 * Fur-farm samples 38 6 0.63 0.0056 38 11 0.82 0.0106 -0.69 0.58 0.19 0.55
* Significant at P < 0.05; ** significant at P < 0.01.
60 JOURNAL OF MAMMALOGY Vol. 93, No. 1
TABLE 4.-Support values for grouping recently established red fox populations with reference native populations or fur-farm samples based on cytochrome-b and D-loop data sets using AMOV A (Excoffier et al. 1992). Reference population groupings are: (1) Eurasia (Europe and Asia), (2) Northwestern North America (Alaska and western Canada), (3) Southeastern Canada (central Canada, eastern Canada, and northeastern United States), and (4) the Western Mountains (Washington Cascade Range, Oregon Cascade Range, Sierra Nevada, and Rocky Mountains); and (5) fur-farm samples.
Reference population
Southeastern United States
Central United States
Western Oregon
Great Basin
Western Washington
Southern California
Cytochrome-b <Pcr
D-Ioop <Pcr
European origins'
Eu only Eu+FF
I
5 5 5 5
0.23 0.37**
a Eu = Eurasia, FF = fur fann, Exp = range expansion from native populations.
* P :0; 0.05; ** P :0; 0.01; *** P :0; 0.001.
foxes in eastern North America may have shifted periodically
in response to changing climatic conditions since the retreat of
Wisconsin glaciers.
Although red foxes were historically absent or extremely
rare in the central and western United States (with the
exception of high-elevation areas in the western mountains
and the Sacramento Valley of California), they became
established in many lowland areas during the 1900s (Aubry
1983, 1984; Bailey 1936b; Sacks et al. 2010; Whitlow and Hall
1933). These recently established populations could have
resulted from human translocations of fur-farm animals that
subsequently escaped or were released (Aubry 1983, 1984;
Lewis et al. 1999), continental-scale range expansions from
010-19 o 5-9
o H o
a) Native populations
Widespread Subclade
North American origins'
Eu+FF+Exp FF only Exp only FF+ Exp
5 3 3 5 3 5
4 5 4 4 4 5 4 4 5 5 4 5 5 5 4 5 0.45** 0.51 *** 0.52*** 0.53***
0.30*** 0.31 *** 0.40***
the East (Kamler and Ballard 2002), natural range expansions
by native montane populations (Bailey 1936a; Fichter and
Williams 1967; Verts and Carraway 1998), or human
translocations from native montane populations for fur farming.
In several putatively nonnative populations in the west and
in the central United States, we found a few Eastern subclade
haplotypes that were best explained by continental-scale
translocations of fur-farmed foxes. Several haplotypes were
common among our study populations but not necessarily
common in the ancestral populations (i.e., consistent with
origin from a common founder population). Although our
sample size from the central United States was too low to rule
out natural range expansions from the east, it is noteworthy
b) Populations resu Itlng from
or highly impacted by translocations
.Cculrnlt:SA
_F ... I'anu
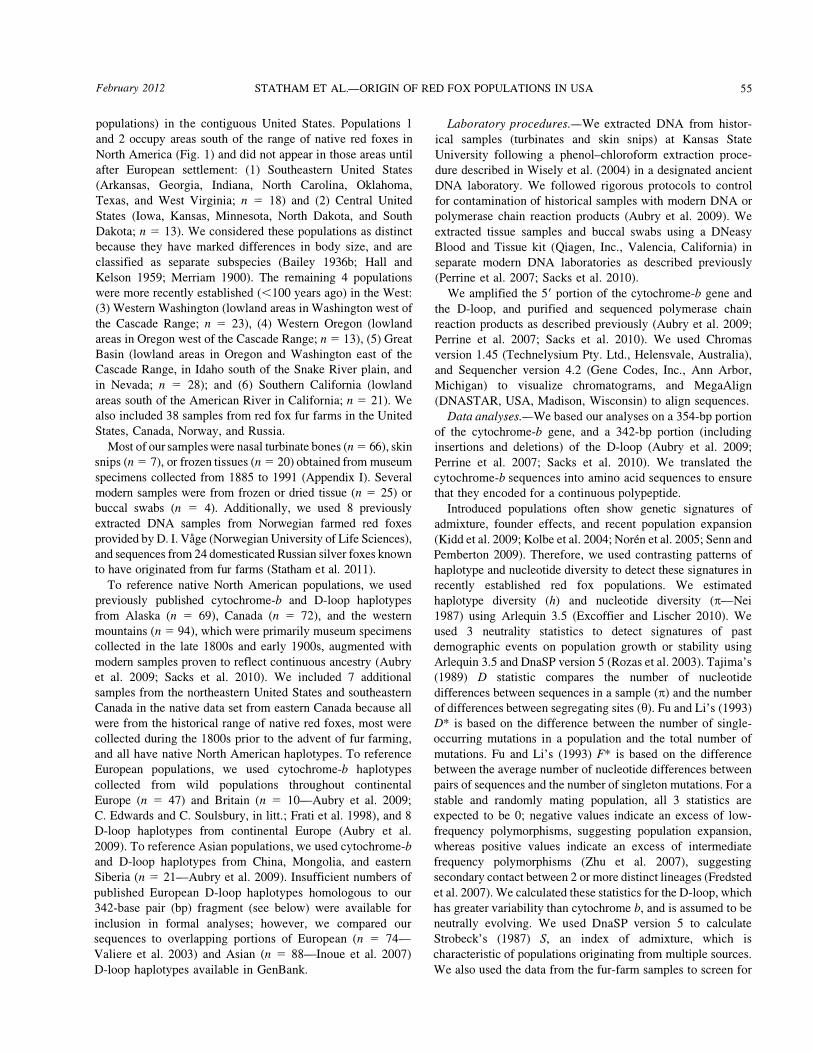
FIG. 4.-D-loop median joining network based on 342 base pairs with superimposed higher order clades and subclades as reported by Aubry et al. (2009). Branch lengths are proportional to the number of substitutions, and circle sizes are proportional to the number of individuals represented. Numbered haplotypes are those found in this study. Together, the Mountain, Eastern, and Widespread subclades comprise the Nearctic clade, which is restricted to North America. a) Network of haplotypes found in native populations (modified from Aubry et al. [2009]). b) Network of haplotypes present among populations resulting from or highly impacted by translocations.
February 20 12 STATHAM ET AL.-ORIGIN OF RED FOX POPULATIONS IN USA 61
Interpretation of origin
... Intracontinental � Translocation
D. Native
A Uncertain
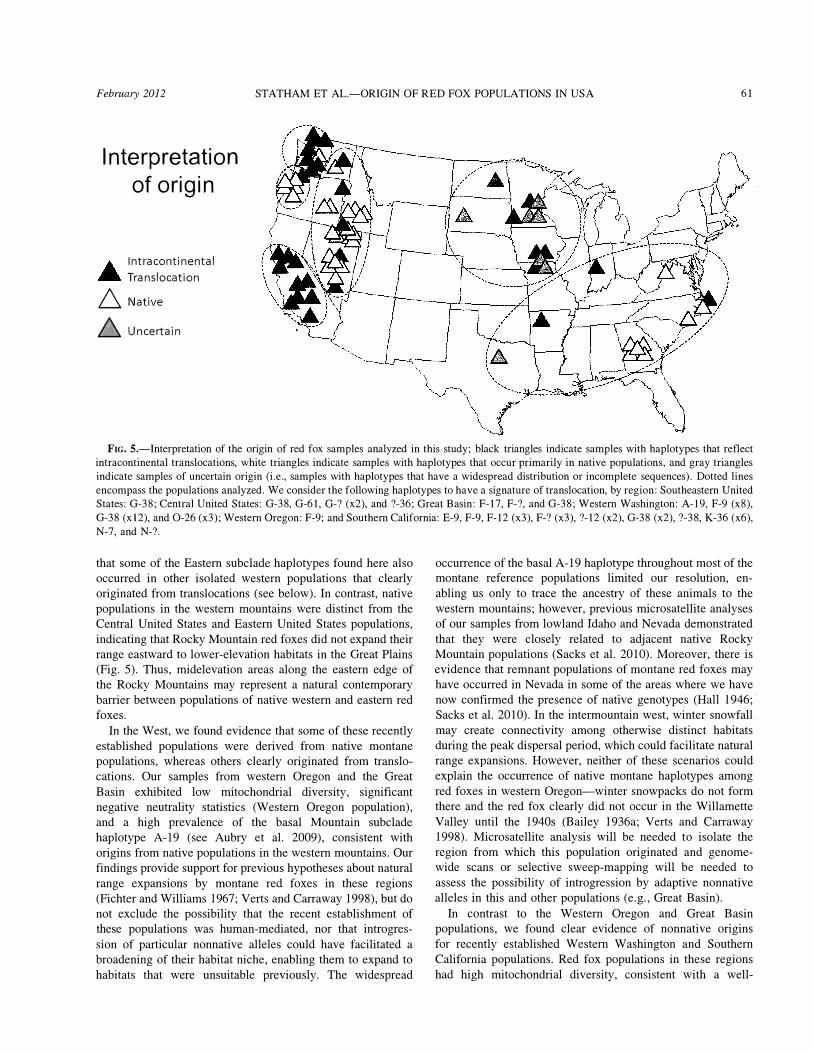
FIG. 5.-Interpretation of the origin of red fox samples analyzed in this study; black triangles indicate samples with haplotypes that reflect intracontinental translocations, white triangles indicate samples with haplotypes that occur primarily in native populations, and gray triangles indicate samples of uncertain origin (i.e., samples with haplotypes that have a widespread distribution or incomplete sequences). Dotted lines encompass the populations analyzed. We consider the following haplotypes to have a signature of translocation, by region: Southeastern United States: 0-38; Central United States: 0-38, 0-61, O-? (x2), and ?-36; Oreat Basin: F-17, F-?, and 0-38; Western Washington: A-19, F-9 (x8), 0-38 (xI2), and 0-26 (x3); Western Oregon: F-9; and Southern California: E-9, F-9, F-12 (x3), F-7 (x3), ?-12 (x2), 0-38 (x2), 7-38, K-36 (x6), N-7, and N-7.
that some of the Eastern subclade haplotypes found here also
occurred in other isolated western populations that clearly
originated from translocations (see below). In contrast, native
populations in the western mountains were distinct from the
Central United States and Eastern United States populations,
indicating that Rocky Mountain red foxes did not expand their
range eastward to lower-elevation habitats in the Great Plains
(Fig. 5). Thus, midelevation areas along the eastern edge of
the Rocky Mountains may represent a natural contemporary
barrier between populations of native western and eastern red
foxes.
In the West, we found evidence that some of these recently
established populations were derived from native montane
populations, whereas others clearly originated from translo
cations. Our samples from western Oregon and the Great
Basin exhibited low mitochondrial diversity, significant
negative neutrality statistics (Western Oregon population),
and a high prevalence of the basal Mountain subclade
haplotype A-19 (see Aubry et al. 2009), consistent with
origins from native populations in the western mountains. Our
findings provide support for previous hypotheses about natural
range expansions by montane red foxes in these regions
(Fichter and Williams 1967; Verts and Carraway 1998), but do
not exclude the possibility that the recent establishment of
these populations was human-mediated, nor that introgres
sion of particular nonnative alleles could have facilitated a
broadening of their habitat niche, enabling them to expand to
habitats that were unsuitable previously. The widespread
occurrence of the basal A-19 haplotype throughout most of the montane reference populations limited our resolution, en
abling us only to trace the ancestry of these animals to the
western mountains; however, previous microsatellite analyses
of our samples from lowland Idaho and Nevada demonstrated
that they were closely related to adjacent native Rocky
Mountain populations (Sacks et al. 20lO). Moreover, there is
evidence that remnant populations of montane red foxes may
have occurred in Nevada in some of the areas where we have
now confirmed the presence of native genotypes (Hall 1946; '
Sacks et al. 20lO). In the intermountain west, winter snowfall
may create connectivity among otherwise distinct habitats
during the peak dispersal period, which could facilitate natural
range expansions. However, neither of these scenarios could
explain the occurrence of native montane haplotypes among
red foxes in western Oregon-winter snowpacks do not form
there and the red fox clearly did not occur in the Willamette
Valley until the 1940s (Bailey 1936a; Verts and Carraway
1998). Microsatellite analysis will be needed to isolate the
region from which this population originated and genome
wide scans or selective sweep-mapping will be needed to
assess the possibility of introgression by adaptive nonnative
alleles in this and other populations (e.g., Great Basin).
In contrast to the Western Oregon and Great Basin
populations, we found clear evidence of nonnative origins
for recently established Western Washington and Southern
California populations. Red fox populations in these regions
had high mitochondrial diversity, consistent with a well-
62 JOURNAL OF MAMMALOGY Vol. 93, No. 1
documented history of fur farming. Additionally, both
populations had significant Strobeck's S-values (indicating
admixture), clustered with the geographically distant Central
United States population in the neighbor-joining tree, and
contained similar mixtures of phylogenetically divergent
haplotypes. Translocations or fur farms have been documented
in or adjacent to all of the Washington counties where we
detected these haplotypes (Aubry 1984), and throughout
southern California (Lewis et al. 1999).
Relatively few haplotypes were common to > 1 of these
populations, making them useful indicators of nonnative stock.
Most of these haplotypes were from the Eastern subclade
and native to popUlations in southeastern Canada and the
northeastern United States (E-9, F-9, F-12, and F-17), or in
native Holarctic-clade populations in Alaska and western
Canada (G-38, G-73, and N-7). Of the 38 samples we
sequenced from red fox fur farms, most belonged to the
Eastern subclade (n = 31), including those from Norway and
Russia. Thus, these haplotypes also will be useful when
screening for nonnative ancestry in Eurasian populations.
According to historical records, most of the original breeding
stock for the fur-farming industry came from Prince Edward
Island in southeastern Canada, and consisted predominantly of
locally caught foxes supplemented with those imported from
southern Alaska (Balcom 1916; Laut 1921). Fur farmers on
Prince Edward Island primarily raised the silver-black color
phase, which had the greatest economic value. Farmed foxes
from Prince Edward Island were subsequently used to stock
fur farms in many areas of North America and Eurasia
(Petersen 1914; Westwood 1989). At the same time, red fox
breeders independently farmed other strains in Ontario,
Quebec, and Maine (Balcom 1916). Given that silver fox
breeders could charge as much as $1,500 each in the mid-
1920s (Eugene Guard 1924), it is possible that fur farmers
obtained their breeding stock from wild populations having
high frequencies of the silver-black color phase, such as those
in Alberta or British Columbia, Canada, or the Cascade Range
in Washington (Butler 1945; Cowan 1938), as was done in
Alaska until at least 1927 (Anchorage Daily Times 1927).
Indeed, the presence of haplotype 0-26 in a translocated
popUlation likely originated in the Washington Cascades
(Aubry et al. 2009).
Contrary to previous interpretations, we found no matrilin
eal descendants of European red foxes anywhere in North
America. Although more intensive sampling in the East may
yet uncover evidence of limited or localized European red fox
ancestry, the clear lack of European haplotypes found thus far
in the east, and in a relatively large sample of nonnative foxes
derived largely from eastern stock, clearly indicates that North
American red foxes have retained primarily North American
ancestry. However, many populations in the contiguous
United States bear a genetic signature of translocations from
other North American locations. Lowland popUlations in
western Washington, southern California, and the central
United States represent an unnatural admixture of clades and
subclades translocated from disparate parts of North America.
In contrast, recently established populations in western
Oregon and the Great Basin had little genetic diversity and
were not significantly differentiated from most native montane
populations. Thus, it is clear that these recently established
populations were derived, at least in part, from montane
populations. Despite an extensive history of red fox translo
cations into and throughout North America, nonnative
lineages apparently have persisted only in regions where
native red foxes were absent historically. A focused study of
microsatellite and single nucleotide polymorphism diversity in
the native Sacramento Valley and adjacent nonnative red fox
population in California suggested that native foxes may be.
able to competitively exclude nonnative foxes, hybridizing
only on the margins of the native range (Sacks et al. 2011).
Similar studies would be useful for understanding the
ecological dynamics between native and nonnative red foxes
in the intermountain west.
ACKNOWLEDGMENTS We thank the following curators and collection managers at the
institutions that allowed us to sample museum material: R. Fisher and S. Peurach (National Museum of Natural History), C. Conroy and E. Lacey (Museum of Vertebrate Zoology), B. Coblentz and D. Markle (Oregon State University Fisheries and Wildlife Mammal Collection), P. Unitt (San Diego Natural History Museum), G. Shugart (Slater Museum of Natural History), J. Bradley (University of Washington Burke Museum), J. Dines and I. Horovitz (Natural History Museum of Los Angeles County), and T. Schweitzer (Fort Roosevelt Vertebrate Collection). We also thank L. Dalen (University of Stockholm), D. Vage (Norwegian University of Life Sciences), A. Shaad (Wolf Park, Indiana), C. Blacketer (Wildcat Creek Wildlife Center, Indiana), J. Becker (Tippecanoe Animal Hospital, Lafayette, Indiana), J. Eger (Royal Ontario Museum), M. Burrell and B. Smith (Animal and Plant Health Inspection Service-Wildlife Services-Oregon), N. B elfiore, R. Stoeber!, M. Bodenchuk, M. Collinge, M. Jensen, R. Beach, and D. Kemner for providing tissue and DNA samples. We thank K. Noren and an anonymous reviewer for helpful comments on an earlier draft of this manuscript. Partial funding was provided by the United States Department of Agriculture Forest Service, Pacific Northwest Research Station, the Kansas State University Ecological Genomics Institute, and the Veterinary Genetics Laboratory at the University of California, Davis.
LITERATURE CITED ANCHORAGE DAILY TIMES. 1927. Fur-farmers name officers; exchange
ideas at banquet; and discuss needs of industry. Thursday, 8 September, Anchorage, Alaska.
AUBRY, K. B. 1983. The Cascade red fox: distribution, morphology, zoogeography and ecology. Ph.D. dissertation, University of Washington, Seattle.
AUBRY, K. B. 1984. The recent history and present distribution of the red fox in Washington. Northwest Science 58:69-79.
AUBRY, K. B., M. J. STATHAM, B. N. SACKS, J. D. PERRINE, AND S. M. WISELY. 2009. Phylogeography of the North American red fox: vicariance in Pleistocene forest refugia. Molecular Ecology 18:2668-2686.
February 20 12 STATHAM ET AL.-ORIGIN OF RED FOX POPULATIONS IN USA 63
AUDUBON, J . J., AND J. BACHMAN. 1849. The viviparous quadrupeds of North America. Privately published by J. J . Audubon, New York. Vol. 2.
BAILEY, V. 1936a. The mammals and life zones of Oregon. North American Fauna 55:1-416.
BAILEY, V. 1936b. The red fox in America. Nature Magazine 28:269-272, 317.
BAIRD S. F. 1857. General report upon the zoology of several Pacific railroad routes . Pp. 331-334 in Reports of explorations and surveys. Vol. 8 . Part 1. 33d Congress, 2d session, Executive Document 78. United States Government Printing Office, Washington, D.C.
BALCOM, A. B . 1916. Fox farming in Prince Edward Island: a chapter in the history of speculation. Quarterly Journal of Economics 30:665-681.
BANDELT, H. J . , P. FORSTER, AND A. ROHL. 1999. Median-joining networks for inferring intraspecific phylogenies . Molecular Biology and Evolution 16:37-48.
BUTLER, I.. 1945. Distribution and genetics of the color phases of the red fox in Canada. Genetics 30:39-50.
CA v ALLINI, P. 1995. Variation in the body size of the red fox. Annales Zoologici Fennici 32:421-427.
CHURCHER, C. S. 1959. The specific status of the New World red fox. Journal of Mammalogy 40:349-360.
COWAN, I. M. 1938. Geographic distribution of color phases of the red fox and black bear in the Pacific Northwest. Journal of Mammalogy 19:202-206.
CRONIN, W. 1983. Changes in the land: Indians, colonists, and the ecology of New England. Hill and Wang, New York.
DORF, E. 1959 . Climatic changes of the past and present . Contributions from the Museum of Paleontology, University of Michigan 8:181-210.
EUGENE GUARD. 1924. Silver foxes are received in city . Wednesday, 15 October, Eugene, Oregon.
EXCOFFIER, 1.. , AND H. E. I.. LISCHER. 2010. Arlequin suite ver 3.5: a new series of programs to perform population genetics analyses under Linux and Windows. Molecular Ecology Resources 10:564-567.
EXCOFFIER, 1.., P. E . SMOUSE, AND J. M. QUATTRO. 1992. Analysis of molecular variance inferred from metric distances among DNA haplotypes: application to human mitochondrial DNA restriction data. Genetics 131 :479-491.
FAUNMAP WORKING GROUP. 1996. Spatial response of mammals to late Quaternary environmental fluctuations. Science 272: 160 1-1606.
FELSENSTEIN, J. 1989 . PHYLIP-phylogeny inference package (version 3.2). Cladistics 5: 1 64-166.
FICHTER, E. , AND R WILLIAMS. 1967. Distribution and status of the red fox in Idaho. Journal of Mammalogy 48:219-230.
FRAT!, F. , G. B . HARTL, S. LOVARI, M. DELmES, AND G. MARKOV. 1998. Quaternary radiation and genetic structure of the red fox Vulpes
vulpes in the Mediterranean Basin, as revealed by allozymes and mitochondrial DNA. Journal of Zoology (London) 245:43-51.
FREDSTED, T. , M. H. SCHIERUP, I.. F. GROENEVALD, AND P. M. KAPPELER.
2007. Genetic structure, lack of sex -biased dispersal and behavioral flexibility in the pair-living fat-tailed dwarf lemur, Cheirogaleus
medius. Behavioral Ecology and Sociobiology 61:943-954. Fu, X. Y. , AND W. H. LI. 1993. Statistical tests of neutrality in
mutations . Genetics 133:693-709. GRINNELL, J . , J . S. DIXON, AND J. M. LINSDALE. 1937. Fur-bearing
mammals of California. University of California Press, Berkeley. Vols . I and 2.
HALL, E. R 1946. Mammals of Nevada. University of California Press, Berkeley.
HALL, E. R, AND K R KELSON. 1959. The mammals of North America. Ronald Press, New York.
INOUE, I . , ET AL. 2007. Mitochondrial DNA phylogeography of the red fox ( Vulpes vulpes) in northern Japan. Zoological Science 24:1178-1186.
KAMLER, J. F . , AND W. B. BALLARD. 2002. A review of native and nonnative red foxes in North America. Wildlife Society Bulletin 30:370-379.
KAMLER, J. F . , AND W. B. BALLARD. 2003. Range expansion of red foxes in eastern Nevada and western Utah. Journal of the ArizonaNevada Academy of Sciences 36:18-20.
KIDD, A. G. , J . BOWMAN, D. LESBARRERES, AND A. I. SCHULTE
HOSTEDDE. 2009. Hybridization between escaped domestic and wild American mink (Neovison vison). Molecular Ecology 18: 1175-1186.
KOLBE, J. J., R E. GLOR, I.. RODRIGUEZ SCHETTINO, A. CHAMIZO LARA, A. LARSON, AND 1. B. Losos . 2004. Genetic variation increases during biological invasion by a Cuban lizard. Nature 431:177-181.
LARMERE, S . , AND M. PASITSCHNIAK-ARTS. 1996. Vulpes vulpes.
Mammalian Species 537:1-11. LARSEN, P. F . , M. M. HANSEN, E. E. NIELSEN, I.. F. JENSEN, AND
V. LOESCHCKE. 2005. Stocking impact and temporal stability of genetic composition in a brackish northern pike population (Esox
lucius 1..) , assessed using microsatellite DNA analysis of historical and contemporary samples . Heredity 95:136-143.
LAUT, A. C. 1921. The fur trade of America. Macmillan Company, New York.
LEWIS, J. c. , K I.. SALLEE, AND R. T. GOLIGHTLY, JR . 1999. Introduction and range expansion of nonnative red foxes ( Vulpes
vulpes) in California. American Midland Naturalist 142:372-381.
LLOYD, H. G. 1980. The red fox. B . T. Batsford Ltd . , London, United Kingdom.
LONG, J. 2003. Introduced mammals of the world: their history, distribution and influence. CSIRO Publishing, Melbourne, Australia.
MACPHERSON, A. 1965. The origin of diversity in mammals of the Canadian Arctic tundra. Systematic Zoology 14:153-173.
MERRIAM, C. H. 1900. Preliminary revision of the North American red foxes. Proceedings of the Washington Academy of Sciences 2:661-676.
NEI, M. 1987. Molecular evolutionary genetics. Columbia University Press, New York.
NEI, M., AND W. H. LI. 1979. Mathematical model for studying genetic variation in terms of restriction endonuc1eases. Proceedings of the National Academy of Sciences 76:5269-5273.
NEWBERRY, J. S. 1857. Report upon the zoology of the route [from the Sacramento Valley to the Columbia River]. pp. 35-110, plates 26-29 in U.S . Pacific railroad exploration and survey 6, part IV, no. 2. Government Printing Office, Washington, D.C.
NOREN, K , L. DALEN, K KVAL0Y, AND A. ANGERBJORN. 2005. Detection of farm fox and hybrid genotypes among wild arctic foxes in Scandinavia. Conservation Genetics 6:885-894.
NOREN, K, ET AL. 2009. Farmed arctic foxes on the Fennoscandian mountain tundra: implications for conservation. Animal Conservation 12:434-444.
NOWAK, R M. 1991. Walker's mammals of the world. 5th ed. Johns Hopkins University Press, Baltimore, Maryland. Vol. II .
64 JOURNAL OF MAMMALOGY Vol. 93, No. 1
PERRINE, J. D. , J. P. POLLINGER, B. N. SACKS, R. H. BARRETT, AND R. K.
WAYNE. 2007. Genetic evidence for the persistence of the critically endangered Sierra Nevada red fox in California. Conservation Genetics 8:1083-1095.
PETERSEN, M. 1914. The fur traders and fur bearing animals. Hammond Press, Buffalo, New York.
RHOADS, S. N. 1903. The mammals of Pennsylvania and New Jersey. Privately printed, Philadelphia, Pennsylvania.
RHYMER, J. M., AND D. S. SIMBERLOFF. 1996. Genetic extinction through hybridization and introgression. Annual Review of Ecology and Systematics 27:83-109.
RICE, W. R. 1989. Analyzing tables of statistical tests. Evolution 43:223-225.
ROZAS, J. , J. C. SANCHEz-DELBARRIO, X. MESSEGUER, AND R. ROZAS.
2003. DnaSP DNA polymorphism analysis by the coalescent and other methods. Bioinformatics 19:2496-2497.
SACKS, B. N. , M. MOORE, M. J. STATHAM, AND H. U. WITTMER. 2011. A restricted hybrid zone between native and introduced red fox ( Vulpes vulpes) populations suggests reproductive barriers. Molecular Ecology 20:326-341.
SACKS, B. N. , M. 1. STATHAM, 1. D. PERRINE, S. M. WISELY, AND K. B. AUBRY. 2010. North American montane red foxes: expansion, fragmentation, and the origin of the Sacramento Valley red fox. Conservation Genetics 11:1523-1539.
SENN, H. V. , AND J. M. PEMBERTON. 2009. Variable extent of hybridization between invasive sika (Cervus nippon) and native red deer (c. elaphus) in a small geographical area. Molecular Ecology 18:862-876.
SETON, E. T. 1929. Lives of game animals. Doubleday, Doran and Company, Garden City, New York.
S0NSTEB0, J. H. , R. B ORGSTR0M, AND M. HEUN. 2008. Genetic structure in alpine brown trout Salrno trutta L. shows that indirect stocking affects native lake populations. Journal of Fish Biology 72:1990-2001.
STATHAM, M. J. , ET AL. 2011. On the origin of a domesticated species: identifying the parent population of Russian silver foxes ( Vulpes
vulpes) . Biological Journal of the Linnean Society 103:168-175.
STROBECK, C. 1987. Average number of nucleotide differences in a sample from a single subpopulation: a test for population subdivision. Genetics 117:149-153.
TAJIMA, F. 1989. Statistical method for testing the neutral mutation hypothesis by DNA polymorphism. Genetics 123:585-595.
V ALIERE, N. , ET AL. 2003. Long-distance wolf recolonization of France and Switzerland inferred from non-invasive genetic sampling over a period of 10 years. Journal of Animal Conservation 6:83-92.
VERTS, B. J. , AND L. N. CARRAWAY. 1998. Land mammals of Oregon. University of California Press, Berkeley.
WESTWOOD, R. E. 1989. Early fur-farming in Utah. Utah Historical Quarterly 57:320-339.
WHITLOW, W. B. , AND E. R. HALL. 1933. Mammals of the Pocatello region of southeastern Idaho. University of California Publications in Zoology 40:235-275.
WISELY, S. M. , J. E. MALDONADO, AND R. C. FLEISCHER. 2004. A technique for sampling ancient DNA that minimizes damage to museum specimens. Conservation Genetics 5:105-107.
ZHU, Q. , X. ZHENG, J. Luo, B. S. GAUT, AND S. GE. 2007. Mu1ti1ocus analysis of nucleotide variation of Oryza sativa and its wild relatives: severe bottleneck during domestication of rice. Molecular Biology and Evolution 24:875-888.
Submitted 31 January 2011. Accepted 28 July 2011.
Associate Editor was Burton K. Lim.
ApPENDIX I Accession numbers of museum specimens from which we acquired
DNA for this study. Fort Roosevelt Vertebrate Collection: FRC027, FRC061, FRC087;
Museum of Vertebrate Zoology: MVZ175993, MVZ207041, MVZ208591, MVZ208595, MVZ222348, MVZ222369, MVZ222471, MVZ33635, MVZ33636, MVZ52099, MVZ52100, MVZ52101, MVZ52102, MVZ57149, MVZ57150, MVZ57151, MVZ57152, MVZ57153, MVZ84481, MVZ90621, MVZ90798, MVZ91097; National Museum of Natural History: USNM107765, USNM110812, USNM188069 , USNM188070 , USNM19969 , USNM224077, USNM242343, USNM242921 , USNM242922, USNM242924, USNM243681, USNM243682, USNM243683, USNM243745, USNM263367, USNM263368, USNM263369 , USNM263372, USNM263373, USNM264977, USNM264979, USNMA03071, USNMA03707, USNMA03713, USNMA03714, USNMA21156, USNMA21157; University of Washington Burke Museum: UW20182, UW32526, UW32527, UW32530, UW32531, UW32532, UW32534, UW32540, UW32541, UW32543, UW32544, UW32545, UW32547, UW32563, UW32950, UW34306, UW41617, UW73061; Natural History Museum of Los Angeles County: LA2, LA5, LA85700, LA87624; Oregon State University Fisheries and Wildlife Mammal Collection: OSU1175, OSU5543, OSU8778, OSU8779, OSU9017; Santa Barbara Natural History Museum: SB-1, SB-2, SB-3, SB-4, SB-5, SB-6; Slater Museum of Natural History: UPS 10841, UPS 1252, UPS 13382, UPS13383, UPS14885.
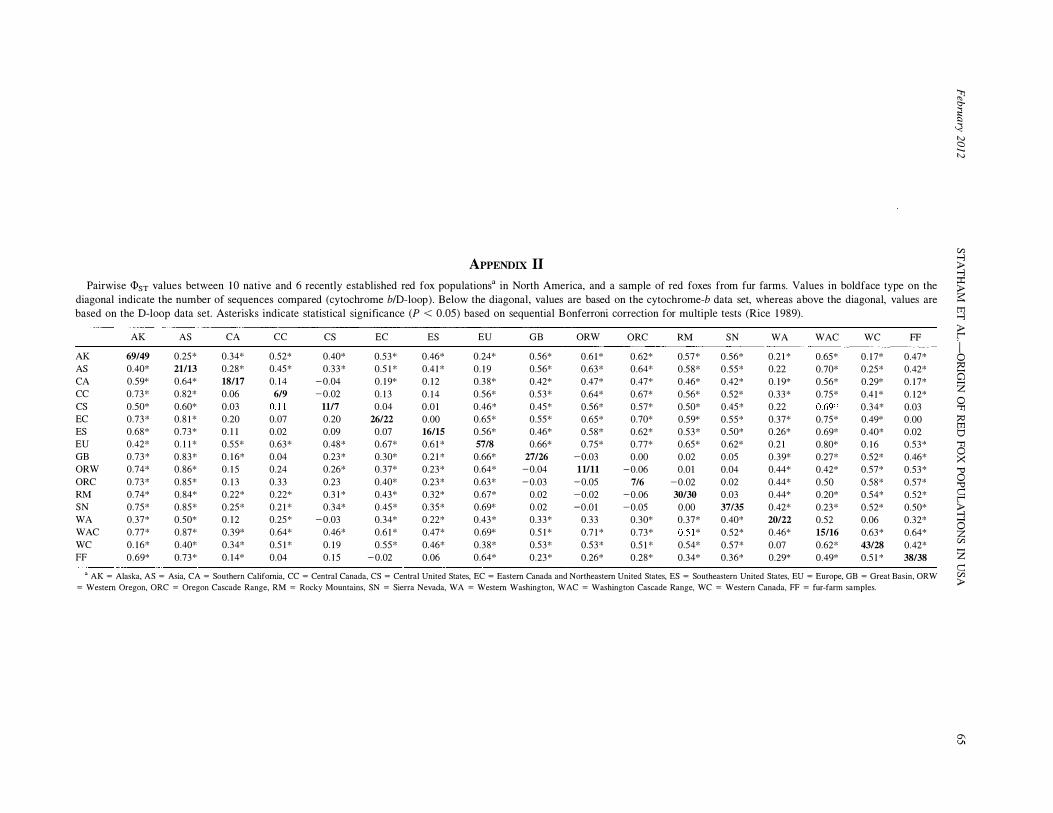
ApPENDIX II Pairwise <l>ST values between 10 native and 6 recently established red fox populations" in North America, and a sample of red foxes from fur fanns. Values in boldface type on the
diagonal indicate the number of sequences compared (cytochrome bID-loop) . Below the diagonal, values are based on the cytochrome-b data set, whereas above the diagonal, values are based on the D-Ioop data set. Asterisks indicate statistical significance (P < 0.05) based on sequential Bonferroni correction for multiple tests (Rice 1989).
AK AS CA CC CS EC ES EU GB ORW ORC RM SN WA WAC WC FF
AK 69/49 0.25* 0.34* 0.52* 0.40* 0.53* 0.46* 0.24* 0.56* 0.61 * 0.62* 0.57* 0.56* 0.21* 0.65* 0.17* 0.47* AS 0.40* 21/13 0.28* 0.45* 0.33* 0.51* 0.41* 0.19 0.56* 0.63* 0.64* 0.58* 0.55* 0.22 0.70* 0.25* 0.42* CA 0.59* 0.64* 18/17 0.14 -0.04 0.19* 0.12 0.38* 0.42* 0.47* 0.47* 0.46* 0.42* 0.19* 0.56* 0.29* 0.17* CC 0.73* 0.82* 0.06 619 -0.Q2 0.13 0.14 0.56* 0.53* 0.64* 0.67* 0.56* 0.52* 0.33* 0.75* 0.41* 0.12* CS 0.50* 0.60* 0.03 0.1 1 1117 0.04 0.01 0.46* 0.45* 0.56* 0.57* 0.50* 0.45* 0.22 0.69" 0.34* 0.03 EC 0.73* 0.81 * 0.20 0.07 0.20 26/22 0.00 0.65* 0.55* 0.65* 0.70* 0.59* 0.55* 0.37* 0.75* 0.49* 0 00 ES 0.68* 0.73* 0.11 0.02 0.09 0.07 16/15 0.56* 0.46* 0.58* 0.62* 0.53* 0.50* 0.26* 0.69* 0.40* 0.02 EU 0.42* 0.11* 0.55* 0.63* 0.48* 0.67* 0.61* 57/8 0.66* 0.75* 0.77* 0.65* 0.62* 0.21 0.80* 0.16 0.53* GB 0.73* 0.83* 0.16* 0.04 0.23* 0.30* 0.21* 0.66* 27/26 -0.03 0.00 0.02 0.05 0.39* 0.27* 0.52* 0.46* ORW 0.74* 0.86* 0.15 0.24 0.26* 0.37* 0.23* 0.64* -0.04 11111 -0.06 om 0.04 0.44* 0.42* 0.57* 0.53* ORC 0.73* 0.85* 0.13 0.33 0.23 0.40* 0.23* 0.63* -0.03 -0.05 7/6 -0.Q2 0.02 0.44* 0.50 0.58* 0.57* RM 0.74* 0.84* 0.22* 0.22* 0.31* 0.43* 0.32* 0.67* 0.02 -0.02 -0.06 30/30 0.03 0.44* 0.20* 0.54* 0.52* SN 0.75* 0.85* 0.25* 0.21 * 0.34* 0.45* 0.35* 0.69* 0.02 -om -0.05 0.00 37/35 0.42* 0.23* 0.52* 0.50* WA 0.37* 0.50* 0.12 0.25* -0.03 0.34* 0.22* 0.43* 0.33* 0.33 0.30* 0.37* 0.40* 20/22 0.52 0.06 0.32* WAC 0.77* 0.87* 0.39* 0.64* 0.46* 0.61 * 0.47* 0.69* 0.51* 0.71* 0.73* 0.51 * 0.52* 0.46* 15/16 0.63* 0.64* WC 0.16* 0.40* 0.34* 0.51* 0.19 0.55* 0.46* 0.38* 0.53* 0.53* 0.51 * 0.54* 0.57* 0.07 0.62* 43/28 0.42* FF 0.69* 0.73* 0.14* 0.04 0.15 -0.Q2 0.06 0.64* 0.23* 0.26* 0.28* 0.34* 0.36* 0.29* 0.49* 0.51 * 38/38
, AK = Alaska, AS = Asia. CA = Southern California, CC = Central Canada, CS = Central United States. EC = Eastern Canada and Northeastern United States. ES = Southeastern United States. EU = Europe. GB = Great Basin, ORW
= Western Oregon. ORC = Oregon Cascade Range, RM = Rocky Mountains, SN = Sierra Nevada, WA = Western Washington, WAC = Washington Cascade Range. WC = Western Canada. FF = fur-farm samples.
� c::;-2 � � N a -.... N
C/:J >-l >->-l ::r: >-is: tn >-l
>-r
I 0
� Cl
Z 0 'I'l
Gl t:I 'I'l 0 >:: "0 0 "0 C t"" >->-l
(5 :z: C/:J
Z C C/:J >-
0'\ VI
Top Related