


Languages
Pages
Legal


OKANAGAN RIVER:
“ADAPTIVE MANAGEMENT
SUCCESS STORIES”
Brian Symonds, P. Eng.
Adaptive Management for Large-Scale
Water Infrastructure Workshop
New Orleans, Louisiana
July 26 & 27, 2018
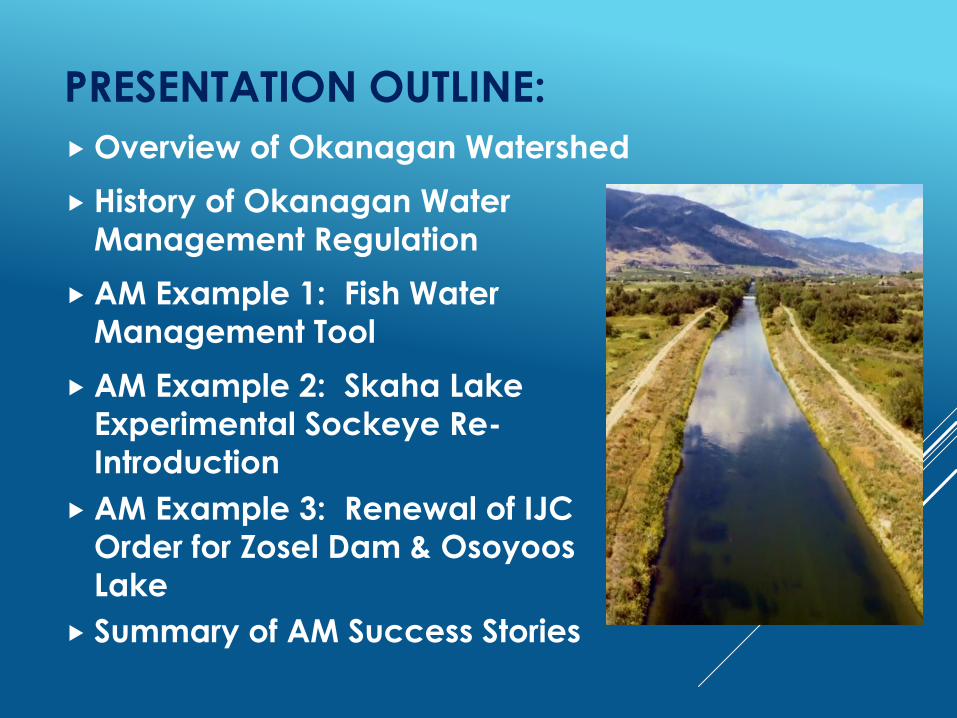
PRESENTATION OUTLINE:
Overview of Okanagan Watershed
History of Okanagan Water
Management Regulation
AM Example 1: Fish Water
Management Tool
AM Example 2: Skaha Lake
Experimental Sockeye Re-
Introduction
AM Example 3: Renewal of IJC
Order for Zosel Dam & Osoyoos
Lake
Summary of AM Success Stories

LOCATION
MAP

OKANAGAN WATERSHED :➢ Located in dry, southern interior of BC
➢ Tributary to Columbia River
➢Drainage area = 8,200 km2 (in Canada)
➢ 5 Mainstem Lks:
- Kalamalka
- Okanagan
- Skaha
-Vaseux
- Osoyoos

OKANAGAN
CLIMATE
Av. Monthly
Temperature
(range 25 – 79 o F)
Av. Monthly
Precipitation
(Mean Annual: ~ 15 in)

OKANAGAN HYDROLOGY
Annual
hydrograph
dominated
by spring
snowmelt

OKANAGAN LAKE - NET MONTHLY INFLOWS
-50.0
0.0
50.0
100.0
150.0
200.0
250.0
JAN FEB MAR APR MAY JUN JUL AUG SEP OCT NOV DEC
In
flo
w -
Kd
am
3
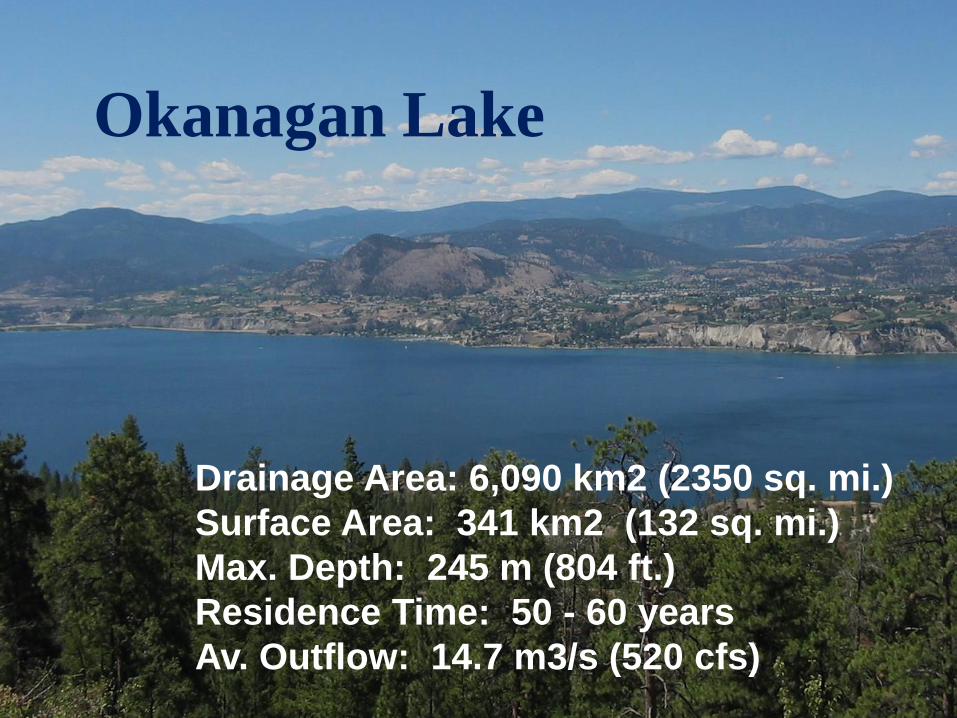
Okanagan Lake
Drainage Area: 6,090 km2 (2350 sq. mi.)
Surface Area: 341 km2 (132 sq. mi.)
Max. Depth: 245 m (804 ft.)
Residence Time: 50 - 60 years
Av. Outflow: 14.7 m3/s (520 cfs)
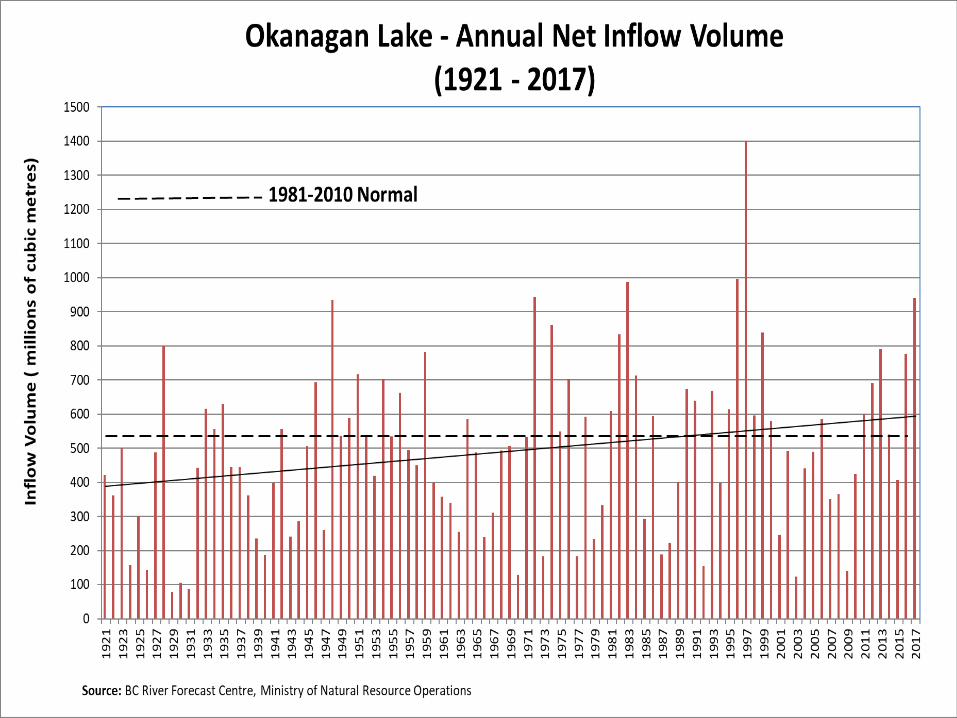

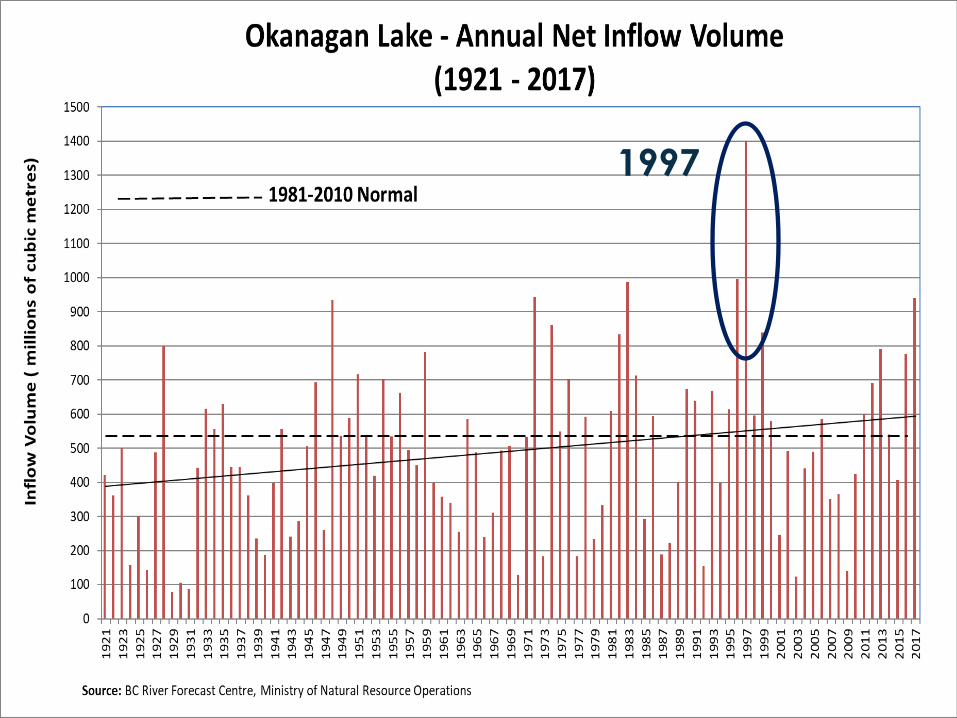
VARIATION IN
OKANAGAN
LAKE ANNUAL
INFLOW
Range of annual inflow
volume :
0.23 m to 4.12 m
78 to 1400 million m3
Similkameen R.Okanagan R.
Columbia R.
Okanogan R.
Okanagan Lake Dam
Kalamalka
Lake Dam
Skaha Lake Dam
McIntyre Dam
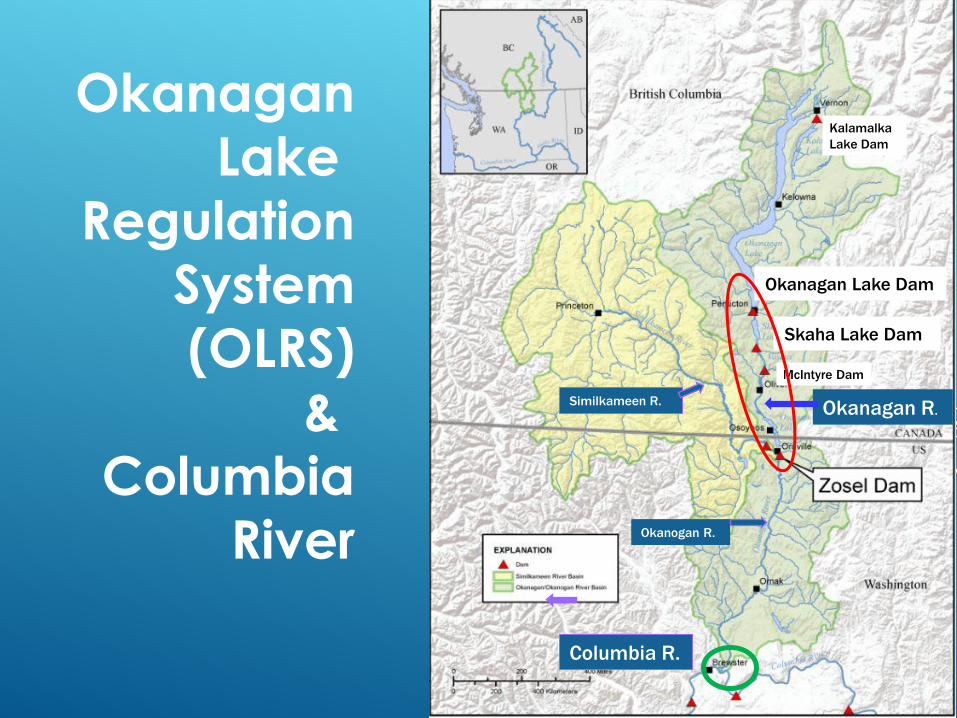
Okanagan
Lake
Regulation
System
(OLRS)
&
Columbia
River
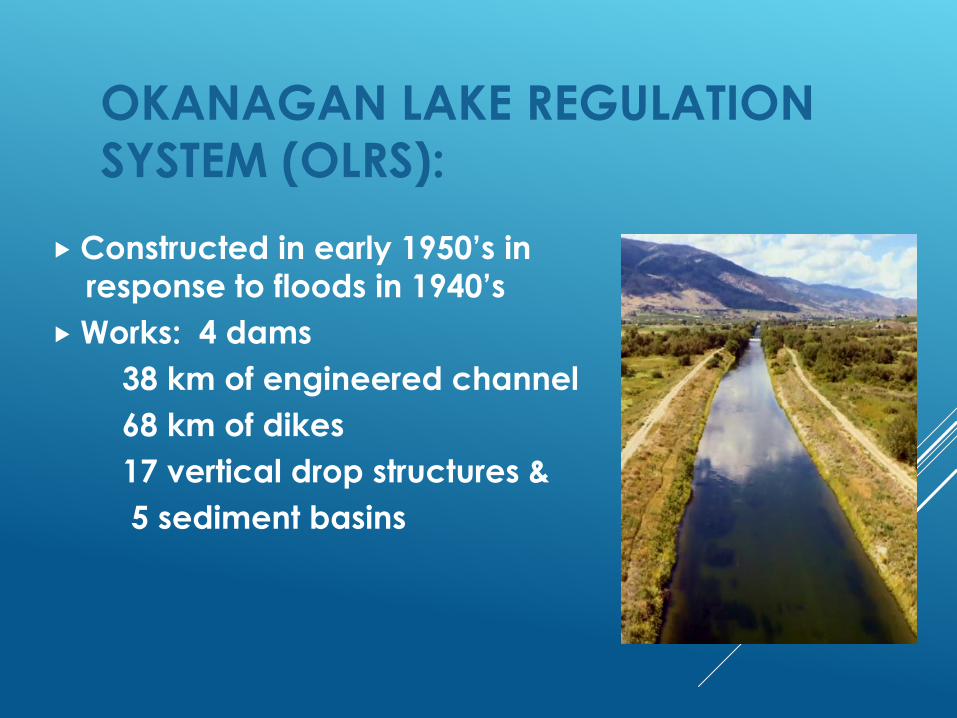
OKANAGAN LAKE REGULATION
SYSTEM (OLRS):
Constructed in early 1950’s in
response to floods in 1940’s
Works: 4 dams
38 km of engineered channel
68 km of dikes
17 vertical drop structures &
5 sediment basins
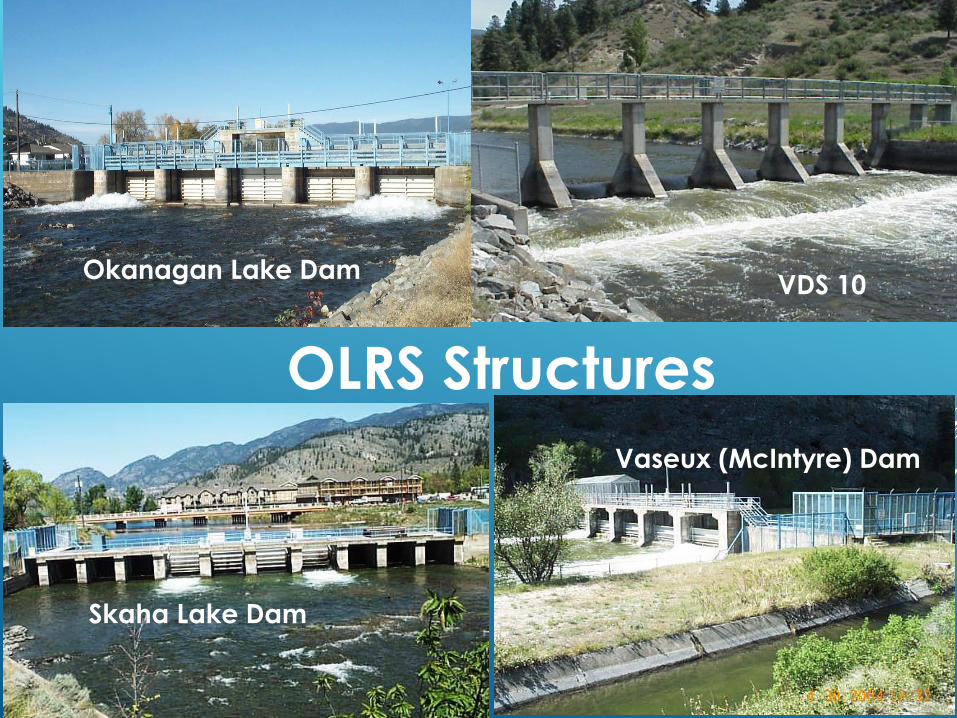
Okanagan Lake Dam
Skaha Lake Dam
Vaseux (McIntyre) Dam
VDS 10
OLRS Structures
Okanagan Lake Dam

▪ 30.4 km engineered channel (86%)
▪ 2.1 km set-back dykes (~6%)
▪ 2.8 km natural river (~8%)
Okanagan R.
(Oliver reach)

OKANAGAN R. IN 1938 AND IN 1996

OKANAGAN LAKE DAM
Okanagan Water
Management Operations

OKANAGAN BASIN AGREEMENT:
In the 1970’s the federal and provincial governments
jointly undertook a multi-year planning process to
develop a Comprehensive Frame Work Plan for
managing the water resources of the Okanagan to
“achieved a desirable balance
between the goals” of:
Economic Development
Environmental Quality
Social Betterment

OPERATIONAL IMPLEMENTATION OF
THE OKANAGAN BASIN AGREEMENT: The OBA provides general operating targets &
directions (i.e., target lake levels and river flows) to meet the multiple competing objectives of flood control, fisheries, water supply, recreation, navigation, tourism, etc. for each of the mainstem lakes and different sections of the Okanagan River
Responsibility for managing and operating system assigned to engineering staff of the Province’s Water Management Program.
Operational decisions regarding lake levels and releases were based on OBA targets, inflow forecasts, past experience, “rules of thumb”, and other WM annual operational considerations
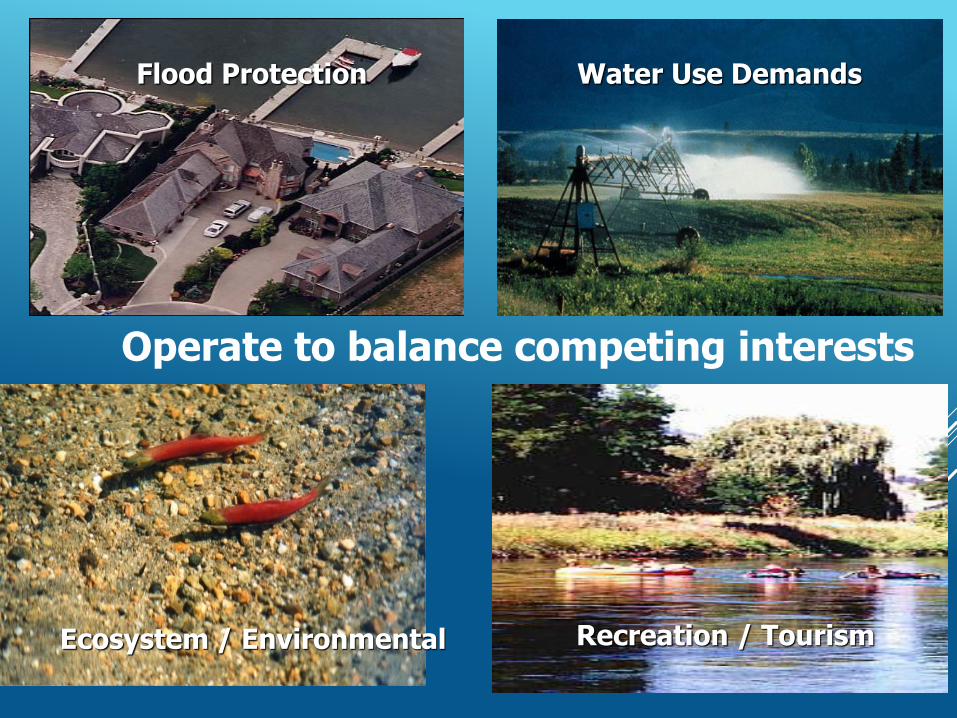
Operate to balance competing interests
Flood Protection
Ecosystem / Environmental Recreation / Tourism
Water Use Demands
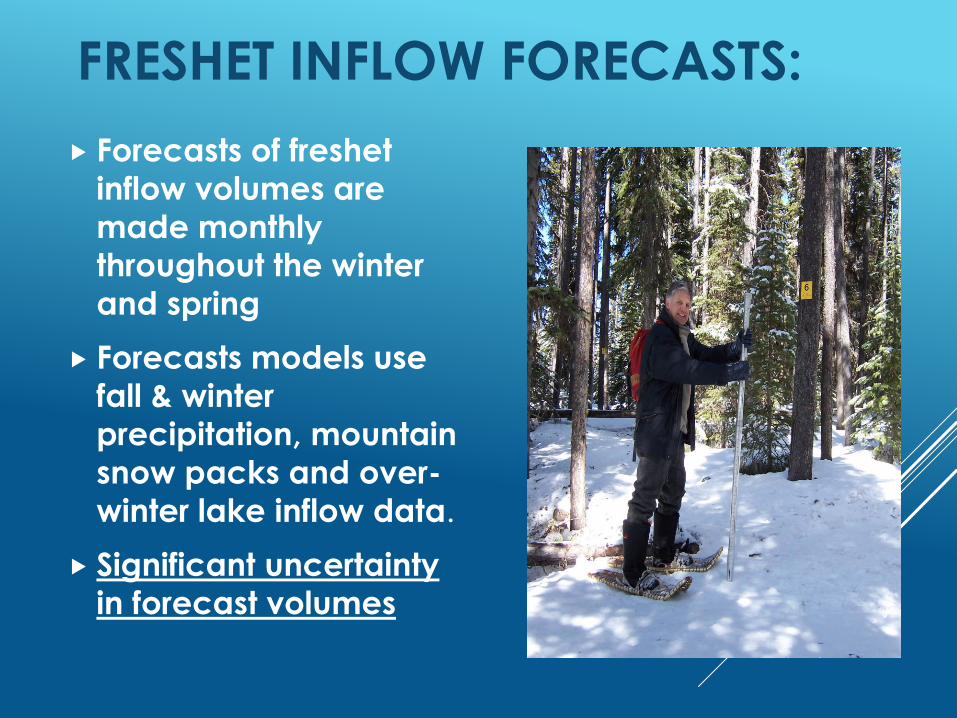
FRESHET INFLOW FORECASTS:
Forecasts of freshet
inflow volumes are
made monthly
throughout the winter
and spring
Forecasts models use
fall & winter
precipitation, mountain
snow packs and over-
winter lake inflow data.
Significant uncertainty
in forecast volumes
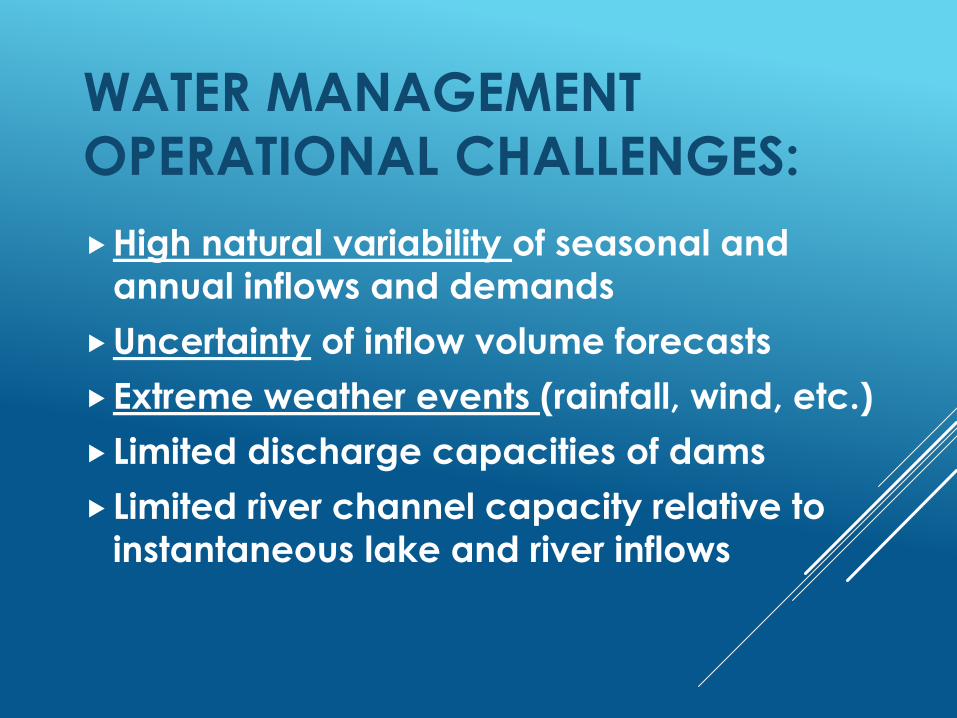
WATER MANAGEMENT
OPERATIONAL CHALLENGES:
High natural variability of seasonal and
annual inflows and demands
Uncertainty of inflow volume forecasts
Extreme weather events (rainfall, wind, etc.)
Limited discharge capacities of dams
Limited river channel capacity relative to
instantaneous lake and river inflows
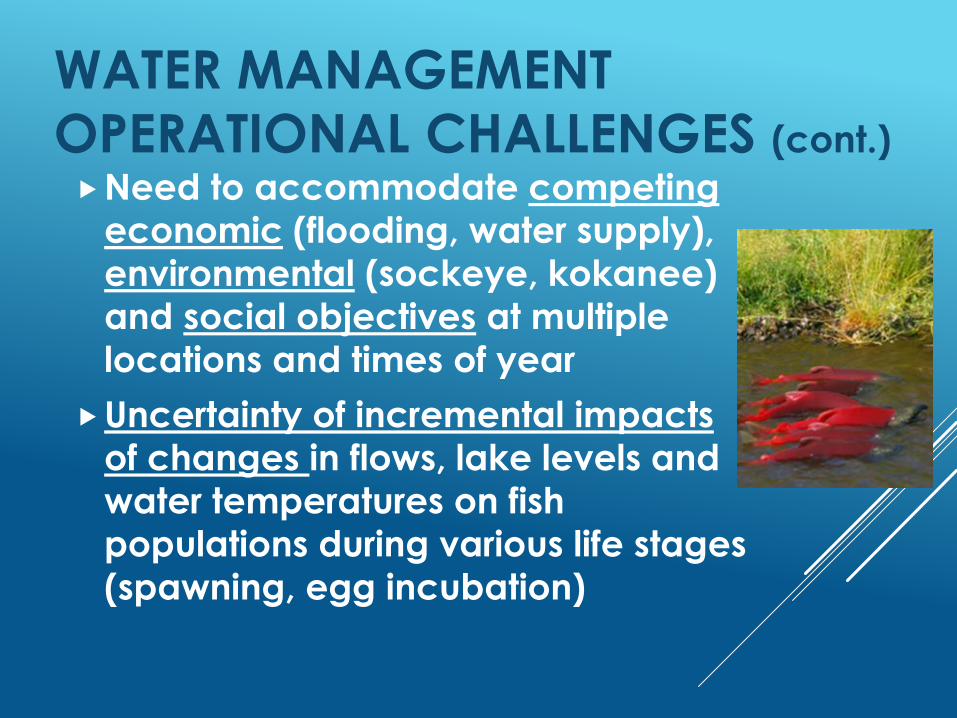
WATER MANAGEMENT
OPERATIONAL CHALLENGES (cont.)
Need to accommodate competing
economic (flooding, water supply),
environmental (sockeye, kokanee)
and social objectives at multiple
locations and times of year
Uncertainty of incremental impacts
of changes in flows, lake levels and
water temperatures on fish
populations during various life stages
(spawning, egg incubation)

SOCKEYE 4- YEAR LIFE CYCLE:
Year 1:
Eggs are laid in Oct/Nov
Fry emerge in April/May
& migrate d/s to lake
Year 2 (May/June):
After spending 1 year in
lake the smolts migrated d/s to ocean
Years 2 ,3 &4:
Rearing in
Ocean
Year 4:
Summer: Adults migrate u/s to lake
Fall: When temp drop continue migration into river spawning areas to spawn.
2
2,3 & 4
4
1

THE BEGINNINGS OF CHANGE:➢ Challenge of achieving the balance of water benefits
in OBA, including maintenance of “fish friendly” lake
levels and flows, had been given to local water
managers with limited input from fisheries agencies.
➢ In the 1990’s the Okanagan River was declared one of
the most endangered rivers in Canada, largely due to
serious declines in annual Okanagan sockeye returns
(from over 200,000 to less than 10,000 returning adults).
➢ In Washington State, FERC requirements for greater
mitigation of fish impacts of Columbia River PUD dams
➢ Greater interest and coordination amongst fisheries
agencies and other interests on both side of border
working together to find solutions.
1997

1997 Sockeye
Dilemma
Scour
Threshold Q En
d D
ate
Issues:
1. Very high inflow early season
forecast with high degree of
uncertainty.
2. Unclear relationship between Q above “threshold” & degree of
redd scour
A.
B.
C.

FORMING NEW PARTNERSHIPS:In 1998 two key partnerships were formed.
1. The Canadian Okanagan Basin Technical Working
Group, consisting of fisheries representatives from:
• Canadian Department of Fisheries & Ocean
• Okanagan Nation Alliance Fisheries Commission
• BC Provincial Fisheries program
2. The Bilateral Okanagan Basin Technical Working
Group, a transboundary partnership including the
members of COBTWG plus USA representatives from:
• Colville Confederated Tribes,
• Washington State & County Fisheries agencies
• Columbia River Public Utility Districts.
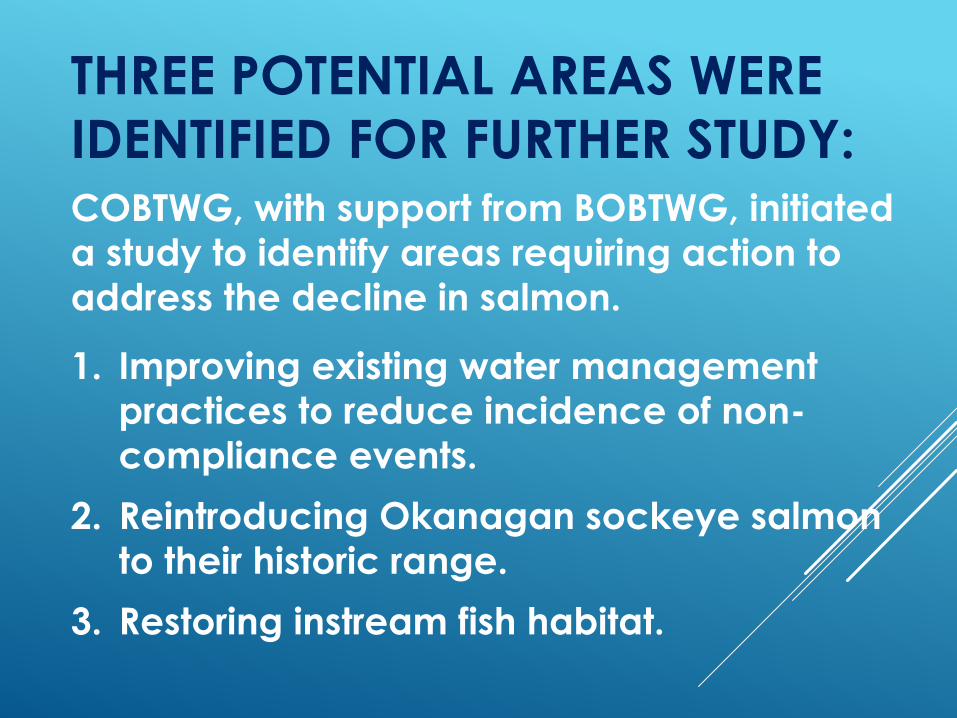
THREE POTENTIAL AREAS WERE
IDENTIFIED FOR FURTHER STUDY:COBTWG, with support from BOBTWG, initiated
a study to identify areas requiring action to
address the decline in salmon.
1. Improving existing water management
practices to reduce incidence of non-
compliance events.
2. Reintroducing Okanagan sockeye salmon
to their historic range.
3. Restoring instream fish habitat.
ADAPTIVE MANAGEMENT
EXAMPLE 1:
OKANAGAN FISH-WATER
MANAGEMENT TOOL
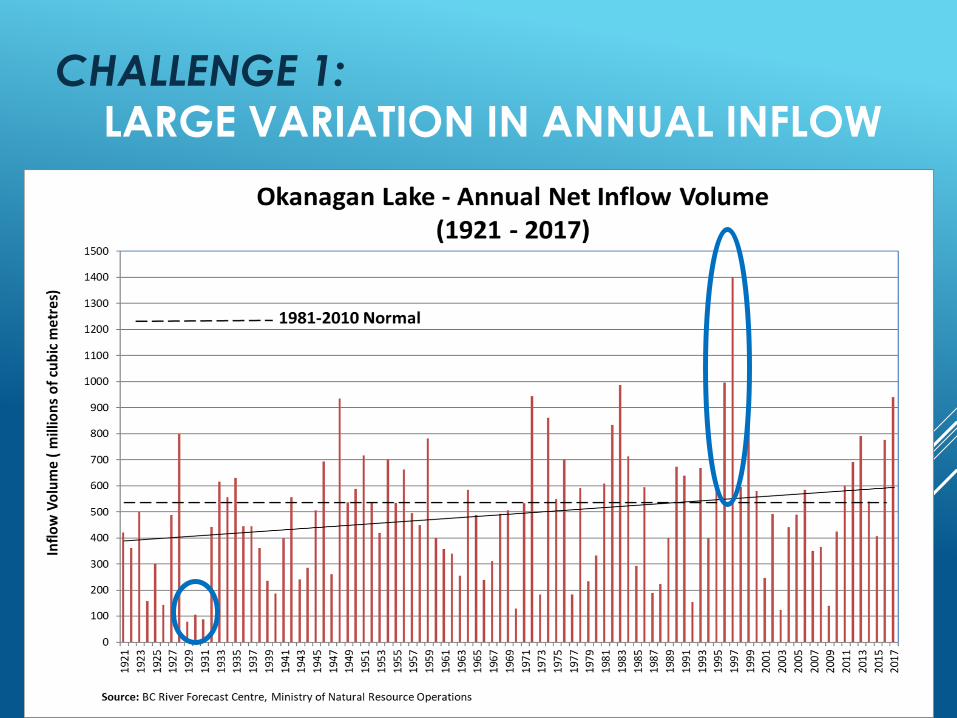
CHALLENGE 1: LARGE VARIATION IN ANNUAL INFLOW
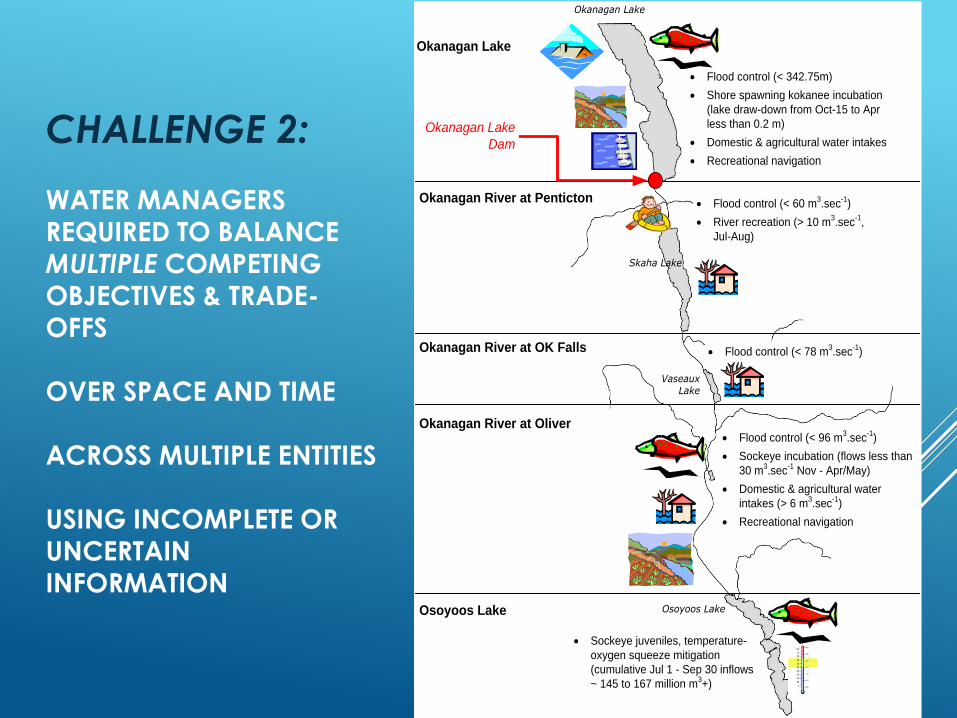
CHALLENGE 2:
WATER MANAGERS
REQUIRED TO BALANCE
MULTIPLE COMPETING
OBJECTIVES & TRADE-
OFFS
OVER SPACE AND TIME
ACROSS MULTIPLE ENTITIES
USING INCOMPLETE OR
UNCERTAIN
INFORMATION
Okanagan Lake
Okanagan River at Penticton
Okanagan River at OK Falls
Okanagan River at Oliver
Osoyoos Lake
Okanagan Lake
Skaha Lake
Vaseaux Lake
Osoyoos Lake
· Flood control (< 342.75m)
· Shore spawning kokanee incubation
(lake draw-down from Oct-15 to Apr
less than 0.2 m)
· Domestic & agricultural water intakes
· Recreational navigation
· Flood control (< 60 m3.sec
-1)
· River recreation (> 10 m3.sec
-1,
Jul-Aug)
· Flood control (< 78 m3.sec
-1)
· Flood control (< 96 m3.sec
-1)
· Sockeye incubation (flows less than
30 m3.sec
-1 Nov - Apr/May)
· Domestic & agricultural water
intakes (> 6 m3.sec
-1)
· Recreational navigation
· Sockeye juveniles, temperature-
oxygen squeeze mitigation
(cumulative Jul 1 - Sep 30 inflows
~ 145 to 167 million m3+)
Okanagan Lake
Dam
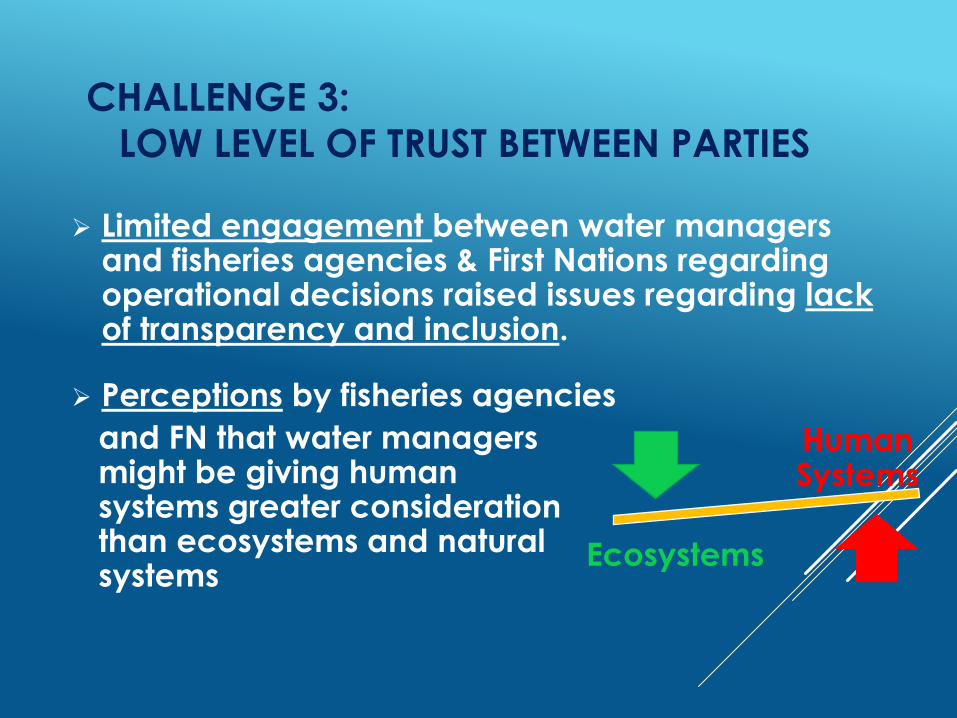
CHALLENGE 3:
LOW LEVEL OF TRUST BETWEEN PARTIES
➢ Limited engagement between water managers and fisheries agencies & First Nations regarding operational decisions raised issues regarding lack of transparency and inclusion.
➢ Perceptions by fisheries agencies
and FN that water managers might be giving human systems greater considerationthan ecosystems and natural systems
Human Systems
Ecosystems

ASSEMBLING THE TEAM AND FUNDING:➢ COBTWG met with water managers to better understand the
issues and challenges facing WM and to solicit their commitment to work together to resolve challenges.
➢ A decision to collaboratively design, build & deploy an Environmental Decision Support System (EDSS) to provide real-time science-based fish and water management tools to improve the balance of WM decisions affecting both human and natural systems.
➢ In addition to “in-kind support” from team members, financial support for the EDSS was secured from Douglas County PUD who were looking for opportunities to meet their FERC fish mitigation targets.
➢ ESSA hired to facilitate EDSS design & development.
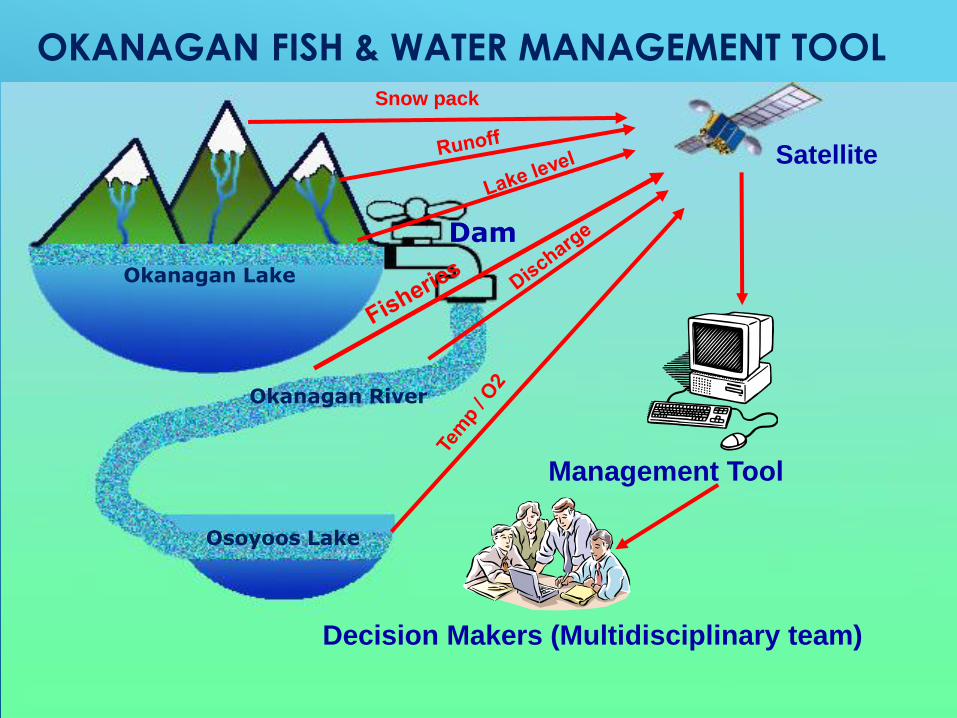
Management Tool
Decision Makers (Multidisciplinary team)
Satellite
Snow pack
Okanagan Lake
Okanagan River
Osoyoos Lake
Dam
OKANAGAN FISH & WATER MANAGEMENT TOOL

Project Development
& Field Work,
1999-2001
Spring, 2002
Submodel Designs
Summer 2002
Model Construction,
Fall 2002-03
Model Revisions,
Release, 2003-04
Design Workshop
Review
& Revision
Test Applications;
Training Implementation,
Field Work
2005-now
Climate Change
2006-07
6
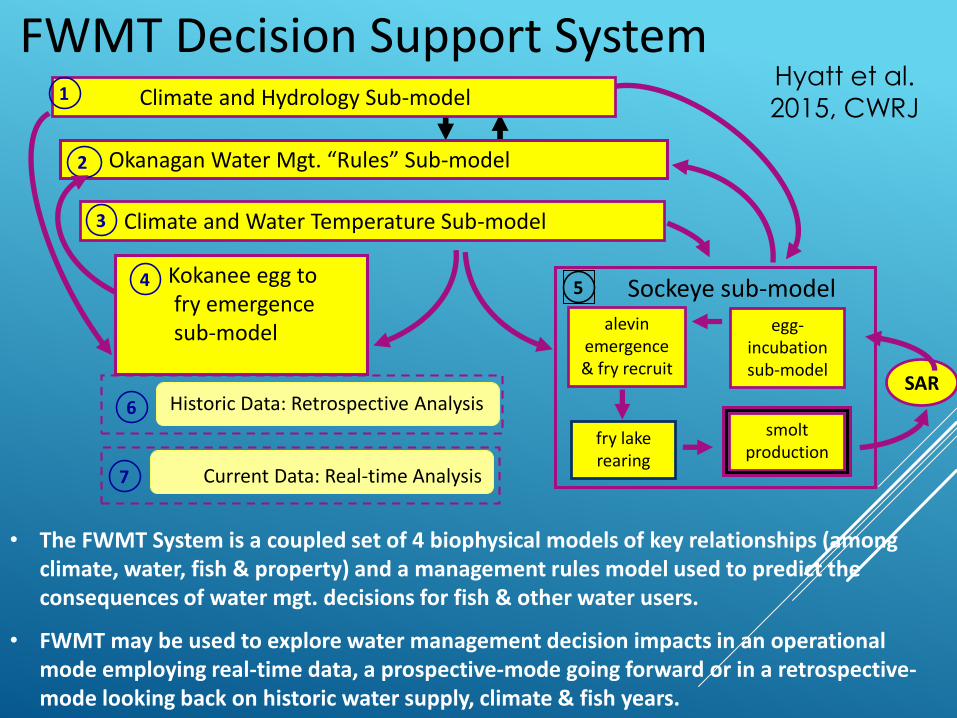
Sockeye sub-modelalevin
emergence & fry recruit
egg-incubation sub-model
fry lake rearing
SAR
smolt production
Climate and Hydrology Sub-model
Climate and Water Temperature Sub-model
Kokanee egg tofry emergencesub-model
Okanagan Water Mgt. “Rules” Sub-model
3
54
2
1
• The FWMT System is a coupled set of 4 biophysical models of key relationships (among climate, water, fish & property) and a management rules model used to predict the consequences of water mgt. decisions for fish & other water users.
• FWMT may be used to explore water management decision impacts in an operational mode employing real-time data, a prospective-mode going forward or in a retrospective-mode looking back on historic water supply, climate & fish years.
Historic Data: Retrospective Analysis
7 Current Data: Real-time Analysis
FWMT Decision Support System Hyatt et al.
2015, CWRJ

WHAT IS THE “FISH WATER
MANAGEMENT TOOL”? An Internet-accessible decision support system (hosted at
ESSA),which incorporates real-time data (lake levels, flows,
water temperatures, actual spawning dates, etc.) into a set linked hydrology and biological submodels
Collaboratively developed and applied tool to support
operational WM decision making
Allows gaming and rapid trade-off analysis of potential release
scenarios by the various fishery and water management
agencies which supports transparent and inclusive in-season
decision making
Documents in-season decisions and learnings
FWMT is updated periodically by working group based on field
work, learnings, etc. (Adaptive Management loop)
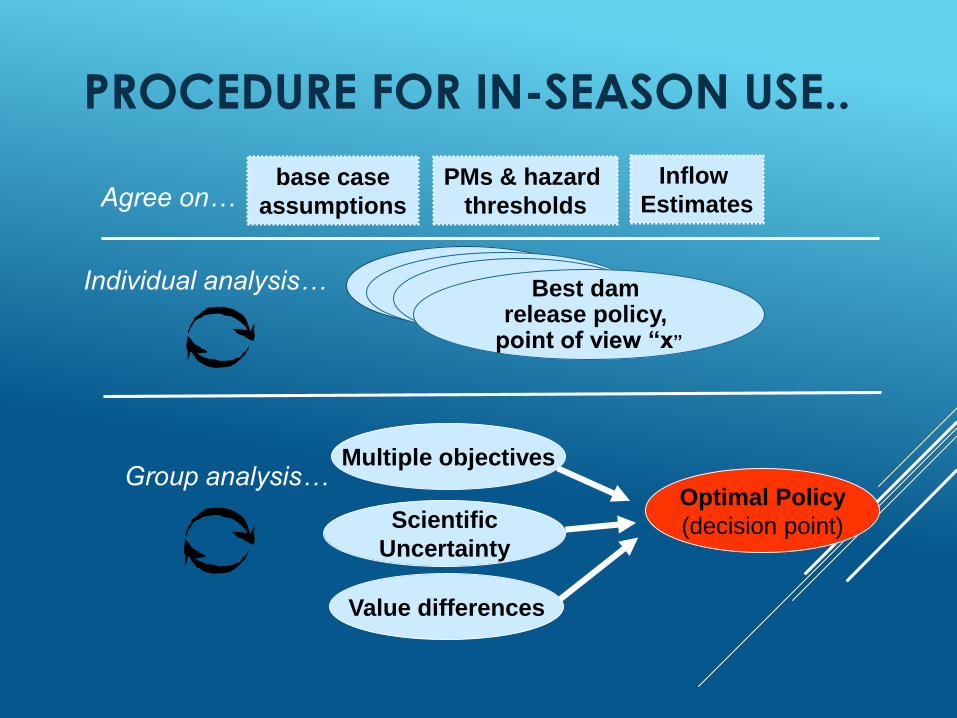
PROCEDURE FOR IN-SEASON USE..
Optimal Policy
(decision point)
Multiple objectives
Scientific
Uncertainty
Value differences
base case
assumptions
PMs & hazard
thresholdsAgree on…Inflow
Estimates
Individual analysis… Best dam release policy,
point of view “x”
Group analysis…
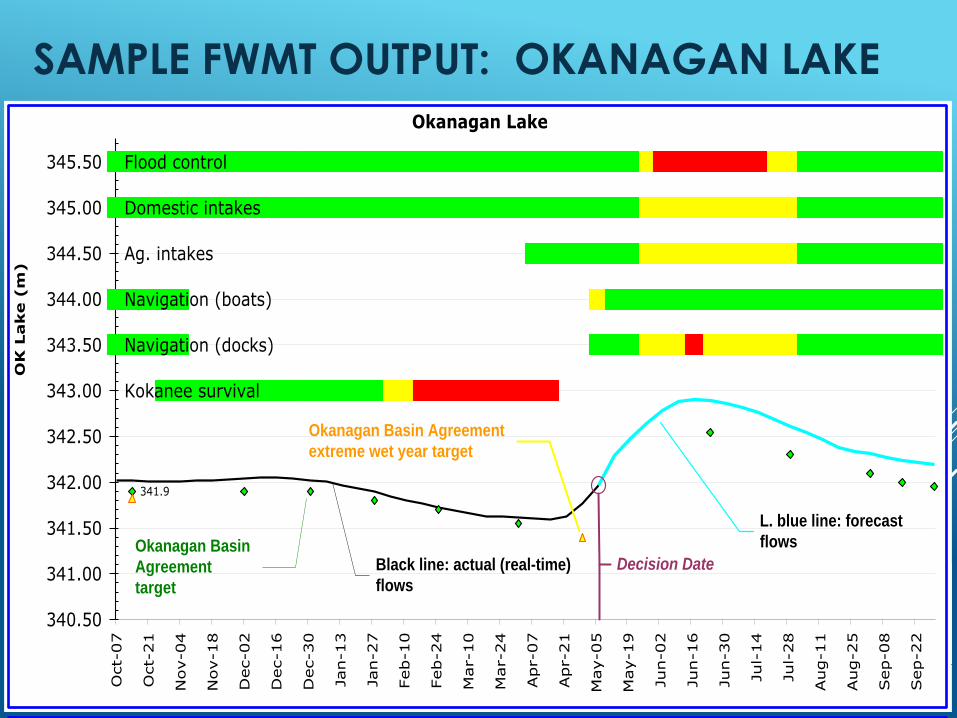
SAMPLE FWMT OUTPUT: OKANAGAN LAKE
Okanagan Lake - Average
Flood control
Domestic intakes
Ag. intakes
Navigation (boats)
Navigation (docks)
Kokanee survival
341.9
340.50
341.00
341.50
342.00
342.50
343.00
343.50
344.00
344.50
345.00
345.50
Oct-
07
Oct-
21
Nov-04
Nov-18
Dec-02
Dec-16
Dec-30
Jan-13
Jan-27
Feb-10
Feb-24
Mar-10
Mar-24
Apr-07
Apr-21
May-05
May-19
Jun-02
Jun-16
Jun-30
Jul-
14
Jul-
28
Aug-11
Aug-25
Sep-08
Sep-22
OK
Lake (
m)
Okanagan River at Penticton - Average
Flood control
Recreation
0.0
10.0
20.0
30.0
40.0
50.0
60.0
70.0
80.0
90.0
100.0
110.0
120.0
130.0
140.0
150.0
160.0
Oct-
07
Oct-
21
Nov-04
Nov-18
Dec-02
Dec-16
Dec-30
Jan-13
Jan-27
Feb-10
Feb-24
Mar-10
Mar-24
Apr-07
Apr-21
May-05
May-19
Jun-02
Jun-16
Jun-30
Jul-
14
Jul-
28
Aug-11
Aug-25
Sep-08
Sep-22
OK
Riv
er (
m3.s
ec
-1)
Okanagan River at Okanagan Falls - Average
-5.0
5.0
15.0
25.0
35.0
45.0
55.0
65.0
75.0
85.0
95.0
105.0
115.0
125.0
135.0
145.0
155.0
Oct-
07
Oct-
21
Nov-04
Nov-18
Dec-02
Dec-16
Dec-30
Jan-13
Jan-27
Feb-10
Feb-24
Mar-10
Mar-24
Apr-07
Apr-21
May-05
May-19
Jun-02
Jun-16
Jun-30
Jul-
14
Jul-
28
Aug-11
Aug-25
Sep-08
Sep-22
Zoom In
Zoom Out
Black line: actual (real-time)
flows
L. blue line: forecast
flows
Decision DateOkanagan Basin
Agreement
target
Okanagan Basin Agreement
extreme wet year target

SAMPLE FWMT OUTPUT:
OKANAGAN RIVER AT OLIVER Okanagan River at Oliver - Low
Flood control
Domestic intakes
Ag. intakes
Sockeye Eggs
Sockeye Alevins
-5.0
5.0
15.0
25.0
35.0
45.0
55.0
65.0
75.0
85.0
95.0
105.0
115.0
125.0
135.0
145.0
155.0
Oct
-07
Oct
-21
Nov-0
4
Nov-1
8
Dec-
02
Dec-
16
Dec-
30
Jan-1
3
Jan-2
7
Feb-1
0
Feb-2
4
Mar-
10
Mar-
24
Apr-
07
Apr-
21
May-0
5
May-1
9
Jun-0
2
Jun-1
6
Jun-3
0
Jul-14
Jul-28
Aug-1
1
Aug-2
5
Sep-0
8
Sep-2
2
OK
Riv
er
(m3.s
ec-1
)
Okanagan Basin Agreement
target to min. sox scour
BC-Washington Co-Operative
Plan minimum flow targets
Sockeye biologist’s rule of
thumb to avoid de-watering
Black line: actual (real-time)
flows
L. blue line: forecast
flows
Net tributary inflows
(incld. evaporation and
water withdrawals)
between Penticton and
Oliver

If OKFWM had been used between 1974 and 2003:
– What release decisions would have been made?
– How might this have changed the abundance of
sockeye?
FWMT Retrospective Analysis
(Test of benefits):

Okanagan Lake - Average
Flood control
Domestic intakes
Ag. intakes
Navigation (boats)
Navigation (docks)
Kokanee survival
341.9
340.50
341.00
341.50
342.00
342.50
343.00
343.50
344.00
344.50
345.00
345.50
Oct-
07
Oct-
21
Nov-0
4
Nov-1
8
Dec-0
2
Dec-1
6
Dec-3
0
Jan-1
3
Jan-2
7
Feb-1
0
Feb-2
4
Mar-
10
Mar-
24
Apr-
07
Apr-
21
May-0
5
May-1
9
Jun-0
2
Jun-1
6
Jun-3
0
Jul-
14
Jul-
28
Aug-1
1
Aug-2
5
Sep-0
8
Sep-2
2
OK
Lake (
m)
Okanagan River at Penticton - Average
Flood control
Recreation
0.0
10.0
20.0
30.0
40.0
50.0
60.0
70.0
80.0
90.0
100.0
110.0
120.0
130.0
140.0
150.0
160.0
Oct-
07
Oct-
21
Nov-0
4
Nov-1
8
Dec-0
2
Dec-1
6
Dec-3
0
Jan-1
3
Jan-2
7
Feb-1
0
Feb-2
4
Mar-
10
Mar-
24
Apr-
07
Apr-
21
May-0
5
May-1
9
Jun-0
2
Jun-1
6
Jun-3
0
Jul-
14
Jul-
28
Aug-1
1
Aug-2
5
Sep-0
8
Sep-2
2
OK
Riv
er (
m3.s
ec
-1)
Okanagan River at Oliver - Average
Flood control
Domestic intakes
Ag. intakes
Sockeye Eggs
Sockeye Alevins
-5.0
5.0
15.0
25.0
35.0
45.0
55.0
65.0
75.0
85.0
95.0
105.0
115.0
125.0
135.0
145.0
155.0
Oct-
07
Oct-
21
Nov-0
4
Nov-1
8
Dec-0
2
Dec-1
6
Dec-3
0
Jan-1
3
Jan-2
7
Feb-1
0
Feb-2
4
Mar-
10
Mar-
24
Apr-
07
Apr-
21
May-0
5
May-1
9
Jun-0
2
Jun-1
6
Jun-3
0
Jul-
14
Jul-
28
Aug-1
1
Aug-2
5
Sep-0
8
Sep-2
2
OK
Riv
er (
m3.s
ec
-1)
Zoom In
Zoom Out
Lake
Level
Dam
Release
D/S
River
Flow
1991 Actual
Okanagan Lake - Average
Flood control
Domestic intakes
Ag. intakes
Navigation (boats)
Navigation (docks)
Kokanee survival
341.9
340.50
341.00
341.50
342.00
342.50
343.00
343.50
344.00
344.50
345.00
345.50
Oct
-07
Oct
-21
Nov-0
4
Nov-1
8
Dec-
02
Dec-
16
Dec-
30
Jan-1
3
Jan-2
7
Feb-1
0
Feb-2
4
Mar-
10
Mar-
24
Apr-
07
Apr-
21
May-0
5
May-1
9
Jun-0
2
Jun-1
6
Jun-3
0
Jul-
14
Jul-
28
Aug-1
1
Aug-2
5
Sep-0
8
Sep-2
2
OK
Lake (
m)
Okanagan River at Penticton - Average
Flood control
Recreation
0.0
10.0
20.0
30.0
40.0
50.0
60.0
70.0
80.0
90.0
100.0
110.0
120.0
130.0
140.0
150.0
160.0
Oct
-07
Oct
-21
Nov-0
4
Nov-1
8
Dec-
02
Dec-
16
Dec-
30
Jan-1
3
Jan-2
7
Feb-1
0
Feb-2
4
Mar-
10
Mar-
24
Apr-
07
Apr-
21
May-0
5
May-1
9
Jun-0
2
Jun-1
6
Jun-3
0
Jul-
14
Jul-
28
Aug-1
1
Aug-2
5
Sep-0
8
Sep-2
2
OK
Riv
er
(m
3.s
ec
-1)
Okanagan River at Oliver - Average
Flood control
Domestic intakes
Ag. intakes
Sockeye Eggs
Sockeye Alevins
-5.0
5.0
15.0
25.0
35.0
45.0
55.0
65.0
75.0
85.0
95.0
105.0
115.0
125.0
135.0
145.0
155.0
Oct
-07
Oct
-21
Nov-0
4
Nov-1
8
Dec-
02
Dec-
16
Dec-
30
Jan-1
3
Jan-2
7
Feb-1
0
Feb-2
4
Mar-
10
Mar-
24
Apr-
07
Apr-
21
May-0
5
May-1
9
Jun-0
2
Jun-1
6
Jun-3
0
Jul-
14
Jul-
28
Aug-1
1
Aug-2
5
Sep-0
8
Sep-2
2
OK
Riv
er
(m
3.s
ec
-1)
Osoyoos Lake - Average
0
20
40
60
80
100
120
140
160
180
200
220
240
260
Oct
-07
Oct
-21
Nov-0
4
Nov-1
8
Dec-
02
Dec-
16
Dec-
30
Jan-1
3
Jan-2
7
Feb-1
0
Feb-2
4
Mar-
10
Mar-
24
Apr-
07
Apr-
21
May-0
5
May-1
9
Jun-0
2
Jun-1
6
Jun-3
0
Jul-
14
Jul-
28
Aug-1
1
Aug-2
5
Sep-0
8
Sep-2
2
Oct
-06
Oct
-20
Nov-0
3
Nov-1
7
Dec-
01
Zoom In
Zoom Out
1991 with FWMT
Kokanee dewatering avoided
Sockeye scour avoided
Recreation maintained
Some
flood
risk

1974-2003 RETROSPECTIVE ANALYSIS:PREDICTED INCREASE IN SOCKEYE SMOLT PRODUCTION
WITH FWMT VS. ACTUAL WATER MANAGEMENT
n = 25mean
0
1
2
3
4
5
6
7
8
(15,
000) -
60,
000
120
,000
180
,000
240
,000
300
,000
360
,000
420
,000
480
,000
540
,000
600
,000
660
,000
720
,000
780
,000
840
,000
900
,000
960
,000
1,0
20,0
00
1,0
80,0
00
1,1
40,0
00
Mor
e
Increase in smolt production using OKFWM
Freq
uenc
y
median
Mean = +384,000/yr (+55%)
Median = +86,000/yr (+12%)
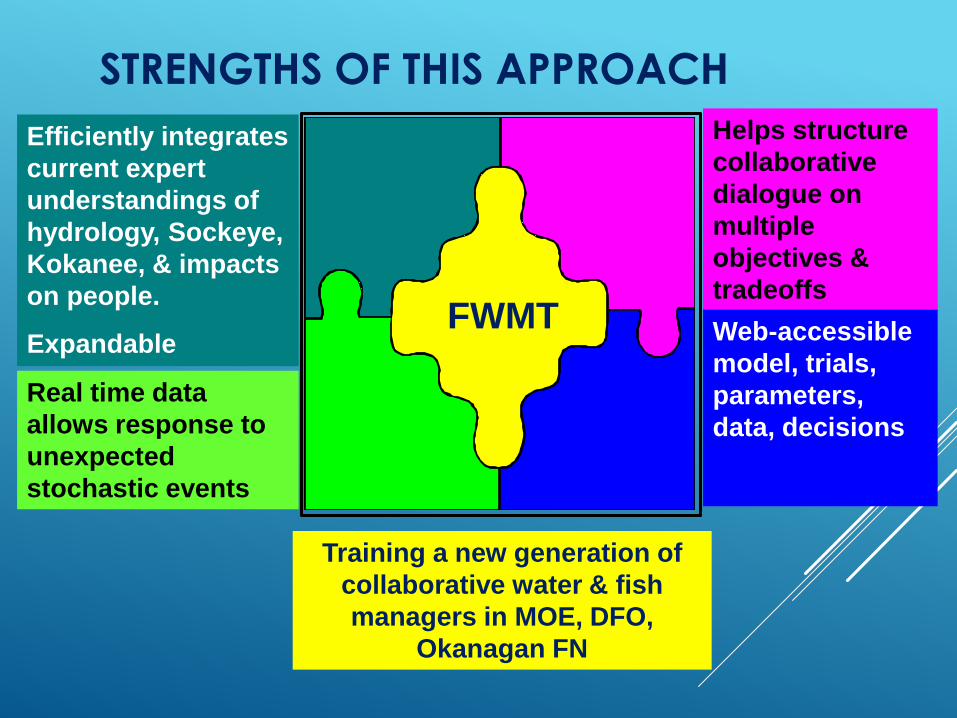
STRENGTHS OF THIS APPROACH
Efficiently integrates
current expert
understandings of
hydrology, Sockeye,
Kokanee, & impacts
on people.
Expandable
Real time data
allows response to
unexpected
stochastic events
Helps structure
collaborative
dialogue on
multiple
objectives &
tradeoffs
Web-accessible
model, trials,
parameters,
data, decisions
FWMT
Training a new generation of
collaborative water & fish
managers in MOE, DFO,
Okanagan FN

POST IMPLEMENTATION SUBMODEL:
TEMPERATURE / OXYGEN SQUEEZE IN
OSOYOOS LAKE
High water temperatures
Fish squeezed
Into small zone
Low oxygen levels
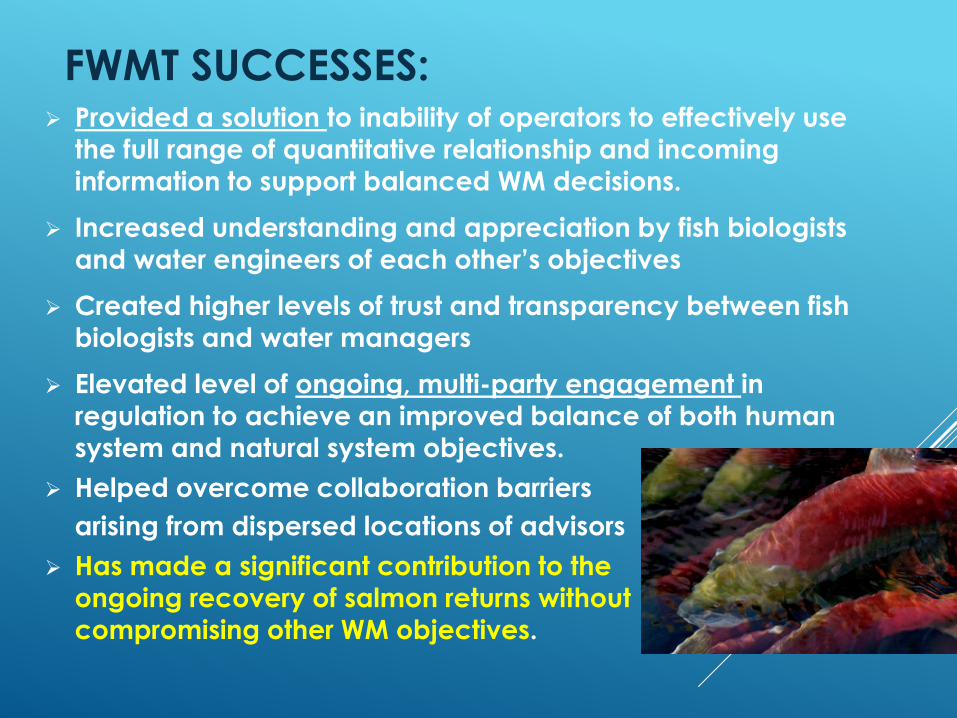
FWMT SUCCESSES:➢ Provided a solution to inability of operators to effectively use
the full range of quantitative relationship and incoming
information to support balanced WM decisions.
➢ Increased understanding and appreciation by fish biologists
and water engineers of each other’s objectives
➢ Created higher levels of trust and transparency between fish
biologists and water managers
➢ Elevated level of ongoing, multi-party engagement in
regulation to achieve an improved balance of both human
system and natural system objectives.
➢ Helped overcome collaboration barriers
arising from dispersed locations of advisors
➢ Has made a significant contribution to theongoing recovery of salmon returns without
compromising other WM objectives.
ADAPTIVE MANAGEMENT
EXAMPLE 2:
SKAHA LAKE EXPERIMENTAL SOCKEYE
SALMON RE-INTRODUCTION
PROGRAM

OKANAGAN FIRST NATIONS
Okanagan salmon are very significant to Okanagan FN’s culturally, ceremonially and as atraditional food source.
FN’s were strong champions within COBTWG for restoring the indigenous range of Okanagan sockeye; including Skaha and Okanagan Lakes.

Range limited by small
irrigation dam
constructed in 1950’s
created a barrier to
sockeye upstream
migration
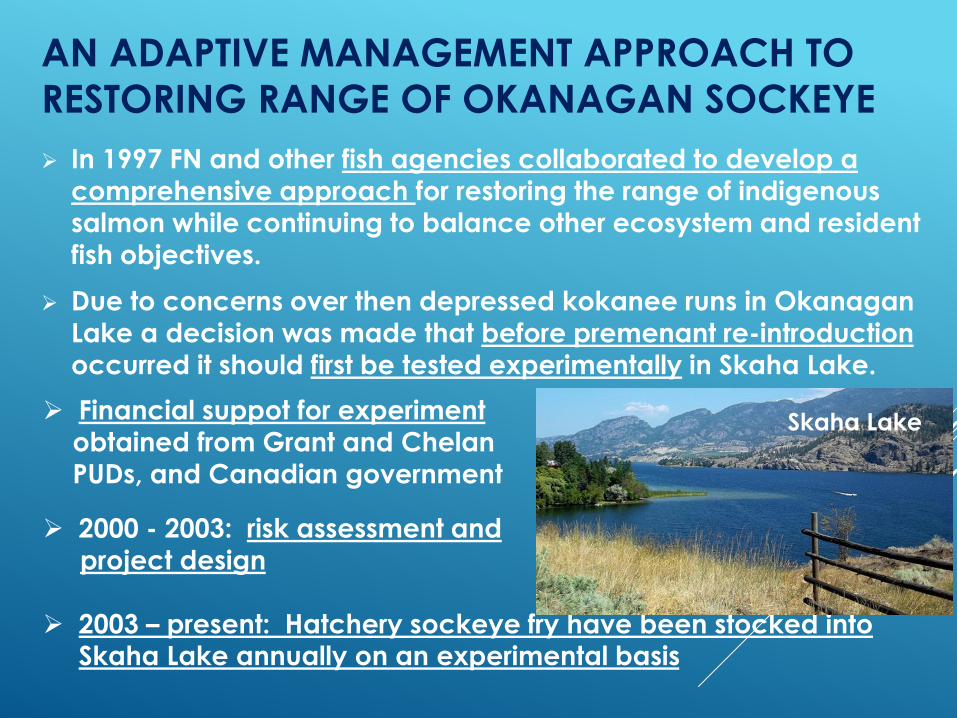
AN ADAPTIVE MANAGEMENT APPROACH TO
RESTORING RANGE OF OKANAGAN SOCKEYE
➢ In 1997 FN and other fish agencies collaborated to develop a
comprehensive approach for restoring the range of indigenous
salmon while continuing to balance other ecosystem and resident fish objectives.
➢ Due to concerns over then depressed kokanee runs in Okanagan
Lake a decision was made that before premenant re-introduction
occurred it should first be tested experimentally in Skaha Lake.
➢ Financial suppot for experiment
obtained from Grant and Chelan
PUDs, and Canadian government
➢ 2000 - 2003: risk assessment and
project design
➢ 2003 – present: Hatchery sockeye fry have been stocked into Skaha Lake annually on an experimental basis
Skaha Lake

KEY MANAGEMENT GOALS FOR SKAHA LAKE
EXPERIMENTAL RE-INTRODUCTION STUDIES:
➢ Restore sockeye to historic range with in Okanagan
➢ Determine whether Skaha Lake sockeye could be produce in
sufficient numbers to meet PUD’s smolt production requirements.
➢ Determine the effects of hatchery-reared kokanee may have on
Skaha Lake kokanee
➢ Assess potential negative impacts on Osoyoos Lake sockeye
from genetic introgression
and disease transmission
➢ Assess carrying capacity of
Skaha Lake for sockeye
and/or kokanee
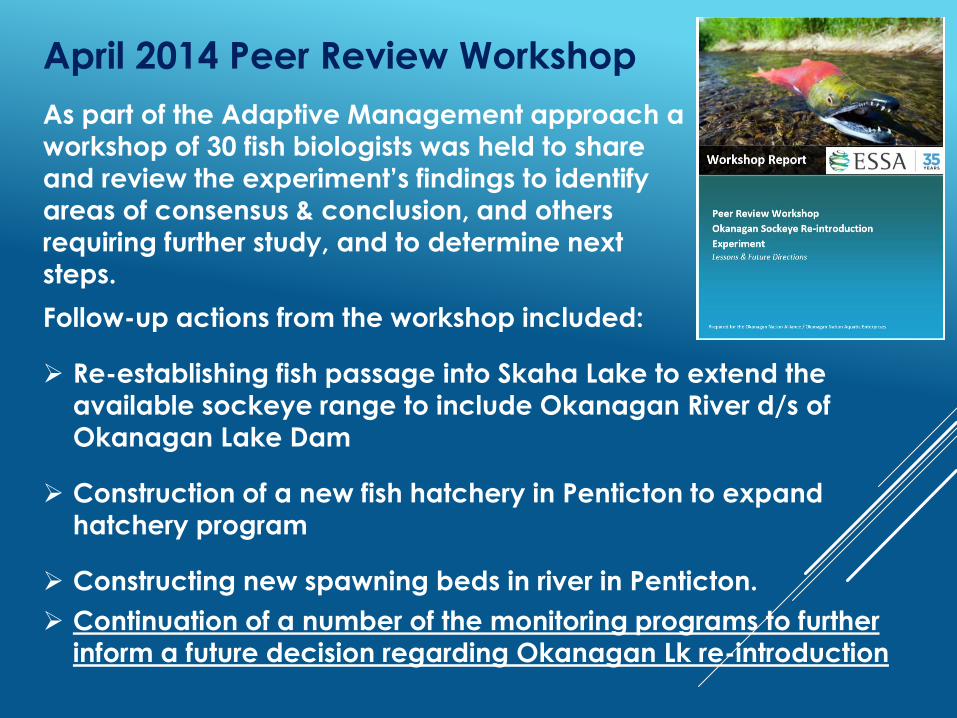
Follow-up actions from the workshop included:
➢ Re-establishing fish passage into Skaha Lake to extend the
available sockeye range to include Okanagan River d/s of
Okanagan Lake Dam
➢ Construction of a new fish hatchery in Penticton to expand
hatchery program
➢ Constructing new spawning beds in river in Penticton.
➢ Continuation of a number of the monitoring programs to further inform a future decision regarding Okanagan Lk re-introduction
April 2014 Peer Review Workshop
As part of the Adaptive Management approach a
workshop of 30 fish biologists was held to share
and review the experiment’s findings to identify
areas of consensus & conclusion, and others requiring further study, and to determine next
steps.

OKANAGAN RIVER RESTORATION INITIATIVE –
RESTORING HABITAT AND RANGE
While the re-introduction
experiment in Skaha Lake
was taking place, a
number of changes have
been made to remove
downstream barriers and
restore habitat.
Backwatering an existing
drop structure by adding a
series of riffles to add
complexity to an otherwise uniform channel.
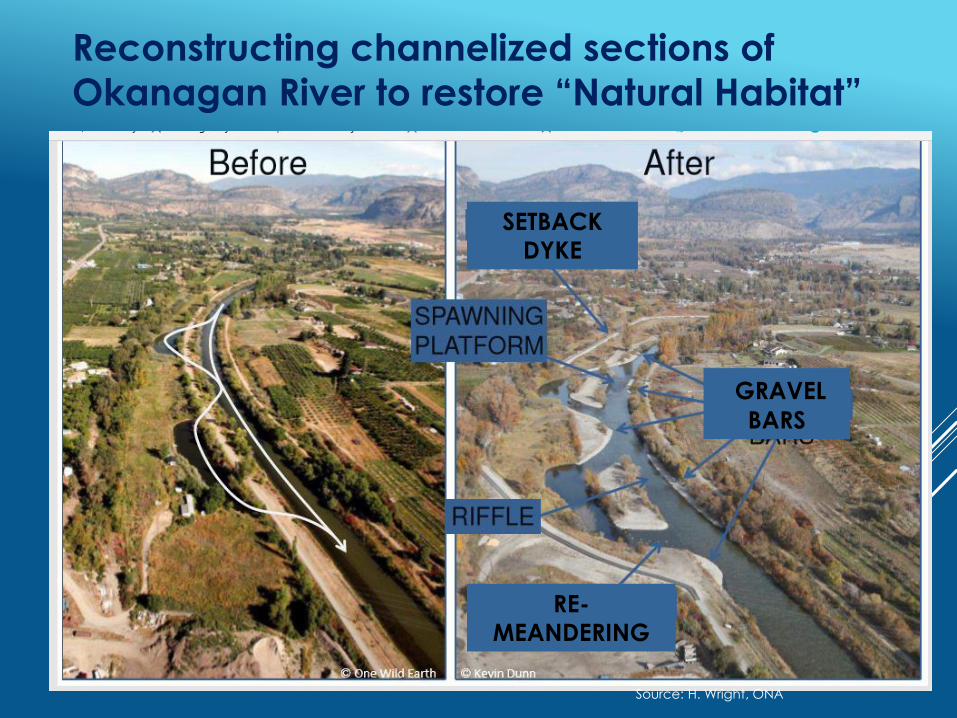
Reconstructing channelized sections of
Okanagan River to restore “Natural Habitat”
Source: H. Wright, ONA
GRAVEL
BARS
SETBACK
DYKE
RE-
MEANDERING

McIntyre Irrigation Dam:
Replacement of Roller Gates
with Fish Friendly Overshot
Gates (2010)
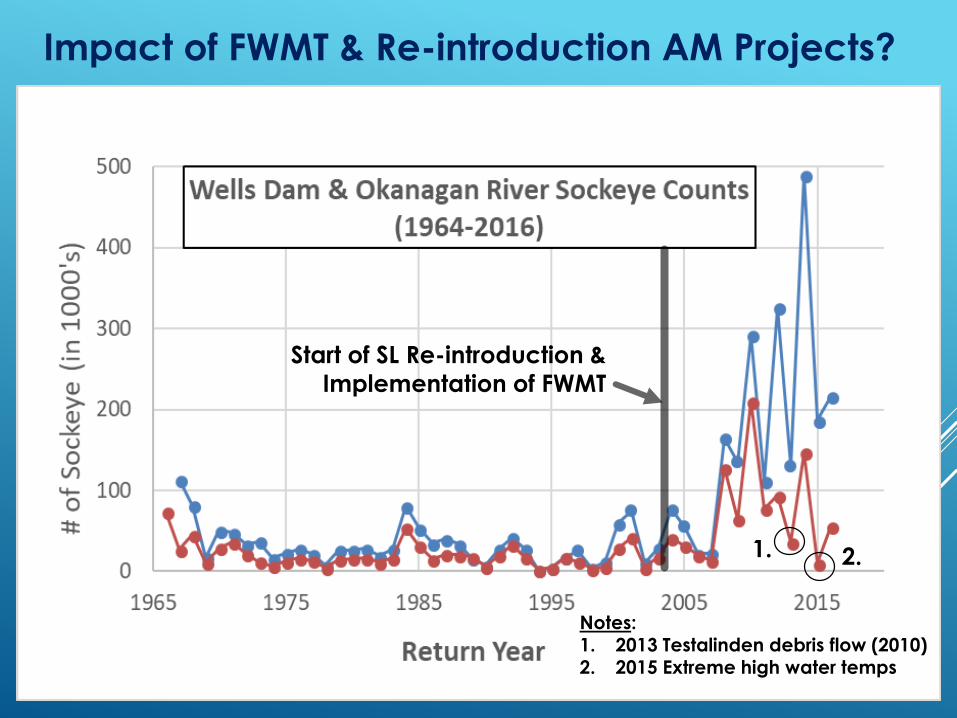
Start of SL Re-introduction &
Implementation of FWMT
Impact of FWMT & Re-introduction AM Projects?
Notes:1. 2013 Testalinden debris flow (2010)2. 2015 Extreme high water temps
1. 2.

Higher sockeye returns
have enabled new
Food, Commercial and
Recreational Fisheries
in the Okanagan
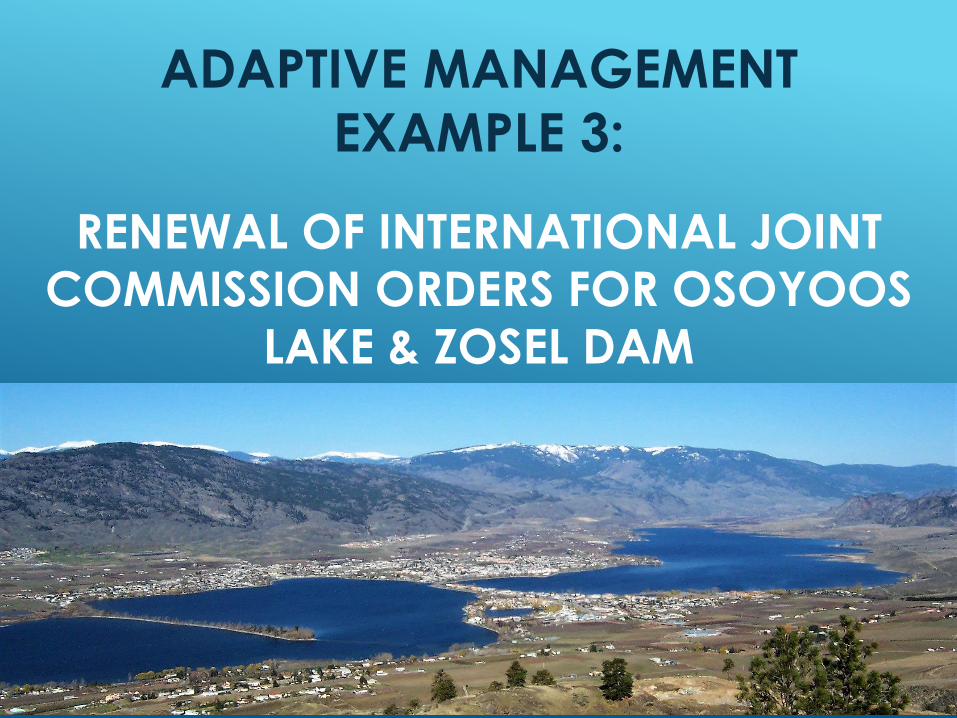
ADAPTIVE MANAGEMENT
EXAMPLE 3:
RENEWAL OF INTERNATIONAL JOINT
COMMISSION ORDERS FOR OSOYOOS
LAKE & ZOSEL DAM

OSOYOOS LAKE
& ZOSEL DAM
Osoyoos Lake straddles the international boundary in south central British Columbia and north central Washington
Zosel
Dam
International
Boundary
N
Osoyoos Lake
Zosel Dam
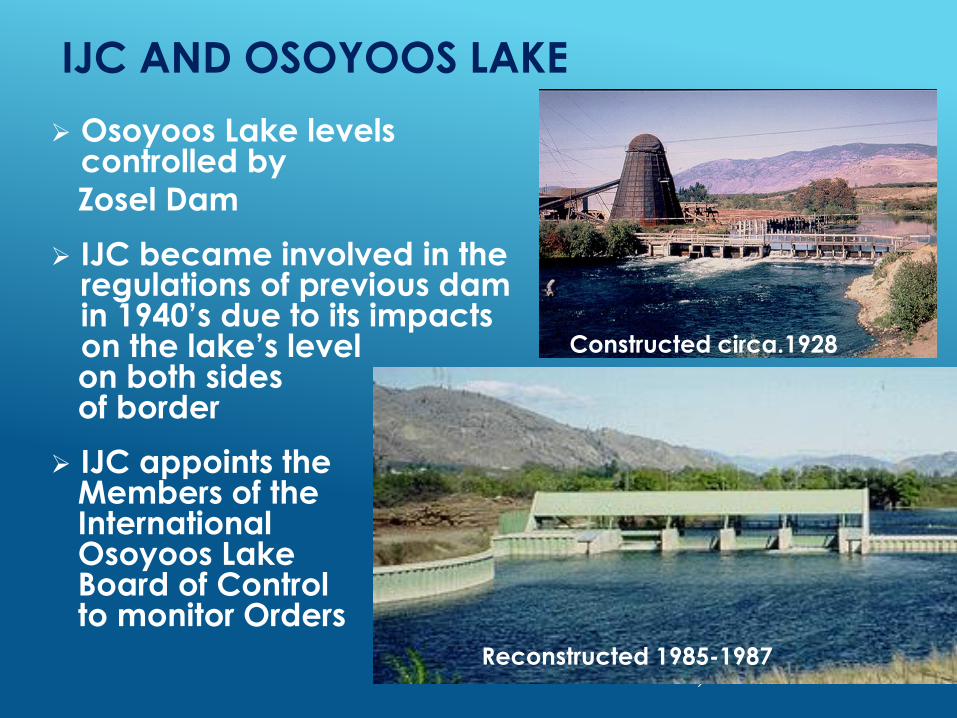
IJC AND OSOYOOS LAKE
➢ Osoyoos Lake levels controlled by
Zosel Dam
➢ IJC became involved in the regulations of previous dam in 1940’s due to its impacts on the lake’s level on both sides of border
➢ IJC appoints theMembers of the International Osoyoos LakeBoard of Controlto monitor Orders
Constructed circa.1928
Reconstructed 1985-1987
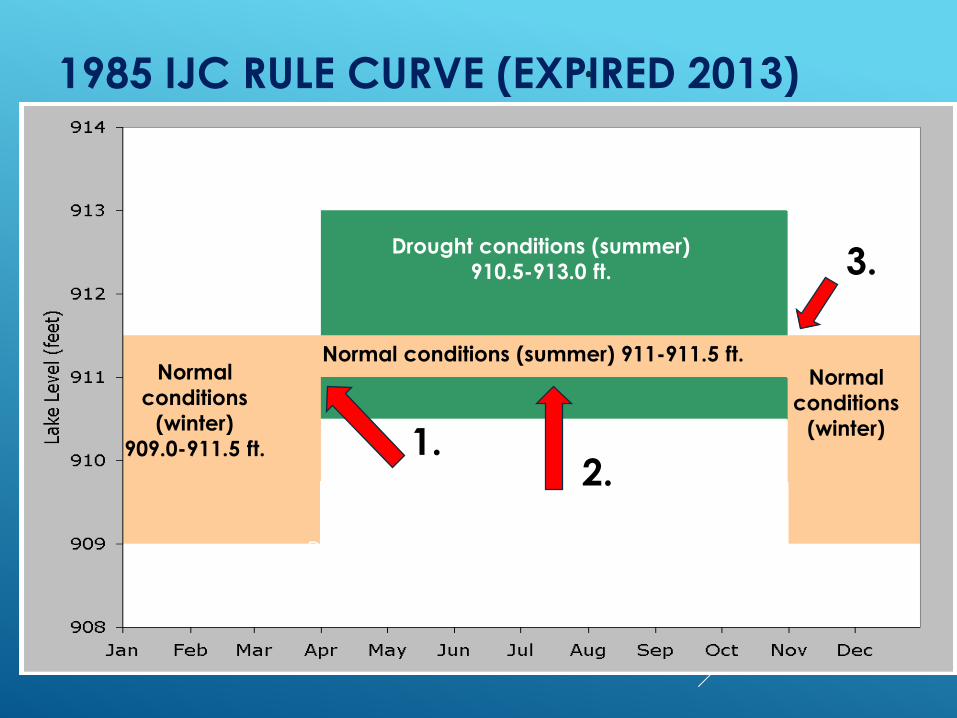
1985 IJC RULE CURVE (EXPIRED 2013)
Normal
conditions
(winter)
909.0-911.5 ft.
Normal conditions (summer) 911-911.5 ft.
Drought conditions (summer)
910.5-913.0 ft.
Normal
conditions
(winter)
Prescribed lake levels may be exceeded by
high Okanagan flows or by backwater from
the Similkameen River
1..2.
3.

ORDER RENEWAL PROCESS
➢ 1985 IJC Order was to expire in February 2013.
➢ IJC process to renew the Osoyoos Lake Order
Plan of Study (2006) & 8 individual technical studies
2011 Osoyoos Lake Water Science Forum
Board prepared recommendations for IJC
Public hearings & public comment period, and
Renewed application for Zosel Dam by State of Washington
➢ IJC committed to providing long term funding, organizational and technical support to renewal process

SUPPORTING TECHNICAL
STUDIES:Overall Plan of Study (2006)
➢ Drought Criteria
➢ Review of Key Operating Dates
➢ Assessment of Suitable Levels
➢ Factors Governing High Water
➢ Methods to Determine Channel Capacity
➢ Impacts of Regulation on Water Quality
➢ Evaluation of Ecosystem Requirements
➢ Operational Implications of Future Climate Change
Zosel Dam
Osoyoos Lake

ADAPTIVE MANAGEMENT
CONSIDERATIONS IN ORDER RENEWAL:
➢ IJC strategic direction
➢ Results of the 8 supporting studies
➢ Concerns of stakeholders and public gather through
engagement at public meetings, water science
forum and other feedback
➢ Dam manger’s and Board’s experiences with 1985
Order
➢ Desire to provide dam managers with greater
operational flexibility & discretion to respond to real-
time conditions
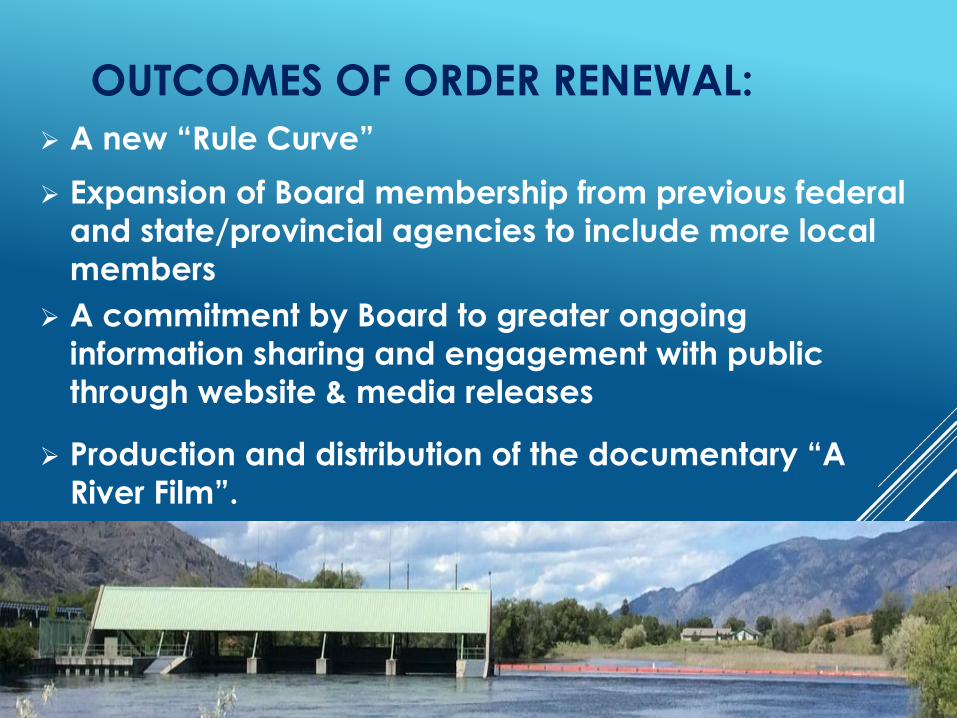
OUTCOMES OF ORDER RENEWAL:
➢ A new “Rule Curve”
➢ Expansion of Board membership from previous federal
and state/provincial agencies to include more local
members
➢ A commitment by Board to greater ongoing
information sharing and engagement with public
through website & media releases
➢ Production and distribution of the documentary “A
River Film”.

2013 IJC RULE CURVE:
Provides
manager with
greater
operation
flexibility and
discretion to
adapt operations in
response to
real-time
conditions,
including
uncertainties
associated with climate change
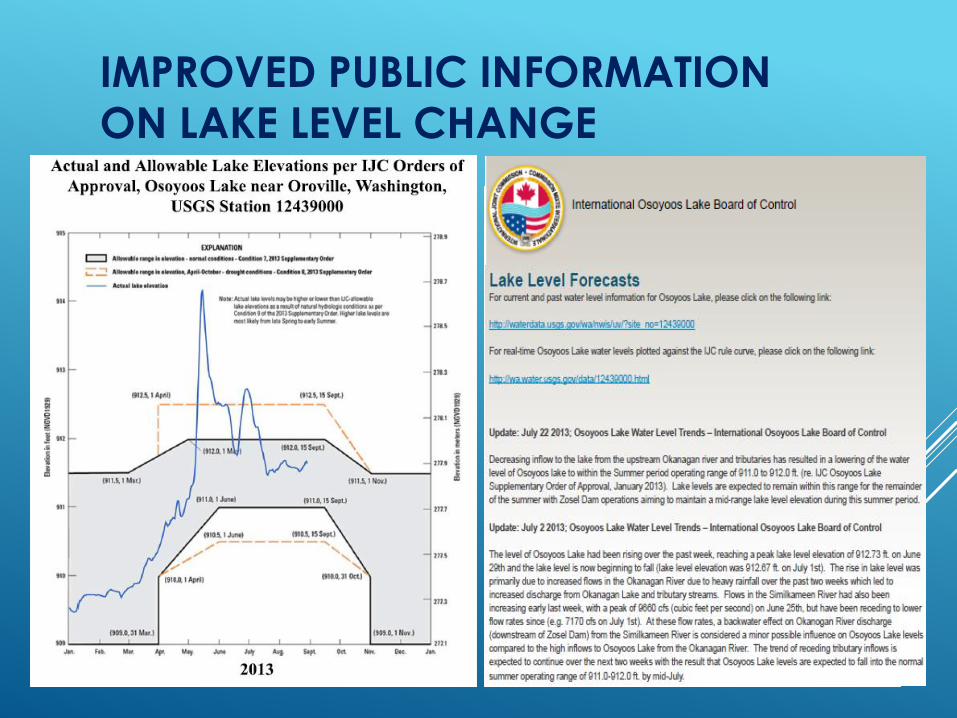
IMPROVED PUBLIC INFORMATION
ON LAKE LEVEL CHANGE

“A RIVER FILM”
Production and
distribution of
documentary to
increase public
engagement and
awareness of
transboundary water
regulation and
collaboration in the
Okanagan

SUMMARY OF KEY OKANAGAN RIVER
ADAPTIVE MANAGEMENT SUCCESSES:
➢ More effective, and collaborative use timely use of the available real-time data and the expanding scientific knowledge base
➢ A culture of experimentation and continuous learning
➢ New and strengthened organizational and funding partnerships
➢ Greater trust, transparency and
collaboration in decision making
➢ Improved “balance” of ecosystem and human system objectives
➢ Significant contributions towardsrecovery of Okanagan sockeyereturns & available instream habitat

Questions?
For more information:
➢Hyatt et al. 2003. Canadian Water
Resources Journal 28 (4): 689-713.
➢ FWMT: www.essa.com/tools/
➢ IOLBC website: ijc.org/en_/iolbc/Home
Top Related