


Languages
Pages
Legal


-The Mighty Value Pandas- Cody Foil – Lucas Kneitz
Arthur Munoz – Erblin Ribari – Ernie Stephenson
Corporate Profile • BKE is a leading retailer of medium to better–priced casual
apparel, footwear and accessories for fashion–conscious young men and women.
• The Company currently operates over 431 stores in 43 states, under the names Buckle and The Buckle.
• The Company emphasizes personalized attention to its guests (customers) and provides individual customer services such as free alterations, free gift–wrapping, layaways and a frequent shopper program.
• Buckle Screen-printing is a full–service solution offering a broad selection of promotional merchandise to outside athletic teams, organizations, clubs and individuals.

Buckle History:
• 1948 - Buckle began as a men's clothing store in Kearney, Nebraska founded by David Hirschfeld
• 1977 – The company introduced women's apparel
• 1991 - The company changed its' name in to The Buckle
• 1992 - The company went public on the NASDAQ and traded as BKLE
• 1997 - The Buckle moved to the New York Stock Exchange where it now trades under the symbol BKE
• 2011 – Reconstructed online venture

Mission Statement:
• We continually strive to achieve the goal of providing the most enjoyable shopping experience possible for our guests. In order to achieve that goal, we must provide high quality products at the best value to our guests in the most equitable manner.

BKE’s Major Product Lines
Merchandising Mix: 40% Men’s & 60% Women’s
Denims 46.6%
Tops(including sweaters) 32.1%
Accessories 8.2%
Sportswear 5.1%
Footwear 4.9%
Outerwear 2.3% Casual
bottoms 0.6%
Other 0.2%
Percentage of Net Sales FYE 1/28/12

Brands

Marketing/Advertising
• Target Market: 15-30 yr. olds
• Wide selection of Merchandise
• Value-added services
– Free hemming
– Free gift-wrapping
– Easy layaways
– Buckle credit card
– Frequent Shopper Program

Operations
• Management promoted within the company • 8600 employees, 2300 full time • Each Store:
– 1 Manager – 1 or 2 Assistant Managers – 1-3 Full-Time Salespeople – Up to 20 Part-time Salespeople
• Average store size: 5,000 sq feet • Prevention of Theft:
– Electronic Article Surveillance – Camera Surveillance (99% of stores)
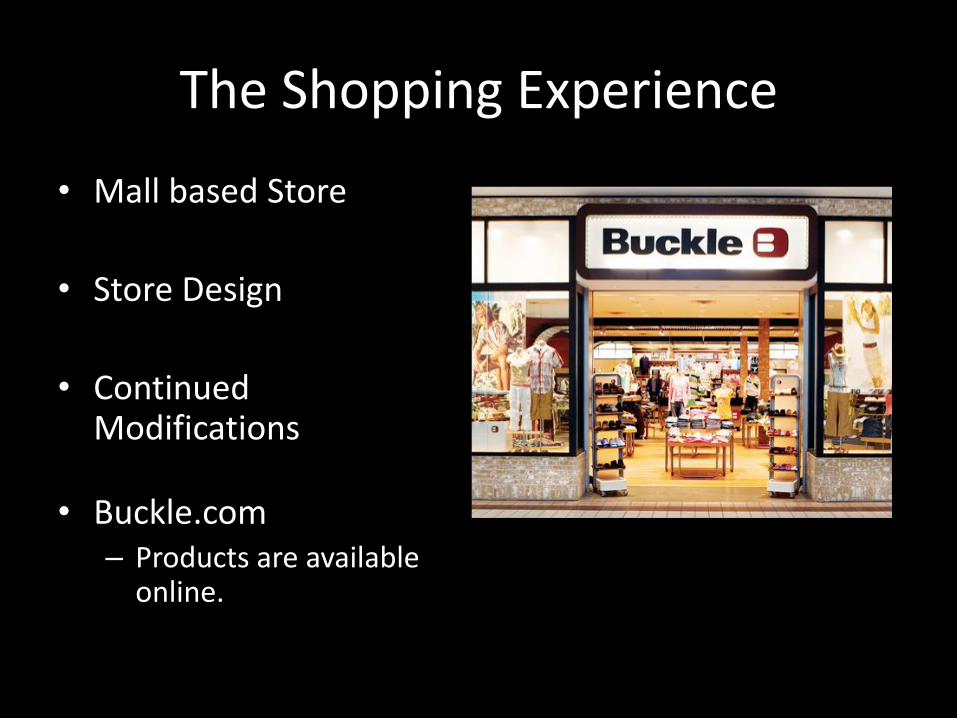
The Shopping Experience
• Mall based Store
• Store Design
• Continued Modifications
• Buckle.com – Products are available
online.

Purchasing/Distribution
• Experienced purchasing team
• No long-term contracts
• Central Distribution Center in Kearney, Nebraska- 240,000 sq. ft
• Online Fulfillment Center- 200,000 sq. ft
• Most stores receive merchandise daily
• Computerized tracking system

Store Locations
• Increased from 295 stores at the beginning of 2002

Main Competitors

What drives their profits?
• Personalized attention to its guest and provides individual costumer services (free gift wraps etc.)
• Most stores are located in upscale malls across the country.
• An online store at Buckle.com.
• Markets a wide variety of well known brands: Ed Hardy, Billabong, Guess, Affliction Clothing, Diesel, Converse.
Plans Going Forward • Providing unique, high-quality merchandise in styles, colors, and sizes that
appeal to consumers
• Effectively marketing both branded and private label merchandise to
consumers in several diverse market segments and maintaining favorable
brand recognition
• Anticipating and responding timely to changing customer demands and
preferences
• Sourcing merchandise efficiently
• Competitively pricing merchandise and creating customer perception of
value
• Monitoring increased labor costs, including increases in health care benefits
and worker’s compensation and unemployment insurance costs

0
5
10
15
20
25
2003 2004 2005 2006 2007 2008 2009 2010 2011 2012
Revenue Per Share ($)

0
0.5
1
1.5
2
2.5
3
3.5
2003 2004 2005 2006 2007 2008 2009 2010 2011 2012
EPS ($)

0
20
40
60
80
100
120
140
160
180
200
2003 2004 2005 2006 2007 2008 2009 2010 2011 2012
Free Cash Flow ($Mil)

0
0.5
1
1.5
2
2.5
3
3.5
4
2003 2004 2005 2006 2007 2008 2009 2010 2011 2012
FCF Per Share ($)

y = -0.3372x + 15.221 R² = 0.2297
0
2
4
6
8
10
12
14
16
18
2003 2004 2005 2006 2007 2008 2009 2010 2011 2012
Price-to-Free-Cash-Flow ratio

0
5
10
15
20
25
30
35
40
45
2003 2004 2005 2006 2007 2008 2009 2010 2011 2012
ROE (%)
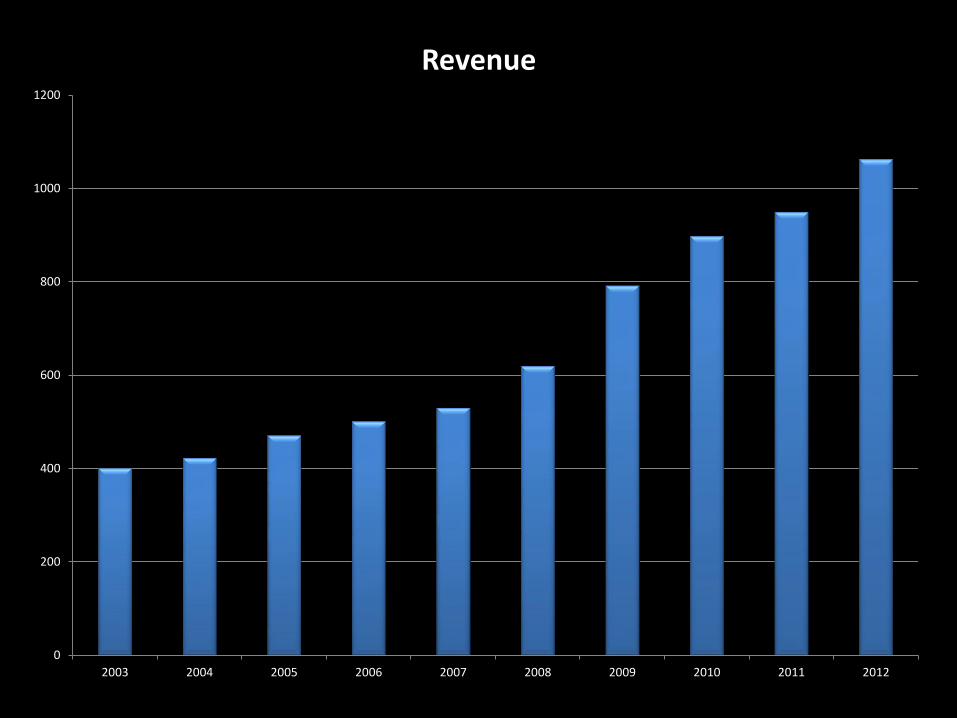
0
200
400
600
800
1000
1200
2003 2004 2005 2006 2007 2008 2009 2010 2011 2012
Revenue

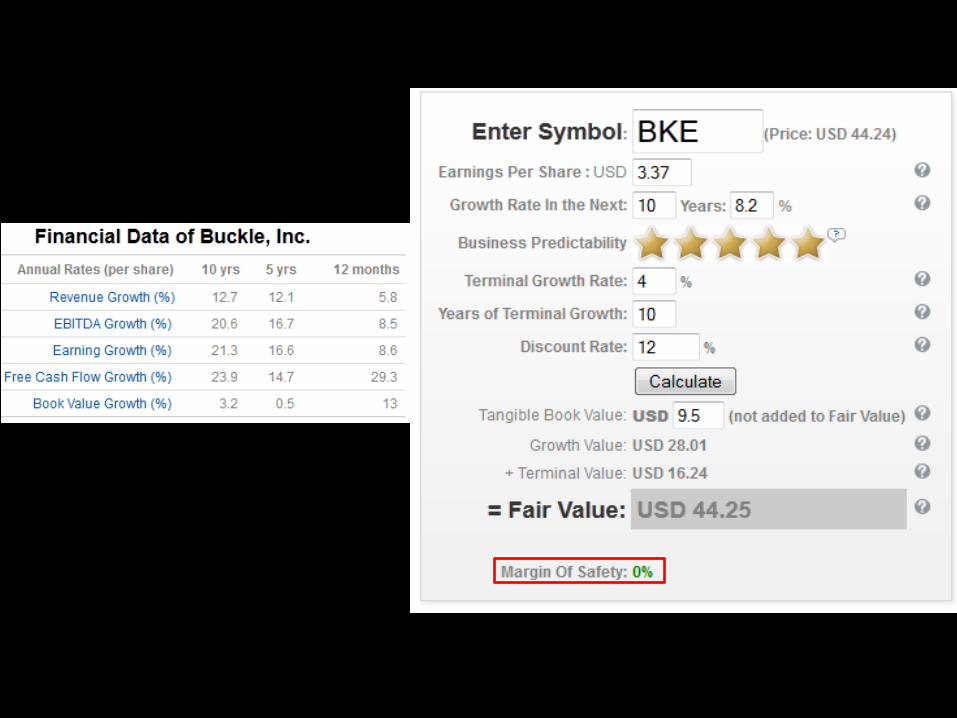
Discounted Cash Flow


Fiscal Period End 2003 2004 2005 2006 2007 2008 2009 2010 2011 2012
PE Ratio(ttm) 11.06 16.18 14.1 13.35 17.46 16.44 9.18 10.87 12.26 13.5
Price to Tangible Book 1.19 1.83 1.86 2.27 3.38 3.66 2.86 3.93 4.81 5.65 Price-to-Free-Cash-Flow ratio 16.49 14.67 11.06 13.51 16.59 13.2 10.02 12.97 13.29 11.86
PS Ratio 0.85 1.28 1.3 1.38 1.83 1.99 1.21 1.54 1.74 1.92
EV-to-Revenue 0.51 0.95 0.89 1.03 1.54 1.73 0.99 1.37 1.6 1.75
EV-to-EBITDA 3.54 6.39 5.08 5.46 8.09 7.99 4.26 5.5 6.32 6.9
EV-to-EBIT 4.5 8.32 6.6 6.76 10.36 9.76 4.83 6.19 7.22 7.85 Earnings Yield (Joel Greenblatt) 22.2 12 15.2 14.8 9.7 10.2 20.7 16.2 13.9 12.7
Forward Rate of Return 0 9.83 7.82 11.72 14.22 14.54 17.72 20.21 20.49 18.05
Shiller PE Ratio 0 15.13 15.91 17.83 23.24 24.07 15.11 17.3 17 17.59
Van Den Berg Metrics

Best Value Worst Value Average Current
PE Ratio(ttm) 9.18 17.46 13.44 13.4
Price to Tangible Book 1.19 5.65 3.144 4.77
Price-to-Free-Cash-Flow ratio 10.02 16.59 13.366 11.55
PS Ratio 0.85 1.99 1.504 1.94
EV-to-Revenue 0.51 1.75 1.236 1.72
EV-to-EBITDA 3.54 8.09 5.953 6.71
EV-to-EBIT 4.5 10.36 7.239 7.63
Earnings Yield (Joel Greenblatt) 22.2 9.7 14.76 13.1
Forward Rate of Return 20.49 7.82 13.46 16.22
Shiller PE Ratio 15.11 24.07 16.318 16.59
Van Den Berg Metrics

Buffettology

Buffettology, cont.
• No Treasury Stock on Balance Sheet • No Preferred Stock • No Defined-Benefit Pension Plan
• Free Cash Flow Yield: 8.19% • Earnings Yield: 7.12% • Return on Assets: 28.49%
(dollar amounts in thousands)

Buffettology, cont. Metric With
Special Dividend*
Without Special Dividend
Buffett’s Threshold
Meets Threshold?
Return on Equity
41.71% 32.25% >15% Yes
Return on Capital
20.13% 17.64% >15% Yes
Dividend Payout Ratio
95% 25% <60% Yes/No
Dividend Yield
6.86% 1.80%
Debt/Equity Ratio
0.46 0.36 <0.8 Yes
*In the most recent fiscal year, Buckle paid a special dividend of $2.25/share.

Conscious Investor 3-Year Default


6-Year Default


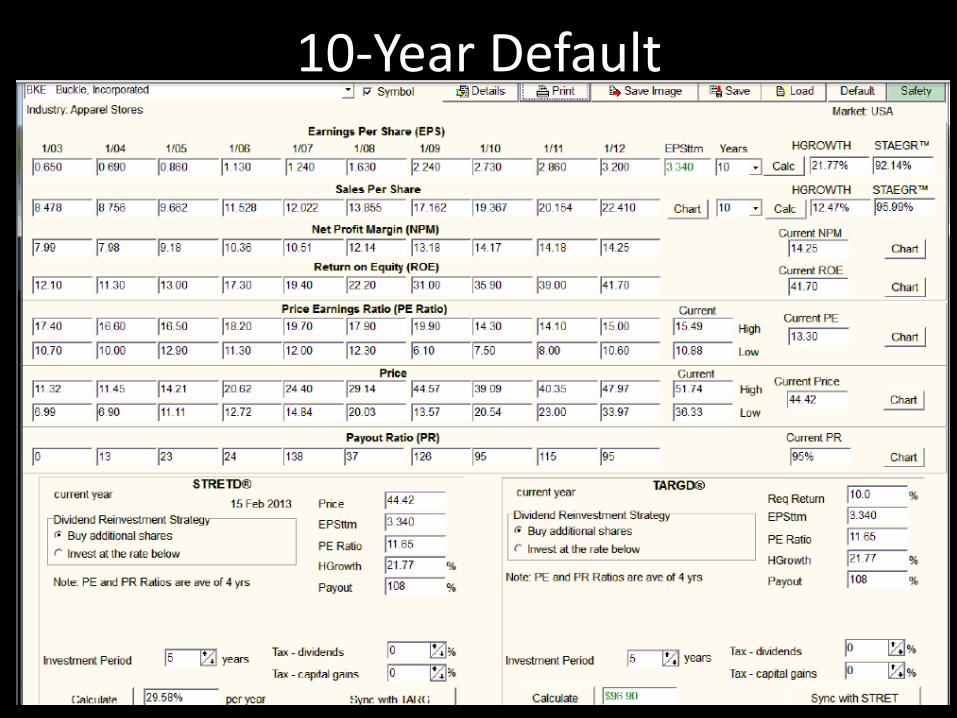
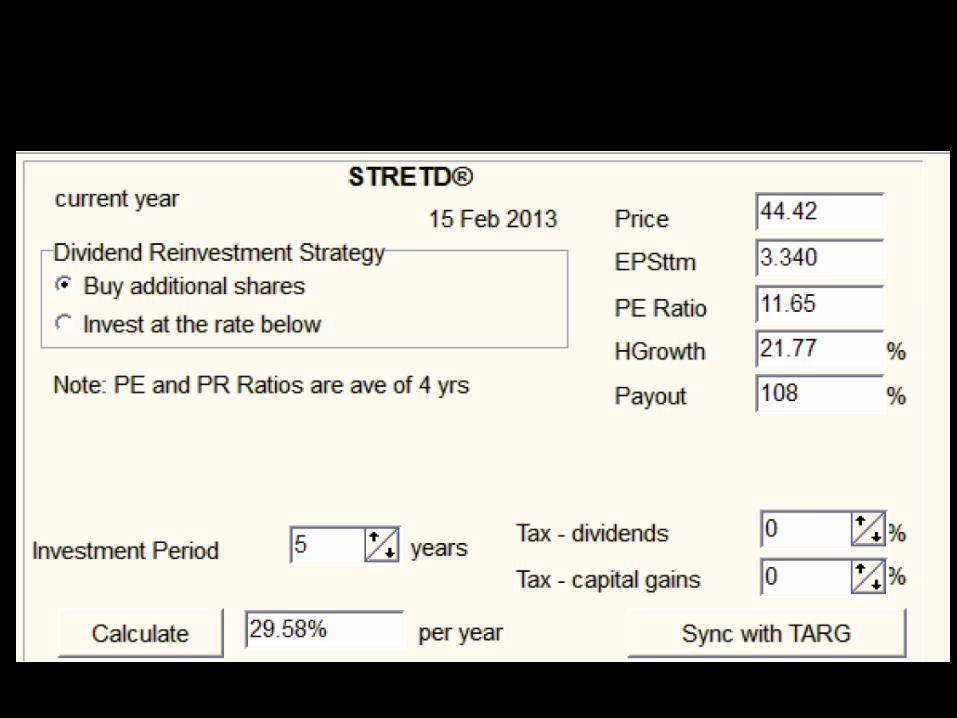
10-Year Default


Safety

Kill It

Kill It Again
Recommendation
• Limit order at $43.00
Top Related