


Languages
Pages
Legal

Int J Clin Health Psychol, Vol. 11. Nº 3
GALLEGO et al. Internet-based treatment program for fear of public speaking 473
The Maudsley Obsessive-Compulsive Inventory: Areliability generalization meta-analysis1
Julio Sánchez-Meca2, José A. López-Pina, José A. López-López,Fulgencio Marín-Martínez, Ana I. Rosa-Alcázar, and Antonia Gómez-Conesa
(Universidad de Murcia, Spain)
ABSTRACT. The Maudsley Obsessive-Compulsive Inventory (MOCI) is one of themost used tests in clinical psychology for assessing the obsessive and compulsivesymptoms in psychiatric patients and as a screening tool in nonclinical population. Areliability generalization meta-analysis was carried out with the purpose of studyinghow test scores reliability varies along different applications of this test. An exhaustivesearch of the literature enabled us to select 51 studies that reported some reliabilityestimate and, by means of the KR-21 formula, we were able to increase the databaseto 308 internal consistency reliability estimates. On average, the internal consistencyreliability of test scores was .76 for the original 30-items version. The reliabilitycoefficients exhibited a large heterogeneity. The analyses of moderator variables revealeda predictive model composed of two predictors: the standard deviation and the meanof test scores. Our results confirmed that reliability is not a property of the test itself,but it varies from one application to the next. As a consequence, the erroneous practiceof inducing reliability from previous studies should be avoided in psychological research.
KEYWORDS. MOCI. Maudsley Obsessive-Compulsive Inventory. Reliability. Coefficientalpha. Meta-analysis.
RESUMEN. El Inventario de Obsesiones y Compulsiones de Maudsley (MOCI) esuno de los tests más utilizados en psicología clínica para evaluar las obsesiones ycompulsiones en pacientes psiquiátricos y como un instrumento de cribado en pobla-
1 This article was supported by a grant of the Fondo de Investigación Sanitaria (FIS), Instituto deSalud Carlos III of the Spanish Government and by FEDER funds (Project nº PI07/90384).
2 Correspondence: Dpto. Psicología Básica y Metodología. Facultad de Psicología. Campus deEspinardo. 30100 Murcia (Spain). E-mail: [email protected]. http://www.um.es/metaanalysis.
© International Journal of Clinical and Health Psychology ISSN 1697-2600 printISSN 2174-0852 online
2011, Vol. 11, Nº 3, pp. 473-493
Int J Clin Health Psychol, Vol. 11. Nº 3
474 SÁNCHEZ-MECA et al. The Maudsley Obsessive-Compulsive Inventory
ción no clínica. Con objeto de estudiar cómo varía la fiabilidad de las puntuaciones deltest, se ha realizado un estudio de generalización de la fiabilidad. Una búsquedaexhaustiva de la literatura nos permitió seleccionar 51 estudios que reportaron algunaestimación de la fiabilidad y, mediante la fórmula KR-21, pudimos incrementar la basede datos hasta 308 estimaciones de la fiabilidad por consistencia interna. En promedio,la fiabilidad por consistencia interna de las puntuaciones fue de 0,76 para la versiónoriginal de 30 ítems. Los coeficientes de fiabilidad exhibieron una gran variabilidad. Losanálisis de variables moderadoras revelaron un modelo predictivo con dos predictores:la desviación típica y la media de las puntuaciones del test. Nuestros resultadosconfirman que la fiabilidad no es una propiedad inherente al test, sino que varía de unaaplicación a otra del mismo. En consecuencia, la práctica errónea de inducir la fiabilidada partir de estudios previos debe ser erradicada de la investigación psicológica.
PALABRAS CLAVE. MOCI. Inventario de Obsesiones y Compulsiones de Maudsley.Fiabilidad. Coeficiente alfa. Meta-análisis.
The obsessive-compulsive disorder (OCD) is one of the most common anxietydisorders, with a prevalence rate around 1-4% (Rosa-Alcázar, Sánchez-Meca, Gómez-Conesa, and Marín-Martínez, 2009). One of the psychological tests most commonly usedfor assessing the obsessive and compulsive symptoms is the Maudsley Obsessive-Compulsive Inventory (MOCI) developed by Hodgson and Rachman (1977). The MOCIis a self-report questionnaire with true-false format developed for evaluating the typeof obsessive-compulsive symptoms and discriminating obsessive patients from otherneurotic patients and from nonclinical people. The test is composed of 30 dichotomousitems, so that the total score for a subject will range between 0 (absence of symptoms)and 30 (maximum presence of symptoms). The original version has four subscales:Checking (9 items), Cleaning (11 items), Slowness (7 items), and Doubting (7 items).Note that the sum of the items for the four subscales is 34, not 30, because four itemsare included in two subscales (Hodgson and Rachman, 1977).
The MOCI can be applied to adults as well as children and adolescents. In addition,it has been applied for assessing obsessive and compulsive symptoms not only inpatients with OCD, but also for other patient populations (e.g., depressive patients), andas a screening tool for nonclinical populations (Einstein and Menzies, 2006). The MOCIis also a very sensitive instrument to therapeutic change and, as a consequence, it hasbeen applied very frequently in empirical studies evaluating the effectiveness ofpsychological and/or pharmacological treatments for patients with OCD (Thordarson etal., 2004).
Since it was developed, the MOCI has been adapted to many different languagesand cultures. So, there are versions of the MOCI adapted to the Spanish (Ávila-Espada,1986; Fonseca-Pedrero, Paíno-Piñeiro, and Lemos-Giraldez, 2007; Guilera, Gómez-Benito,Tomás, and Carrera, 2005), German (Müller et al., 1997), French (Hantouche and Guelfi,1993), Dutch (Meesters, 1997), Italian (Sanavio and Vidotto, 1985), Norwegian (Støylen,Larsen, and Kvale, 2000), Icelandic (Smári, Bjarnason, Porleifsson, Sturludóttir, andHafsteinsdóttir 1994), Turkish (Erol and Savasir, 1989), Hebrew (Zohar, LaBuda, and
Int J Clin Health Psychol, Vol. 11. Nº 3
SÁNCHEZ-MECA et al. The Maudsley Obsessive-Compulsive Inventory 475
Moschel-Ravid, 1995), Korean (Min and Won, 1999), Chinese (Chan, 1990), and Japanese(Tadai, Nakamura, Okazaki, and Nakajima, 1995).
To be useful, a psychological test must show good psychometric properties interms of reliability and validity. This research is focused on score reliability for theMOCI. From the classical test theory, reliability can be defined as the consistency ofmeasurement over the conditions of testing (Anastasi and Urbina, 1997). Such conditionsinclude time sampling (e.g., test-retest correlation), content sampling (e.g., coefficientalpha), and scorer/rater differences (e.g., intraclass correlation). Several psychometricstudies have analyzed the score reliability of the MOCI. In the original study, Hodgsonand Rachman (1977) applied the MOCI to 50 OCD and 50 neurotic patients and obtainedcoefficients alpha of .70, .80, .70, and .70 for the Checking, Cleaning, Slowness, andDoubting subscales, respectively. Regarding test-retest reliability, they obtained a valueof .80 on the sample of 50 OCD patients. Later, Rachman, and Hodgson (1980) examinedthe psychometric properties of the MOCI on a sample of 50 neurotic patients and asample of 50 nonclinical people, finding similar reliability estimates, but verifying thesuspect that the Slowness subscale did not have good properties. Other psychometricstudies have found similar results to the ones obtained by Hodgson and Rachman(1977), such as those of Sternberger and Burns (1990), Emmelkamp, Kraaijkamp, and Vanden Hout (1999), Støylen et al. (2000), and Li and Chen (2007). On the other hand, otherstudies have suggested deleting the Slowness subscale and maintaining the other three(e.g., Chan, 1990; Sanavio and Vidotto, 1985).
In Spain, the first adaptations were carried out by Ávila-Espada (1986) and Raich(1996), but the first psychometric study with Spanish population was published byGuilera et al. (2005). They applied a Spanish version of the scale to a sample of 312university students, obtaining a coefficient alpha for the total scale of .81. Guilera et al.(2005) did not report coefficients alpha for the subscales, but in a recent study Fonseca-Pedrero, Lemos-Giráldez, Paíno-Piñeiro, Villazón-García, and Muñiz (2010) applied theMOCI to a sample of 508 nonclinical children and adolescents, obtaining coefficientsalpha of .67, .42, .45, and .50 for Checking, Cleaning, Slowness, and Doubting subscales,respectively, and an alpha of .75 for the total scale.
The reliability generalization approachThe psychometric theory states that reliability is not a property of the test, but of
the test scores obtained in an application of it to a particular sample of participants(Crocker and Algina, 1986; Pedhazur and Schmelkin, 1991). This is because reliability oftest scores can change depending on the composition and characteristics of the samplesof participants and also on the application context. As reliability varies in each testadministration, researchers should report the reliability obtained for the data at hand.However, it is very common that researchers cite reliability estimates obtained in previousstudies or normative samples rather than estimating score reliability with the own data.This phenomenon, known as reliability induction (Vacha-Haase, Kogan, and Thompson,2000), does not take into account that the reliability of test scores obtained in aparticular sample is only comparable to that obtained in another sample if both have thesame composition and variability. And this correspondence is almost never checked
Int J Clin Health Psychol, Vol. 11. Nº 3
476 SÁNCHEZ-MECA et al. The Maudsley Obsessive-Compulsive Inventory
(Crocker and Algina, 1986). Unfortunately, many researchers make the mistake of inducingscore reliability from that obtained in previous studies. Some studies have analyzed thereporting practices of score reliability and have found large rates of reliability induction,even reaching percentages of 88.8%, for the Buss Durkee Hostiliy Inventory (Vassar andHale, 2009), or 94%, for the Spielberger Strait-Trait Anxiety Inventory (Barnes, Harp, andJung, 1998).
Although there are many studies that induce score reliability, with the studies thatreport reliability estimates from the data at hand, it is possible to conduct a meta-analytic reliability generalization (RG) study. Vacha-Haase (1998) coined the term«reliability generalization» to refer to this type of research. The purpose in an RG studyis to obtain an average estimate of the score reliability of the test, to determine whetherthe reliability coefficients are heterogeneous among themselves and, where appropriate,to examine which characteristics of the test, of the studies and of the participants canaccount for that heterogeneity (Henson and Thompson, 2002; Rodriguez and Maeda,2006; Sánchez-Meca and López-Pina, 2008). From the Vacha-Haase’s (1998) seminalwork, more than 80 RG studies about different psychological tests have been published.For example, RG studies have been carried out about the Beck Depression Inventory(Yin and Fan, 2000), the Eysenck Personality Inventory (Caruso, Witkievitz, Belcourt-Dittloff, and Gottlieb, 2001), the Maslach Burnout Inventory (Aguayo, Vargas, de laFuente, and Lozano, 2011), and the Hamilton Rating Scale for Depression (López-Pina,Sánchez-Meca, and Rosa-Alcázar, 2009).
Objectives of the studyThis overview of the MOCI makes clear that it is a very widely used test in clinical
populations and for screening purposes. In addition, the test has been adapted todifferent languages and cultures. It seems reasonable, then, to expect a large variabilityin the reliability estimates along different administrations of the MOCI. Therefore, thepurpose of this research was to carry out an RG meta-analysis with the aim of obtainingan estimate of the mean reliability of the test scores and to search for characteristicsof the studies and of the participants that are affecting the reliability estimates (Botellaand Gambara, 2006; Montero and León, 2007). In particular, it was expected thatcharacteristics such as the mean and the standard deviation of the test scores, the ageand the target population of the participants (clinical vs. nonclinical), and the versionof the test (original vs. adapted), would affect the score reliability. As internal consistencyis the most usual type of reliability reported in the studies, we focused on coefficientalpha as the reliability coefficient. We were also interested in estimating the mean scorereliability of the different subscales of the MOCI and in examining whether they have,in general, a good score reliability taking .7 as the criterion (Nunnally and Bernstein,1994).
One of the most serious problems when carrying out RG studies is the failure ofresearchers to report reliability estimates from their own data. When the measurementinstrument is composed of a set of dichotomous items, however, it is possible to obtainan estimate of the coefficient alpha by the KR-21 formula if the study reports the numberof items in the test, the total score mean, and the total score standard deviation (Crockerand Algina, 1986).
Int J Clin Health Psychol, Vol. 11. Nº 3
SÁNCHEZ-MECA et al. The Maudsley Obsessive-Compulsive Inventory 477
When the items vary in difficulty, KR-21 will underestimate the true coefficientalpha, but the underestimation will be less than 0.03 for coefficients alpha greater than.60 (Hopkins, 1998). Several authors have proposed increasing the number of coefficientsalpha in RG studies by estimating them through KR-21 when the study fails to reportreliability (Henson, Kogan, and Vacha-Haase, 2001; Kieffer and Reese, 2002; Lane,White, and Henson, 2002). At the same time, studies that report coefficient alpha anddescriptive statistics for the total test score will make it possible to examine the magnitudeof the underestimation produced by KR-21, as well as the relationship between KR-21and coefficient alpha. Thus, in their RG study on the Coopersmith Self-Esteem Inventory,Lane et al. (2002) found a mean underestimation of KR-21 equal to .02 and a correlationof .90 between KR-21 and coefficient alpha.
MethodLocating studies
An RG study requires selecting the studies that have applied the test and thatreport a reliability estimate from the data at hand. To be included, studies were requiredto meet four criteria: a) studies which had applied the MOCI to a sample of participants,b) they had to report a coefficient alpha computed from their own sample data, c) theyhad to be carried out or published between 1977 and 2008, and d) due to idiomlimitations, they had to be written in English, French, Spanish or Portuguese.
To locate the studies, the following electronic databases were consulted: PsycInfo,MedLine, ERIC, and the Scholar Google search engine, by combining «Maudsley ANDObsessiv*» as keywords. In addition, references from 26 meta-analytic reviews aboutOCD, specialized journals, books and monographs, as well as references from thealready retrieved studies, were also consulted. Finally, expert researchers in this topicwere contacted in order to locate unpublished studies (or hardly recoverable ones)which could have applied the MOCI.
This search process entailed consulting more than 3,500 references, which allowedus to identify 327 studies which had applied the MOCI. Only 51 studies (15.6%) reporteda reliability estimate from the data at hand and, as a consequence, did not inducereliability from previous studies. The remaining 276 studies (84.4%) induced reliability.Two kinds of reliability induction can be distinguished (Shields and Caruso, 2004):reliability induction by omission consists in not making any reference to the test scoresreliability, whereas reliability induction by report occurs when the study reports somereliability estimate from previous studies. In our RG meta-analysis, the number of studiesthat induced reliability by omission and by report was 201 (61.5%) and 75 (22.9%),respectively. The 51 studies that did not induce reliability were the target populationin our RG study. With the exception of two studies that were written in Spanish, the49 remaining studies were written in English. The continent most represented in thisdatabase was Europe with 28 studies (54.9%), followed by North America with 14studies (27.4%), Asia with 5 studies (9.8%), and Oceania with 4 Australian studies(7.8%).
Int J Clin Health Psychol, Vol. 11. Nº 3
478 SÁNCHEZ-MECA et al. The Maudsley Obsessive-Compulsive Inventory
Coding study characteristicsIn order to explore how study characteristics can affect the measurement error when
the MOCI is applied, the following moderator variables were coded in the studies: a)standard deviation of the test scores (for total scale and subscales); b) mean of the testscores (for total scale and subscales); c) test version (original vs. other); d) test length(30 items, 37 items, other); e) mean age of participants (in years); f) standard deviationof the age of participants (in years); g) gender distribution in the sample (% male); h)sample ethnicity (% Caucasian); i) target population of the sample (nonclinical, Universitystudents, clinical, and subclinical); j) disorder of the participants (OCD, eating disorders,and other); k) mean of disorder history (in years); l) standard deviation of disorderhistory (in years); m) study focus (psychometric vs. substantive); n) focus of thepsychometric studies (the MOCI vs. other tests); o) publication year of the study; p)researcher affiliation (psychology vs. psychiatry), and q) sample size. Together withthese moderator variables, coefficients alpha and test-retest correlations were obtainedfor the total scale and for the subscales when they were reported in the studies.
The reliability of the coding process of the study characteristics was checked byselecting a random sample of 20% of the studies that had applied the MOCI. Thissample of studies was double-coded by two independent coding teams. In general, theintercoder agreement was satisfactory, with kappa coefficients ranging between .73 and.98 for the qualitative characteristics, and intraclass correlations ranging between .75and .96 for the continuous variables.
Statistical analysesSeparate meta-analyses were carried out for coefficients alpha and test-retest
correlations, as they are two different types of reliability. In order to increase thedatabase of internal consistency coefficients, the KR-21 formula was applied to thosestudies that did not report a coefficient alpha but reported the number of items (J) andthe mean ( X ) and standard deviation (Sx) of the test scores for the total scale. Thus,it was possible to estimate coefficient alpha by applying the formula:
21
121
xJS
XJX
J
JKR . (1)
The statistical analyses with coefficients alpha and KR-21 estimates were carriedout after transforming these coefficients by means of the Bonett’s (2002) formula:T = Ln(1-/ ˆ /) Ln being the natural logarithm, T being the transformed coefficient andˆ being the coefficient alpha or its estimation by KR-21 formula. To facilitate interpretationof results, the average T values and their confidence limits were back-transformed topresent the results in the original metric of reliability coefficients, by means of thetransformation formula: ˆ = 1 - eT. Test-retest correlations were transformed by Fisher’sZ. Using a transformation formula of the reliability coefficients allows to normalize itsdistribution and to stabilize their variances (Botella, Suero, and Gambara, 2010; Rodriguezand Maeda, 2006). To obtain summary statistics of reliability coefficients, a random-
Int J Clin Health Psychol, Vol. 11. Nº 3
SÁNCHEZ-MECA et al. The Maudsley Obsessive-Compulsive Inventory 479
effects model was assumed and, as a consequence, the reliability coefficients wereweighted by the inverse variance. The heterogeneity exhibited by the reliability estimateswas assessed by the Q test and the I2 index. Finally, the influence of moderator variableswas examined by applying regression analyses for the continuous variables and analysesof variance (ANOVAs) for the qualitative ones from a mixed-effects model (Borenstein,Hedges, Higgins, and Rothstein, 2009; Sánchez-Meca and Marín-Martínez, 2008).
ResultsFirst, summary statistics for reliability estimates (coefficients alpha and test-retest
correlations) will be presented. Next, an analysis of the equivalence of KR-21 formulaas an estimator of coefficient alpha is presented. This section will finish with a descriptionof the analyses of moderator variables and the proposal of a predictive model.
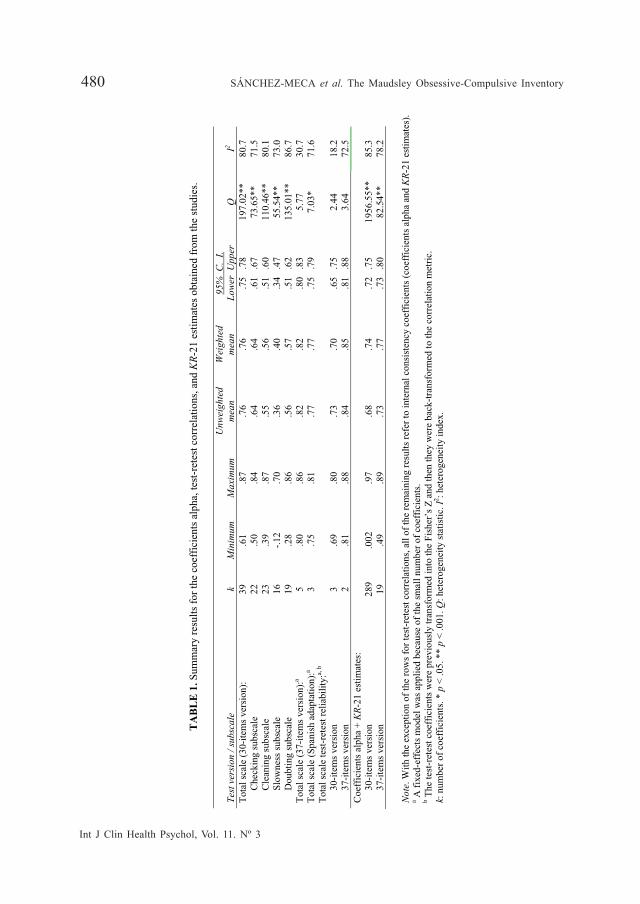
Estimating the mean reliabilityA total of 51 studies reported a reliability estimate with the data at hand. Out of
the 51 studies, 39 of them reported a coefficient alpha for the total scale in its original30-items version, whereas 5 studies reported coefficients alpha from the 37-items (Turkish)version. In addition, five studies reported a test-retest correlation, three of them for the30-items version and the other two for the 37-items version. The results are presentedseparately for both test lengths. Table 1 shows the main summary statistics for coefficientsalpha and test-retest reliability coefficients. The 30-items version presented a (weighted)mean coefficient alpha of .76 (confidence limits: .75 and .78), clearly over the cut offvalue of .70 to be considered an acceptable reliability (Nunnally and Bernstein, 1994).The Turkish version, with 37 items, was even better, reaching an average coefficientalpha of .82, although based on five studies only. Table 1 also shows the results forthe three Spanish studies that reported a coefficient alpha, with a mean of .77 (confidencelimits: .75 and .79).
Int J Clin Health Psychol, Vol. 11. Nº 3
480 SÁNCHEZ-MECA et al. The Maudsley Obsessive-Compulsive Inventory
TA
BL
E 1
. Sum
mar
y re
sults
for
the
coef
fici
ents
alp
ha, t
est-
rete
st c
orre
latio
ns, a
nd K
R-2
1 es
timat
es o
btai
ned
from
the
stud
ies.
Te
st v
ersi
on /
subs
cale
k
M
inim
um
M
axim
um
Unw
eigh
ted
mea
n W
eigh
ted
mea
n 95
% C
. I.
Lo
wer
Upp
er
Q
I2
Tot
al s
cale
(30
-ite
ms
vers
ion)
:
Che
ckin
g su
bsca
le
C
lean
ing
subs
cale
Slo
wne
ss s
ubsc
ale
D
oubt
ing
subs
cale
39
22
23
16
19
.61
.50
.39
-.12
.2
8
.87
.84
.87
.70
.86
.76
.64
.55
.36
.56
.76
.64
.56
.40
.57
.75
.78
.6
1 .
67
.51
.60
.3
4 .
47
.51
.62
197.
02**
73
.65*
* 11
0.46
**
55.5
4**
135.
01**
80.7
71
.5
80.1
73
.0
86.7
T
otal
sca
le (
37-i
tem
s ve
rsio
n):a
5 .8
0 .8
6 .8
2 .8
2 .8
0 .
83
5.77
30
.7
Tot
al s
cale
(Sp
anis
h ad
apta
tion)
:a 3
.75
.81
.77
.77
.75
.79
7.
03*
71.6
T
otal
sca
le te
st-r
etes
t rel
iabi
lity:
a, b
3
0-ite
ms
vers
ion
3
7-ite
ms
vers
ion
3 2
.6
9 .8
1
.8
0 .8
8
.7
3 .8
4
.7
0 .8
5
.6
5 .
75
.81
.88
2.
44
3.64
18
.2
72.5
C
oeff
icie
nts
alph
a +
KR
-21
estim
ates
:
30-
item
s ve
rsio
n
37-
item
s ve
rsio
n
28
9 19
.0
02
.49
.9
7 .8
9
.6
8 .7
3
.7
4 .7
7
.7
2 .
75
.73
.80
19
56.5
5**
82.5
4**
85
.3
78.2
N
ote.
With
the
exce
ptio
n of
the
row
s fo
r te
st-r
etes
t cor
rela
tions
, all
of th
e re
mai
ning
res
ults
ref
er to
inte
rnal
con
sist
ency
coe
ffic
ient
s (c
oeff
icie
nts
alph
a an
d K
R-2
1 es
timat
es).
a A
fix
ed-e
ffec
ts m
odel
was
app
lied
beca
use
of th
e sm
all n
umbe
r of
coe
ffic
ient
s.
b The
test
-ret
est c
oeff
icie
nts
wer
e pr
evio
usly
tran
sfor
med
into
the
Fish
er’s
Z a
nd th
en th
ey w
ere
back
-tra
nsfo
rmed
to th
e co
rrel
atio
n m
etri
c.
k: n
umbe
r of
coe
ffic
ient
s. *
p <
.05.
**
p <
.001
. Q: h
eter
ogen
eity
sta
tistic
. I2 : h
eter
ogen
eity
inde
x.
Int J Clin Health Psychol, Vol. 11. Nº 3
SÁNCHEZ-MECA et al. The Maudsley Obsessive-Compulsive Inventory 481
Some studies reported coefficients alpha separately for the four subscales of theMOCI, obtaining mean reliability estimates of .64 for the Checking subscale, .56 for theCleaning subscale, .40 for the Slowness subscale, and .57 for the Doubting subscale.The four subscales exhibited a mean internal consistency clearly under the cut off of.70. Further, their confidence limits did not include that cut off value. Out of the foursubscales, and in agreement with previous results, the Slowness subscale exhibited thepoorest internal consistency.
With regards to test-retest reliability, the three studies that reported reliabilityestimates for the 30-items original version achieved a mean reliability of .70, whereas thetwo Turkish studies (37-items version) obtained a larger mean reliability of .85.
KR-21 estimatesAs the MOCI is composed of dichotomous items, the KR-21 formula was applied
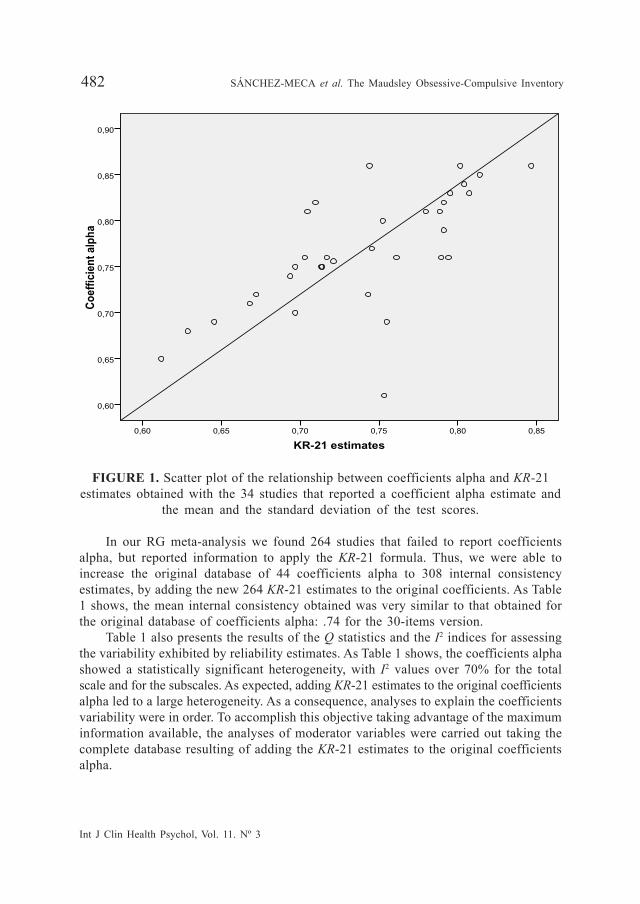
to estimate the coefficient alpha when the study failed to report an internal consistencyestimate but reported the number of items of the scale and the mean and the standarddeviation of test scores. In order to examine the adequacy of using KR-21 formula asan estimate of coefficient alpha, we selected the 34 studies that reported a coefficientalpha with the data at hand in addition to the number of items, the mean and thestandard deviation of test scores. With equation 1) we calculated the KR-21 estimate,obtaining a mean of .74. Comparing this mean with that obtained with the 34 coefficientsalpha, .76, the underestimation of KR-21 formula was of .02 only, a very similar differenceto that obtained by Henson and Thompson´s (2002) RG study, and also in agreementwith the maximum .03 underestimation stated by Hopkins (1998). Although theunderestimation can be considered negligible, we found statistically significant differencesbetween the mean coefficient alpha and the mean KR-21 [T (33) = 3.29, p = .002].However, the Pearson correlation coefficient between coefficients alpha and KR-21estimates was of large magnitude and statistically significant (r = .68, p < .001). Figure1 presents a scatter plot of the relationship between coefficients alpha and KR-21estimates. Thus, KR-21 estimates and coefficients alpha share an important amount ofvariability and, as a consequence, KR-21 is a useful formula to estimate coefficient alphain RG studies when the empirical studies fail to report an internal consistency coefficientwith the data at hand.
Int J Clin Health Psychol, Vol. 11. Nº 3
482 SÁNCHEZ-MECA et al. The Maudsley Obsessive-Compulsive Inventory
FIGURE 1. Scatter plot of the relationship between coefficients alpha and KR-21estimates obtained with the 34 studies that reported a coefficient alpha estimate and
the mean and the standard deviation of the test scores.
In our RG meta-analysis we found 264 studies that failed to report coefficientsalpha, but reported information to apply the KR-21 formula. Thus, we were able toincrease the original database of 44 coefficients alpha to 308 internal consistencyestimates, by adding the new 264 KR-21 estimates to the original coefficients. As Table1 shows, the mean internal consistency obtained was very similar to that obtained forthe original database of coefficients alpha: .74 for the 30-items version.
Table 1 also presents the results of the Q statistics and the I2 indices for assessingthe variability exhibited by reliability estimates. As Table 1 shows, the coefficients alphashowed a statistically significant heterogeneity, with I2 values over 70% for the totalscale and for the subscales. As expected, adding KR-21 estimates to the original coefficientsalpha led to a large heterogeneity. As a consequence, analyses to explain the coefficientsvariability were in order. To accomplish this objective taking advantage of the maximuminformation available, the analyses of moderator variables were carried out taking thecomplete database resulting of adding the KR-21 estimates to the original coefficientsalpha.
KR-21 estimates0,850,800,750,700,650,60
Coe
ffici
ent a
lpha
0,90
0,85
0,80
0,75
0,70
0,65
0,60
Int J Clin Health Psychol, Vol. 11. Nº 3
SÁNCHEZ-MECA et al. The Maudsley Obsessive-Compulsive Inventory 483
Searching for moderator variablesTo explore the study and sample characteristics related to reliability, we used the
289 coefficients alpha and KR-21 estimates obtained from the studies that applied the30-items version of the MOCI. This composite of reliability estimates was the dependentvariable, whereas the moderator variables previously coded were the predictors thatcould explain the variability exhibited by the reliability coefficients. To examine theinfluence of continuous moderator variables, simple regression analyses were carriedout, whereas for exploring the influence of qualitative moderators, ANOVAs wereaccomplished. In all cases, mixed-effects models were assumed taking as the dependentvariable the Bonett’s (2002) transformation applied to the internal consistency estimates.
Int J Clin Health Psychol, Vol. 11. Nº 3
484 SÁNCHEZ-MECA et al. The Maudsley Obsessive-Compulsive Inventory
TA
BL
E 2
. Wei
ghte
d si
mpl
e re
gres
sion
ana
lyse
s of
the
cont
inuo
us m
oder
ator
var
iabl
es o
n th
e in
tern
al c
onsi
sten
cy r
elia
bilit
y es
timat
es (
coef
fici
ents
alp
ha +
K
R-2
1 es
timat
es).
Mod
erat
or v
aria
ble
k M
in.
Max
. M
ean
Med
ian
b j
Z p
QE
R2
SD o
f te
st s
core
s M
ean
of te
st s
core
s M
ean
age
(in
year
s)
SD o
f th
e ag
e (i
n ye
ars)
G
ende
r (%
mal
e)
Eth
nici
ty (
% C
auca
sian
) M
ean
of d
isor
der
hist
ory
(in
year
s)
SD o
f di
sord
er h
isto
ry (
in y
ears
) Pu
blic
atio
n ye
ar
280
280
267
220
262
28
79
61
289
1.55
2.
30
14.4
5 .5
1 .0
0 .0
0 1.
08
.78
1977
10.3
3 28
.55
63.9
0 19
.20
100.
00
100.
00
26.2
6 18
.35
2009
4.60
10
.30
31.2
3 8.
36
35.4
1 63
.04
11.6
2 7.
54
1999
4.60
9.
05
32.0
0 9.
19
38.0
0 80
.50
10.9
5 7.
53
2000
-.35
-.
01
.01
.01
.00
-.00
.0
0 .0
1 -.
00
-33.
52
-2.2
5 3.
67
1.50
.9
8 -2
.49
.59
.71
-.63
< .0
01
.025
<
.001
.1
32
.327
.0
13
.552
.4
77
.528
364.
91**
18
92.0
3**
1651
.04*
* 15
19.1
8**
1742
.34*
* 21
1.74
**
390.
53**
24
7.02
**
1934
.55*
*
.946
.0
02
.028
.0
06
.0
.024
.0
.0
19
.0
Not
es. k
: num
ber
of c
oeff
icie
nts.
Min
. and
Max
.: m
inim
um a
nd m
axim
um v
alue
s, r
espe
ctiv
ely.
bj:
unst
anda
rdiz
ed r
egre
ssio
n co
effi
cien
t for
the
mod
erat
or v
aria
ble.
Z:
stat
istic
al te
st f
or te
stin
g th
e st
atis
tical
sig
nifi
canc
e of
the
mod
erat
or v
aria
ble.
QE: s
tatis
tic f
or te
stin
g th
e m
odel
spe
cifi
catio
n.. R
2 : pro
port
ion
of v
aria
nce
acco
unte
d fo
r by
the
mod
erat
or v
aria
ble.
**
p <
.001
.
Int J Clin Health Psychol, Vol. 11. Nº 3
SÁNCHEZ-MECA et al. The Maudsley Obsessive-Compulsive Inventory 485
TA
BL
E 3
. Wei
ghte
d A
NO
VA
s of
the
qual
itativ
e m
oder
ator
var
iabl
es o
n in
tern
al c
onsi
sten
cy r
elia
bilit
y es
timat
es (
coef
fici
ents
alp
ha +
KR
-21
estim
ates
).
Mod
erat
or v
aria
ble
k W
eigh
ted
mea
n 95
% C
. I.
Lo
wer
Upp
er
Q
wj
Q
B
p R2
Tes
t ver
sion
:
Ori
gina
l
Oth
er
16
2 12
7
.7
5 .7
2
.7
3 .
76
.70
.74
10
82.6
8**
807.
25**
5.13
.0
23
.023
Stud
y fo
cus:
Psy
chom
etri
c
Sub
stan
tive
51
238
.7
5 .7
3
.7
3 .
78
.72
.74
19
5.68
**
1758
.00*
*
2.06
.1
51
.0
Psyc
hom
etri
c fo
cus:
MO
CI
O
ther
17
34
.7
2 .7
7
.6
9 .
75
.75
.79
90
.94*
* 92
.06*
*
9.12
.0
02
.022
Tar
get p
opul
atio
n:
N
on c
linic
al
U
nive
rsity
stu
dent
s
Clin
ical
Sub
clin
ical
65
56
155
12
.6
8 .7
7 .7
5 .6
8
.6
5 .
71
.74
.79
.7
3 .
76
.59
.75
26
1.52
**
753.
39**
82
5.39
**
53.3
6**
24.6
7 <
.001
.0
01
Dis
orde
r:
O
CD
Eat
ing
diso
rder
s
Oth
er
98
29
41
.7
3 .8
0 .7
1
.7
0 .
76
.76
.83
.6
7 .
75
40
1.94
**
171.
06**
21
4.29
**
9.20
.0
10
.099
Res
earc
her
affi
liatio
n:
P
sych
olog
y
Psy
chia
try
16
4 96
.7
4 .7
3
.7
32
.76
.709
.7
5
12
74.1
5**
519.
60**
1.27
.2
59
.0
Not
es. k
: num
ber
of c
oeff
icie
nts.
Qw
j: w
ithin
-cat
egor
y st
atis
tic f
or te
stin
g th
e m
odel
spe
cifi
catio
n. Q
B: b
etw
een-
cate
gori
es s
tatis
tic f
or te
stin
g th
e st
atis
tical
sig
nifi
canc
e of
the
mod
erat
or v
aria
ble.
R2 : p
ropo
rtio
n of
var
ianc
e ac
coun
ted
for
by th
e m
oder
ator
var
iabl
e. *
* p
< .0
0
Int J Clin Health Psychol, Vol. 11. Nº 3
486 SÁNCHEZ-MECA et al. The Maudsley Obsessive-Compulsive Inventory
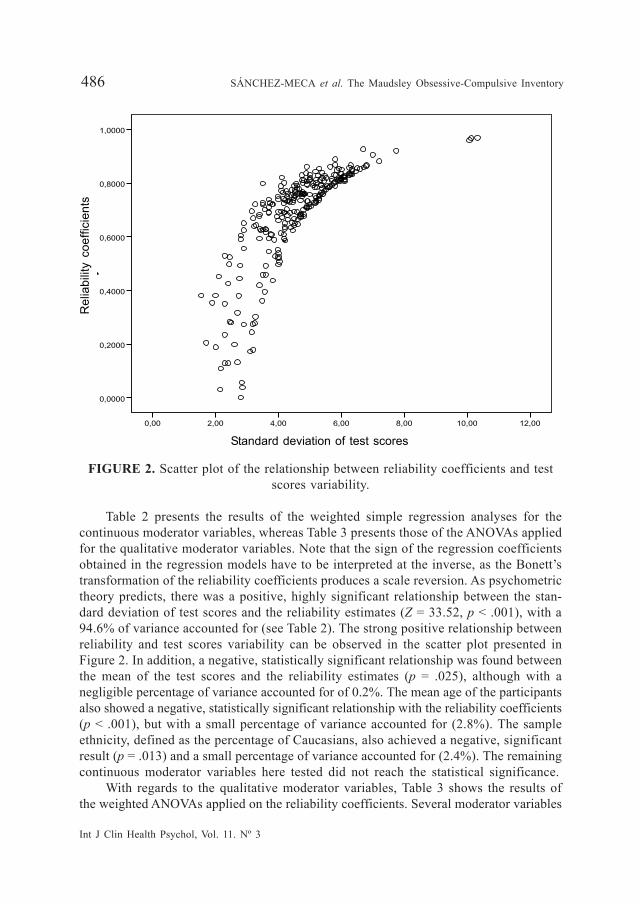
FIGURE 2. Scatter plot of the relationship between reliability coefficients and testscores variability.
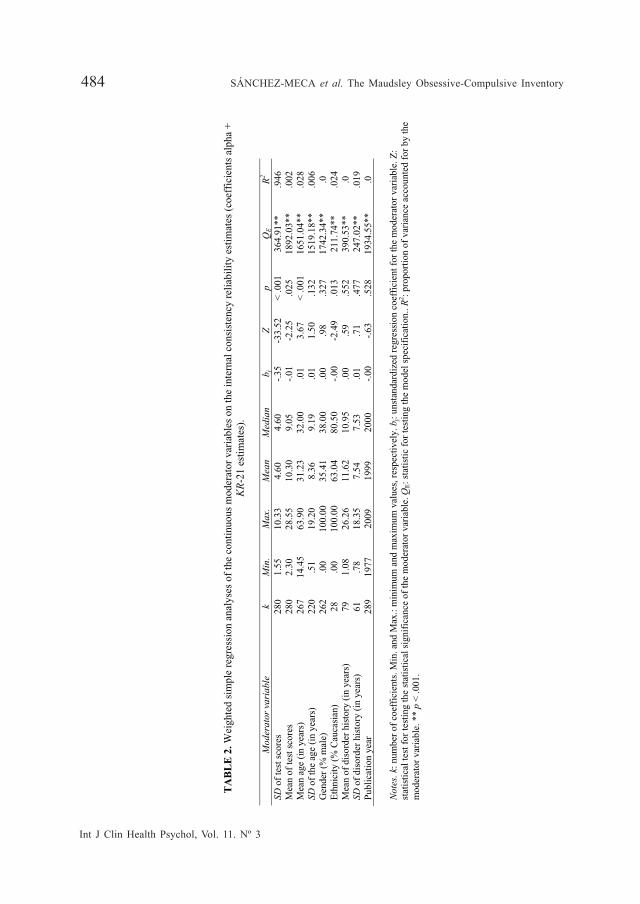
Table 2 presents the results of the weighted simple regression analyses for thecontinuous moderator variables, whereas Table 3 presents those of the ANOVAs appliedfor the qualitative moderator variables. Note that the sign of the regression coefficientsobtained in the regression models have to be interpreted at the inverse, as the Bonett’stransformation of the reliability coefficients produces a scale reversion. As psychometrictheory predicts, there was a positive, highly significant relationship between the stan-dard deviation of test scores and the reliability estimates (Z = 33.52, p < .001), with a94.6% of variance accounted for (see Table 2). The strong positive relationship betweenreliability and test scores variability can be observed in the scatter plot presented inFigure 2. In addition, a negative, statistically significant relationship was found betweenthe mean of the test scores and the reliability estimates (p = .025), although with anegligible percentage of variance accounted for of 0.2%. The mean age of the participantsalso showed a negative, statistically significant relationship with the reliability coefficients(p < .001), but with a small percentage of variance accounted for (2.8%). The sampleethnicity, defined as the percentage of Caucasians, also achieved a negative, significantresult (p = .013) and a small percentage of variance accounted for (2.4%). The remainingcontinuous moderator variables here tested did not reach the statistical significance.
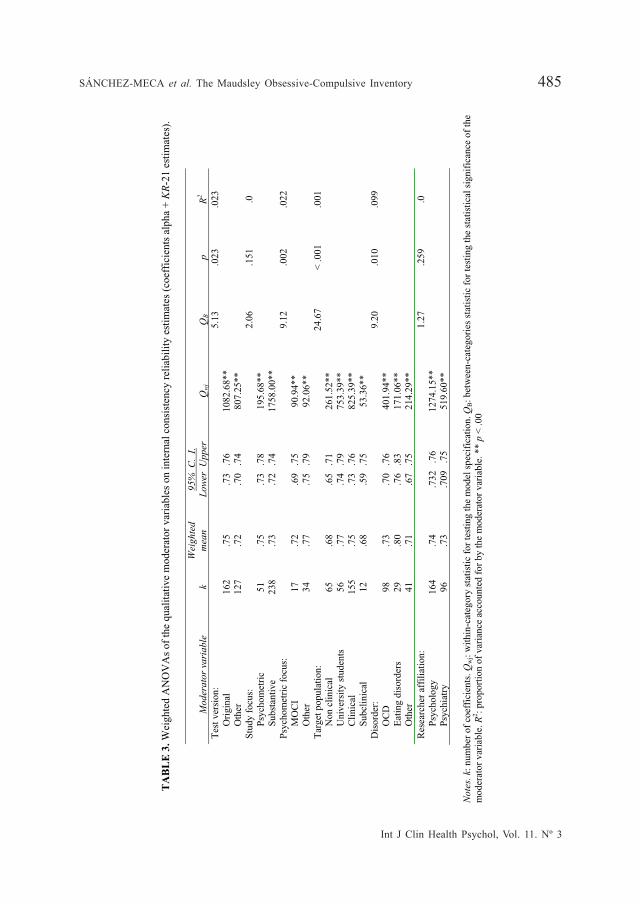
With regards to the qualitative moderator variables, Table 3 shows the results ofthe weighted ANOVAs applied on the reliability coefficients. Several moderator variables
12,0010,008,006,004,002,000,00
y
1,0000
0,8000
0,6000
0,4000
0,2000
0,0000
Standard deviation of test scores
Rel
iabi
lity
coef
ficie
nts
Int J Clin Health Psychol, Vol. 11. Nº 3
SÁNCHEZ-MECA et al. The Maudsley Obsessive-Compulsive Inventory 487
reached the statistical significance, but with very small proportions of variance accountedfor (all of them under .10). This was the case for the test version (p = .023), whichshowed a better mean reliability coefficient for the original test than for adaptations ofthe test to other languages and/or cultures. The target population also reached astatistically significant result (p < .001), with better reliability estimates when participantswere University students or psychiatric patients, and with lower reliability values fornonclinical or subclinical participants. Moreover, when the studies composed of psychiatricpatients were classified as a function of the disorder type, there were also foundsignificant differences between OCD patients (mean reliability = .73), patients witheating disorders (mean = .80), and other psychiatric disorders (mean = .71). Some of thestudies were focused on examining the psychometric properties of different tests. Whenthese studies were classified into studies about the MOCI versus other tests, a statisticallysignificant difference was found between the two mean reliability coefficients, with ahigher mean for studies focused on other tests (mean = .77) than that for those focusedon the MOCI (mean = .72). Finally, as Table 3 shows, there were no statisticallysignificant differences when the studies were classified as a function of their focus(psychometric versus substantive) or by the main researcher affiliation (psychologyversus psychiatry).
Although some of the moderator variables here analyzed showed a statisticallysignificant association with reliability estimates, anyone of them achieved a nonsignificantresult for the model misspecification test. Therefore, proposing a model containing theset of most relevant predictors of reliability was in order.
An explanatory modelWith the purpose of finding a predictive model able to explain, at least, part of the
variability in the reliability estimates, a weighted multiple regression analysis was appliedassuming a mixed-effects model. Selection of predictors was based on both statisticaland substantive criteria. Thus, we included in the model the following predictors: thestandard deviation and the mean of test scores, the test version (0, original; 1, other),the mean age of the participants (in years), and the target population. Although froma conceptual point of view the predictive model was composed of five predictors,actually the model included seven independent variables, as the target populationentered in the model as three dichotomous predictors enabling us to code, by applyinga dummy coding system (0, absent; 1, present), the membership of the studies tononclinical population, University students, and clinical population.
Int J Clin Health Psychol, Vol. 11. Nº 3
488 SÁNCHEZ-MECA et al. The Maudsley Obsessive-Compulsive Inventory
TABLE 4. Results of the weighted multiple regression analysis on the internalconsistency reliability estimates (coefficients alpha + KR-21 estimates).
Moderator variable bj Zj p SD of test scores Mean of test scores Test version Mean age (in years) Target population – Non clinical Target population – University Target population - Clinical
-.395 .045 -.036 -.001 -.022 -.041 -.053
-35.10 12.91 -1.64 -.73 -.31 -.60 -.75
< .001 < .001 .101 .464 .754 .551 .453
Results of the multiple regression model:
QR(7) = 1341.08, p < .001; R2 = .979 QE(272) = 306.66, p = .073
Notes. bj: partial unstandardized regression coefficients. Zj: statistic test for testing the significanceof each moderator variable once partialized out the influence of the other moderator variables inthe model. p: probability level associated to Zj. QR: statistic for testing the significance of the fullregression model. QE: statistic for testing the model misspecification. R2: proportion of varianceaccounted for by the full model.
Table 4 presents the results of the weighted multiple regression model. The fullmodel reached a highly statistically significant result (p < .001) with a percentage ofvariance accounted for of 97.9%. Moreover, the model misspecification test was notstatistically significant (p = .073). Although the model reached a large predictive power,the standard deviation and the mean of test scores were the only predictors thatachieved a statistically significant contribution to the predictive model, the remainingpredictors being unable to offer nothing relevant to the model. A result that deservesspecial attention is the absence of statistical significance for the target population. AsTable 3 showed, this moderator variable presented statistically significant differencesamong the mean reliability estimates for the different target populations. However, thetarget population did not reach a statistically significant contribution to the predictivemodel. The reason of this result is the strong relationship between the target populationand the mean of test scores. In particular, when the studies were classified as a functionof the target population, the means obtained for the mean of test scores were 5.96 innonclinical samples, 7.01 with University students, 11.40 for subclinical samples, and13.11 for clinical samples. In fact, following the Botella et al.’s (2010) approach, a mixed-effects meta-analysis was carried out by taking the mean of test scores as the dependentvariable and the target population as the independent variable. The results showed astatistically significant association between the mean of test scores and the targetpopulation [QB (3) = 295.37, p < .001; R2 = .29]. Therefore, the reason for not finding astatistical contribution of the target population to the reliability estimates variability wasthe existence of a strong collinearity between the target population and the mean of testscores.
As only the standard deviation and the mean of test scores reached a statisticallysignificant contribution to the predictive model, the definitive explanatory model wascomposed of these two predictors only. The mixed-effects multiple regression model for
Int J Clin Health Psychol, Vol. 11. Nº 3
SÁNCHEZ-MECA et al. The Maudsley Obsessive-Compulsive Inventory 489
these two predictors reached a statistically significant result [QR (2) = 1715.83, p < .001;R2 = .999], with the two predictors exhibiting a significant contribution to the model (p< .001). Further, the misspecification test was non significant [QE (277) = 191.65, p = .999],meaning that the model was well-specified. As a consequence, the predictive equationT’ = .14 – 0.40*SD + .037*Mean, can be used to obtain predictions of the reliability fora given standard deviation and mean of test scores. For example, taking the average ofthe SD (4.60) and of the mean (10.30) of test scores showed in Table 2, the equationgives a prediction for the reliability of test scores of .73.3
DiscussionAs reliability is not a property of the test itself, but of the test scores obtained in
each application, it is needed to develop RG studies in order to examine how reliabilityvaries through different administrations of the same test. In this article we presentedthe results of an RG study about the MOCI, one of the most commonly applied testsin Psychology to assess obsessive and compulsive symptoms in psychiatric patientsand as a screening tool for nonclinical population. As the MOCI is composed ofdichotomous items, it was possible to take advantage of the KR-21 formula to increasethe database of reliability estimates when the study did not report a coefficient alphabut reported the number of items of the test and the mean and standard deviation oftest scores. Our comparison between coefficients alpha and KR-21 estimates showed asmall underestimation of .02 with the KR-21 formula, very similar to that obtained byLane et al. (2002). With this strategy it was possible to increase our database of internalconsistency estimates from 44 to 308. Therefore, our recommendation is to use KR-21formula in RG studies for tests composed of dichotomous items when the study doesnot report the coefficient alpha for the data at hand.
The mean reliability obtained for test scores of the total scale was .76, clearly overthe cut off of .70 usually considered as the minimum recommendable reliability whenapplying tests for exploratory research purposes (Nunnally and Bernstein, 1994). Theaverage test-retest reliability (.70) was slightly lower to that obtained for internalconsistency, although still over .70. However, if we take into account the more strict cutoff values of .80 for general research purposes and of .90 for important clinical decisions,then the reliability exhibited by the MOCI scores is clearly insufficient, as for clinicalsamples (see Table 3) the mean reliability coefficient was .75 only (Henson, 2001).Therefore, our results showed a satisfactory reliability for the MOCI only when it isused for exploratory research purposes.
Several characteristics of the studies presented a statistically significant relationshipwith the internal consistency estimates, such as the mean age, the target population,and the test version. However, when they were introduced in a multiple regression
3 Note that the value obtained by applying the predictive equation was T’ = -1.08. As this valueis in the metric of Bonett’s transformation, it is needed to back-transform this value in order toput the result in the metric of reliability coefficient. Thus, by applying the formula, we obtain.73.
Int J Clin Health Psychol, Vol. 11. Nº 3
490 SÁNCHEZ-MECA et al. The Maudsley Obsessive-Compulsive Inventory
model, the only variables that significantly contributed to explain the reliability estimatesvariability were the standard deviation and the mean of test scores. Therefore, ourpredictive model is based on only these two variables and it can be used in futureresearch to predict the expected reliability in a given application of the MOCI.
Finally, only 15.6% of the studies that applied the MOCI reported a reliabilitycoefficient with the data at hand. The majority of the studies that applied the MOCIinduced reliability from previous applications of the test or simply omitted any commentabout reliability. The erroneous practice of inducing reliability should be eradicated, asit does a disservice to psychological research (Vacha-Haase and Thompson, 2011).
ReferencesAguayo, R., Vargas, C., de la Fuente, E.I., and Lozano, L.M. (2011). A meta-analytic reliability
generalization study of the Maslach Burnout Inventory. International Journal of Clinicaland Health Psychology, 11, 343-361.
Anastasi, A. and Urbina, S. (1997). Psychological testing (7th ed.). Upper Saddle River, NJ:Prentice Hall.
Ávila-Espada, A. (1986). Una contribución a la evaluación de las obsesiones y compulsiones conla revisión del Inventario de Obsesiones de Leyton (LOI) y del Cuestionario ObsesivoCompulsivo de Maudsley (MOCQ). Psiquis, 100, 67-74.
Barnes, L.L.B., Harp, D., and Jung, W.S. (2002). Reliability generalization of scores on theSpielberger State-Trait Anxiety Inventory. Educational and Psychological Measurement,62, 603-618.
Bonett, D.G. (2002). Sample size requirements for testing and estimating coefficient alpha.Journal of Educational and Behavioral Statistics, 27, 335-340.
Borenstein, M., Hedges, L.V., Higgins, J.P.T., and Rothstein, H.R. (2009). Introduction to meta-analysis. Chichester, UK: Wiley.
Botella, J. and Gambara, H. (2006). Doing and reporting a meta-analysis. International Journalof Clinical and Health Psychology, 6, 425-440.
Botella, J., Suero, M., and Gambara, H. (2010). Psychometric inferences from a meta-analysisof reliability and internal consistency coefficients. Psychological Methods, 15, 386-397.
Caruso, J.C., Witkiewitz, K., Belcourt-Dittloff, A., and Gottlieb, J.D. (2001). Reliability scoresfrom the Eysenck Personality Questionnaire: A reliability generalization study. Educationaland Psychological Measurement, 61, 675-689.
Chan, D.W. (1990). The Maudsley Obsessional-Compulsive Inventory: A psychometric investigationon Chinese normal subjects. Behaviour Research and Therapy, 28, 413-420.
Crocker, L. and Algina, J. (1986). Introduction to classical and modern test theory. New York:Holt, Rinehart and Winston.
Einstein, D.A. and Menzies, R.G. (2006). Magical thinking in obsessive-compulsive disorder,panic disorder and the general community. Behavioural and Cognitive Psychotherapy, 34,351-357.
Emmelkamp, P.M.G., Kraaijkamp, H.J.M., and Van den Hout, M.A. (1999). Assessment ofobsessive-compulsive disorder. Behavior Modification, 23, 269-279.
Erol, N. and Savasir, I. (1989, June). The Turkish version of the Maudsley Obsessional CompulsiveQuestionnaire. Paper presented at the 2nd Regional Conference of the InternationalAssociation for Cross-Cultural Psychology. Amsterdam, The Netherlands.
Int J Clin Health Psychol, Vol. 11. Nº 3
SÁNCHEZ-MECA et al. The Maudsley Obsessive-Compulsive Inventory 491
Fonseca-Pedrero, E., Lemos-Giráldez, S., Paíno-Piñeiro, M., Villazón-García, U., and Muñiz, J.(2010). Schizotypal traits, obsessive-compulsive symptoms, and social functioning inadolescents. Comprehensive Psychiatry, 51, 71-77.
Fonseca-Pedrero, E., Paíno-Piñeiro, M., and Lemos-Giráldez, S. (2007). La diversidadpsicopedagógica en el aula: Evaluación de problemas emocionales y comportamentales.Aula Abierta, 36, 39-48.
Guilera, G., Gómez-Benito, J., Tomás, J., and Carreras, V. (2005). Fiabilidad y validez de laversión española del Maudsley Obsessive-Compulsive Inventory (MOCI). Interpsiquis.
Hantouche, E.G. and Guelfi, J.D. (1993). Auto-évaluation du trouble obsessionnel-compulsif:Adaptation et validation de deux outils psychométriques en version française. L’Encéphale,19, 241-248.
Henson, R.K. (2001). Understanding internal consistency reliability estimates: A conceptualprimer on coefficient alpha. Measurement and Evaluation in Counseling and Development,34, 177-189.
Henson, R.K., Kogan, L.R., and Vacha-Haase, T. (2001). A reliability generalization study of theTeacher Efficacy Scale and related instruments. Educational and Psychological Measurement,61, 404-420.
Henson, R.K. and Thompson, B. (2002). Characterizing measurement error in scores acrossstudies: Some recommendations for conducting «reliability generalization» studies.Measurement and Evaluation in Counseling and Development, 35, 113-126.
Hodgson, R.J. and Rachman, S. (1977). Obsessional-compulsive complaints. Behaviour Researchand Therapy, 15, 389-395.
Hopkins, K.D. (1998). Educational and psychological measurement and evaluation (8th ed.).Boston: Allyn and Bacon.
Kieffer, K.M. and Reese, R.J. (2002). A reliability generalization study of the Geriatric DepressionScale. Educational and Psychological Measurement, 62, 969-994.
Lane, G.G., White, A.E., and Henson, R.K. (2002). Expanding reliability generalization methodswith KR-21 estimates: An RG study on the Coopersmith Self-esteem Inventory. Educationaland Psychological Measurement, 62, 685-711.
Li, C.-S.R. and Chen, S.-H. (2007). Obsessive-compulsiveness and impulsivity in a non-clinicalpopulation of adolescent males and females. Psychiatry Research, 149, 129-138.
López-Pina, J.A., Sánchez-Meca, J., and Rosa-Alcázar, A.I. (2009). The Hamilton Rating Scalefor Depression: A meta-analytic reliability generalization study. International Journal ofClinical and Health Psychology, 9, 143-159.
Meesters, Y. (1997). Twee dwang-vragenlijsten bij OCD-patiënten: de MOCI en de IDB [Twocompulsion inventories for OCD patients: MOCI and IDB]. Gedragstherapie, 30, 103-112.
Min, B. and Won, H. (1999). Reliability and validity of the Korean translations of MaudsleyObsessional-Compulsive Inventory and Padua Inventory. The Korean Journal of ClinicalPsychology, 18, 163-182.
Montero I. and León, O. (2007). A guide for naming research studies in Psychology. InternacionalJournal of Clinical and Health Psychology, 4, 505-520.
Müller, N., Putz, A., Kathmann, N., Lehle, R., Günther, W., and Straube, A. (1997). Characteristicsof obsessive-compulsive symptoms in Tourette syndrome, obsessive-compulsive disorder,and Parkinson disease. Psychiatry Research, 70, 105-114.
Nunnally, J.C. and Bernstein, I.H. (1994). Psychometric theory (3rd ed.). New York: McGraw-Hill.
Pedhazur, E.J. and Schmelkin, L.P. (1991). Measurement, design, and analysis: An integratedapproach. Hillsdale, NJ: Erlbaum.
Int J Clin Health Psychol, Vol. 11. Nº 3
492 SÁNCHEZ-MECA et al. The Maudsley Obsessive-Compulsive Inventory
Rachman, S. and Hodgson, R.J. (1980). Obsessions and compulsions. Englewood Cliffs, NJ:Prentice Hall.
Raich, R.M. (1996). Evaluación del trastorno obsesivo-compulsivo. In G. Buela-Casal, V. Caballo,and J.C. Sierra (Eds.), Manual de evaluación en psicología clínica y de la salud (pp. 161-178). Madrid: Siglo XXI.
Rodriguez, M.C. and Maeda, Y. (2006). Meta-analysis of coefficient alpha. Psychological Methods,11, 306-322.
Rosa-Alcázar, A.I., Sánchez-Meca, J., Gómez-Conesa, A., and Marín-Martínez, F. (2008). Thepsychological treatment of obsessive-compulsive disorder: A meta-analysis. ClinicalPsychology Review, 28, 1310-1325.
Sanavio, E. and Vidotto, G. (1985). The components of the Maudsley Obsessional-CompulsiveQuestionnaire. Behaviour Research and Therapy, 23, 659-662.
Sánchez-Meca, J. and López-Pina, J.A. (2008). El enfoque meta-analítico de generalización dela fiabilidad. Acción Psicológica, 5, 37-64.
Sánchez-Meca, J. and Marín-Martínez, F. (2008). Confidence intervals for the overall effect sizein random-effects meta-analysis. Psychological Methods, 13, 31-48.
Shields, A.L. and Caruso, J.C. (2004). A reliability induction and reliability generalization studyof the Cage Questionnaire. Educational and Psychological Measurement, 64, 254-270.
Smári, J., Bjarnason, B.A., Porleifsson, K., Sturludóttir, S., and Hafsteinsdóttir, P. (1994). Étudepsychométrique de la Liste des Pensées Obsédantes en version islandaise. Poster presentedat the 22nd Conference of the French Association of Cognitive-Behaviour Therapy, Paris(France).
Sternberger, L.G., and Burns, G.L. (1990). Compulsive activity and the Maudsley Obsessional-Compulsive Inventory: Psychometric properties of two measures of obsessive-compulsivedisorder. Behavior Therapy, 21, 117-127.
Støylen, I.J., Larsen, S., and Kvale, G. (2000). The Maudsley Obsessional-Compulsive Inventoryand OCD in a norwegian nonclinical sample. Scandinavian Journal of Psychology, 41,283-286.
Tadai, T., Nakamura, M., Okazaki, S., and Nakajima, T. (1995). The prevalence of obsessive-compulsive disorder in Japan: A study of students using the Maudsley Obsessional-Compulsive Inventory and DSM-III-R. Psychiatry and Clinical Neurosciences, 49, 39-41.
Thordarson, D.S., Radomsky, A.S., Rachman, S., Shafran, R., Sawchuk, C.N., and Hakstian, A.R.(2004). The Vancouver Obsessional Compulsive Inventory (VOCI). Behaviour Researchand Therapy, 42, 1289-1314.
Vacha-Haase, T. (1998). Reliability generalization: Exploring variance in measurement erroraffecting score reliability across studies. Educational and Psychological Measurement, 58,6-20.
Vacha-Haase, T., Kogan, L.R., and Thompson, B. (2000). Sample compositions and variabilitiesin published studies versus those in test manuals. Educational and PsychologicalMeasurement, 60, 509-522.
Vacha-Haase, T. and Thompson, B. (2011). Score reliability: A retrospective look back at 12years of reliability generalization studies. Measurement and Evaluation in Counseling andDevelopment, 44, 159-168.
Vassar, M. and Hale, W. (2009). Reliability reporting across studies using the Buss DurkeeHostility Inventory. Journal of Interpersonal Violence, 24, 20-37.
Yin, P. and Fan, X. (2000). Assessing the reliability of Beck Depression Inventory scores:Reliability generalization across studies. Educational and Psychological Measurement, 60,201-223.
Int J Clin Health Psychol, Vol. 11. Nº 3
SÁNCHEZ-MECA et al. The Maudsley Obsessive-Compulsive Inventory 493
Zohar, A.H., LaBuda, M., and Moschel-Ravid, O. (1995). Obsessive-compulsive behaviors andcognitive functioning: A study of compulsivity, frame shifting and Type A activitypatterns in a normal population. Neuropsychiatry, Neuropsychology, and BehavioralNeurology, 8, 163-167.
Received May 17, 2011Accepted June 16, 2011
Top Related