


Languages
Pages
Legal


The Insurance Crisis – How To Achieve Sustainable Premiums
By
Rod Hughes
Australian Yachting Federation
Insurance & Risk Management Seminar
8th June 2002
The Situation
• Dramatic increases in liability insurance premiums, or even unavailability of cover
• Impacting on wide range of organisations – sporting bodies, event organisers, community organisations in addition to commercial business operators
• Enormous effect on Australian society – situation reaching crisis point
The Cause
• Prime consideration in setting premiums is risk exposure– Claims history– Potential for claims in future policy period
• Substantial underwriting losses to insurers on liability cover e.g. loss ratio in 2000 of 134% i.e. claims incurred 134% of premiums received
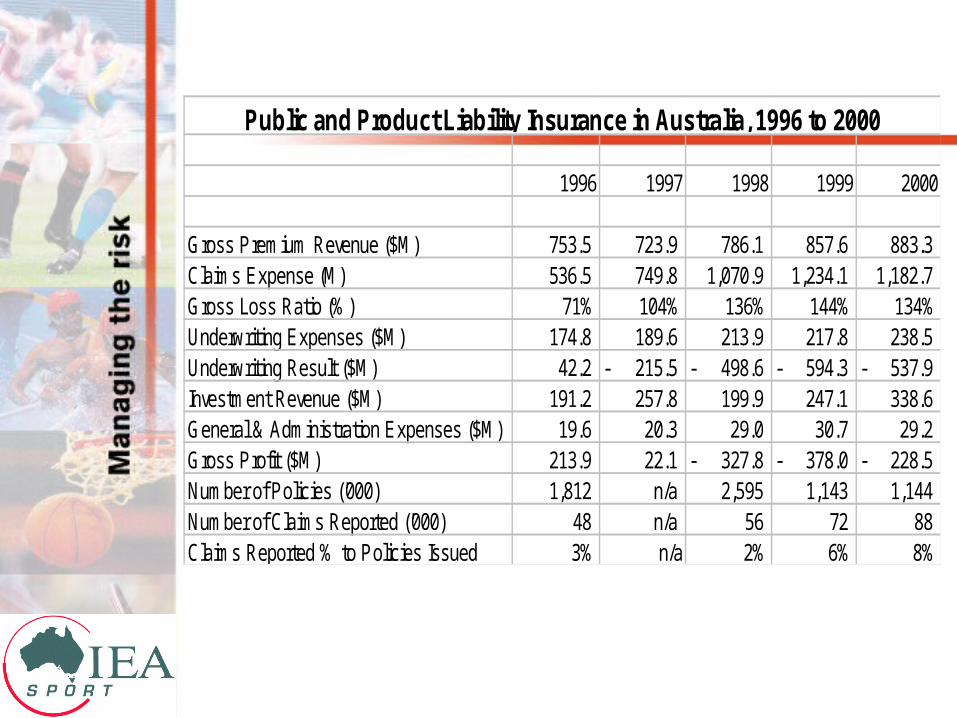
1996 1997 1998 1999 2000
Gross Premium Revenue ($M) 753.5 723.9 786.1 857.6 883.3 Claims Expense (M) 536.5 749.8 1,070.9 1,234.1 1,182.7 Gross Loss Ratio (%) 71% 104% 136% 144% 134%Underwriting Expenses ($M) 174.8 189.6 213.9 217.8 238.5 Underwriting Result ($M) 42.2 215.5- 498.6- 594.3- 537.9- Investment Revenue ($M) 191.2 257.8 199.9 247.1 338.6 General & Administration Expenses ($M) 19.6 20.3 29.0 30.7 29.2 Gross Profit ($M) 213.9 22.1 327.8- 378.0- 228.5- Number of Policies ('000) 1,812 n/a 2,595 1,143 1,144 Number of Claims Reported ('000) 48 n/a 56 72 88 Claims Reported % to Policies Issued 3% n/a 2% 6% 8%
Public and Product Liability Insurance in Australia, 1996 to 2000
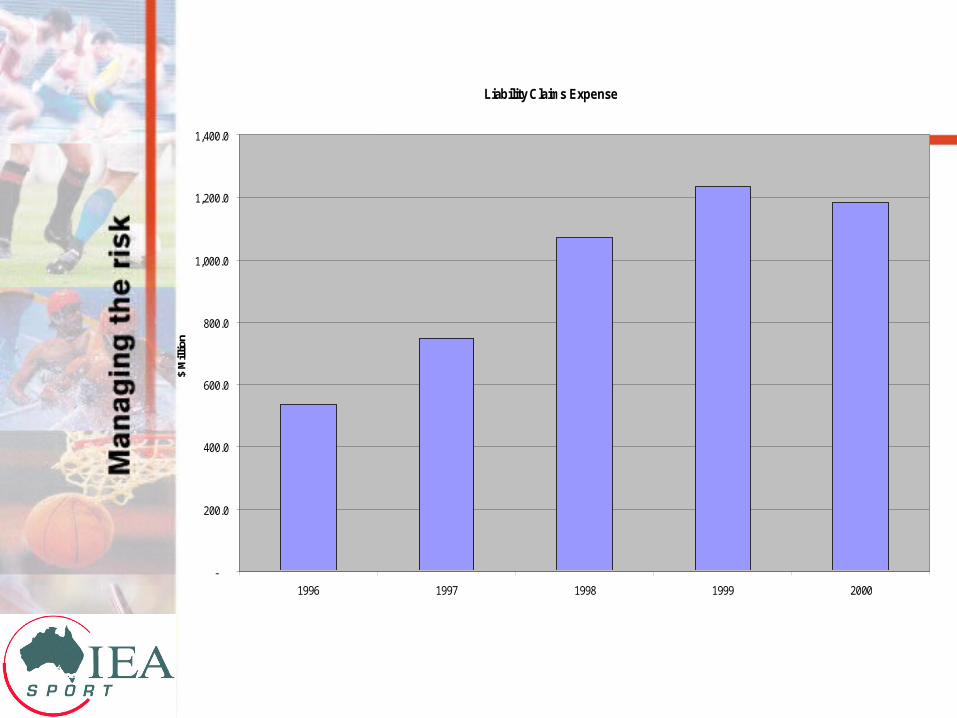
Liability Claims Expense
-
200.0
400.0
600.0
800.0
1,000.0
1,200.0
1,400.0
1996 1997 1998 1999 2000
$ M
illio
n

Liability Underwriting Result (Premium less Claims less Underwriting Expenses)
-700.0
-600.0
-500.0
-400.0
-300.0
-200.0
-100.0
-
100.0
1996 1997 1998 1999 2000
$ M
illio
n
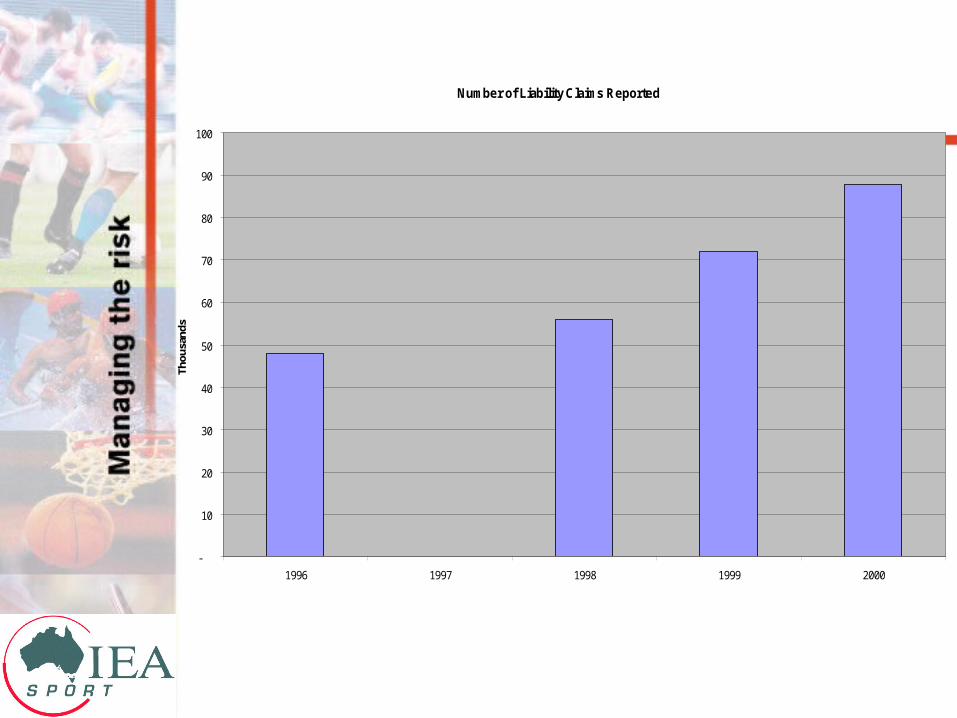
Number of Liability Claims Reported
-
10
20
30
40
50
60
70
80
90
100
1996 1997 1998 1999 2000
Thou
sand
s

Justification??
• Future trends – “long tail” nature of liability claims
• Risky business – potential for significant loss• Unsatisfactory results – shareholder demand for
returns – associated events e.g. September 11, HIH
• Does potential benefit justify the insurers risk??
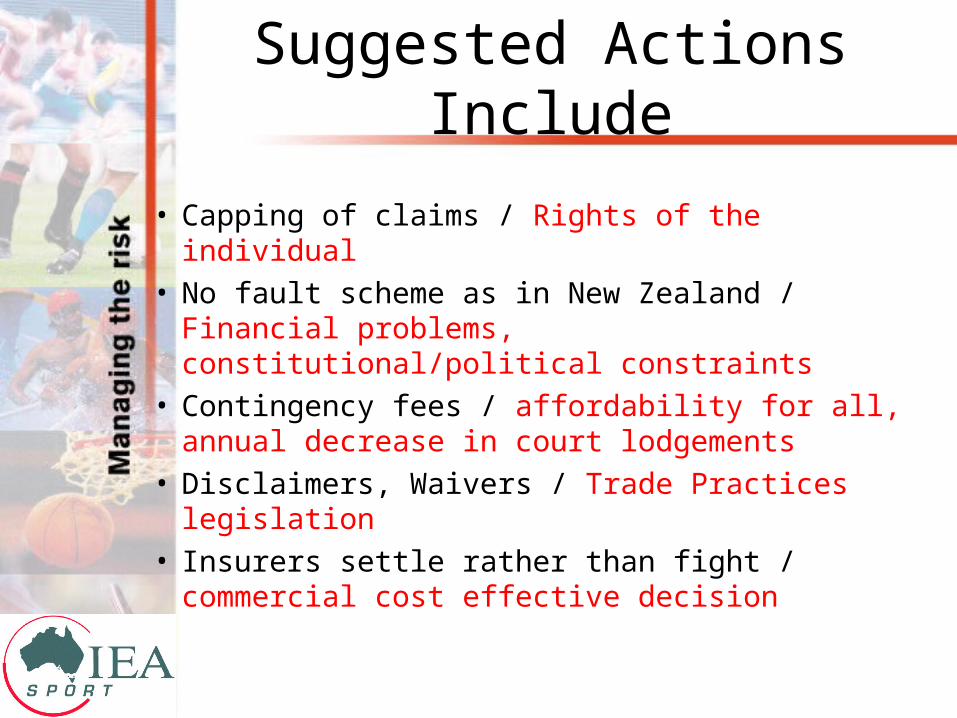
Suggested Actions Include
• Capping of claims / Rights of the individual• No fault scheme as in New Zealand / Financial
problems, constitutional/political constraints• Contingency fees / affordability for all, annual
decrease in court lodgements• Disclaimers, Waivers / Trade Practices legislation• Insurers settle rather than fight / commercial cost
effective decision
• Very complex matter – no single simple solution
• Will require cooperation and determination of all parties involved
• Will not be solved overnight
• The key to reducing liability premiums is to reduce liability claim payments

As sport administrators, what can we do?
Group Pooling?
• Premiums based on actuarial calculations – incident rate, average cost of claims
• Once sufficient numbers to prevent distortion, extra numbers do not reduce the risk
• Extra numbers may provide higher risk• The lure of extra premium has contributed
substantially to the current situation e.g. demise of HIH
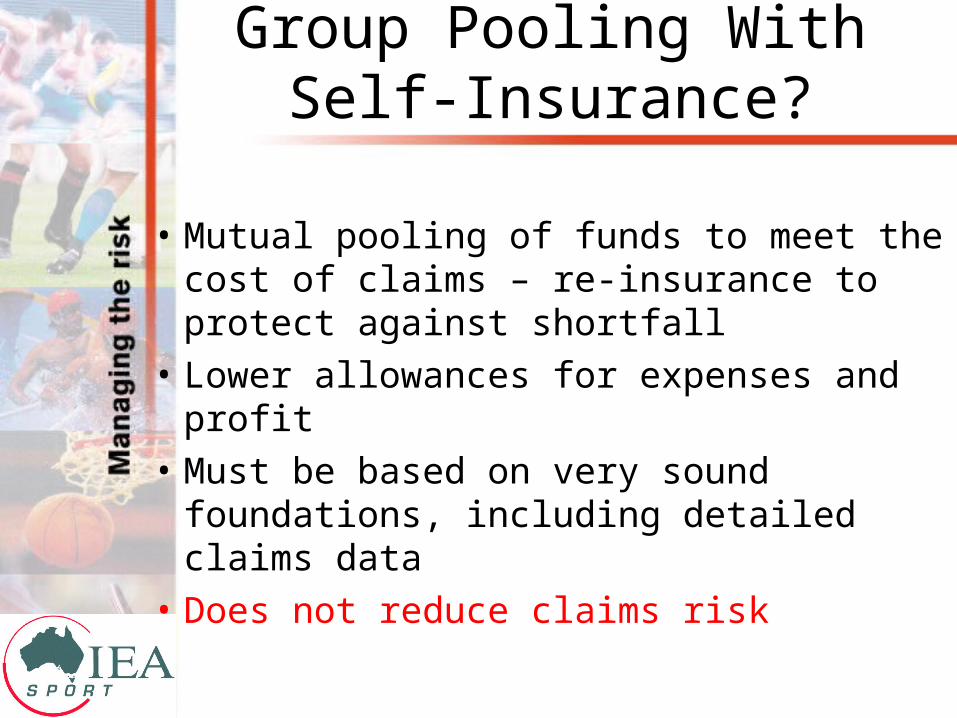
Group Pooling With Self-Insurance?
• Mutual pooling of funds to meet the cost of claims – re-insurance to protect against shortfall
• Lower allowances for expenses and profit
• Must be based on very sound foundations, including detailed claims data
• Does not reduce claims risk

Reduce Incident Rate, Reduce Average Cost of Claim
• Critical to reducing the cost of liability insurance – must happen for there to be sustainable premium reductions
• Actions taken that do not have the effect of reducing the incidence and/or cost of liability claims will have limited influence
• Group pooling in isolation will have limited impact
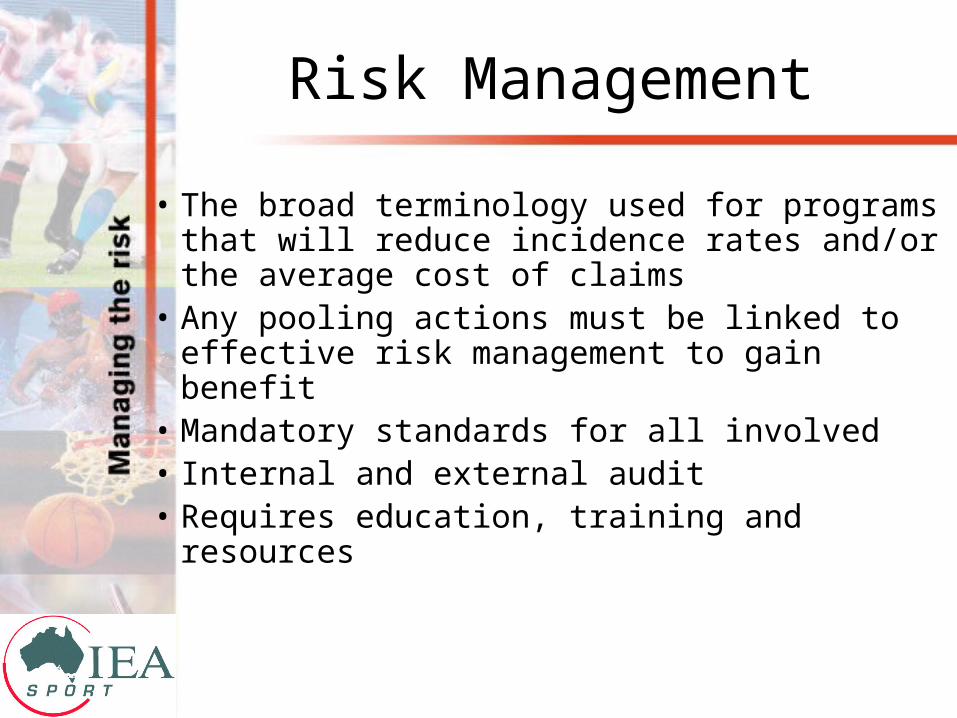
Risk Management
• The broad terminology used for programs that will reduce incidence rates and/or the average cost of claims
• Any pooling actions must be linked to effective risk management to gain benefit
• Mandatory standards for all involved• Internal and external audit• Requires education, training and resources
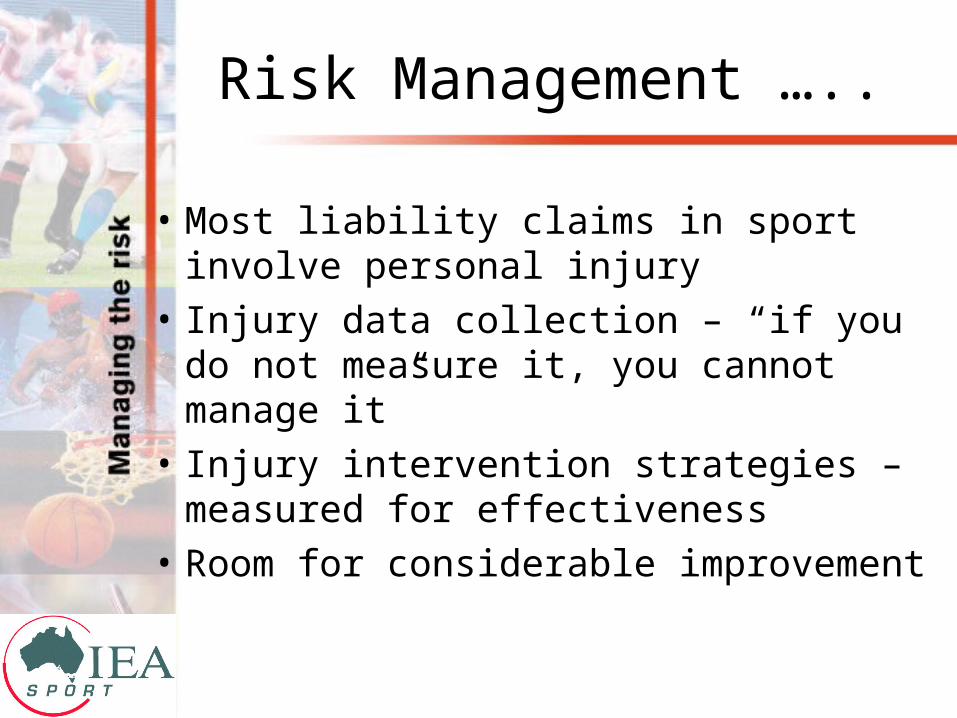
Risk Management …..
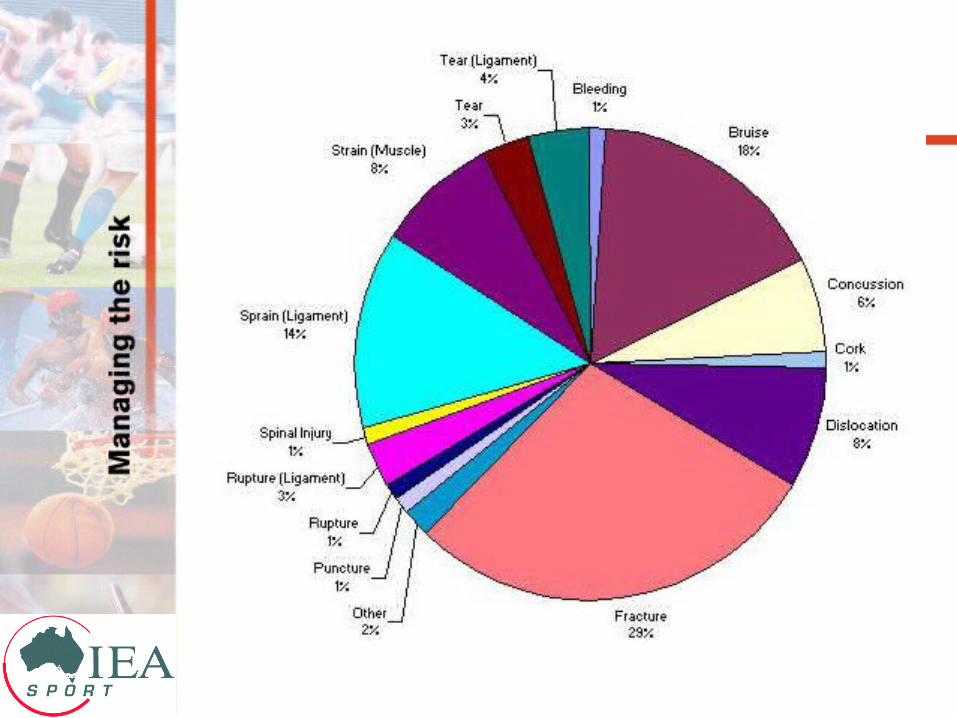
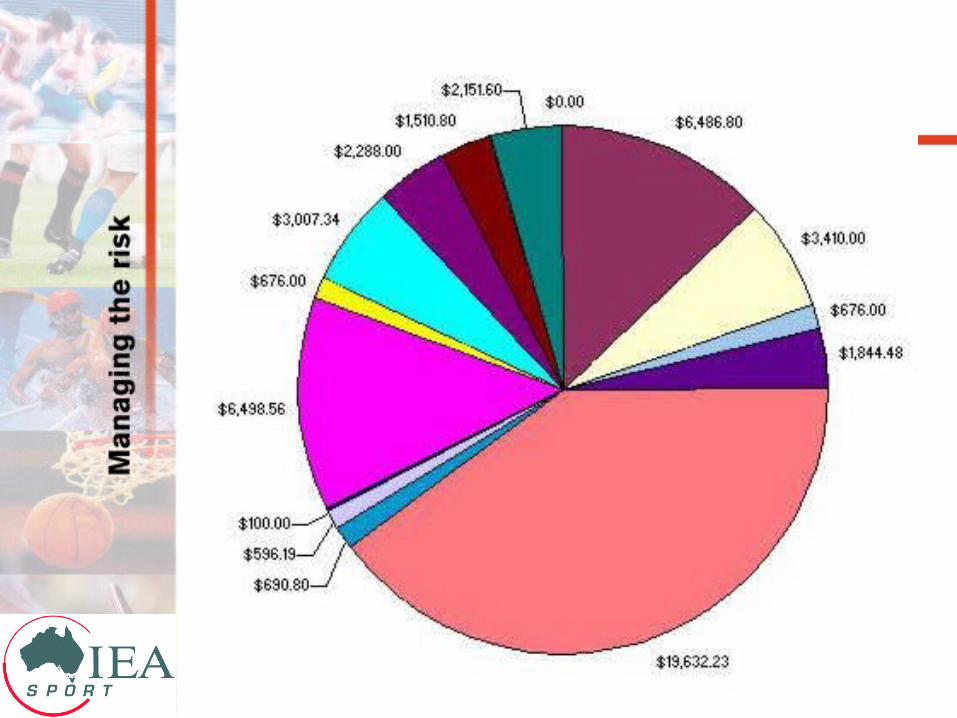
• Most liability claims in sport involve personal injury
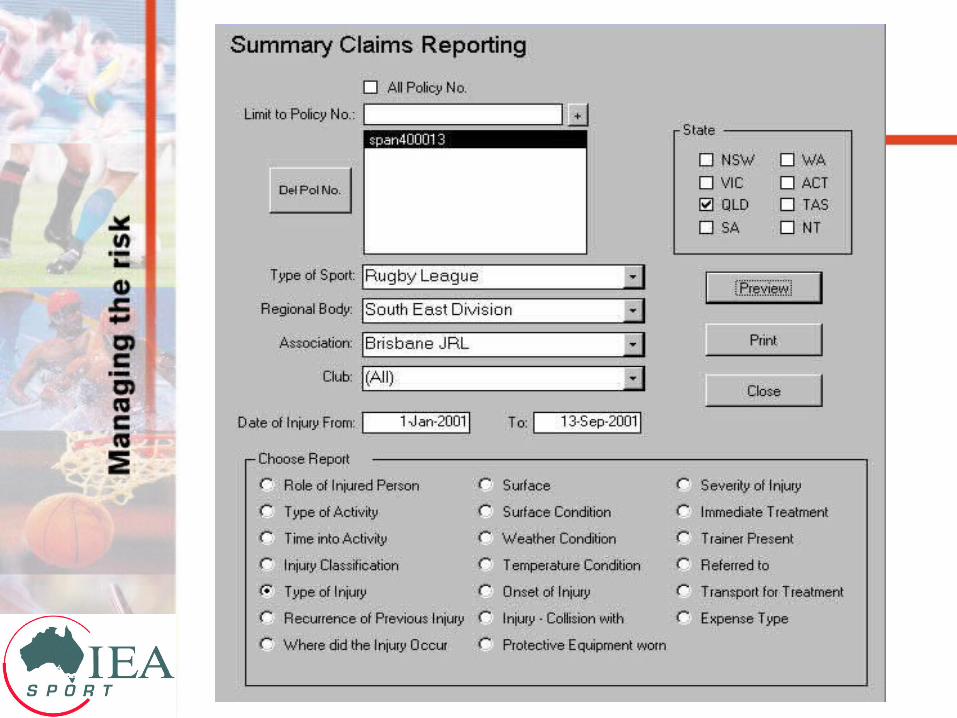
• Injury data collection – “if you do not measure it, you cannot manage it”
• Injury intervention strategies – measured for effectiveness
• Room for considerable improvement

Best Practice Management• Effective risk management infrastructure• Sector taskforce to oversee operations of compliance to
maintain a best practice mechanism• Injury data collected and utilised in prevention
campaigns• Recognition by insurers that their ratings will be
reflective of clients adherence to best practice and industry standards
• A commitment from all parties concerned to be prepared to give some ground in the knowledge that more of the same is not a viable proposition
Top Related