


Languages
Pages
Legal

1
The Influence of Strategic Orientation on SME Export Success: An Investigation on Success Factors of SME Exporters in Myanmar through PLSNC Model
Soe Htet [email protected]
Nattapan Buavaraporn, Ph.D. [email protected]
Business School, University of the Thai Chamber of Commerce
Abstract
The integration of ASEAN Economic Community (AEC) in 2016 raises an imperative concern with the readiness in entering into AEC successfully. Considering the important role of SMEs in Myanmar economy, in which Myanmar is new emerging country in AEC, it needs to pay attention on enhancing the readiness and success of SME exporters. Through the development of PLSNC Model, this paper aimed primarily at investigating influence of strategic orientation on SME exporters in Myanmar and also determining the relative level of influence that each factor of strategic orientation has on export success of SME exporters in Myanmar. The PLSNC model is developed based on the literature reviews of social network orientation and proactive learning culture (PLC) model developed by other scholars. Confirmatory factor analysis and Structural Equation Model (SEM) analysis were conducted by using SPSS and AMOS analytical tools to test model fit and hypotheses. The qualified responses of 410 from respondents were selected to test hypotheses of the study. Findings are consistent with the hypotheses. Results met with objectives of the study. The value that this paper offers is a well suited model to investigate the influence of strategic orientation on SME export success, especially for developing countries. Contributions of this paper includes providing a synthesized model (PLSNC) to measure export success, investigating success factors of SME exporters to reflect and make improvements by using PLSNC model. Policy makers and exporters can utilize the findings, for SME sector development, which reveals the importance of social network orientation and relative level of influence of other lower order constructs on export success.
Keywords: small and medium enterprise, export success factors, proactive learning and social network culture, strategic orientation.
2
Introduction As the role of SMEs export of respective country plays significant role, scholars and practitioners of SMEs export around the world paid more attention to the key export success factors of SMEs. Some scholars examined the effectiveness of public programs which support SMEs export (Alvarez, 2004) and other scholars emphasized on managerial aspect of SMEs export success (Makrini, 2014). There are so many factors contributing to the success of SMEs export and the identified success factors presented by various scholars, based on different locations, industries, and aspects, have differences and level of the influence of identified factors on the SMEs export success are also varied. For example, the constructs such as market orientation, learning orientation, entrepreneurial orientation and social networking orientation have been used by several of scholars in previous literatures (Javalgi, Todd and Granot, 2011; Gnitzy, Baker and Grinstein,2014; Keskin, 2006; Ellis, 2000 ). However, those specific investigations could not offer holistic approach in investigating factors influencing export success. This study fills the gap by developing an all inclusive higher order construct (PLSNC) and contributes a better framework in the field of investigating export success factors. The theoretical background of this study mainly based on social network theory (guanxi) (Davies et al., 1995; Buttery and Wong, 1999; Park and Luo, 2001; Holmlund & Kock, 1998; Pablos, 2005; Ruzzier et al., 2006) and proactive learning culture. Proactive learning culture construct is a higher order construct consists of three lower constructs such as market orientation, learning orientation, and entrepreneurial orientation (Gnizy, Baker, & Grinstein, 2014). Social network orientation includes building friendship, reciprocating favors, and creating trust among contracting partners and new contacts (Leung and Wong, 2001). PLSNC is a higher order construction of PLC construct and social network orientation construct because some studies have proven that social networking is really important for export success of small firms (Holmlund & Kock, 1998; Pablos, 2005; Ruzzier et al., 2006).The rationale is that conceptual framework of the study can fill the gaps what both main theories lack and utilizes merits of each theory. The investigation on export success factors of SMEs in Myanmar was carried out in this study to have a deeper understanding of the SME exporters in Myanmar and factors contribution to their export success. The results from the investigation can be supportive in setting a solid framework for measuring the effectiveness and efficiency of SMEs exporters, SMEs support programs, and SMEs related policy matters.
3
2. Literature Review
2.1 Export performance
Louter, Ouwerkerk, and Bakker (1991) explained that Export success could not be defined in objective terms, because perceptions of people are different. The conception of an excellent success made by one export manager could be considered as poor by another manager. Historical results, expectations and objectives are used in evaluating certain results. That is why more than one indicator such as export/sales ratio, financial indicators, and meeting export objectives are used in measuring export success. Milesi et al. (2007) constructed an export performance index (EPI) to identify highly dynamic and well positioned SMEs in external markets. Export SMEs in three countries were evaluated by using EPI. Rock and Ahmed (2008) identified limitations of previous researches in literature by pointing out inconsistencies. First, in the export-marketing field, there is not a well-established tradition based on previous findings and knowledge, regarding successful export activity, is fragmented (Aaby and Slater, 1989; Cavusgil and Zou, 1994). Zou, Taylor, and Osland (1998) developed a cross-national generalized export performance measure, also known as “the EXPERF Scale”, based on three dimensions such as financial export performance, strategic export performance, and satisfaction with the export venture.
2.2 Proactive learning culture Ginzy, Baker, & Grinstein (2014) stated that the role of strategic orientation culture in improving foreign launch success of SMEs is not known very well even though they constitute a significant portion of international trade. Proactive learning culture (PLC) or dynamic capability (DC) is a construct synthesized as a higher order construct consists of three lower constructs which are market orientation, entrepreneurial orientation, and learning orientation. The authors pointed out that PLC is specifically important to SMEs because they are vulnerable in risky foreign market launch as they have very limited market power and resources. As behavioral mediators of the impact of PLC on foreign market launch success, marketing program adaptation and local integration are examined (See also in Figure 1: PLC model).

4
Reviews of lower order constructs and mediating constructs of PLC model are described in the following paragraphs. Javalgi, Todd, and Granot (2011) discussed that market orientation concept derived from marketing concept explaining that organization success depends on meeting and satisfying customers’ needs. Creating superior customer values can grant firms sustainable competitive advantage (Narver and Salter, 1990). Findings of a previous research emphasizing on western countries showed that there is a positive relationship between market orientation and business performance (Jaworski and Kohli, 1993; Narver and Slater, 1990; Deshpande et al., 1993; Deshpande and Farley, 1996). Miller (1983) defined entrepreneurship as “the process by which organizations renew themselves by pioneering, innovation and risk-taking”. Entrepreneurship is an exploitation of opportunity for the firm’s renewal and rejuvenation (Covin and Mile, 1999). The associated traits of entrepreneurial orientation are risk-taking, proactiveness, and innovativeness ( Atuahene-Gima and Ko, 2001; Lumpkin and Dess, 1996). Rauch et al. (2009) contended that entrepreneurial orientation is positively related to the performance of the firm. It is evident in the case of foreign launch success as an effect of entrepreneurial orientation (Zhou et al., 2007). Learning orientation can be defined as “ an organizational characteristic that reflects the value that a firm places not only an adroitly responding to changes in the environment but on constantly challenging the assumptions that frame the organization’s relationship with the environment” ( Baker and Sinkula, 1999a, p.412).It is found out that strong learning orientation firms learn better, question deep-seated assumptions on fundamental operating philosophies and examine mental models guiding the decision making of the firms. Performance of the firms can be improved by the superior capabilities of the firms and demands of the external environment (Baker and Sinkula, 1999a, 2002; Liu et al., 2002; Slater and Narver 1995).
5
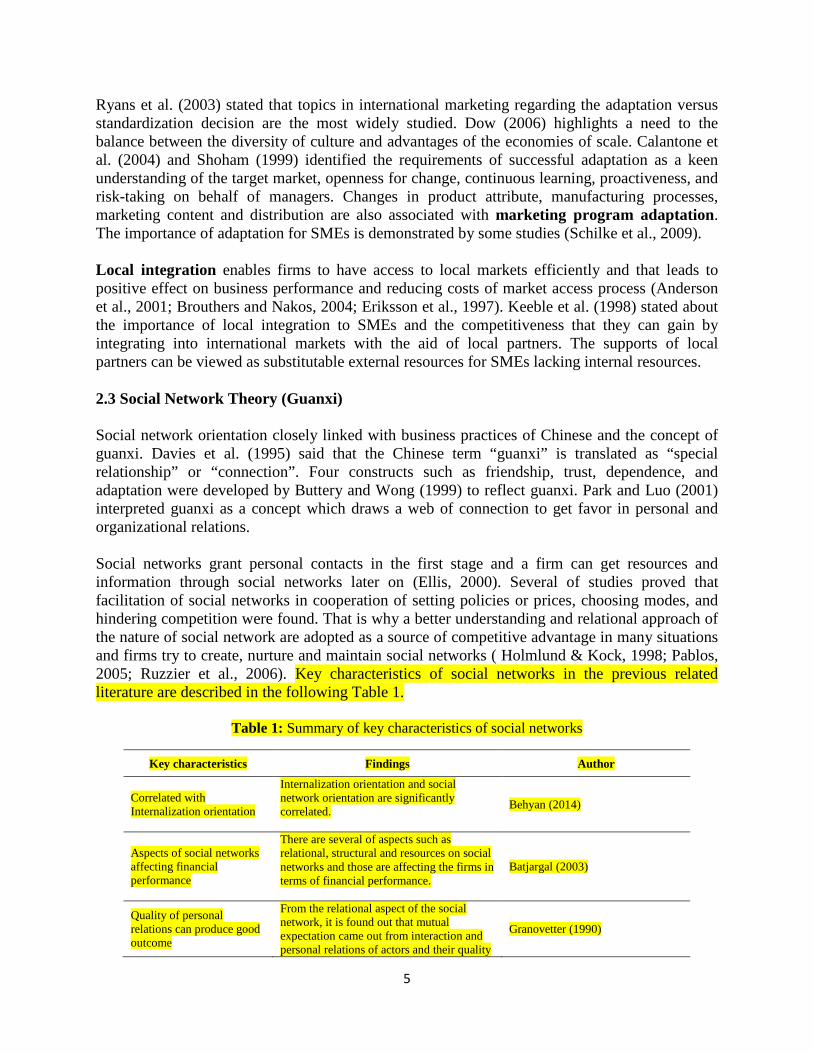
Ryans et al. (2003) stated that topics in international marketing regarding the adaptation versus standardization decision are the most widely studied. Dow (2006) highlights a need to the balance between the diversity of culture and advantages of the economies of scale. Calantone et al. (2004) and Shoham (1999) identified the requirements of successful adaptation as a keen understanding of the target market, openness for change, continuous learning, proactiveness, and risk-taking on behalf of managers. Changes in product attribute, manufacturing processes, marketing content and distribution are also associated with marketing program adaptation. The importance of adaptation for SMEs is demonstrated by some studies (Schilke et al., 2009). Local integration enables firms to have access to local markets efficiently and that leads to positive effect on business performance and reducing costs of market access process (Anderson et al., 2001; Brouthers and Nakos, 2004; Eriksson et al., 1997). Keeble et al. (1998) stated about the importance of local integration to SMEs and the competitiveness that they can gain by integrating into international markets with the aid of local partners. The supports of local partners can be viewed as substitutable external resources for SMEs lacking internal resources. 2.3 Social Network Theory (Guanxi) Social network orientation closely linked with business practices of Chinese and the concept of guanxi. Davies et al. (1995) said that the Chinese term “guanxi” is translated as “special relationship” or “connection”. Four constructs such as friendship, trust, dependence, and adaptation were developed by Buttery and Wong (1999) to reflect guanxi. Park and Luo (2001) interpreted guanxi as a concept which draws a web of connection to get favor in personal and organizational relations. Social networks grant personal contacts in the first stage and a firm can get resources and information through social networks later on (Ellis, 2000). Several of studies proved that facilitation of social networks in cooperation of setting policies or prices, choosing modes, and hindering competition were found. That is why a better understanding and relational approach of the nature of social network are adopted as a source of competitive advantage in many situations and firms try to create, nurture and maintain social networks ( Holmlund & Kock, 1998; Pablos, 2005; Ruzzier et al., 2006). Key characteristics of social networks in the previous related literature are described in the following Table 1.
Table 1: Summary of key characteristics of social networks
Key characteristics Findings Author
Correlated with Internalization orientation
Internalization orientation and social network orientation are significantly correlated. Behyan (2014)
Aspects of social networks affecting financial performance
There are several of aspects such as relational, structural and resources on social networks and those are affecting the firms in terms of financial performance.
Batjargal (2003)
Quality of personal relations can produce good outcome
From the relational aspect of the social network, it is found out that mutual expectation came out from interaction and personal relations of actors and their quality
Granovetter (1990)
6
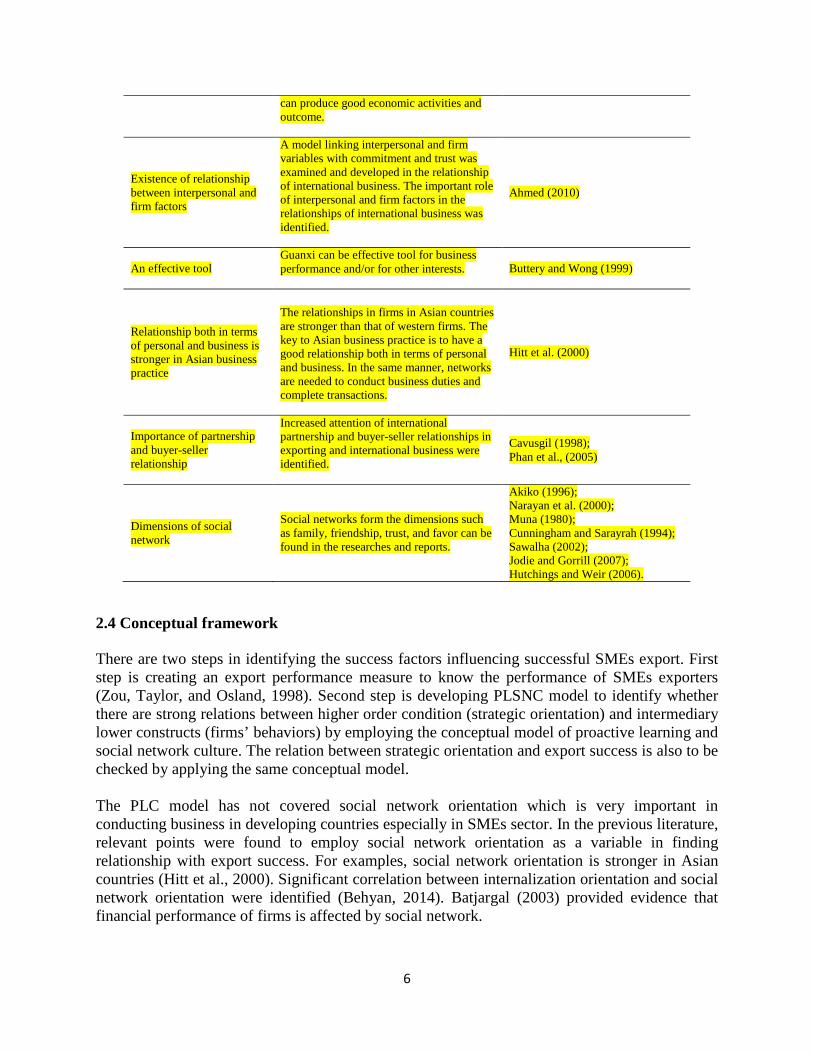
can produce good economic activities and outcome.
Existence of relationship between interpersonal and firm factors
A model linking interpersonal and firm variables with commitment and trust was examined and developed in the relationship of international business. The important role of interpersonal and firm factors in the relationships of international business was identified.
Ahmed (2010)
An effective tool Guanxi can be effective tool for business performance and/or for other interests. Buttery and Wong (1999)
Relationship both in terms of personal and business is stronger in Asian business practice
The relationships in firms in Asian countries are stronger than that of western firms. The key to Asian business practice is to have a good relationship both in terms of personal and business. In the same manner, networks are needed to conduct business duties and complete transactions.
Hitt et al. (2000)
Importance of partnership and buyer-seller relationship
Increased attention of international partnership and buyer-seller relationships in exporting and international business were identified.
Cavusgil (1998); Phan et al., (2005)
Dimensions of social network
Social networks form the dimensions such as family, friendship, trust, and favor can be found in the researches and reports.
Akiko (1996); Narayan et al. (2000); Muna (1980); Cunningham and Sarayrah (1994); Sawalha (2002); Jodie and Gorrill (2007); Hutchings and Weir (2006).
2.4 Conceptual framework There are two steps in identifying the success factors influencing successful SMEs export. First step is creating an export performance measure to know the performance of SMEs exporters (Zou, Taylor, and Osland, 1998). Second step is developing PLSNC model to identify whether there are strong relations between higher order condition (strategic orientation) and intermediary lower constructs (firms’ behaviors) by employing the conceptual model of proactive learning and social network culture. The relation between strategic orientation and export success is also to be checked by applying the same conceptual model. The PLC model has not covered social network orientation which is very important in conducting business in developing countries especially in SMEs sector. In the previous literature, relevant points were found to employ social network orientation as a variable in finding relationship with export success. For examples, social network orientation is stronger in Asian countries (Hitt et al., 2000). Significant correlation between internalization orientation and social network orientation were identified (Behyan, 2014). Batjargal (2003) provided evidence that financial performance of firms is affected by social network.

7
Another consideration which supports social network orientation to be included in the framework is that China is one of the major trading partners of Myanmar and business people from neighboring countries of Myanmar also conduct business with China. This shows that “Guanxi” can be a familiar concept for trading partners of Myanmar especially for those who engage in border trade. Ginzy, Baker and Grinstein (2014) suggested that interaction between PLC and national culture should be examined. Social network orientation is relevant to be included in the framework because firms can seek expertise of local contacts regarding national culture and other contextual understanding of the business environment. Social network orientation and its relationship with export success can be found in previous studies (Behyan, 2014; Batjargal, 2003), but the inclusion of it in PLC model had not been done by other scholars yet and this study filled that gap. Therefore, PLSNC model was developed as an extended model of PLC to establish a more holistic framework. The dimensions and sub-dimensions of each construct of the model are described in table 2.
Table 2 : Dimensions and sub-dimensions of each construct of the PLSNC model
Construct Dimension(s) References
Market Orientation 1. Acquisition of market information Narver and Slater (1990); Kohli et al. (1993); Matsuno et al. (2002) 2. Dissemination of market information
Learning Orientation 1. Continuous learning Baker and Sinkula (1999) Entrepreneurial
Orientation 1. Pursuing market opportunities Matsuno et al (2002)
Social Network Orientation
1. Friendship Kale et al. (2000); Wu (2008); Ring & Van de Ven (1992); Kagami (2006)
2. Favor Leung and Wong(2001) 3. Trust Ramasamy, Goh, &Yeung (2006)
Marketing Program Adaptation
1. Marketing effort Lages and Montgomery (2004)
Local Integration 1. Connecting with local Lages and Montgomery (2004)
Success of SME Exporting Firm
1. Financial Performance Gnizy, Baker,& Grinstein (2014); Zou, S., Taylor, C. R. and Osland, G.E., (1998)
2. Strategic Performance 3. Managerial Satisfaction
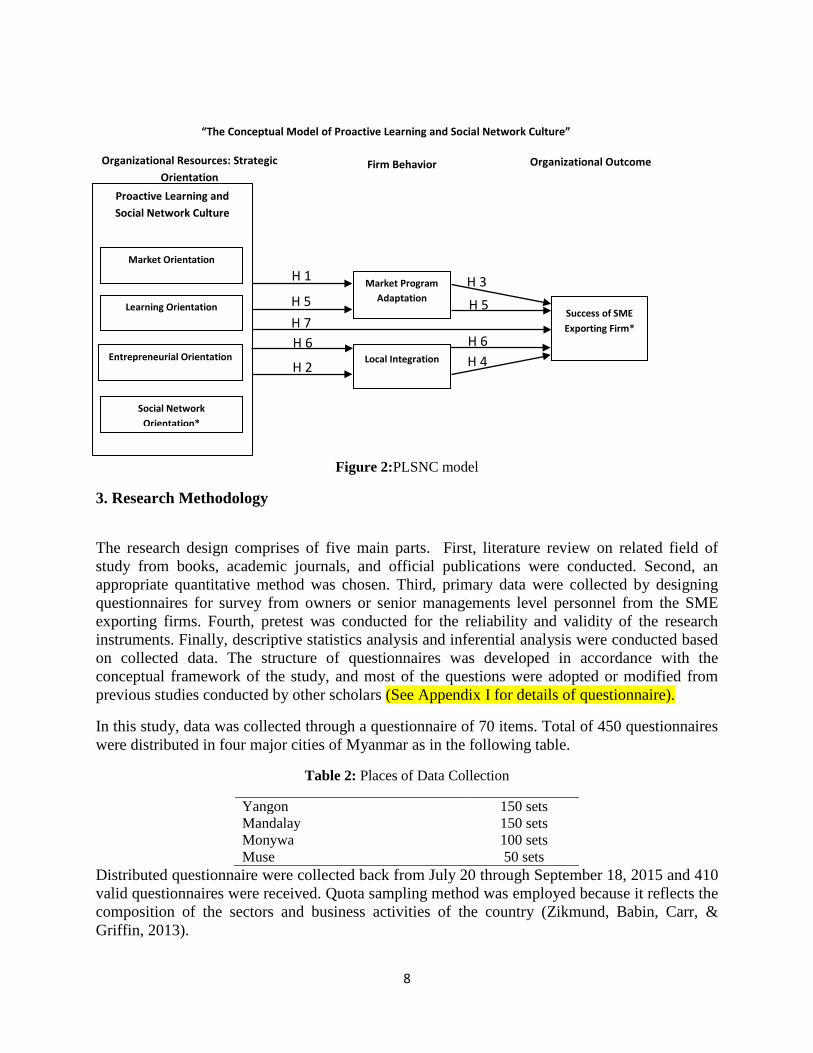
Based on all the related literature reviews of the previous studies and dimensions of the constructs, the conceptual framework of the study was developed and configured as in the following figure (See figure 2: PLSNC model for details).
8
H 5 H 5 H 7 H 6 H 6
Figure 2:PLSNC model
3. Research Methodology
The research design comprises of five main parts. First, literature review on related field of study from books, academic journals, and official publications were conducted. Second, an appropriate quantitative method was chosen. Third, primary data were collected by designing questionnaires for survey from owners or senior managements level personnel from the SME exporting firms. Fourth, pretest was conducted for the reliability and validity of the research instruments. Finally, descriptive statistics analysis and inferential analysis were conducted based on collected data. The structure of questionnaires was developed in accordance with the conceptual framework of the study, and most of the questions were adopted or modified from previous studies conducted by other scholars (See Appendix I for details of questionnaire).
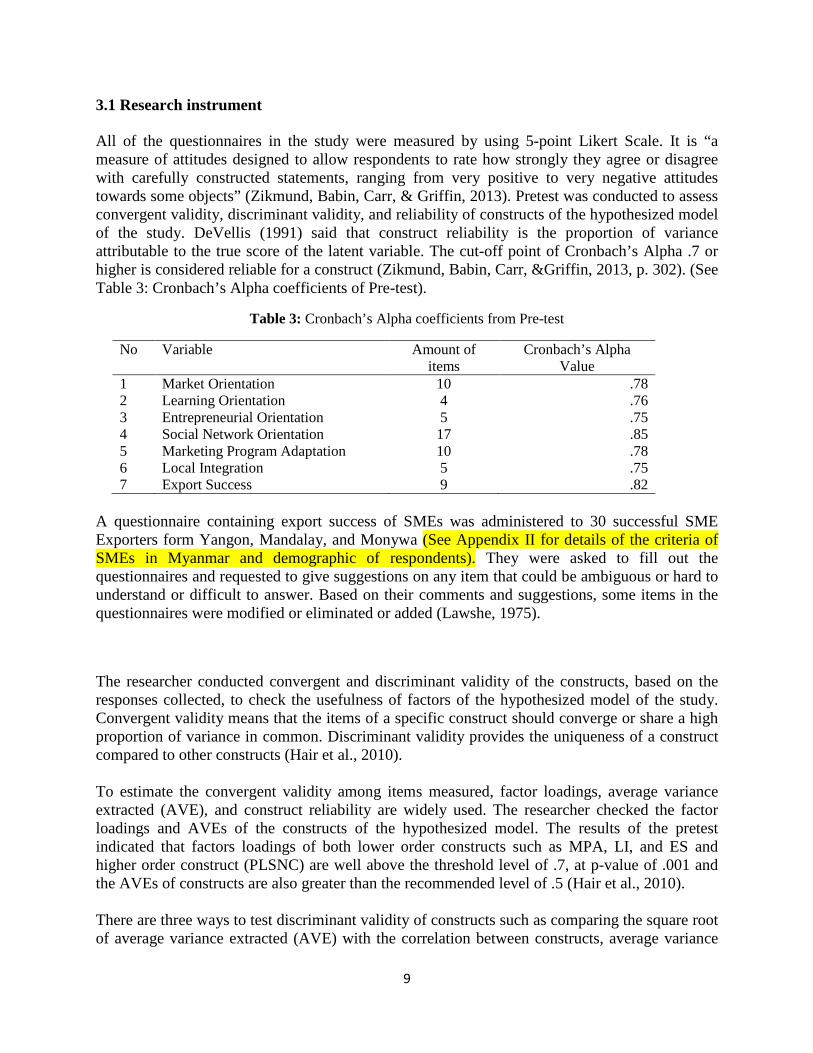
In this study, data was collected through a questionnaire of 70 items. Total of 450 questionnaires were distributed in four major cities of Myanmar as in the following table.
Table 2: Places of Data Collection
Yangon 150 sets Mandalay 150 sets Monywa 100 sets Muse 50 sets
Distributed questionnaire were collected back from July 20 through September 18, 2015 and 410 valid questionnaires were received. Quota sampling method was employed because it reflects the composition of the sectors and business activities of the country (Zikmund, Babin, Carr, & Griffin, 2013).
“The Conceptual Model of Proactive Learning and Social Network Culture”
Organizational Outcome Organizational Resources: Strategic Orientation
Firm Behavior
Proactive Learning and Social Network Culture
Market Orientation
Learning Orientation
Entrepreneurial Orientation
Social Network
Orientation*
H 1 H 3 Market Program Adaptation
Success of SME Exporting Firm*
H 4 H 2 Local Integration
9
3.1 Research instrument All of the questionnaires in the study were measured by using 5-point Likert Scale. It is “a measure of attitudes designed to allow respondents to rate how strongly they agree or disagree with carefully constructed statements, ranging from very positive to very negative attitudes towards some objects” (Zikmund, Babin, Carr, & Griffin, 2013). Pretest was conducted to assess convergent validity, discriminant validity, and reliability of constructs of the hypothesized model of the study. DeVellis (1991) said that construct reliability is the proportion of variance attributable to the true score of the latent variable. The cut-off point of Cronbach’s Alpha .7 or higher is considered reliable for a construct (Zikmund, Babin, Carr, &Griffin, 2013, p. 302). (See Table 3: Cronbach’s Alpha coefficients of Pre-test).
Table 3: Cronbach’s Alpha coefficients from Pre-test
No Variable Amount of items
Cronbach’s Alpha Value
1 Market Orientation 10 .78 2 Learning Orientation 4 .76 3 Entrepreneurial Orientation 5 .75 4 Social Network Orientation 17 .85 5 Marketing Program Adaptation 10 .78 6 Local Integration 5 .75 7 Export Success 9 .82
A questionnaire containing export success of SMEs was administered to 30 successful SME Exporters form Yangon, Mandalay, and Monywa (See Appendix II for details of the criteria of SMEs in Myanmar and demographic of respondents). They were asked to fill out the questionnaires and requested to give suggestions on any item that could be ambiguous or hard to understand or difficult to answer. Based on their comments and suggestions, some items in the questionnaires were modified or eliminated or added (Lawshe, 1975).
The researcher conducted convergent and discriminant validity of the constructs, based on the responses collected, to check the usefulness of factors of the hypothesized model of the study. Convergent validity means that the items of a specific construct should converge or share a high proportion of variance in common. Discriminant validity provides the uniqueness of a construct compared to other constructs (Hair et al., 2010). To estimate the convergent validity among items measured, factor loadings, average variance extracted (AVE), and construct reliability are widely used. The researcher checked the factor loadings and AVEs of the constructs of the hypothesized model. The results of the pretest indicated that factors loadings of both lower order constructs such as MPA, LI, and ES and higher order construct (PLSNC) are well above the threshold level of .7, at p-value of .001 and the AVEs of constructs are also greater than the recommended level of .5 (Hair et al., 2010). There are three ways to test discriminant validity of constructs such as comparing the square root of average variance extracted (AVE) with the correlation between constructs, average variance

10
extracted (AVE) with maximum shared variance (MSV) , and average variance extracted (AVE) and average shared variance (ASV). The thresholds are that AVE should be higher than MSV and AVS. Similarly, the square root of AVE should be higher than inter-construct correlation. The researcher found out from the pretest that the square root of AVE of respective inter-constructs is higher than the correlation of inter-constructs of the hypothesized model of the study (Hair et al., 2010).
3.2 Data analysis In this study, descriptive statistics analysis was conducted to explain demographic data of respondents with frequency and proportion. Agreement level of constructs of the study was also examined. Confirmatory factor analysis and structural equation model were used to test model fit and relationships between dependent variables and independent variables of the study. All the hypotheses of the study were tested by SEM solution.
4. Results
Correlation analysis showed that all the variables are significantly correlated with each other. The correlation between higher order construct (PLSNC) and lower order constructs such as MO, LO, EO, and SNO are highly correlated compared to other lower constructs such as MPA, LI and ES. The correlation between SNO and PLSNC stood highest (.811**) among all the correlations and which means that social network orientation carries a lot of weight in PLSNC construct. Correlation matrix of all the constructs was summarized in the Table 4.1.
Table 4.1: Correlation Matrix MO LO EO SNO MPA LI ES PLSNC MO 1 LO .429** 1 EO .415** .577** 1 SNO .573** .488** .483** 1 MPA .470** .391** .371** .508** 1 LI .413** .322** .338** .461** .651** 1 ES .447** .358** .323** .464** .658** .563** 1 PLSNC .762** .792** .786** .811** .552** .487** .505** 1 Note1: **. Correlation is significant at the 0.01 level (2-tailed). Note2: MO = Market Orientation; LO = Learning Orientation; EO = Entrepreneurial Orientation; SNO = Social Network Orientation; MPA = Market Program Adaptation; LI = Local Integration; ES = Export Success; PLSNC= Proactive Learning and Social Network Culture.
4.1 Confirmatory factor analysis
AMOS text output provides absolute goodness-of-fit measures: The p-value of the Chi-square (Degrees of freedom= 879) is less than .001 and which means that it is statistically significant. The Goodness-of-Fit Index (GFI), Adjusted Goodness-of-Fit Index (AGFI), and the Comparative Fit index (CFI) stand at .900, .882, and .986, which show that the specified model fits well. The root mean square of approximation (RMSEA) is .023, which provides evidence of close fit of the model in relation to the degrees of freedom because RMSEA is less than .05. The Tucker Lewis Index (TLI) is .984, while CFI is .986. Both belong to incremental fit indices and their values are

11
well above the recommended threshold level of .90, which further supported the close fit of the model. The norm Chi-square (X2/df) has a value of 1.216. This fell within the recommended range of 3 to 1which indicated conditional support for model fit (Carmines and McIver, 1981, page 80).
In summary, the various indices of overall goodness-of-fit for the model provided sufficient support for the results to be accredited as an acceptable representation of the hypothesized constructs and the model as a whole. (See also the Table 4.2a below)
Table 4.2a: Model fit indices for confirmatory factor analysis FIT Index Acceptable threshold levels Value
X2 x² relative to df with p-value (<.05)
Chi-square = 1.477 p-value= >.001
GFI GFI is less than or equal to 1. A value of 1 indicates a perfect fit.
0.900
AGFI AGFI Values is less than or equal to 1. A value of 1 indicates a perfect fit. .882
CFI CFI is truncated to fall in the range from 0 to 1. CFI values close to 1 indicate a very good fit. .986
RMSEA Values < 0.05 .023 TLI range for TLI lies between zero and one .984
Source: (Hair et. al., 2010)
The measures such as Composite Reliability (CR), Average Variance Extracted (AVE), Maximum Shared Variance (MSV), and Average Shared Variance (ASV) are commonly used to establish validity and reliability of constructs of the specified model in respective study. The thresholds of these values are described in the following table 4.2b.
Table 4.2b: Thresholds of construct reliability and validity
Reliability CR > 0.7
Convergent Validity AVE > 0.5
Discriminant Validity MSV < AVE
ASV < AVE
Inter-construct correlation< Square root of AVE
Regarding convergent validity, there are three ways such as factor loadings, average variance extracted (AVE), and construct reliability (or) composite reliability (CR) to estimate the convergent validity among items measured (Hair et al., 2010).
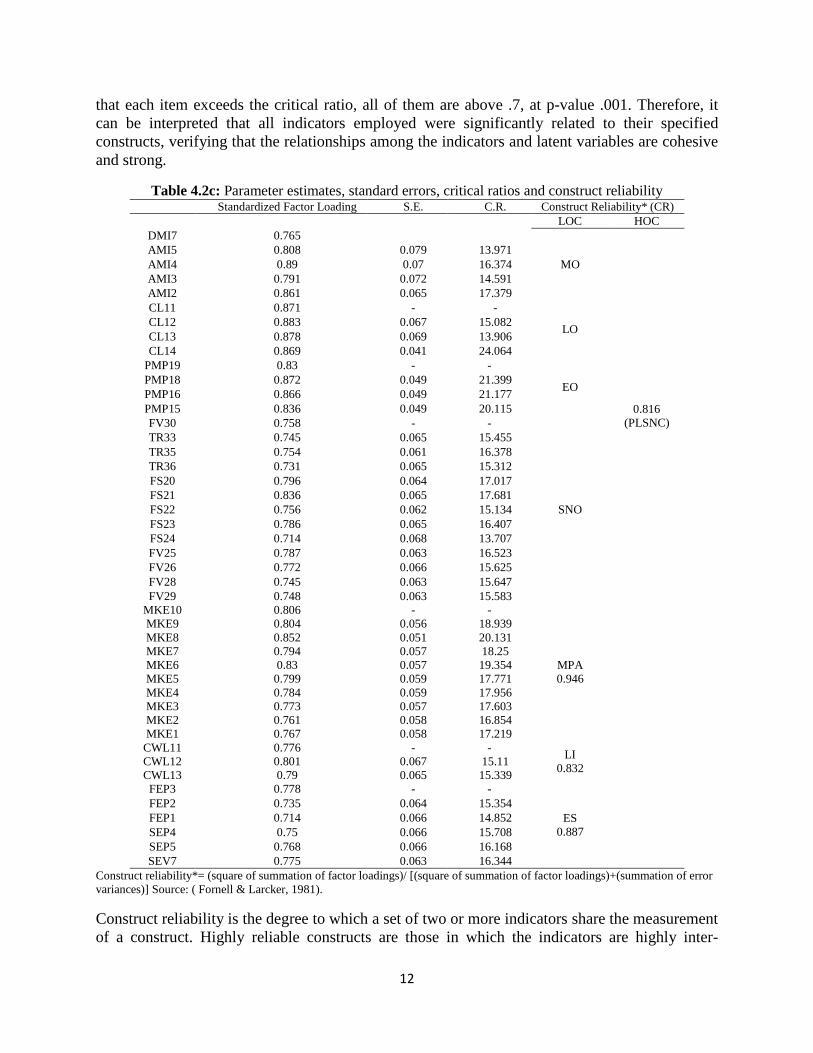
In the AMOS text output file, critical ratio (C.R.) represents the t-value, which is the parameter estimate divided by its standard error. Byrne (2001) mentioned that t-value greater than 1.96 or smaller than -1.96 implies statistical significance. The higher the factor loadings or coefficients compared to their standard errors, the stronger the evidence of relationship between the observed indicators to their respective latent factors (Koufteros, 1999). Table 4.2c, described below, shows
12
that each item exceeds the critical ratio, all of them are above .7, at p-value .001. Therefore, it can be interpreted that all indicators employed were significantly related to their specified constructs, verifying that the relationships among the indicators and latent variables are cohesive and strong.
Table 4.2c: Parameter estimates, standard errors, critical ratios and construct reliability Standardized Factor Loading S.E. C.R. Construct Reliability* (CR)
LOC HOC DMI7 0.765
MO
0.816 (PLSNC)
AMI5 0.808 0.079 13.971 AMI4 0.89 0.07 16.374 AMI3 0.791 0.072 14.591 AMI2 0.861 0.065 17.379 CL11 0.871 - -
LO CL12 0.883 0.067 15.082 CL13 0.878 0.069 13.906 CL14 0.869 0.041 24.064
PMP19 0.83 - -
EO PMP18 0.872 0.049 21.399 PMP16 0.866 0.049 21.177 PMP15 0.836 0.049 20.115 FV30 0.758 - -
SNO
TR33 0.745 0.065 15.455 TR35 0.754 0.061 16.378 TR36 0.731 0.065 15.312 FS20 0.796 0.064 17.017 FS21 0.836 0.065 17.681 FS22 0.756 0.062 15.134 FS23 0.786 0.065 16.407 FS24 0.714 0.068 13.707 FV25 0.787 0.063 16.523 FV26 0.772 0.066 15.625 FV28 0.745 0.063 15.647 FV29 0.748 0.063 15.583
MKE10 0.806 - -
MPA 0.946
MKE9 0.804 0.056 18.939 MKE8 0.852 0.051 20.131 MKE7 0.794 0.057 18.25 MKE6 0.83 0.057 19.354 MKE5 0.799 0.059 17.771 MKE4 0.784 0.059 17.956 MKE3 0.773 0.057 17.603 MKE2 0.761 0.058 16.854 MKE1 0.767 0.058 17.219
CWL11 0.776 - - LI 0.832 CWL12 0.801 0.067 15.11
CWL13 0.79 0.065 15.339 FEP3 0.778 - -
ES 0.887
FEP2 0.735 0.064 15.354 FEP1 0.714 0.066 14.852 SEP4 0.75 0.066 15.708 SEP5 0.768 0.066 16.168 SEV7 0.775 0.063 16.344
Construct reliability*= (square of summation of factor loadings)/ [(square of summation of factor loadings)+(summation of error variances)] Source: ( Fornell & Larcker, 1981).
Construct reliability is the degree to which a set of two or more indicators share the measurement of a construct. Highly reliable constructs are those in which the indicators are highly inter-
13
correlated, indicating that they are all measuring the same latent construct. The range of values for reliability is between 0 and 1. Computations for each construct are shown in the factor loadings table mentioned above. The results shown that the reliability values of the high order construct PLSNC and lower order constructs such as MPA, LI, and ES were above the recommended level of .70 (Hair et al., 2010).
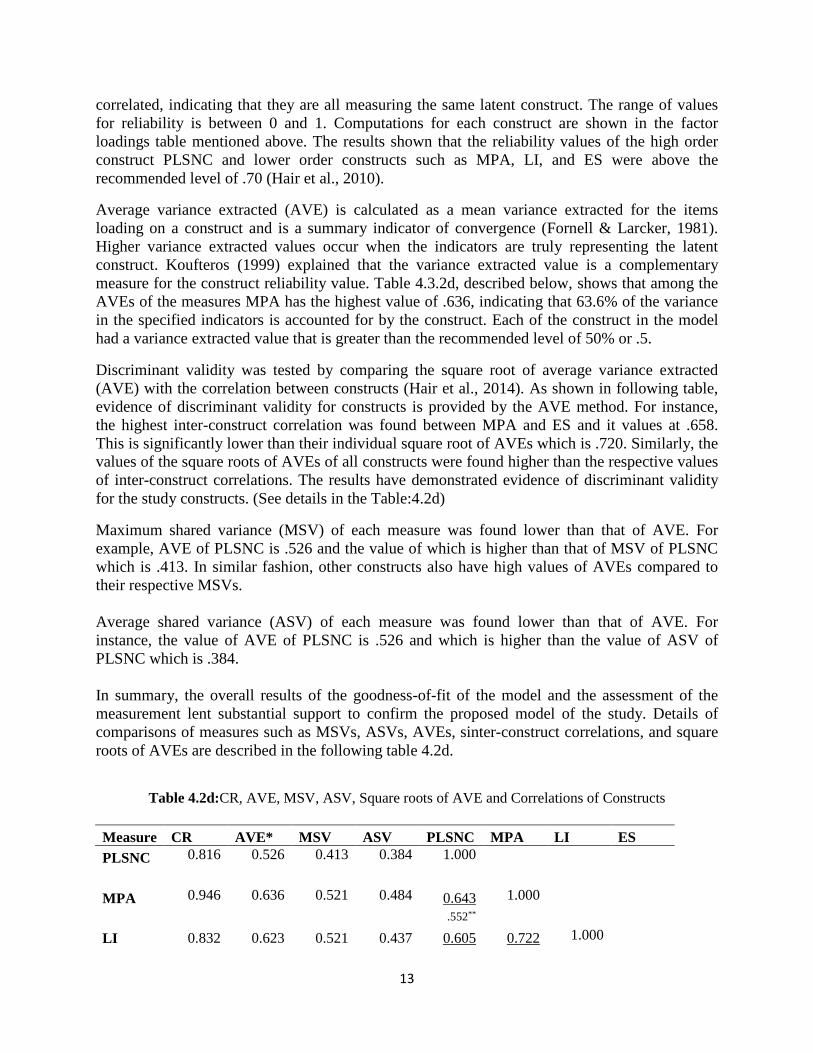
Average variance extracted (AVE) is calculated as a mean variance extracted for the items loading on a construct and is a summary indicator of convergence (Fornell & Larcker, 1981). Higher variance extracted values occur when the indicators are truly representing the latent construct. Koufteros (1999) explained that the variance extracted value is a complementary measure for the construct reliability value. Table 4.3.2d, described below, shows that among the AVEs of the measures MPA has the highest value of .636, indicating that 63.6% of the variance in the specified indicators is accounted for by the construct. Each of the construct in the model had a variance extracted value that is greater than the recommended level of 50% or .5.
Discriminant validity was tested by comparing the square root of average variance extracted (AVE) with the correlation between constructs (Hair et al., 2014). As shown in following table, evidence of discriminant validity for constructs is provided by the AVE method. For instance, the highest inter-construct correlation was found between MPA and ES and it values at .658. This is significantly lower than their individual square root of AVEs which is .720. Similarly, the values of the square roots of AVEs of all constructs were found higher than the respective values of inter-construct correlations. The results have demonstrated evidence of discriminant validity for the study constructs. (See details in the Table:4.2d)
Maximum shared variance (MSV) of each measure was found lower than that of AVE. For example, AVE of PLSNC is .526 and the value of which is higher than that of MSV of PLSNC which is .413. In similar fashion, other constructs also have high values of AVEs compared to their respective MSVs. Average shared variance (ASV) of each measure was found lower than that of AVE. For instance, the value of AVE of PLSNC is .526 and which is higher than the value of ASV of PLSNC which is .384. In summary, the overall results of the goodness-of-fit of the model and the assessment of the measurement lent substantial support to confirm the proposed model of the study. Details of comparisons of measures such as MSVs, ASVs, AVEs, sinter-construct correlations, and square roots of AVEs are described in the following table 4.2d.
Table 4.2d:CR, AVE, MSV, ASV, Square roots of AVE and Correlations of Constructs
Measure CR AVE* MSV ASV PLSNC MPA LI ES PLSNC 0.816 0.526 0.413 0.384 1.000
MPA 0.946 0.636 0.521 0.484 0.643 1.000
.552**
LI 0.832 0.623 0.521 0.437 0.605 0.722 1.000

14
.487** .651**
ES 0.887 0.568 0.518 0.438 0.611 0.720 0.650 1.000 .505** .658** .563**
*Average variance extracted (AVE) = (summation of squared factor loadings)/ [(summation of squared factor loadings) + (summation of error variances)] Source: (Fornell & Larcker, 1981). ** Correlations; ___ Square root of AVE
4.2 Model adjustment and Goodness of Fit approach
The assessments on GOF approach for Model fit regarding SEM path analysis was conducted. AMOS text output of specified SEM analysis of the conceptual framework of the study provided absolute goodness-of-fit measures: The p-value of the Chi-square (Degrees of freedom= 898) is at .025 meaning that it is statistically significant. The Goodness-of-Fit Index (GFI), Adjusted Goodness-of-Fit Index (AGFI), and the Comparative Fit index (CFI) stand at .907, .893, and .994, which show that the specified model fits well. The root mean square of approximation (RMSEA) is .015, which provides evidence of close fit of the model in relation to the degrees of freedom because RMSEA is less than .05. The Tucker Lewis Index (TLI) is .993, while CFI is .994. Both belong to incremental fit indices and their values are well above the recommended threshold level of .90, which further supported the close fit of the model. The norm Chi-square (X2/df) has a value of 1.094. This fell within the recommended range of 3 to 1 which indicated conditional support for model fit (Carmines and McIver, 1981, page 80).
In summary, the various indices of overall goodness-of-fit for the model provided sufficient support for the results to be accredited as an acceptable representation of the hypothesized constructs and the model as a whole. (See also the table 4.3 below)
Table 4.3:Model fit indices for SEM analysis FIT Index Acceptable threshold levels value
X2 x² relative to df with p-value (<.05)
Chi-square = 1.094 p-value= .025
GFI GFI is less than or equal to 1. A value of 1 indicates a perfect fit.
0.909
AGFI AGFI Values is less than or equal to 1. A value of 1 indicates a perfect fit.
.893
CFI CFI is truncated to fall in the range from 0 to 1. CFI values close to 1 indicate a very good fit.
.994
RMSEA Values < 0.05 .015 TLI range for TLI lies between zero and one .993
Source: (Hair et. al., 2010)
4.3 Hypothesis testing
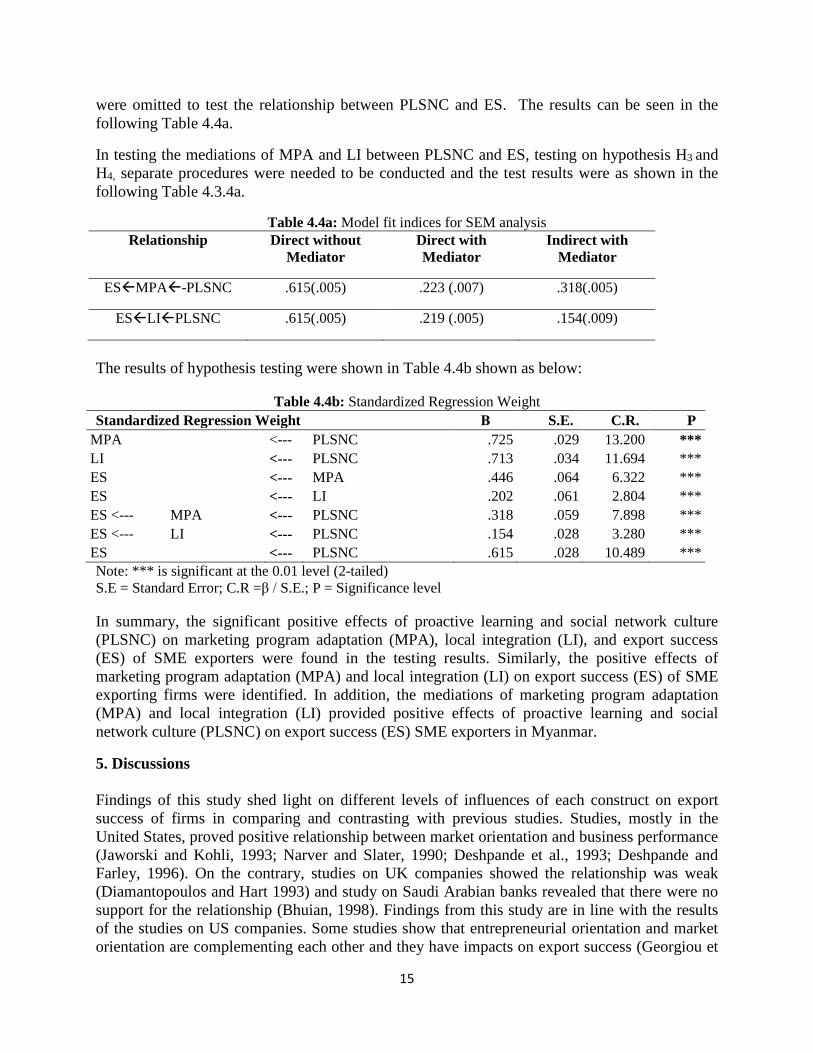
Most of the hypotheses, H1, H2, H3, and H4, were tested based on the specified model (See details of specified model and testings in the Appendix III). The results revealed strong support for the specified model relationship (See Table of standardized regression weights). However, regarding testing hypothesis H7, the direct effect of PLSNC on ES, mediating variables and theirs paths
15
were omitted to test the relationship between PLSNC and ES. The results can be seen in the following Table 4.4a.
In testing the mediations of MPA and LI between PLSNC and ES, testing on hypothesis H3 and H4, separate procedures were needed to be conducted and the test results were as shown in the following Table 4.3.4a.
Table 4.4a: Model fit indices for SEM analysis Relationship Direct without
Mediator Direct with Mediator
Indirect with Mediator
ESMPA-PLSNC .615(.005) .223 (.007) .318(.005)
ESLIPLSNC .615(.005) .219 (.005) .154(.009)
The results of hypothesis testing were shown in Table 4.4b shown as below:
Table 4.4b: Standardized Regression Weight Standardized Regression Weight Β S.E. C.R. P
MPA <--- PLSNC .725 .029 13.200 *** LI <--- PLSNC .713 .034 11.694 *** ES <--- MPA .446 .064 6.322 *** ES <--- LI .202 .061 2.804 *** ES <--- MPA <--- PLSNC .318 .059 7.898 *** ES <--- LI <--- PLSNC .154 .028 3.280 *** ES <--- PLSNC .615 .028 10.489 *** Note: *** is significant at the 0.01 level (2-tailed) S.E = Standard Error; C.R =β / S.E.; P = Significance level
In summary, the significant positive effects of proactive learning and social network culture (PLSNC) on marketing program adaptation (MPA), local integration (LI), and export success (ES) of SME exporters were found in the testing results. Similarly, the positive effects of marketing program adaptation (MPA) and local integration (LI) on export success (ES) of SME exporting firms were identified. In addition, the mediations of marketing program adaptation (MPA) and local integration (LI) provided positive effects of proactive learning and social network culture (PLSNC) on export success (ES) SME exporters in Myanmar.
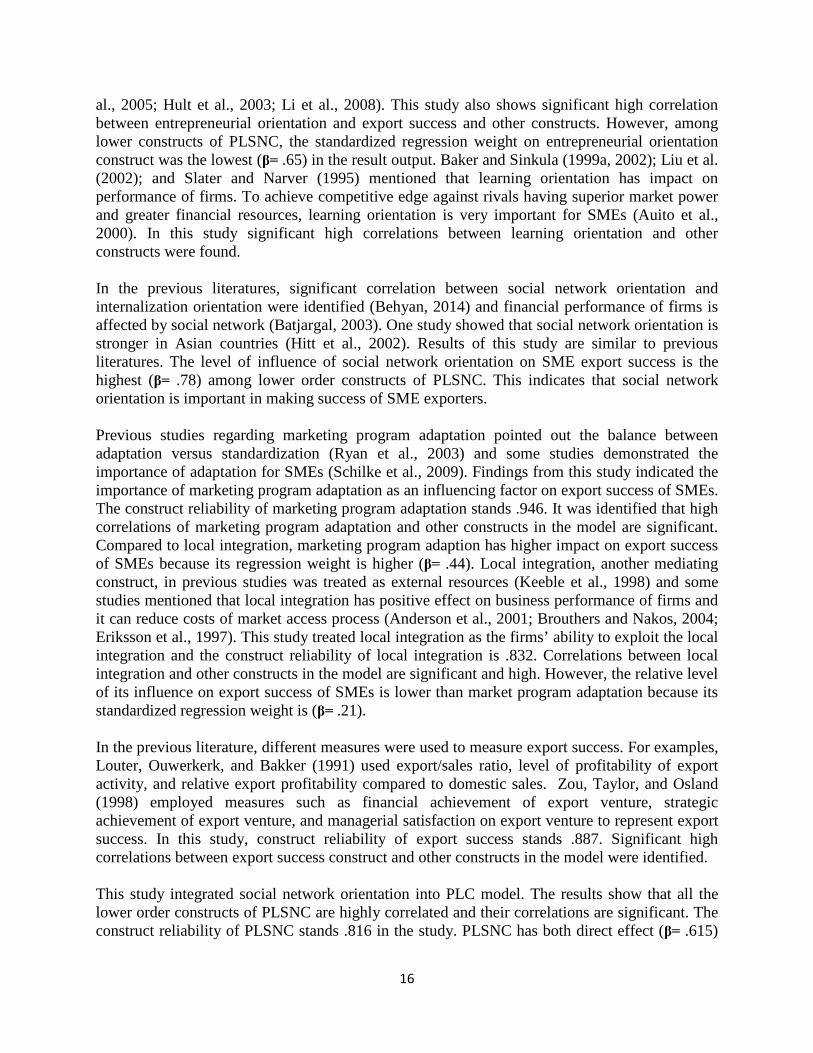
5. Discussions Findings of this study shed light on different levels of influences of each construct on export success of firms in comparing and contrasting with previous studies. Studies, mostly in the United States, proved positive relationship between market orientation and business performance (Jaworski and Kohli, 1993; Narver and Slater, 1990; Deshpande et al., 1993; Deshpande and Farley, 1996). On the contrary, studies on UK companies showed the relationship was weak (Diamantopoulos and Hart 1993) and study on Saudi Arabian banks revealed that there were no support for the relationship (Bhuian, 1998). Findings from this study are in line with the results of the studies on US companies. Some studies show that entrepreneurial orientation and market orientation are complementing each other and they have impacts on export success (Georgiou et
16
al., 2005; Hult et al., 2003; Li et al., 2008). This study also shows significant high correlation between entrepreneurial orientation and export success and other constructs. However, among lower constructs of PLSNC, the standardized regression weight on entrepreneurial orientation construct was the lowest (β= .65) in the result output. Baker and Sinkula (1999a, 2002); Liu et al. (2002); and Slater and Narver (1995) mentioned that learning orientation has impact on performance of firms. To achieve competitive edge against rivals having superior market power and greater financial resources, learning orientation is very important for SMEs (Auito et al., 2000). In this study significant high correlations between learning orientation and other constructs were found. In the previous literatures, significant correlation between social network orientation and internalization orientation were identified (Behyan, 2014) and financial performance of firms is affected by social network (Batjargal, 2003). One study showed that social network orientation is stronger in Asian countries (Hitt et al., 2002). Results of this study are similar to previous literatures. The level of influence of social network orientation on SME export success is the highest (β= .78) among lower order constructs of PLSNC. This indicates that social network orientation is important in making success of SME exporters. Previous studies regarding marketing program adaptation pointed out the balance between adaptation versus standardization (Ryan et al., 2003) and some studies demonstrated the importance of adaptation for SMEs (Schilke et al., 2009). Findings from this study indicated the importance of marketing program adaptation as an influencing factor on export success of SMEs. The construct reliability of marketing program adaptation stands .946. It was identified that high correlations of marketing program adaptation and other constructs in the model are significant. Compared to local integration, marketing program adaption has higher impact on export success of SMEs because its regression weight is higher (β= .44). Local integration, another mediating construct, in previous studies was treated as external resources (Keeble et al., 1998) and some studies mentioned that local integration has positive effect on business performance of firms and it can reduce costs of market access process (Anderson et al., 2001; Brouthers and Nakos, 2004; Eriksson et al., 1997). This study treated local integration as the firms’ ability to exploit the local integration and the construct reliability of local integration is .832. Correlations between local integration and other constructs in the model are significant and high. However, the relative level of its influence on export success of SMEs is lower than market program adaptation because its standardized regression weight is (β= .21). In the previous literature, different measures were used to measure export success. For examples, Louter, Ouwerkerk, and Bakker (1991) used export/sales ratio, level of profitability of export activity, and relative export profitability compared to domestic sales. Zou, Taylor, and Osland (1998) employed measures such as financial achievement of export venture, strategic achievement of export venture, and managerial satisfaction on export venture to represent export success. In this study, construct reliability of export success stands .887. Significant high correlations between export success construct and other constructs in the model were identified. This study integrated social network orientation into PLC model. The results show that all the lower order constructs of PLSNC are highly correlated and their correlations are significant. The construct reliability of PLSNC stands .816 in the study. PLSNC has both direct effect (β= .615)
17
on export success and indirect effect (β= .21) on export success mediated by marketing program adaptation and local integration. The standardized regression weights of the lower order constructs of PLSNC stands MO (β= .72), LO (β= .66), EO (β= .65), and SNO (β= .78). This shows that social network orientation has the highest level of influence on export success. Additionally, this evidence, standardized regression weight, proved that PLSNC construct is well suited to measure export success of SME exporters. SMEs export success has been associated with market orientation, learning orientation, and entrepreneurial orientation to understand the effects of dynamic capability of firms on export success. Some scholars hypothesized higher order construct like proactive learning culture (PLC) and tested the relationship between PLC and export success (Gnizy, Baker,& Grinstein, 2014). There were studies focused on relationship between social network orientation and export success. Each pervious research has its own merits and contributions. However, they left rooms to be explored or for improvement. This study filled those gaps by integrating social network orientation into PLC model and PLSNC was proven to be a well suited model for measuring export success of SMEs. In addition, Model Fit Indices of both confirmatory factory analysis and SEM analysis showed that the model is a robust one.
6. Contributions and Limitations of the study As an extended model of PLC (Gnizy, Baker, & Grinstein, 2014), social network orientation was incorporated into PLSNC model to measure success of SME firms. The results revealed that the effect of SNO on export success is very significant because its standardized regression weight on PLSNC construct was the highest compared to other lower order constructs such as MO, LO, and EO. Although SNO and its relationship with export success can be found in previous studies (Behyan, 2014; Batjargal, 2003), the inclusion of it in PLC model had not been done by other scholars yet and this study filled that gap. Findings of the study provide enough evidence to deem PLSNC model as a robust model to measure the success factors of the export success of SME firms especially in Myanmar. Revealing positive significant effect of social network orientation on export success of SMEs is one of the major contributions of the study. Although similar studies had been done by other scholars previously in other regions, findings of this study provided further confirmation on the already existed theory and literature. The last theoretical contribution of the study is that the findings of the study reflect the perceptions of successful SME exporters in Myanmar. Export success literature about Myanmar was rarely known to most of the people and some even think that those are almost non-existent. This given situation allows the study to be perceived as a pioneer in investigating success factors influencing SME exporters in Myanmar. The results of study can be helpful in making assessment, with PLSNC model, for the SME exporters to predict their performance in export venture. For example, lower order constructs of the PLSNC model and PLSNC model itself can be employed as success factors influencing export success of SME exporters. Consequently, SME exporters can make improvements on their market orientation, learning orientation, entrepreneurial orientation, social network
18
orientation, and proactive learning & social network orientation for better performance of their export ventures. Policy makers can learn from the findings that learning orientation and entrepreneurial orientation of the SME exporters are relatively weak. The possible reason is that small firms can not absorb financial failure in taking risk and can not rely on public support programs to promote trade and trade finance. Consequently, they can not pursue profitable business opportunities and learning opportunities because of risk avoidance. Three are some limitations of the study. The study only focused on SME exporters operating in Yangon, Mandalay, Muse, and Monywa. Criticisms may arise because of limited regional coverage of the study. For example, the places like Myawaddy city bordering with Thailand and Tamu city which is quite close to India should be included in the study to gain a better balanced perspective. On the contrary, some might point out that the scope of the study is broad and it might not get results which can provide specific nature of success of SME exporters. Another issue is that the study was based on SME exporters from a range of sectors and which might yield the general results but focusing on specific industry could yield different results. The research could not be based on financial data of the respondents because most business people want to keep their financial details secret and there is no financial database of firms. The questionnaire of the study mostly derived from previous related literature about SME export success in other countries (Maldifassi, J. O. and Caorsi, J.C., 2014). If questionnaire development was based on exploratory study of SME export success with the focus on Myanmar and exploratory factor analysis were conducted, the results could be different. Lack of or unavailability of previous literature focusing on SME export success of Myanmar also made the model and the results of the testing difficult to compare and contrast with other studies. However, the results of analysis brought by the study can be instrumental for future research and it can be deemed as a frontier.
7. Recommendations for the future research There are two main approaches to recommend for future research. In the first approach, several of modifications on specified model in the study can be made to investigate key factors of SME export success. One way is narrowing down the scope of the study by focusing on one sector or location and conducting analysis with the model used in this study. The results could be more specific and control variables such as age of the firm, location of the firm, size of the firm, and product differentiation can be applied in doing analysis. In the second approach, aspects such as inclusion of external factors in the model, exploring public support programs and export success of SMEs in Myanmar, and trade barriers for SME exporters can be good research directions. Effectiveness of public support programs for facilitating trade and finance, role of chambers of commerce, and macroeconomic conditions of the country can be assessed to know whether they have effect on export success (ES) of SMEs. If both internal and external factors are incorporated to specify a model, the results would reflect a comprehensive view on export success (ES) of SMEs. Research focusing on public support programs for facilitating trade & finance and their impacts on export success (ES) of SMEs had been previously conducted by other scholars. Similar
19
studies in Myanmar should be done because the literature related to Myanmar focus is rarely found. Another focus of SME export success would be investigating trade barriers for SME exporters. Understanding trade barriers for SME exporters would be helpful for policy makers and business people. Especially, people from developing countries need to have statistical indications of ways to improve policies and practices in promoting trade.
References Ahmed, F. (2010).The role of interpersonal and firm factors in international business
relationships.Asian Academy of Management Journal, 15(1), 45-62. Akiko, M. (1996).Asl and Wasta: trends in Anglo-American anthropology on Syria and
Lebanon. Annals of Japan Association for Middle East Studies, 11, 131-159. Alvarez, R. (2004). Sources of export success in small- and medium-sized enterprises: the
impact of public programs. International Business Review. doi:10.1016/j.ibusrev.2004.01.002
Anderson, U., Forsgren, M., & Pedersen, T. (2001). Subsidiary performance in multinational corporations: the importance of technology embeddedness. International Business Review, 10(1), 3-23.
Atuahene-Gima, K., & Ko, A. (2001). An empirical investigation of the effect of market orientation and entrepreneurship orientation alignment on product innovation. Organization Science, 12(1), 54-74.
Auito, E., Sapienza, H., & Almeida, J. Y. (2000).Effects of age at entry, knowledge intensity, and imitability on international growth. Academy of Management Journal, 43(5), 909-924.
Baker, W., & Sinkula, J. (1999a).The synergistic effect of market orientation and learning orientation on organizational performance. Journal of the Academy of Marketing Science, 27(4), 411-427.
Baker, W., & Sinkula, J. (1999b).Learning orientation, market orientation and innovation: integrating and extending models of organizational performance, Journal of Market-Focused Management, 4(4), 295-308.
Baker, W., & Sinkula, J. (2002). Market orientation, learning orientation and product innovation: delving into the organization’s black box, Journal of Market-Focused Management, 5(1), 5-23.
Batjargal, B. (2003). Social Capital and Entrepreneurial Performance in Russia: A Longitudinal Study. Organization Studies.doi:10.1177/0170840603024004002
Behyan M (2014). Analyzing Correlation between Internationalization Orientation and Social Network .International Economic Studies, 43 (2), 47-56.
Bhuian, S. N. (1998). An Empirical Examination of Market Orientation in Saudi Arabian Manufacturing Companies.Journal of Business Research.doi:10.1016/S0148-2963(97)00130-6
20
Brouthers, K. D., & Nakos, G. (2004). SMEs entry mode choice and performance: a transaction cost perspective. Entrepreneurship Theory and Practice, 2(3), 229-247.
Buttery, A. E. & Wong, Y.H. (1999). The Development of a Guanxi Framework. Marketing Intelligence & Planning,17(3), 147-154.
Calantone, R., Cavusgil, T., Schmidt, J., & Shin, G. C. (2004). Internationalization and the dynamic of product adaptation: an empirical investigation. Journal of Product Innovation Management, 21(3), 185-198.
Carmines, E. G., and J. P. McIver, 1981. Analyzing Models with Unobserved Variable: Analysis of Covariannce structures. In G. W. Bohrnstedt and E. F. Borgotta (eds.), Social Measurements: Current Issues. Beverly Hill, CA:Sage, 65-115
Cavusgil, S. T. (1998). Executive insights: international partnering- a systematic framework for collaborating with foreign business partners. Journal of International Marketing, 6(1), 91-107.
Covin, J. G., & Miles, P. M. (1999).Corporate entrepreneurship and the pursuit of competitive advantage.Entrepreneurship Theory and Practice, 23(3), 47-63.
Cunningham, R. B.,& Sarayrah, Y. K. (1994).Taming Wasta to achieve development, Bnet Research Center.Arab Studies Quarterly, ASQ, 16(3), 29-39.
Davies, H., Leung, T. K., Luk, S. T., & Wong, Y. (1995). The benefits of “Guanxi”: The value of relationships in developing the Chinese market. Industrial Marketing Management. doi:10.1016/0019-8501(94)00079-C
Deshpande, S. P. (1996). Ethical climate and the link between success and ethical behavior: An empirical investigation of a non-profit organization. Journal of Business Ethics.doi:10.1007/BF00382957
Deshpandè, R., Farley, J. U., & Webster, F. E. (1993). Corporate Cultures, Customer Orientation, and Innovativeness in Japanese Firms: A Quadrad Analysis.
Deshpande, R. & Farley, J. U. (1996). Understanding market orientation: A prospectively designed meta-analysis of three market orientation scales. Marketing Science Institute. Report No. 96-125, Cambridge. Massachusetts.
DeVellis, R. F. (1991). Scale Development: theory and applications. Newbury Park, UK: Sage Publications, Inc.
Diamantopoulos, A., & Hart, S. (1993). Linking market orientation and company performance: preliminary evidence on Kohli and Jaworski'sframework. Journal of Strategic Marketing.1(2) doi:10.1080/09652549300000007
Dow, D. (2006). Adaptation and performance in foreign markets: evidence of systematic under-adaptation. Journal of International Business Studies.37(2), 212-226 doi:8400189
Ellis, P. (2000). Social Ties and Foreign Market Entry.Journal of International Business Studies. doi:10.1057/palgrave.jibs.8490916
Eriksson, K., Johanson, J., Majkgard, A., & Sharma, D. (1997). Experiential know ledge and cost in the international process. Journal of International Business Studies, 28(2), 337-360.
Fornell, C., Larcker, D.F., (1981). Evaluating structural equation models with unobservable variables and measurement error. Journal of Marketing Research, 18 (1), 39-50
Georgiou, M., Freeman, S., & Edwards, R. (2005). International entrepreneurship: antecedents and outcome. Working paper No.69/05, November, Department of Management, Monash University, Victoria.

21
Gnizy, I., Baker, W. E., & Grinstein, A. (2014). Proactive learning culture: a dynamic capability and key success factor for SMEs entering foreign markets. International marketing review, 31(5), 477-505.
Granovetter, M. (1990). The Old and the New Economic Sociology: A History and an Agenda, In R. Friedland& A. Robertson (Eds) Beyond the market place: rethinking economy and society, New York: Walter de Guyer ,89-112.
Hair, J. F. et al., (2010). Multivariate data analysis: A global perspective. Upper Saddle River, NJ: Pearson Education.
Hair, J. F. et al., (2014). A primer on partial least squares structural equations modeling (PLS-SEM). Los Angeles: SAGE.
Hitt, M. A., Dacin, M. T., Levitas, E., Arregle, J. L., & Borza, A. (2000). Partner selection in emerging and developed market contexts: Resource-based and organizational learning perspectives. Academy of Management journal, 43(3), 449-467
Holmlund, M., & Kock, S. (1998). Relationships and the internationalization of the Finnish Small and Medium-Sized companies. International Small Business Journal, 16(4), 46-64.
Hult, G. T., Snow, C. C., & Kandemir, D. (2003).The Role of Entrepreneurship in Building Cultural Competitiveness in Different Organizational Types. Journal of Management.doi:10.1016/S0149-2063_03_00017-5
Hutchings, K., & Weir, D. (2006). Understanding networking in China and the Arab World : Lessons for international managers. Journal of European Industrial Training.doi:10.1108/03090590610673641
Javalgi, Raj. G., Todd, P., and Granot, E. (2011). The internationalization of Indian SMEs in B-to-B markets.Journal of Business & Industrial Marketing.26(7), 542-548. doi:10.1108/08858621111162343
Jaworski, B. J., & Kohli, A. K. (1993). Marketing orientation: antecedents and consequences. Journal of Marketing ,57 (3), pp. 53-70.
Jodie, R., & Gorill, M. A. (2007).Doing business in Libya, Libyan social and business culture, Communic Aid Group Ltd.CIA World Fact-book.
Kagami, Y. (2006). In Search of Alliance Capability │ As Conditions Facilitating Knowledge Creation in Creative Industry.Keio Communication Review, 28, 87-105
Kale, P., Singh, H., & Perlmutter, H. (2000). Learning and protection of proprietary assets in strategic alliances: building relational capital. Strategic Management Journal.doi:10.1002/(SICI)1097-0266(200003)21:3<217::AID-SMJ95>3.3.CO;2-P
Keeble, D., Lawson, C., Smith, H. L., Moore, B., & Wilkinson, F. (1998). Internationalisation process, networking and local embeddeness in technology-intensive small firms.Small Business Economics, 11(4), 327-342.
Keskin, H. (2006). Learning orientation, and innovation capabilities in SMEs: an extended model.European Journal of Innovation Management, 9(4), 396-417.
Kohli, A., Jaworski, B., & Kumar, A. (1993). MARKOR: a measure of market orientation. Journal of Marketing Research, 30(4), 467-477.
Koufteros, X.A. (1999). Testing a model of pull production: a paradigm for manufacturing research using structural equal modeling. Journal of Operations Management, 17.
Lages, L. F., & Lages, C. R. (2004). The STEP Scale: A Measure of Short-Term Export Performance Improvement. Journal of International Marketing. doi:10.1509/jimk.12.1.36.25647
22
Leung, T. K., & Wong, Y. H. (2001).The ethics and positioning of guanxi in China.Marketing Intelligence & Planning.doi:10.1108/02634500110363826
Li, Y., Huang, J., Liu, Y., and Tsai, M. (2008). Moderating effects of entrepreneurial orientation on market orientation-performance linkage: evidence form Chinese small firms.Journal of Small Business Management, 46(1), 113-133.
Liu, S., Luo, X., & Shi, Y. Z. (2002). Integrating customer orientation, corporate entrepreneurship, and learning orientation in organization-in-transition: an empirical study. International Journal of Research in Marketing, 19(4), 367-382.
Louter, P. J., Ouwerkerk, C., & Bakker, B. A. (1991). An Inquiry into Successful Exporting.European Journal of Marketing.doi:10.1108/03090569110001429
Lumpkin, G.T., & Dess, G.G. (1996). Clarifying the entrepreneurial orientation construct and linking it to performance. Academy of Management Review, 21(1), 135-172
Makrini, H. E. (2014). How does management perceive export success? An empirical study of Moroccan SMES. Business Process Management Journal, 21(1), 126-151.
Maldifassi, J. O. and Caorsi, J.C. (2014), “ Export success factors of small- and medium sized firms in Chile”, Journal of Small Business and Enterprise Development, Vol. 21 Iss 3 pp. 450-469.
Matsuno, K., Mentzer, J., & Ozsomer, A. (2002).The effects of entrepreneurial proclivity and market orientation on business performance.Journal of Marketing, 66(3), 18-34.
Miller, D. (1983). The Correlates of Entrepreneurship in Three Types of Firms.Management Science. doi:10.1287/mnsc.29.7.770
Muna, F. (1980). The Arab executive.St Martin's, New York, NY. Narayan-parker, D. et al. (2000). Crying out for change : voices of the poor. National economic
action council, (2004) .Available from: http://www.arab-hdr.org/publications/other/undp/hdr/2004/jordan-e.pdf.
Narver, J. C., & Slater, S. (1990). The effect of market orientation on business profitability.Journal of Marketing, 54(4), 20-35.
Pablos, P. O. (2005). Western and Eastern views on social networks. The Learning Organization.doi:10.1108/09696470510611393
Phan, M., Styles, C., Patterson, P. 2005, “Relational competency’s role in Southeast Asia business partnerships”, Journal of Business Research, 58, 173-184.
Park, S. H., & Luo, Y. (2001). Guanxi and organizational dynamics: organizational networking in Chinese firms. Strategic Management Journal. doi:10.1002/smj.167
Rauch, A. W., Frese, M., & Lumpkin, T. G. (2009). Entrepreneurial orientation and business performance: an assessment of past research and suggestions for the future. Entrepreneurship Theory and Practice, 33(3), 761-787.
Ramasamy, B., Goh, K. W., & Yeung, M. C. (2006). Is Guanxi (relationship) a bridge to Knowledge transfer?. Journal of Business Research. doi:10.1016/j.jbusres.2005.04.001
Ring, P. S., & Ven, A. H. (1992). Structuring cooperative relationships between organizations. Strategic Management Journal. doi:10.1002/smj.4250130702
Rock, J. T., & Ahmed, S. A. (2008). Relationship Between Success Factors and Chilean Firms' Export Performance: An Exploratory Study. Latin American Business Review.doi:10.1080/10978520802205686
Ruzzier, M., Hisrich, R. D., & Antoncic, B. (2006). SME internationalization research: past, present, and future. Journal of Small Business and Enterprise Development.doi:10.1108/14626000610705705
23
Ryans, J., Griffith, D., & White, S. (2003). Standardization/adaptation of international marketing strategy: necessary conditions for advancement of knowledge. International Marketing Review, 20(6), 588-603.
Sawalha, F. (2002) “Study says ' wasta'difficult to stamp out when advocates remain in power”, Jordan Times. April 1, 2002.
Schilke, O., Reimann, M., & Thomas, J. S. (2009). When does international marketing standardization matter to firm performance? Journal of International Marketing, 17(4), 24-46.
Shoham, A. (1999). Bounded rationality, planning, standardization of international strategy, and export performance: a structural model examination.Journal of International Marketing, 7(2), 24-50.
Slater, S., & Narver, J. (1995).Market orientation and the learning organization.Journal of Marketing, 59(3), 63-74.
Wu, W. (2008). Dimensions of Social Capital and Firm Competitiveness Improvement: The Mediating Role of Information Sharing. Journal of Management Studies. doi:10.1111/j.1467-6486.2007.00741.x
Zhou, K. Z., Brown, J. R., Dev, C. S., & Agarwal, S. (2007). The effects of customer and competitor orientations on performance in global markets: a contingency analysis. Journal of International Business Studies.doi:8400259
Zikmund, W. G., Babin, B. J., Carr, J. C., & Griffin, M. (2013).Sampling Designs and Sampling Procedures. In Business research methods (9th ed., pp. 394-395). Singapore: Australia South-Western [2013].
Zou, S., Taylor, C. R. and Osland, G.E., (1998). The EXPERF Scale: A Cross-National Generalized Export Performance Measure. Journal of International Marketing. 6(3), 37-58.
24
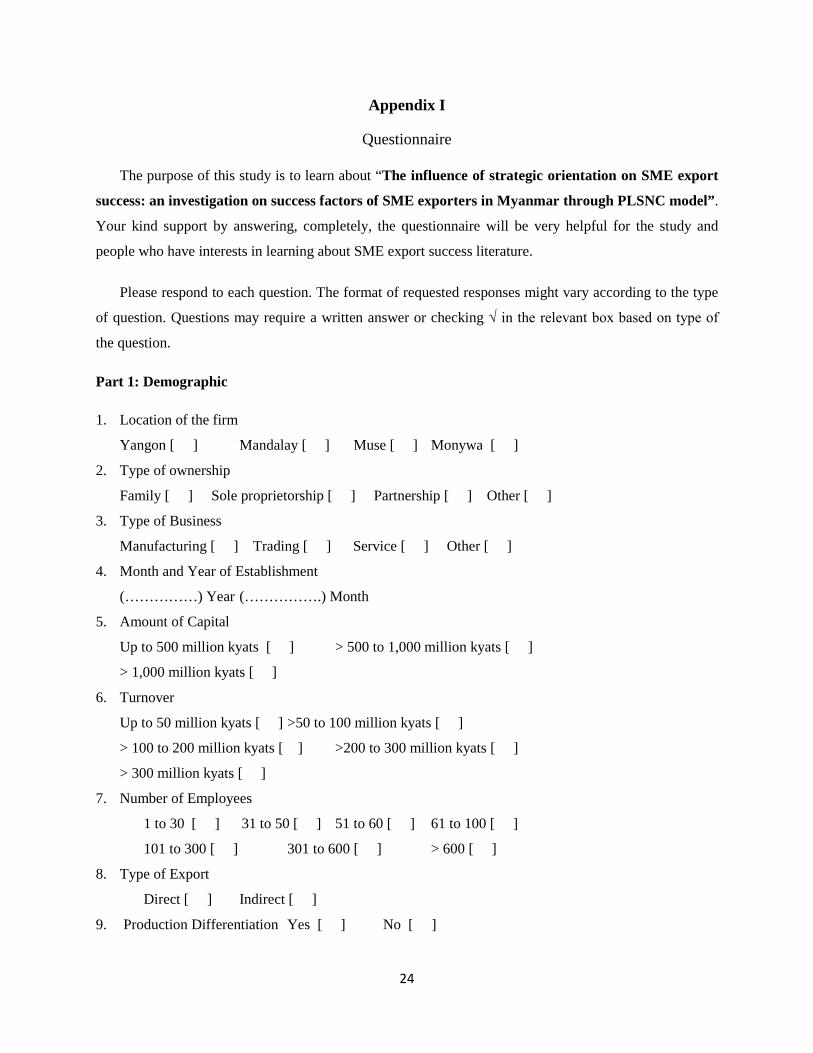
Appendix I
Questionnaire
The purpose of this study is to learn about “The influence of strategic orientation on SME export
success: an investigation on success factors of SME exporters in Myanmar through PLSNC model”.
Your kind support by answering, completely, the questionnaire will be very helpful for the study and
people who have interests in learning about SME export success literature.
Please respond to each question. The format of requested responses might vary according to the type
of question. Questions may require a written answer or checking √ in the relevant box based on type of
the question.
Part 1: Demographic
1. Location of the firm
Yangon [ ] Mandalay [ ] Muse [ ] Monywa [ ]
2. Type of ownership
Family [ ] Sole proprietorship [ ] Partnership [ ] Other [ ]
3. Type of Business
Manufacturing [ ] Trading [ ] Service [ ] Other [ ]
4. Month and Year of Establishment
(……………) Year (…………….) Month
5. Amount of Capital
Up to 500 million kyats [ ] > 500 to 1,000 million kyats [ ]
> 1,000 million kyats [ ]
6. Turnover
Up to 50 million kyats [ ] >50 to 100 million kyats [ ]
> 100 to 200 million kyats [ ] >200 to 300 million kyats [ ]
> 300 million kyats [ ]
7. Number of Employees
1 to 30 [ ] 31 to 50 [ ] 51 to 60 [ ] 61 to 100 [ ]
101 to 300 [ ] 301 to 600 [ ] > 600 [ ]
8. Type of Export
Direct [ ] Indirect [ ]
9. Production Differentiation Yes [ ] No [ ]

25
10. Name/s of Commodities exported ………………………………………………………..
11. Type of Respondents Owner [ ] Manager/ In charge [ ]
From the part 2 through part 4, please indicate your perception level as a scale ranging from 1 to 5, in which by checking √ in the box. Each statement is measured by using a 5-point Likert scale: 1=strongly disagree; 2=disagree; 3= neutral; 4= agree; 5=strongly agree.
Part 2: Proactive Learning and Social Network Culture (PLSNC)
Dimension Statement (item) 1 2 3 4 5
Acquisition of market information
1. We regularly conduct research with our customers to assess the performance of our products and services.
2. Intelligence on our competitors is frequently collected.
3. Intelligence on our distribution network is frequently collected.
4. We frequently review the likely effect of changes in our business environment (e.g. regulation, technology) on customers.
5. We frequently collect and evaluate general macroeconomic information (e.g. interest rates, exchange rates, GDP, industry growth rate, inflation).
Dissemination of market information
6. Marketing personnel in our firm/business unit frequently spend time discussing customers and preferences with other functional departments.
7. Our firm/business unit frequently circulates information about our markets and customers (e.g. reports, memos, newsletters).
8. We frequently have cross-functional meetings to discuss market trends and developments (e.g. customers, competitors, suppliers).
9. We frequently have interdepartmental meetings to update our knowledge of the business environment (e.g. regulation, economic trends).
10. New customer or market information usually disseminates quickly throughout are firm/business unit.
Continuous learning
11. Our basic values include learning as a key to improvement.
12. The collective wisdom in this enterprise is that once we quit learning we endanger our future.
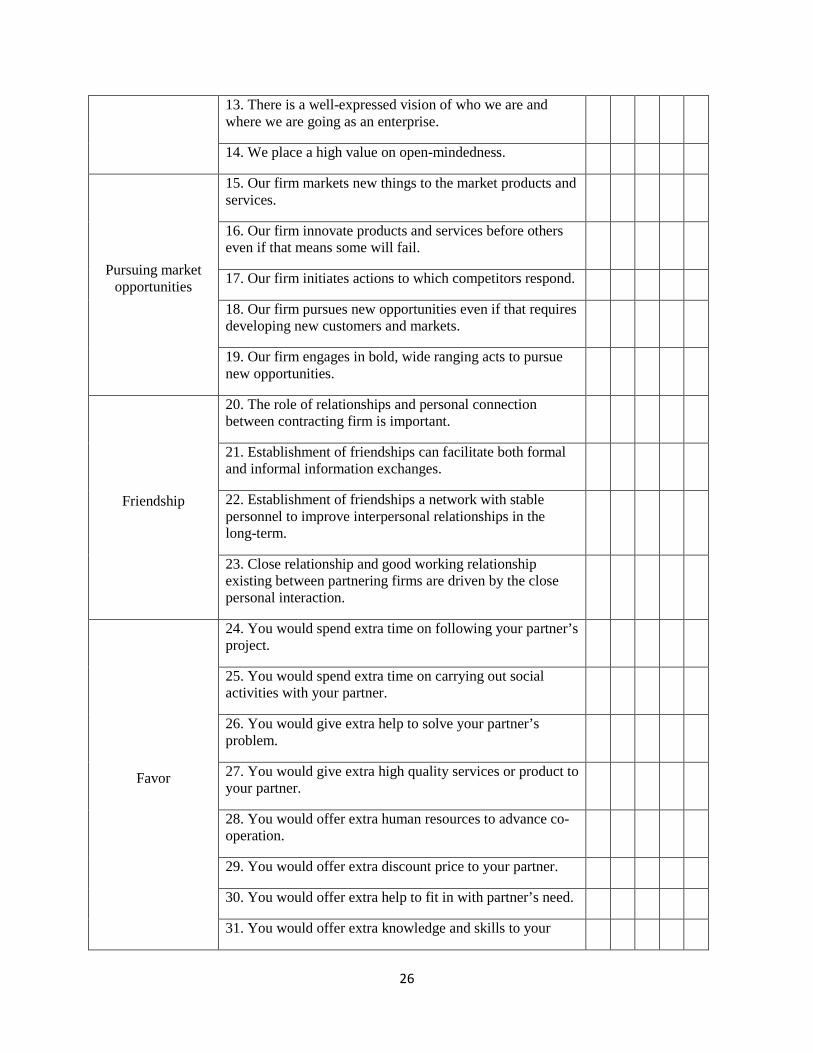
26
13. There is a well-expressed vision of who we are and where we are going as an enterprise.
14. We place a high value on open-mindedness.
Pursuing market opportunities
15. Our firm markets new things to the market products and services.
16. Our firm innovate products and services before others even if that means some will fail.
17. Our firm initiates actions to which competitors respond.
18. Our firm pursues new opportunities even if that requires developing new customers and markets.
19. Our firm engages in bold, wide ranging acts to pursue new opportunities.
Friendship
20. The role of relationships and personal connection between contracting firm is important.
21. Establishment of friendships can facilitate both formal and informal information exchanges.
22. Establishment of friendships a network with stable personnel to improve interpersonal relationships in the long-term.
23. Close relationship and good working relationship existing between partnering firms are driven by the close personal interaction.
Favor
24. You would spend extra time on following your partner’s project.
25. You would spend extra time on carrying out social activities with your partner.
26. You would give extra help to solve your partner’s problem.
27. You would give extra high quality services or product to your partner.
28. You would offer extra human resources to advance co-operation.
29. You would offer extra discount price to your partner.
30. You would offer extra help to fit in with partner’s need.
31. You would offer extra knowledge and skills to your

27
partner.
Trust
32. Our business partners are frank in dealing with us.
33. Promises made by our business partners are reliable.
34. Our business partners are knowledgeable about the products.
35. Our firm believes in the information our business partners provide us.
Part 3: Firm Behaviors (Mediating Variables)
Dimension Statement (item) 1 2 3 4 5
Marketing Effort
1. We make adaptation of our size of product/ line of service to the marketing program.
2. We make adaptation of our product/ process design to the marketing program.
3. We make adaptation of our product positioning to the marketing program.
4. We make adaptation of our brand name and/or packaging to the marketing program.
5. We make adaptation of our price of product/ line of service to the marketing program.
6. We make adaptation of our advertising and/or sales promotion to the marketing program.
7. We make adaptation of our sales force structure and management to the marketing program.
8. We make adaptation of our upstream supply chain (parts/process suppliers) to the marketing program.
9. We make adaptation of our downstream supply chain (wholesalers, retailers) the marketing program.
10. We make adaptation of our customer service to the marketing program.
Connecting with local
11. We rely on using or establishing local production facilities.
12. We rely on local distributors.
13. We rely on local suppliers.
28
14. We rely on a local sales force
15. We rely on local marketing support services (advertising, sales promotion, public relations)
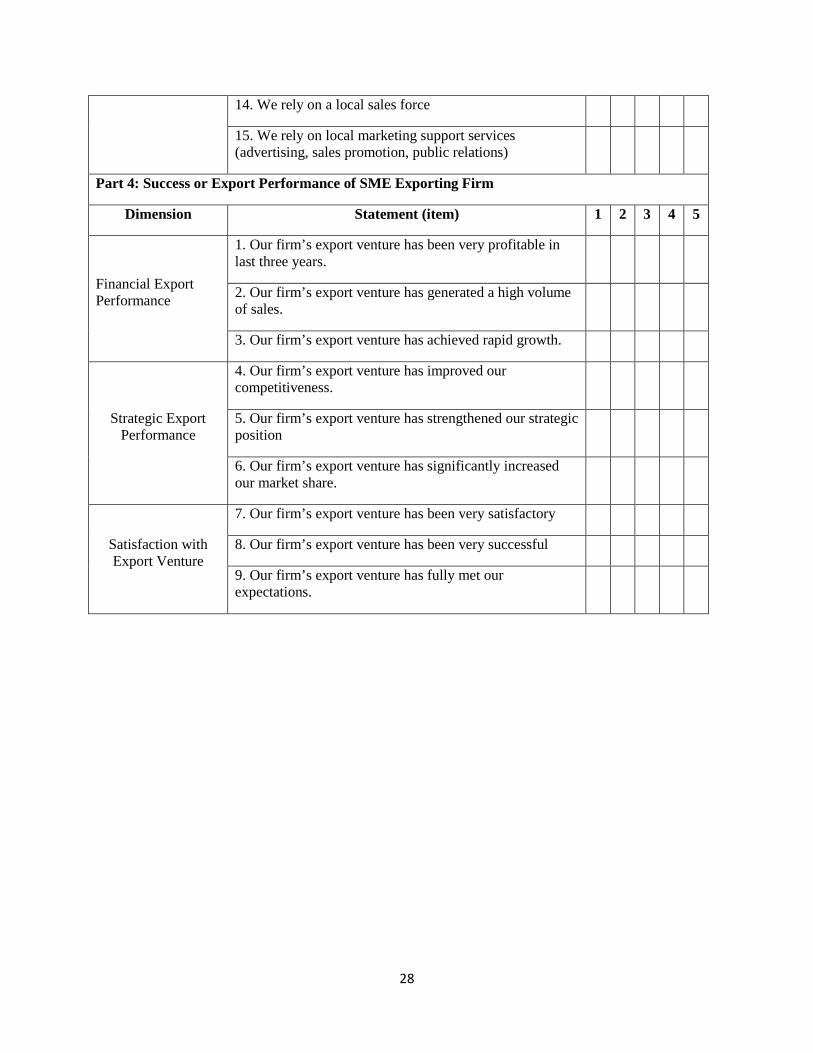
Part 4: Success or Export Performance of SME Exporting Firm
Dimension Statement (item) 1 2 3 4 5
Financial Export Performance
1. Our firm’s export venture has been very profitable in last three years.
2. Our firm’s export venture has generated a high volume of sales.
3. Our firm’s export venture has achieved rapid growth.
Strategic Export Performance
4. Our firm’s export venture has improved our competitiveness.
5. Our firm’s export venture has strengthened our strategic position
6. Our firm’s export venture has significantly increased our market share.
Satisfaction with Export Venture
7. Our firm’s export venture has been very satisfactory
8. Our firm’s export venture has been very successful
9. Our firm’s export venture has fully met our expectations.

29
Appendix II
SME Definitions of Myanmar
On the official website of SMEs development center established by the government of Myanmar (GOM), definition of SMEs in Myanmar is provided as in the following Table.
Table of SME Definitions of Myanmar
SME Definition according to 18.3.2015 Hluttaw confirmation(draft)
Sr. Categories No. of Employees Capital (Kyats in Million)
Turn-over (Kyats in Million)
1 Small (a) Manufacturing sector Up to 50 Up to 500 (b) Labor intensive manufacturing sector Up to 300 Up to 500 (c) Wholesale Business Up to 30 Up to 100 (d) Retail Business Up to 30 Up to 50 (e) Servicing Business Up to 30 Up to 100 (f) Except from above Business Up to 30 Up to 50 2. Medium (a) Manufacturing sector From 51-Up to 300 From 500-up to 1000 (b) Labor intensive manufacturing sector From 301 -Up to 600 From 500-up to 1000 (c) Wholesale Business From 31-Up to 60 From 100-up to 300 (d) Retail Business From 31-Up to 60 From 50-up to 100 (e) Servicing Business From 31-Up to 100 From 100-up to 200 (f) Except from above Business From 31-Up to 60 From 50-up to 100
(Source: http://www.smedevelopmentcenter.gov.mm/?q=en/def_sme)
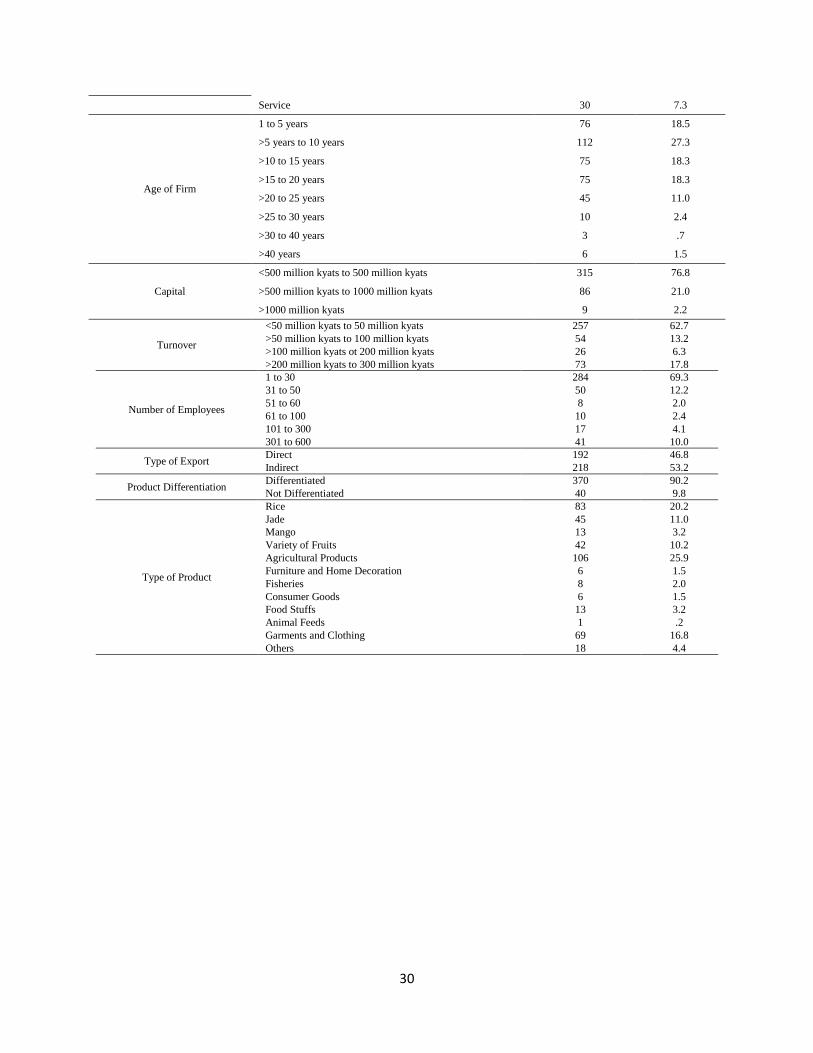
Table of Summary of Demographic Results
Demographic Frequency Percentage
Type of Respondent Owner 223 54.4 Manager/ Executive 187 45.6
Location of Firm
Yangon 150 36.6 Mandalay 146 35.6
Muse 20 4.9
Monywa 94 22.9
Type of Ownership
Family 203 49.5
Private 149 36.3
Partnership 58 14.1
Type of Firm Production 123 30.0
Trading 257 62.7
30
Turnover
<50 million kyats to 50 million kyats 257 62.7 >50 million kyats to 100 million kyats 54 13.2 >100 million kyats ot 200 million kyats 26 6.3 >200 million kyats to 300 million kyats 73 17.8
Number of Employees
1 to 30 284 69.3 31 to 50 50 12.2 51 to 60 8 2.0 61 to 100 10 2.4 101 to 300 17 4.1 301 to 600 41 10.0
Type of Export Direct 192 46.8 Indirect 218 53.2
Product Differentiation Differentiated 370 90.2 Not Differentiated 40 9.8
Type of Product
Rice 83 20.2 Jade 45 11.0 Mango 13 3.2 Variety of Fruits 42 10.2 Agricultural Products 106 25.9 Furniture and Home Decoration 6 1.5 Fisheries 8 2.0 Consumer Goods 6 1.5 Food Stuffs 13 3.2 Animal Feeds 1 .2 Garments and Clothing 69 16.8 Others 18 4.4
Service 30 7.3
Age of Firm
1 to 5 years 76 18.5
>5 years to 10 years 112 27.3
>10 to 15 years 75 18.3
>15 to 20 years 75 18.3
>20 to 25 years 45 11.0
>25 to 30 years 10 2.4
>30 to 40 years 3 .7
>40 years 6 1.5
Capital
<500 million kyats to 500 million kyats 315 76.8
>500 million kyats to 1000 million kyats 86 21.0
>1000 million kyats 9 2.2
31
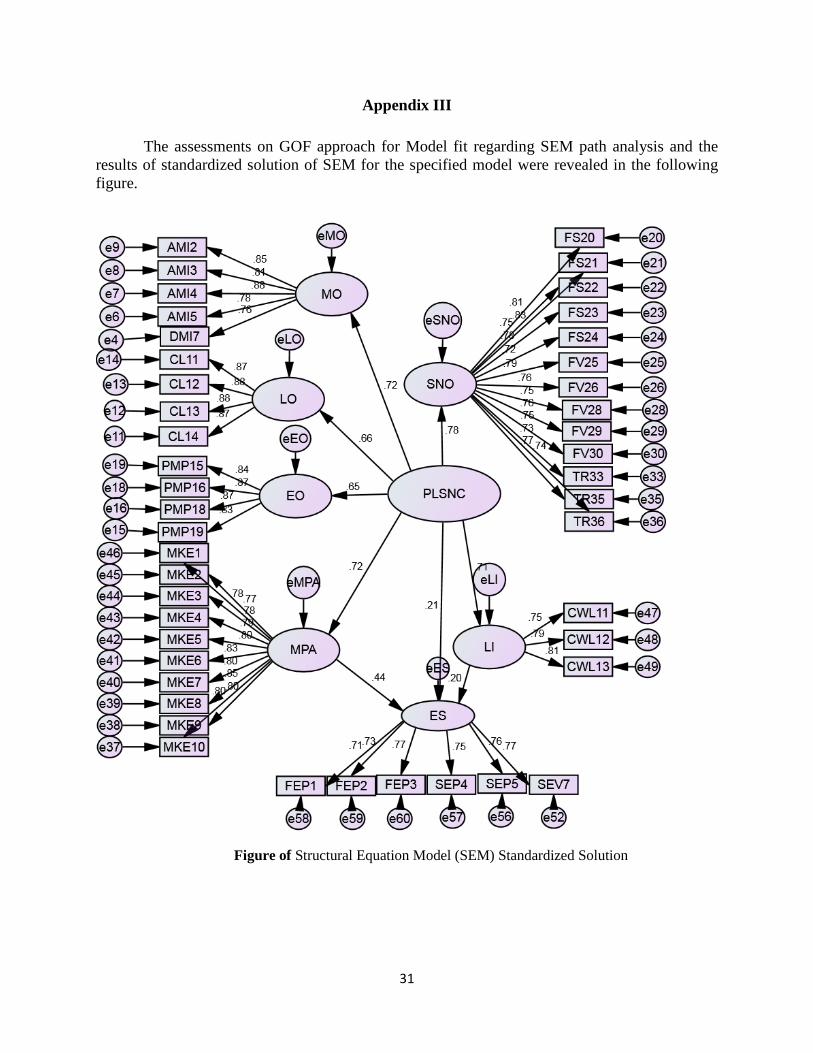
Appendix III
The assessments on GOF approach for Model fit regarding SEM path analysis and the results of standardized solution of SEM for the specified model were revealed in the following figure.
Figure of Structural Equation Model (SEM) Standardized Solution
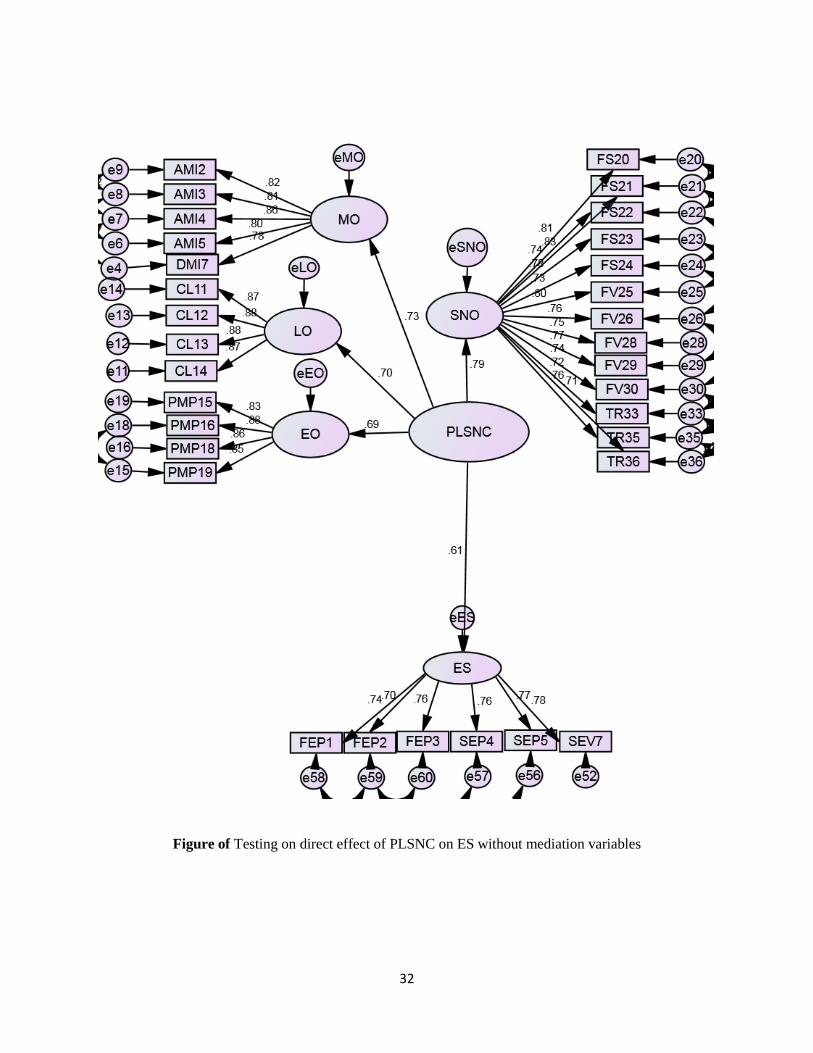
32
Figure of Testing on direct effect of PLSNC on ES without mediation variables
33
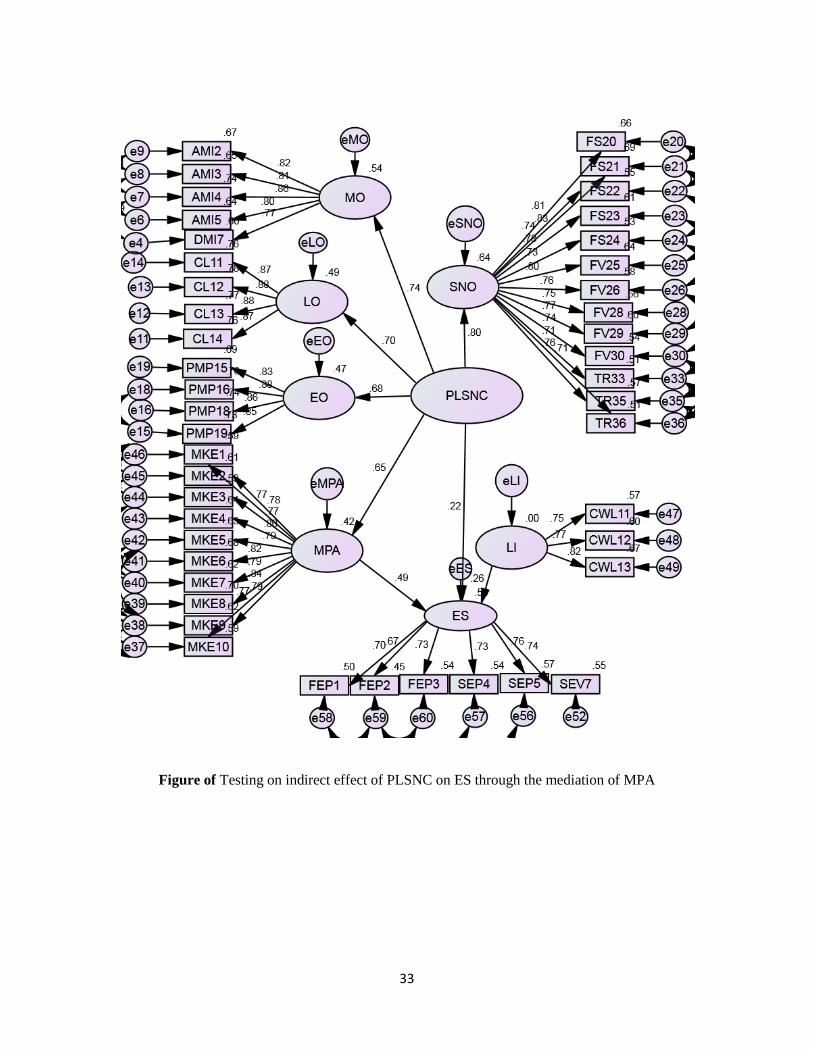
Figure of Testing on indirect effect of PLSNC on ES through the mediation of MPA

34
Figure of Testing on indirect effect of PLSNC on ES through the mediation of LI
Top Related