


Languages
Pages
Legal

Prepared in collaboration with Mercer
The Human Capital Report
Insight Report


The The Human Capital Report | iii
Preface v
by Klaus Schwab
World Economic Forum
PART 1: MEASURING HUMAN CAPITAL 1
The Human Capital Index 3
Appendix: Regional and income group classifications 32
PART 2: COUNTRY PROFILES 35
User’s Guide: How Country Profiles Work 37
List of Countries 49
Country Profiles 50
Acknowledgements 539
Contributors’ Bios 540
Contents

World Economic Forum91-93 route de la CapiteCH-1223 Cologny/GenevaSwitzerlandTel.: +41 (0)22 869 1212Fax: +41 (0)22 786 2744E-mail: [email protected]
© 2013 World Economic Forum
All rights reserved.No part of this publication may be reproduced or transmitted in any form or by any means, including photocopying and recording, or by any information storage and retrieval system.
ISBN 92-95044-52-5ISBN 978-92-95044-52-4

The The Human Capital Report | v
The key for the future of any country and any institution lies in the talent, skills and capabilities of its people. With talent shortages projected to become more severe in much of the developed and developing world, it will be imperative to turn our attention to how these shortages can be met in the short term and prevented in the long term. For the individual, as well as for societies and economies as a whole, investing in human capital is critical; even more so in the context of shifting population dynamics and limited resources.
Through the Human Capital Report, the World Economic Forum seeks to provide a holistic, long term overview on how well countries are leveraging their human capital and establishing workforces that are prepared for the demands of competitive economies. By providing a comprehensive framework for benchmarking human capital, the Report highlights countries that are role models in investing in the health, education and talent of their people and providing an environment where these investments translate into productivity for the economy. In addition, through extensive additional information on the 122 countries covered, the Report seeks to provide a fuller picture of the context within which human capital is operating in any particular country.
We would like to express our deep appreciation to Patricia A. Milligan, President, North America Region and Richard A. Guzzo, Partner and Co-Leader, Workforce Sciences Institute at Mercer, as well as David E. Bloom, Clarence James Gamble Professor of Economics and Demography, Harvard School of Public Health for their invaluable contributions to this Report. We would also like to thank Saadia Zahidi, Senior Director and Charlotte Harding, Project Manager for leading this project at the World Economic Forum. We are also grateful for the support of Amey Soo at the World Economic Forum and Linda Chen and Alison Riggieri at Mercer. Finally, we are thankful to the many business leaders, faculty, international organization experts and government leaders who have provided input on this project since its inception, particularly through workshops held at our Annual Meeting in Davos and summits in China and India.
Using the Report as a basis, we aim to provide a platform for a much-needed dialogue across multiple sectors and stakeholder groups on how best to invest in human capital—both in the short and long term. Over the coming year, this discourse will take place through regional summits, industry dialogues, Global Agenda
Councils and the activities of other World Economic Forum communities. In particular, we hope to mobilize key constituents from governments and the business sector to address human capital gaps through public-private collaboration. It is also our hope that this first edition of the Human Capital Report will inspire further research, policy changes and new projects by business, governments, civil society and universities and serve as a call to action to transform the pace of change on an issue that is fundamental to the growth and stability of the global economy and society.
PrefaceKLAUS SCHWAB
Executive Chairman, World Economic Forum


Part 1Measuring Human Capital


The Human Capital Report | 3
The Human Capital Index
the trends in similar regional and income groups. The third and fourth pages show detailed information on variables contained in the Index as well as over 60 contextual variables on demographics, education, health, society and the workforce.
MEASURING HUMAN CAPITALThe Human Capital Index is a new measure for capturing and tracking the state of human capital development around the world. It has three key features.
First, the Index measures a broader set of indicators than the traditional definitions of human capital. Human capital is not a one–dimensional concept, but means different things to different stakeholders. In the business world, human capital is the economic value of an employee’s set of skills. To the policy maker, human capital is the capacity of the population to drive economic growth. Traditionally, human capital has been viewed as a function of education and experience, the latter reflecting both training and learning by doing. But in recent years, health (including physical capacities, cognitive function and mental health) has come to be seen as a fundamental component of human capital. Additionally, the value of human capital is critically determined by the physical, social and economic context of a society, because that context determines how particular attributes a person possesses may be rewarded. The Index is thus based on four pillars: three core determinants of human capital (education, health and employment) plus those factors that allow these three core determinants to translate into greater returns.
Second, the Index takes a long–term approach to human capital. In addition to providing a snapshot of the state of a country’s human capital today through measures that reflect the results of a country’s past practices, it includes indicators resulting from practices and policy decisions impacting the children of today and which will shape the future workforce. Long–term thinking around human capital often does not fit political cycles or business investment horizons; but lack of such long term planning can perpetuate continued wasted potential in a country’s population and losses for a nation’s growth and productivity. The Index seeks to develop a stronger consciousness around the need for such planning.
Third, the Index aims to take into account the individual life course. For example, the WHO states that
INTRODUCTIONA nation’s human capital endowment—the skills and capacities that reside in people and that are put to productive use—can be a more important determinant of its long term economic success than virtually any other resource. This resource must be invested in and leveraged efficiently in order for it to generate returns, for the individuals involved as well as an economy as a whole. Additionally, despite high unemployment in many countries, the global economy is entering an era of talent scarcity that, if left unaddressed, will hinder economic growth worldwide. Understanding and addressing challenges related to human capital is thus fundamental to short term stability as well as the long term growth, prosperity and competitiveness of nations.
The Human Capital Index explores the contributors and inhibitors to the development and deployment of a healthy, educated and productive labour force, and has generated the information contained in this Report. The Index provides country rankings that allow for effective comparisons across regions and income groups. The methodology and quantitative analysis behind the rankings are intended to serve as a basis for designing effective measures for workforce planning. While the rankings are designed to create greater awareness among a global audience, the Index also seeks to serve as a basis for dialogue and action by leaders at the World Economic Forum to increase public–private collaboration on developing human capital.
The first part of Part 1 reviews the underlying concepts employed in creating the Human Capital Index and outlines the methods used to calculate it. The second part presents the 2013 rankings and regional performance, and calls attention to notable country cases. The third part of Part 1 provides an overview of the links between human capital and the economic performance of countries and points to further areas of work.
The Country Profiles contained in Part 2 of this Report give a more detailed picture of the relative strengths and weaknesses of each country’s performance compared with that of other nations. The first page of each profile contains an overview of each country’s performance in 2013 as well as a visual representation of the countries demographic and labour force structure. The second page shows information on occupation types and comparisons with

Part 1: Measuring Human Capital
4 | The Human Capital Report
“early childhood is the most important phase for overall development throughout the lifespan,” elaborating that “many challenges faced by adults, such as mental health issues, obesity, heart disease, criminality, and poor literacy and numeracy, can be traced back to early childhood.” 1 The Index thus includes measures indicating quality of early childhood. Furthermore, the Index captures the extent to which investments made in earlier years in health and education are being realised in the working age population through lifelong learning and training. Finally, at the other end of the continuum, the Index takes into account the health and productivity of the older population.
As a vital support to the Index, the Country Profiles included in this Report contain a wide variety of contextual factors. In particular, the Profiles call attention to population dynamics, such as youth bulges, ageing populations and shrinking workforces, which, in the context of limited resources, point to critical areas for urgent– and longer–term investments.
THE FOUR PILLARSThe four pillars of the Index are:
• The Education pillar contains indicators relating to quantitative and qualitative aspects of education across primary, secondary and tertiary levels and contains information on both the present workforce as well as the future workforce.
• The Health and Wellness pillar contains indicators relating to a population’s physical and mental well–being, from childhood to adulthood.
• The Workforce and Employment pillar is designed to quantify the experience, talent, knowledge and training in a country’s working–age population.
• The Enabling Environment pillar captures the legal framework, infrastructure and other factors that enable returns on human capital.
The Index contains 51 indicators in total, spread across the four pillars, with 12 indicators in the Education pillar, 14 in the Health and Wellness pillar, 16 in the Workforce and Employment pillar and nine in the Enabling Environment pillar. The values for each of the indicators come from publicly available data produced by international organizations such as the World Health Organization (WHO), the United Nations Educational Scientific and Cultural Organization (UNESCO) and the International Labour Organization (ILO). In addition to hard data, the Index uses qualitative survey data from the World Economic Forum’s Executive Opinion Survey and Gallup’s wellness perception survey data. A full overview of the Index indicators and sources is included in Table 1 and detailed descriptions are included in the section on How to Read the Country Profiles.
EducationThe Education pillar captures several dimensions of education—access to education and quality of education, impacting the future labour force, and the educational attainment of those already in the labour force.
Access to educationAccess to education for today’s children and youth—the future workforce—is captured using net adjusted enrolment rates for primary and net enrolment rates for secondary school, as well as through gross tertiary enrolment ratios and a measure of the education gender gap. The net enrolment rate captures all children who are enrolling at the right age for that school level. Social, in addition to economic, marginalization still denies education to many. The Education subindex from the World Economic Forum’s Global Gender Gap Report, which measures the gap between females’ and males’ access to the three selected stages of education, is included in this pillar as an indicator of educational inclusion.
Quality of educationAlthough access measures show exposure to learning, they do not capture the quality of these learning environments. A third of the Education pillar thus comprises qualitative indicators, such as the quality of primary education, quality of maths and science instruction, the quality of management schools, the level of access to the Internet in schools and the quality of the education system overall for meeting the needs of a competitive economy.
Educational attainmentIncluded in this sub–pillar are three measures of educational attainment to capture the percentage of the population (aged 25 and over) who have achieved at least primary, lower secondary or tertiary education.
Health and WellnessThe Health and Wellness pillar captures how various socio–cultural, geographical, environmental and physiological health factors impact human capital development. Based on a life–course approach, it includes early development indicators, that are predictive of the health of the future workforce, and communicable and non–communicable disease indicators that impact the productivity and capacity of the current labour force.
SurvivalA fundamental determinant of human capital is the survival of its population. In the crudest terms, longer lives equal more productive years per capita, but are also a strong indicator of the overall health and living conditions of a population. This sub–pillar includes a simple measure of average life expectancy across the population, infant mortality and the health parity sub–index from the World Economic Forum’s Global Gender Gap Index.
The Human Capital Report | 5
Part 1: Measuring Human Capital
HealthThe state of physical health of the population is captured in the Health sub–pillar, focusing on both children and adults. The first few years of infancy are critical for a child; nutritional deficiencies and disease at this age may impede the child’s physical and cognitive development so that he or she is unable to reach his or her productive potential in adulthood. Early development indicators of long–term cognitive and physical impairment include an average of stunting (refers to low height–for–age, when a child is short for his/her age but not necessarily thin; a result of chronic malnutrition) and wasting (refers to low weight–for–height where a child is thin for his/her height but not necessarily short; a result of acute malnutrition) in children under five.
The Health sub–pillar also seeks to capture the years spent in poor health in the adult, working age population by measuring the difference between this life expectancy and the number of years that a person can expect to live in “full health” without disease and/or injury.2 Non–communicable diseases (NCDs) kill more than 36 million people each year, a quarter of whom die before the age of 60.3 We capture these losses through a measure of the proportion of the population under 60, (i.e. the population that is normally considered of economically active age), that dies ‘prematurely’ from NCDs. In addition, NCDs as well as communicable diseases have adverse effects throughout the life course. The Health sub–pillar includes five measures of NCDs, and their impact on business. These comprise: heart diseases, cancer, mental illness, diabetes and chronic respiratory disease. This group of five NCD indicators, which measure the seriousness of their impact on business, together contribute a single weight to the ‘Average business impact of non–communicable diseases’ composite indicator. In addition, the following three communicable diseases: HIV, tuberculosis and malaria combined, carry a further single weight for the ‘Average business impact of communicable diseases’ indicator.
In 2008, there were more than 1.4 billion adults in the world overweight, and more than half a billion globally obese (having a body mass index of equal to or greater than 30). More of the world’s population is killed through being overweight than underweight today.4 Obesity causes lost productivity and is a substantial burden on the health resources of a nation. We thus include a measure of BMI for the adult population.
Well–beingThe WHO estimates that the impact of mental health illnesses costs developed countries between three and four percent of GNP annually.5 Depression is ranked as the leading cause of disability worldwide.6 While many cases go unreported due to lack of access to care or stigma, this sub–pillar comprises two perception–based indicators reporting experiences of depression and stress. This means that the data is not reflective of those who
have received a medical diagnosis for stress or depression, but is a measure from a sample population who have experienced what they understand to be feelings of stress or depression.
ServicesThis sub–pillar includes three additional indicators that provide a broad view of the quality of healthcare and access to healthcare services. The qualitative measures of quality and access to healthcare were chosen because they are more closely related to individual health than are measures of expenditures on healthcare infrastructure. The final indicator in the sub–pillar measures the use of improved drinking water sources and improved sanitation facilities, which can reduce illnesses leading to loss of productivity and absenteeism.7
Workforce and EmploymentThere are no standard, internationally comparable datasets that directly measure skills, talent and experience despite agreement among governments, academia and business leaders that these should be measured. Therefore, the Index relies on a number of proxy variables to seek to provide an aggregate measure for quantitative and qualitative aspects of the labour force. The Workforce and Employment pillar combines labour force participation rates to measure how many in a country are gaining experience in the workforce with indicators of the level or quality of experience gained.
ParticipationThis sub–pillar measures how many people are able to participate actively in the workforce as well as how successfully particular sectors of the population are able to contribute (women, youth and those aged over 65). In addition to labour force participation rates for those aged 15–64, this sub–pillar includes a measure of the gender gap in economic participation—whether an economy is leveraging both halves of its human capital pool or not impacts the aggregate accumulation of experience. We have also included an indicator representing labour force participation of the over 65’s. From a human capital stock perspective, a low labour force participation rate for the “silver” workforce is treated as undesirable but is particularly negative for those countries with long, healthy life expectancies that face ageing populations and shrinking workforces. Further information on statutory retirement ages is included in each country’s profile.
Unemployment rates for both the youth and adult population are included. These indicators capture a subset of those in the economy who are in the labour force and are actively looking for and are available for work, and exclude those who are outside of the labour force, i.e. are not working nor looking for work. We include both adult and youth unemployment because of its greater multiplier effects in the future. With youth unemployment worsening

Part 1: Measuring Human Capital
6 | The Human Capital Report
Table 1: Structure of the Human Capital Index
(cont’d.)
PILLAR 1: EDUCATION
Sub–pillar Indicator Source
Access Primary enrolment rate (%) UNESCO, Institute for Statistics, provided database extraction 22 August
2013, latest available data 2003–2012
Secondary enrolment rate (%) UNESCO, Institute for Statistics, provided database extraction 22 August
2013, latest available data 2003–2012
Tertiary enrolment ratio (%) UNESCO, Institute for Statistics, provided database extraction 22 August
2013, latest available data 2003–2012
Education gender gap World Economic Forum, Global Gender Gap Report, 2012
Quality Internet access in schools World Economic Forum, Executive Opinion Survey, 2013–2014
Quality of the education system World Economic Forum, Executive Opinion Survey, 2013–2014
Quality of primary schools World Economic Forum, Executive Opinion Survey, 2013–2014
Quality of math and science education World Economic Forum, Executive Opinion Survey, 2013–2014
Quality of management schools World Economic Forum, Executive Opinion Survey, 2013–2014
Attainment Primary education attainment
(% population age 25+)
UNESCO Institute for Statistics, Education Statistics online database,
2011 or latest year available
Secondary education attainment
(% population age 25+)
UNESCO Institute for Statistics, Education Statistics online database,
2011 or latest year available
Tertiary education attainment
(% population age 25+)
UNESCO Institute for Statistics, Education Statistics online database,
2011 or latest year available
PILLAR 2: HEALTH AND WELLNESS
Sub–pillar Indicator Source
Survival Infant mortality (per 1,000 live births) World Health Organisation, Global Health Observatory, World Health
Statistics, Mortality and Burden of Disease, Child mortality, 2011
Life expectancy World Health Organisation, Global Health Observatory, World Health
Statistics, Mortality and Burden of Disease, Child mortality, 2011
Survival gender gap World Economic Forum, Global Gender Gap Report, 2012
Health Stunting and wasting (% in children under 5) World Health Organisation, Global Health Observatory, World Health
Statistics, Nutrition, Child malnutrition, latest available data 2003–2011
Unhealthy life years (% of life expectancy) Healthy adjusted life expectancy, World Health Organisation data, 2007,
taken from the Global Gender Gap Report 2012; life expectancy, as
above
Deaths under 60 from non–communicable
diseases (% of all NCD deaths)
World Health Organisation, Global Health Observatory, World Health
Statistics, Non–communicable diseases, 2008
Obesity (% of adults with BMI ≥ 30) World Health Organisation, Global Health Observatory, World Health
Statistics, Adult risk factors, 2008
Business impact of non–communicable diseases World Economic Forum, Executive Opinion Survey, 2013–2014
Business impact of communicable diseases World Economic Forum, Executive Opinion Survey, 2013–2014
Well–being Stress (% of respondents) Gallup, Worldview database, latest available data 2009–2013
Depression (% of respondents) Gallup, Worldview database, latest available data 2006–2011
Services Water, sanitation and hygiene World Health Organisation, Global Health Observatory, World Health
Statistics, Environmental Health, latest available data 2005–2011
Healthcare quality World Economic Forum, Executive Opinion Survey, 2013–2014
Healthcare accessibility World Economic Forum, Executive Opinion Survey, 2013–2014

The Human Capital Report | 7
Part 1: Measuring Human Capital
Table 1: Structure of the Human Capital Index (cont’d.)
PILLAR 3: WORKFORCE AND EMPLOYMENT
Sub–pillar Indicator Source
Participation Labour force participation rate, age 15–64 (%) ILO, Key Indicators of the Labour Market, (KILM), 2010
Labour force participation rate, age 65+ (%) ILO, Key Indicators of the Labour Market, (KILM), 2010
Economic participation gender gap World Economic Forum, Global Gender Gap Report, 2012
Unemployment rate (%) ILO, ILOstat, latest available data 2003–2010
Youth unemployment rate (%) ILO, Laborstat, latest available data 2003–2010
Talent Country capacity to attract talent World Economic Forum, Executive Opinion Survey, 2013–2014
Country capacity to retain talent World Economic Forum, Executive Opinion Survey, 2013–2014
Ease of finding skilled employees World Economic Forum, Executive Opinion Survey, 2013–2014
Pay related to productivity World Economic Forum, Executive Opinion Survey, 2013–2014
Capacity for innovation World Economic Forum, Executive Opinion Survey, 2013–2014
Index of Economic Complexity Hausmann, R., Hidalgo, C., et al. The Atlas of Economic Complexity.
Cambridge: Puritan Press, 2011
Firm level technology absorption World Economic Forum, Executive Opinion Survey, 2013–2014
Scientific and technical journal articles (per 1,000 people) World Bank, World Development Indicators online database, 2009
and United Nations, Department of Economic and Social Affairs,
World Population Prospects, 2009
Median age of the working population United Nations, Department of Economic and Social Affairs, Population
Division, World Population Prospects DEMOBASE 2010
Training Staff training World Economic Forum, Executive Opinion Survey, 2013–2014
Training services World Economic Forum, Executive Opinion Survey, 2013–2014
PILLAR 4: ENABLING ENVIRONMENT
Sub–pillar Indicator Source
Infrastructure Mobile users (per 100 people) World Bank, World Development Indicators online database, 2011
Internet users (per 100 people) World Bank, World Development Indicators online database, 2011
Quality of domestic transport World Economic Forum, Executive Opinion Survey, 2013–2014
Collaboration State of cluster development World Economic Forum, Executive Opinion Survey, 2013–2014
Business and university R&D collaboration World Economic Forum, Executive Opinion Survey, 2013–2014
Legal framework Doing Business Index World Bank and International Finance Corporation, 2012
Social safety net protection World Economic Forum, Executive Opinion Survey, 2013–2014
Intellectual property protection and property rights World Economic Forum, Executive Opinion Survey, 2013–2014
Social mobility Social mobility World Economic Forum, Executive Opinion Survey, 2013–2014

Part 1: Measuring Human Capital
8 | The Human Capital Report
globally and with young people more than three times more likely to be unemployed than adults, the ILO warns of a “scarred generation” and that “youth unemployment and underemployment impose heavy social and economic costs, resulting in the loss of opportunities for economic growth [...] and unutilized investment in education and training.”8
TalentThis sub–pillar contains several concepts to capture a broad, aggregate measure of talent. First, it contains a high–level measure of the average level of experience in an economy in the form of the median age of the working age population (15–64). Second, it integrates business leaders’ assessment of their countries ability to attract and retain talent, of their companies’ ability to find skilled employees and of the existence of merit–based rewards for employees. Third, it assesses whether the talent available in a country leads to economic results in the form of production, learning within firms, innovation and knowledge generation, captured through the Index of Economic Complexity—countries that make sophisticated products must possess the skills and expertise to do so—two survey variables on firm level technology absorption and capacity for innovation, and the prevalence of scientific and technical journal articles.
TrainingTwo quantitative indicators serve as a proxy for continued training and learning. The extent of staff training indicator measures the extent to which companies invest in training and employee development and the training services indicator measures the extent to which high–quality specialized training services are available.
Enabling EnvironmentThe indicators included in this pillar capture whether human capital is deployed effectively or whether barriers in the environment are preventing the effective use of human capital, thereby negating the investments made in human capital development.
InfrastructureThis sub–pillar looks at three basic aspects of physical and communication infrastructure as facilitators of human capital. Physical transport, which facilitates access to workplaces and is critical to connecting industry and communities together, is measured through a survey indicator on the quality of domestic transport. The use of ICT, such as mobile phones and the Internet, can also accelerate communication and exchange across the complex networks that underpin human capital growth. These are captured through prevalence indicators for mobile phones and Internet use, respectively.
CollaborationCross–industry and cross–sector learning facilitate innovation, information exchange and the development of human capital. These concepts are captured through two survey indicators from the Executive Opinion Survey. We include a measure of the extent to which universities and industry collaborate on R&D. We also include a measure of how prevalent are well–developed and deep clusters.
Legal frameworkThis sub–pillar looks at the legal environment within which people are employed or self–employed. In particular, we include the ease of doing business in a country, using the World Bank’s Doing Business Index, which looks at how conducive the legal and regulatory environment is to starting and operating a local business. The protection of both physical property and intellectual property is important from a human capital perspective as it protects the knowledge—the intangible assets—of an individual as well as the assets connected with that knowledge. This is measured through a combination of two survey variables. We also include in this sub–pillar social safety net protection for its role in preserving skills and knowledge and reducing the attrition on human capital.
Social mobilityFinally, we include a measure of rigid socio–cultural practices that may thwart progress in human capital development despite investments through policy instruments. The opportunity for an individual to transcend social strata may be a significant motivational factor for investment in their own and their offspring’s human capital development. Therefore in countries where status is ascribed rather than achieved, the incentive for investing in human capital is reduced.
CONSTRUCTION OF THE INDEXStandardizing dataThe indicators used in the Index are measured on different scales. To standardize the data, we used the z–score statistic as it preserves the distribution of the data, a feature most relevant for a comparative international composite index.
Z–scores are expressed as standard deviations from the mean. The mean is zero and has a standard deviation of one. This means that all data points above the mean are expressed as positive scores and all data below the mean are expressed as negative scores. The z–scores methodology is based on an assumption of the normal distribution. A standard deviation of plus (minus) 1 represents the area 34.13% above (below) the mean (zero) and a standard deviation of plus (minus) 2 represents the area 47.72% above (below) the mean. The z–score of a data point indicates the number of standard deviations above or below the mean. So a z–score of –2 is exactly two standard deviations, or 47.72%, below the mean.
The Human Capital Report | 9
Part 1: Measuring Human Capital
The z–score approach is a widely used way of converting raw data that is expressed in differing formats into a common metric (standardizing). The z-score approach is widely used but, like alternative approaches, it does introduce some uncertainty. For example, z-scores are unfamiliar to many. Also, converting to z-scores can sometimes yield an extreme value, and a common approach is to delete extreme values. However, considering the further arbitrary distortions this may create, a decision was made not to prune the data at any point in order to represent the dataset in its purest form.
Weights and missing dataOnce all underlying data is converted to z–scores, a country’s score on a given pillar is determined by an unweighted average of all available scores within that pillar. A country’s score on the overall index is an unweighted average of the four pillar scores. Underlying weights are reported in Tables 2a–2d.
Missing data is not imputed. The criterion for an indicator to be included in the Index is that it must have non–missing data for at least 50 percent of the countries. The criterion for a country to be included in the Index is that it must have non–missing data for at least 70 percent of each of the pillar’s indicators. This means a country must have data for at least:
• 8 out of 12 indicators in the Education pillar• 10 out of 14 indicators in the Health and Wellness pillar• 11 out of 16 indicators in the Workforce and
Employment pillar• 6 out of 9 indicators in the Enabling Environment pillar
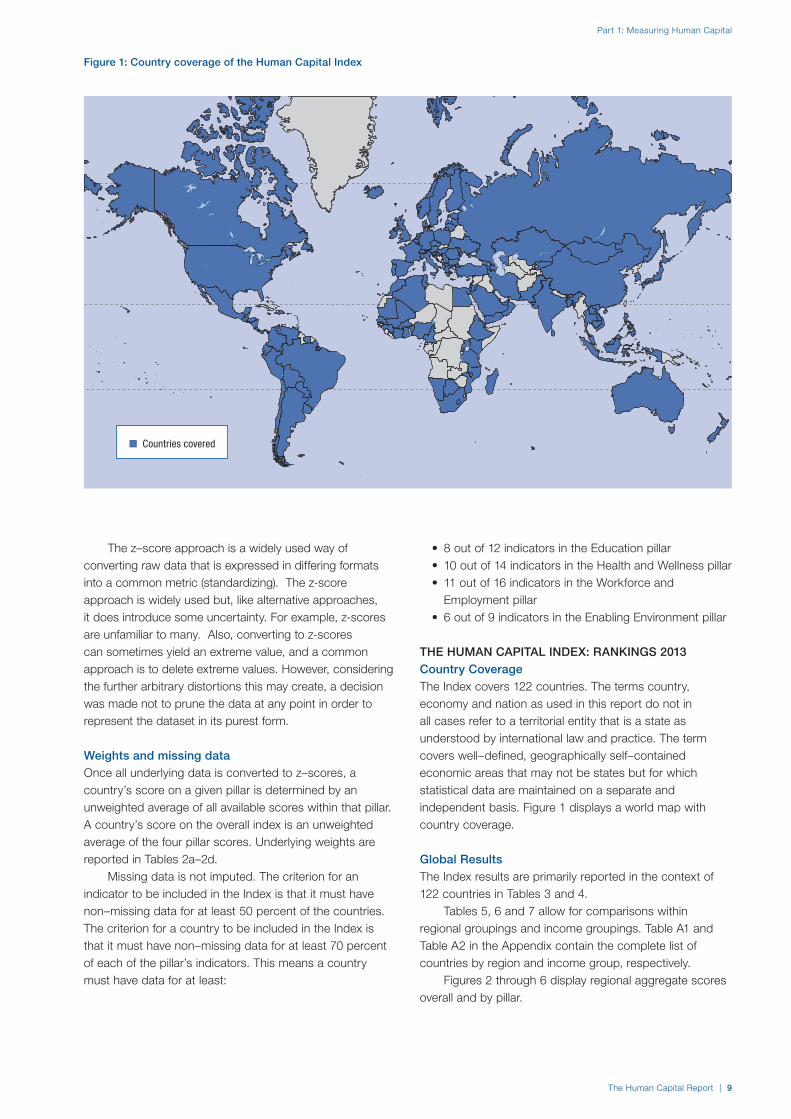
THE HUMAN CAPITAL INDEX: RANKINGS 2013Country CoverageThe Index covers 122 countries. The terms country, economy and nation as used in this report do not in all cases refer to a territorial entity that is a state as understood by international law and practice. The term covers well–defined, geographically self–contained economic areas that may not be states but for which statistical data are maintained on a separate and independent basis. Figure 1 displays a world map with country coverage.
Global ResultsThe Index results are primarily reported in the context of 122 countries in Tables 3 and 4.
Tables 5, 6 and 7 allow for comparisons within regional groupings and income groupings. Table A1 and Table A2 in the Appendix contain the complete list of countries by region and income group, respectively.
Figures 2 through 6 display regional aggregate scores overall and by pillar.
Figure 1: Country coverage of the Human Capital Index
n Countries covered

Part 1: Measuring Human Capital
10 | The Human Capital Report
Sub–pillar Indicator Weight
Participation Labour force participation rate, age 15–64 (%) 1.56
Labour force participation rate, age 65+ (%) 1.56
Economic participation gender gap 1.56
Unemployment rate 1.56
Youth unemployment rate 1.56
Talent Country capacity to attract talent 1.56
Country capacity to retain talent 1.56
Ease of finding skilled employees 1.56
Pay related to productivity 1.56
Capacity for innovation 1.56
Index of economic complexity 1.56
Firm level technology absorption 1.56
Scientific and technical journal articles 1.56
Median age of the working population 1.56
Training Staff training 1.56
Training services 1.56
TOTAL PILLAR WEIGHT 25.00
Table 2c: Workforce and employment subpillars and indicator weights
Sub–pillar Indicator Weight
Access Primary enrolment rate (%) 2.08
Secondary enrolment rate (%) 2.08
Tertiary enrolment ratio (%) 2.08
Education gender gap 2.08
Quality Internet access in schools 2.08
Quality of the education system 2.08
Quality of primary schools 2.08
Quality of math and science education 2.08
Quality of management schools 2.08
Attainment Primary education attainment (% population age 25+) 2.08
Secondary education attainment (% population age 25+) 2.08
Tertiary education attainment (% population age 25+) 2.08
TOTAL PILLAR WEIGHT 25.00
Table 2a: Education subpillars and indicator weights
Sub–pillar Indicator Weight
Survival Infant mortality (per 1,000 live births) 1.79
Life expectancy 1.79
Survival gender gap 1.79
Health Stunting and wasting (% in children under 5) 1.79
Unhealthy life years (% of life expectancy) 1.79
Deaths under 60 from non–communicable diseases (% of all NCD deaths). 1.79
Obesity (% of adults with BMI ≥ 30) 1.79
Business impact of non–communicable diseases 1.79
Business impact of communicable diseases 1.79
Well–being Stress (% of respondents) 1.79
Depression (% of respondents) 1.79
Services Water, sanitation and hygiene 1.79
Healthcare quality 1.79
Healthcare accessibility 1.79
TOTAL PILLAR WEIGHT 25.00
Table 2b: Health and wellness subpillars and indicator weights
The Human Capital Report | 11
Part 1: Measuring Human Capital
TOP TENThe top ten countries are dominated by the European countries, with eight of the top ten spots occupied by countries from this region. Switzerland (1) tops the rankings for the Human Capital Index, demonstrating consistently high scores across all four pillars, with top spots on Health and Wellness and Workforce and Employment, second place on Enabling Environment and fourth on Education.
Within the countries from Northern and Western Europe in the top ten, four Nordic countries, Finland (2), Sweden (5), Norway (7) and Denmark (9) dominate. Finland’s exemplary Education and Enabling Environment scores put it at the top of the rankings for these two pillars and seven ranks ahead of the next highest–ranking Nordic country. The overall strength of the Nordic region lies in the Workforce and Employment pillar, with Finland, Norway and Sweden occupying three of the top six ranks. Denmark drops out of the top ten, to 12th position in this pillar and down to 11th position for the Enabling Environment pillar.
Singapore (3) is the only Asian country in the top ten due to very strong scores on the Education pillar, Workforce and Employment pillar and a strong fifth position on the Enabling Environment pillar.
The Netherlands (4) is the third of the European countries in the top ten due to strong performances for Health and Wellness and for Enabling Environment. Germany (6) just edges ahead of the Netherlands on the Enabling Environment rankings in third place but holds ninth position on the Workforce and Employment pillar. Germany’s relatively low place on the Education pillar (19) pulls down the country’s overall score in the Index.
The United Kingdom (8) performs well on Enabling Environment but has lower scores on Health and Wellness, holding 17th position. Canada (10) is the first of the two North American countries in the Index and the only one in the top ten. Canada’s overall scores are greatly enhanced by its second position on the Education pillar. Ranks for the remaining three pillars vary between 15th and 20th position.
ASIA AND THE PACIFICThe region has a diverse spread of wealth, comprising five of the sample’s high–income economies, four upper–middle income, nine lower–middle economies as well as Bangladesh and Cambodia, two low–income countries. As a region, Asia ranks third overall, behind North America and Europe and Central Asia.
Singapore (3) is the highest ranked of the region’s countries and the only country from the region in the top ten. Singapore’s excellent rank is due to its very strong scores on the Education and Workforce and Employment pillars, and good scores on Enabling Environment. Exceptionally strong scores across the qualitative education indicators and the high level of tertiary education among the adult population drive up its Education pillar ranking. Strengths on the Enabling Environment’s Collaboration and Legal framework sub–pillars include a top rank on the Doing Business Index. The Health and Wellness pillar is weakened mainly due to the burden of disease in the country.
Despite the Enabling Environment being New Zealand’s (12) weakest pillar at 18th, the country also performs very well in some aspects, with top ten ranks across the Legal framework sub–pillar and a rank of 3 in Social mobility. New Zealand’s strengths in Education are similar to those of Singapore, but it ranks lower in the qualitative talent indicators on the Workforce and Employment pillar, including a particularly low rank (69) for the ability of the country to retain talent, or the ‘brain drain’ indicator.
Japan’s (15) strong performance in Health and Wellness is due to excellent scores in the Health and the Survival sub–pillars. Top rankings for life expectancy and years lived in good health help drive the strong rankings. Japan’s training indicators on the Workforce and Employment pillar are also strong, with top ten rankings. Enrolment rates in secondary education rank at the top while the Primary enrolment indicator gives Japan third place. However Japan’s relatively weaker spots in the
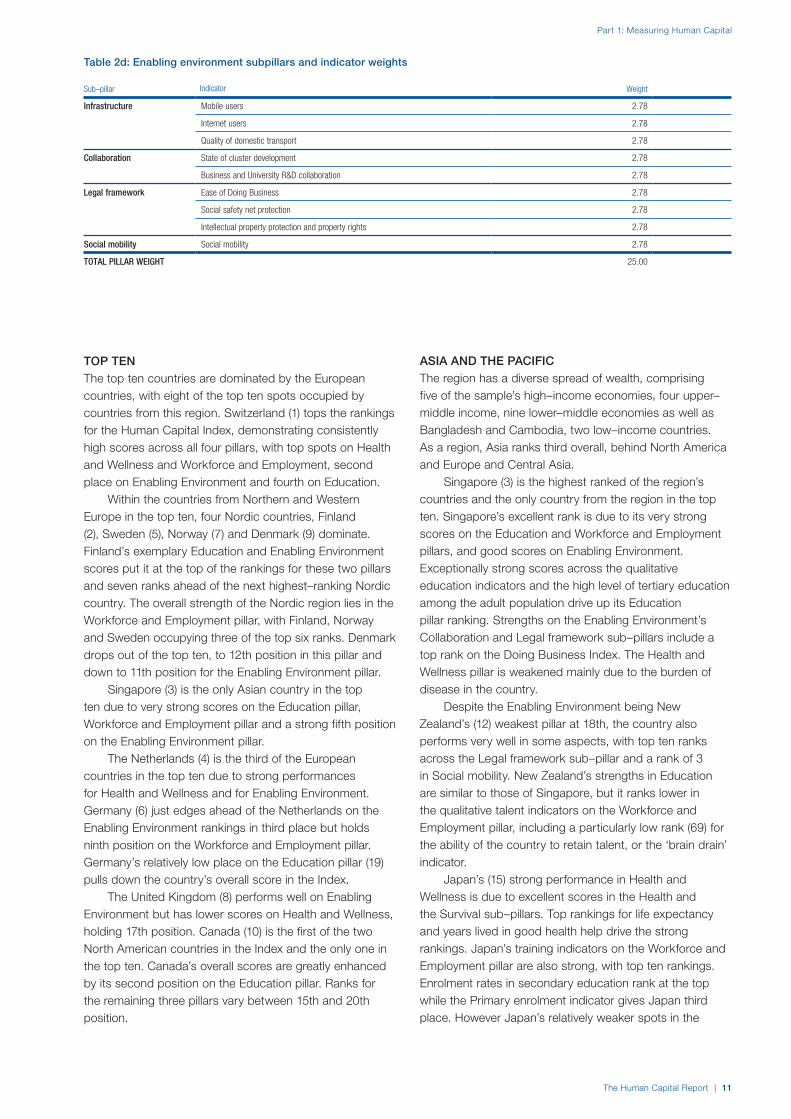
Sub–pillar Indicator Weight
Infrastructure Mobile users 2.78
Internet users 2.78
Quality of domestic transport 2.78
Collaboration State of cluster development 2.78
Business and University R&D collaboration 2.78
Legal framework Ease of Doing Business 2.78
Social safety net protection 2.78
Intellectual property protection and property rights 2.78
Social mobility Social mobility 2.78
TOTAL PILLAR WEIGHT 25.00
Table 2d: Enabling environment subpillars and indicator weights

Part 1: Measuring Human Capital
12 | The Human Capital Report
Overall index Education Health and wellness Workforce and employment Enabling environment
Country Rank Score Rank Score Rank Score Rank Score Rank Score
Switzerland 1 1.455 4 1.313 1 0.977 1 1.736 2 1.793
Finland 2 1.406 1 1.601 9 0.844 3 1.250 1 1.926
Singapore 3 1.232 3 1.348 13 0.762 2 1.345 5 1.471
Netherlands 4 1.161 7 1.106 4 0.901 8 1.150 4 1.484
Sweden 5 1.111 14 0.977 2 0.960 6 1.154 10 1.351
Germany 6 1.109 19 0.888 8 0.877 9 1.149 3 1.522
Norway 7 1.104 15 0.970 6 0.890 5 1.182 8 1.373
United Kingdom 8 1.042 10 1.031 17 0.682 10 1.072 7 1.384
Denmark 9 1.024 18 0.891 3 0.943 12 0.932 11 1.330
Canada 10 0.987 2 1.355 20 0.548 15 0.875 17 1.168
Belgium 11 0.985 6 1.191 11 0.780 21 0.673 14 1.296
New Zealand 12 0.978 5 1.204 15 0.743 17 0.804 18 1.163
Austria 13 0.977 25 0.713 7 0.886 14 0.886 6 1.424
Iceland 14 0.957 8 1.075 5 0.900 16 0.826 20 1.026
Japan 15 0.948 28 0.628 10 0.836 11 1.027 13 1.302
United States 16 0.920 11 1.027 43 0.239 4 1.235 16 1.181
Luxembourg 17 0.881 35 0.522 16 0.704 13 0.928 9 1.372
Qatar 18 0.834 26 0.684 44 0.206 7 1.154 15 1.294
Australia 19 0.831 13 0.988 18 0.663 19 0.675 23 0.999
Ireland 20 0.824 9 1.033 25 0.516 22 0.645 19 1.103
France 21 0.746 22 0.776 14 0.744 25 0.520 24 0.943
Malaysia 22 0.644 34 0.526 39 0.301 18 0.736 22 1.014
Korea, Rep. 23 0.640 17 0.899 27 0.481 23 0.596 30 0.582
United Arab Emirates 24 0.610 29 0.626 70 –0.032 24 0.527 12 1.320
Israel 25 0.587 27 0.651 29 0.457 20 0.674 32 0.568
Barbados 26 0.581 12 1.007 42 0.245 29 0.340 27 0.730
Estonia 27 0.571 20 0.862 22 0.536 39 0.142 26 0.745
Malta 28 0.473 24 0.716 28 0.473 30 0.330 37 0.371
Spain 29 0.465 31 0.590 12 0.778 70 –0.185 28 0.679
Portugal 30 0.453 37 0.411 23 0.532 34 0.243 29 0.624
Cyprus 31 0.452 16 0.938 32 0.352 33 0.252 41 0.268
Slovenia 32 0.445 21 0.825 26 0.516 41 0.106 38 0.332
Czech Republic 33 0.387 36 0.452 36 0.310 36 0.210 31 0.576
Lithuania 34 0.360 23 0.745 41 0.252 56 –0.018 36 0.462
Costa Rica 35 0.320 39 0.382 30 0.445 28 0.378 50 0.077
Chile 36 0.305 49 0.250 38 0.306 37 0.194 35 0.471
Italy 37 0.266 40 0.378 19 0.601 75 –0.243 39 0.329
Latvia 38 0.248 30 0.615 48 0.151 54 –0.011 43 0.237
Saudi Arabia 39 0.245 55 0.098 72 –0.041 61 –0.099 21 1.023
Bahrain 40 0.232 48 0.274 64 0.011 43 0.099 33 0.544
Oman 41 0.220 62 0.032 37 0.307 78 –0.280 25 0.822
Panama 42 0.207 66 –0.006 60 0.055 31 0.301 34 0.477
China 43 0.186 58 0.069 65 0.010 26 0.516 47 0.147
Thailand 44 0.158 79 –0.242 40 0.281 27 0.482 48 0.112
Kazakhstan 45 0.124 43 0.359 69 –0.031 40 0.107 51 0.061
Croatia 46 0.099 38 0.394 24 0.526 88 –0.378 60 –0.146
Mauritius 47 0.099 50 0.234 45 0.202 64 –0.143 49 0.102
Uruguay 48 0.096 67 –0.037 21 0.543 84 –0.340 44 0.219
Poland 49 0.087 42 0.376 47 0.173 63 –0.139 57 –0.064
Sri Lanka 50 0.020 51 0.172 35 0.323 62 –0.127 70 –0.288
Russian Federation 51 0.010 41 0.377 62 0.027 66 –0.163 63 –0.201
Jordan 52 0.005 44 0.350 68 –0.015 97 –0.481 46 0.167
Indonesia 53 0.001 61 0.040 84 –0.215 32 0.262 58 –0.082
Hungary 54 0.000 33 0.530 73 –0.064 77 –0.275 62 –0.190
Greece 55 –0.011 47 0.280 34 0.331 86 –0.365 71 –0.291
Bulgaria 56 –0.048 46 0.282 33 0.333 100 –0.496 74 –0.311
Brazil 57 –0.054 88 –0.497 49 0.150 45 0.078 52 0.054
Mexico 58 –0.057 82 –0.291 56 0.074 48 0.011 53 –0.022
Kuwait 59 –0.059 80 –0.285 58 0.065 80 –0.297 40 0.281
Turkey 60 –0.065 77 –0.220 51 0.117 83 –0.337 45 0.181
Ecuador 61 –0.099 69 –0.090 76 –0.094 47 0.034 68 –0.244
Table 3: Detailed rankings
(Cont’d.)

The Human Capital Report | 13
Part 1: Measuring Human Capital
Table 3: Detailed rankings (cont’d.)
Overall index Education Health and wellness Workforce and employment Enabling environment
Country Rank Score Rank Score Rank Score Rank Score Rank Score
Argentina 62 –0.120 56 0.091 31 0.362 92 –0.408 84 –0.527
Ukraine 63 –0.124 45 0.316 55 0.078 67 –0.166 96 –0.725
Azerbaijan 64 –0.157 71 –0.153 94 –0.414 55 –0.016 55 –0.044
Macedonia, FYR 65 –0.160 52 0.165 63 0.013 115 –0.784 54 –0.033
Philippines 66 –0.161 65 0.011 96 –0.473 38 0.164 78 –0.344
Tunisia 67 –0.165 70 –0.099 46 0.173 101 –0.499 66 –0.236
Jamaica 68 –0.171 81 –0.285 50 0.126 76 –0.246 69 –0.279
Romania 69 –0.176 57 0.077 61 0.048 85 –0.364 83 –0.463
Vietnam 70 –0.202 73 –0.176 88 –0.291 57 –0.040 73 –0.302
Colombia 71 –0.202 72 –0.169 79 –0.116 73 –0.229 72 –0.296
Albania 72 –0.216 54 0.136 54 0.083 71 –0.207 105 –0.874
Armenia 73 –0.218 60 0.042 71 –0.035 113 –0.678 64 –0.201
Lebanon 74 –0.220 32 0.548 77 –0.099 96 –0.458 104 –0.870
Peru 75 –0.227 84 –0.323 82 –0.204 50 –0.003 81 –0.377
Trinidad and Tobago 76 –0.233 53 0.164 121 –1.043 53 –0.008 56 –0.047
Georgia 77 –0.258 74 –0.191 66 –0.005 102 –0.514 76 –0.321
India 78 –0.270 63 0.020 112 –0.868 49 0.005 67 –0.239
Botswana 79 –0.291 85 –0.386 86 –0.270 93 –0.416 59 –0.090
Lao PDR 80 –0.297 83 –0.320 91 –0.407 59 –0.097 80 –0.364
Kenya 81 –0.306 90 –0.503 103 –0.603 35 0.226 79 –0.347
Morocco 82 –0.336 93 –0.590 59 0.061 99 –0.485 77 –0.328
Moldova 83 –0.337 64 0.014 53 0.092 110 –0.654 102 –0.801
Guatemala 84 –0.341 105 –0.968 81 –0.196 46 0.035 65 –0.234
Serbia 85 –0.343 59 0.053 52 0.115 118 –0.945 89 –0.596
South Africa 86 –0.361 92 –0.589 98 –0.533 105 –0.588 42 0.265
Ghana 87 –0.363 91 –0.505 99 –0.533 60 –0.099 75 –0.317
Bhutan 88 –0.370 89 –0.498 83 –0.208 74 –0.231 85 –0.545
Mongolia 89 –0.400 76 –0.198 80 –0.139 106 –0.610 92 –0.651
El Salvador 90 –0.405 95 –0.612 92 –0.409 68 –0.175 82 –0.425
Suriname 91 –0.420 87 –0.423 67 –0.010 109 –0.640 90 –0.607
Kyrgyz Republic 92 –0.440 78 –0.233 75 –0.073 112 –0.673 100 –0.781
Nicaragua 93 –0.446 94 –0.594 78 –0.100 89 –0.386 94 –0.704
Iran, Islamic Rep. 94 –0.487 68 –0.051 87 –0.274 119 –1.059 88 –0.564
Dominican Republic 95 –0.499 97 –0.732 85 –0.223 91 –0.401 91 –0.641
Cambodia 96 –0.505 99 –0.839 102 –0.596 42 0.104 93 –0.688
Namibia 97 –0.539 98 –0.817 100 –0.560 108 –0.620 61 –0.160
Paraguay 98 –0.546 102 –0.906 57 0.072 94 –0.433 108 –0.916
Bolivia 99 –0.552 86 –0.409 113 –0.878 69 –0.185 97 –0.736
Honduras 100 –0.560 103 –0.947 89 –0.335 90 –0.397 87 –0.561
Venezuela 101 –0.564 75 –0.194 74 –0.068 114 –0.746 120 –1.250
Senegal 102 –0.602 112 –1.202 90 –0.404 51 –0.006 101 –0.794
Malawi 103 –0.629 101 –0.897 107 –0.723 52 –0.007 106 –0.890
Tanzania 104 –0.680 100 –0.870 117 –0.957 58 –0.087 103 –0.805
Madagascar 105 –0.725 107 –0.997 109 –0.749 44 0.084 118 –1.238
Uganda 106 –0.727 108 –1.036 118 –0.959 65 –0.147 99 –0.767
Cameroon 107 –0.728 96 –0.687 111 –0.850 79 –0.295 113 –1.082
Lesotho 108 –0.751 110 –1.084 101 –0.588 95 –0.438 107 –0.894
Côte d’Ivoire 109 –0.759 114 –1.302 95 –0.418 72 –0.208 114 –1.107
Bangladesh 110 –0.782 104 –0.959 104 –0.606 103 –0.543 110 –1.019
Egypt 111 –0.790 113 –1.206 97 –0.521 116 –0.878 86 –0.555
Pakistan 112 –0.837 111 –1.166 115 –0.920 104 –0.545 95 –0.718
Benin 113 –0.865 109 –1.044 106 –0.689 98 –0.481 119 –1.244
Nigeria 114 –0.878 116 –1.411 120 –1.034 81 –0.328 98 –0.740
Algeria 115 –0.954 106 –0.991 93 –0.413 121 –1.345 112 –1.066
Ethiopia 116 –0.961 115 –1.380 108 –0.749 111 –0.660 111 –1.056
Mozambique 117 –0.966 117 –1.474 114 –0.916 82 –0.337 115 –1.135
Mali 118 –1.034 120 –1.747 110 –0.826 107 –0.614 109 –0.949
Burkina Faso 119 –1.077 121 –1.817 116 –0.943 87 –0.374 117 –1.173
Guinea 120 –1.272 118 –1.482 119 –1.026 117 –0.911 122 –1.667
Mauritania 121 –1.297 119 –1.744 105 –0.666 122 –1.404 121 –1.373
Yemen 122 –1.395 122 –1.972 122 –1.134 120 –1.320 116 –1.153
Part 1: Measuring Human Capital
14 | The Human Capital Report
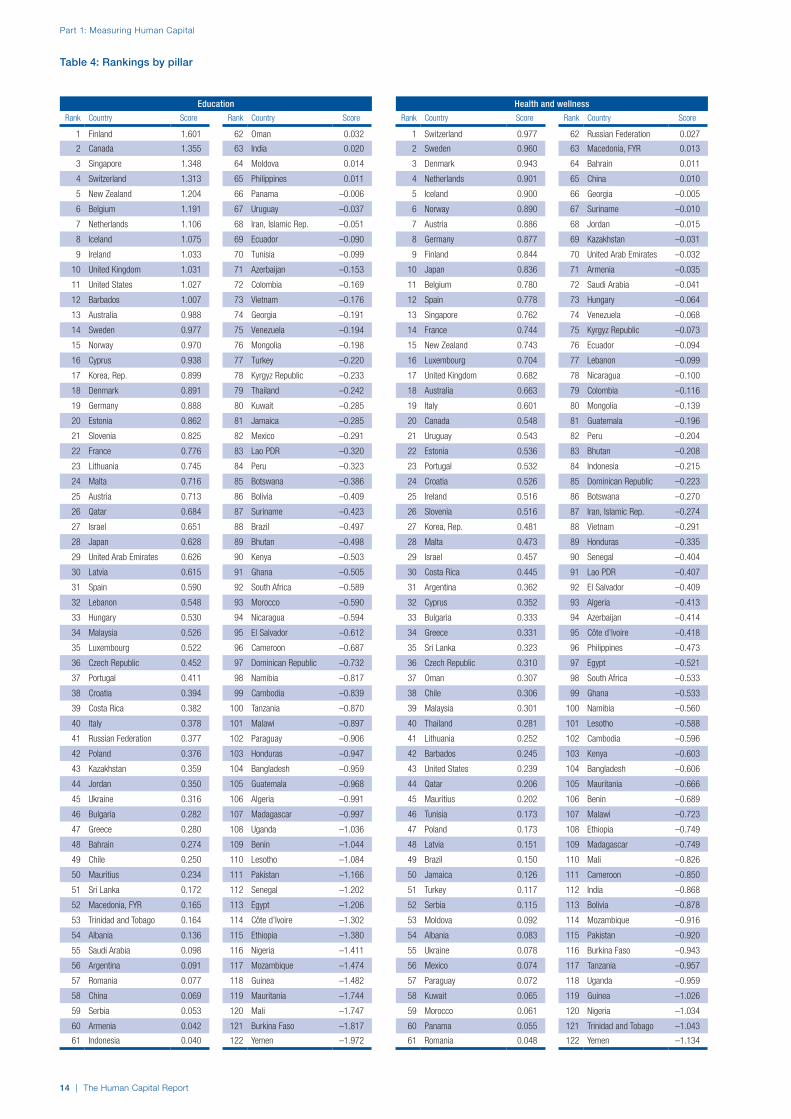
Table 4: Rankings by pillar
Rank Country Score
1 Finland 1.601
2 Canada 1.355
3 Singapore 1.348
4 Switzerland 1.313
5 New Zealand 1.204
6 Belgium 1.191
7 Netherlands 1.106
8 Iceland 1.075
9 Ireland 1.033
10 United Kingdom 1.031
11 United States 1.027
12 Barbados 1.007
13 Australia 0.988
14 Sweden 0.977
15 Norway 0.970
16 Cyprus 0.938
17 Korea, Rep. 0.899
18 Denmark 0.891
19 Germany 0.888
20 Estonia 0.862
21 Slovenia 0.825
22 France 0.776
23 Lithuania 0.745
24 Malta 0.716
25 Austria 0.713
26 Qatar 0.684
27 Israel 0.651
28 Japan 0.628
29 United Arab Emirates 0.626
30 Latvia 0.615
31 Spain 0.590
32 Lebanon 0.548
33 Hungary 0.530
34 Malaysia 0.526
35 Luxembourg 0.522
36 Czech Republic 0.452
37 Portugal 0.411
38 Croatia 0.394
39 Costa Rica 0.382
40 Italy 0.378
41 Russian Federation 0.377
42 Poland 0.376
43 Kazakhstan 0.359
44 Jordan 0.350
45 Ukraine 0.316
46 Bulgaria 0.282
47 Greece 0.280
48 Bahrain 0.274
49 Chile 0.250
50 Mauritius 0.234
51 Sri Lanka 0.172
52 Macedonia, FYR 0.165
53 Trinidad and Tobago 0.164
54 Albania 0.136
55 Saudi Arabia 0.098
56 Argentina 0.091
57 Romania 0.077
58 China 0.069
59 Serbia 0.053
60 Armenia 0.042
61 Indonesia 0.040
Rank Country Score
62 Oman 0.032
63 India 0.020
64 Moldova 0.014
65 Philippines 0.011
66 Panama –0.006
67 Uruguay –0.037
68 Iran, Islamic Rep. –0.051
69 Ecuador –0.090
70 Tunisia –0.099
71 Azerbaijan –0.153
72 Colombia –0.169
73 Vietnam –0.176
74 Georgia –0.191
75 Venezuela –0.194
76 Mongolia –0.198
77 Turkey –0.220
78 Kyrgyz Republic –0.233
79 Thailand –0.242
80 Kuwait –0.285
81 Jamaica –0.285
82 Mexico –0.291
83 Lao PDR –0.320
84 Peru –0.323
85 Botswana –0.386
86 Bolivia –0.409
87 Suriname –0.423
88 Brazil –0.497
89 Bhutan –0.498
90 Kenya –0.503
91 Ghana –0.505
92 South Africa –0.589
93 Morocco –0.590
94 Nicaragua –0.594
95 El Salvador –0.612
96 Cameroon –0.687
97 Dominican Republic –0.732
98 Namibia –0.817
99 Cambodia –0.839
100 Tanzania –0.870
101 Malawi –0.897
102 Paraguay –0.906
103 Honduras –0.947
104 Bangladesh –0.959
105 Guatemala –0.968
106 Algeria –0.991
107 Madagascar –0.997
108 Uganda –1.036
109 Benin –1.044
110 Lesotho –1.084
111 Pakistan –1.166
112 Senegal –1.202
113 Egypt –1.206
114 Côte d’Ivoire –1.302
115 Ethiopia –1.380
116 Nigeria –1.411
117 Mozambique –1.474
118 Guinea –1.482
119 Mauritania –1.744
120 Mali –1.747
121 Burkina Faso –1.817
122 Yemen –1.972
Rank Country Score
1 Switzerland 0.977
2 Sweden 0.960
3 Denmark 0.943
4 Netherlands 0.901
5 Iceland 0.900
6 Norway 0.890
7 Austria 0.886
8 Germany 0.877
9 Finland 0.844
10 Japan 0.836
11 Belgium 0.780
12 Spain 0.778
13 Singapore 0.762
14 France 0.744
15 New Zealand 0.743
16 Luxembourg 0.704
17 United Kingdom 0.682
18 Australia 0.663
19 Italy 0.601
20 Canada 0.548
21 Uruguay 0.543
22 Estonia 0.536
23 Portugal 0.532
24 Croatia 0.526
25 Ireland 0.516
26 Slovenia 0.516
27 Korea, Rep. 0.481
28 Malta 0.473
29 Israel 0.457
30 Costa Rica 0.445
31 Argentina 0.362
32 Cyprus 0.352
33 Bulgaria 0.333
34 Greece 0.331
35 Sri Lanka 0.323
36 Czech Republic 0.310
37 Oman 0.307
38 Chile 0.306
39 Malaysia 0.301
40 Thailand 0.281
41 Lithuania 0.252
42 Barbados 0.245
43 United States 0.239
44 Qatar 0.206
45 Mauritius 0.202
46 Tunisia 0.173
47 Poland 0.173
48 Latvia 0.151
49 Brazil 0.150
50 Jamaica 0.126
51 Turkey 0.117
52 Serbia 0.115
53 Moldova 0.092
54 Albania 0.083
55 Ukraine 0.078
56 Mexico 0.074
57 Paraguay 0.072
58 Kuwait 0.065
59 Morocco 0.061
60 Panama 0.055
61 Romania 0.048
Rank Country Score
62 Russian Federation 0.027
63 Macedonia, FYR 0.013
64 Bahrain 0.011
65 China 0.010
66 Georgia –0.005
67 Suriname –0.010
68 Jordan –0.015
69 Kazakhstan –0.031
70 United Arab Emirates –0.032
71 Armenia –0.035
72 Saudi Arabia –0.041
73 Hungary –0.064
74 Venezuela –0.068
75 Kyrgyz Republic –0.073
76 Ecuador –0.094
77 Lebanon –0.099
78 Nicaragua –0.100
79 Colombia –0.116
80 Mongolia –0.139
81 Guatemala –0.196
82 Peru –0.204
83 Bhutan –0.208
84 Indonesia –0.215
85 Dominican Republic –0.223
86 Botswana –0.270
87 Iran, Islamic Rep. –0.274
88 Vietnam –0.291
89 Honduras –0.335
90 Senegal –0.404
91 Lao PDR –0.407
92 El Salvador –0.409
93 Algeria –0.413
94 Azerbaijan –0.414
95 Côte d’Ivoire –0.418
96 Philippines –0.473
97 Egypt –0.521
98 South Africa –0.533
99 Ghana –0.533
100 Namibia –0.560
101 Lesotho –0.588
102 Cambodia –0.596
103 Kenya –0.603
104 Bangladesh –0.606
105 Mauritania –0.666
106 Benin –0.689
107 Malawi –0.723
108 Ethiopia –0.749
109 Madagascar –0.749
110 Mali –0.826
111 Cameroon –0.850
112 India –0.868
113 Bolivia –0.878
114 Mozambique –0.916
115 Pakistan –0.920
116 Burkina Faso –0.943
117 Tanzania –0.957
118 Uganda –0.959
119 Guinea –1.026
120 Nigeria –1.034
121 Trinidad and Tobago –1.043
122 Yemen –1.134
Education Health and wellness

The Human Capital Report | 15
Part 1: Measuring Human Capital
Rank Country Score
1 Switzerland 1.736
2 Singapore 1.345
3 Finland 1.250
4 United States 1.235
5 Norway 1.182
6 Sweden 1.154
7 Qatar 1.154
8 Netherlands 1.150
9 Germany 1.149
10 United Kingdom 1.072
11 Japan 1.027
12 Denmark 0.932
13 Luxembourg 0.928
14 Austria 0.886
15 Canada 0.875
16 Iceland 0.826
17 New Zealand 0.804
18 Malaysia 0.736
19 Australia 0.675
20 Israel 0.674
21 Belgium 0.673
22 Ireland 0.645
23 Korea, Rep. 0.596
24 United Arab Emirates 0.527
25 France 0.520
26 China 0.516
27 Thailand 0.482
28 Costa Rica 0.378
29 Barbados 0.340
30 Malta 0.330
31 Panama 0.301
32 Indonesia 0.262
33 Cyprus 0.252
34 Portugal 0.243
35 Kenya 0.226
36 Czech Republic 0.210
37 Chile 0.194
38 Philippines 0.164
39 Estonia 0.142
40 Kazakhstan 0.107
41 Slovenia 0.106
42 Cambodia 0.104
43 Bahrain 0.099
44 Madagascar 0.084
45 Brazil 0.078
46 Guatemala 0.035
47 Ecuador 0.034
48 Mexico 0.011
49 India 0.005
50 Peru –0.003
51 Senegal –0.006
52 Malawi –0.007
53 Trinidad and Tobago –0.008
54 Latvia –0.011
55 Azerbaijan –0.016
56 Lithuania –0.018
57 Vietnam –0.040
58 Tanzania –0.087
59 Lao PDR –0.097
60 Ghana –0.099
61 Saudi Arabia –0.099
Rank Country Score
62 Sri Lanka –0.127
63 Poland –0.139
64 Mauritius –0.143
65 Uganda –0.147
66 Russian Federation –0.163
67 Ukraine –0.166
68 El Salvador –0.175
69 Bolivia –0.185
70 Spain –0.185
71 Albania –0.207
72 Côte d’Ivoire –0.208
73 Colombia –0.229
74 Bhutan –0.231
75 Italy –0.243
76 Jamaica –0.246
77 Hungary –0.275
78 Oman –0.280
79 Cameroon –0.295
80 Kuwait –0.297
81 Nigeria –0.328
82 Mozambique –0.337
83 Turkey –0.337
84 Uruguay –0.340
85 Romania –0.364
86 Greece –0.365
87 Burkina Faso –0.374
88 Croatia –0.378
89 Nicaragua –0.386
90 Honduras –0.397
91 Dominican Republic –0.401
92 Argentina –0.408
93 Botswana –0.416
94 Paraguay –0.433
95 Lesotho –0.438
96 Lebanon –0.458
97 Jordan –0.481
98 Benin –0.481
99 Morocco –0.485
100 Bulgaria –0.496
101 Tunisia –0.499
102 Georgia –0.514
103 Bangladesh –0.543
104 Pakistan –0.545
105 South Africa –0.588
106 Mongolia –0.610
107 Mali –0.614
108 Namibia –0.620
109 Suriname –0.640
110 Moldova –0.654
111 Ethiopia –0.660
112 Kyrgyz Republic –0.673
113 Armenia –0.678
114 Venezuela –0.746
115 Macedonia, FYR –0.784
116 Egypt –0.878
117 Guinea –0.911
118 Serbia –0.945
119 Iran, Islamic Rep. –1.059
120 Yemen –1.320
121 Algeria –1.345
122 Mauritania –1.404
Rank Country Score
1 Finland 1.926
2 Switzerland 1.793
3 Germany 1.522
4 Netherlands 1.484
5 Singapore 1.471
6 Austria 1.424
7 United Kingdom 1.384
8 Norway 1.373
9 Luxembourg 1.372
10 Sweden 1.351
11 Denmark 1.330
12 United Arab Emirates 1.320
13 Japan 1.302
14 Belgium 1.296
15 Qatar 1.294
16 United States 1.181
17 Canada 1.168
18 New Zealand 1.163
19 Ireland 1.103
20 Iceland 1.026
21 Saudi Arabia 1.023
22 Malaysia 1.014
23 Australia 0.999
24 France 0.943
25 Oman 0.822
26 Estonia 0.745
27 Barbados 0.730
28 Spain 0.679
29 Portugal 0.624
30 Korea, Rep. 0.582
31 Czech Republic 0.576
32 Israel 0.568
33 Bahrain 0.544
34 Panama 0.477
35 Chile 0.471
36 Lithuania 0.462
37 Malta 0.371
38 Slovenia 0.332
39 Italy 0.329
40 Kuwait 0.281
41 Cyprus 0.268
42 South Africa 0.265
43 Latvia 0.237
44 Uruguay 0.219
45 Turkey 0.181
46 Jordan 0.167
47 China 0.147
48 Thailand 0.112
49 Mauritius 0.102
50 Costa Rica 0.077
51 Kazakhstan 0.061
52 Brazil 0.054
53 Mexico –0.022
54 Macedonia, FYR –0.033
55 Azerbaijan –0.044
56 Trinidad and Tobago –0.047
57 Poland –0.064
58 Indonesia –0.082
59 Botswana –0.090
60 Croatia –0.146
61 Namibia –0.160
Rank Country Score
62 Hungary –0.190
63 Russian Federation –0.201
64 Armenia –0.201
65 Guatemala –0.234
66 Tunisia –0.236
67 India –0.239
68 Ecuador –0.244
69 Jamaica –0.279
70 Sri Lanka –0.288
71 Greece –0.291
72 Colombia –0.296
73 Vietnam –0.302
74 Bulgaria –0.311
75 Ghana –0.317
76 Georgia –0.321
77 Morocco –0.328
78 Philippines –0.344
79 Kenya –0.347
80 Lao PDR –0.364
81 Peru –0.377
82 El Salvador –0.425
83 Romania –0.463
84 Argentina –0.527
85 Bhutan –0.545
86 Egypt –0.555
87 Honduras –0.561
88 Iran, Islamic Rep. –0.564
89 Serbia –0.596
90 Suriname –0.607
91 Dominican Republic –0.641
92 Mongolia –0.651
93 Cambodia –0.688
94 Nicaragua –0.704
95 Pakistan –0.718
96 Ukraine –0.725
97 Bolivia –0.736
98 Nigeria –0.740
99 Uganda –0.767
100 Kyrgyz Republic –0.781
101 Senegal –0.794
102 Moldova –0.801
103 Tanzania –0.805
104 Lebanon –0.870
105 Albania –0.874
106 Malawi –0.890
107 Lesotho –0.894
108 Paraguay –0.916
109 Mali –0.949
110 Bangladesh –1.019
111 Ethiopia –1.056
112 Algeria –1.066
113 Cameroon –1.082
114 Côte d’Ivoire –1.107
115 Mozambique –1.135
116 Yemen –1.153
117 Burkina Faso –1.173
118 Madagascar –1.238
119 Benin –1.244
120 Venezuela –1.250
121 Mauritania –1.373
122 Guinea –1.667
Table 4: Rankings by pillar (cont’d.)
Workforce and employment Enabling environment

Part 1: Measuring Human Capital
16 | The Human Capital Report
Table 5: Rankings by region
Asia and the Pacific
Rank Country Score
3 Singapore 1.232
12 New Zealand 0.978
15 Japan 0.948
19 Australia 0.831
22 Malaysia 0.644
23 Korea, Rep. 0.640
43 China 0.186
44 Thailand 0.158
50 Sri Lanka 0.020
53 Indonesia 0.001
66 Philippines –0.161
70 Vietnam –0.202
78 India –0.270
80 Lao PDR –0.297
88 Bhutan –0.370
89 Mongolia –0.400
94 Iran, Islamic Rep. –0.487
96 Cambodia –0.505
110 Bangladesh –0.782
112 Pakistan –0.837
Europe and Central Asia
Rank Country Score
1 Switzerland 1.455
2 Finland 1.406
4 Netherlands 1.161
5 Sweden 1.111
6 Germany 1.109
7 Norway 1.104
8 United Kingdom 1.042
9 Denmark 1.024
11 Belgium 0.985
13 Austria 0.977
14 Iceland 0.957
17 Luxembourg 0.881
20 Ireland 0.824
21 France 0.746
27 Estonia 0.571
28 Malta 0.473
29 Spain 0.465
30 Portugal 0.453
31 Cyprus 0.452
32 Slovenia 0.445
33 Czech Republic 0.387
34 Lithuania 0.360
37 Italy 0.266
38 Latvia 0.248
45 Kazakhstan 0.124
46 Croatia 0.099
49 Poland 0.087
51 Russian Federation 0.010
54 Hungary 0.000
55 Greece –0.011
56 Bulgaria –0.048
60 Turkey –0.065
63 Ukraine –0.124
64 Azerbaijan –0.157
65 Macedonia, FYR –0.160
69 Romania –0.176
72 Albania –0.216
73 Armenia –0.218
77 Georgia –0.258
83 Moldova –0.337
85 Serbia –0.343
92 Kyrgyz Republic –0.440
Latin America and the Caribbean
Rank Country Score
26 Barbados 0.581
35 Costa Rica 0.320
36 Chile 0.305
42 Panama 0.207
48 Uruguay 0.096
57 Brazil –0.054
58 Mexico –0.057
61 Ecuador –0.099
62 Argentina –0.120
68 Jamaica –0.171
71 Colombia –0.202
75 Peru –0.227
76 Trinidad and Tobago –0.233
84 Guatemala –0.341
90 El Salvador –0.405
91 Suriname –0.420
93 Nicaragua –0.446
95 Dominican Republic –0.499
98 Paraguay –0.546
99 Bolivia –0.552
100 Honduras –0.560
101 Venezuela –0.564
Index include gender gap indicators for education and the workforce, the country’s ability to attract talent, and reported depression in the Well–being sub–pillar.
Australia (19) and Malaysia (22) have almost identical scores on the Workforce and Employment and Enabling Environment pillars, but their performance within the pillars varies. Australia ranks poorly on its labour force participation of those over the age of 65, whereas Malaysia, the highest of the region’s upper–middle income countries, ranks very low for the Economic participation gender gap indicator. Malaysia performs well on most of the qualitative talent and training indicators in the Workforce and Employment pillar. Australia performs well
on the majority of indicators in Enabling Environment, in particular those concerning the legal framework. Australia also performs well on the Educational attainment of the population over 25 indicator.
The Republic of Korea (23) has its strongest performance on the Education pillar, with a rank of 17. Korea’s enrolment rates for tertiary education take the top spot overall and the educational attainment of the adult population has consistently strong ranks. Despite good scores across the qualitative indicators, overall Quality of the education system was particularly low at 52nd position. Korea’s scores on the Enabling Environment pillar are pulled down by low scores on the Social mobility

The Human Capital Report | 17
Part 1: Measuring Human Capital
Table 5: Rankings by region (cont’d.)
Middle East and North Africa
Rank Country Score
18 Qatar 0.834
24 United Arab Emirates 0.610
25 Israel 0.587
39 Saudi Arabia 0.245
40 Bahrain 0.232
41 Oman 0.220
52 Jordan 0.005
59 Kuwait –0.059
67 Tunisia –0.165
74 Lebanon –0.220
82 Morocco –0.336
111 Egypt –0.790
115 Algeria –0.954
121 Mauritania –1.297
122 Yemen –1.395
North America
Rank Country Score
10 Canada 0.987
16 United States 0.920
Sub–Saharan Africa
Rank Country Score
47 Mauritius 0.099
79 Botswana –0.291
81 Kenya –0.306
86 South Africa –0.361
87 Ghana –0.363
97 Namibia –0.539
102 Senegal –0.602
103 Malawi –0.629
104 Tanzania –0.680
105 Madagascar –0.725
106 Uganda –0.727
107 Cameroon –0.728
108 Lesotho –0.751
109 Côte d’Ivoire –0.759
113 Benin –0.865
114 Nigeria –0.878
116 Ethiopia –0.961
117 Mozambique –0.966
118 Mali –1.034
119 Burkina Faso –1.077
120 Guinea –1.272
and Social safety net protection indicators. Korea also has a notably low score on the Business impact of non–communicable diseases indicator, in the Health and Wellness pillar.
China’s (43) positions across the four pillars vary greatly from the 26th rank on the Workforce and Employment pillar to 65th on the Health and Wellness pillar, the latter due in part to weak scores across the Health and Services sub–pillars. China’s overall scores are boosted by good performance on the Talent sub–pillar of indicators, such as the Attraction and Retention of talent. The country’s highest scores are from the Labour force participation of the 15 to 64 age group and Pay relating to productivity measures indicators.
Thailand (44) also has a hugely varied distribution of rankings across the pillars, ranging from 27th on Workforce and Employment to 79th in Education. Thailand ranks 94th on the Enrolment in primary school indicator, and the majority of the education indicators are in the bottom half of the sample countries. Thailand’s very low levels of unemployment yield two top–five rankings for these indicators. Good performances on the qualitative talent indicators are also strong points.
Sri Lanka’s (50) scores are boosted by good performances on the Health and Wellness pillar, but it performs poorly on the labour force participation indicators (103). India (78) performs well on the Workforce and Employment pillar (49) while holding only 112th position for Health and Wellness. India’s high prevalence of stunting and wasting, low scores in sanitation and hygiene and
second–to–bottom rank on the health gender gap indicator are some of the variables driving down the scores for India. India’s Collaboration sub–pillar scores boost its ranking on the Enabling Environment pillar.
Indonesia’s (53) ranks vary between 32nd on the Workforce and Employment pillar to 84th on the Health and Wellness pillar. A relatively low unemployment rate and good labour force participation of the over 65s, as well as a good performance on some of the qualitative talent indicators, support Indonesia’s strong overall performance on the Workforce and Employment pillar. Paradoxically, the country’s strongest performance overall is on the Well–being sub–pillar, with top and second rankings for the Depression and Stress indicators respectively.
The Philippines (66) follows a similar profile to Indonesia with a 38th ranking on the Workforce and Employment pillar and 96th on Health and Wellness. The Philippines has top scores for the education and health gender gap indicators as well as a strong 15th rank for economic participation. Ranks below 100 on Well–being sub–pillar indicators pull down the aggregate Health and Wellness scores.
Vietnam holds 70th position and Lao PDR holds 80th position. Bhutan’s (88) strong labour force participation and in particular low unemployment rates drive strong scores on the Workforce and Employment pillar. However, weak scores in technology absorption and training pull down the overall ranking to 74th spot.
Mongolia’s (89) lowest performance is on the Workforce and Employment pillar, where the country

Part 1: Measuring Human Capital
18 | The Human Capital Report
Low income
Rank Country Score
81 Kenya –0.306
92 Kyrgyz Republic –0.440
96 Cambodia –0.505
103 Malawi –0.629
104 Tanzania –0.680
105 Madagascar –0.725
106 Uganda –0.727
110 Bangladesh –0.782
113 Benin –0.865
116 Ethiopia –0.961
117 Mozambique –0.966
118 Mali –1.034
119 Burkina Faso –1.077
120 Guinea –1.272
Lower–middle income
Rank Country Score
50 Sri Lanka 0.020
53 Indonesia 0.001
63 Ukraine –0.124
66 Philippines –0.161
70 Vietnam –0.202
73 Armenia –0.218
77 Georgia –0.258
78 India –0.270
80 Lao PDR –0.297
82 Morocco –0.336
83 Moldova –0.337
84 Guatemala –0.341
87 Ghana –0.363
88 Bhutan –0.370
89 Mongolia –0.400
90 El Salvador –0.405
93 Nicaragua –0.446
98 Paraguay –0.546
99 Bolivia –0.552
100 Honduras –0.560
102 Senegal –0.602
107 Cameroon –0.728
108 Lesotho –0.751
109 Côte d’Ivoire –0.759
111 Egypt –0.790
112 Pakistan –0.837
114 Nigeria –0.878
121 Mauritania –1.297
122 Yemen –1.395
Upper–middle income
Rank Country Score
22 Malaysia 0.644
35 Costa Rica 0.320
42 Panama 0.207
43 China 0.186
44 Thailand 0.158
45 Kazakhstan 0.124
47 Mauritius 0.099
52 Jordan 0.005
54 Hungary 0.000
56 Bulgaria –0.048
57 Brazil –0.054
58 Mexico –0.057
60 Turkey –0.065
61 Ecuador –0.099
62 Argentina –0.120
64 Azerbaijan –0.157
65 Macedonia, FYR –0.160
67 Tunisia –0.165
68 Jamaica –0.171
69 Romania –0.176
71 Colombia –0.202
72 Albania –0.216
74 Lebanon –0.220
75 Peru –0.227
79 Botswana –0.291
85 Serbia –0.343
86 South Africa –0.361
91 Suriname –0.420
94 Iran, Islamic Rep. –0.487
95 Dominican Republic –0.499
97 Namibia –0.539
101 Venezuela –0.564
115 Algeria –0.954
High income
Rank Country Score
1 Switzerland 1.455
2 Finland 1.406
3 Singapore 1.232
4 Netherlands 1.161
5 Sweden 1.111
6 Germany 1.109
7 Norway 1.104
8 United Kingdom 1.042
9 Denmark 1.024
10 Canada 0.987
11 Belgium 0.985
12 New Zealand 0.978
13 Austria 0.977
14 Iceland 0.957
15 Japan 0.948
16 United States 0.920
17 Luxembourg 0.881
18 Qatar 0.834
19 Australia 0.831
20 Ireland 0.824
21 France 0.746
23 Korea, Rep. 0.640
24 United Arab Emirates 0.610
25 Israel 0.587
26 Barbados 0.581
27 Estonia 0.571
28 Malta 0.473
29 Spain 0.465
30 Portugal 0.453
31 Cyprus 0.452
32 Slovenia 0.445
33 Czech Republic 0.387
34 Lithuania 0.360
36 Chile 0.305
37 Italy 0.266
38 Latvia 0.248
39 Saudi Arabia 0.245
40 Bahrain 0.232
41 Oman 0.220
46 Croatia 0.099
48 Uruguay 0.096
49 Poland 0.087
51 Russian Federation 0.010
55 Greece –0.011
59 Kuwait –0.059
76 Trinidad and Tobago –0.233
Table 6: Rankings by income group*
*Note: Income classifications are taken from the World Bank, which classifies economies into four income categories based on GNI per capita: high income, upper–middle income, lower–middle income and low income.
The Human Capital Report | 19
Part 1: Measuring Human Capital
Overall index Education Health and wellness Workforce and employment Enabling environment
Country Rank Score Rank Score Rank Score Rank Score Rank Score
BRICS –0.169 –0.173 –0.306 –0.167 –0.030
China 43 0.186 58 0.069 65 0.010 26 0.516 47 0.147
Russian Federation 51 0.010 41 0.377 62 0.027 66 –0.163 63 –0.201
Brazil 57 –0.054 88 –0.497 49 0.150 45 0.078 52 0.054
India 78 –0.270 63 0.020 112 –0.868 49 0.005 67 –0.239
South Africa 86 –0.361 92 –0.589 98 –0.533 105 –0.588 42 0.265
OECD 0.713 0.766 0.599 0.586 0.899
Switzerland 1 1.455 4 1.313 1 0.977 1 1.736 2 1.793
Finland 2 1.406 1 1.601 9 0.844 3 1.250 1 1.926
Netherlands 4 1.161 7 1.106 4 0.901 8 1.150 4 1.484
Sweden 5 1.111 14 0.977 2 0.960 6 1.154 10 1.351
Germany 6 1.109 19 0.888 8 0.877 9 1.149 3 1.522
Norway 7 1.104 15 0.970 6 0.890 5 1.182 8 1.373
United Kingdom 8 1.042 10 1.031 17 0.682 10 1.072 7 1.384
Denmark 9 1.024 18 0.891 3 0.943 12 0.932 11 1.330
Canada 10 0.987 2 1.355 20 0.548 15 0.875 17 1.168
Belgium 11 0.985 6 1.191 11 0.780 21 0.673 14 1.296
New Zealand 12 0.978 5 1.204 15 0.743 17 0.804 18 1.163
Austria 13 0.977 25 0.713 7 0.886 14 0.886 6 1.424
Iceland 14 0.957 8 1.075 5 0.900 16 0.826 20 1.026
Japan 15 0.948 28 0.628 10 0.836 11 1.027 13 1.302
United States 16 0.920 11 1.027 43 0.239 4 1.235 16 1.181
Luxembourg 17 0.881 35 0.522 16 0.704 13 0.928 9 1.372
Australia 19 0.831 13 0.988 18 0.663 19 0.675 23 0.999
Ireland 20 0.824 9 1.033 25 0.516 22 0.645 19 1.103
France 21 0.746 22 0.776 14 0.744 25 0.520 24 0.943
Korea, Rep. 23 0.640 17 0.899 27 0.481 23 0.596 30 0.582
Israel 25 0.587 27 0.651 29 0.457 20 0.674 32 0.568
Estonia 27 0.571 20 0.862 22 0.536 39 0.142 26 0.745
Spain 29 0.465 31 0.590 12 0.778 70 –0.185 28 0.679
Portugal 30 0.453 37 0.411 23 0.532 34 0.243 29 0.624
Slovenia 32 0.445 21 0.825 26 0.516 41 0.106 38 0.332
Czech Republic 33 0.387 36 0.452 36 0.310 36 0.210 31 0.576
Chile 36 0.305 49 0.250 38 0.306 37 0.194 35 0.471
Italy 37 0.266 40 0.378 19 0.601 75 –0.243 39 0.329
Poland 49 0.087 42 0.376 47 0.173 63 –0.139 57 –0.064
Hungary 54 0.000 33 0.530 73 –0.064 77 –0.275 62 –0.190
Greece 55 –0.011 47 0.280 34 0.331 86 –0.365 71 –0.291
Mexico 58 –0.057 82 –0.291 56 0.074 48 0.011 53 –0.022
Turkey 60 –0.065 77 –0.220 51 0.117 83 –0.337 45 0.181
ASEAN 0.109 0.043 –0.080 0.369 0.102
Singapore 3 1.232 3 1.348 13 0.762 2 1.345 5 1.471
Malaysia 22 0.644 34 0.526 39 0.301 18 0.736 22 1.014
Thailand 44 0.158 79 –0.242 40 0.281 27 0.482 48 0.112
Indonesia 53 0.001 61 0.040 84 –0.215 32 0.262 58 –0.082
Philippines 66 –0.161 65 0.011 96 –0.473 38 0.164 78 –0.344
Vietnam 70 –0.202 73 –0.176 88 –0.291 57 –0.040 73 –0.302
Lao PDR 80 –0.297 83 –0.320 91 –0.407 59 –0.097 80 –0.364
Cambodia 96 –0.505 99 –0.839 102 –0.596 42 0.104 93 –0.688
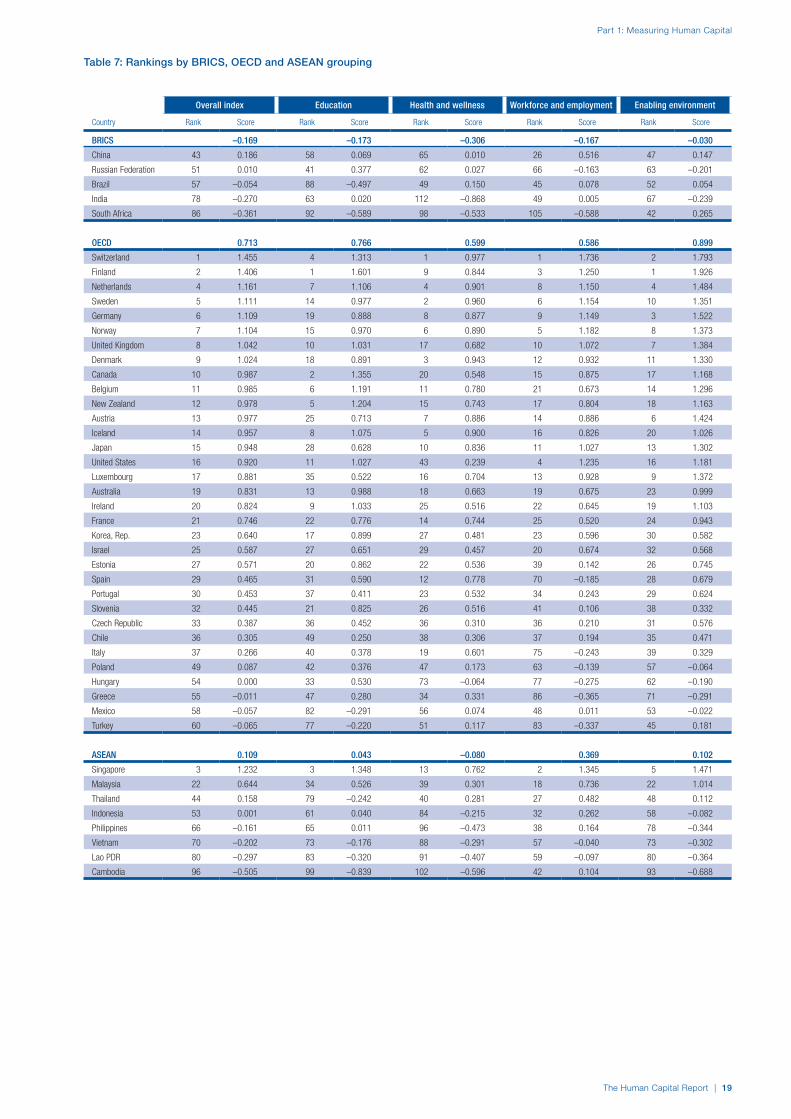
Table 7: Rankings by BRICS, OECD and ASEAN grouping

Part 1: Measuring Human Capital
20 | The Human Capital Report
scores 106th. Although Mongolia takes the top spot for the Economic participation gender gap indicator, Mongolia is in last position for the Training services indicator. Mongolia shows a stronger performance on the Education pillar where its primary and tertiary enrolment rates are both in the top 40 rankings.
Iran (94) is the lowest of the upper–middle income economies represented in the Asia and Pacific region. Iran has a wide distribution of ranks across the four pillars, from 68th for Education to 119th for Workforce and Employment. Strong enrolment rates push up Iran’s scores for the former pillar, whereas bottom five positions for the Economic participation gender gap and Labour force participation (15–64) indicators contribute to driving down the aggregate scores for the latter pillar. Cambodia (96) is followed by Bangladesh (110) and Pakistan (112).
EUROPE AND CENTRAL ASIAEurope and Central Asia holds the second highest overall rank of the six regions in the Index, with a top performance on Health and Wellness and second position on Enabling Environment. Two–thirds of the region’s countries are high–income economies that dominate the top half of the global rankings across all categories. With eight of the top ten in the region and thirteen in the top 20, the Europe and Central Asia region has only fifteen of its countries outside the top 50.
Switzerland (1) and Finland (2) hold the highest ranks on the Index. In addition to investment in human capital
across health, education and employment, both countries are able to leverage strong returns through creating an efficient, effective ecosystem or enabling environment. Switzerland and Finland hold the top four spots across all pillars with the exception of Finland on the Health and Wellness pillar where Finland ranks ninth place.
The Netherlands (4), Sweden (5), Germany (6) and Norway (7) follow next. Sweden, in tenth spot, trails Germany (third) on the Enabling Environment pillar, mainly due to Germany’s more advanced scores on the Cluster development and Internal infrastructure indicators. However Sweden’s second position globally for Health and Wellness, due to low impact of NCDs, nudges the country ahead in the overall rankings. Norway’s Education and Workforce and Employment pillars are similar to Denmark’s, however Norway fares better than its neighbour on the unemployment indicators.
The UK (8) leads Denmark (9) on all but the Health and Wellness pillar. The UK’s Health sub–pillar scores are held back due to obesity and well–being indicators. Belgium (11), Austria (13) and Iceland (14) have good overall performances on the Health and Wellness pillar, due to excellent healthcare systems and, in particular for Iceland, high scores on the communicable and non–communicable disease indicators. Belgium and Iceland both post very strong scores in Education, which supports their overall rankings. Austria’s 25th position on the Education pillar is the weakest performance of the three countries on any of the pillars, but its ICT and physical infrastructure ensures
–1.0
–0.8
–0.6
–0.4
–0.2
0.0
0.2
0.4
0.6
0.8
1.0
Sub-Saharan AfricaMiddle East and North Africa
Latin America and the Caribbean
Asia and the Pacific
Europe and Central Asia
North America
Figure 2: Regional performance on the Human Capital Index
Source: Human Capital Index 2013. Scores are weighted by population; population data from United Nations Department of Economic and Social Affairs, World Population Prospects, rev. 2012.
Pilla
r sco
re

The Human Capital Report | 21
Part 1: Measuring Human Capital
a strong overall ranking on the Enabling Environment pillar at sixth spot, ahead of Belgium in the 14th and Iceland in 20th positions.
Luxembourg (17) ranges from ninth position on the Enabling Environment pillar, due to strengths in Legal infrastructure and Social mobility, to 35th on Education, where enrolment rates and qualitative measures of education have a lower performance. Ireland’s (20) strengths lie in Education, in contrast to France’s (21) performance, which places it 13 positions below Ireland on this pillar.
Estonia (27) has a consistent performance across all pillars except for Workforce and Employment, which has the country in 39th spot. Estonia has excellent scores on the Tertiary attainment and Internet access in schools indicators, helping to drive up the overall results for this pillar, although high rates of unemployment are a weak factor. Malta’s (28) strength is on the Education pillar, while Infrastructure and Collaboration indicators weaken performance on the Enabling Environment pillar.
Spain (29) and Portugal (30) share similar ranks for Enabling Environment, but within this pillar they demonstrate different strengths and weaknesses. Spain performs very well on the Health and Wellness pillar with a 12th spot ranking; however a very poor 70th rank on the Workforce and Employment pillar due to low labour force participation and high unemployment brings the overall scores down significantly. Spain’s participation and access measures for education are strong but qualitative
measures are low in comparison. Portugal’s rankings are supported by the country’s performance on the Health and Wellness pillar, however the Education pillar is Portugal’s main weakness, in particular the relatively low levels of educational attainment in the current workforce.
Cyprus (31) has strong scores on the qualitative education indicators. Below average scores in well–being reduce the performance on the Health and Wellness pillar and several weak indicator scores result in the lowest performance for Cyprus on the Enabling Environment pillar.
Slovenia (32) has a varied performance across the pillars, with Education in 21st position due to high levels of educational attainment of the adult population, and Workforce and Employment in 41st position, where unemployment impacts profoundly on the overall scores. The Czech Republic (33) has a notably homogenous performance across all pillars with a rank of 36 for all pillars, with the exception of a stronger performance on Enabling Environment, in particular for the group of infrastructure–related variables.
Lithuania (34) and its neighbour Latvia (38) both demonstrate similar scores on the Workforce and Employment pillars. Italy’s (37) main strengths lie in the health of its population. With a rank of 19 in the Health and Wellness pillar, Italy has some of the top rankings in several indicators. However Italy’s lowest performance is the Workforce and Employment pillar, where it ranked at 75th, due to low levels of staff training and low perceptions of the use of technology within business. A notable
–1.2
–1.0
–0.8
–0.6
–0.4
–0.2
0.0
0.2
0.4
0.6
0.8
1.0
1.2
Sub-Saharan AfricaMiddle East and North Africa
Latin America and the Caribbean
Asia and the Pacific
Europe and Central Asia
North America
Figure 3: Regional performance on the Education pillar
Source: Human Capital Index 2013. Scores are weighted by population; population data from United Nations Department of Economic and Social Affairs, World Population Prospects, rev. 2012.
Pilla
r sco
re

Part 1: Measuring Human Capital
22 | The Human Capital Report
strength for Italy is its perceived top position in the State of cluster development indicator.
Croatia’s (46) performance in the legal and regulatory environment, brain drain concerns, an inability to attract talent and low scores on innovation contributed to its ranking. Kazakhstan (45), Poland (49) and the Russian Federation (51) have almost identical scores on the Education pillar, despite varying scores on the current access to education indicators. For the latter two countries this was their strongest performing pillar. Poland also leads the health rankings for the three countries with a rank of 47th on the Health and Wellness pillar, however Kazakhstan’s higher rankings on the remaining two pillars have ensured its higher overall position on the Human Capital Index. Excellent scores on the Participation sub–pillar drive a higher overall rank on the Workforce and Employment pillar. However, business leaders still indicate an inability of the country to source the required talent. Poland leads Russia in the Workforce and Employment pillar, especially in indicators of the Talent and Training sub–pillars. However, Russia has a stronger performance on the Participation sub–pillar.
Hungary’s (54) overall scores are driven by excellent results on the Education pillar, in particular rankings of first and fifth for primary and secondary attainment among the population over 25 years of age, while the Well–being indicators and obesity and non–communicable disease indicators supress performance on the Health and Wellness pillar. Greece (55) and Bulgaria (56)
follow next. Both hold similar aggregate scores on the Education and the Health and Wellness pillars, although within these groups Greece outperforms Bulgaria on the access to education indicators and Bulgaria leads Greece significantly on the health gender gap and stress indicators. Both countries have low scores across the Participation sub–pillar in the Workforce and Employment pillar.
Turkey (60) is the last of the Europe and Central Asia countries in the upper half of the overall Index rankings. Strengths on the Collaboration and Legal framework sub–pillars of the Enabling Environment pillar push this pillar to a rank of 45, and generally sound performances across the Health and Wellness pillar offset weaker performances on the Education and Workforce and Employment pillars, the latter being due to low levels of labour force participation and a significant gender gap in economic participation.
Ukraine’s (63) performance is varied across the categories with 45th position on the Education pillars in contrast to its 96th rank on Enabling Environment. Tertiary enrolment and gender parity in education support the 45th ranking while very low Social mobility, Legal infrastructure and Cluster development scores are behind the low Enabling Environment pillar score.
Azerbaijan (64)’s weakest pillar is Health and Wellness, especially the Survival and the Health sub–pillars, and it has one of the world’s lowest scores in the gender gap indicator. Macedonia, FYR (65), Romania (69) and Albania (72) follow next. Armenia’s (73) overall rank is reduced as a result of a very low score in the Workforce
–1.0
–0.8
–0.6
–0.4
–0.2
0.0
0.2
0.4
0.6
Sub-Saharan AfricaAsia and the Pacific
Middle East and North Africa
Latin America and the Caribbean
North AmericaEurope and Central Asia
Figure 4: Regional performance on the Health and Wellness pillar
Source: Human Capital Index 2013. Scores are weighted by population; population data from United Nations Department of Economic and Social Affairs, World Population Prospects, rev. 2012.
Pilla
r sco
re
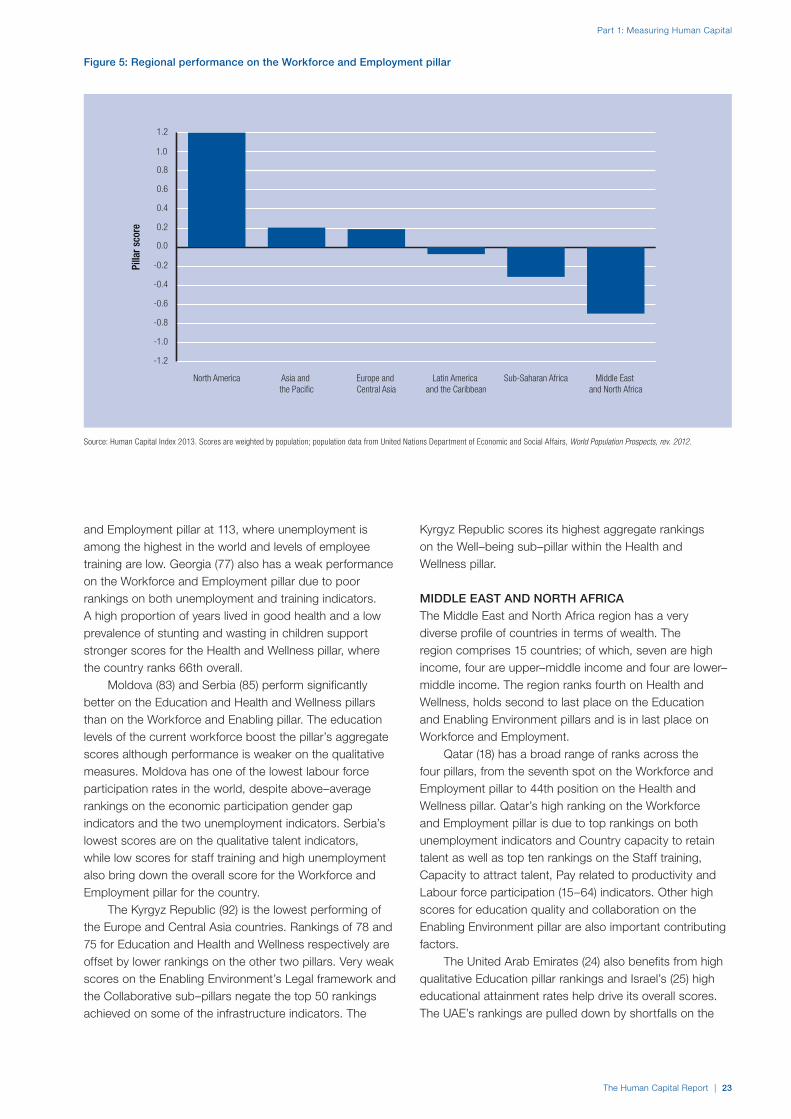
The Human Capital Report | 23
Part 1: Measuring Human Capital
and Employment pillar at 113, where unemployment is among the highest in the world and levels of employee training are low. Georgia (77) also has a weak performance on the Workforce and Employment pillar due to poor rankings on both unemployment and training indicators. A high proportion of years lived in good health and a low prevalence of stunting and wasting in children support stronger scores for the Health and Wellness pillar, where the country ranks 66th overall.
Moldova (83) and Serbia (85) perform significantly better on the Education and Health and Wellness pillars than on the Workforce and Enabling pillar. The education levels of the current workforce boost the pillar’s aggregate scores although performance is weaker on the qualitative measures. Moldova has one of the lowest labour force participation rates in the world, despite above–average rankings on the economic participation gender gap indicators and the two unemployment indicators. Serbia’s lowest scores are on the qualitative talent indicators, while low scores for staff training and high unemployment also bring down the overall score for the Workforce and Employment pillar for the country.
The Kyrgyz Republic (92) is the lowest performing of the Europe and Central Asia countries. Rankings of 78 and 75 for Education and Health and Wellness respectively are offset by lower rankings on the other two pillars. Very weak scores on the Enabling Environment’s Legal framework and the Collaborative sub–pillars negate the top 50 rankings achieved on some of the infrastructure indicators. The
Kyrgyz Republic scores its highest aggregate rankings on the Well–being sub–pillar within the Health and Wellness pillar.
MIDDLE EAST AND NORTH AFRICAThe Middle East and North Africa region has a very diverse profile of countries in terms of wealth. The region comprises 15 countries; of which, seven are high income, four are upper–middle income and four are lower–middle income. The region ranks fourth on Health and Wellness, holds second to last place on the Education and Enabling Environment pillars and is in last place on Workforce and Employment.
Qatar (18) has a broad range of ranks across the four pillars, from the seventh spot on the Workforce and Employment pillar to 44th position on the Health and Wellness pillar. Qatar’s high ranking on the Workforce and Employment pillar is due to top rankings on both unemployment indicators and Country capacity to retain talent as well as top ten rankings on the Staff training, Capacity to attract talent, Pay related to productivity and Labour force participation (15–64) indicators. Other high scores for education quality and collaboration on the Enabling Environment pillar are also important contributing factors.
The United Arab Emirates (24) also benefits from high qualitative Education pillar rankings and Israel’s (25) high educational attainment rates help drive its overall scores. The UAE’s rankings are pulled down by shortfalls on the
-1.2
-1.0
-0.8
-0.6
-0.4
-0.2
0.0
0.2
0.4
0.6
0.8
1.0
1.2
Middle East and North Africa
Sub-Saharan AfricaLatin America and the Caribbean
Europe and Central Asia
Asia and the Pacific
North America
Figure 5: Regional performance on the Workforce and Employment pillar
Source: Human Capital Index 2013. Scores are weighted by population; population data from United Nations Department of Economic and Social Affairs, World Population Prospects, rev. 2012.
Pilla
r sco
re

Part 1: Measuring Human Capital
24 | The Human Capital Report
Health and Wellness pillar with a last place ranking for Deaths under 60 from non–communicable diseases and a weak performance for Obesity. The Collaboration indicators of the Enabling Environment pillar are also helping to push up the overall scores for the UAE. Israel’s Life expectancy, Business impact of non–communicable diseases and health services indicators are strong performers for the country.
Saudi Arabia’s (39) pillar scores ranges from a 21st rank on Enabling Environment to a weaker 72nd spot on Health and Wellness. The country scores well on all indicators of the former, with the exception of Internet access, where usage rates are outside the top 50 rankings. Conversely, Saudi Arabia achieves the top spot for mobile phone use. Bahrain’s (40) strength is also on the Enabling Environment pillar, with a strong performance on the Legal framework and Social mobility sub–pillars. Deaths under 60 from NCDs and Obesity are weak points, both ranking below 100.
In contrast to a number of other countries in the region, Oman (41) has a relatively strong performance on the Health and Wellness pillar, with a rank of 37. Despite a relatively low life expectancy, Oman ranks highly in healthy life years and healthcare services. Oman’s Enabling Environment pillar is in a strong 25th position in part due to good scores in ICT usage and Intellectual property rights and property protection. Weaker scores in labour force participation and the education gender gap measure pull down the country’s overall scores.
Jordan (52) and Kuwait (59) both rank low on the Workforce and Employment pillar. Although Kuwait has good rankings for the unemployment indicators it has significantly lower scores on the qualitative measures. Jordan fares better, in this group, in particularly with the country’s level of technology absorption, but the country’s labour force participation rate among the 15–64 age group is the lowest in the sample and the economic gender gap measure puts the country in the bottom ten for this indicator.
A good overall performance (46th) on the Health and Wellness pillar boosts Tunisia’s (67) overall rankings. High rankings for the business impact of both communicable and non–communicable disease indicators help push up the scores on this pillar. Compared to a number of other countries in the region, Tunisia has very low rankings in labour force participation, economic gender gap and unemployment rates, placing Tunisia in 101st place in the Workforce and Employment pillar.
Lebanon (74) performs well on the Education pillar with a rank of 32nd, significantly higher than its 96th rank for Workforce and Employment and 104th rank for Enabling Environment. With the exception of Internet access in schools, the qualitative measures for Lebanon’s education perform well, at a 13th spot or above. Poor rankings on the Infrastructure, Legal frameworks and Collaboration sub–pillars push down scores on the Enabling Environment pillar.
-1.2
-1.0
-0.8
-0.6
-0.4
-0.2
0.0
0.2
0.4
0.6
0.8
1.0
1.2
Sub-Saharan AfricaMiddle East and North Africa
Latin America and the Caribbean
Asia and the Pacific
Europe and Central Asia
North America
Figure 6: Regional performance on the Enabling Environment pillar
Source: Human Capital Index 2013. Scores are weighted by population; population data from United Nations Department of Economic and Social Affairs, World Population Prospects, rev. 2012.
Pilla
r sco
re
The Human Capital Report | 25
Part 1: Measuring Human Capital
Morocco’s (82) Health and Wellness pillar is the country’s strongest, ranking 59th, boosted by strong performances on the Stunting and wasting in children, Depression and Business impact of non–communicable diseases indicators. Morocco is the highest ranked of the North African countries, significantly ahead of its neighbour Algeria (115) in all pillars, particularly Health and Wellness, where very low scores on the business impact of disease indicators distinctly separate the countries. Algeria’s qualitative measures for education, talent and training impact the overall results significantly and contribute to the overall lower ranking.
The Enabling Environment and Health and Wellness pillars help the low performance of Egypt (111). Stronger results on the Survival gender gap and the Water, sanitation and hygiene indicators are offset by poor results on Obesity and the two qualitative healthcare indicators. Likewise, the better ranking on the State of cluster development indicator is pulled down by the other Collaborative indicator, Business and university R&D collaboration.
Mauritania (121) and Yemen (122) are the lowest ranking countries in the region and in the Index overall, occupying the bottom four pillar spots in all but two instances. Mauritania has marginally better qualitative education results. Yemen has slightly better scores on the Enabling Environment pillar due to its domestic transport and social safety net indicators, although the collaboration variables reduce the overall pillar score to 116th. Mauritania scores well on the Depression indicator, helping to boost the country’s score to 105th on this pillar.
NORTH AMERICANorth America is the highest performing of the six regions and is comprised of only two high–income economies. Canada (10) ranks the highest of the North America region, due to a very strong performance on the Education pillar. The second overall rank raises the aggregate Human Capital Index score from the other three pillars, which rank between 15th for Workforce and Employment to 20th for Health and Wellness. Canada has the highest tertiary attainment levels of all the countries in the Index. Canada’s qualitative measures are significantly higher than that of the United States (16).
Within the Enabling Environment pillar, the United States demonstrates superior collaboration, as it does on the talent group of indicators in the Workforce and Employment pillar. However it is on the Health and Wellness pillar where the greatest difference in performance lies, with Canada scoring higher than the United States on the access and quality of its healthcare, on well–being and on the impact of non–communicable disease indicators.
SUB–SAHARAN AFRICATwenty–one countries are represented in the Sub– Saharan Africa region, which scores at the bottom of the six regions overall, with the lowest scores for each pillar, except for the Workforce and Employment pillar where it ranks fifth, ahead of the Middle East and North Africa region. Mauritius, Botswana, South Africa and Namibia are from the upper–middle income category of economies. There are six countries from the lower– middle income group and the remainder are all low– income economies.
Mauritius (47) is the highest–ranking county in the region and the only country from the region in the top 50. Good performances on Education and Enabling Environment, and in particular Health and Wellness where the country is ranked 45th, mean that the country is significantly ahead of the region’s second and third placed countries, Botswana (79) and Kenya (81). A lower 64th position on the Workforce and Employment pillar is due to low levels of labour force participation and a low ranking on the youth unemployment indicator.
Botswana ranks well on the Enabling Environment pillar with a 59th spot, in comparison with 85th to 93rd on the other three pillars. Better scores in the Legal framework sub–pillar help lift the lower scores in the Collaboration sub–pillar. In contrast, Kenya does well in terms of Collaboration but poorly on Legal framework. Botswana shares the top spot in the education gender gap measure and 40th in economic participation but has a much lower rank for the Survival gender gap indicator. Kenya does well overall on the talent indicators, with a globally high rank for Ease of finding skilled employees.
South Africa (86) ranks 42nd on the Enabling Environment pillar, its highest pillar score by a significant margin, and has rankings of 92nd to 105th on the other pillars. In particular, its Collaboration and Legal framework sub–pillars have strong results but the Infrastructure scores are pulled down by a 104th place rank for the Domestic transport indicator. South Africa’s very poor scores for unemployment, youth unemployment and labour force participation drive down the rankings for the Workforce and Employment pillar. Despite good scores for staff training, South Africa has one of the lowest scores on the Ease of finding skilled employees and Pay relating to productivity indicators.
Ghana (87) has stronger scores across the Workforce and Employment and Enabling Environment pillars than it does on the Education and Health and Wellness pillars. Strong labour force participation rates across the population maintain its ranking despite some weaknesses on the talent and training indicators. Ghana’s Domestic transport indicator performs better than the ICT element within the Infrastructure sub–pillar.
Namibia’s (97) ranking on the Enabling Environment pillar (61) tops that of the other three pillars, where it ranks between 98th and 108th, by a significant margin. Senegal
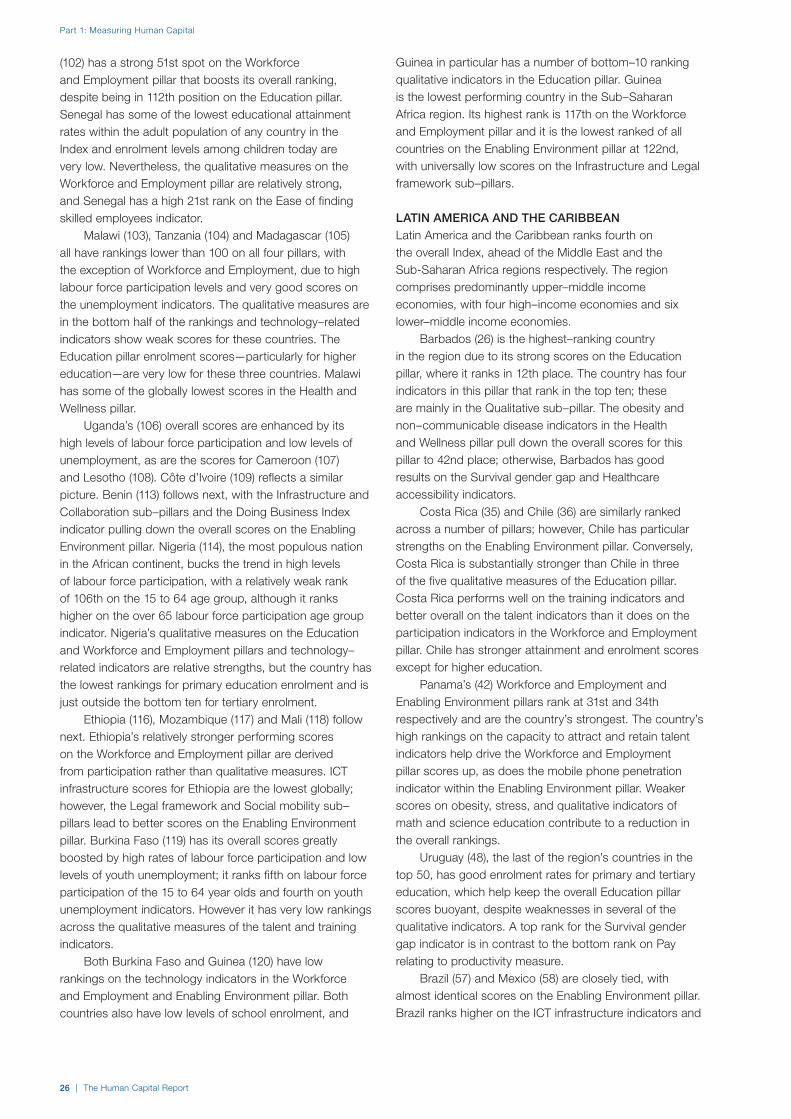
Part 1: Measuring Human Capital
26 | The Human Capital Report
(102) has a strong 51st spot on the Workforce and Employment pillar that boosts its overall ranking, despite being in 112th position on the Education pillar. Senegal has some of the lowest educational attainment rates within the adult population of any country in the Index and enrolment levels among children today are very low. Nevertheless, the qualitative measures on the Workforce and Employment pillar are relatively strong, and Senegal has a high 21st rank on the Ease of finding skilled employees indicator.
Malawi (103), Tanzania (104) and Madagascar (105) all have rankings lower than 100 on all four pillars, with the exception of Workforce and Employment, due to high labour force participation levels and very good scores on the unemployment indicators. The qualitative measures are in the bottom half of the rankings and technology–related indicators show weak scores for these countries. The Education pillar enrolment scores—particularly for higher education—are very low for these three countries. Malawi has some of the globally lowest scores in the Health and Wellness pillar.
Uganda’s (106) overall scores are enhanced by its high levels of labour force participation and low levels of unemployment, as are the scores for Cameroon (107) and Lesotho (108). Côte d’Ivoire (109) reflects a similar picture. Benin (113) follows next, with the Infrastructure and Collaboration sub–pillars and the Doing Business Index indicator pulling down the overall scores on the Enabling Environment pillar. Nigeria (114), the most populous nation in the African continent, bucks the trend in high levels of labour force participation, with a relatively weak rank of 106th on the 15 to 64 age group, although it ranks higher on the over 65 labour force participation age group indicator. Nigeria’s qualitative measures on the Education and Workforce and Employment pillars and technology–related indicators are relative strengths, but the country has the lowest rankings for primary education enrolment and is just outside the bottom ten for tertiary enrolment.
Ethiopia (116), Mozambique (117) and Mali (118) follow next. Ethiopia’s relatively stronger performing scores on the Workforce and Employment pillar are derived from participation rather than qualitative measures. ICT infrastructure scores for Ethiopia are the lowest globally; however, the Legal framework and Social mobility sub–pillars lead to better scores on the Enabling Environment pillar. Burkina Faso (119) has its overall scores greatly boosted by high rates of labour force participation and low levels of youth unemployment; it ranks fifth on labour force participation of the 15 to 64 year olds and fourth on youth unemployment indicators. However it has very low rankings across the qualitative measures of the talent and training indicators.
Both Burkina Faso and Guinea (120) have low rankings on the technology indicators in the Workforce and Employment and Enabling Environment pillar. Both countries also have low levels of school enrolment, and
Guinea in particular has a number of bottom–10 ranking qualitative indicators in the Education pillar. Guinea is the lowest performing country in the Sub–Saharan Africa region. Its highest rank is 117th on the Workforce and Employment pillar and it is the lowest ranked of all countries on the Enabling Environment pillar at 122nd, with universally low scores on the Infrastructure and Legal framework sub–pillars.
LATIN AMERICA AND THE CARIBBEANLatin America and the Caribbean ranks fourth on the overall Index, ahead of the Middle East and the Sub-Saharan Africa regions respectively. The region comprises predominantly upper–middle income economies, with four high–income economies and six lower–middle income economies.
Barbados (26) is the highest–ranking country in the region due to its strong scores on the Education pillar, where it ranks in 12th place. The country has four indicators in this pillar that rank in the top ten; these are mainly in the Qualitative sub–pillar. The obesity and non–communicable disease indicators in the Health and Wellness pillar pull down the overall scores for this pillar to 42nd place; otherwise, Barbados has good results on the Survival gender gap and Healthcare accessibility indicators.
Costa Rica (35) and Chile (36) are similarly ranked across a number of pillars; however, Chile has particular strengths on the Enabling Environment pillar. Conversely, Costa Rica is substantially stronger than Chile in three of the five qualitative measures of the Education pillar. Costa Rica performs well on the training indicators and better overall on the talent indicators than it does on the participation indicators in the Workforce and Employment pillar. Chile has stronger attainment and enrolment scores except for higher education.
Panama’s (42) Workforce and Employment and Enabling Environment pillars rank at 31st and 34th respectively and are the country’s strongest. The country’s high rankings on the capacity to attract and retain talent indicators help drive the Workforce and Employment pillar scores up, as does the mobile phone penetration indicator within the Enabling Environment pillar. Weaker scores on obesity, stress, and qualitative indicators of math and science education contribute to a reduction in the overall rankings.
Uruguay (48), the last of the region’s countries in the top 50, has good enrolment rates for primary and tertiary education, which help keep the overall Education pillar scores buoyant, despite weaknesses in several of the qualitative indicators. A top rank for the Survival gender gap indicator is in contrast to the bottom rank on Pay relating to productivity measure.
Brazil (57) and Mexico (58) are closely tied, with almost identical scores on the Enabling Environment pillar. Brazil ranks higher on the ICT infrastructure indicators and

The Human Capital Report | 27
Part 1: Measuring Human Capital
social mobility, but there is a distinct margin between the two countries on the Doing Business Index indicator, with Brazil (96th) trailing Mexico (44). Mexico and Brazil have similar scores for the majority of the qualitative Education indicators but Mexico leads in the attainment measures for all three levels of education.
Ecuador (61) performs significantly better on the Workforce and Employment pillar, contrasting with the other three pillars, where it ranks between 68th and 76th. Communicable diseases, stress and unhealthy life years bring down the rankings of the Health and Wellness pillar, while low levels of unemployment and good ranks for talent attraction, retention and ease of finding skilled employees raise the overall rankings of the stronger performing Workforce and Employment pillar.
Argentina (62) and Jamaica (68) score well on the Health and Wellness pillar, helping to drive up the aggregate scores in the final index. Both countries have top ranks on the Survival gender gap indicator, and Argentina performs well on the Well–being and Services sub–pillars. A strong performance on the Education pillar, due to quality management schools and high levels of tertiary enrolment, helps to mitigate the impact of low scores on the Workforce and Employment pillar, where three qualitative indicators rank 100 or lower. Pay relating to productivity has a notably low rank at 120th position. Jamaica’s State of cluster development, R&D collaboration and Domestic transport indicators represent its main strengths within the Enabling Environment pillar.
Colombia (71) has consistent scores across all four pillars, with just a seven–rank difference between its highest–ranked Education and Enabling Environment in 72nd place and its lowest rank Health and Wellness pillar, which sits in the 79th spot. The country’s highest rank is 17th, for the Stunting and wasting in children under 5 indicator, and its lowest rank is 103rd for the Quality of domestic transport indicator. Peru (75) has consistent ranks in the low 80s across three of the pillars. However, the Workforce and Employment pillar, in 50th, is a significant strength for the country. Guatemala (84), comparably strong in this pillar, drops to 105th rank on the Education pillar due to very low scores in four of the five qualitative indicators. Low unemployment, high labour force participation of the over 65s and staff training help boost Guatemala’s ranks for the Workforce and Employment pillar. Peru also has good rankings on both the 15–64 and the over 65s labour force participation indicators and benefits from low unemployment rates. However, low scores in innovation and number of scientific and technical journal articles force down the aggregate scores for the Workforce and Employment pillar.
Trinidad and Tobago (76) ranks between 53rd and 56th in three pillars, but a very poor rank of 121st on Health and Wellness, which puts the country second from bottom across all regions, drives down its overall score substantially. Trinidad and Tobago scores the
lowest on the healthy life years indicator. Low rankings for Survival gender gap, Obesity and Business impact of non–communicable diseases also contribute to the low scores for the Health and Wellness pillar. Low youth unemployment and the capacity of the country to attract talent are among the strengths of the Workforce and Employment pillar.
El Salvador (90), Suriname (91) and Nicaragua (93) follow next. Suriname has overall better qualitative and attainment rankings on the Education pillar, and El Salvador has a stronger performance on the educational access indicators. Nicaragua’s strengths include the Workforce and Employment talent indicators. Its principal weakness lies in the Infrastructure sub–pillar of Enabling Environment. Suriname has bottom–10 rankings on the Doing Business Index, Quality of domestic transport and Social safety net protection indicators. Healthcare access and quality, and primary school and maths quality indicators are strengths for Suriname.
The Dominican Republic (95) scores well on access and attainment measures, but performs poorly on qualitative measures in the Education pillar. Labour force participation of the over 65s and Firm level technology absorption are the stronger–performing indicators in the Workforce and Employment pillar. In the Health and Wellness pillar, where the country scores its highest pillar rank of 85th, Stunting and wasting in children under 5 is the only indicator in the top 50.
Paraguay’s (98) strongest performance is on the Health and wellness pillar; notably, the Survival and Well–being sub–pillars. Despite relatively stronger participation scores on the Workforce and Employment pillar, the majority of the talent and training indicators remain in the bottom quartile. Bolivia (99), Honduras (100) and, last placed in the Latin American region, Venezuela (101), follow next. Honduras’ performance ranges from 87th position on Enabling Environment to 103rd place on Education, due to very low qualitative and attainment scores. Low unemployment and relatively higher ranks for training help raise the overall rankings for Honduras. Bolivia’s scores for attracting and retaining talent and the ease of finding skilled employees are among those indicator that help drive up the country’s Workforce and Employment pillar ranking. It is a similar picture with the qualitative indicators in the Education pillar. Venezuela has good access and attainment measures in education; however, very low scores on the Legal framework, Social mobility and Talent sub–pillar indicators push down the overall human Capital Index ranking for the country.
Figures 7, 8, 9 and 10 display correlations between the Human Capital Index, Human Development Index, Global Competitiveness Index, GDP per capita and the Global Gender Gap Index.
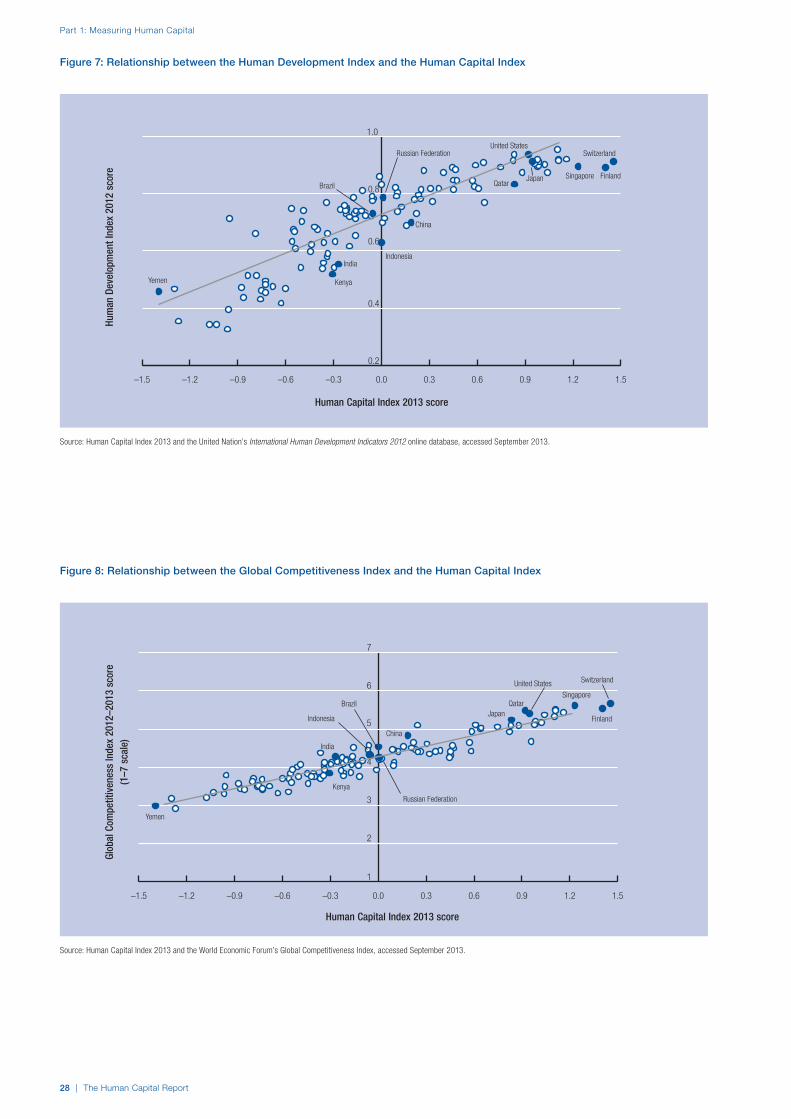
–1.5 –1.2 –0.9 –0.6 –0.3 0.0 0.3 0.6 0.9 1.2 1.5
0.2
0.4
0.6
0.8
1.0
KenyaYemen
IndiaIndonesia
China
Brazil Qatar
Switzerland
Singapore FinlandJapan
United StatesRussian Federation
Figure 7: Relationship between the Human Development Index and the Human Capital Index
Source: Human Capital Index 2013 and the United Nation’s International Human Development Indicators 2012 online database, accessed September 2013.
Hum
an D
evel
opm
ent I
ndex
201
2 sc
ore
Human Capital Index 2013 score
–1.5 –1.2 –0.9 –0.6 –0.3 0.0 0.3 0.6 0.9 1.2 1.5
1
2
3
4
5
6
7
Kenya
India
Yemen
Indonesia
China
Brazil Qatar
Switzerland
Japan
United States
Singapore
Finland
Russian Federation
Figure 8: Relationship between the Global Competitiveness Index and the Human Capital Index
Source: Human Capital Index 2013 and the World Economic Forum’s Global Competitiveness Index, accessed September 2013.
Glob
al C
ompe
titiv
enes
s In
dex
2012
–201
3 sc
ore
(1
–7 s
cale
)
Human Capital Index 2013 score
Part 1: Measuring Human Capital
28 | The Human Capital Report

Source: Source: Human Capital Index 2013 and Global Gender Gap Index 2012.
–1.5 –1.2 –0.9 –0.6 –0.3 0.0 0.3 0.6 0.9 1.2 1.5
0.5
0.6
0.7
0.8
0.9
Kenya
IndiaIndonesia China
Brazil
Qatar
Switzerland
Finland
Japan
United States
Singapore
Russian Federation
Yemen
–1.5 –1.2 –0.9 –0.6 –0.3 0.0 0.3 0.6 0.9 1.2 1.5
0
20
40
60
80
Qatar
Kenya India
YemenIndonesia
China
Brazil
Singapore
Switzerland
Japan Finland
United States
Russian Federation
Figure 9: Relationship between GDP per capita and the Human Capital Index
Figure 10: Relationship between the Global Gender Gap Index and the Human Capital Index
Source: Human Capital Index 2013 and the World Bank’s World DataBank: World Development Indicators & Global Development Finance online database 2012, accessed September 2013.
GDP
per c
apita
(con
stan
t int
erna
tiona
l $, 1
,000
s)Gl
obal
Gen
der G
ap In
dex
2012
sco
re
Human Capital Index 2013 score
Human Capital Index 2013 score
The Human Capital Report | 29
Part 1: Measuring Human Capital

Part 1: Measuring Human Capital
30 | The Human Capital Report
CONCLUSIONThe Human Capital Index seeks to create greater awareness among a global audience of human capital as a fundamental pillar of the growth, stability and competitiveness of nations. This Index is a first attempt at measuring human capital holistically and across a large set of countries. We hope to continue to improve methodology in future years and hope that this Report will also foster further research.
The Index seeks to serve as a tool for capturing the complexity of workforce dynamics so that various stakeholders are able to take better–informed decisions. Because human capital is critical not only to the productivity of society but also to the functioning of its political, social and civil institutions, understanding its current capacity is valuable to a wide variety of stakeholders. We hope that this Report can help governments, business, universities and civil society institutions identify key areas for focus and investment. All of these entities have a stake in human capital development, whether their primary goal is to power their businesses, strengthen their communities, or create a population that is better able to contribute to and share in the rewards of growth and prosperity. We thus hope that this Report will also foster collaboration between sectors to address human capital gaps.
NOTES 1 See WHO, Fact sheet no 332: Early child development.
2 See WHO, Health Status Statistics: Mortality.
3 See WHO, Fact sheet: Noncommunicable diseases.
4 See WHO, Fact sheet: Obesity and overweight.
5 See WHO, Investing in Mental Health, page 5.
6 See WHO, 10 Facts on Mental Health: Fact 2.
7 See Sanctuary, M., Tropp, H., et al., “Making water a part of economic development: The economic benefits of improved water management and services”.
8 See ILO, Resource Guide on youth employment.
REFERENCESAccess Economics Pty Limited. The Global Economic Cost of Visual
Impairment. 2010. Sydney: Access Economics Pty Limited.
ACT. A Better Measure of Skills Gaps. 2004. Iowa city: ACT, Inc.Agbor, J.A. and Price, G.N. Does Famine Matter For Aggregate Adolescent Human Capital Acquisition In Sub-Saharan Africa?. ERSA (Economic Research Southern Africa), www.econrsa.org/publications/working-papers/does-famine-matter-aggregate-adolescent-human-capital-acquisition-sub, December 2012.
Aiyar, S. and Mody, A. The Demographic Dividend: Evidence from the Indian States. International Monetary Fund, http://www.imf.org/external/pubs/ft/wp/2011/wp1138.pdf, 2011.
Appleton, S. and Teal, F. Human Capital and Economic Development. Working Paper Series 173. 2000. Abidjan: African Development Bank.
Barclay, S. (2010) The Dubai Initiative Measuring Human Capital for Investment. Student research, 2010. Cambridge: Harvard University, John F. Kennedy School of Government.
Bernal-Verdugo, L.E., Furceri, D., and Guillaume, D. Labor Market Flexibility and Unemployment: New Empirical Evidence of Static and Dynamic Effects. International Monetary Fund, http://www.imf.org/external/pubs/ft/wp/2012/wp1264.pdf, 2012.
Bleakley, H. “Health, Human Capital, and Development”. Annual Review of Economics, 2010, 2(1): 283-310. www.annualreviews.org/doi/abs/10.1146/annurev.economics.102308.124436.
Brown, Tim. “A creative future for education”. Forum Blog (blog), Feb 6, 2013, http://forumblog.org/2013/02/a-creative-future-for-education/#disqus_thread.
Cairncross, F. and Pöysti, K. ICTs for education and building human capital. International Telecommunications Union, www.itu.int/osg/spu/visions/summaries/education.pdf, 2003.
Carneiro, P. and Heckman, J. Human Capital Policy. 2003. Working Paper 9495. Cambridge, MA: National Bureau of Economic Research.
Cisco. Equipping Every Learner for the 21st Century. www.cisco.com/web/about/citizenship/socio-economic/docs/GlobalEdWP.pdf, 2008.
Coulombe, S.,Tremblay, J.F. and Marchand, S. International Adult Literacy Survey Literacy scores, human capital and growth across fourteen OECD countries. 2004. Ottawa: Statistics Canada.
Deaton, A. Income, Health, and Well-Being around the World: Evidence from the Gallup World Poll. NBER Working Paper No. 13317. National Bureau of Economic Research, http://www.nber.org/papers/w13317, 2007.
Donnelly, J. (2011) “How did Sierra Leone provide free health care?” In The Lancet, 2011, 377.
The Economist. “Education and demography: Trimming the dividend”. 17:43, March 15, 2013.
Eidos Institute, The. The Australian Human Capital Project Prospectus. The Human Capital Gateway, http://www.humancapitalgateway.org/HCGProspectusFinal.pdf.
Ederer, P. Innovation at Work: The European Human Capital Index. 2006. Brussels: Lisbon Council Policy Brief.
Gonzalez, G. Karoly, L.A., et al. Facing Human Capital Challenges of the 21st Century: education and labor market initiatives in Lebanon, Oman, Qatar, and the United Arab Emirates. 2008. Doha: Rand-Qatar Policy Institute.
Hausmann, R., Hidalgo, C., et al. The Atlas of Economic Complexity. Cambridge: Puritan Press, 2011.
Hendricks, L. “How Important Is Human Capital for Development? Evidence from Immigrant Earnings”. American Economic Review, 2012, 92(1):198-219. www.aeaweb.org/articles.php?doi=10.1257/000282802760015676.
Institute for Health Metrics and Evaluation. The Global Burden of Disease: Generating evidence, guiding policy. 2013. Seattle: Institute for Health Metrics and Evaluation.
ILO (International Labour Organization). Global Employment Trends for Youth 2012. 2012. Geneva: ILO.
———. International Standard Classification of Occupations: Structure, group definitions and correspondence tables (ISCO-08). 2012. Geneva: ILO.
———. Resource Guide on youth employment. ILO, http://www.ilo.org/public/english/support/lib/resource/subject/youth.htm, August 2013.
Irmen, A. Cross-Country Income Differences and Technology Diffusion in a Competitive World. Discussion Paper Series No. 480. 2008. Heidelberg: University of Heidelberg Department of Economics.
Keeley, B. Human Capital: How what you know shapes your life. 2007. Paris: OECD.
Li, H. Measuring Human Capital in China. Lisbon Council, http://www.lisboncouncil.net/component/downloads/?id=420.
Malawi Ministry of Economic Planning and Development, National Statistics Office, and the Centre for Social Research. Malawi Social Indicators Survey 1995. Chapter 8: Child Malnutrition. http://www.childinfo.org/files/Malintro.pdf, September 1996.

The Human Capital Report | 31
Part 1: Measuring Human Capital
Marope, M.T. Namibia Human Capital and Knowledge Development for Economic Growth with Equity. World Bank, siteresources.worldbank.org/INTAFRICA/Resources/No84.pdf, 2008.
Mourshed, M., Farrell, D., Barton, D. Education to Employment: Designing and education system that works (Executive Summary). McKinsey Centre for Government, http://www.mckinsey.com/client_service/public_sector/mckinsey_center_for_government/education_to_employment, 2010.
Murphy, S. Business and Philanthropy Partnerships for Human Capital Development in the Middle East. Corporate Social Responsibility Initiative Working Paper No. 52. 2009. Cambridge: John F. Kennedy School of Government, Harvard University.
Nayar, R., Gottret, P., et al. More and Better Jobs in South Asia. 2012. Washington, DC: World Bank.
Nkhwa, T. Building Africa’s Human Capital Opportunities and Challenges. Presented at 27th African Association for Public Administration and Management Annual Roundtable Conference. 5-9 December 2005. http://unpan1.un.org/intradoc/groups/public/documents/aapam/unpan025761.pdf.
OECD (Organisation for Economic Co-Operation and Development). OECD Patent Statistics Manual. http://browse.oecdbookshop.org/oecd/pdfs/free/9209021e.pdf.
———. The Creative Society of the 21st Century. http://www.oecd.org/futures/35391171.pdf, 2010.
Oortwijn, W. and Mathijssen, J., et al. Evaluating the Uptake of the Healthy Life Years Indicator. 2006. Santa Monica: RAND.
Riddell, W. C. Investing in Human Capital: Policy Priorities for Canada. Canadian Priorities Agenda Brief No.5: Human Capital. 2008. Montreal: Institute for Research on Public Policy.
Rinne, U. and Zhao, Z. Human Capital vs. Signaling, The German Reunification as a Natural Experiment (preliminary draft, Germany and China). 2010. http://www.iza.org/conference_files/TAM2010/rinne_u1844.pdf.
Ross, J. Understanding the Demographic Dividend. 2004. Washington: Policy Project.
Royal Society, The. Knowledge, networks and nations: Global scientific collaboration in the 21st century. 2011. London: The Royal Society.
Sanctuary, M., Tropp, H., et al. Making water a part of economic development: The economic benefits of improved water management and services. WHO (World Health Organization), http://www.who.int/features/factfiles/mental_health/mental_health_facts/en/index1.html, August 2013.
Steinberg, C. Can Women Save Japan (and Asia too)? International Monetary Fund, www.imf.org/external/pubs/ft/fandd/2012/09/steinberg.htm, 2012.
Souter, D. Towards Inclusive Knowledge Societies: A review of UNESCO’s action in implementing the WSIS outcomes. 2010. Paris: UNESCO.
Thylefors, B. and Négrel A-D, et al. “Global Data on Blindness”. Reproduced from “Global Data on Blindness”, Thylefors B and Négrel A-D., et al. Bulletin of the World Health Organization, 1995, 73(1):115–121.
UNDP (United Nations Development Program). Mobile Technologies and Empowerment: Enhancing human development through participation and innovation. http://www.undpegov.org/mgov-primer.html, 2012.
UNESCO (United Nations Educational, Scientific and Cultural Organization). Education for all the Global Imperative. 2005. Paris: UNESCO.
UNESCO Institute for Statistics. Global Education Digest: Comparing Education Statistics Across the World. 2011. Montreal: UNESCO.
Wail, B., Said, H et al. A New Data Set of Educational Inequality in the World, 1950–2010: Gini Index of Education by Age Group. http://papers.ssrn.com/sol3/papers.cfm?abstract_id=1895496, 2011.
Walpole, S. C., Prieto-Merino, D., et al. “The weight of nations: an estimation of adult human biomass”. In BMC Public Health, 2012, 12:439.
Westervelt, E. The Secret To Germany’s Low Youth Unemployment (National Public Radio podcast), April 04, 2012, http://www.npr.org/2012/04/04/149927290/the-secret-to-germanys-low-youth-unemployment.
WHO (World Health Organization). 10 Facts on Mental Health: Fact 2. http://www.who.int/features/factfiles/mental_health/mental_health_facts/en/index1.html, July 2013.
———. Fact sheet: Obesity and overweight. http://www.who.int/mediacentre/factsheets/fs311/en/, March 2013.
———. Fact sheet no 332: Early child development. http://www.who.int/mediacentre/factsheets/fs332/en/, August 2009.
———. Fact sheet: Noncommunicable diseases. http://www.who.int/mediacentre/factsheets/fs355/en/, March 2013.
———. Global Data On Visual Impairments. 2012. WHO/NMH/PBD/12.01.
———. Health Status Statistics: Mortality. http://www.who.int/healthinfo/statistics/indhale/en/, July 2013.
———. Investing in Mental Health. http://www.who.int/mental_health/media/investing_mnh.pdf, 2003.
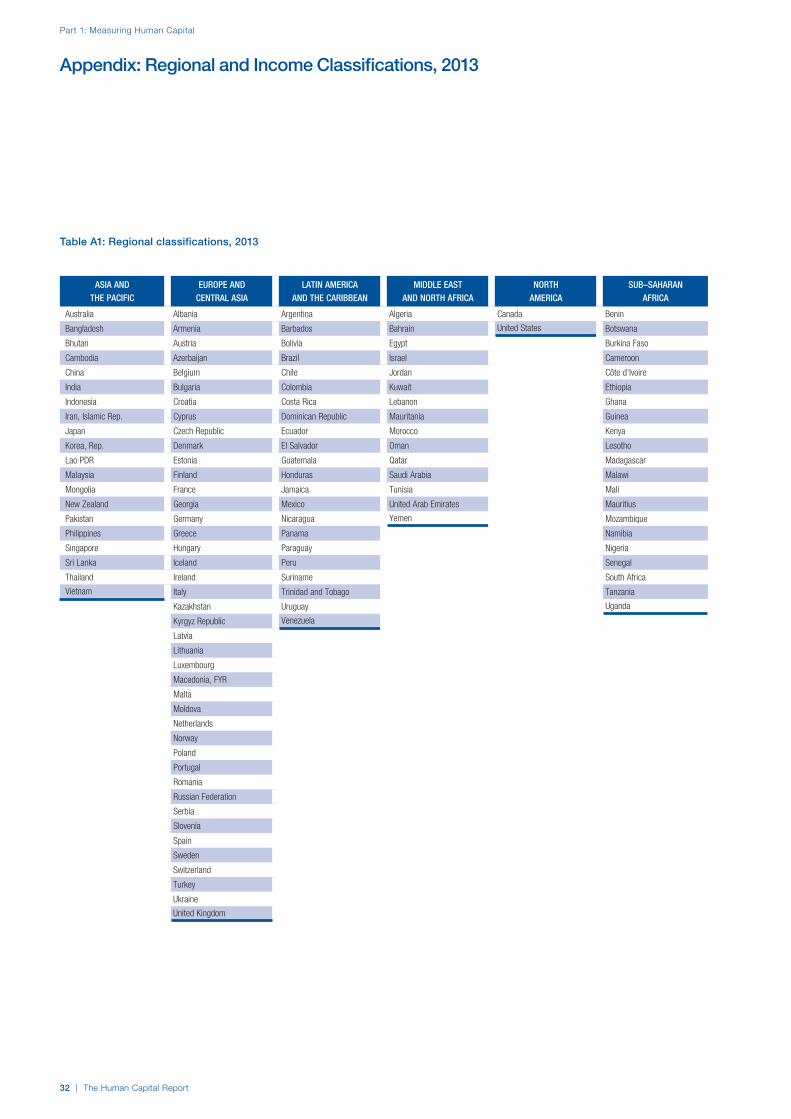
Part 1: Measuring Human Capital
32 | The Human Capital Report
Appendix: Regional and Income Classifications, 2013
Table A1: Regional classifications, 2013
ASIA AND THE PACIFIC
EUROPE AND CENTRAL ASIA
LATIN AMERICA AND THE CARIBBEAN
MIDDLE EAST AND NORTH AFRICA
NORTH AMERICA
SUB–SAHARAN AFRICA
Australia Albania Argentina Algeria Canada Benin
Bangladesh Armenia Barbados Bahrain United States Botswana
Bhutan Austria Bolivia Egypt Burkina Faso
Cambodia Azerbaijan Brazil Israel Cameroon
China Belgium Chile Jordan Côte d’Ivoire
India Bulgaria Colombia Kuwait Ethiopia
Indonesia Croatia Costa Rica Lebanon Ghana
Iran, Islamic Rep. Cyprus Dominican Republic Mauritania Guinea
Japan Czech Republic Ecuador Morocco Kenya
Korea, Rep. Denmark El Salvador Oman Lesotho
Lao PDR Estonia Guatemala Qatar Madagascar
Malaysia Finland Honduras Saudi Arabia Malawi
Mongolia France Jamaica Tunisia Mali
New Zealand Georgia Mexico United Arab Emirates Mauritius
Pakistan Germany Nicaragua Yemen Mozambique
Philippines Greece Panama Namibia
Singapore Hungary Paraguay Nigeria
Sri Lanka Iceland Peru Senegal
Thailand Ireland Suriname South Africa
Vietnam Italy Trinidad and Tobago Tanzania
Kazakhstan Uruguay Uganda
Kyrgyz Republic Venezuela
Latvia
Lithuania
Luxembourg
Macedonia, FYR
Malta
Moldova
Netherlands
Norway
Poland
Portugal
Romania
Russian Federation
Serbia
Slovenia
Spain
Sweden
Switzerland
Turkey
Ukraine
United Kingdom

The Human Capital Report | 33
Part 1: Measuring Human Capital
Appendix: Regional and income classifications, 2013 (cont’d.)
LOW INCOME
US$1,035 or less
Bangladesh
Benin
Burkina Faso
Cambodia
Ethiopia
Guinea
Kenya
Kyrgyz Republic
Madagascar
Malawi
Mali
Mozambique
Tanzania
Uganda
LOWER–MIDDLE INCOME
US$1,036–$4,085
Armenia
Bhutan
Bolivia
Cameroon
Côte d’Ivoire
Egypt
El Salvador
Georgia
Ghana
Guatemala
Honduras
India
Indonesia
Lao PDR
Lesotho
Mauritania
Moldova
Mongolia
Morocco
Nicaragua
Nigeria
Pakistan
Paraguay
Philippines
Senegal
Sri Lanka
Ukraine
Vietnam
Yemen
UPPER–MIDDLE INCOME
US$4,086–$12,615
Albania
Algeria
Argentina
Azerbaijan
Botswana
Brazil
Bulgaria
China
Colombia
Costa Rica
Dominican Republic
Ecuador
Hungary
Iran, Islamic Rep.
Jamaica
Jordan
Kazakhstan
Lebanon
Macedonia, FYR
Malaysia
Mauritius
Mexico
Namibia
Panama
Peru
Romania
Serbia
South Africa
Suriname
Thailand
Tunisia
Turkey
Venezuela
HIGH INCOME
US$ 12,616 or more
Australia
Austria
Bahrain
Barbados
Belgium
Canada
Chile
Croatia
Cyprus
Czech Republic
Denmark
Estonia
Finland
France
Germany
Greece
Iceland
Ireland
Israel
Italy
Japan
Korea, Rep.
Kuwait
Latvia
Lithuania
Luxembourg
Malta
Netherlands
New Zealand
Norway
Oman
Poland
Portugal
Qatar
Russian Federation
Saudi Arabia
Singapore
Slovenia
Spain
Sweden
Switzerland
Trinidad and Tobago
United Arab Emirates
United Kingdom
United States
Uruguay
Table A2: Income classifications, 2013
Note: Income classifications are taken from the World Bank, which classifies economies into four income categories based on 2013 GNI per capita (current US$), high income, upper–middle income, lower–middle income and low income.


Part 2Country Profiles


Part 2: Country Profiles
The Human Capital Report | 37
2.1: Country Profiles
1 | The Human Capital Index 2013
Rank/122 Score
Year
s (5
yea
r age
gro
ups)
Percent of total population
0–4
5–9
10–14
15–19
20–24
25–29
30–34
35–39
40–44
45–49
50–54
55–59
60–64
65–69
70–74
75–79
80–84
85–89
90–94
95–99
100+
0 1 2 3 4 5 66 5 4 3 2 1 0
AlbaniaHuman Capital Index 2013 72 –0.216
Pillar 1: Education 54 0.136
Pillar 2: Health and wellness 54 0.083
Pillar 3: Workforce and employment 71 –0.207
Pillar 4: Enabling environment 105 –0.874
Key Indicators
Total population (1,000s) 3,150.1
Median age of population 32
GDP per capita PPP (constant 2005, international $) 8,059
GDP growth (annual %) 0.8
Male Female Additional indicators
■ Total population ■ Total population Aged dependency: 15.1%
■ Labour force participation ■ Labour force participation Youth dependency: 34.0%
■ Primary and secondary enrolment ■ Primary and secondary enrolment Male labour force participation, age 65+: 0.3%
Female labour force participation, age 65+: 0.1%
Education and workforce distribution
male enrolment is shown on the respective side of the pyramid—males on the left, females on the right. Although the school ages do not fully align with this age bracket in the population pyramid, it is the closest representative age group. Source: UNESCO, Institute for Statistics, provided database extraction 22 August 2013, data from 2012 or latest available data. Bars are absent from pyramids in Profiles of countries that did not provide the data.
• The lighter coloured bars for the 10-14 age group indicate the proportion of this population sector enrolled in secondary school. Similar to primary enrolment, although the school ages do not fully align with this age bracket in the population pyramid, it is the closest representative age group. Source: UNESCO, Institute for Statistics, provided database extraction 22 August 2013, data from 2012 or latest available data. Bars are absent from pyramids in Profiles of countries that did not provide the data.
• The midshaded areas of the pyramid for the ten age groups between 15 and 64 represent the labour force participation for each of these age groups,
User’s Guide: How Country Profiles Work
COUNTRY PROFILES: PAGE 1
KEY RANKS, SCORES AND INDICATORS
The first section presents each country’s overall human capital score and its rank out of the 122 reviewed countries, as well as the scores and ranks for each pillar.
Key Indicators• Total population (in thousands of inhabitants).
Source: World Bank’s World Development Indicators online database (accessed August 2013).
• Median age of population (in years). Source: United Nations, Department of Economic and Social Affairs, Population Division, World Population Prospects, 2010 (accessed September 2013).
• GDP per capita PPP (constant 2005 international dollars). Source: World Bank’s World Development Indicators online database (accessed August 2013).
• GDP growth (annual percentage). Source: World Bank’s World Development Indicators online database (accessed August 2013).
EDUCATION AND WORKFORCE DISTRIBUTION
The chart is a graphical representation of the age and gender structure of a country, overlaid with data on school enrolment and workforce participation.
• The ‘pyramid’ in the bottom half of the page presents the demographic profile of the country. The vertical axis lists each five-year cohort in the population, while the horizontal axis displays the percentage of the total population represented by each cohort. The left side of the pyramid (black bars) represents the male population and the right side represents the female (blue bars). Population data source: United Nations, Department of Economic and Social Affairs, Population Division, World Population Prospects, 2010 (accessed September 2013).
• The lighter coloured bars for the 5-9 age group indicate the proportion of these children enrolled in primary school. The distinction between female and

Part 2: Country Profiles
38 | The Human Capital Report
The Human Capital Index 2013 | 2
2.1: Country Profiles
HCI s
core
–2.5
–2.0
–1.5
–1.0
–0.5
0.0
0.5
1.0
1.5
2.0
2.5
Overall Index
Enablingenvironment
Workforce andemployment
Health andwellness
Education
AlbaniaEmployment types, educational requirements and educational attainment Percent of population Educational in employment type attainment (%)
Tertiary requirements n/a 1.5
Professionals n/a
Technicians and associate professionals n/a
Secondary requirements n/a 72.8
Clerks n/a
Service workers and shop and market sales workers n/a
Skilled agricultural and fi shery workers n/a
Craft and related trade workers n/a
Plant and machine operators and assemblers n/a
Primary requirements n/a 10.6
Elementary occupations n/a
Various n/a
Legislators, senior offi cials and managers n/a
Unclassifi ed n/a
Armed forces n/a
Spread of scores (by pillar and overall)
Albania
Upper-middle income economies
Europe and Central Asia
disaggregated by gender. The midshade blue bars represent the proportion of female labour force participation for each relevant age group and the midshade black bars represent the proportion of male labour force participation for each relevant age group. Source: International Labour Organisation (ILO), ILOStat, 2010 or latest available data (accessed August 2013). Bars are absent from pyramids in Profiles of countries that did not provide the data. There are instances where the labour force participation is greater than the actual population shown. This is due to differences in methodology that the ILO and the UN’s population division apply when sourcing the data regarding temporary foreign labour. Although the ILO provides labour force participation data for the over-65 age category there is no means of determining how this should be distributed between the eight age groups of the population over 65 so this data is not represented in the pyramids. However this information for both males and females is stated in the legend under “Additional indicators.”
• The legend above the pyramid shows the three different shades of bars used in the chart. It also states the dependency rates for the young (below age 15) and elderly (over age 65). The youth dependency is the percentage of the population below the age of 15 in relation to the size of the working age population (age 15 to 64). The aged dependency is the percentage of the population aged 65 and over in relation to the size of the working age population (age 15 to 64).
COUNTRY PROFILES: PAGE 2
EMPLOYMENT TYPES, EDUCATIONAL REQUIREMENTS AND EDUCATIONAL ATTAINMENT
This section matches the educational attainment of a country, across different educational levels, with the occupational groups that require a specific level of education.
• Employment data is drawn from the International Labour Organisation’s (ILO’s) Laborsta online database, 2008, or latest available year (accessed July 2013). Data was taken from Laborsta since at the time of collecting the data, the ILOstat data for this variable was still being populated and limited data was available. Therefore the latest data available is for 2008.
• The ILO has linked eight of the ten major occupational groups listed below to the four international standard of classification of employment (ISCO-88) skill levels.1,2
Each skill level has been referenced to the educational levels of the International Standard Classification of Education (ISCED-93) typically required for competent performance in the occupation.
Skills level 1 = Primary level education (ISCED level 1)
Elementary occupations
Skills level 2 = Secondary level education (ISCED levels 2 and 3)
ClerksService workers and shop and market sales workersSkilled agricultural and fishery workersCraft and related trades workersPlant and machine operators and assemblers
Skills levels 3 & 4 = Tertiary level education (ISCED levels 5 – 7)
ProfessionalsTechnicians and associate professionals
• Occupations included in the armed forces and in the legislators, senior officials and managers groups are not mapped to any skills category or education level in ISCO-88. Based on information from national sources, skills for executing tasks and duties of occupations belonging to each of these two major groups vary to such an extent that it would be impossible to link them with any of the four broad ISCO-88 skill levels.3

Part 2: Country Profiles
The Human Capital Report | 39
• For the purpose of inclusion in the County Profiles, we have grouped together skills groups 3 and 4. The ILO presents skills categories 3 and 4 separately, aligning with ISCED levels 5 and 6 & 7 respectively. Note that for ISCO-88, level 4 is not aligned with any skills category.
• Each employment type is listed under the relevant education level, which is aligned with the skills required to perform this type of job competently. Both the Legislators, senior officials and managers and the Armed forces groups, which cannot be aligned with a specific education level, are reported under the heading “Various”. Unclassified occupations, which consist of those jobs that cannot be assigned to any of the ten listed employment types, are also listed under “Various”.
• Employment data is provided in thousands of jobs and divided by the total population age 15 and over (Source: United Nations, Department of Economic and Social Affairs, Population Division, World Population Prospects, 2010 [accessed September 2013] to provide occupations held as a percentage of this population. Numbers will not add up to 100 as the data does not report the non-working population and there are omissions in the data where the figures straddle more than one category. Due to rounding, some subtotals may not be the sum of the display.
• Data in the “Educational attainment (%)” column is sourced from UNESCO, Institute for Statistics, Education Statistics online database, latest year available (accessed August 2013). The data states the maximum level of education that has been reached among the population aged 25 and over and provides this as a percentage of the total population aged 25 and over. This data and the data in the “Percent of population in employment type” column are not completely aligned with the data on employment types, which is predominantly concerning the population aged 15 and over. Some countries report data for age groups other than 15 and over.
• In some instances, a country has reported data that is split across several occupational groups. For example data for the Legislators, senior officials and managers employment type may be provided as a single figure combined with data for the Professionals employment type. As only the Professionals type is aligned with a recognised skills-education classification, and we cannot estimate the number to be attributed to either grouping, then the data has been omitted. Therefore a number of countries may have reported data that is not included in the table.
• N/A is listed when a country does not report data for occupation or for educational attainment.
SPREAD OF SCORES BY PILLAR AND OVERALL
This section gives an overview of each country’s scores for each of the four pillars and the overall Human Capital Index, in relation to the scores of all other countries as well as the geographic region and income sub-groups to which the country belongs.
• The light grey bars represent the total spread of scores across all 122 countries in the index. The top of the grey bar indicates the pillar score of the top performing country in that pillar from the entire sample. The bottom limit of the grey bar indicates the pillar score of the bottom performing country in that pillar.
• The vertical position of the white circle indicates where the country lies in relation to all other countries in the index. The higher the vertical position the better the country’s performance in relation to other countries.
• The black circle represents the position of the average of the country’s specific income group. Income group classifications are detailed in Table A2 of the Appendix.
• The blue circle represents the position of the average of the country’s geographical group. Geographical groups are detailed in Table A1 of the Appendix.
COUNTRY PROFILES: PAGE 3The first three of the four pillars’ indicators are listed in detail on this page. Each indicator lists the country’s rank (out of 122 countries), the z-score, the original data for the indicator, and the minimum and maximum values from the entire sample of 122 countries.
PILLARS 1–3
Pillar 1: EducationAccess
Primary enrolment rate (%): Net adjusted enrolment rate, which refers to the percentage of children in the official primary school age range who are enrolled in either primary or secondary education. Source: UNESCO, Institute for Statistics, provided database extraction 22 August 2013, data from 2012 or latest available data.
Secondary enrolment rate (%): Percentage of children in the official age range for secondary school who are enrolled in secondary education. Source: UNESCO Institute for Statistics, provided database extraction 22 August 2013, data from 2012 or latest available data.

Part 2: Country Profiles
40 | The Human Capital Report
Tertiary enrolment ratio (%): Total enrolment in tertiary education (ISCED 5 and 6), regardless of age, expressed as a percentage of the total population of the five-year age group that has left secondary school. Source: UNESCO Institute for Statistics, provided database extraction 22 August 2013, data from 2012 or latest available data.
Education gender gap: Taken from the World Economic Forum’s Global Gender Gap Report 2012 and comprises the full Education subindex score (ratios: female literacy rate over male value, female net primary level enrolment over male value, female net secondary level enrolment over male value, female gross tertiary enrolment over male value); 0 = lowest score, 1 = highest score and full gender parity.
Quality Internet access in schools: Response to the survey
question, “How well does the educational system in your country meet the needs of a competitive economy? (1 = not well at all, 7 = very well)”. Source: World Economic Forum, Executive Opinion Survey, 2013-2014.
Quality of the education system: Response to the survey question, “How well does the educational system in your country meet the needs of a competitive economy? (1 = not well at all, 7 = very well)”. Source: World Economic Forum, Executive Opinion Survey, 2013-2014.
Quality of primary schools: Response to the survey question, “How would you assess the quality of primary schools in your country? (1 = poor, 7 = excellent — among the best in the world)”. Source: World Economic Forum, Executive Opinion Survey, 2013-2014.
Quality of math and science education: Response to the survey question, “How would you assess the quality of math and science education in your country’s schools? (1 = poor, 7 = excellent — among the best in the world)”. Source: World Economic Forum, Executive Opinion Survey, 2013-2014.
Quality of management schools: Concerned with the quality of management and business schools in the country and is a response to the survey question, “How would you assess the quality of management or business schools in your country? (1 = poor, 7 = excellent — among the best in the world)”. Source: World Economic Forum, Executive Opinion Survey, 2013-2014.
Attainment Primary education attainment (% population
age 25+): Percentage of the population aged 25 and over with at least a primary education (ISCED 1). This data is cumulative, which means that those with secondary education are counted in the primary education figures. Therefore, total figures across more than one category may add up to more than 100%. Source: UNESCO Institute for Statistics, Education Statistics online database, 2011 or latest year available (accessed August 2013).
Secondary education attainment (% population age 25+): Percentage of the population aged 25 and over with at least a secondary education (ISCED 2-6). Source: UNESCO Institute for Statistics, Education Statistics online database, 2011 or latest year available (accessed August 2013).
Tertiary education attainment (% population age 25+): Percentage of the population aged 25 and over with at a least tertiary education (ISCED 5 and 6). Source: UNESCO Institute for Statistics, Education Statistics online database, 2011 or latest year available (accessed August 2013).
2.1: Country Profiles
3 | The Human Capital Index 2013
Pillar 1: Education Rank/122 Z-Score Country Value Sample Minimum Sample Maximum
Access
Primary enrolment rate (%) ...................................................................59.........................0.368 ........................ 96 ...........................58 ......................... 100
Secondary enrolment rate (%) ..............................................................—..............................— .........................— ...........................16 ......................... 100
Tertiary enrolment ratio (%) ...................................................................49.........................0.127 ........................ 44 .............................1 ......................... 103
Education gender gap2 .........................................................................69.........................0.403 ................... 0.989 ......................0.645 ...................... 1.000
Quality
Internet access in schools1 ...................................................................63.......................–0.105 ..................... 4.19 ........................1.64 ........................ 6.64
Quality of the education system1 ..........................................................42.........................0.281 ..................... 4.05 ........................1.99 ........................ 5.98
Quality of primary schools1 ...................................................................45.........................0.352 ..................... 4.32 ........................1.97 ........................ 6.82
Quality of math & science education1 ...................................................48.........................0.306 ..................... 4.33 ........................1.88 ........................ 6.29
Quality of management schools1 ..........................................................73.......................–0.234 ..................... 4.10 ........................2.29 ........................ 6.09
Attainment
Primary education attainment (% population age 25+) ..........................20.........................0.771 ........................ 95 .............................5 ......................... 100
Secondary education attainment (% population age 25+) .....................24.........................0.818 ........................ 85 .............................2 ......................... 100
Tertiary education attainment (% population age 25+) ..........................83.......................–1.588 .......................... 1 .............................0 ........................... 44
Pillar 2: Health and Wellness Rank/122 Z-Score Country Value Sample Minimum Sample Maximum
Survival
Infant mortality (per 1,000 live births) ....................................................57.........................0.383 ........................ 13 .............................2 ........................... 98
Life expectancy ...................................................................................59.........................0.177 ........................ 74 ...........................50 ........................... 83
Survival gender gap2 ..........................................................................116.......................–3.489 ................... 0.931 ......................0.920 ...................... 0.980
Health
Stunting and wasting (% in children under 5) ........................................46.......................–0.107 ..................... 16.3 ..........................1.2 ........................ 36.5
Unhealthy life years (% of life expectancy) ............................................59.........................0.186 ........................ 14 .............................8 ........................... 66
Deaths under 60 from non-communicable
diseases (% of all NCD deaths) ......................................................31.........................0.919 ..................... 14.9 ..........................7.3 ........................ 55.8
Obesity (% of adults with BMI ≥ 30) .....................................................66.......................–0.271 ..................... 21.1 ..........................1.1 ........................ 42.8
Business impact of non-communicable diseases1 ..................................1.........................3.098 ..................... 5.87 ........................2.74 ........................ 5.87
Business impact of communicable diseases1 .......................................29.........................0.813 ..................... 6.29 ........................3.13 ........................ 6.90
Well-being
Stress (% of respondents)7 ..................................................................99.......................–0.948 ........................ 43 .............................8 ........................... 69
Depression (% of respondents)7 .............................................................8.........................1.253 .......................... 4 .............................2 ........................... 37
Services
Water, sanitation and hygiene (% with access) .....................................59.........................0.524 ..................... 94.3 ........................31.1 ...................... 100.0
Healthcare quality1................................................................................86.......................–0.708 ..................... 3.25 ........................1.78 ........................ 6.75
Healthcare accessibility1 .......................................................................83.......................–0.671 ..................... 3.84 ........................2.41 ........................ 6.75
Pillar 3: Workforce and Employment Rank/122 Z-Score Country Value Sample Minimum Sample Maximum
Participation
Labour force participation rate, age 15-64 (%) .....................................81.......................–0.275 ..................... 66.5 ........................43.4 ........................ 90.6
Labour force participation rate, age 65+ (%) .........................................62.......................–0.379 ..................... 17.3 ..........................1.6 ........................ 91.2
Economic participation gender gap2 .....................................................57.........................0.193 ................... 0.666 ......................0.310 ...................... 0.839
Unemployment rate (%) ........................................................................94.......................–0.966 ..................... 13.8 ..........................0.3 ........................ 32.0
Youth unemployment rate (%) ...............................................................87.......................–0.884 ..................... 27.2 ..........................1.6 ........................ 48.2
Talent
Country capacity to attract talent1 ........................................................51.........................0.147 ..................... 3.59 ........................1.48 ........................ 6.08
Country capacity to retain talent1..........................................................53.........................0.010 ..................... 3.54 ........................1.81 ........................ 5.97
Ease of finding skilled employees1 ........................................................52.........................0.164 ..................... 4.10 ........................2.13 ........................ 5.69
Pay related to productivity1 ...................................................................20.........................0.984 ..................... 4.52 ........................2.37 ........................ 5.25
Capacity for innovation1......................................................................107.......................–0.929 ..................... 2.97 ........................2.31 ........................ 5.84
Index of Economic Complexity3 ............................................................54.......................–0.049 ..................... 0.06 ......................–1.96 ........................ 2.37
Firm level technology absorption1 .........................................................93.......................–0.800 ..................... 4.24 ........................3.17 ........................ 6.23
Scientific and technical journal articles (per 1,000 people) ..................102.......................–0.620 ................... 0.003 ......................0.000 ...................... 1.242
Median age of the working population ..................................................47.........................0.477 ........................ 37 ...........................28 ........................... 42
Training
Staff training1 ........................................................................................31.........................0.537 ..................... 4.39 ........................2.51 ........................ 5.57
Training services1 ................................................................................100.......................–0.926 ..................... 3.57 ........................2.67 ........................ 6.47
Albania

Part 2: Country Profiles
The Human Capital Report | 41
Pillar 2: Health and WellnessSurvival
Infant mortality (per 1,000 live births): Probability of dying between birth and age 1 per 1,000 live births. Source: World Health Organisation, Global Health Observatory, World Health Statistics, Mortality and Burden of Disease, Child mortality, 2011 (accessed July 2013).
Life expectancy: Life expectancy at birth (years). Source: World Health Organisation, Global Health Observatory, World Health Statistics, Mortality and Global Health Estimates, 2011 (accessed August 2013).
Survival gender gap: Taken from the World Economic Forum’s Global Gender Gap 2012 report and comprises the full Health and Survival subindex (ratios: sex ratio at birth [converted to female-over-male ratio], Female healthy life expectancy over male value; 0 = lowest score, 1 = highest score and full gender parity).
Health Stunting and wasting (% in children under 5):
Average of the percentage of children under five years of age who are stunted (height-for-age ratio is below minus two standard deviations [moderate and severe] and minus three standard deviations [severe] from the median height-for-age ratio of the reference population) and the percentage of children under five who are wasted (weight-for-height ratio is below minus two standard deviations [moderate and severe] and minus three standard deviations [severe] from the median weight-for-height of the reference population).4 Source: World Health Organisation, Global Health Observatory, World Health Statistics, Nutrition, Child malnutrition, 2011 or latest available data (accessed July 2013).
Unhealthy life years (% of life expectancy): Number of years difference between healthy adjusted life expectancy at birth (HALE) and life expectancy at birth, as a percentage of life expectancy. Source: Healthy adjusted life expectancy, World Health Organisation data, 2007, taken from the Global Gender Gap Report 2012. Life expectancy, as above.
Deaths under 60 from non-communicable diseases (% of all NCD deaths): Number of deaths under age 60 from non-communicable diseases (NCD) expressed as a percentage of all NCD deaths. Source: World Health Organisation, Global Health Observatory, World Health Statistics, Non-communicable diseases, 2008 (accessed August 2013).
Obesity (% of adults with BMI ≥ 30): Percentage of adults aged 20 and over with a body mass index of 30
or above. Source: World Health Organisation, Global Health Observatory, World Health Statistics, Adult risk factors, 2008 (accessed August 2013).
Business impact of non-communicable diseases is the average of five variables contained in the response to the survey question, “How serious an impact do you consider the following diseases will have on your company in the next five years (e.g. death, disability, medical and funeral expenses, productivity and absenteeism, recruitment and training expenses, revenues)?
a. Heart disease and related cardio vascular problems (1 = a serious impact, 7 = no impact at all)
b. Cancer (1 = a serious impact, 7 = no impact at all)
c. Mental illness (1 = a serious impact, 7 = no impact at all)
d. Diabetes (1 = a serious impact, 7 = no impact at all)
e. Chronic respiratory disease (1 = a serious impact, 7 = no impact at all)
Source: World Economic Forum, Executive Opinion Survey, 2013-2014.
Business impact of communicable diseases: The average of three variables contained in the response to the survey question, “How serious an impact do you consider the following diseases will have on your company in the next five years (e.g. death, disability, medical and funeral expenses, productivity and absenteeism, recruitment and training expenses, revenues)?
f. HIV / AIDS (1 = a serious impact, 7 = no impact at all)
g. Tuberculosis (1 = a serious impact, 7 = no impact at all)
h. Malaria (1 = a serious impact, 7 = no impact at all)
Source: World Economic Forum, Executive Opinion Survey, 2013-2014.
Well-being Stress (% of respondents): Percentage of sample
population with “yes” responses to the question, “Did you experience the following feelings during a lot of the day yesterday? How about stress?”. Source: Gallup, Worldview database, 2013 or latest available data.
Depression (% of respondents): Percentage of sample population with “yes” responses to the question, “Did you experience the following feelings during a lot of the day yesterday? How about depression?”. Source: Gallup, Worldview database, 2011 or latest available data.

Part 2: Country Profiles
42 | The Human Capital Report
Services Water, sanitation and hygiene: Average of
“population (as a % of total population) using improved drinking water sources” and “population using improved sanitation facilities”. Source: World Health Organisation, Global Health Observatory, World Health Statistics, Environmental Health, 2011 or latest available data (accessed August 2013).
Healthcare quality: Response to the survey question, “In your country, how would you assess the quality of healthcare (public and private) provided to ordinary citizens? (1 = extremely poor – among the worst in the world, 7 = excellent - among the best in the world)”. Source: World Economic Forum, Executive Opinion Survey, 2013-2014.
Healthcare accessibility: Response to the survey question, “How accessible is healthcare in your country? (1 = limited — only the privileged have access, 7 = universal— all citizens have access to healthcare)”. Source: World Economic Forum, Executive Opinion Survey, 2013-2014.
Pillar 3: Workforce and EmploymentParticipation
Labour force participation rate, age 15-64 (%): The labour force participation rate is a measure of the proportion of a country’s working-age population that engages actively in the labour market, either by working or looking for work.5 Source: ILO, Key Indicators of the Labour Market, (KILM), 2010 (accessed September 2013).
Labour force participation rate, age 65+ (%): Source: ILO, Key Indicators of the Labour Market, (KILM), 2010 (accessed July 2013).
Economic participation gender gap: Taken from the World Economic Forum’s Global Gender Gap Report 2012 and comprises the full Economic Participation and Opportunity subindex score (ratios: female labour force participation over male value, estimated female earned income over male value, female legislators, senior officials, and managers over male value, female professional and technical workers over male value, wage equality between women and men for similar work [converted to male-over-female ratio]); 0 = lowest score, 1 = highest score and full gender parity.
Unemployment rate: Number of persons who are unemployed as a percentage of the total number of employed and unemployed persons (i.e. the labour force)6 Source: ILO, ILOstat, 2010 or latest available data (accessed August 2013).
Youth unemployment rate: Number of unemployed youth (typically 15-24 years) divided by the youth labour force (employment + unemployment).7 Source: ILO, Laborstat, 2010 or latest available data (accessed August 2013).
Talent Country capacity to attract talent: Response to the
survey question, “Does your country attract talented people from abroad? (1 = not at all, 7 = attracts the best and brightest from around the world)”. Source: World Economic Forum, Executive Opinion Survey, 2013-2014.
Country capacity to retain talent: Response to the survey question, “Does your country retain talented people? (1 = the best and brightest leave to pursue opportunities in other countries, 7 = the best and brightest stay and pursue opportunities in the country)”. Source: World Economic Forum, Executive Opinion Survey, 2013-2014.
Ease of finding skilled employees: Response to the survey question, “In your country, how easy is it for companies to find employees with the required skills for their business needs? (1 = extremely difficult, 7 = extremely easy)”. Source: World Economic Forum, Executive Opinion Survey, 2013-2014.
Pay related to productivity: Response to the survey question, “To what extent is pay in your country related to productivity? (1 = not related to worker productivity, 7 = strongly related to worker productivity)”. Source: World Economic Forum, Executive Opinion Survey, 2013-2014.
Capacity for innovation: Response to the survey question, “In your country, how do companies obtain technology? (1 = exclusively from licensing or imitating foreign companies, 7 = by conducting formal research and pioneering their own new products and processes)”. Source: World Economic Forum, Executive Opinion Survey, 2013-2014.
Index of economic complexity: The Atlas of Economic Complexity attempts to measure the amount of productive knowledge that each country holds.8 Source: Hausmann, R., Hidalgo, C., et al. The Atlas of Economic Complexity. Cambridge: Puritan Press, 2011.9
Firm level technology absorption: Response to the survey question, “To what extent do businesses in your country absorb new technology? (1 = Not at all; 7 = Aggressively absorb)”. Source: World Economic Forum, Executive Opinion Survey, 2013-2014.
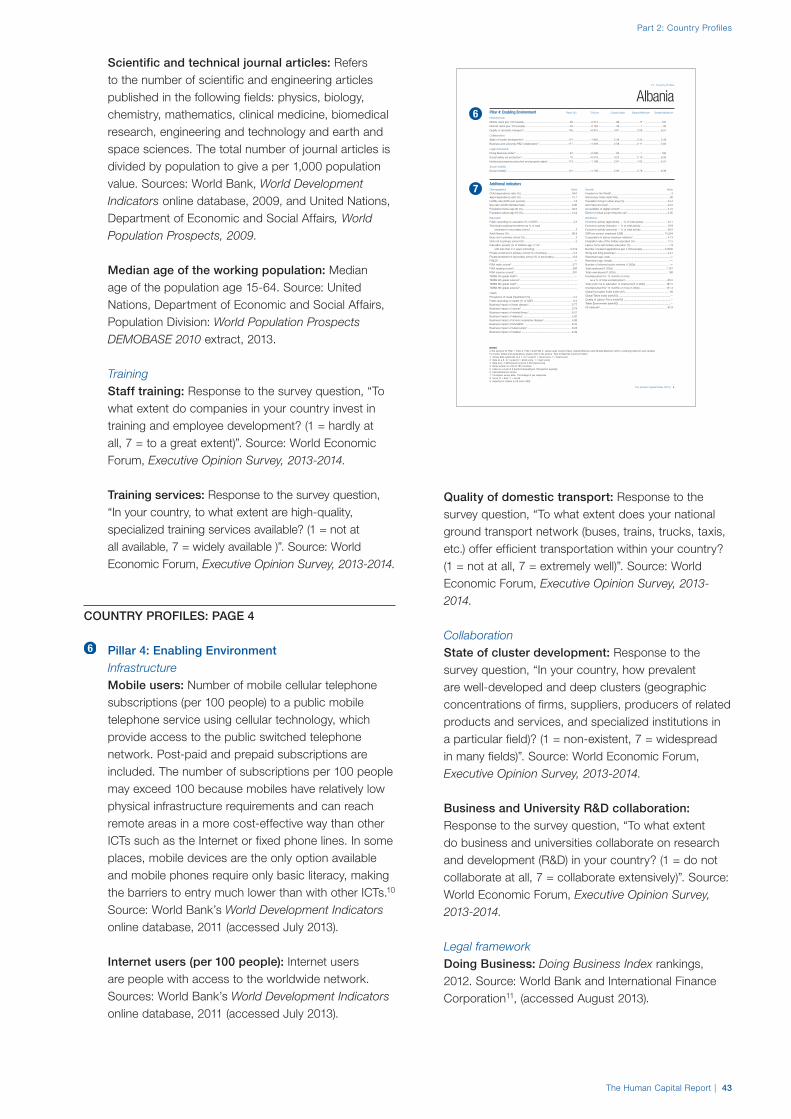
Part 2: Country Profiles
The Human Capital Report | 43
Scientific and technical journal articles: Refers to the number of scientific and engineering articles published in the following fields: physics, biology, chemistry, mathematics, clinical medicine, biomedical research, engineering and technology and earth and space sciences. The total number of journal articles is divided by population to give a per 1,000 population value. Sources: World Bank, World Development Indicators online database, 2009, and United Nations, Department of Economic and Social Affairs, World Population Prospects, 2009.
Median age of the working population: Median age of the population age 15-64. Source: United Nations, Department of Economic and Social Affairs, Population Division: World Population Prospects DEMOBASE 2010 extract, 2013.
Training Staff training: Response to the survey question, “To
what extent do companies in your country invest in training and employee development? (1 = hardly at all, 7 = to a great extent)”. Source: World Economic Forum, Executive Opinion Survey, 2013-2014.
Training services: Response to the survey question, “In your country, to what extent are high-quality, specialized training services available? (1 = not at all available, 7 = widely available )”. Source: World Economic Forum, Executive Opinion Survey, 2013-2014.
COUNTRY PROFILES: PAGE 4
Pillar 4: Enabling EnvironmentInfrastructure
Mobile users: Number of mobile cellular telephone subscriptions (per 100 people) to a public mobile telephone service using cellular technology, which provide access to the public switched telephone network. Post-paid and prepaid subscriptions are included. The number of subscriptions per 100 people may exceed 100 because mobiles have relatively low physical infrastructure requirements and can reach remote areas in a more cost-effective way than other ICTs such as the Internet or fixed phone lines. In some places, mobile devices are the only option available and mobile phones require only basic literacy, making the barriers to entry much lower than with other ICTs.10 Source: World Bank’s World Development Indicators online database, 2011 (accessed July 2013).
Internet users (per 100 people): Internet users are people with access to the worldwide network. Sources: World Bank’s World Development Indicators online database, 2011 (accessed July 2013).
Quality of domestic transport: Response to the survey question, “To what extent does your national ground transport network (buses, trains, trucks, taxis, etc.) offer efficient transportation within your country? (1 = not at all, 7 = extremely well)”. Source: World Economic Forum, Executive Opinion Survey, 2013-2014.
Collaboration State of cluster development: Response to the
survey question, “In your country, how prevalent are well-developed and deep clusters (geographic concentrations of firms, suppliers, producers of related products and services, and specialized institutions in a particular field)? (1 = non-existent, 7 = widespread in many fields)”. Source: World Economic Forum, Executive Opinion Survey, 2013-2014.
Business and University R&D collaboration: Response to the survey question, “To what extent do business and universities collaborate on research and development (R&D) in your country? (1 = do not collaborate at all, 7 = collaborate extensively)”. Source: World Economic Forum, Executive Opinion Survey, 2013-2014.
Legal framework Doing Business: Doing Business Index rankings,
2012. Source: World Bank and International Finance Corporation11, (accessed August 2013).
The Human Capital Index 2013 | 4
2.1: Country Profiles
NOTESIn the sections for Pillar 1, Pillar 2, Pillar 3 and Pillar 4, values under Country Value, Sample Minimum and Sample Maximum refer to underlying data for each variable.For further details and explanations, please refer to the section “How to Read the Country Profiles”.1 Survey data responses on a 1- to 7-scale (1 = worst score, 7 = best score)2 Data on a 0- to 1-scale (0 = worst score, 1 = best score)3 Data from -1.960 (worst score) to 2.367 (best score)4 Rank number on a list of 185 countries5 Index on a scale of 0 (perfect inequality) to 100 (perfect equality)6 International test scores7 Perception survey data. Percentage of yes responses.8 Score (1 = best, 7 = worst)9 Reported in relation to UK score (100)
AlbaniaPillar 4: Enabling Environment Rank/122 Z-Score Country Value Sample Minimum Sample Maximum
Infrastructure
Mobile users (per 100 people) ..............................................................83.......................–0.314 ........................ 96 ...........................17 ......................... 191
Internet users (per 100 people) .............................................................52.........................0.184 ........................ 49 .............................1 ........................... 95
Quality of domestic transport1 ............................................................105.......................–0.915 ..................... 3.67 ........................2.08 ........................ 6.51
Collaboration
State of cluster development1 ............................................................121.......................–1.964 ..................... 2.49 ........................2.33 ........................ 5.49
Business and university R&D collaboration1 ........................................117.......................–1.339 ..................... 2.58 ........................2.11 ........................ 5.84
Legal framework
Doing Business Index4 .........................................................................67.......................–0.098 ........................ 85 .............................1 ......................... 180
Social safety net protection1 .................................................................75.......................–0.519 ..................... 3.22 ........................2.10 ........................ 6.26
Intellectual property protection and property rights1............................113.......................–1.199 ..................... 2.87 ........................1.62 ........................ 6.31
Social mobility
Social mobility1 ...................................................................................121.......................–1.706 ..................... 2.85 ........................2.78 ........................ 6.36
Additional indicatorsDemographics Value
Child dependency ratio (%)..................................................................... 34.0Aged dependency ratio (%) .................................................................... 15.1Fertility rate (births per woman) ................................................................. 1.8Sex ratio at birth (female/male) ............................................................... 0.90Population below age 20 (%) .................................................................. 32.5Population above age 60 (%) .................................................................. 14.2
Education
Public spending on education (% of GDP) ................................................ 3.3Technical/vocational enrolment as % of total
enrolment in secondary school ............................................................. 5Adult literacy (%) ..................................................................................... 96.8Boys not in primary school (%) .................................................................... 2Girls not in primary school (%) ..................................................................... 5Education poverty (% of children age 17-22
with less than 2-4 years schooling) ................................................ 0.019Private enrolment in primary school (% of primary) ................................... 5.4Private enrolment in secondary school (% of secondary) .......................... 6.6PIRLS6 .......................................................................................................—PISA math scores6 .................................................................................. 377PISA reading scores6 ............................................................................... 385PISA science scores6 .............................................................................. 391TIMSS 4th grade math6 ..............................................................................—TIMSS 4th grade science6 ..........................................................................—TIMSS 8th grade math6 ..............................................................................—TIMSS 8th grade science6 ..........................................................................—
Health
Prevalence of visual impairment (%) .......................................................... 2.2Public spending on health (% of GDP) ...................................................... 6.3Business impact of heart disease1 .......................................................... 5.77Business impact of cancer1 .................................................................... 5.78Business impact of mental illness1 .......................................................... 6.01Business impact of diabetes1 ................................................................. 5.92Business impact of chronic respiratory disease1 ..................................... 5.88Business impact of HIV/AIDS1 ................................................................ 6.25Business impact of tuberculosis1 ............................................................ 6.28Business impact of malaria1 ................................................................... 6.32
Society Value
Freedom in the World8................................................................................. 3Democracy Index (rank/165) ...................................................................... 90Population living in urban area (%) .......................................................... 54.4Gini Index (income)5................................................................................ 34.5Accessibility of digital content1 ............................................................... 4.10Extent of virtual social networks use1 ..................................................... 5.05
Workforce
Economic activity (agriculture) — % of total activity ................................ 44.1Economic activity (industry) — % of total activity .................................... 19.9Economic activity (services) — % of total activity .................................... 36.0GDP per person employed (US$) ....................................................... 15,324Cooperation in labour-employer relations1 .............................................. 4.73Emigration rate of the tertiary educated (%) ............................................ 17.5Labour force with tertiary education (%) ................................................... 7.9Number of patent applications (per 1,000 people) .............................. 0.0035Hiring and firing practices1 ...................................................................... 4.41Retirement age, male .................................................................................—Retirement age, female ...............................................................................—Number of informal sector workers (1,000s) ...............................................—Total employed (1,000s) ....................................................................... 1,161Total unemployed (1,000s) ....................................................................... 185Unemployment for 12 months or more
as a % of total unemployment ......................................................... 65.5Total youth not in education or employment (1,000s) ........................... 187.5Unemployment for 12 months or more (1,000s) ................................... 121.3Global Innovation Index (rank/142) ............................................................ 93Global Talent Index (rank/60) ......................................................................—Quality of Labour Force (rank/60) ...............................................................—Talent Environment (rank/60) ......................................................................—IQ measure9 ........................................................................................... 82.9

Part 2: Country Profiles
44 | The Human Capital Report
Social safety net protection: Response to the survey question, “In your country, does a formal social safety net provide protection from economic insecurity in the event of job loss or disability? (1 = not at all, 7 = fully)”. Source: World Economic Forum, Executive Opinion Survey, 2013-2014.
Intellectual property protection and property rights: Average of responses to the two survey questions, “In your country, how strong is the protection of intellectual property, including anti-counterfeiting measures? (1 = extremely weak, 7 = extremely strong)” and “In your country, how strong is the protection of property rights, including financial assets? (1 = extremely weak, 7 = extremely strong)”. Source: World Economic Forum, Executive Opinion Survey, 2013-2014.
Social mobilitySocial mobility: Response to the survey question, “In your country, to what extent do individuals have the opportunity to improve their economic situation through their personal efforts regardless of the socio-economic status of their parents? (1 = little opportunity exists to improve one’s economic situation, 7 = significant opportunity exists to improve one’s economic situation)”. Source: World Economic Forum, Executive Opinion Survey, 2013-2014.
Additional indicators
DemographicsChild dependency ratio (%): Ratio of population age 0 to 14 per 100 population age 15 to 64. Source: United Nations, Department of Economic and Social Affairs, Population Division, World Population Prospects 2010 (accessed September 2013).
Aged dependency ratio (%): Ratio of population age 65 and over per 100 population age 15 to 64. Source: United Nations, Department of Economic and Social Affairs, Population Division, World Population Prospects 2010 (accessed September 2013).
Fertility rate (births per woman): Basic indicator of the level of fertility, calculated by summing age-specific birth rates over all reproductive ages (15 to 49). It may be interpreted as the expected number of children a women who survives to the end of the reproductive age span will have during her lifetime if she experiences the given age-specific rates.12 Source: United Nations, Department of Economic and Social Affairs, Population Division, World Population Prospects 2010 (accessed September 2013).
Sex ratio at birth (female/male): Taken from the World Economic Forum’s Global Gender Gap Report
2012. The sex ratio at birth is converted to female-over-male ratio.
Population below age 20 (%): Population between 0 and 19 as a percentage of the total population. Source: United Nations, Department of Economic and Social Affairs, Population Division, World Population Prospects 2010 (accessed September 2013).
Population above age 60 (%): Population 60 years and over as a percentage of the total population. Source: United Nations, Department of Economic and Social Affairs, Population Division, World Population Prospects 2010 (accessed September 2013).
Education Public spending on education (% of GDP): Total
public expenditure (current and capital) on education expressed as a percentage of the Gross Domestic Product (GDP) in a given year. Source: World Bank’s World Development Indicators online database, 2012 (accessed August 2013).
Technical/vocational enrolment as % of total enrolment in secondary school: Technical/vocational enrolment in ISCED 2 and 3 as a percentage of total enrolment in ISCED 2 and 3. Source: UNESCO Institute of Statistics, Education Statistics online database, 2012 or latest available year (accessed September 2013).
Adult literacy (%): Source: UNESCO Institute of Statistics, Education Statistics online database, 2012 or latest available year (accessed August 2013).
Boys not in primary school (%): Out-of-school rate for children of primary school age (%), male. Source: UNESCO Institute of Statistics, Education Statistics online database, 2012 or latest available year (accessed August 2013).
Girls not in primary school (%): Out-of-school rate for children of primary school age (%), female. Source: UNESCO Institute of Statistics, Education Statistics online database, 2012 or latest available year (accessed August 2013).
Education poverty (% of children age 17-22 with less than 2-4 years schooling): Share of the population aged 17 to 22 with less than 4 years in school (the minimum needed to gain basic literacy skills), and the share of the population aged 17 to 22 with less than 2 years in school. Source: UNESCO Institute of Statistics, Education Statistics online database, 2007 or latest available year (accessed July 2013).
Part 2: Country Profiles
The Human Capital Report | 45
Private enrolment in primary school (% of primary): Enrolment in private primary schools as a percentage of total enrolment in primary school. Source: UNESCO Institute of Statistics, Education Statistics online database, 2012 or latest available year (accessed August 2013).
Private enrolment in secondary school (% of secondary): Enrolment in private secondary schools as a percentage of total enrolment in secondary school. Source: UNESCO Institute of Statistics, Education Statistics online database, 2012 or latest available year (accessed August 2013).
PIRLS (Progress in International Reading Literacy Study): Average score for reading, grade 4. The scores are reported on a scale from 0 to 1,000 with the PIRLS scale average set at 500 (the 2001 mean) and standard deviation set at 100. Source: National Center for Education Statistics (NCES), Institute of Education Sciences, PIRLS International Data Explorer (data from International Association for the Evaluation of Educational Achievement, 2011).
PISA (Program for International Student Assessment) math scores: Average score for mathematics, age 15. Scores are scaled so that the mean is 500 and standard deviation 100. Source: Organisation for Economic Cooperation and Development (OECD) and National Center for Education Statistics (NCES), Institute of Education Sciences, PISA International Data Explorer. Data from 2009 (accessed July 2013).
PISA (Program for International Student Assessment) reading scores: average score for reading, age 15. Scores are scaled so that the mean is 500 and standard deviation 100. Source: Organisation for Economic Cooperation and Development (OECD) and National Center for Education Statistics (NCES), Institute of Education Sciences, PISA International Data Explorer. Data from 2009 (accessed July 2013).
PISA (Program for International Student Assessment) science scores: Average score for science, age 15. Scores are scaled so that the mean is 500 and standard deviation 100. Source: Organisation for Economic Cooperation and Development (OECD) and National Center for Education Statistics (NCES), Institute of Education Sciences, PISA International Data Explorer. Data from 2009 (accessed July 2013).
TIMSS (Trends in International Mathematics and Science Study) 4th grade math: Average score for
mathematics, grade 4. Scores are reported on a scale of 0 to 1,000 with the TIMSS scale average set at 500 and standard deviation set at 100. Source: National Center for Education Statistics (NCES), Institute of Education Sciences, TIMSS International Data Explorer (data from International Association for the Evaluation of Educational Achievement, 2011).
TIMSS (Trends in International Mathematics and Science Study) 4th grade science: Average score for science, grade 4. Scores are reported on a scale of 0 to 1,000 with the TIMSS scale average set at 500 and standard deviation set at 100. Source: National Center for Education Statistics (NCES), Institute of Education Sciences, TIMSS International Data Explorer (data from International Association for the Evaluation of Educational Achievement, 2011).
TIMSS (Trends in International Mathematics and Science Study) 8th grade math: Average score for mathematics, grade 8. Scores are reported on a scale of 0 to 1,000 with the TIMSS scale average set at 500 and standard deviation set at 100. Source: National Center for Education Statistics (NCES), Institute of Education Sciences, TIMSS International Data Explorer (data from International Association for the Evaluation of Educational Achievement, 2011).
TIMSS (Trends in International Mathematics and Science Study) 8th grade science: Average score for science, grade 8. Scores are reported on a scale of 0 to 1,000 with the TIMSS scale average set at 500 and standard deviation set at 100. Source: National Center for Education Statistics (NCES), Institute of Education Sciences, TIMSS International Data Explorer (data from International Association for the Evaluation of Educational Achievement, 2011).
Health Prevalence of visual impairment (%): impairment
is defined as presenting visual acuity prevalence of moderate, severe vision impairment and blindness (<6/18), all ages. Age-standardized (using the WHO reference population). Source: Stevens, G., White, R., et al. On behalf of the Vision Loss Expert Group. Global Prevalence of Vision Impairment and Blindness: Magnitude and Temporal Trends, 1990-2010. In Ophthalmology, 2013, Jul 10.
Public spending on health (% of GDP): Total health expenditure is the sum of public and private health expenditure and covers the provision of health services (preventive and curative), family planning activities, nutrition activities and emergency aid designated for health but does not include provision of water and sanitation. Source: World Bank’s World

Part 2: Country Profiles
46 | The Human Capital Report
Development Indicators online database, 2012 (accessed August 2013).
Business impact of heart disease: Response to the survey question, “How serious an impact do you consider the following diseases will have on your company in the next five years (e.g. death, disability, medical and funeral expenses, productivity and absenteeism, recruitment and training expenses, revenues)? a. Heart disease and related cardio vascular problems (1 = a serious impact, 7 = no impact at all)”. Source: World Economic Forum, Executive Opinion Survey, 2013-2014.
Business impact of cancer: Response to the survey question, “How serious an impact do you consider the following diseases will have on your company in the next five years (e.g. death, disability, medical and funeral expenses, productivity and absenteeism, recruitment and training expenses, revenues)? b. Cancer (1 = a serious impact, 7 = no impact at all)”. Source: World Economic Forum, Executive Opinion Survey, 2013-2014.
Business impact of mental illness: Response to the survey question, “How serious an impact do you consider the following diseases will have on your company in the next five years (e.g. death, disability, medical and funeral expenses, productivity and absenteeism, recruitment and training expenses, revenues)? c. Mental illness (1 = a serious impact, 7 = no impact at all)”. Source: World Economic Forum, Executive Opinion Survey, 2013-2014.
Business impact of diabetes: Response to the survey question, “How serious an impact do you consider the following diseases will have on your company in the next five years (e.g. death, disability, medical and funeral expenses, productivity and absenteeism, recruitment and training expenses, revenues)? d. Diabetes (1 = a serious impact, 7 = no impact at all)”. Source: World Economic Forum, Executive Opinion Survey, 2013-2014.
Business impact of chronic respiratory disease: Response to the survey question, “How serious an impact do you consider the following diseases will have on your company in the next five years (e.g. death, disability, medical and funeral expenses, productivity and absenteeism, recruitment and training expenses, revenues)? e. Chronic respiratory disease (1 = a serious impact, 7 = no impact at all)”. Source: World Economic Forum, Executive Opinion Survey, 2013-2014.
Business impact of HIV/AIDS: Response to the survey question, “How serious an impact do you consider the following diseases will have on your company in the next five years (e.g. death, disability, medical and funeral expenses, productivity and absenteeism, recruitment and training expenses, revenues)? f. HIV / AIDS (1 = a serious impact, 7 = no impact at all)”. Source: World Economic Forum, Executive Opinion Survey, 2013-2014.
Business impact of tuberculosis: Response to the survey question, “How serious an impact do you consider the following diseases will have on your company in the next five years (e.g. death, disability, medical and funeral expenses, productivity and absenteeism, recruitment and training expenses, revenues)? g. Tuberculosis (1 = a serious impact, 7 = no impact at all)”. Source: World Economic Forum, Executive Opinion Survey, 2013-2014.
Business impact of malaria: Response to the survey question, “How serious an impact do you consider the following diseases will have on your company in the next five years (e.g. death, disability, medical and funeral expenses, productivity and absenteeism, recruitment and training expenses, revenues)? h. Malaria (1 = a serious impact, 7 = no impact at all)”. Source: World Economic Forum, Executive Opinion Survey, 2013-2014.
Society Freedom in the World: Political rights as measured on
a one-to-seven scale, with one representing the highest degree of freedom and seven the lowest. Source: Freedom House, Freedom in the World 2013 (accessed August 2013).
Democracy Index (rank/165): Democracy ranking of countries. Source: The Economist Intelligence Unit, Democracy Index 2012 (accessed August 2013).
Population living in urban area (%): Urban population refers to people living in urban areas as defined by national statistical offices. It is calculated using World Bank population estimates and urban ratios from the United Nations World Urbanization Prospects. Source: World Bank’s World Development Indicators online database, 2012 (accessed August 2013).
Gini Index (income): Measures the extent to which the distribution of income or consumption expenditure among individuals or households within an economy deviates from a perfectly equal distribution. A Gini Index of 0 represents perfect equality, while an Index of 100 implies perfect inequality. Source: World Bank’s

Part 2: Country Profiles
The Human Capital Report | 47
World Development Indicators online database, 2012 (accessed August 2013).
Accessibility of digital content: Response to the survey question, “In your country, how available is digital content via multiple platforms (e.g. fixed-line Internet, wireless Internet, mobile network, satellite)? (1 = not available at all, 7 = widely available)”. Source: World Economic Forum, Executive Opinion Survey, 2013-2014.
Extent of virtual social networks use: Response to the survey question, “In your country, how widely used are virtual social networks (e.g. Facebook, Twitter, LinkedIn)? (1 = not used at all, 7 = widely used)”. Source: World Economic Forum, Executive Opinion Survey, 2013-2014.
WorkforceEconomic activity (agriculture) - % of total activity: Percentage of total employment in agriculture. Source: World Bank’s World Development Indicators online database, 2011 or latest data (accessed July 2013).
Economic activity (industry) - % of total activity: Percentage of total employment in industry. Source: World Bank’s World Development Indicators online database, 2011 or latest data (accessed July 2013).
Economic activity (services) - % of total activity: Percentage of total employment in services. Source: World Bank’s World Development Indicators online database, 2011 or latest data (accessed July 2013).
GDP per person employed (US$): GDP per person employed, in constant 1990 PPP $, is gross domestic product (GDP) divided by total employment in the economy. Purchasing power parity (PPP) GDP is GDP converted to 1990 constant international dollars using PPP rates. An international dollar has the same purchasing power over GDP that a U.S. dollar has in the United States. Source: World Bank’s World Development Indicators online database, 2011 or latest data (accessed August 2013).
Cooperation in labour-employer relations: Response to the survey question, “In your country, how would you characterize labour-employer relations? (1 = generally confrontational, 7 = generally cooperative)”. Source: World Economic Forum, Executive Opinion Survey, 2013-2014.
Emigration rate of the tertiary educated (%): Emigration rate of tertiary educated to OECD countries as a percentage of total tertiary educated population. This shows the stock of emigrants aged 25 and older,
residing in an OECD country other than that in which they were born, with at least one year of tertiary education as a percentage of the population age 25 and older with tertiary education. Source: World Bank’s World Development Indicators online database, 2000 (accessed July 2013).
Labour force with tertiary education (%): Proportion of labour force that has a tertiary education, as a percentage of the total labour force. Source: World Bank’s World Development Indicators online database, 2000 (accessed July 2013).
Number of patent applications (per 1,000 people): Total patent applications (direct and PCT national phase entries) divided by population (thousands). Source: World Intellectual Property Organisation (WIPO) statistics database 2011 (accessed February 2013) and United Nations, Department of Economic and Social Affairs, Population Division, World Population Prospects: The 2012 Revision (accessed June 2013).
Hiring and firing practices: Response to the survey question, “In your country, how would you characterize the hiring and firing of workers? (1 = heavily impeded by regulations, 7 = extremely flexible)”. Source: World Economic Forum, Executive Opinion Survey, 2013-2014.
Retirement age, male. Source: Mercer’s Worldwide Benefit and Employment Guidelines 2013. Where not available data is sourced from Organisation for Economic Cooperation and Development (OECD) “Average effective age of retirement”, 2011 (accessed August 2013).
Retirement age, female. Source: Mercer’s Worldwide Benefit and Employment Guidelines 2013. Where not available data is sourced from Organisation for Economic Cooperation and Development (OECD) “Average effective age of retirement”, 2011 (accessed August 2013).
Number of informal sector workers (1,000s). The data refers to non-agricultural employment; it excludes employment in agriculture, hunting, forestry and fishing activities. Source: International Labour Organisation (ILO) and Women in Informal Employment: Globalizing and Informing (WIEGO), “Women and men in the informal economy – Statistical Picture”, Laborsta, 2010 (accessed July 2013).
Total employed (1,000s): “Employed” comprises all persons of working age who, during a specified brief period, were in one of the following categories: a) paid employment (whether at work or with a job but not at

Part 2: Country Profiles
48 | The Human Capital Report
work); or b) self-employment (whether at work or with an enterprise but not at work). Source: ILOStat, 2010 or latest available data (accessed August 2013).
Total unemployed (1,000s): “Unemployed” comprises all persons of working age who were: a) without work during the reference period; i.e. were not in paid employment or self-employment; b) currently available for work; i.e. were available for paid employment or self-employment during the reference period; and c) seeking work; i.e. had taken specific steps in a specified recent period to seek paid employment or self-employment. Source: ILOStat, 2010 or latest available data (accessed August 2013).
Unemployed for 12 months or more as a % of total unemployment: Total number unemployed (in thousands) for more than 12 months divided by the total number of unemployed (in thousands), expressed as a percentage. Source: ILOStat, 2010 or latest available data (accessed August 2013).
Total youth not in education or employment (1,000s): Proportion of youth (persons between the ages of 15 and 24 years) who are not in employment and not in education or training. Source: ILOStat, 2010 or latest available data (accessed July 2013).
Unemployment for 12 months or more (1,000s): Total number unemployed (in thousands) for more than 12 months. Source: ILOStat, 2010 or latest available data (accessed August 2013).
Global Innovation Index (rank/142): Five input pillars capture elements of the national economy that enable innovative activities: (1) Institutions, (2) Human capital and research, (3) Infrastructure, (4) Market sophistication and (5) Business sophistication. Two output pillars capture actual evidence of innovation outputs: (6) Knowledge and technology outputs and (7) Creative outputs. Source: Cornell University, INSEAD and the World Intellectual Property Organization (WIPO), 2013 (accessed August 2013),
Global Talent Index (rank/60): Uses quantitative and qualitative data to measure the economic indicators, cultural contexts, trends in education, foreign direct investment (FDI), mortality, health and market fluidity that will impact the ability of talent to thrive. Source: Heidrick & Struggles and Economist Intelligence Unit (EIU), Global Talent Index 2011 (accessed August 2013).
Quality of Labour Force (rank/60): Subindex of the Global Talent Index. Variables comprise: researchers in R&D, technicians in R&D, quality of work force,
quality of labour force, language skills of labour force and technical skills of workforce and local managers. Source: Heidrick & Struggles and Economist Intelligence Unit (EIU), Global Talent Index 2011 (accessed August 2013).
Talent Environment (rank/60): Subindex of the Global Talent Index. Variables comprise: R&D as percentage of GDP, degree of restrictiveness of labour laws, wage regulation, protection of private property and meritocratic remuneration. Source: Heidrick & Struggles and Economist Intelligence Unit (EIU), Global Talent Index 2011 (accessed August 2013).
IQ measure: Final IQ, (intelligence quotient) is calculated as a weighted average of scholastic achievement and IQ. Source: Lynn, R. and Vanhanen, T. Intelligence: A Unifying Construct for the Social Sciences. London: Ulster Institute for Social Research, 2012.
NOTES 1 The ILO defines skill level as “a function of the complexity and range
of the tasks and duties involved” and skill specialisation as “the field of knowledge required, the tools and machinery used, the materials worked on or with, as well as the kinds of goods and services produced.”
2 For ISCO-88 subgroups and skills levels see: http://www.ilo.org/public/english/bureau/stat/isco/isco88/publ3.htm.
3 International Labor Organisation. http://www.ilo.org/public/english/bureau/stat/isco/isco88/publ3.htm
4 UNICEF, Monitoring the Status of Child and Women. http://www.childinfo.org/malnutrition_methodology.html.
5 International Labour Office, Key Indicators of the Labour Market, 7th edition. http://kilm.ilo.org/manuscript/kilm01.asp.
6 International Labour Office, ILOStat. http://www.ilo.org/ilostat/faces/help_home/conceptsdefinitions?_adf.ctrl-state=170uhpi2ta_138&clean=true&_afrLoop=67928553669604.
7 International Labour Office, the Youth Employment Network. http://www.ilo.org/public/english/employment/yen/whatwedo/projects/indicators/2.htm.
8 See: http://atlas.media.mit.edu/media/atlas/pdf/HarvardMIT_AtlasOfEconomicComplexity_Part_I.pdf.
9 The Observatory of Economic Complexity. http://atlas.media.mit.edu/rankings/.
10 United Nations Development Programme. “Mobile Technologies and Empowerment: Enhancing human development through participation and innovation.” http://www.undpegov.org/mgov-primer.html.
11 The World Bank and International Finance Corporation. The Doing Business Project. http://www.doingbusiness.org/rankings.
12 Handbook on the Collection of Fertility and Morality Data. New York: United Nations, 2004. http://unstats.un.org/unsd/publication/SeriesF/SeriesF_92E.pdf.

Part 2: Country Profiles
The Human Capital Report | 49
List of Countries
Country/Economy Page
Albania 50
Algeria 54
Argentina 58
Armenia 62
Australia 66
Austria 70
Azerbaijan 74
Bahrain 78
Bangladesh 82
Barbados 86
Belgium 90
Benin 94
Bhutan 98
Bolivia 102
Botswana 106
Brazil 110
Bulgaria 114
Burkina Faso 118
Cambodia 122
Cameroon 126
Canada 130
Chile 134
China 138
Colombia 142
Costa Rica 146
Côte d’Ivoire 150
Croatia 154
Cyprus 158
Czech Republic 162
Denmark 166
Dominican Republic 170
Ecuador 174
Egypt 178
El Salvador 182
Estonia 186
Ethiopia 190
Finland 194
France 198
Georgia 202
Germany 206
Ghana 210
Country/Economy Page
Greece 214
Guatemala 218
Guinea 222
Honduras 226
Hungary 230
Iceland 234
India 238
Indonesia 242
Iran, Islamic Rep. 246
Ireland 250
Israel 254
Italy 258
Jamaica 262
Japan 266
Jordan 270
Kazakhstan 274
Kenya 278
Korea, Rep. 282
Kuwait 286
Kyrgyz Republic 290
Lao PDR 294
Latvia 298
Lebanon 302
Lesotho 306
Lithuania 310
Luxembourg 314
Macedonia, FYR 318
Madagascar 322
Malawi 326
Malaysia 330
Mali 334
Malta 338
Mauritania 342
Mauritius 346
Mexico 350
Moldova 354
Mongolia 358
Morocco 362
Mozambique 366
Namibia 370
Netherlands 374
Country/Economy Page
New Zealand 378
Nicaragua 382
Nigeria 386
Norway 390
Oman 394
Pakistan 398
Panama 402
Paraguay 406
Peru 410
Philippines 414
Poland 418
Portugal 422
Qatar 426
Romania 430
Russian Federation 434
Saudi Arabia 438
Senegal 442
Serbia 446
Singapore 450
Slovenia 454
South Africa 458
Spain 462
Sri Lanka 466
Suriname 470
Sweden 474
Switzerland 478
Tanzania 482
Thailand 486
Trinidad and Tobago 490
Tunisia 494
Turkey 498
Uganda 502
Ukraine 506
United Arab Emirates 510
United Kingdom 514
United States 518
Uruguay 522
Venezuela 526
Vietnam 530
Yemen 534
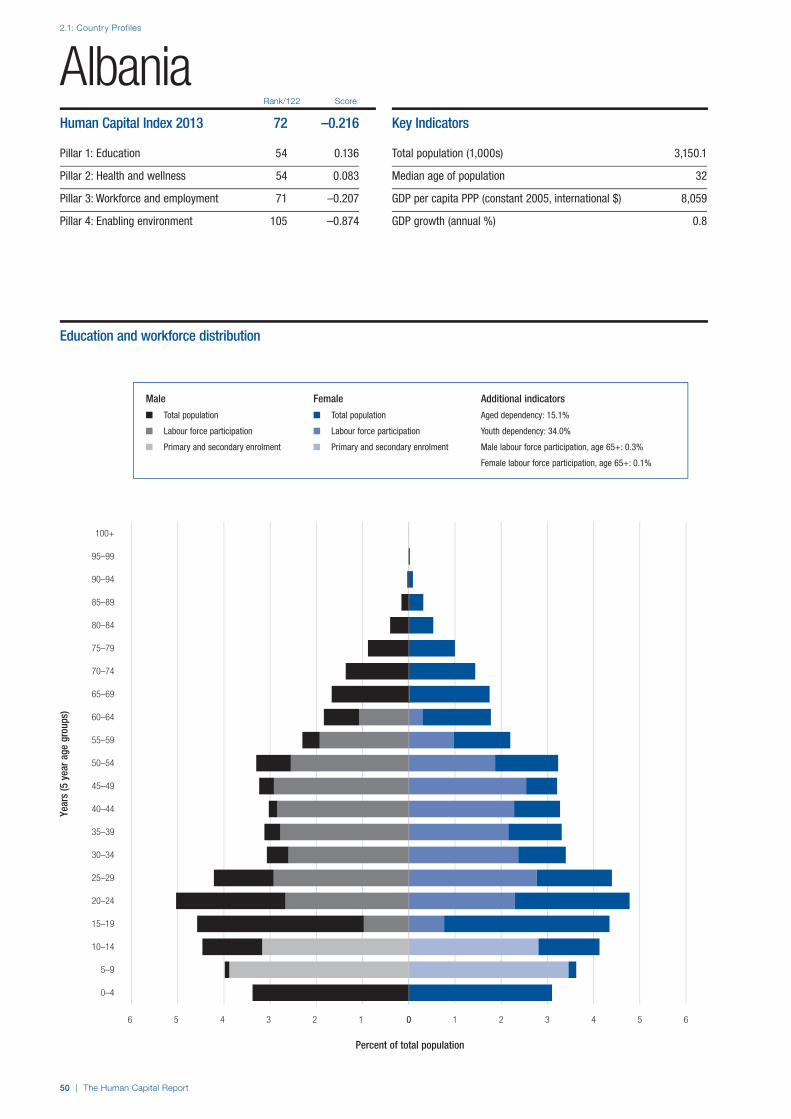
2.1: Country Profiles
50 | The Human Capital Report
Rank/122 Score
Year
s (5
yea
r age
gro
ups)
Percent of total population
0–4
5–9
10–14
15–19
20–24
25–29
30–34
35–39
40–44
45–49
50–54
55–59
60–64
65–69
70–74
75–79
80–84
85–89
90–94
95–99
100+
0 1 2 3 4 5 66 5 4 3 2 1 0
AlbaniaHuman Capital Index 2013 72 –0.216
Pillar 1: Education 54 0.136
Pillar 2: Health and wellness 54 0.083
Pillar 3: Workforce and employment 71 –0.207
Pillar 4: Enabling environment 105 –0.874
Key Indicators
Total population (1,000s) 3,150.1
Median age of population 32
GDP per capita PPP (constant 2005, international $) 8,059
GDP growth (annual %) 0.8
Male Female Additional indicators
n Total population n Total population Aged dependency: 15.1%
n Labour force participation n Labour force participation Youth dependency: 34.0%
n Primary and secondary enrolment n Primary and secondary enrolment Male labour force participation, age 65+: 0.3%
Female labour force participation, age 65+: 0.1%
Education and workforce distribution

The Human Capital Report | 51
2.1: Country Profiles
HCI s
core
–2.5
–2.0
–1.5
–1.0
–0.5
0.0
0.5
1.0
1.5
2.0
2.5
Overall Index
Enablingenvironment
Workforce andemployment
Health andwellness
Education
AlbaniaEmployment types, educational requirements and educational attainment
Percent of population Educational in employment type attainment (%)
Tertiary requirements n/a 1.5
Professionals n/a
Technicians and associate professionals n/a
Secondary requirements n/a 72.8
Clerks n/a
Service workers and shop and market sales workers n/a
Skilled agricultural and fishery workers n/a
Craft and related trade workers n/a
Plant and machine operators and assemblers n/a
Primary requirements n/a 10.6
Elementary occupations n/a
Various n/a
Legislators, senior officials and managers n/a
Unclassified n/a
Armed forces n/a
Spread of scores (by pillar and overall)
Albania
Upper-middle income economies
Europe and Central Asia

2.1: Country Profiles
52 | The Human Capital Report
Pillar 1: Education Rank/122 Z-Score Country Value Sample Minimum Sample Maximum
Access
Primary enrolment rate (%) ...................................................................59.........................0.368........................ 96...........................58 ......................... 100
Secondary enrolment rate (%) ..............................................................—..............................— .........................— ...........................16 ......................... 100
Tertiary enrolment ratio (%) ...................................................................49.........................0.127........................ 44.............................1 ......................... 103
Education gender gap2 .........................................................................69.........................0.403................... 0.989......................0.645 ...................... 1.000
Quality
Internet access in schools1 ...................................................................63.......................–0.105..................... 4.19........................1.64 ........................ 6.64
Quality of the education system1 ..........................................................42.........................0.281..................... 4.05........................1.99 ........................ 5.98
Quality of primary schools1 ...................................................................45.........................0.352..................... 4.32........................1.97 ........................ 6.82
Quality of math & science education1 ...................................................48.........................0.306..................... 4.33........................1.88 ........................ 6.29
Quality of management schools1 ..........................................................73.......................–0.234..................... 4.10........................2.29 ........................ 6.09
Attainment
Primary education attainment (% population age 25+) ..........................20.........................0.771........................ 95.............................5 ......................... 100
Secondary education attainment (% population age 25+) .....................24.........................0.818........................ 85.............................2 ......................... 100
Tertiary education attainment (% population age 25+) ..........................83.......................–1.588.......................... 1.............................0 ........................... 44
Pillar 2: Health and Wellness Rank/122 Z-Score Country Value Sample Minimum Sample Maximum
Survival
Infant mortality (per 1,000 live births) ....................................................57.........................0.383........................ 13.............................2 ........................... 98
Life expectancy ...................................................................................59.........................0.177........................ 74...........................50 ........................... 83
Survival gender gap2 ..........................................................................116.......................–3.489................... 0.931......................0.920 ...................... 0.980
Health
Stunting and wasting (% in children under 5) ........................................46.......................–0.107..................... 16.3..........................1.2 ........................ 36.5
Unhealthy life years (% of life expectancy) ............................................59.........................0.186........................ 14.............................8 ........................... 66
Deaths under 60 from non-communicable
diseases (% of all NCD deaths) ......................................................31.........................0.919 ..................... 14.9 ..........................7.3 ........................ 55.8
Obesity (% of adults with BMI ≥ 30) .....................................................66.......................–0.271..................... 21.1..........................1.1 ........................ 42.8
Business impact of non-communicable diseases1 ..................................1.........................3.098..................... 5.87........................2.74 ........................ 5.87
Business impact of communicable diseases1 .......................................29.........................0.813..................... 6.29........................3.13 ........................ 6.90
Well-being
Stress (% of respondents)7 ..................................................................99.......................–0.948........................ 43.............................8 ........................... 69
Depression (% of respondents)7 .............................................................8.........................1.253.......................... 4.............................2 ........................... 37
Services
Water, sanitation and hygiene (% with access) .....................................59.........................0.524..................... 94.3........................31.1 ...................... 100.0
Healthcare quality1................................................................................86.......................–0.708..................... 3.25........................1.78 ........................ 6.75
Healthcare accessibility1 .......................................................................83.......................–0.671..................... 3.84........................2.41 ........................ 6.75
Pillar 3: Workforce and Employment Rank/122 Z-Score Country Value Sample Minimum Sample Maximum
Participation
Labour force participation rate, age 15-64 (%) .....................................81.......................–0.275..................... 66.5........................43.4 ........................ 90.6
Labour force participation rate, age 65+ (%) .........................................62.......................–0.379..................... 17.3..........................1.6 ........................ 91.2
Economic participation gender gap2 .....................................................57.........................0.193................... 0.666......................0.310 ...................... 0.839
Unemployment rate (%) ........................................................................94.......................–0.966..................... 13.8..........................0.3 ........................ 32.0
Youth unemployment rate (%) ...............................................................87.......................–0.884..................... 27.2..........................1.6 ........................ 48.2
Talent
Country capacity to attract talent1 ........................................................51.........................0.147..................... 3.59........................1.48 ........................ 6.08
Country capacity to retain talent1..........................................................53.........................0.010..................... 3.54........................1.81 ........................ 5.97
Ease of finding skilled employees1 ........................................................52.........................0.164..................... 4.10........................2.13 ........................ 5.69
Pay related to productivity1 ...................................................................20.........................0.984..................... 4.52........................2.37 ........................ 5.25
Capacity for innovation1......................................................................107.......................–0.929..................... 2.97........................2.31 ........................ 5.84
Index of Economic Complexity3 ............................................................54.......................–0.049..................... 0.06......................–1.96 ........................ 2.37
Firm level technology absorption1 .........................................................93.......................–0.800..................... 4.24........................3.17 ........................ 6.23
Scientific and technical journal articles (per 1,000 people) ..................102.......................–0.620................... 0.003......................0.000 ...................... 1.242
Median age of the working population ..................................................47.........................0.477........................ 37...........................28 ........................... 42
Training
Staff training1 ........................................................................................31.........................0.537..................... 4.39........................2.51 ........................ 5.57
Training services1 ................................................................................100.......................–0.926..................... 3.57........................2.67 ........................ 6.47
Albania

2.1: Country Profiles
NOTESIn the sections for Pillar 1, Pillar 2, Pillar 3 and Pillar 4, values under Country Value, Sample Minimum and Sample Maximum refer to underlying data for each variable.For further details and explanations, please refer to the section “How to Read the Country Profiles”.1 Survey data responses on a 1- to 7-scale (1 = worst score, 7 = best score)2 Data on a 0- to 1-scale (0 = worst score, 1 = best score)3 Data from -1.960 (worst score) to 2.367 (best score)4 Rank number on a list of 185 countries5 Index on a scale of 0 (perfect inequality) to 100 (perfect equality)6 International test scores7 Perception survey data. Percentage of yes responses.8 Score (1 = best, 7 = worst)9 Reported in relation to UK score (100)
The Human Capital Report | 53
AlbaniaPillar 4: Enabling Environment Rank/122 Z-Score Country Value Sample Minimum Sample Maximum
Infrastructure
Mobile users (per 100 people) ..............................................................83.......................–0.314........................ 96...........................17 ......................... 191
Internet users (per 100 people) .............................................................52.........................0.184........................ 49.............................1 ........................... 95
Quality of domestic transport1 ............................................................105.......................–0.915..................... 3.67........................2.08 ........................ 6.51
Collaboration
State of cluster development1 ............................................................121.......................–1.964..................... 2.49........................2.33 ........................ 5.49
Business and university R&D collaboration1 ........................................117.......................–1.339 ..................... 2.58 ........................2.11 ........................ 5.84
Legal framework
Doing Business Index4 .........................................................................67.......................–0.098........................ 85.............................1 ......................... 180
Social safety net protection1 .................................................................75.......................–0.519..................... 3.22........................2.10 ........................ 6.26
Intellectual property protection and property rights1............................113.......................–1.199 ..................... 2.87 ........................1.62 ........................ 6.31
Social mobility
Social mobility1 ...................................................................................121.......................–1.706..................... 2.85........................2.78 ........................ 6.36
Additional indicatorsDemographics Value
Child dependency ratio (%)..................................................................... 34.0Aged dependency ratio (%) .................................................................... 15.1Fertility rate (births per woman) ................................................................. 1.8Sex ratio at birth (female/male) ............................................................... 0.90Population below age 20 (%) .................................................................. 32.5Population above age 60 (%) .................................................................. 14.2
Education
Public spending on education (% of GDP) ................................................ 3.3Technical/vocational enrolment as % of total
enrolment in secondary school ............................................................. 5Adult literacy (%) ..................................................................................... 96.8Boys not in primary school (%) .................................................................... 2Girls not in primary school (%) ..................................................................... 5Education poverty (% of children age 17-22
with less than 2-4 years schooling) ................................................ 0.019Private enrolment in primary school (% of primary) ................................... 5.4Private enrolment in secondary school (% of secondary) .......................... 6.6PIRLS6 .......................................................................................................—PISA math scores6 .................................................................................. 377PISA reading scores6 ............................................................................... 385PISA science scores6 .............................................................................. 391TIMSS 4th grade math6 ..............................................................................—TIMSS 4th grade science6 ..........................................................................—TIMSS 8th grade math6 ..............................................................................—TIMSS 8th grade science6 ..........................................................................—
Health
Prevalence of visual impairment (%) .......................................................... 2.2Public spending on health (% of GDP) ...................................................... 6.3Business impact of heart disease1 .......................................................... 5.77Business impact of cancer1 .................................................................... 5.78Business impact of mental illness1 .......................................................... 6.01Business impact of diabetes1 ................................................................. 5.92Business impact of chronic respiratory disease1 ..................................... 5.88Business impact of HIV/AIDS1 ................................................................ 6.25Business impact of tuberculosis1 ............................................................ 6.28Business impact of malaria1 ................................................................... 6.32
Society Value
Freedom in the World8................................................................................. 3Democracy Index (rank/165) ...................................................................... 90Population living in urban area (%) .......................................................... 54.4Gini Index (income)5................................................................................ 34.5Accessibility of digital content1 ............................................................... 4.10Extent of virtual social networks use1 ..................................................... 5.05
Workforce
Economic activity (agriculture) — % of total activity ................................ 44.1Economic activity (industry) — % of total activity .................................... 19.9Economic activity (services) — % of total activity .................................... 36.0GDP per person employed (US$) ....................................................... 15,324Cooperation in labour-employer relations1 .............................................. 4.73Emigration rate of the tertiary educated (%) ............................................ 17.5Labour force with tertiary education (%) ................................................... 7.9Number of patent applications (per 1,000 people) .............................. 0.0035Hiring and firing practices1 ...................................................................... 4.41Retirement age, male .................................................................................—Retirement age, female ...............................................................................—Number of informal sector workers (1,000s) ...............................................—Total employed (1,000s) ....................................................................... 1,161Total unemployed (1,000s) ....................................................................... 185Unemployment for 12 months or more
as a % of total unemployment ......................................................... 65.5Total youth not in education or employment (1,000s) ........................... 187.5Unemployment for 12 months or more (1,000s) ................................... 121.3Global Innovation Index (rank/142) ............................................................ 93Global Talent Index (rank/60) ......................................................................—Quality of Labour Force (rank/60) ...............................................................—Talent Environment (rank/60) ......................................................................—IQ measure9 ........................................................................................... 82.9

2.1: Country Profiles
54 | The Human Capital Report
Rank/122 Score
Year
s (5
yea
r age
gro
ups)
Percent of total population
0–4
5–9
10–14
15–19
20–24
25–29
30–34
35–39
40–44
45–49
50–54
55–59
60–64
65–69
70–74
75–79
80–84
85–89
90–94
95–99
100+
0 1 2 3 4 5 66 5 4 3 2 1 0
AlgeriaHuman Capital Index 2013 115 –0.954
Pillar 1: Education 106 –0.991
Pillar 2: Health and wellness 93 –0.413
Pillar 3: Workforce and employment 121 –1.345
Pillar 4: Enabling environment 112 –1.066
Key Indicators
Total population (1,000s) 37,062.8
Median age of population 26
GDP per capita PPP (constant 2005, international $) 7,339
GDP growth (annual %) 2.5
Male Female Additional indicators
n Total population n Total population Aged dependency: 6.9%
n Labour force participation n Labour force participation Youth dependency: 39.8%
n Primary and secondary enrolment n Primary and secondary enrolment Male labour force participation, age 65+: 0.3%
Female labour force participation, age 65+: n/a
Education and workforce distribution
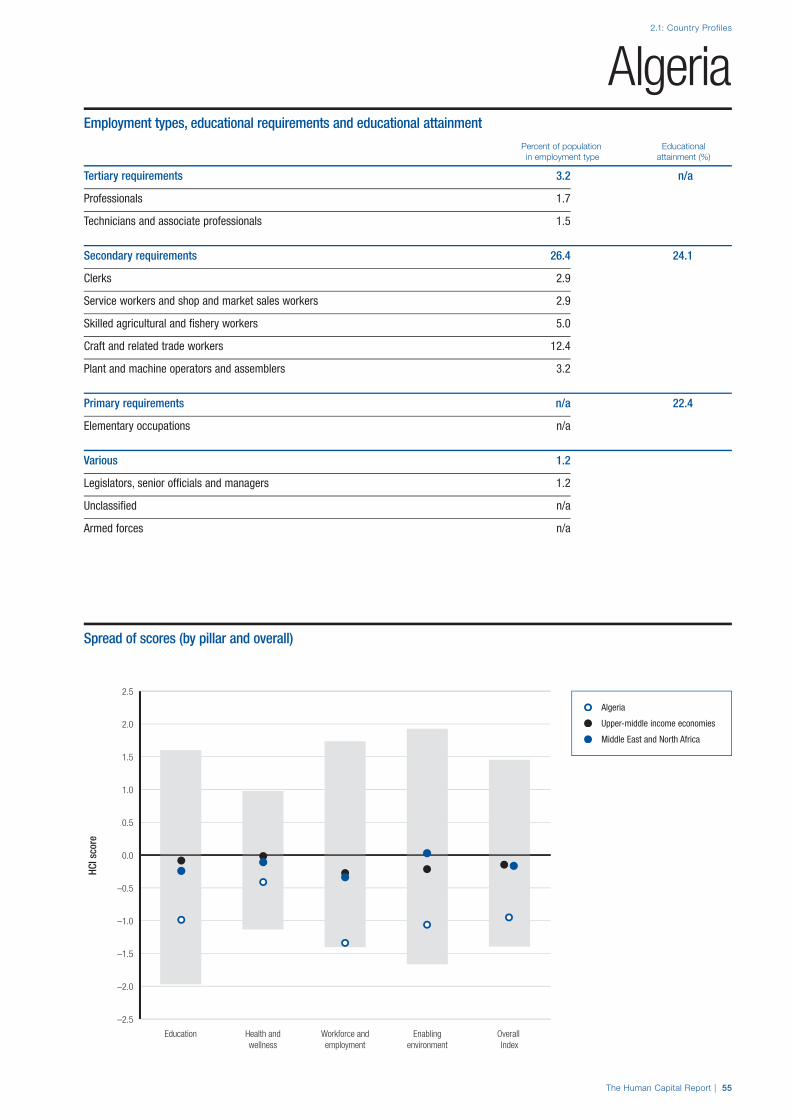
The Human Capital Report | 55
2.1: Country Profiles
HCI s
core
–2.5
–2.0
–1.5
–1.0
–0.5
0.0
0.5
1.0
1.5
2.0
2.5
Overall Index
Enablingenvironment
Workforce andemployment
Health andwellness
Education
AlgeriaEmployment types, educational requirements and educational attainment
Percent of population Educational in employment type attainment (%)
Tertiary requirements 3.2 n/a
Professionals 1.7
Technicians and associate professionals 1.5
Secondary requirements 26.4 24.1
Clerks 2.9
Service workers and shop and market sales workers 2.9
Skilled agricultural and fishery workers 5.0
Craft and related trade workers 12.4
Plant and machine operators and assemblers 3.2
Primary requirements n/a 22.4
Elementary occupations n/a
Various 1.2
Legislators, senior officials and managers 1.2
Unclassified n/a
Armed forces n/a
Spread of scores (by pillar and overall)
Algeria
Upper-middle income economies
Middle East and North Africa

2.1: Country Profiles
56 | The Human Capital Report
Pillar 1: Education Rank/122 Z-Score Country Value Sample Minimum Sample Maximum
Access
Primary enrolment rate (%) ...................................................................44.........................0.509........................ 98...........................58 ......................... 100
Secondary enrolment rate (%) ..............................................................—..............................— .........................— ...........................16 ......................... 100
Tertiary enrolment ratio (%) ...................................................................67.......................–0.322........................ 32.............................1 ......................... 103
Education gender gap2 .........................................................................94.......................–0.115................... 0.950......................0.645 ...................... 1.000
Quality
Internet access in schools1 .................................................................117.......................–1.719..................... 2.17........................1.64 ........................ 6.64
Quality of the education system1 ........................................................111.......................–1.262..................... 2.67........................1.99 ........................ 5.98
Quality of primary schools1 .................................................................110.......................–1.351..................... 2.47........................1.97 ........................ 6.82
Quality of math & science education1 .................................................110.......................–1.388..................... 2.71........................1.88 ........................ 6.29
Quality of management schools1 ........................................................115.......................–1.550..................... 3.00........................2.29 ........................ 6.09
Attainment
Primary education attainment (% population age 25+) ..........................63.......................–1.250........................ 46.............................5 ......................... 100
Secondary education attainment (% population age 25+) .....................77.......................–1.466........................ 24.............................2 ......................... 100
Tertiary education attainment (% population age 25+) ..........................—..............................— .........................— .............................0 ........................... 44
Pillar 2: Health and Wellness Rank/122 Z-Score Country Value Sample Minimum Sample Maximum
Survival
Infant mortality (per 1,000 live births) ....................................................89.......................–0.201........................ 26.............................2 ........................... 98
Life expectancy ...................................................................................72.........................0.056........................ 73...........................50 ........................... 83
Survival gender gap2 ............................................................................96.......................–0.430................... 0.966......................0.920 ...................... 0.980
Health
Stunting and wasting (% in children under 5) ........................................27.........................0.610..................... 10.0..........................1.2 ........................ 36.5
Unhealthy life years (% of life expectancy) ............................................80.......................–0.073........................ 15.............................8 ........................... 66
Deaths under 60 from non-communicable
diseases (% of all NCD deaths) ......................................................80.......................–0.316 ..................... 30.6 ..........................7.3 ........................ 55.8
Obesity (% of adults with BMI ≥ 30) .....................................................48.........................0.109..................... 17.5..........................1.1 ........................ 42.8
Business impact of non-communicable diseases1 ..............................121.......................–2.731..................... 3.25........................2.74 ........................ 5.87
Business impact of communicable diseases1 .......................................95.......................–0.902..................... 4.58........................3.13 ........................ 6.90
Well-being
Stress (% of respondents)7 ..................................................................38.........................0.292........................ 27.............................8 ........................... 69
Depression (% of respondents)7 ...........................................................97.......................–0.978........................ 18.............................2 ........................... 37
Services
Water, sanitation and hygiene (% with access) .....................................70.........................0.272..................... 89.4........................31.1 ...................... 100.0
Healthcare quality1..............................................................................101.......................–0.975..................... 2.92........................1.78 ........................ 6.75
Healthcare accessibility1 .......................................................................74.......................–0.511..................... 4.04........................2.41 ........................ 6.75
Pillar 3: Workforce and Employment Rank/122 Z-Score Country Value Sample Minimum Sample Maximum
Participation
Labour force participation rate, age 15-64 (%) ...................................120.......................–2.381..................... 45.9........................43.4 ........................ 90.6
Labour force participation rate, age 65+ (%) .......................................107.......................–1.024....................... 4.8..........................1.6 ........................ 91.2
Economic participation gender gap2 ...................................................115.......................–2.256................... 0.378......................0.310 ...................... 0.839
Unemployment rate (%) ........................................................................79.......................–0.241..................... 10.0..........................0.3 ........................ 32.0
Youth unemployment rate (%) ...............................................................79.......................–0.585..................... 24.3..........................1.6 ........................ 48.2
Talent
Country capacity to attract talent1 ......................................................112.......................–1.433..................... 1.96........................1.48 ........................ 6.08
Country capacity to retain talent1........................................................114.......................–1.496..................... 2.08........................1.81 ........................ 5.97
Ease of finding skilled employees1 ........................................................82.......................–0.373..................... 3.73........................2.13 ........................ 5.69
Pay related to productivity1 .................................................................116.......................–1.809..................... 2.82........................2.37 ........................ 5.25
Capacity for innovation1......................................................................122.......................–1.758..................... 2.31........................2.31 ........................ 5.84
Index of Economic Complexity3 ..........................................................104.......................–1.419................... –1.24......................–1.96 ........................ 2.37
Firm level technology absorption1 .......................................................122.......................–2.308..................... 3.17........................3.17 ........................ 6.23
Scientific and technical journal articles (per 1,000 people) ....................73.......................–0.571................... 0.017......................0.000 ...................... 1.242
Median age of the working population ..................................................85.......................–0.735........................ 32...........................28 ........................... 42
Training
Staff training1 ......................................................................................118.......................–1.560..................... 3.04........................2.51 ........................ 5.57
Training services1 ................................................................................119.......................–1.567..................... 3.07........................2.67 ........................ 6.47
Algeria

2.1: Country Profiles
NOTESIn the sections for Pillar 1, Pillar 2, Pillar 3 and Pillar 4, values under Country Value, Sample Minimum and Sample Maximum refer to underlying data for each variable.For further details and explanations, please refer to the section “How to Read the Country Profiles”.1 Survey data responses on a 1- to 7-scale (1 = worst score, 7 = best score)2 Data on a 0- to 1-scale (0 = worst score, 1 = best score)3 Data from -1.960 (worst score) to 2.367 (best score)4 Rank number on a list of 185 countries5 Index on a scale of 0 (perfect inequality) to 100 (perfect equality)6 International test scores7 Perception survey data. Percentage of yes responses.8 Score (1 = best, 7 = worst)9 Reported in relation to UK score (100)
The Human Capital Report | 57
AlgeriaPillar 4: Enabling Environment Rank/122 Z-Score Country Value Sample Minimum Sample Maximum
Infrastructure
Mobile users (per 100 people) ..............................................................79.......................–0.238........................ 99...........................17 ......................... 191
Internet users (per 100 people) .............................................................99.......................–1.066........................ 14.............................1 ........................... 95
Quality of domestic transport1 ..............................................................88.......................–0.597 ..................... 3.95 ........................2.08 ........................ 6.51
Collaboration
State of cluster development1 ............................................................104.......................–0.987..................... 3.19........................2.33 ........................ 5.49
Business and university R&D collaboration1 ........................................122.......................–1.869 ..................... 2.11 ........................2.11 ........................ 5.84
Legal framework
Doing Business Index4 .......................................................................110.......................–1.397...................... 152.............................1 ......................... 180
Social safety net protection1 .................................................................85.......................–0.690..................... 3.03........................2.10 ........................ 6.26
Intellectual property protection and property rights1............................115.......................–1.360 ..................... 2.70 ........................1.62 ........................ 6.31
Social mobility
Social mobility1 ...................................................................................115.......................–1.391..................... 3.13........................2.78 ........................ 6.36
Additional indicatorsDemographics Value
Child dependency ratio (%)..................................................................... 39.8Aged dependency ratio (%) ...................................................................... 6.9Fertility rate (births per woman) ................................................................. 2.7Sex ratio at birth (female/male) ............................................................... 0.95Population below age 20 (%) .................................................................. 37.1Population above age 60 (%) .................................................................... 6.8
Education
Public spending on education (% of GDP) ................................................ 4.3Technical/vocational enrolment as % of total
enrolment in secondary school ............................................................. 8Adult literacy (%) ..................................................................................... 72.6Boys not in primary school (%) .................................................................... 2Girls not in primary school (%) ..................................................................... 3Education poverty (% of children age 17-22
with less than 2-4 years schooling) ......................................................—Private enrolment in primary school (% of primary) ................................... 0.5Private enrolment in secondary school (% of secondary) .......................... 0.3PIRLS6 .......................................................................................................—PISA math scores6 .....................................................................................—PISA reading scores6 ..................................................................................—PISA science scores6 .................................................................................—TIMSS 4th grade math6 ..............................................................................—TIMSS 4th grade science6 ..........................................................................—TIMSS 8th grade math6 ..............................................................................—TIMSS 8th grade science6 ..........................................................................—
Health
Prevalence of visual impairment (%) .......................................................... 5.3Public spending on health (% of GDP) ...................................................... 3.9Business impact of heart disease1 .......................................................... 3.23Business impact of cancer1 .................................................................... 2.98Business impact of mental illness1 .......................................................... 3.33Business impact of diabetes1 ................................................................. 3.35Business impact of chronic respiratory disease1 ..................................... 3.39Business impact of HIV/AIDS1 ................................................................ 4.33Business impact of tuberculosis1 ............................................................ 4.33Business impact of malaria1 ................................................................... 5.08
Society Value
Freedom in the World8................................................................................. 6Democracy Index (rank/165) .................................................................... 118Population living in urban area (%) .......................................................... 73.7Gini Index (income)5................................................................................ 35.3Accessibility of digital content1 ............................................................... 2.98Extent of virtual social networks use1 ..................................................... 5.11
Workforce
Economic activity (agriculture) — % of total activity ................................ 11.7Economic activity (industry) — % of total activity .................................... 33.1Economic activity (services) — % of total activity .................................... 55.2GDP per person employed (US$) ......................................................... 8,374Cooperation in labour-employer relations1 .............................................. 3.35Emigration rate of the tertiary educated (%) .............................................. 9.5Labour force with tertiary education (%) ................................................. 10.0Number of patent applications (per 1,000 people) .............................. 0.0242Hiring and firing practices1 ...................................................................... 2.65Retirement age, male .................................................................................—Retirement age, female ...............................................................................—Number of informal sector workers (1,000s) ...............................................—Total employed (1,000s) ....................................................................... 9,736Total unemployed (1,000s) .................................................................... 1,076Unemployment for 12 months or more
as a % of total unemployment .............................................................—Total youth not in education or employment (1,000s) ........................ 1,878.0Unemployment for 12 months or more (1,000s) .........................................—Global Innovation Index (rank/142) .......................................................... 138Global Talent Index (rank/60) ..................................................................... 56Quality of Labour Force (rank/60) .............................................................. 59Talent Environment (rank/60) ..................................................................... 57 IQ measure9 ........................................................................................... 82.8
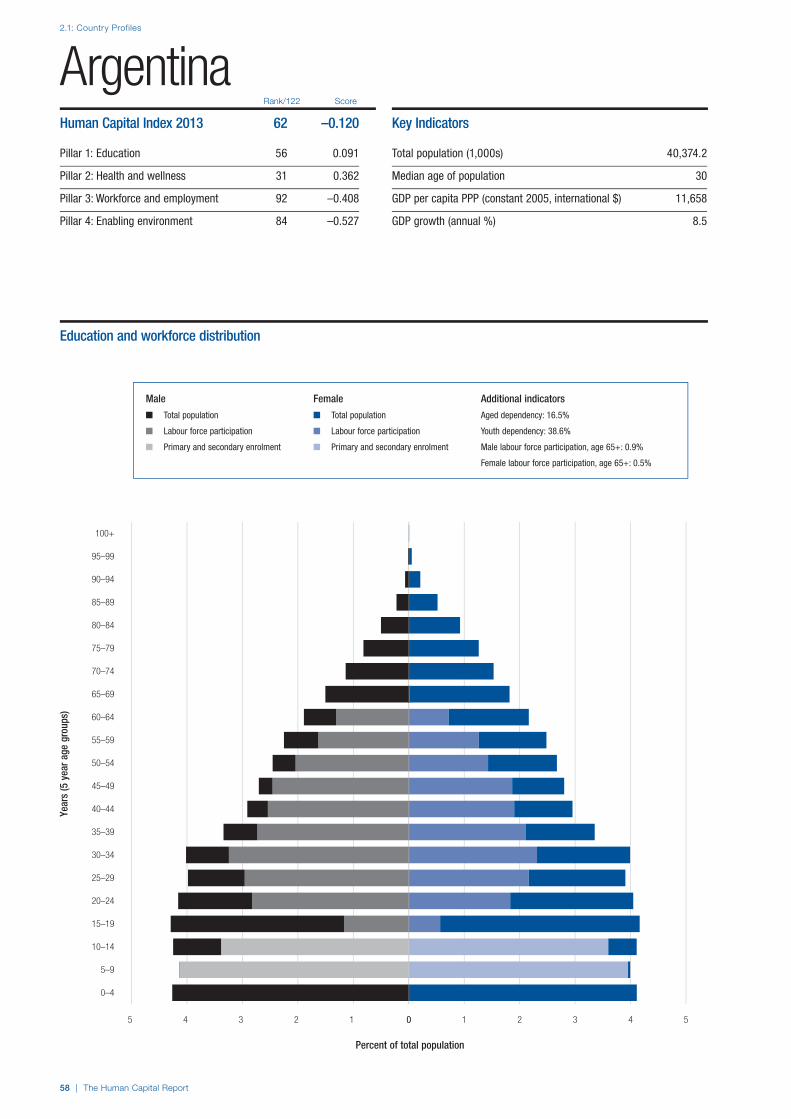
2.1: Country Profiles
58 | The Human Capital Report
Rank/122 Score
Year
s (5
yea
r age
gro
ups)
Percent of total population
0–4
5–9
10–14
15–19
20–24
25–29
30–34
35–39
40–44
45–49
50–54
55–59
60–64
65–69
70–74
75–79
80–84
85–89
90–94
95–99
100+
0 1 2 3 4 55 4 3 2 1 0
ArgentinaHuman Capital Index 2013 62 –0.120
Pillar 1: Education 56 0.091
Pillar 2: Health and wellness 31 0.362
Pillar 3: Workforce and employment 92 –0.408
Pillar 4: Enabling environment 84 –0.527
Key Indicators
Total population (1,000s) 40,374.2
Median age of population 30
GDP per capita PPP (constant 2005, international $) 11,658
GDP growth (annual %) 8.5
Male Female Additional indicators
n Total population n Total population Aged dependency: 16.5%
n Labour force participation n Labour force participation Youth dependency: 38.6%
n Primary and secondary enrolment n Primary and secondary enrolment Male labour force participation, age 65+: 0.9%
Female labour force participation, age 65+: 0.5%
Education and workforce distribution

The Human Capital Report | 59
2.1: Country Profiles
HCI s
core
–2.5
–2.0
–1.5
–1.0
–0.5
0.0
0.5
1.0
1.5
2.0
2.5
Overall Index
Enablingenvironment
Workforce andemployment
Health andwellness
Education
ArgentinaEmployment types, educational requirements and educational attainment
Percent of population Educational in employment type attainment (%)
Tertiary requirements 6.0 13.7
Professionals 1.4
Technicians and associate professionals 4.7
Secondary requirements 19.6 42.6
Clerks 4.1
Service workers and shop and market sales workers 7.1
Skilled agricultural and fishery workers 0.1
Craft and related trade workers 5.3
Plant and machine operators and assemblers 3.0
Primary requirements 7.2 33.5
Elementary occupations 7.2
Various 3.7
Legislators, senior officials and managers 0.1
Unclassified 3.4
Armed forces 0.3
Spread of scores (by pillar and overall)
Argentina
Upper-middle income economies
Latin America and the Carribean
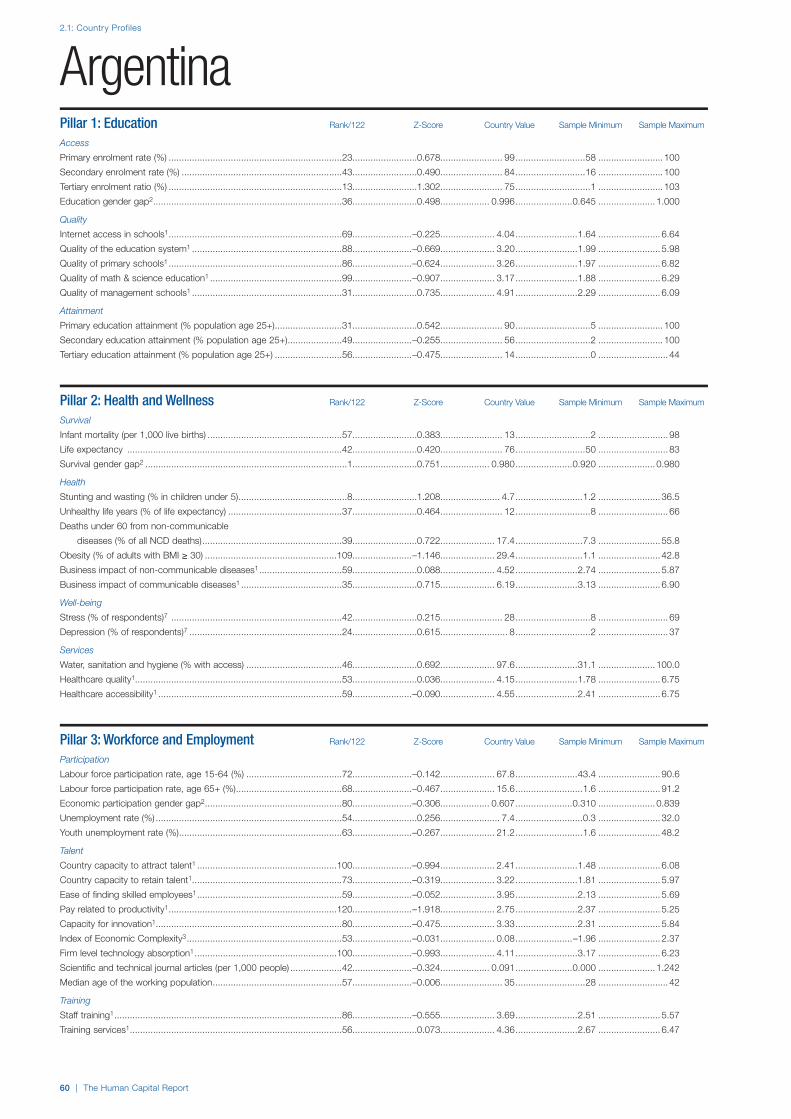
2.1: Country Profiles
60 | The Human Capital Report
Pillar 1: Education Rank/122 Z-Score Country Value Sample Minimum Sample Maximum
Access
Primary enrolment rate (%) ...................................................................23.........................0.678........................ 99...........................58 ......................... 100
Secondary enrolment rate (%) ..............................................................43.........................0.490........................ 84...........................16 ......................... 100
Tertiary enrolment ratio (%) ...................................................................13.........................1.302........................ 75.............................1 ......................... 103
Education gender gap2 .........................................................................36.........................0.498................... 0.996......................0.645 ...................... 1.000
Quality
Internet access in schools1 ...................................................................69.......................–0.225..................... 4.04........................1.64 ........................ 6.64
Quality of the education system1 ..........................................................88.......................–0.669..................... 3.20........................1.99 ........................ 5.98
Quality of primary schools1 ...................................................................86.......................–0.624..................... 3.26........................1.97 ........................ 6.82
Quality of math & science education1 ...................................................99.......................–0.907..................... 3.17........................1.88 ........................ 6.29
Quality of management schools1 ..........................................................31.........................0.735..................... 4.91........................2.29 ........................ 6.09
Attainment
Primary education attainment (% population age 25+) ..........................31.........................0.542........................ 90.............................5 ......................... 100
Secondary education attainment (% population age 25+) .....................49.......................–0.255........................ 56.............................2 ......................... 100
Tertiary education attainment (% population age 25+) ..........................56.......................–0.475........................ 14.............................0 ........................... 44
Pillar 2: Health and Wellness Rank/122 Z-Score Country Value Sample Minimum Sample Maximum
Survival
Infant mortality (per 1,000 live births) ....................................................57.........................0.383........................ 13.............................2 ........................... 98
Life expectancy ...................................................................................42.........................0.420........................ 76...........................50 ........................... 83
Survival gender gap2 ..............................................................................1.........................0.751................... 0.980......................0.920 ...................... 0.980
Health
Stunting and wasting (% in children under 5) ..........................................8.........................1.208....................... 4.7..........................1.2 ........................ 36.5
Unhealthy life years (% of life expectancy) ............................................37.........................0.464........................ 12.............................8 ........................... 66
Deaths under 60 from non-communicable
diseases (% of all NCD deaths) ......................................................39.........................0.722 ..................... 17.4 ..........................7.3 ........................ 55.8
Obesity (% of adults with BMI ≥ 30) ...................................................109.......................–1.146..................... 29.4..........................1.1 ........................ 42.8
Business impact of non-communicable diseases1 ................................59.........................0.088..................... 4.52........................2.74 ........................ 5.87
Business impact of communicable diseases1 .......................................35.........................0.715..................... 6.19........................3.13 ........................ 6.90
Well-being
Stress (% of respondents)7 ..................................................................42.........................0.215........................ 28.............................8 ........................... 69
Depression (% of respondents)7 ...........................................................24.........................0.615.......................... 8.............................2 ........................... 37
Services
Water, sanitation and hygiene (% with access) .....................................46.........................0.692..................... 97.6........................31.1 ...................... 100.0
Healthcare quality1................................................................................53.........................0.036..................... 4.15........................1.78 ........................ 6.75
Healthcare accessibility1 .......................................................................59.......................–0.090..................... 4.55........................2.41 ........................ 6.75
Pillar 3: Workforce and Employment Rank/122 Z-Score Country Value Sample Minimum Sample Maximum
Participation
Labour force participation rate, age 15-64 (%) .....................................72.......................–0.142..................... 67.8........................43.4 ........................ 90.6
Labour force participation rate, age 65+ (%) .........................................68.......................–0.467..................... 15.6..........................1.6 ........................ 91.2
Economic participation gender gap2 .....................................................80.......................–0.306................... 0.607......................0.310 ...................... 0.839
Unemployment rate (%) ........................................................................54.........................0.256....................... 7.4..........................0.3 ........................ 32.0
Youth unemployment rate (%) ...............................................................63.......................–0.267..................... 21.2..........................1.6 ........................ 48.2
Talent
Country capacity to attract talent1 ......................................................100.......................–0.994..................... 2.41........................1.48 ........................ 6.08
Country capacity to retain talent1..........................................................73.......................–0.319..................... 3.22........................1.81 ........................ 5.97
Ease of finding skilled employees1 ........................................................59.......................–0.052..................... 3.95........................2.13 ........................ 5.69
Pay related to productivity1 .................................................................120.......................–1.918..................... 2.75........................2.37 ........................ 5.25
Capacity for innovation1........................................................................80.......................–0.475..................... 3.33........................2.31 ........................ 5.84
Index of Economic Complexity3 ............................................................53.......................–0.031..................... 0.08......................–1.96 ........................ 2.37
Firm level technology absorption1 .......................................................100.......................–0.993..................... 4.11........................3.17 ........................ 6.23
Scientific and technical journal articles (per 1,000 people) ....................42.......................–0.324................... 0.091......................0.000 ...................... 1.242
Median age of the working population ..................................................57.......................–0.006........................ 35...........................28 ........................... 42
Training
Staff training1 ........................................................................................86.......................–0.555..................... 3.69........................2.51 ........................ 5.57
Training services1 ..................................................................................56.........................0.073..................... 4.36........................2.67 ........................ 6.47
Argentina

2.1: Country Profiles
NOTESIn the sections for Pillar 1, Pillar 2, Pillar 3 and Pillar 4, values under Country Value, Sample Minimum and Sample Maximum refer to underlying data for each variable.For further details and explanations, please refer to the section “How to Read the Country Profiles”.1 Survey data responses on a 1- to 7-scale (1 = worst score, 7 = best score)2 Data on a 0- to 1-scale (0 = worst score, 1 = best score)3 Data from -1.960 (worst score) to 2.367 (best score)4 Rank number on a list of 185 countries5 Index on a scale of 0 (perfect inequality) to 100 (perfect equality)6 International test scores7 Perception survey data. Percentage of yes responses.8 Score (1 = best, 7 = worst)9 Reported in relation to UK score (100)
The Human Capital Report | 61
ArgentinaPillar 4: Enabling Environment Rank/122 Z-Score Country Value Sample Minimum Sample Maximum
Infrastructure
Mobile users (per 100 people) ..............................................................22.........................0.819...................... 135...........................17 ......................... 191
Internet users (per 100 people) .............................................................54.........................0.138........................ 48.............................1 ........................... 95
Quality of domestic transport1 ..............................................................94.......................–0.707 ..................... 3.85 ........................2.08 ........................ 6.51
Collaboration
State of cluster development1 ............................................................102.......................–0.945..................... 3.22........................2.33 ........................ 5.49
Business and university R&D collaboration1 ..........................................55.......................–0.091..................... 3.70........................2.11 ........................ 5.84
Legal framework
Doing Business Index4 .........................................................................91.......................–0.854...................... 124.............................1 ......................... 180
Social safety net protection1 .................................................................82.......................–0.595..................... 3.14........................2.10 ........................ 6.26
Intellectual property protection and property rights1............................121.......................–1.651 ..................... 2.40 ........................1.62 ........................ 6.31
Social mobility
Social mobility1 .....................................................................................99.......................–0.852..................... 3.62........................2.78 ........................ 6.36
Additional indicatorsDemographics Value
Child dependency ratio (%)..................................................................... 38.6Aged dependency ratio (%) .................................................................... 16.5Fertility rate (births per woman) ................................................................. 2.3Sex ratio at birth (female/male) ............................................................... 0.95Population below age 20 (%) .................................................................. 33.3Population above age 60 (%) .................................................................. 14.7
Education
Public spending on education (% of GDP) ................................................ 5.8Technical/vocational enrolment as % of total
enrolment in secondary school ............................................................. 8Adult literacy (%) ..................................................................................... 97.9Boys not in primary school (%) ...................................................................—Girls not in primary school (%) ..................................................................... 1Education poverty (% of children age 17-22
with less than 2-4 years schooling) ......................................................—Private enrolment in primary school (% of primary) ................................. 24.8Private enrolment in secondary school (% of secondary) ........................ 27.8PIRLS6 .......................................................................................................—PISA math scores6 .................................................................................. 388PISA reading scores6 ............................................................................... 398PISA science scores6 .............................................................................. 401TIMSS 4th grade math6 ..............................................................................—TIMSS 4th grade science6 ..........................................................................—TIMSS 8th grade math6 ..............................................................................—TIMSS 8th grade science6 ..........................................................................—
Health
Prevalence of visual impairment (%) .......................................................... 2.2Public spending on health (% of GDP) ...................................................... 8.1Business impact of heart disease1 .......................................................... 4.02Business impact of cancer1 .................................................................... 4.18Business impact of mental illness1 .......................................................... 5.00Business impact of diabetes1 ................................................................. 4.62Business impact of chronic respiratory disease1 ..................................... 4.78Business impact of HIV/AIDS1 ................................................................ 5.60Business impact of tuberculosis1 ............................................................ 6.30Business impact of malaria1 ................................................................... 6.66
Society Value
Freedom in the World8................................................................................. 2Democracy Index (rank/165) ...................................................................... 52Population living in urban area (%) .......................................................... 92.6Gini Index (income)5................................................................................ 44.5Accessibility of digital content1 ............................................................... 4.74Extent of virtual social networks use1 ..................................................... 5.97
Workforce
Economic activity (agriculture) — % of total activity .................................. 1.2Economic activity (industry) — % of total activity .................................... 23.8Economic activity (services) — % of total activity .................................... 74.4GDP per person employed (US$) ....................................................... 28,412Cooperation in labour-employer relations1 .............................................. 3.31Emigration rate of the tertiary educated (%) .............................................. 2.8Labour force with tertiary education (%) ................................................. 34.6Number of patent applications (per 1,000 people) .............................. 0.1168Hiring and firing practices1 ...................................................................... 2.72Retirement age, male .................................................................................—Retirement age, female ...............................................................................—Number of informal sector workers (1,000s) ......................................... 5,138Total employed (1,000s) ..................................................................... 15,162Total unemployed (1,000s) .................................................................... 1,210Unemployment for 12 months or more
as a % of total unemployment ......................................................... 28.0Total youth not in education or employment (1,000s) ........................ 1,302.6Unemployment for 12 months or more (1,000s) ................................... 338.7Global Innovation Index (rank/142) ............................................................ 56Global Talent Index (rank/60) ..................................................................... 28Quality of Labour Force (rank/60) .............................................................. 26Talent Environment (rank/60) ..................................................................... 52IQ measure9 ........................................................................................... 92.3
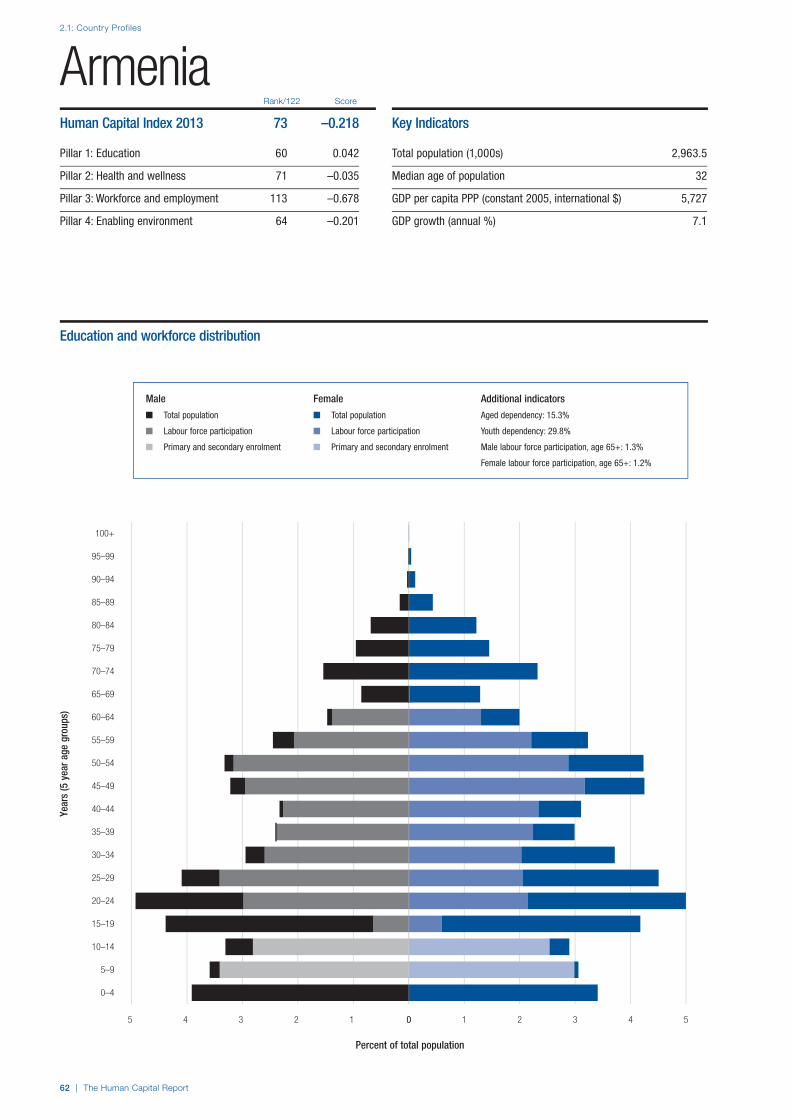
2.1: Country Profiles
62 | The Human Capital Report
Rank/122 Score
Year
s (5
yea
r age
gro
ups)
Percent of total population
0–4
5–9
10–14
15–19
20–24
25–29
30–34
35–39
40–44
45–49
50–54
55–59
60–64
65–69
70–74
75–79
80–84
85–89
90–94
95–99
100+
0 1 2 3 4 55 4 3 2 1 0
ArmeniaHuman Capital Index 2013 73 –0.218
Pillar 1: Education 60 0.042
Pillar 2: Health and wellness 71 –0.035
Pillar 3: Workforce and employment 113 –0.678
Pillar 4: Enabling environment 64 –0.201
Key Indicators
Total population (1,000s) 2,963.5
Median age of population 32
GDP per capita PPP (constant 2005, international $) 5,727
GDP growth (annual %) 7.1
Male Female Additional indicators
n Total population n Total population Aged dependency: 15.3%
n Labour force participation n Labour force participation Youth dependency: 29.8%
n Primary and secondary enrolment n Primary and secondary enrolment Male labour force participation, age 65+: 1.3%
Female labour force participation, age 65+: 1.2%
Education and workforce distribution

The Human Capital Report | 63
2.1: Country Profiles
HCI s
core
–2.5
–2.0
–1.5
–1.0
–0.5
0.0
0.5
1.0
1.5
2.0
2.5
Overall Index
Enablingenvironment
Workforce andemployment
Health andwellness
Education
ArmeniaEmployment types, educational requirements and educational attainment
Percent of population Educational in employment type attainment (%)
Tertiary requirements n/a 20.4
Professionals n/a
Technicians and associate professionals n/a
Secondary requirements n/a 49.0
Clerks n/a
Service workers and shop and market sales workers n/a
Skilled agricultural and fishery workers n/a
Craft and related trade workers n/a
Plant and machine operators and assemblers n/a
Primary requirements n/a 6.8
Elementary occupations n/a
Various n/a
Legislators, senior officials and managers n/a
Unclassified n/a
Armed forces n/a
Spread of scores (by pillar and overall)
Armenia
Lower-middle income economies
Europe and Central Asia

2.1: Country Profiles
64 | The Human Capital Report
Pillar 1: Education Rank/122 Z-Score Country Value Sample Minimum Sample Maximum
Access
Primary enrolment rate (%) ...................................................................60.........................0.331........................ 96...........................58 ......................... 100
Secondary enrolment rate (%) ..............................................................35.........................0.610........................ 86...........................16 ......................... 100
Tertiary enrolment ratio (%) ...................................................................44.........................0.319........................ 49.............................1 ......................... 103
Education gender gap2 .........................................................................22.........................0.541................... 0.999......................0.645 ...................... 1.000
Quality
Internet access in schools1 ...................................................................68.......................–0.217..................... 4.05........................1.64 ........................ 6.64
Quality of the education system1 ..........................................................57.......................–0.155..................... 3.66........................1.99 ........................ 5.98
Quality of primary schools1 ...................................................................64.......................–0.155..................... 3.77........................1.97 ........................ 6.82
Quality of math & science education1 ...................................................59.........................0.138..................... 4.17........................1.88 ........................ 6.29
Quality of management schools1 ........................................................103.......................–1.036..................... 3.43........................2.29 ........................ 6.09
Attainment
Primary education attainment (% population age 25+) ..........................—..............................— .........................— .............................5 ......................... 100
Secondary education attainment (% population age 25+) .....................—..............................— .........................— .............................2 ......................... 100
Tertiary education attainment (% population age 25+) ..........................—..............................— .........................— .............................0 ........................... 44
Pillar 2: Health and Wellness Rank/122 Z-Score Country Value Sample Minimum Sample Maximum
Survival
Infant mortality (per 1,000 live births) ....................................................69.........................0.248........................ 16.............................2 ........................... 98
Life expectancy ...................................................................................82.......................–0.187........................ 71...........................50 ........................... 83
Survival gender gap2 ..........................................................................113.......................–2.364................... 0.944......................0.920 ...................... 0.980
Health
Stunting and wasting (% in children under 5) ........................................37.........................0.320..................... 12.5..........................1.2 ........................ 36.5
Unhealthy life years (% of life expectancy) ............................................69.........................0.091........................ 14.............................8 ........................... 66
Deaths under 60 from non-communicable
diseases (% of all NCD deaths) ......................................................36.........................0.848 ..................... 15.8 ..........................7.3 ........................ 55.8
Obesity (% of adults with BMI ≥ 30) .....................................................80.......................–0.513..................... 23.4..........................1.1 ........................ 42.8
Business impact of non-communicable diseases1 ................................44.........................0.385..................... 4.65........................2.74 ........................ 5.87
Business impact of communicable diseases1 .......................................67.........................0.165..................... 5.64........................3.13 ........................ 6.90
Well-being
Stress (% of respondents)7 ..................................................................17.........................0.912........................ 19.............................8 ........................... 69
Depression (% of respondents)7 ...........................................................65.......................–0.022........................ 12.............................2 ........................... 37
Services
Water, sanitation and hygiene (% with access) .....................................57.........................0.537..................... 94.6........................31.1 ...................... 100.0
Healthcare quality1................................................................................64.......................–0.326..................... 3.71........................1.78 ........................ 6.75
Healthcare accessibility1 .......................................................................78.......................–0.586..................... 3.95........................2.41 ........................ 6.75
Pillar 3: Workforce and Employment Rank/122 Z-Score Country Value Sample Minimum Sample Maximum
Participation
Labour force participation rate, age 15-64 (%) .....................................96.......................–0.561..................... 63.7........................43.4 ........................ 90.6
Labour force participation rate, age 65+ (%) .........................................47.......................–0.018..................... 24.3..........................1.6 ........................ 91.2
Economic participation gender gap2 .....................................................69.........................0.009................... 0.645......................0.310 ...................... 0.839
Unemployment rate (%) ......................................................................103.......................–1.959..................... 19.0..........................0.3 ........................ 32.0
Youth unemployment rate (%) .............................................................103.......................–2.765..................... 45.5..........................1.6 ........................ 48.2
Talent
Country capacity to attract talent1 ........................................................93.......................–0.857..................... 2.56........................1.48 ........................ 6.08
Country capacity to retain talent1........................................................103.......................–0.937..................... 2.62........................1.81 ........................ 5.97
Ease of finding skilled employees1 ........................................................88.......................–0.607..................... 3.56........................2.13 ........................ 5.69
Pay related to productivity1 ...................................................................31.........................0.672..................... 4.33........................2.37 ........................ 5.25
Capacity for innovation1........................................................................66.......................–0.327..................... 3.44........................2.31 ........................ 5.84
Index of Economic Complexity3 ............................................................—..............................— .........................— ......................–1.96 ........................ 2.37
Firm level technology absorption1 .........................................................84.......................–0.638..................... 4.36........................3.17 ........................ 6.23
Scientific and technical journal articles (per 1,000 people) ....................53.......................–0.451................... 0.053......................0.000 ...................... 1.242
Median age of the working population ..................................................54.........................0.074........................ 35...........................28 ........................... 42
Training
Staff training1 ........................................................................................98.......................–0.751..................... 3.56........................2.51 ........................ 5.57
Training services1 ................................................................................106.......................–1.055..................... 3.47........................2.67 ........................ 6.47
Armenia

2.1: Country Profiles
NOTESIn the sections for Pillar 1, Pillar 2, Pillar 3 and Pillar 4, values under Country Value, Sample Minimum and Sample Maximum refer to underlying data for each variable.For further details and explanations, please refer to the section “How to Read the Country Profiles”.1 Survey data responses on a 1- to 7-scale (1 = worst score, 7 = best score)2 Data on a 0- to 1-scale (0 = worst score, 1 = best score)3 Data from -1.960 (worst score) to 2.367 (best score)4 Rank number on a list of 185 countries5 Index on a scale of 0 (perfect inequality) to 100 (perfect equality)6 International test scores7 Perception survey data. Percentage of yes responses.8 Score (1 = best, 7 = worst)9 Reported in relation to UK score (100)
The Human Capital Report | 65
ArmeniaPillar 4: Enabling Environment Rank/122 Z-Score Country Value Sample Minimum Sample Maximum
Infrastructure
Mobile users (per 100 people) ..............................................................71.......................–0.103...................... 104...........................17 ......................... 191
Internet users (per 100 people) .............................................................76.......................–0.423........................ 32.............................1 ........................... 95
Quality of domestic transport1 ..............................................................59.........................0.061 ..................... 4.52 ........................2.08 ........................ 6.51
Collaboration
State of cluster development1 ..............................................................73.......................–0.373..................... 3.63........................2.33 ........................ 5.49
Business and university R&D collaboration1 ..........................................93.......................–0.699 ..................... 3.16 ........................2.11 ........................ 5.84
Legal framework
Doing Business Index4 .........................................................................30.........................0.930........................ 32.............................1 ......................... 180
Social safety net protection1 .................................................................89.......................–0.729..................... 2.99........................2.10 ........................ 6.26
Intellectual property protection and property rights1..............................52.......................–0.011 ..................... 4.08 ........................1.62 ........................ 6.31
Social mobility
Social mobility1 .....................................................................................76.......................–0.463..................... 3.97........................2.78 ........................ 6.36
Additional indicatorsDemographics Value
Child dependency ratio (%)..................................................................... 29.8Aged dependency ratio (%) .................................................................... 15.3Fertility rate (births per woman) ................................................................. 1.7Sex ratio at birth (female/male) ............................................................... 0.90Population below age 20 (%) .................................................................. 29.1Population above age 60 (%) .................................................................. 13.7
Education
Public spending on education (% of GDP) ................................................ 3.1Technical/vocational enrolment as % of total
enrolment in secondary school ............................................................. 2Adult literacy (%) ..................................................................................... 99.6Boys not in primary school (%) .................................................................... 5Girls not in primary school (%) ..................................................................... 2Education poverty (% of children age 17-22
with less than 2-4 years schooling) ................................................ 0.016Private enrolment in primary school (% of primary) ................................... 1.5Private enrolment in secondary school (% of secondary) .......................... 1.4PIRLS6 .......................................................................................................—PISA math scores6 .....................................................................................—PISA reading scores6 ..................................................................................—PISA science scores6 .................................................................................—TIMSS 4th grade math6 ........................................................................... 452TIMSS 4th grade science6 ....................................................................... 416TIMSS 8th grade math6 ........................................................................... 467TIMSS 8th grade science6 ....................................................................... 437
Health
Prevalence of visual impairment (%) .......................................................... 2.4Public spending on health (% of GDP) ...................................................... 4.3Business impact of heart disease1 .......................................................... 4.07Business impact of cancer1 .................................................................... 4.19Business impact of mental illness1 .......................................................... 5.14Business impact of diabetes1 ................................................................. 4.88Business impact of chronic respiratory disease1 ..................................... 4.98Business impact of HIV/AIDS1 ................................................................ 5.84Business impact of tuberculosis1 ............................................................ 5.39Business impact of malaria1 ................................................................... 5.69
Society Value
Freedom in the World8................................................................................. 5Democracy Index (rank/165) .................................................................... 114Population living in urban area (%) .......................................................... 64.2Gini Index (income)5................................................................................ 31.3Accessibility of digital content1 ............................................................... 5.27Extent of virtual social networks use1 ..................................................... 5.77
Workforce
Economic activity (agriculture) — % of total activity ................................ 44.2Economic activity (industry) — % of total activity .................................... 16.8Economic activity (services) — % of total activity .................................... 39.0GDP per person employed (US$) ....................................................... 28,502Cooperation in labour-employer relations1 .............................................. 4.79Emigration rate of the tertiary educated (%) .............................................. 8.9Labour force with tertiary education (%) ................................................. 22.9Number of patent applications (per 1,000 people) .............................. 0.0472Hiring and firing practices1 ...................................................................... 4.80Retirement age, male .................................................................................—Retirement age, female ...............................................................................—Number of informal sector workers (1,000s) ............................................ 138Total employed (1,000s) ....................................................................... 1,185Total unemployed (1,000s) ....................................................................... 278Unemployment for 12 months or more
as a % of total unemployment ......................................................... 51.4Total youth not in education or employment (1,000s) ........................... 456.1Unemployment for 12 months or more (1,000s) ................................... 143.1Global Innovation Index (rank/142) ............................................................ 59Global Talent Index (rank/60) ......................................................................—Quality of Labour Force (rank/60) ...............................................................—Talent Environment (rank/60) ......................................................................—IQ measure9 ........................................................................................... 93.5

2.1: Country Profiles
66 | The Human Capital Report
Rank/122 Score
Year
s (5
yea
r age
gro
ups)
Percent of total population
0–4
5–9
10–14
15–19
20–24
25–29
30–34
35–39
40–44
45–49
50–54
55–59
60–64
65–69
70–74
75–79
80–84
85–89
90–94
95–99
100+
0 1 2 3 4 55 4 3 2 1 0
AustraliaHuman Capital Index 2013 19 0.831
Pillar 1: Education 13 0.988
Pillar 2: Health and wellness 18 0.663
Pillar 3: Workforce and employment 19 0.675
Pillar 4: Enabling environment 23 0.999
Key Indicators
Total population (1,000s) 22,404.5
Median age of population 37
GDP per capita PPP (constant 2005, international $) 35,669
GDP growth (annual %) 3.4
Male Female Additional indicators
n Total population n Total population Aged dependency: 19.9%
n Labour force participation n Labour force participation Youth dependency: 28.0%
n Primary and secondary enrolment n Primary and secondary enrolment Male labour force participation, age 65+: 1.0%
Female labour force participation, age 65+: 0.5%
Education and workforce distribution

The Human Capital Report | 67
2.1: Country Profiles
HCI s
core
–2.5
–2.0
–1.5
–1.0
–0.5
0.0
0.5
1.0
1.5
2.0
2.5
Overall Index
Enablingenvironment
Workforce andemployment
Health andwellness
Education
AustraliaEmployment types, educational requirements and educational attainment
Percent of population Educational in employment type attainment (%)
Tertiary requirements 19.1 38.4
Professionals 10.9
Technicians and associate professionals 8.2
Secondary requirements 30.1 50.9
Clerks 8.0
Service workers and shop and market sales workers 9.2
Skilled agricultural and fishery workers 1.7
Craft and related trade workers 7.3
Plant and machine operators and assemblers 3.9
Primary requirements 4.8 6.4
Elementary occupations 4.8
Various 6.6
Legislators, senior officials and managers 6.6
Unclassified n/a
Armed forces n/a
Spread of scores (by pillar and overall)
Australia
High-income economies
Asia and the Pacific

2.1: Country Profiles
68 | The Human Capital Report
Pillar 1: Education Rank/122 Z-Score Country Value Sample Minimum Sample Maximum
Access
Primary enrolment rate (%) ...................................................................53.........................0.452........................ 97...........................58 ......................... 100
Secondary enrolment rate (%) ..............................................................39.........................0.574........................ 85...........................16 ......................... 100
Tertiary enrolment ratio (%) .....................................................................9.........................1.496........................ 80.............................1 ......................... 103
Education gender gap2 ...........................................................................1.........................0.548................... 1.000......................0.645 ...................... 1.000
Quality
Internet access in schools1 ...................................................................15.........................1.301..................... 5.95........................1.64 ........................ 6.64
Quality of the education system1 ..........................................................22.........................1.098..................... 4.78........................1.99 ........................ 5.98
Quality of primary schools1 ...................................................................19.........................1.005..................... 5.03........................1.97 ........................ 6.82
Quality of math & science education1 ...................................................32.........................0.588..................... 4.60........................1.88 ........................ 6.29
Quality of management schools1 ..........................................................28.........................0.902..................... 5.05........................2.29 ........................ 6.09
Attainment
Primary education attainment (% population age 25+) ............................1.........................0.964...................... 100.............................5 ......................... 100
Secondary education attainment (% population age 25+) .....................15.........................1.151........................ 94.............................2 ......................... 100
Tertiary education attainment (% population age 25+) ............................4.........................1.776........................ 38.............................0 ........................... 44
Pillar 2: Health and Wellness Rank/122 Z-Score Country Value Sample Minimum Sample Maximum
Survival
Infant mortality (per 1,000 live births) ....................................................19.........................0.787.......................... 4.............................2 ........................... 98
Life expectancy .....................................................................................3.........................1.150........................ 82...........................50 ........................... 83
Survival gender gap2 ............................................................................63.........................0.220................... 0.974......................0.920 ...................... 0.980
Health
Stunting and wasting (% in children under 5) ........................................—..............................— .........................— ..........................1.2 ........................ 36.5
Unhealthy life years (% of life expectancy) ..............................................5.........................0.811 ........................ 10 .............................8 ........................... 66
Deaths under 60 from non-communicable
diseases (% of all NCD deaths) ......................................................14.........................1.202 ..................... 11.3 ..........................7.3 ........................ 55.8
Obesity (% of adults with BMI ≥ 30) .....................................................97.......................–0.693 ..................... 25.1 ..........................1.1 ........................ 42.8
Business impact of non-communicable diseases1 ................................42.........................0.410 ..................... 4.66 ........................2.74 ........................ 5.87
Business impact of communicable diseases1 .......................................25.........................0.916 ..................... 6.39 ........................3.13 ........................ 6.90
Well-being
Stress (% of respondents)7 ..................................................................64.......................–0.173........................ 33.............................8 ........................... 69
Depression (% of respondents)7 ...........................................................24.........................0.615.......................... 8.............................2 ........................... 37
Services
Water, sanitation and hygiene (% with access) .......................................1.........................0.815................... 100.0........................31.1 ...................... 100.0
Healthcare quality1................................................................................17.........................1.339..................... 5.74........................1.78 ........................ 6.75
Healthcare accessibility1 .......................................................................22.........................1.223..................... 6.16........................2.41 ........................ 6.75
Pillar 3: Workforce and Employment Rank/122 Z-Score Country Value Sample Minimum Sample Maximum
Participation
Labour force participation rate, age 15-64 (%) .....................................29.........................0.737..................... 76.4........................43.4 ........................ 90.6
Labour force participation rate, age 65+ (%) .........................................84.......................–0.720..................... 10.7..........................1.6 ........................ 91.2
Economic participation gender gap2 .....................................................19.........................0.982................... 0.759......................0.310 ...................... 0.839
Unemployment rate (%) ........................................................................28.........................0.676....................... 5.2..........................0.3 ........................ 32.0
Youth unemployment rate (%) ...............................................................28.........................0.731..................... 11.5..........................1.6 ........................ 48.2
Talent
Country capacity to attract talent1 ........................................................13.........................1.254..................... 4.73........................1.48 ........................ 6.08
Country capacity to retain talent1..........................................................33.........................0.600..................... 4.11........................1.81 ........................ 5.97
Ease of finding skilled employees1 ........................................................37.........................0.580..................... 4.39........................2.13 ........................ 5.69
Pay related to productivity1 ...................................................................96.......................–0.763..................... 3.46........................2.37 ........................ 5.25
Capacity for innovation1........................................................................22.........................0.947..................... 4.46........................2.31 ........................ 5.84
Index of Economic Complexity3 ............................................................73.......................–0.482................... –0.35......................–1.96 ........................ 2.37
Firm level technology absorption1 .........................................................13.........................1.406..................... 5.82........................3.17 ........................ 6.23
Scientific and technical journal articles (per 1,000 people) ......................8.........................2.256................... 0.864......................0.000 ...................... 1.242
Median age of the working population ..................................................33.........................0.904........................ 39...........................28 ........................... 42
Training
Staff training1 ........................................................................................26.........................0.724..................... 4.51........................2.51 ........................ 5.57
Training services1 ..................................................................................20.........................0.965..................... 5.07........................2.67 ........................ 6.47
Australia

2.1: Country Profiles
NOTESIn the sections for Pillar 1, Pillar 2, Pillar 3 and Pillar 4, values under Country Value, Sample Minimum and Sample Maximum refer to underlying data for each variable.For further details and explanations, please refer to the section “How to Read the Country Profiles”.1 Survey data responses on a 1- to 7-scale (1 = worst score, 7 = best score)2 Data on a 0- to 1-scale (0 = worst score, 1 = best score)3 Data from -1.960 (worst score) to 2.367 (best score)4 Rank number on a list of 185 countries5 Index on a scale of 0 (perfect inequality) to 100 (perfect equality)6 International test scores7 Perception survey data. Percentage of yes responses.8 Score (1 = best, 7 = worst)9 Reported in relation to UK score (100)
The Human Capital Report | 69
AustraliaPillar 4: Enabling Environment Rank/122 Z-Score Country Value Sample Minimum Sample Maximum
Infrastructure
Mobile users (per 100 people) ..............................................................60.........................0.037...................... 108...........................17 ......................... 191
Internet users (per 100 people) .............................................................18.........................1.255........................ 79.............................1 ........................... 95
Quality of domestic transport1 ..............................................................34.........................0.564 ..................... 4.96 ........................2.08 ........................ 6.51
Collaboration
State of cluster development1 ..............................................................34.........................0.526..................... 4.27........................2.33 ........................ 5.49
Business and university R&D collaboration1 ..........................................14.........................1.427 ..................... 5.06 ........................2.11 ........................ 5.84
Legal framework
Doing Business Index4 ...........................................................................9.........................1.357........................ 10.............................1 ......................... 180
Social safety net protection1 .................................................................20.........................1.077..................... 4.95........................2.10 ........................ 6.26
Intellectual property protection and property rights1..............................21.........................1.165 ..................... 5.28 ........................1.62 ........................ 6.31
Social mobility
Social mobility1 .....................................................................................13.........................1.583..................... 5.81........................2.78 ........................ 6.36
Additional indicatorsDemographics Value
Child dependency ratio (%)..................................................................... 28.0Aged dependency ratio (%) .................................................................... 19.9Fertility rate (births per woman) ................................................................. 1.9Sex ratio at birth (female/male) ............................................................... 0.94Population below age 20 (%) .................................................................. 25.7Population above age 60 (%) .................................................................. 18.9
Education
Public spending on education (% of GDP) ................................................ 5.1Technical/vocational enrolment as % of total
enrolment in secondary school ........................................................... 33Adult literacy (%) .........................................................................................—Boys not in primary school (%) .................................................................... 3Girls not in primary school (%) ..................................................................... 2Education poverty (% of children age 17-22
with less than 2-4 years schooling) ......................................................—Private enrolment in primary school (% of primary) ................................. 30.9Private enrolment in secondary school (% of secondary) ........................ 33.3PIRLS6 .................................................................................................... 527PISA math scores6 .................................................................................. 514PISA reading scores6 ............................................................................... 515PISA science scores6 .............................................................................. 527TIMSS 4th grade math6 ........................................................................... 516TIMSS 4th grade science6 ....................................................................... 516TIMSS 8th grade math6 ........................................................................... 505TIMSS 8th grade science6 ....................................................................... 519
Health
Prevalence of visual impairment (%) .......................................................... 1.2Public spending on health (% of GDP) ...................................................... 9.0Business impact of heart disease1 .......................................................... 4.49Business impact of cancer1 .................................................................... 4.40Business impact of mental illness1 .......................................................... 4.71Business impact of diabetes1 ................................................................. 4.59Business impact of chronic respiratory disease1 ..................................... 5.14Business impact of HIV/AIDS1 ................................................................ 6.11Business impact of tuberculosis1 ............................................................ 6.47Business impact of malaria1 ................................................................... 6.59
Society Value
Freedom in the World8................................................................................. 1Democracy Index (rank/165) ........................................................................ 6Population living in urban area (%) .......................................................... 89.3Gini Index (income)5................................................................................ 35.2Accessibility of digital content1 ............................................................... 6.10Extent of virtual social networks use1 ..................................................... 6.39
Workforce
Economic activity (agriculture) — % of total activity .................................. 3.3Economic activity (industry) — % of total activity .................................... 21.1Economic activity (services) — % of total activity .................................... 75.5GDP per person employed (US$) ....................................................... 49,898Cooperation in labour-employer relations1 .............................................. 4.03Emigration rate of the tertiary educated (%) .............................................. 2.7Labour force with tertiary education (%) ................................................. 33.8Number of patent applications (per 1,000 people) .............................. 1.1393Hiring and firing practices1 ...................................................................... 2.85Retirement age, male ................................................................................ 67Retirement age, female .............................................................................. 67Number of informal sector workers (1,000s) ...............................................—Total employed (1,000s) ..................................................................... 11,215Total unemployed (1,000s) ....................................................................... 618Unemployment for 12 months or more
as a % of total unemployment ......................................................... 18.7Total youth not in education or employment (1,000s) ........................... 143.1Unemployment for 12 months or more (1,000s) ................................... 115.8Global Innovation Index (rank/142) ............................................................ 19Global Talent Index (rank/60) ....................................................................... 6Quality of Labour Force (rank/60) ................................................................ 8Talent Environment (rank/60) ..................................................................... 18IQ measure9 ........................................................................................... 99.2

2.1: Country Profiles
70 | The Human Capital Report
Rank/122 Score
Year
s (5
yea
r age
gro
ups)
Percent of total population
0–4
5–9
10–14
15–19
20–24
25–29
30–34
35–39
40–44
45–49
50–54
55–59
60–64
65–69
70–74
75–79
80–84
85–89
90–94
95–99
100+
0 1 2 3 4 55 4 3 2 1 0
AustriaHuman Capital Index 2013 13 0.977
Pillar 1: Education 25 0.713
Pillar 2: Health and wellness 7 0.886
Pillar 3: Workforce and employment 14 0.886
Pillar 4: Enabling environment 6 1.424
Key Indicators
Total population (1,000s) 8,401.9
Median age of population 42
GDP per capita PPP (constant 2005, international $) 36,259
GDP growth (annual %) 0.8
Male Female Additional indicators
n Total population n Total population Aged dependency: 26.4%
n Labour force participation n Labour force participation Youth dependency: 21.9%
n Primary and secondary enrolment n Primary and secondary enrolment Male labour force participation, age 65+: 0.6%
Female labour force participation, age 65+: 0.3%
Education and workforce distribution

The Human Capital Report | 71
2.1: Country Profiles
HCI s
core
–2.5
–2.0
–1.5
–1.0
–0.5
0.0
0.5
1.0
1.5
2.0
2.5
Overall Index
Enablingenvironment
Workforce andemployment
Health andwellness
Education
AustriaEmployment types, educational requirements and educational attainment
Percent of population Educational in employment type attainment (%)
Tertiary requirements 17.4 17.5
Professionals 5.8
Technicians and associate professionals 11.6
Secondary requirements 30.6 n/a
Clerks 7.8
Service workers and shop and market sales workers 8.4
Skilled agricultural and fishery workers 3.0
Craft and related trade workers 7.9
Plant and machine operators and assemblers 3.5
Primary requirements 6.8 n/a
Elementary occupations 6.8
Various 4.6
Legislators, senior officials and managers 4.0
Unclassified 0.5
Armed forces 0.2
Spread of scores (by pillar and overall)
Austria
High-income economies
Europe and Central Asia

2.1: Country Profiles
72 | The Human Capital Report
Pillar 1: Education Rank/122 Z-Score Country Value Sample Minimum Sample Maximum
Access
Primary enrolment rate (%) ...................................................................—..............................— .........................— ...........................58 ......................... 100
Secondary enrolment rate (%) ..............................................................—..............................— .........................— ...........................16 ......................... 100
Tertiary enrolment ratio (%) ...................................................................20.........................1.136........................ 70.............................1 ......................... 103
Education gender gap2 .........................................................................44.........................0.477................... 0.995......................0.645 ...................... 1.000
Quality
Internet access in schools1 ...................................................................23.........................1.118..................... 5.72........................1.64 ........................ 6.64
Quality of the education system1 ..........................................................23.........................1.064..................... 4.75........................1.99 ........................ 5.98
Quality of primary schools1 ...................................................................24.........................0.913..................... 4.93........................1.97 ........................ 6.82
Quality of math & science education1 ...................................................32.........................0.588..................... 4.60........................1.88 ........................ 6.29
Quality of management schools1 ..........................................................37.........................0.531..................... 4.74........................2.29 ........................ 6.09
Attainment
Primary education attainment (% population age 25+) ..........................—..............................— .........................— .............................5 ......................... 100
Secondary education attainment (% population age 25+) .....................—..............................— .........................— .............................2 ......................... 100
Tertiary education attainment (% population age 25+) ..........................46.......................–0.123........................ 18.............................0 ........................... 44
Pillar 2: Health and Wellness Rank/122 Z-Score Country Value Sample Minimum Sample Maximum
Survival
Infant mortality (per 1,000 live births) ....................................................19.........................0.787.......................... 4.............................2 ........................... 98
Life expectancy ...................................................................................14.........................1.028........................ 81...........................50 ........................... 83
Survival gender gap2 ............................................................................42.........................0.674................... 0.979......................0.920 ...................... 0.980
Health
Stunting and wasting (% in children under 5) ........................................—..............................— .........................— ..........................1.2 ........................ 36.5
Unhealthy life years (% of life expectancy) ............................................28.........................0.586........................ 11.............................8 ........................... 66
Deaths under 60 from non-communicable
diseases (% of all NCD deaths) ........................................................7.........................1.289 ..................... 10.2 ..........................7.3 ........................ 55.8
Obesity (% of adults with BMI ≥ 30) .....................................................53.........................0.025..................... 18.3..........................1.1 ........................ 42.8
Business impact of non-communicable diseases1 ................................35.........................0.498..................... 4.70........................2.74 ........................ 5.87
Business impact of communicable diseases1 .........................................6.........................1.257..................... 6.73........................3.13 ........................ 6.90
Well-being
Stress (% of respondents)7 ..................................................................70.......................–0.250........................ 34.............................8 ........................... 69
Depression (% of respondents)7 .............................................................8.........................1.253.......................... 4.............................2 ........................... 37
Services
Water, sanitation and hygiene (% with access) .......................................1.........................0.815................... 100.0........................31.1 ...................... 100.0
Healthcare quality1..................................................................................3.........................1.931..................... 6.46........................1.78 ........................ 6.75
Healthcare accessibility1 .........................................................................6.........................1.627..................... 6.65........................2.41 ........................ 6.75
Pillar 3: Workforce and Employment Rank/122 Z-Score Country Value Sample Minimum Sample Maximum
Participation
Labour force participation rate, age 15-64 (%) .....................................32.........................0.594..................... 75.0........................43.4 ........................ 90.6
Labour force participation rate, age 65+ (%) .......................................103.......................–0.999....................... 5.3..........................1.6 ........................ 91.2
Economic participation gender gap2 .....................................................63.........................0.067................... 0.652......................0.310 ...................... 0.839
Unemployment rate (%) ........................................................................20.........................0.829....................... 4.4..........................0.3 ........................ 32.0
Youth unemployment rate (%) ...............................................................14.........................1.008....................... 8.8..........................1.6 ........................ 48.2
Talent
Country capacity to attract talent1 ........................................................24.........................0.785..................... 4.25........................1.48 ........................ 6.08
Country capacity to retain talent1..........................................................21.........................1.038..................... 4.54........................1.81 ........................ 5.97
Ease of finding skilled employees1 ........................................................72.......................–0.272..................... 3.80........................2.13 ........................ 5.69
Pay related to productivity1 ...................................................................61.........................0.034..................... 3.94........................2.37 ........................ 5.25
Capacity for innovation1........................................................................14.........................1.582..................... 4.96........................2.31 ........................ 5.84
Index of Economic Complexity3 ..............................................................5.........................1.813..................... 1.84......................–1.96 ........................ 2.37
Firm level technology absorption1 .........................................................16.........................1.322..................... 5.76........................3.17 ........................ 6.23
Scientific and technical journal articles (per 1,000 people) ....................18.........................1.299................... 0.577......................0.000 ...................... 1.242
Median age of the working population ..................................................10.........................1.403........................ 41...........................28 ........................... 42
Training
Staff training1 ........................................................................................16.........................1.405..................... 4.95........................2.51 ........................ 5.57
Training services1 ....................................................................................4.........................2.262..................... 6.09........................2.67 ........................ 6.47
Austria

2.1: Country Profiles
NOTESIn the sections for Pillar 1, Pillar 2, Pillar 3 and Pillar 4, values under Country Value, Sample Minimum and Sample Maximum refer to underlying data for each variable.For further details and explanations, please refer to the section “How to Read the Country Profiles”.1 Survey data responses on a 1- to 7-scale (1 = worst score, 7 = best score)2 Data on a 0- to 1-scale (0 = worst score, 1 = best score)3 Data from -1.960 (worst score) to 2.367 (best score)4 Rank number on a list of 185 countries5 Index on a scale of 0 (perfect inequality) to 100 (perfect equality)6 International test scores7 Perception survey data. Percentage of yes responses.8 Score (1 = best, 7 = worst)9 Reported in relation to UK score (100)
The Human Capital Report | 73
AustriaPillar 4: Enabling Environment Rank/122 Z-Score Country Value Sample Minimum Sample Maximum
Infrastructure
Mobile users (per 100 people) ..............................................................10.........................1.403...................... 155...........................17 ......................... 191
Internet users (per 100 people) .............................................................15.........................1.284........................ 80.............................1 ........................... 95
Quality of domestic transport1 ..............................................................13.........................1.402 ..................... 5.69 ........................2.08 ........................ 6.51
Collaboration
State of cluster development1 ..............................................................15.........................1.338..................... 4.85........................2.33 ........................ 5.49
Business and university R&D collaboration1 ..........................................21.........................1.130 ..................... 4.79 ........................2.11 ........................ 5.84
Legal framework
Doing Business Index4 .........................................................................27.........................0.988........................ 29.............................1 ......................... 180
Social safety net protection1 ...................................................................7.........................2.130..................... 6.09........................2.10 ........................ 6.26
Intellectual property protection and property rights1..............................14.........................1.562 ..................... 5.69 ........................1.62 ........................ 6.31
Social mobility
Social mobility1 .....................................................................................14.........................1.580..................... 5.81........................2.78 ........................ 6.36
Additional indicatorsDemographics Value
Child dependency ratio (%)..................................................................... 21.9Aged dependency ratio (%) .................................................................... 26.4Fertility rate (births per woman) ................................................................. 1.4Sex ratio at birth (female/male) ............................................................... 0.95Population below age 20 (%) .................................................................. 20.7Population above age 60 (%) .................................................................. 23.1
Education
Public spending on education (% of GDP) ................................................ 6.0Technical/vocational enrolment as % of total
enrolment in secondary school ........................................................... 39Adult literacy (%) .........................................................................................—Boys not in primary school (%) ...................................................................—Girls not in primary school (%) ....................................................................—Education poverty (% of children age 17-22
with less than 2-4 years schooling) ......................................................—Private enrolment in primary school (% of primary) ................................... 5.8Private enrolment in secondary school (% of secondary) .......................... 9.5PIRLS6 .................................................................................................... 529PISA math scores6 .................................................................................. 496PISA reading scores6 ............................................................................... 470PISA science scores6 .............................................................................. 494TIMSS 4th grade math6 ........................................................................... 508TIMSS 4th grade science6 ....................................................................... 532TIMSS 8th grade math6 ..............................................................................—TIMSS 8th grade science6 ..........................................................................—
Health
Prevalence of visual impairment (%) .......................................................... 1.0Public spending on health (% of GDP) .................................................... 10.6Business impact of heart disease1 .......................................................... 4.37Business impact of cancer1 .................................................................... 4.46Business impact of mental illness1 .......................................................... 4.27Business impact of diabetes1 ................................................................. 5.10Business impact of chronic respiratory disease1 ..................................... 5.32Business impact of HIV/AIDS1 ................................................................ 6.58Business impact of tuberculosis1 ............................................................ 6.73Business impact of malaria1 ................................................................... 6.87
Society Value
Freedom in the World8................................................................................. 1Democracy Index (rank/165) ...................................................................... 12Population living in urban area (%) .......................................................... 67.9Gini Index (income)5................................................................................ 29.2Accessibility of digital content1 ............................................................... 6.23Extent of virtual social networks use1 ..................................................... 6.23
Workforce
Economic activity (agriculture) — % of total activity .................................. 5.3Economic activity (industry) — % of total activity .................................... 26.0Economic activity (services) — % of total activity .................................... 68.7GDP per person employed (US$) ....................................................... 49,220Cooperation in labour-employer relations1 .............................................. 5.54Emigration rate of the tertiary educated (%) ............................................ 13.5Labour force with tertiary education (%) ................................................. 19.3Number of patent applications (per 1,000 people) .............................. 0.2892Hiring and firing practices1 ...................................................................... 3.32Retirement age, male ................................................................................ 65Retirement age, female .............................................................................. 60Number of informal sector workers (1,000s) ...............................................—Total employed (1,000s) ....................................................................... 4,096Total unemployed (1,000s) ....................................................................... 188Unemployment for 12 months or more
as a % of total unemployment ......................................................... 25.2Total youth not in education or employment (1,000s) ............................. 84.8Unemployment for 12 months or more (1,000s) ..................................... 47.5Global Innovation Index (rank/142) ............................................................ 23Global Talent Index (rank/60) ..................................................................... 17Quality of Labour Force (rank/60) .............................................................. 16Talent Environment (rank/60) ....................................................................... 3IQ measure9 ........................................................................................... 98.8

2.1: Country Profiles
74 | The Human Capital Report
Rank/122 Score
Year
s (5
yea
r age
gro
ups)
Percent of total population
0–4
5–9
10–14
15–19
20–24
25–29
30–34
35–39
40–44
45–49
50–54
55–59
60–64
65–69
70–74
75–79
80–84
85–89
90–94
95–99
100+
0 1 2 3 4 5 66 5 4 3 2 1 0
AzerbaijanHuman Capital Index 2013 64 –0.157
Pillar 1: Education 71 –0.153
Pillar 2: Health and wellness 94 –0.414
Pillar 3: Workforce and employment 55 –0.016
Pillar 4: Enabling environment 55 –0.044
Key Indicators
Total population (1,000s) 9,094.7
Median age of population 29
GDP per capita PPP (constant 2005, international $) 9,156
GDP growth (annual %) 4.5
Male Female Additional indicators
n Total population n Total population Aged dependency: 8.3%
n Labour force participation n Labour force participation Youth dependency: 31.8%
n Primary and secondary enrolment n Primary and secondary enrolment Male labour force participation, age 65+: 0.3%
Female labour force participation, age 65+: 0.1%
Education and workforce distribution

The Human Capital Report | 75
2.1: Country Profiles
HCI s
core
–2.5
–2.0
–1.5
–1.0
–0.5
0.0
0.5
1.0
1.5
2.0
2.5
Overall Index
Enablingenvironment
Workforce andemployment
Health andwellness
Education
AzerbaijanEmployment types, educational requirements and educational attainment
Percent of population Educational in employment type attainment (%)
Tertiary requirements n/a 25.1
Professionals n/a
Technicians and associate professionals n/a
Secondary requirements n/a 65.6
Clerks n/a
Service workers and shop and market sales workers n/a
Skilled agricultural and fishery workers n/a
Craft and related trade workers n/a
Plant and machine operators and assemblers n/a
Primary requirements n/a 2.9
Elementary occupations n/a
Various n/a
Legislators, senior officials and managers n/a
Unclassified n/a
Armed forces n/a
Spread of scores (by pillar and overall)
Azerbaijan
Upper-middle income economies
Europe and Central Asia

2.1: Country Profiles
76 | The Human Capital Report
Pillar 1: Education Rank/122 Z-Score Country Value Sample Minimum Sample Maximum
Access
Primary enrolment rate (%) ...................................................................99.......................–0.722........................ 87...........................58 ......................... 100
Secondary enrolment rate (%) ..............................................................36.........................0.601........................ 86...........................16 ......................... 100
Tertiary enrolment ratio (%) ...................................................................82.......................–0.795........................ 20.............................1 ......................... 103
Education gender gap2 .........................................................................77.........................0.324................... 0.983......................0.645 ...................... 1.000
Quality
Internet access in schools1 ...................................................................63.......................–0.105..................... 4.19........................1.64 ........................ 6.64
Quality of the education system1 ..........................................................99.......................–0.815..................... 3.07........................1.99 ........................ 5.98
Quality of primary schools1 ...................................................................95.......................–0.845..................... 3.02........................1.97 ........................ 6.82
Quality of math & science education1 ...................................................93.......................–0.750..................... 3.32........................1.88 ........................ 6.29
Quality of management schools1 ........................................................114.......................–1.407..................... 3.12........................2.29 ........................ 6.09
Attainment
Primary education attainment (% population age 25+) ..........................14.........................0.897........................ 98.............................5 ......................... 100
Secondary education attainment (% population age 25+) .....................10.........................1.221........................ 95.............................2 ......................... 100
Tertiary education attainment (% population age 25+) ..........................27.........................0.564........................ 25.............................0 ........................... 44
Pillar 2: Health and Wellness Rank/122 Z-Score Country Value Sample Minimum Sample Maximum
Survival
Infant mortality (per 1,000 live births) ....................................................99.......................–0.784........................ 39.............................2 ........................... 98
Life expectancy ...................................................................................82.......................–0.187........................ 71...........................50 ........................... 83
Survival gender gap2 ..........................................................................118.......................–4.477................... 0.920......................0.920 ...................... 0.980
Health
Stunting and wasting (% in children under 5) ........................................47.......................–0.170..................... 16.8..........................1.2 ........................ 36.5
Unhealthy life years (% of life expectancy) ............................................98.......................–0.378........................ 17.............................8 ........................... 66
Deaths under 60 from non-communicable
diseases (% of all NCD deaths) ......................................................60.........................0.085 ..................... 25.5 ..........................7.3 ........................ 55.8
Obesity (% of adults with BMI ≥ 30) .....................................................92.......................–0.650..................... 24.7..........................1.1 ........................ 42.8
Business impact of non-communicable diseases1 ................................47.........................0.294..................... 4.61........................2.74 ........................ 5.87
Business impact of communicable diseases1 .......................................61.........................0.269..................... 5.74........................3.13 ........................ 6.90
Well-being
Stress (% of respondents)7 ..................................................................17.........................0.912........................ 19.............................8 ........................... 69
Depression (% of respondents)7 ...........................................................56.........................0.137........................ 11.............................2 ........................... 37
Services
Water, sanitation and hygiene (% with access) .....................................84.......................–0.155..................... 81.1........................31.1 ...................... 100.0
Healthcare quality1................................................................................75.......................–0.583..................... 3.40........................1.78 ........................ 6.75
Healthcare accessibility1 .......................................................................62.......................–0.111..................... 4.53........................2.41 ........................ 6.75
Pillar 3: Workforce and Employment Rank/122 Z-Score Country Value Sample Minimum Sample Maximum
Participation
Labour force participation rate, age 15-64 (%) .....................................66.........................0.001..................... 69.2........................43.4 ........................ 90.6
Labour force participation rate, age 65+ (%) .........................................82.......................–0.704..................... 11.0..........................1.6 ........................ 91.2
Economic participation gender gap2 .....................................................67.........................0.045................... 0.649......................0.310 ...................... 0.839
Unemployment rate (%) ........................................................................32.........................0.600....................... 5.6..........................0.3 ........................ 32.0
Youth unemployment rate (%) ...............................................................41.........................0.422..................... 14.5..........................1.6 ........................ 48.2
Talent
Country capacity to attract talent1 ........................................................28.........................0.641..................... 4.10........................1.48 ........................ 6.08
Country capacity to retain talent1..........................................................56.......................–0.035..................... 3.50........................1.81 ........................ 5.97
Ease of finding skilled employees1 ........................................................79.......................–0.327..................... 3.76........................2.13 ........................ 5.69
Pay related to productivity1 ...................................................................19.........................1.101..................... 4.60........................2.37 ........................ 5.25
Capacity for innovation1........................................................................32.........................0.440..................... 4.05........................2.31 ........................ 5.84
Index of Economic Complexity3 ..........................................................106.......................–1.456................... –1.28......................–1.96 ........................ 2.37
Firm level technology absorption1 .........................................................55.........................0.076..................... 4.87........................3.17 ........................ 6.23
Scientific and technical journal articles (per 1,000 people) ....................75.......................–0.573................... 0.017......................0.000 ...................... 1.242
Median age of the working population ..................................................65.......................–0.203........................ 34...........................28 ........................... 42
Training
Staff training1 ........................................................................................70.......................–0.198..................... 3.92........................2.51 ........................ 5.57
Training services1 ..................................................................................64.......................–0.085..................... 4.24........................2.67 ........................ 6.47
Azerbaijan
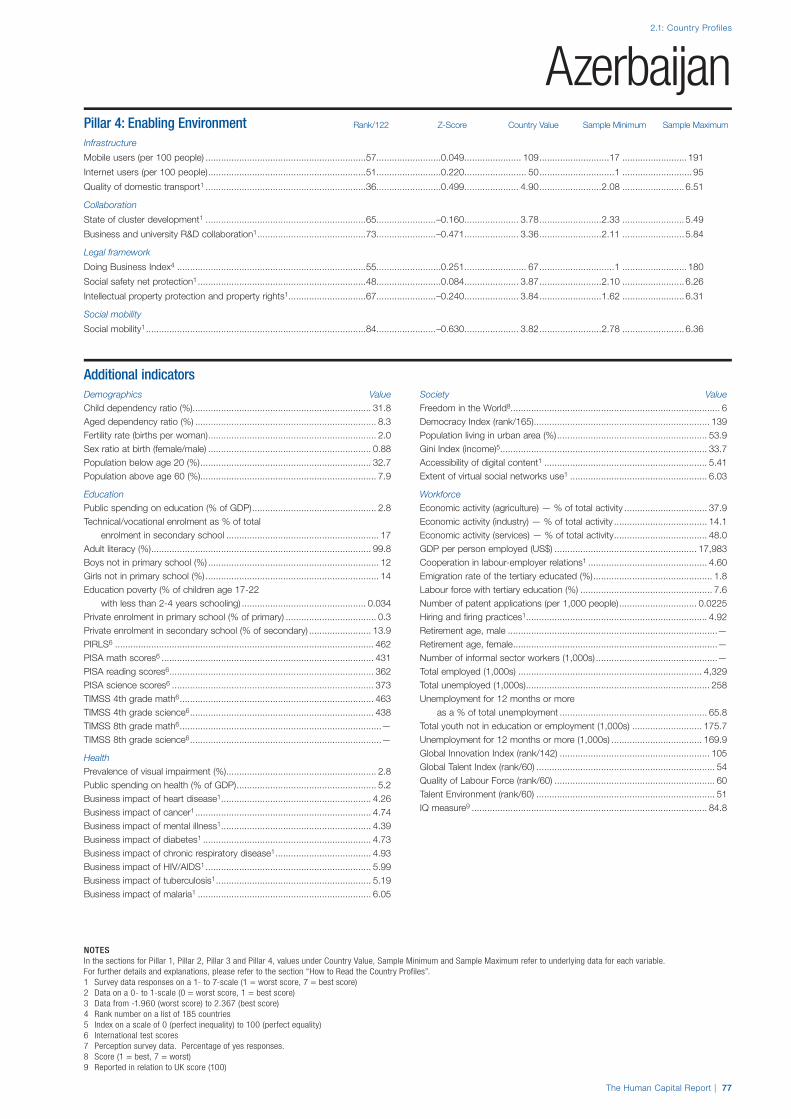
2.1: Country Profiles
NOTESIn the sections for Pillar 1, Pillar 2, Pillar 3 and Pillar 4, values under Country Value, Sample Minimum and Sample Maximum refer to underlying data for each variable.For further details and explanations, please refer to the section “How to Read the Country Profiles”.1 Survey data responses on a 1- to 7-scale (1 = worst score, 7 = best score)2 Data on a 0- to 1-scale (0 = worst score, 1 = best score)3 Data from -1.960 (worst score) to 2.367 (best score)4 Rank number on a list of 185 countries5 Index on a scale of 0 (perfect inequality) to 100 (perfect equality)6 International test scores7 Perception survey data. Percentage of yes responses.8 Score (1 = best, 7 = worst)9 Reported in relation to UK score (100)
The Human Capital Report | 77
AzerbaijanPillar 4: Enabling Environment Rank/122 Z-Score Country Value Sample Minimum Sample Maximum
Infrastructure
Mobile users (per 100 people) ..............................................................57.........................0.049...................... 109...........................17 ......................... 191
Internet users (per 100 people) .............................................................51.........................0.220........................ 50.............................1 ........................... 95
Quality of domestic transport1 ..............................................................36.........................0.499 ..................... 4.90 ........................2.08 ........................ 6.51
Collaboration
State of cluster development1 ..............................................................65.......................–0.160..................... 3.78........................2.33 ........................ 5.49
Business and university R&D collaboration1 ..........................................73.......................–0.471 ..................... 3.36 ........................2.11 ........................ 5.84
Legal framework
Doing Business Index4 .........................................................................55.........................0.251........................ 67.............................1 ......................... 180
Social safety net protection1 .................................................................48.........................0.084..................... 3.87........................2.10 ........................ 6.26
Intellectual property protection and property rights1..............................67.......................–0.240 ..................... 3.84 ........................1.62 ........................ 6.31
Social mobility
Social mobility1 .....................................................................................84.......................–0.630..................... 3.82........................2.78 ........................ 6.36
Additional indicatorsDemographics Value
Child dependency ratio (%)..................................................................... 31.8Aged dependency ratio (%) ...................................................................... 8.3Fertility rate (births per woman) ................................................................. 2.0Sex ratio at birth (female/male) ............................................................... 0.88Population below age 20 (%) .................................................................. 32.7Population above age 60 (%) .................................................................... 7.9
Education
Public spending on education (% of GDP) ................................................ 2.8Technical/vocational enrolment as % of total
enrolment in secondary school ........................................................... 17Adult literacy (%) ..................................................................................... 99.8Boys not in primary school (%) .................................................................. 12Girls not in primary school (%) ................................................................... 14Education poverty (% of children age 17-22
with less than 2-4 years schooling) ................................................ 0.034Private enrolment in primary school (% of primary) ................................... 0.3Private enrolment in secondary school (% of secondary) ........................ 13.9PIRLS6 .................................................................................................... 462PISA math scores6 .................................................................................. 431PISA reading scores6 ............................................................................... 362PISA science scores6 .............................................................................. 373TIMSS 4th grade math6 ........................................................................... 463TIMSS 4th grade science6 ....................................................................... 438TIMSS 8th grade math6 ..............................................................................—TIMSS 8th grade science6 ..........................................................................—
Health
Prevalence of visual impairment (%) .......................................................... 2.8Public spending on health (% of GDP) ...................................................... 5.2Business impact of heart disease1 .......................................................... 4.26Business impact of cancer1 .................................................................... 4.74Business impact of mental illness1 .......................................................... 4.39Business impact of diabetes1 ................................................................. 4.73Business impact of chronic respiratory disease1 ..................................... 4.93Business impact of HIV/AIDS1 ................................................................ 5.99Business impact of tuberculosis1 ............................................................ 5.19Business impact of malaria1 ................................................................... 6.05
Society Value
Freedom in the World8................................................................................. 6Democracy Index (rank/165) .................................................................... 139Population living in urban area (%) .......................................................... 53.9Gini Index (income)5................................................................................ 33.7Accessibility of digital content1 ............................................................... 5.41Extent of virtual social networks use1 ..................................................... 6.03
Workforce
Economic activity (agriculture) — % of total activity ................................ 37.9Economic activity (industry) — % of total activity .................................... 14.1Economic activity (services) — % of total activity .................................... 48.0GDP per person employed (US$) ....................................................... 17,983Cooperation in labour-employer relations1 .............................................. 4.60Emigration rate of the tertiary educated (%) .............................................. 1.8Labour force with tertiary education (%) ................................................... 7.6Number of patent applications (per 1,000 people) .............................. 0.0225Hiring and firing practices1 ...................................................................... 4.92Retirement age, male .................................................................................—Retirement age, female ...............................................................................—Number of informal sector workers (1,000s) ...............................................—Total employed (1,000s) ....................................................................... 4,329Total unemployed (1,000s) ....................................................................... 258Unemployment for 12 months or more
as a % of total unemployment ......................................................... 65.8Total youth not in education or employment (1,000s) ........................... 175.7Unemployment for 12 months or more (1,000s) ................................... 169.9Global Innovation Index (rank/142) .......................................................... 105Global Talent Index (rank/60) ..................................................................... 54Quality of Labour Force (rank/60) .............................................................. 60Talent Environment (rank/60) ..................................................................... 51IQ measure9 ........................................................................................... 84.8

2.1: Country Profiles
78 | The Human Capital Report
Rank/122 Score
Year
s (5
yea
r age
gro
ups)
Percent of total population
0–4
5–9
10–14
15–19
20–24
25–29
30–34
35–39
40–44
45–49
50–54
55–59
60–64
65–69
70–74
75–79
80–84
85–89
90–94
95–99
100+
0 2 4 6 8 10 1212 10 8 6 4 2 0
BahrainHuman Capital Index 2013 40 0.232
Pillar 1: Education 48 0.274
Pillar 2: Health and wellness 64 0.011
Pillar 3: Workforce and employment 43 0.099
Pillar 4: Enabling environment 33 0.544
Key Indicators
Total population (1,000s) 1,251.5
Median age of population 30
GDP per capita PPP (constant 2005, international $) 21,521
GDP growth (annual %) 4.5
Male Female Additional indicators
n Total population n Total population Aged dependency: 2.6%
n Labour force participation n Labour force participation Youth dependency: 25.4%
n Primary and secondary enrolment n Primary and secondary enrolment Male labour force participation, age 65+: 0.4%
Female labour force participation, age 65+: 0.1%
Education and workforce distribution

The Human Capital Report | 79
2.1: Country Profiles
HCI s
core
–2.5
–2.0
–1.5
–1.0
–0.5
0.0
0.5
1.0
1.5
2.0
2.5
Overall Index
Enablingenvironment
Workforce andemployment
Health andwellness
Education
BahrainEmployment types, educational requirements and educational attainment
Percent of population Educational in employment type attainment (%)
Tertiary requirements n/a 11.2
Professionals n/a
Technicians and associate professionals n/a
Secondary requirements n/a 57.1
Clerks n/a
Service workers and shop and market sales workers n/a
Skilled agricultural and fishery workers n/a
Craft and related trade workers n/a
Plant and machine operators and assemblers n/a
Primary requirements n/a 12.0
Elementary occupations n/a
Various n/a
Legislators, senior officials and managers n/a
Unclassified n/a
Armed forces n/a
Spread of scores (by pillar and overall)
Bahrain
High-income economies
Middle East and North Africa

2.1: Country Profiles
80 | The Human Capital Report
Pillar 1: Education Rank/122 Z-Score Country Value Sample Minimum Sample Maximum
Access
Primary enrolment rate (%) ...................................................................19.........................0.706........................ 99...........................58 ......................... 100
Secondary enrolment rate (%) ..............................................................10.........................0.958........................ 94...........................16 ......................... 100
Tertiary enrolment ratio (%) ...................................................................69.......................–0.409........................ 30.............................1 ......................... 103
Education gender gap2 .........................................................................42.........................0.478................... 0.995......................0.645 ...................... 1.000
Quality
Internet access in schools1 ...................................................................40.........................0.518..................... 4.97........................1.64 ........................ 6.64
Quality of the education system1 ..........................................................40.........................0.360..................... 4.12........................1.99 ........................ 5.98
Quality of primary schools1 ...................................................................53.........................0.103..................... 4.05........................1.97 ........................ 6.82
Quality of math & science education1 ...................................................67.........................0.002..................... 4.04........................1.88 ........................ 6.29
Quality of management schools1 ..........................................................74.......................–0.246..................... 4.09........................2.29 ........................ 6.09
Attainment
Primary education attainment (% population age 25+) ..........................—..............................— .........................— .............................5 ......................... 100
Secondary education attainment (% population age 25+) .....................—..............................— .........................— .............................2 ......................... 100
Tertiary education attainment (% population age 25+) ..........................—..............................— .........................— .............................0 ........................... 44
Pillar 2: Health and Wellness Rank/122 Z-Score Country Value Sample Minimum Sample Maximum
Survival
Infant mortality (per 1,000 live births) ....................................................45.........................0.563.......................... 9.............................2 ........................... 98
Life expectancy ...................................................................................30.........................0.785........................ 79...........................50 ........................... 83
Survival gender gap2 ............................................................................98.......................–0.865................... 0.961......................0.920 ...................... 0.980
Health
Stunting and wasting (% in children under 5) ........................................—..............................— .........................— ..........................1.2 ........................ 36.5
Unhealthy life years (% of life expectancy) ............................................96.......................–0.303........................ 16.............................8 ........................... 66
Deaths under 60 from non-communicable
diseases (% of all NCD deaths) ....................................................100.......................–1.126 ..................... 40.9 ..........................7.3 ........................ 55.8
Obesity (% of adults with BMI ≥ 30) ...................................................113.......................–1.484..................... 32.6..........................1.1 ........................ 42.8
Business impact of non-communicable diseases1 ................................45.........................0.320..................... 4.62........................2.74 ........................ 5.87
Business impact of communicable diseases1 .......................................46.........................0.517..................... 5.99........................3.13 ........................ 6.90
Well-being
Stress (% of respondents)7 ..................................................................76.......................–0.328........................ 35.............................8 ........................... 69
Depression (% of respondents)7 ...........................................................90.......................–0.660........................ 16.............................2 ........................... 37
Services
Water, sanitation and hygiene (% with access) .....................................31.........................0.789..................... 99.5........................31.1 ...................... 100.0
Healthcare quality1................................................................................37.........................0.620..................... 4.86........................1.78 ........................ 6.75
Healthcare accessibility1 .......................................................................20.........................1.311..................... 6.26........................2.41 ........................ 6.75
Pillar 3: Workforce and Employment Rank/122 Z-Score Country Value Sample Minimum Sample Maximum
Participation
Labour force participation rate, age 15-64 (%) .....................................50.........................0.287..................... 72.0........................43.4 ........................ 90.6
Labour force participation rate, age 65+ (%) .........................................75.......................–0.601..................... 13.0..........................1.6 ........................ 91.2
Economic participation gender gap2 ...................................................103.......................–1.246................... 0.497......................0.310 ...................... 0.839
Unemployment rate (%) ........................................................................—..............................— .........................— ..........................0.3 ........................ 32.0
Youth unemployment rate (%) ...............................................................91.......................–0.997..................... 28.3..........................1.6 ........................ 48.2
Talent
Country capacity to attract talent1 ........................................................11.........................1.539..................... 5.03........................1.48 ........................ 6.08
Country capacity to retain talent1..........................................................20.........................1.098..................... 4.59........................1.81 ........................ 5.97
Ease of finding skilled employees1 ........................................................44.........................0.333..................... 4.22........................2.13 ........................ 5.69
Pay related to productivity1 ...................................................................32.........................0.657..................... 4.32........................2.37 ........................ 5.25
Capacity for innovation1........................................................................71.......................–0.399..................... 3.39........................2.31 ........................ 5.84
Index of Economic Complexity3 ............................................................—..............................— .........................— ......................–1.96 ........................ 2.37
Firm level technology absorption1 .........................................................27.........................0.947..................... 5.49........................3.17 ........................ 6.23
Scientific and technical journal articles (per 1,000 people) ....................62.......................–0.526................... 0.031......................0.000 ...................... 1.242
Median age of the working population ..................................................70.......................–0.311........................ 33...........................28 ........................... 42
Training
Staff training1 ........................................................................................35.........................0.453..................... 4.34........................2.51 ........................ 5.57
Training services1 ..................................................................................48.........................0.151..................... 4.42........................2.67 ........................ 6.47
Bahrain

2.1: Country Profiles
NOTESIn the sections for Pillar 1, Pillar 2, Pillar 3 and Pillar 4, values under Country Value, Sample Minimum and Sample Maximum refer to underlying data for each variable.For further details and explanations, please refer to the section “How to Read the Country Profiles”.1 Survey data responses on a 1- to 7-scale (1 = worst score, 7 = best score)2 Data on a 0- to 1-scale (0 = worst score, 1 = best score)3 Data from -1.960 (worst score) to 2.367 (best score)4 Rank number on a list of 185 countries5 Index on a scale of 0 (perfect inequality) to 100 (perfect equality)6 International test scores7 Perception survey data. Percentage of yes responses.8 Score (1 = best, 7 = worst)9 Reported in relation to UK score (100)
The Human Capital Report | 81
BahrainPillar 4: Enabling Environment Rank/122 Z-Score Country Value Sample Minimum Sample Maximum
Infrastructure
Mobile users (per 100 people) ..............................................................30.........................0.614...................... 128...........................17 ......................... 191
Internet users (per 100 people) .............................................................21.........................1.184........................ 77.............................1 ........................... 95
Quality of domestic transport1 ..............................................................67.......................–0.198 ..................... 4.30 ........................2.08 ........................ 6.51
Collaboration
State of cluster development1 ..............................................................29.........................0.639..................... 4.35........................2.33 ........................ 5.49
Business and university R&D collaboration1 ........................................106.......................–0.952..................... 2.93........................2.11 ........................ 5.84
Legal framework
Doing Business Index4 .........................................................................39.........................0.736........................ 42.............................1 ......................... 180
Social safety net protection1 .................................................................22.........................0.966..................... 4.83........................2.10 ........................ 6.26
Intellectual property protection and property rights1..............................26.........................1.024 ..................... 5.14 ........................1.62 ........................ 6.31
Social mobility
Social mobility1 .....................................................................................27.........................0.887..................... 5.19........................2.78 ........................ 6.36
Additional indicatorsDemographics Value
Child dependency ratio (%)..................................................................... 25.4Aged dependency ratio (%) ...................................................................... 2.6Fertility rate (births per woman) ................................................................. 2.2Sex ratio at birth (female/male) ............................................................... 0.97Population below age 20 (%) .................................................................. 25.3Population above age 60 (%) .................................................................... 3.5
Education
Public spending on education (% of GDP) ................................................ 2.9Technical/vocational enrolment as % of total
enrolment in secondary school ............................................................. 7Adult literacy (%) ..................................................................................... 94.6Boys not in primary school (%) .................................................................... 1Girls not in primary school (%) ..................................................................... 4Education poverty (% of children age 17-22
with less than 2-4 years schooling) ......................................................—Private enrolment in primary school (% of primary) ................................. 32.5Private enrolment in secondary school (% of secondary) ........................ 21.8PIRLS6 .......................................................................................................—PISA math scores6 .....................................................................................—PISA reading scores6 ..................................................................................—PISA science scores6 .................................................................................—TIMSS 4th grade math6 ........................................................................... 436TIMSS 4th grade science6 ....................................................................... 449TIMSS 8th grade math6 ........................................................................... 409TIMSS 8th grade science6 ....................................................................... 452
Health
Prevalence of visual impairment (%) .......................................................... 2.5Public spending on health (% of GDP) ...................................................... 3.8Business impact of heart disease1 .......................................................... 4.67Business impact of cancer1 .................................................................... 4.52Business impact of mental illness1 .......................................................... 5.33Business impact of diabetes1 ................................................................. 3.75Business impact of chronic respiratory disease1 ..................................... 4.84Business impact of HIV/AIDS1 ................................................................ 5.86Business impact of tuberculosis1 ............................................................ 5.87Business impact of malaria1 ................................................................... 6.25
Society Value
Freedom in the World8................................................................................. 6Democracy Index (rank/165) .................................................................... 150Population living in urban area (%) .......................................................... 88.8Gini Index (income)5....................................................................................—Accessibility of digital content1 ............................................................... 5.72Extent of virtual social networks use1 ..................................................... 6.35
Workforce
Economic activity (agriculture) — % of total activity ....................................—Economic activity (industry) — % of total activity ........................................—Economic activity (services) — % of total activity ........................................—GDP per person employed (US$) ......................................................... 9,175Cooperation in labour-employer relations1 .............................................. 4.94Emigration rate of the tertiary educated (%) .............................................. 5.1Labour force with tertiary education (%) ................................................. 16.7Number of patent applications (per 1,000 people) .............................. 0.1119Hiring and firing practices1 ...................................................................... 4.27Retirement age, male .................................................................................—Retirement age, female ...............................................................................—Number of informal sector workers (1,000s) ...............................................—Total employed (1,000s) .......................................................................... 703Total unemployed (1,000s) ........................................................................... 8Unemployment for 12 months or more
as a % of total unemployment .............................................................—Total youth not in education or employment (1,000s) .................................—Unemployment for 12 months or more (1,000s) .........................................—Global Innovation Index (rank/142) ............................................................ 67Global Talent Index (rank/60) ......................................................................—Quality of Labour Force (rank/60) ...............................................................—Talent Environment (rank/60) ......................................................................—IQ measure9 ........................................................................................... 85.6

2.1: Country Profiles
82 | The Human Capital Report
Rank/122 Score
Year
s (5
yea
r age
gro
ups)
Percent of total population
0–4
5–9
10–14
15–19
20–24
25–29
30–34
35–39
40–44
45–49
50–54
55–59
60–64
65–69
70–74
75–79
80–84
85–89
90–94
95–99
100+
0 1 2 3 4 5 66 5 4 3 2 1 0
BangladeshHuman Capital Index 2013 110 –0.782
Pillar 1: Education 104 –0.959
Pillar 2: Health and wellness 104 –0.606
Pillar 3: Workforce and employment 103 –0.543
Pillar 4: Enabling environment 110 –1.019
Key Indicators
Total population (1,000s) 151,125.5
Median age of population 24
GDP per capita PPP (constant 2005, international $) 1,623
GDP growth (annual %) 6.3
Male Female Additional indicators
n Total population n Total population Aged dependency: 7.2%
n Labour force participation n Labour force participation Youth dependency: 49.7%
n Primary and secondary enrolment n Primary and secondary enrolment Male labour force participation, age 65+: 1.2%
Female labour force participation, age 65+: 0.2%
Education and workforce distribution

The Human Capital Report | 83
2.1: Country Profiles
HCI s
core
–2.5
–2.0
–1.5
–1.0
–0.5
0.0
0.5
1.0
1.5
2.0
2.5
Overall Index
Enablingenvironment
Workforce andemployment
Health andwellness
Education
BangladeshEmployment types, educational requirements and educational attainment
Percent of population Educational in employment type attainment (%)
Tertiary requirements 2.4 4.2
Professionals 2.2
Technicians and associate professionals 0.2
Secondary requirements 43.4 22.5
Clerks 1.0
Service workers and shop and market sales workers 6.5
Skilled agricultural and fishery workers 2.7
Craft and related trade workers 22.2
Plant and machine operators and assemblers 11.1
Primary requirements n/a 20.5
Elementary occupations n/a
Various 45.9
Legislators, senior officials and managers 45.9
Unclassified n/a
Armed forces n/a
Spread of scores (by pillar and overall)
Bangladesh
Low-income economies
Asia and the Pacific
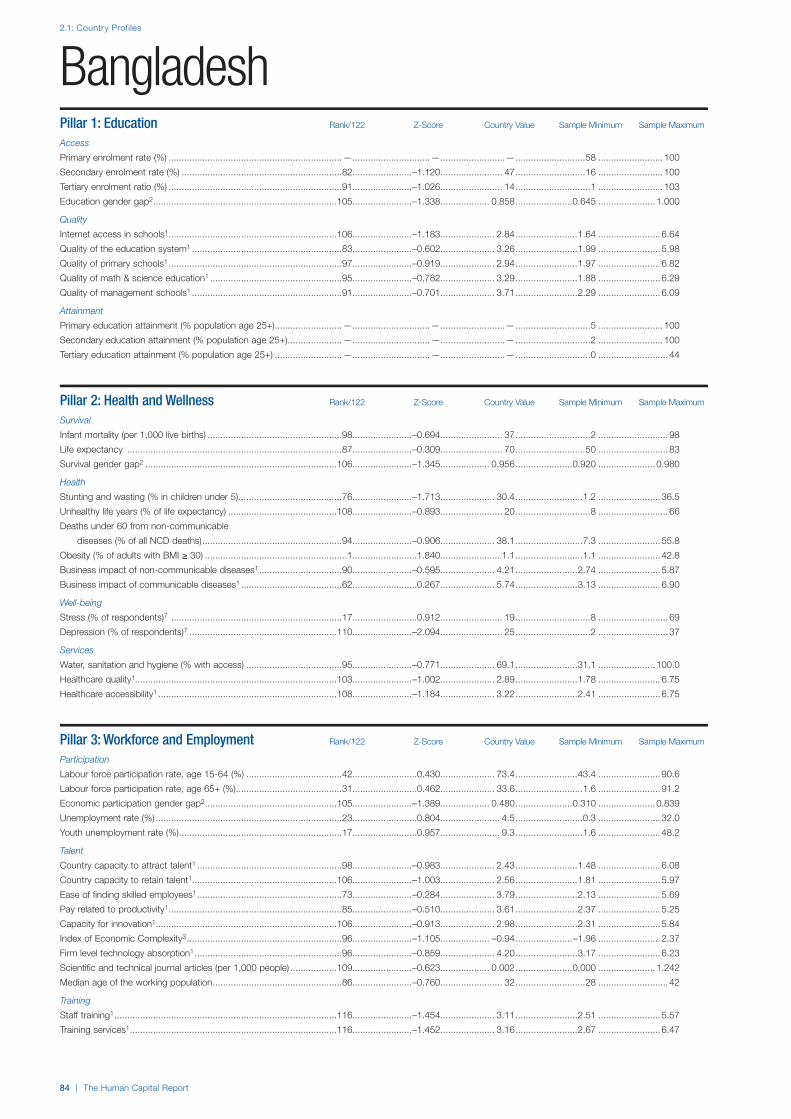
2.1: Country Profiles
84 | The Human Capital Report
Pillar 1: Education Rank/122 Z-Score Country Value Sample Minimum Sample Maximum
Access
Primary enrolment rate (%) ...................................................................—..............................— .........................— ...........................58 ......................... 100
Secondary enrolment rate (%) ..............................................................82.......................–1.120........................ 47...........................16 ......................... 100
Tertiary enrolment ratio (%) ...................................................................91.......................–1.026........................ 14.............................1 ......................... 103
Education gender gap2 .......................................................................105.......................–1.338................... 0.858......................0.645 ...................... 1.000
Quality
Internet access in schools1 .................................................................106.......................–1.183..................... 2.84........................1.64 ........................ 6.64
Quality of the education system1 ..........................................................83.......................–0.602..................... 3.26........................1.99 ........................ 5.98
Quality of primary schools1 ...................................................................97.......................–0.919..................... 2.94........................1.97 ........................ 6.82
Quality of math & science education1 ...................................................95.......................–0.782..................... 3.29........................1.88 ........................ 6.29
Quality of management schools1 ..........................................................91.......................–0.701..................... 3.71........................2.29 ........................ 6.09
Attainment
Primary education attainment (% population age 25+) ..........................—..............................— .........................— .............................5 ......................... 100
Secondary education attainment (% population age 25+) .....................—..............................— .........................— .............................2 ......................... 100
Tertiary education attainment (% population age 25+) ..........................—..............................— .........................— .............................0 ........................... 44
Pillar 2: Health and Wellness Rank/122 Z-Score Country Value Sample Minimum Sample Maximum
Survival
Infant mortality (per 1,000 live births) ....................................................98.......................–0.694........................ 37.............................2 ........................... 98
Life expectancy ...................................................................................87.......................–0.309........................ 70...........................50 ........................... 83
Survival gender gap2 ..........................................................................106.......................–1.345................... 0.956......................0.920 ...................... 0.980
Health
Stunting and wasting (% in children under 5) ........................................76.......................–1.713..................... 30.4..........................1.2 ........................ 36.5
Unhealthy life years (% of life expectancy) ..........................................108.......................–0.893........................ 20.............................8 ........................... 66
Deaths under 60 from non-communicable
diseases (% of all NCD deaths) ......................................................94.......................–0.906 ..................... 38.1 ..........................7.3 ........................ 55.8
Obesity (% of adults with BMI ≥ 30) .......................................................1.........................1.840....................... 1.1..........................1.1 ........................ 42.8
Business impact of non-communicable diseases1 ................................90.......................–0.595..................... 4.21........................2.74 ........................ 5.87
Business impact of communicable diseases1 .......................................62.........................0.267..................... 5.74........................3.13 ........................ 6.90
Well-being
Stress (% of respondents)7 ..................................................................17.........................0.912........................ 19.............................8 ........................... 69
Depression (% of respondents)7 .........................................................110.......................–2.094........................ 25.............................2 ........................... 37
Services
Water, sanitation and hygiene (% with access) .....................................95.......................–0.771..................... 69.1........................31.1 ...................... 100.0
Healthcare quality1..............................................................................103.......................–1.002..................... 2.89........................1.78 ........................ 6.75
Healthcare accessibility1 .....................................................................108.......................–1.184..................... 3.22........................2.41 ........................ 6.75
Pillar 3: Workforce and Employment Rank/122 Z-Score Country Value Sample Minimum Sample Maximum
Participation
Labour force participation rate, age 15-64 (%) .....................................42.........................0.430..................... 73.4........................43.4 ........................ 90.6
Labour force participation rate, age 65+ (%) .........................................31.........................0.462..................... 33.6..........................1.6 ........................ 91.2
Economic participation gender gap2 ...................................................105.......................–1.389................... 0.480......................0.310 ...................... 0.839
Unemployment rate (%) ........................................................................23.........................0.804....................... 4.5..........................0.3 ........................ 32.0
Youth unemployment rate (%) ...............................................................17.........................0.957....................... 9.3..........................1.6 ........................ 48.2
Talent
Country capacity to attract talent1 ........................................................98.......................–0.983..................... 2.43........................1.48 ........................ 6.08
Country capacity to retain talent1........................................................106.......................–1.003..................... 2.56........................1.81 ........................ 5.97
Ease of finding skilled employees1 ........................................................73.......................–0.284..................... 3.79........................2.13 ........................ 5.69
Pay related to productivity1 ...................................................................85.......................–0.510..................... 3.61........................2.37 ........................ 5.25
Capacity for innovation1......................................................................106.......................–0.913..................... 2.98........................2.31 ........................ 5.84
Index of Economic Complexity3 ............................................................96.......................–1.105................... –0.94......................–1.96 ........................ 2.37
Firm level technology absorption1 .........................................................96.......................–0.859..................... 4.20........................3.17 ........................ 6.23
Scientific and technical journal articles (per 1,000 people) ..................109.......................–0.623................... 0.002......................0.000 ...................... 1.242
Median age of the working population ..................................................86.......................–0.760........................ 32...........................28 ........................... 42
Training
Staff training1 ......................................................................................116.......................–1.454..................... 3.11........................2.51 ........................ 5.57
Training services1 ................................................................................116.......................–1.452..................... 3.16........................2.67 ........................ 6.47
Bangladesh
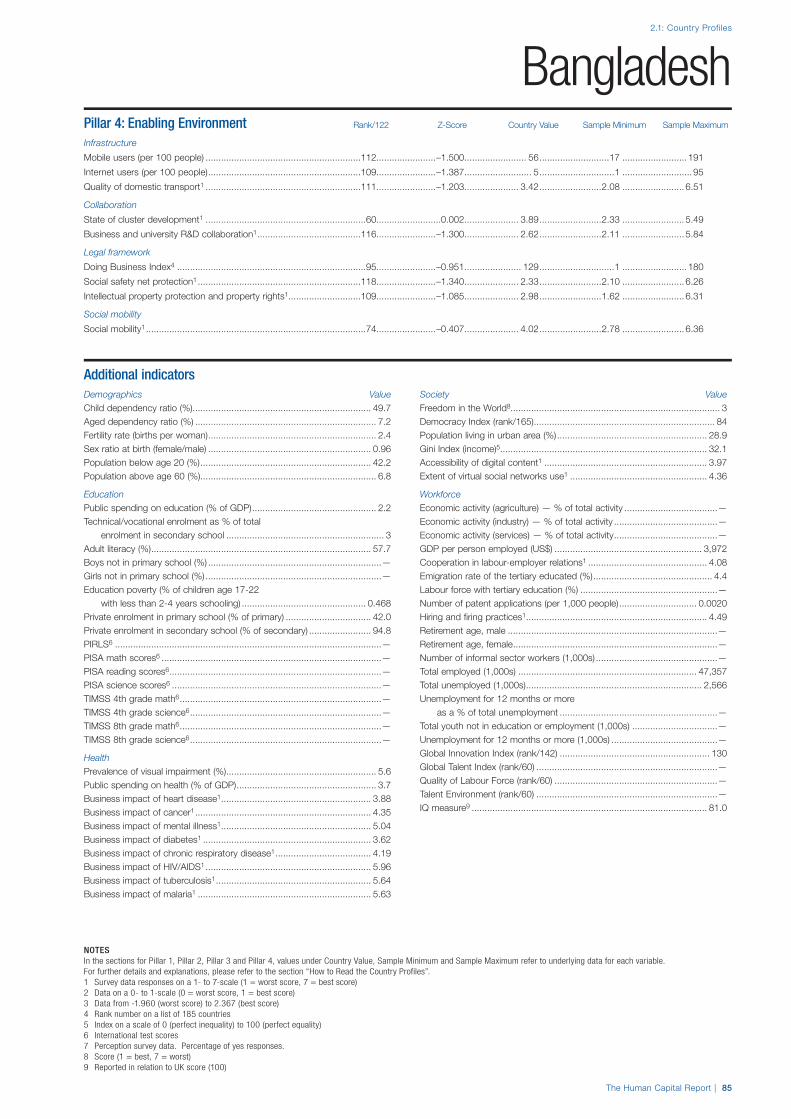
2.1: Country Profiles
NOTESIn the sections for Pillar 1, Pillar 2, Pillar 3 and Pillar 4, values under Country Value, Sample Minimum and Sample Maximum refer to underlying data for each variable.For further details and explanations, please refer to the section “How to Read the Country Profiles”.1 Survey data responses on a 1- to 7-scale (1 = worst score, 7 = best score)2 Data on a 0- to 1-scale (0 = worst score, 1 = best score)3 Data from -1.960 (worst score) to 2.367 (best score)4 Rank number on a list of 185 countries5 Index on a scale of 0 (perfect inequality) to 100 (perfect equality)6 International test scores7 Perception survey data. Percentage of yes responses.8 Score (1 = best, 7 = worst)9 Reported in relation to UK score (100)
The Human Capital Report | 85
BangladeshPillar 4: Enabling Environment Rank/122 Z-Score Country Value Sample Minimum Sample Maximum
Infrastructure
Mobile users (per 100 people) ............................................................112.......................–1.500........................ 56...........................17 ......................... 191
Internet users (per 100 people) ...........................................................109.......................–1.387.......................... 5.............................1 ........................... 95
Quality of domestic transport1 ............................................................111.......................–1.203 ..................... 3.42 ........................2.08 ........................ 6.51
Collaboration
State of cluster development1 ..............................................................60.........................0.002..................... 3.89........................2.33 ........................ 5.49
Business and university R&D collaboration1 ........................................116.......................–1.300..................... 2.62........................2.11 ........................ 5.84
Legal framework
Doing Business Index4 .........................................................................95.......................–0.951...................... 129.............................1 ......................... 180
Social safety net protection1 ...............................................................118.......................–1.340..................... 2.33........................2.10 ........................ 6.26
Intellectual property protection and property rights1............................109.......................–1.085 ..................... 2.98 ........................1.62 ........................ 6.31
Social mobility
Social mobility1 .....................................................................................74.......................–0.407..................... 4.02........................2.78 ........................ 6.36
Additional indicatorsDemographics Value
Child dependency ratio (%)..................................................................... 49.7Aged dependency ratio (%) ...................................................................... 7.2Fertility rate (births per woman) ................................................................. 2.4Sex ratio at birth (female/male) ............................................................... 0.96Population below age 20 (%) .................................................................. 42.2Population above age 60 (%) .................................................................... 6.8
Education
Public spending on education (% of GDP) ................................................ 2.2Technical/vocational enrolment as % of total
enrolment in secondary school ............................................................. 3Adult literacy (%) ..................................................................................... 57.7Boys not in primary school (%) ...................................................................—Girls not in primary school (%) ....................................................................—Education poverty (% of children age 17-22
with less than 2-4 years schooling) ................................................ 0.468Private enrolment in primary school (% of primary) ................................. 42.0Private enrolment in secondary school (% of secondary) ........................ 94.8PIRLS6 .......................................................................................................—PISA math scores6 .....................................................................................—PISA reading scores6 ..................................................................................—PISA science scores6 .................................................................................—TIMSS 4th grade math6 ..............................................................................—TIMSS 4th grade science6 ..........................................................................—TIMSS 8th grade math6 ..............................................................................—TIMSS 8th grade science6 ..........................................................................—
Health
Prevalence of visual impairment (%) .......................................................... 5.6Public spending on health (% of GDP) ...................................................... 3.7Business impact of heart disease1 .......................................................... 3.88Business impact of cancer1 .................................................................... 4.35Business impact of mental illness1 .......................................................... 5.04Business impact of diabetes1 ................................................................. 3.62Business impact of chronic respiratory disease1 ..................................... 4.19Business impact of HIV/AIDS1 ................................................................ 5.96Business impact of tuberculosis1 ............................................................ 5.64Business impact of malaria1 ................................................................... 5.63
Society Value
Freedom in the World8................................................................................. 3Democracy Index (rank/165) ...................................................................... 84Population living in urban area (%) .......................................................... 28.9Gini Index (income)5................................................................................ 32.1Accessibility of digital content1 ............................................................... 3.97Extent of virtual social networks use1 ..................................................... 4.36
Workforce
Economic activity (agriculture) — % of total activity ....................................—Economic activity (industry) — % of total activity ........................................—Economic activity (services) — % of total activity ........................................—GDP per person employed (US$) ......................................................... 3,972Cooperation in labour-employer relations1 .............................................. 4.08Emigration rate of the tertiary educated (%) .............................................. 4.4Labour force with tertiary education (%) .....................................................—Number of patent applications (per 1,000 people) .............................. 0.0020Hiring and firing practices1 ...................................................................... 4.49Retirement age, male .................................................................................—Retirement age, female ...............................................................................—Number of informal sector workers (1,000s) ...............................................—Total employed (1,000s) ..................................................................... 47,357Total unemployed (1,000s) .................................................................... 2,566Unemployment for 12 months or more
as a % of total unemployment .............................................................—Total youth not in education or employment (1,000s) .................................—Unemployment for 12 months or more (1,000s) .........................................—Global Innovation Index (rank/142) .......................................................... 130Global Talent Index (rank/60) ......................................................................—Quality of Labour Force (rank/60) ...............................................................—Talent Environment (rank/60) ......................................................................—IQ measure9 ........................................................................................... 81.0
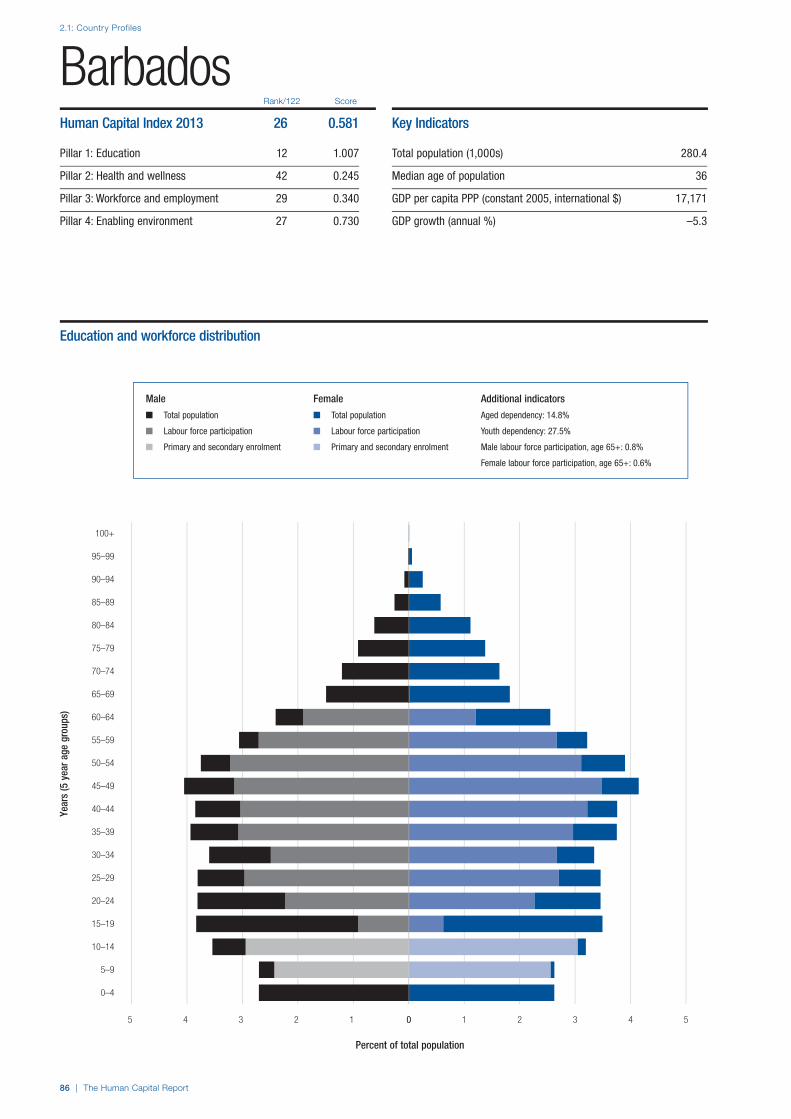
2.1: Country Profiles
86 | The Human Capital Report
Rank/122 Score
Year
s (5
yea
r age
gro
ups)
Percent of total population
0–4
5–9
10–14
15–19
20–24
25–29
30–34
35–39
40–44
45–49
50–54
55–59
60–64
65–69
70–74
75–79
80–84
85–89
90–94
95–99
100+
0 1 2 3 4 55 4 3 2 1 0
BarbadosHuman Capital Index 2013 26 0.581
Pillar 1: Education 12 1.007
Pillar 2: Health and wellness 42 0.245
Pillar 3: Workforce and employment 29 0.340
Pillar 4: Enabling environment 27 0.730
Key Indicators
Total population (1,000s) 280.4
Median age of population 36
GDP per capita PPP (constant 2005, international $) 17,171
GDP growth (annual %) –5.3
Male Female Additional indicators
n Total population n Total population Aged dependency: 14.8%
n Labour force participation n Labour force participation Youth dependency: 27.5%
n Primary and secondary enrolment n Primary and secondary enrolment Male labour force participation, age 65+: 0.8%
Female labour force participation, age 65+: 0.6%
Education and workforce distribution

The Human Capital Report | 87
2.1: Country Profiles
HCI s
core
–2.5
–2.0
–1.5
–1.0
–0.5
0.0
0.5
1.0
1.5
2.0
2.5
Overall Index
Enablingenvironment
Workforce andemployment
Health andwellness
Education
BarbadosEmployment types, educational requirements and educational attainment
Percent of population Educational in employment type attainment (%)
Tertiary requirements 10.9 1.1
Professionals 6.3
Technicians and associate professionals 4.6
Secondary requirements 30.6 62.3
Clerks 6.7
Service workers and shop and market sales workers 11.0
Skilled agricultural and fishery workers 1.7
Craft and related trade workers 7.7
Plant and machine operators and assemblers 3.5
Primary requirements 11.2 8.3
Elementary occupations 11.2
Various 11.7
Legislators, senior officials and managers 4.3
Unclassified n/a
Armed forces 7.4
Spread of scores (by pillar and overall)
Barbados
High-income economies
Latin America and the Carribean

2.1: Country Profiles
88 | The Human Capital Report
Pillar 1: Education Rank/122 Z-Score Country Value Sample Minimum Sample Maximum
Access
Primary enrolment rate (%) ...................................................................71.........................0.199........................ 95...........................58 ......................... 100
Secondary enrolment rate (%) ..............................................................28.........................0.725........................ 89...........................16 ......................... 100
Tertiary enrolment ratio (%) ...................................................................30.........................0.808........................ 62.............................1 ......................... 103
Education gender gap2 ...........................................................................1.........................0.548................... 1.000......................0.645 ...................... 1.000
Quality
Internet access in schools1 ...................................................................34.........................0.630..................... 5.11........................1.64 ........................ 6.64
Quality of the education system1 ............................................................6.........................1.724..................... 5.34........................1.99 ........................ 5.98
Quality of primary schools1 .....................................................................4.........................1.917..................... 6.02........................1.97 ........................ 6.82
Quality of math & science education1 .....................................................9.........................1.529..................... 5.50........................1.88 ........................ 6.29
Quality of management schools1 ..........................................................25.........................0.986..................... 5.12........................2.29 ........................ 6.09
Attainment
Primary education attainment (% population age 25+) ..........................—..............................— .........................— .............................5 ......................... 100
Secondary education attainment (% population age 25+) .....................—..............................— .........................— .............................2 ......................... 100
Tertiary education attainment (% population age 25+) ..........................—..............................— .........................— .............................0 ........................... 44
Pillar 2: Health and Wellness Rank/122 Z-Score Country Value Sample Minimum Sample Maximum
Survival
Infant mortality (per 1,000 live births) ....................................................73.........................0.159........................ 18.............................2 ........................... 98
Life expectancy ...................................................................................35.........................0.664........................ 78...........................50 ........................... 83
Survival gender gap2 ..............................................................................1.........................0.751................... 0.980......................0.920 ...................... 0.980
Health
Stunting and wasting (% in children under 5) ........................................—..............................— .........................— ..........................1.2 ........................ 36.5
Unhealthy life years (% of life expectancy) ............................................71.........................0.088........................ 14.............................8 ........................... 66
Deaths under 60 from non-communicable
diseases (% of all NCD deaths) ......................................................48.........................0.518 ..................... 20.0 ..........................7.3 ........................ 55.8
Obesity (% of adults with BMI ≥ 30) ...................................................116.......................–1.569..................... 33.4..........................1.1 ........................ 42.8
Business impact of non-communicable diseases1 ..............................111.......................–1.219..................... 3.93........................2.74 ........................ 5.87
Business impact of communicable diseases1 .......................................76.......................–0.104..................... 5.37........................3.13 ........................ 6.90
Well-being
Stress (% of respondents)7 ..................................................................—..............................— .........................— .............................8 ........................... 69
Depression (% of respondents)7 ...........................................................—..............................— .........................— .............................2 ........................... 37
Services
Water, sanitation and hygiene (% with access) .....................................55.........................0.556..................... 94.9........................31.1 ...................... 100.0
Healthcare quality1................................................................................19.........................1.315..................... 5.71........................1.78 ........................ 6.75
Healthcare accessibility1 .......................................................................11.........................1.538..................... 6.54........................2.41 ........................ 6.75
Pillar 3: Workforce and Employment Rank/122 Z-Score Country Value Sample Minimum Sample Maximum
Participation
Labour force participation rate, age 15-64 (%) .....................................13.........................1.166..................... 80.6........................43.4 ........................ 90.6
Labour force participation rate, age 65+ (%) .........................................94.......................–0.875....................... 7.7..........................1.6 ........................ 91.2
Economic participation gender gap2 .......................................................9.........................1.247................... 0.791......................0.310 ...................... 0.839
Unemployment rate (%) ........................................................................81.......................–0.374..................... 10.7..........................0.3 ........................ 32.0
Youth unemployment rate (%) ...............................................................83.......................–0.781..................... 26.2..........................1.6 ........................ 48.2
Talent
Country capacity to attract talent1 ........................................................17.........................1.197..................... 4.67........................1.48 ........................ 6.08
Country capacity to retain talent1..........................................................27.........................0.797..................... 4.30........................1.81 ........................ 5.97
Ease of finding skilled employees1 ..........................................................9.........................1.534..................... 5.05........................2.13 ........................ 5.69
Pay related to productivity1 ...................................................................88.......................–0.628..................... 3.54........................2.37 ........................ 5.25
Capacity for innovation1........................................................................70.......................–0.378..................... 3.40........................2.31 ........................ 5.84
Index of Economic Complexity3 ............................................................—..............................— .........................— ......................–1.96 ........................ 2.37
Firm level technology absorption1 .........................................................41.........................0.478..................... 5.16........................3.17 ........................ 6.23
Scientific and technical journal articles (per 1,000 people) ....................55.......................–0.474................... 0.046......................0.000 ...................... 1.242
Median age of the working population ..................................................31.........................0.994........................ 39...........................28 ........................... 42
Training
Staff training1 ........................................................................................27.........................0.719..................... 4.51........................2.51 ........................ 5.57
Training services1 ..................................................................................38.........................0.485..................... 4.69........................2.67 ........................ 6.47
Barbados

2.1: Country Profiles
NOTESIn the sections for Pillar 1, Pillar 2, Pillar 3 and Pillar 4, values under Country Value, Sample Minimum and Sample Maximum refer to underlying data for each variable.For further details and explanations, please refer to the section “How to Read the Country Profiles”.1 Survey data responses on a 1- to 7-scale (1 = worst score, 7 = best score)2 Data on a 0- to 1-scale (0 = worst score, 1 = best score)3 Data from -1.960 (worst score) to 2.367 (best score)4 Rank number on a list of 185 countries5 Index on a scale of 0 (perfect inequality) to 100 (perfect equality)6 International test scores7 Perception survey data. Percentage of yes responses.8 Score (1 = best, 7 = worst)9 Reported in relation to UK score (100)
The Human Capital Report | 89
BarbadosPillar 4: Enabling Environment Rank/122 Z-Score Country Value Sample Minimum Sample Maximum
Infrastructure
Mobile users (per 100 people) ..............................................................32.........................0.586...................... 127...........................17 ......................... 191
Internet users (per 100 people) .............................................................27.........................0.997........................ 72.............................1 ........................... 95
Quality of domestic transport1 ..............................................................15.........................1.302 ..................... 5.60 ........................2.08 ........................ 6.51
Collaboration
State of cluster development1 ..............................................................66.......................–0.164..................... 3.77........................2.33 ........................ 5.49
Business and university R&D collaboration1 ..........................................36.........................0.554 ..................... 4.28 ........................2.11 ........................ 5.84
Legal framework
Doing Business Index4 .........................................................................70.......................–0.156........................ 88.............................1 ......................... 180
Social safety net protection1 .................................................................14.........................1.453..................... 5.36........................2.10 ........................ 6.26
Intellectual property protection and property rights1..............................32.........................0.670 ..................... 4.77 ........................1.62 ........................ 6.31
Social mobility
Social mobility1 .....................................................................................19.........................1.328..................... 5.58........................2.78 ........................ 6.36
Additional indicatorsDemographics Value
Child dependency ratio (%)..................................................................... 27.5Aged dependency ratio (%) .................................................................... 14.8Fertility rate (births per woman) ................................................................. 1.8Sex ratio at birth (female/male) ............................................................... 0.99Population below age 20 (%) .................................................................. 26.5Population above age 60 (%) .................................................................. 15.2
Education
Public spending on education (% of GDP) ................................................ 7.5Technical/vocational enrolment as % of total
enrolment in secondary school ............................................................. 1Adult literacy (%) .........................................................................................—Boys not in primary school (%) .................................................................. 10Girls not in primary school (%) ..................................................................... 3Education poverty (% of children age 17-22
with less than 2-4 years schooling) ......................................................—Private enrolment in primary school (% of primary) ................................. 11.2Private enrolment in secondary school (% of secondary) .......................... 5.3PIRLS6 .......................................................................................................—PISA math scores6 .....................................................................................—PISA reading scores6 ..................................................................................—PISA science scores6 .................................................................................—TIMSS 4th grade math6 ..............................................................................—TIMSS 4th grade science6 ..........................................................................—TIMSS 8th grade math6 ..............................................................................—TIMSS 8th grade science6 ..........................................................................—
Health
Prevalence of visual impairment (%) .......................................................... 1.8Public spending on health (% of GDP) ...................................................... 7.7Business impact of heart disease1 .......................................................... 3.90Business impact of cancer1 .................................................................... 3.81Business impact of mental illness1 .......................................................... 4.60Business impact of diabetes1 ................................................................. 3.23Business impact of chronic respiratory disease1 ..................................... 4.13Business impact of HIV/AIDS1 ................................................................ 4.14Business impact of tuberculosis1 ............................................................ 5.85Business impact of malaria1 ................................................................... 6.13
Society Value
Freedom in the World8................................................................................. 1Democracy Index (rank/165) .......................................................................—Population living in urban area (%) .......................................................... 44.9Gini Index (income)5....................................................................................—Accessibility of digital content1 ............................................................... 5.96Extent of virtual social networks use1 ..................................................... 6.15
Workforce
Economic activity (agriculture) — % of total activity .................................. 3.3Economic activity (industry) — % of total activity .................................... 20.3Economic activity (services) — % of total activity .................................... 76.4GDP per person employed (US$) ....................................................... 19,663Cooperation in labour-employer relations1 .............................................. 5.19Emigration rate of the tertiary educated (%) ............................................ 62.6Labour force with tertiary education (%) ................................................. 18.4Number of patent applications (per 1,000 people) .............................. 0.2532Hiring and firing practices1 ...................................................................... 4.11Retirement age, male .................................................................................—Retirement age, female ...............................................................................—Number of informal sector workers (1,000s) ...............................................—Total employed (1,000s) .......................................................................... 127Total unemployed (1,000s) ......................................................................... 15Unemployment for 12 months or more
as a % of total unemployment .............................................................—Total youth not in education or employment (1,000s) .................................—Unemployment for 12 months or more (1,000s) .........................................—Global Innovation Index (rank/142) ............................................................ 47Global Talent Index (rank/60) ......................................................................—Quality of Labour Force (rank/60) ...............................................................—Talent Environment (rank/60) ......................................................................—IQ measure9 ........................................................................................... 80.0

2.1: Country Profiles
90 | The Human Capital Report
Rank/122 Score
Year
s (5
yea
r age
gro
ups)
Percent of total population
0–4
5–9
10–14
15–19
20–24
25–29
30–34
35–39
40–44
45–49
50–54
55–59
60–64
65–69
70–74
75–79
80–84
85–89
90–94
95–99
100+
0 1 2 3 4 55 4 3 2 1 0
BelgiumHuman Capital Index 2013 11 0.985
Pillar 1: Education 6 1.191
Pillar 2: Health and wellness 11 0.780
Pillar 3: Workforce and employment 21 0.673
Pillar 4: Enabling environment 14 1.296
Key Indicators
Total population (1,000s) 10,941.3
Median age of population 41
GDP per capita PPP (constant 2005, international $) 32,649
GDP growth (annual %) –0.3
Male Female Additional indicators
n Total population n Total population Aged dependency: 26.0%
n Labour force participation n Labour force participation Youth dependency: 25.4%
n Primary and secondary enrolment n Primary and secondary enrolment Male labour force participation, age 65+: 0.2%
Female labour force participation, age 65+: 0.1%
Education and workforce distribution

The Human Capital Report | 91
2.1: Country Profiles
HCI s
core
–2.5
–2.0
–1.5
–1.0
–0.5
0.0
0.5
1.0
1.5
2.0
2.5
Overall Index
Enablingenvironment
Workforce andemployment
Health andwellness
Education
BelgiumEmployment types, educational requirements and educational attainment
Percent of population Educational in employment type attainment (%)
Tertiary requirements 16.0 30.0
Professionals 5.5
Technicians and associate professionals 10.6
Secondary requirements 26.0 47.9
Clerks 5.7
Service workers and shop and market sales workers 7.8
Skilled agricultural and fishery workers 6.2
Craft and related trade workers 1.0
Plant and machine operators and assemblers 5.4
Primary requirements 3.9 13.0
Elementary occupations 3.9
Various 6.6
Legislators, senior officials and managers 0.4
Unclassified 1.2
Armed forces 5.0
Spread of scores (by pillar and overall)
Belgium
High-income economies
Europe and Central Asia

2.1: Country Profiles
92 | The Human Capital Report
Pillar 1: Education Rank/122 Z-Score Country Value Sample Minimum Sample Maximum
Access
Primary enrolment rate (%) ...................................................................25.........................0.674........................ 99...........................58 ......................... 100
Secondary enrolment rate (%) ..............................................................32.........................0.693........................ 88...........................16 ......................... 100
Tertiary enrolment ratio (%) ...................................................................19.........................1.142........................ 71.............................1 ......................... 103
Education gender gap2 .........................................................................60.........................0.439................... 0.992......................0.645 ...................... 1.000
Quality
Internet access in schools1 ...................................................................24.........................1.086..................... 5.68........................1.64 ........................ 6.64
Quality of the education system1 ............................................................7.........................1.702..................... 5.32........................1.99 ........................ 5.98
Quality of primary schools1 .....................................................................2.........................2.174..................... 6.30........................1.97 ........................ 6.82
Quality of math & science education1 .....................................................3.........................2.104..................... 6.05........................1.88 ........................ 6.29
Quality of management schools1 ............................................................2.........................1.979..................... 5.95........................2.29 ........................ 6.09
Attainment
Primary education attainment (% population age 25+) ..........................29.........................0.661........................ 93.............................5 ......................... 100
Secondary education attainment (% population age 25+) .....................28.........................0.626........................ 80.............................2 ......................... 100
Tertiary education attainment (% population age 25+) ..........................16.........................1.014........................ 30.............................0 ........................... 44
Pillar 2: Health and Wellness Rank/122 Z-Score Country Value Sample Minimum Sample Maximum
Survival
Infant mortality (per 1,000 live births) ....................................................19.........................0.787.......................... 4.............................2 ........................... 98
Life expectancy ...................................................................................24.........................0.907........................ 80...........................50 ........................... 83
Survival gender gap2 ............................................................................42.........................0.674................... 0.979......................0.920 ...................... 0.980
Health
Stunting and wasting (% in children under 5) ........................................—..............................— .........................— ..........................1.2 ........................ 36.5
Unhealthy life years (% of life expectancy) ............................................15.........................0.771........................ 10.............................8 ........................... 66
Deaths under 60 from non-communicable
diseases (% of all NCD deaths) ......................................................14.........................1.202 ..................... 11.3 ..........................7.3 ........................ 55.8
Obesity (% of adults with BMI ≥ 30) .....................................................56.......................–0.060..................... 19.1..........................1.1 ........................ 42.8
Business impact of non-communicable diseases1 ................................39.........................0.428..................... 4.67........................2.74 ........................ 5.87
Business impact of communicable diseases1 .......................................20.........................1.008..................... 6.48........................3.13 ........................ 6.90
Well-being
Stress (% of respondents)7 ..................................................................70.......................–0.250........................ 34.............................8 ........................... 69
Depression (% of respondents)7 ...........................................................65.......................–0.022........................ 12.............................2 ........................... 37
Services
Water, sanitation and hygiene (% with access) .......................................1.........................0.815................... 100.0........................31.1 ...................... 100.0
Healthcare quality1..................................................................................1.........................2.167..................... 6.75........................1.78 ........................ 6.75
Healthcare accessibility1 .........................................................................1.........................1.712..................... 6.75........................2.41 ........................ 6.75
Pillar 3: Workforce and Employment Rank/122 Z-Score Country Value Sample Minimum Sample Maximum
Participation
Labour force participation rate, age 15-64 (%) .....................................72.......................–0.142..................... 67.8........................43.4 ........................ 90.6
Labour force participation rate, age 65+ (%) .......................................119.......................–1.169....................... 2.0..........................1.6 ........................ 91.2
Economic participation gender gap2 .....................................................32.........................0.684................... 0.724......................0.310 ...................... 0.839
Unemployment rate (%) ........................................................................64.........................0.085....................... 8.3..........................0.3 ........................ 32.0
Youth unemployment rate (%) ...............................................................72.......................–0.390..................... 22.4..........................1.6 ........................ 48.2
Talent
Country capacity to attract talent1 ........................................................38.........................0.400..................... 3.85........................1.48 ........................ 6.08
Country capacity to retain talent1..........................................................24.........................0.877..................... 4.38........................1.81 ........................ 5.97
Ease of finding skilled employees1 ........................................................38.........................0.541..................... 4.36........................2.13 ........................ 5.69
Pay related to productivity1 ...................................................................78.......................–0.395..................... 3.68........................2.37 ........................ 5.25
Capacity for innovation1........................................................................10.........................1.723..................... 5.07........................2.31 ........................ 5.84
Index of Economic Complexity3 ............................................................20.........................1.032..................... 1.09......................–1.96 ........................ 2.37
Firm level technology absorption1 .........................................................23.........................1.089..................... 5.59........................3.17 ........................ 6.23
Scientific and technical journal articles (per 1,000 people) ....................15.........................1.632................... 0.677......................0.000 ...................... 1.242
Median age of the working population ....................................................9.........................1.415........................ 41...........................28 ........................... 42
Training
Staff training1 ........................................................................................18.........................1.322..................... 4.89........................2.51 ........................ 5.57
Training services1 ....................................................................................5.........................2.068..................... 5.94........................2.67 ........................ 6.47
Belgium

2.1: Country Profiles
NOTESIn the sections for Pillar 1, Pillar 2, Pillar 3 and Pillar 4, values under Country Value, Sample Minimum and Sample Maximum refer to underlying data for each variable.For further details and explanations, please refer to the section “How to Read the Country Profiles”.1 Survey data responses on a 1- to 7-scale (1 = worst score, 7 = best score)2 Data on a 0- to 1-scale (0 = worst score, 1 = best score)3 Data from -1.960 (worst score) to 2.367 (best score)4 Rank number on a list of 185 countries5 Index on a scale of 0 (perfect inequality) to 100 (perfect equality)6 International test scores7 Perception survey data. Percentage of yes responses.8 Score (1 = best, 7 = worst)9 Reported in relation to UK score (100)
The Human Capital Report | 93
BelgiumPillar 4: Enabling Environment Rank/122 Z-Score Country Value Sample Minimum Sample Maximum
Infrastructure
Mobile users (per 100 people) ..............................................................45.........................0.280...................... 117...........................17 ......................... 191
Internet users (per 100 people) .............................................................19.........................1.219........................ 78.............................1 ........................... 95
Quality of domestic transport1 ..............................................................20.........................1.014 ..................... 5.35 ........................2.08 ........................ 6.51
Collaboration
State of cluster development1 ..............................................................18.........................1.287..................... 4.81........................2.33 ........................ 5.49
Business and university R&D collaboration1 ............................................6.........................1.950..................... 5.53........................2.11 ........................ 5.84
Legal framework
Doing Business Index4 .........................................................................31.........................0.911........................ 33.............................1 ......................... 180
Social safety net protection1 ...................................................................1.........................2.282..................... 6.26........................2.10 ........................ 6.26
Intellectual property protection and property rights1..............................20.........................1.211 ..................... 5.33 ........................1.62 ........................ 6.31
Social mobility
Social mobility1 .....................................................................................15.........................1.514..................... 5.75........................2.78 ........................ 6.36
Additional indicatorsDemographics Value
Child dependency ratio (%)..................................................................... 25.4Aged dependency ratio (%) .................................................................... 26.0Fertility rate (births per woman) ................................................................. 1.8Sex ratio at birth (female/male) ............................................................... 0.95Population below age 20 (%) .................................................................. 22.8Population above age 60 (%) .................................................................. 23.3
Education
Public spending on education (% of GDP) ................................................ 6.6Technical/vocational enrolment as % of total
enrolment in secondary school ........................................................... 40Adult literacy (%) .........................................................................................—Boys not in primary school (%) .................................................................... 1Girls not in primary school (%) ..................................................................... 1Education poverty (% of children age 17-22
with less than 2-4 years schooling) ......................................................—Private enrolment in primary school (% of primary) ................................. 53.8Private enrolment in secondary school (% of secondary) ........................ 68.7PIRLS6 .................................................................................................... 506PISA math scores6 .................................................................................. 515PISA reading scores6 ............................................................................... 506PISA science scores6 .............................................................................. 507TIMSS 4th grade math6 ........................................................................... 549TIMSS 4th grade science6 ....................................................................... 508TIMSS 8th grade math6 ..............................................................................—TIMSS 8th grade science6 ..........................................................................—
Health
Prevalence of visual impairment (%) .......................................................... 0.9Public spending on health (% of GDP) .................................................... 10.6Business impact of heart disease1 .......................................................... 4.60Business impact of cancer1 .................................................................... 4.42Business impact of mental illness1 .......................................................... 4.58Business impact of diabetes1 ................................................................. 4.74Business impact of chronic respiratory disease1 ..................................... 5.03Business impact of HIV/AIDS1 ................................................................ 6.12Business impact of tuberculosis1 ............................................................ 6.49Business impact of malaria1 ................................................................... 6.83
Society Value
Freedom in the World8................................................................................. 1Democracy Index (rank/165) ...................................................................... 24Population living in urban area (%) .......................................................... 97.5Gini Index (income)5................................................................................ 33.0Accessibility of digital content1 ............................................................... 6.01Extent of virtual social networks use1 ..................................................... 6.13
Workforce
Economic activity (agriculture) — % of total activity .................................. 1.3Economic activity (industry) — % of total activity .................................... 23.2Economic activity (services) — % of total activity .................................... 75.5GDP per person employed (US$) ....................................................... 55,092Cooperation in labour-employer relations1 .............................................. 4.19Emigration rate of the tertiary educated (%) .............................................. 5.5Labour force with tertiary education (%) ................................................. 38.8Number of patent applications (per 1,000 people) .............................. 0.0697Hiring and firing practices1 ...................................................................... 2.78Retirement age, male ................................................................................ 65Retirement age, female .............................................................................. 65Number of informal sector workers (1,000s) ...............................................—Total employed (1,000s) ....................................................................... 4,489Total unemployed (1,000s) ....................................................................... 406Unemployment for 12 months or more
as a % of total unemployment ......................................................... 48.5Total youth not in education or employment (1,000s) ........................... 283.2Unemployment for 12 months or more (1,000s) ................................... 196.8Global Innovation Index (rank/142) ............................................................ 20Global Talent Index (rank/60) ..................................................................... 18Quality of Labour Force (rank/60) .............................................................. 20Talent Environment (rank/60) ..................................................................... 20IQ measure9 ........................................................................................... 99.2
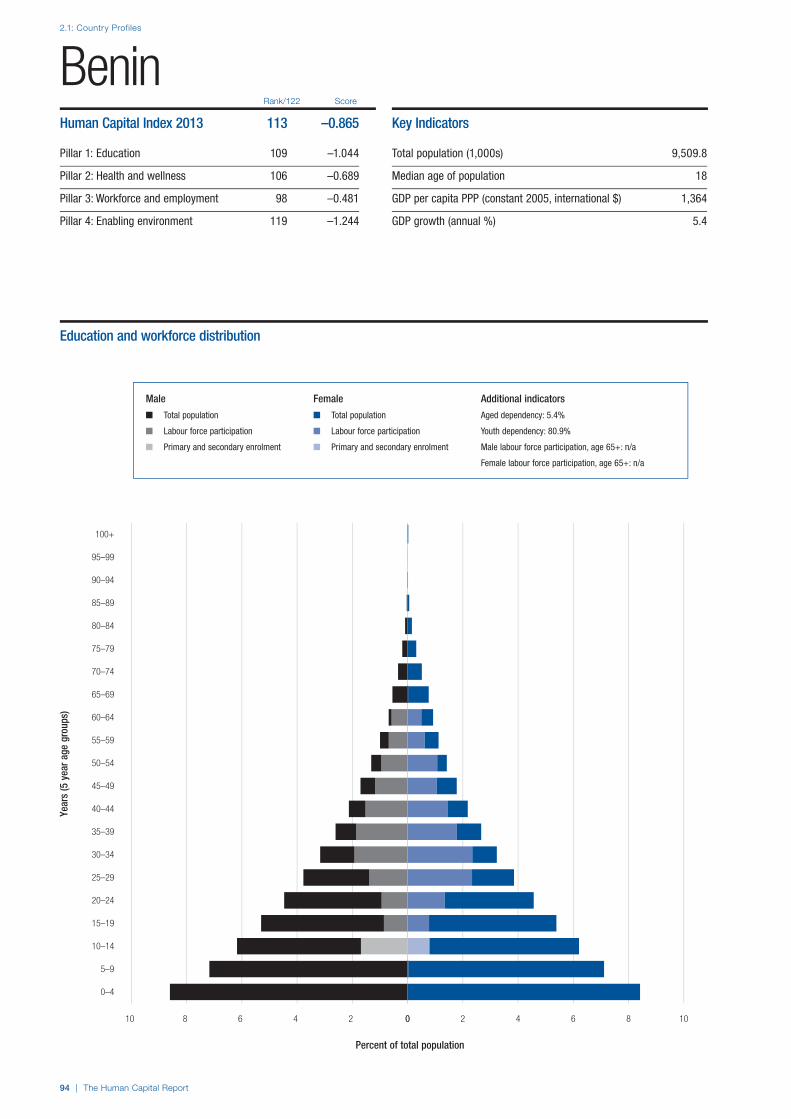
2.1: Country Profiles
94 | The Human Capital Report
Rank/122 Score
Year
s (5
yea
r age
gro
ups)
Percent of total population
0–4
5–9
10–14
15–19
20–24
25–29
30–34
35–39
40–44
45–49
50–54
55–59
60–64
65–69
70–74
75–79
80–84
85–89
90–94
95–99
100+
0 2 4 6 8 1010 8 6 4 2 0
BeninHuman Capital Index 2013 113 –0.865
Pillar 1: Education 109 –1.044
Pillar 2: Health and wellness 106 –0.689
Pillar 3: Workforce and employment 98 –0.481
Pillar 4: Enabling environment 119 –1.244
Key Indicators
Total population (1,000s) 9,509.8
Median age of population 18
GDP per capita PPP (constant 2005, international $) 1,364
GDP growth (annual %) 5.4
Male Female Additional indicators
n Total population n Total population Aged dependency: 5.4%
n Labour force participation n Labour force participation Youth dependency: 80.9%
n Primary and secondary enrolment n Primary and secondary enrolment Male labour force participation, age 65+: n/a
Female labour force participation, age 65+: n/a
Education and workforce distribution

The Human Capital Report | 95
2.1: Country Profiles
HCI s
core
–2.5
–2.0
–1.5
–1.0
–0.5
0.0
0.5
1.0
1.5
2.0
2.5
Overall Index
Enablingenvironment
Workforce andemployment
Health andwellness
Education
BeninEmployment types, educational requirements and educational attainment
Percent of population Educational in employment type attainment (%)
Tertiary requirements n/a 2.2
Professionals n/a
Technicians and associate professionals n/a
Secondary requirements n/a 12.2
Clerks n/a
Service workers and shop and market sales workers n/a
Skilled agricultural and fishery workers n/a
Craft and related trade workers n/a
Plant and machine operators and assemblers n/a
Primary requirements n/a 16.0
Elementary occupations n/a
Various n/a
Legislators, senior officials and managers n/a
Unclassified n/a
Armed forces n/a
Spread of scores (by pillar and overall)
Benin
Low-income economies
Sub-Saharan Africa

2.1: Country Profiles
96 | The Human Capital Report
Pillar 1: Education Rank/122 Z-Score Country Value Sample Minimum Sample Maximum
Access
Primary enrolment rate (%) ...................................................................86.......................–0.153........................ 92...........................58 ......................... 100
Secondary enrolment rate (%) ..............................................................—..............................— .........................— ...........................16 ......................... 100
Tertiary enrolment ratio (%) ...................................................................97.......................–1.138........................ 11.............................1 ......................... 103
Education gender gap2 .......................................................................118.......................–4.157................... 0.645......................0.645 ...................... 1.000
Quality
Internet access in schools1 .................................................................118.......................–1.831..................... 2.03........................1.64 ........................ 6.64
Quality of the education system1 ..........................................................84.......................–0.613..................... 3.25........................1.99 ........................ 5.98
Quality of primary schools1 ...................................................................84.......................–0.578..................... 3.31........................1.97 ........................ 6.82
Quality of math & science education1 ...................................................58.........................0.159..................... 4.19........................1.88 ........................ 6.29
Quality of management schools1 ..........................................................64.......................–0.043..................... 4.26........................2.29 ........................ 6.09
Attainment
Primary education attainment (% population age 25+) ..........................—..............................— .........................— .............................5 ......................... 100
Secondary education attainment (% population age 25+) .....................—..............................— .........................— .............................2 ......................... 100
Tertiary education attainment (% population age 25+) ..........................—..............................— .........................— .............................0 ........................... 44
Pillar 2: Health and Wellness Rank/122 Z-Score Country Value Sample Minimum Sample Maximum
Survival
Infant mortality (per 1,000 live births) ..................................................114.......................–2.086........................ 68.............................2 ........................... 98
Life expectancy .................................................................................113.......................–1.889........................ 57...........................50 ........................... 83
Survival gender gap2 ............................................................................98.......................–0.865................... 0.961......................0.920 ...................... 0.980
Health
Stunting and wasting (% in children under 5) ........................................69.......................–1.280..................... 26.6..........................1.2 ........................ 36.5
Unhealthy life years (% of life expectancy) ............................................44.........................0.391........................ 12.............................8 ........................... 66
Deaths under 60 from non-communicable
diseases (% of all NCD deaths) ....................................................105.......................–1.291 ..................... 43.0 ..........................7.3 ........................ 55.8
Obesity (% of adults with BMI ≥ 30) .....................................................24.........................1.270....................... 6.5..........................1.1 ........................ 42.8
Business impact of non-communicable diseases1 ................................84.......................–0.442..................... 4.28........................2.74 ........................ 5.87
Business impact of communicable diseases1 .....................................114.......................–1.790..................... 3.70........................3.13 ........................ 6.90
Well-being
Stress (% of respondents)7 ....................................................................7.........................1.300........................ 14.............................8 ........................... 69
Depression (% of respondents)7 ...........................................................56.........................0.137........................ 11.............................2 ........................... 37
Services
Water, sanitation and hygiene (% with access) ...................................114.......................–2.008..................... 45.0........................31.1 ...................... 100.0
Healthcare quality1................................................................................68.......................–0.475..................... 3.53........................1.78 ........................ 6.75
Healthcare accessibility1 .......................................................................81.......................–0.623..................... 3.90........................2.41 ........................ 6.75
Pillar 3: Workforce and Employment Rank/122 Z-Score Country Value Sample Minimum Sample Maximum
Participation
Labour force participation rate, age 15-64 (%) .....................................42.........................0.430..................... 73.4........................43.4 ........................ 90.6
Labour force participation rate, age 65+ (%) ...........................................6.........................1.685..................... 57.3..........................1.6 ........................ 91.2
Economic participation gender gap2 .....................................................20.........................0.980................... 0.759......................0.310 ...................... 0.839
Unemployment rate (%) ........................................................................—..............................— .........................— ..........................0.3 ........................ 32.0
Youth unemployment rate (%) ...............................................................—..............................— .........................— ..........................1.6 ........................ 48.2
Talent
Country capacity to attract talent1 ........................................................91.......................–0.838..................... 2.57........................1.48 ........................ 6.08
Country capacity to retain talent1........................................................109.......................–1.056..................... 2.51........................1.81 ........................ 5.97
Ease of finding skilled employees1 ........................................................64.......................–0.121..................... 3.90........................2.13 ........................ 5.69
Pay related to productivity1 .................................................................113.......................–1.483..................... 3.02........................2.37 ........................ 5.25
Capacity for innovation1......................................................................100.......................–0.829..................... 3.04........................2.31 ........................ 5.84
Index of Economic Complexity3 ............................................................—..............................— .........................— ......................–1.96 ........................ 2.37
Firm level technology absorption1 .......................................................107.......................–1.175..................... 3.98........................3.17 ........................ 6.23
Scientific and technical journal articles (per 1,000 people) ....................88.......................–0.610................... 0.006......................0.000 ...................... 1.242
Median age of the working population ................................................104.......................–1.192........................ 30...........................28 ........................... 42
Training
Staff training1 ......................................................................................115.......................–1.440..................... 3.12........................2.51 ........................ 5.57
Training services1 ..................................................................................86.......................–0.600..................... 3.83........................2.67 ........................ 6.47
Benin

2.1: Country Profiles
NOTESIn the sections for Pillar 1, Pillar 2, Pillar 3 and Pillar 4, values under Country Value, Sample Minimum and Sample Maximum refer to underlying data for each variable.For further details and explanations, please refer to the section “How to Read the Country Profiles”.1 Survey data responses on a 1- to 7-scale (1 = worst score, 7 = best score)2 Data on a 0- to 1-scale (0 = worst score, 1 = best score)3 Data from -1.960 (worst score) to 2.367 (best score)4 Rank number on a list of 185 countries5 Index on a scale of 0 (perfect inequality) to 100 (perfect equality)6 International test scores7 Perception survey data. Percentage of yes responses.8 Score (1 = best, 7 = worst)9 Reported in relation to UK score (100)
The Human Capital Report | 97
BeninPillar 4: Enabling Environment Rank/122 Z-Score Country Value Sample Minimum Sample Maximum
Infrastructure
Mobile users (per 100 people) ..............................................................95.......................–0.639........................ 85...........................17 ......................... 191
Internet users (per 100 people) ...........................................................114.......................–1.440.......................... 4.............................1 ........................... 95
Quality of domestic transport1 ............................................................117.......................–1.831..................... 2.87........................2.08 ........................ 6.51
Collaboration
State of cluster development1 ............................................................114.......................–1.423..................... 2.88........................2.33 ........................ 5.49
Business and university R&D collaboration1 ........................................113.......................–1.233 ..................... 2.68 ........................2.11 ........................ 5.84
Legal framework
Doing Business Index4 .......................................................................119.......................–1.843...................... 175.............................1 ......................... 180
Social safety net protection1 ...............................................................102.......................–0.917..................... 2.79........................2.10 ........................ 6.26
Intellectual property protection and property rights1..............................90.......................–0.779 ..................... 3.29 ........................1.62 ........................ 6.31
Social mobility
Social mobility1 ...................................................................................107.......................–1.089..................... 3.41........................2.78 ........................ 6.36
Additional indicatorsDemographics Value
Child dependency ratio (%)..................................................................... 80.9Aged dependency ratio (%) ...................................................................... 5.4Fertility rate (births per woman) ................................................................. 5.3Sex ratio at birth (female/male) ............................................................... 0.95Population below age 20 (%) .................................................................. 54.1Population above age 60 (%) .................................................................... 4.5
Education
Public spending on education (% of GDP) ................................................ 5.3Technical/vocational enrolment as % of total
enrolment in secondary school ............................................................. 3Adult literacy (%) ..................................................................................... 28.7Boys not in primary school (%) ...................................................................—Girls not in primary school (%) ....................................................................—Education poverty (% of children age 17-22
with less than 2-4 years schooling) ................................................ 0.885Private enrolment in primary school (% of primary) ................................. 15.7Private enrolment in secondary school (% of secondary) ........................ 18.7PIRLS6 .......................................................................................................—PISA math scores6 .....................................................................................—PISA reading scores6 ..................................................................................—PISA science scores6 .................................................................................—TIMSS 4th grade math6 ..............................................................................—TIMSS 4th grade science6 ..........................................................................—TIMSS 8th grade math6 ..............................................................................—TIMSS 8th grade science6 ..........................................................................—
Health
Prevalence of visual impairment (%) .......................................................... 5.4Public spending on health (% of GDP) ...................................................... 4.6Business impact of heart disease1 .......................................................... 3.93Business impact of cancer1 .................................................................... 4.39Business impact of mental illness1 .......................................................... 4.62Business impact of diabetes1 ................................................................. 4.28Business impact of chronic respiratory disease1 ..................................... 4.19Business impact of HIV/AIDS1 ................................................................ 3.85Business impact of tuberculosis1 ............................................................ 3.88Business impact of malaria1 ................................................................... 3.36
Society Value
Freedom in the World8................................................................................. 2Democracy Index (rank/165) ...................................................................... 79Population living in urban area (%) .......................................................... 45.6Gini Index (income)5................................................................................ 38.6Accessibility of digital content1 ............................................................... 3.15Extent of virtual social networks use1 ..................................................... 4.75
Workforce
Economic activity (agriculture) — % of total activity ....................................—Economic activity (industry) — % of total activity ........................................—Economic activity (services) — % of total activity ........................................—GDP per person employed (US$) ...............................................................—Cooperation in labour-employer relations1 .............................................. 3.69Emigration rate of the tertiary educated (%) .............................................. 8.7Labour force with tertiary education (%) .....................................................—Number of patent applications (per 1,000 people) ......................................—Hiring and firing practices1 ...................................................................... 3.74Retirement age, male .................................................................................—Retirement age, female ...............................................................................—Number of informal sector workers (1,000s) ...............................................—Total employed (1,000s) ....................................................................... 2,202Total unemployed (1,000s) ......................................................................... 20Unemployment for 12 months or more
as a % of total unemployment .............................................................—Total youth not in education or employment (1,000s) ............................. 29.9Unemployment for 12 months or more (1,000s) .........................................—Global Innovation Index (rank/142) .......................................................... 127Global Talent Index (rank/60) ......................................................................—Quality of Labour Force (rank/60) ...............................................................—Talent Environment (rank/60) ......................................................................—IQ measure9 ........................................................................................... 67.7

2.1: Country Profiles
98 | The Human Capital Report
Rank/122 Score
Year
s (5
yea
r age
gro
ups)
Percent of total population
0–4
5–9
10–14
15–19
20–24
25–29
30–34
35–39
40–44
45–49
50–54
55–59
60–64
65–69
70–74
75–79
80–84
85–89
90–94
95–99
100+
0 1 2 3 4 5 6 77 6 5 4 3 2 1 0
BhutanHuman Capital Index 2013 88 –0.370
Pillar 1: Education 89 –0.498
Pillar 2: Health and wellness 83 –0.208
Pillar 3: Workforce and employment 74 –0.231
Pillar 4: Enabling environment 85 –0.545
Key Indicators
Total population (1,000s) 716.9
Median age of population 24
GDP per capita PPP (constant 2005, international $) 5,774
GDP growth (annual %) 9.4
Male Female Additional indicators
n Total population n Total population Aged dependency: 6.9%
n Labour force participation n Labour force participation Youth dependency: 45.3%
n Primary and secondary enrolment n Primary and secondary enrolment Male labour force participation, age 65+: 1.1%
Female labour force participation, age 65+: 0.7%
Education and workforce distribution

The Human Capital Report | 99
2.1: Country Profiles
HCI s
core
–2.5
–2.0
–1.5
–1.0
–0.5
0.0
0.5
1.0
1.5
2.0
2.5
Overall Index
Enablingenvironment
Workforce andemployment
Health andwellness
Education
BhutanEmployment types, educational requirements and educational attainment
Percent of population Educational in employment type attainment (%)
Tertiary requirements n/a 8.9
Professionals n/a
Technicians and associate professionals n/a
Secondary requirements n/a 21.4
Clerks n/a
Service workers and shop and market sales workers n/a
Skilled agricultural and fishery workers n/a
Craft and related trade workers n/a
Plant and machine operators and assemblers n/a
Primary requirements n/a 13.4
Elementary occupations n/a
Various n/a
Legislators, senior officials and managers n/a
Unclassified n/a
Armed forces n/a
Spread of scores (by pillar and overall)
Bhutan
Lower-middle income economies
Asia and the Pacific
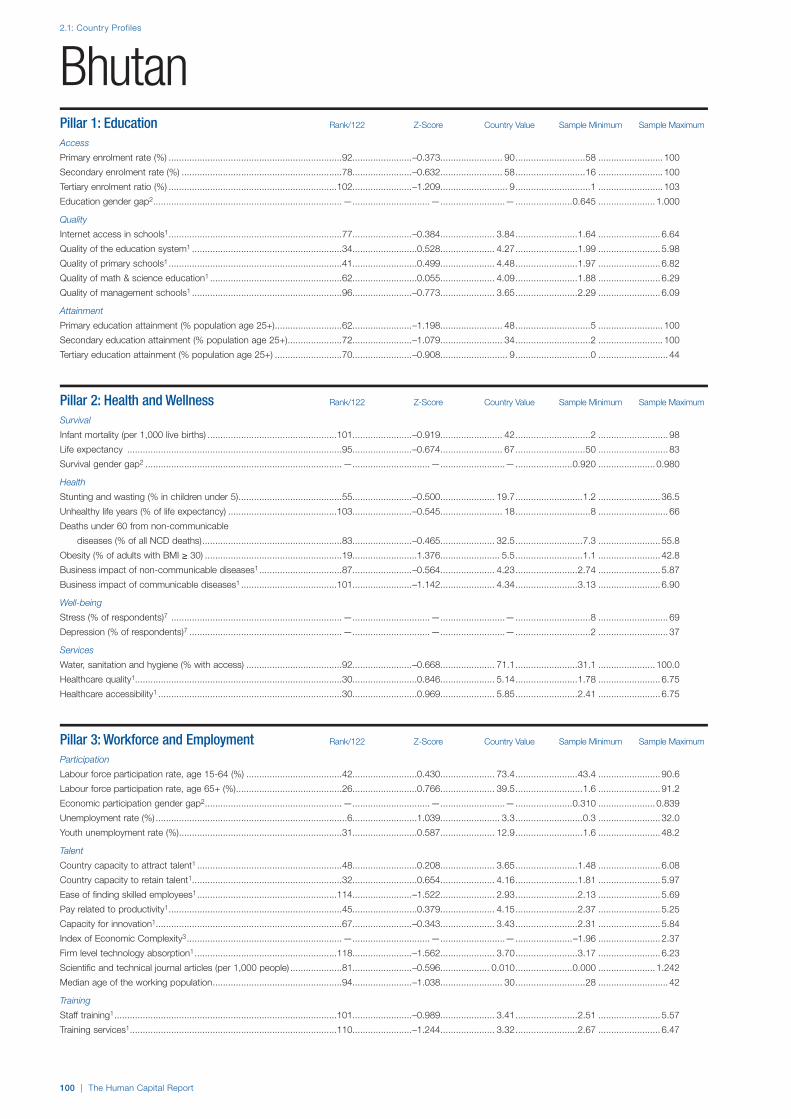
2.1: Country Profiles
100 | The Human Capital Report
Pillar 1: Education Rank/122 Z-Score Country Value Sample Minimum Sample Maximum
Access
Primary enrolment rate (%) ...................................................................92.......................–0.373........................ 90...........................58 ......................... 100
Secondary enrolment rate (%) ..............................................................78.......................–0.632........................ 58...........................16 ......................... 100
Tertiary enrolment ratio (%) .................................................................102.......................–1.209.......................... 9.............................1 ......................... 103
Education gender gap2 .........................................................................—..............................— .........................— ......................0.645 ...................... 1.000
Quality
Internet access in schools1 ...................................................................77.......................–0.384..................... 3.84........................1.64 ........................ 6.64
Quality of the education system1 ..........................................................34.........................0.528..................... 4.27........................1.99 ........................ 5.98
Quality of primary schools1 ...................................................................41.........................0.499..................... 4.48........................1.97 ........................ 6.82
Quality of math & science education1 ...................................................62.........................0.055..................... 4.09........................1.88 ........................ 6.29
Quality of management schools1 ..........................................................96.......................–0.773..................... 3.65........................2.29 ........................ 6.09
Attainment
Primary education attainment (% population age 25+) ..........................62.......................–1.198........................ 48.............................5 ......................... 100
Secondary education attainment (% population age 25+) .....................72.......................–1.079........................ 34.............................2 ......................... 100
Tertiary education attainment (% population age 25+) ..........................70.......................–0.908.......................... 9.............................0 ........................... 44
Pillar 2: Health and Wellness Rank/122 Z-Score Country Value Sample Minimum Sample Maximum
Survival
Infant mortality (per 1,000 live births) ..................................................101.......................–0.919........................ 42.............................2 ........................... 98
Life expectancy ...................................................................................95.......................–0.674........................ 67...........................50 ........................... 83
Survival gender gap2 ............................................................................—..............................—.........................—......................0.920 ...................... 0.980
Health
Stunting and wasting (% in children under 5) ........................................55.......................–0.500..................... 19.7..........................1.2 ........................ 36.5
Unhealthy life years (% of life expectancy) ..........................................103.......................–0.545........................ 18.............................8 ........................... 66
Deaths under 60 from non-communicable
diseases (% of all NCD deaths) ......................................................83.......................–0.465 ..................... 32.5 ..........................7.3 ........................ 55.8
Obesity (% of adults with BMI ≥ 30) .....................................................19.........................1.376....................... 5.5..........................1.1 ........................ 42.8
Business impact of non-communicable diseases1 ................................87.......................–0.564..................... 4.23........................2.74 ........................ 5.87
Business impact of communicable diseases1 .....................................101.......................–1.142..................... 4.34........................3.13 ........................ 6.90
Well-being
Stress (% of respondents)7 ..................................................................—..............................— .........................— .............................8 ........................... 69
Depression (% of respondents)7 ...........................................................—..............................— .........................— .............................2 ........................... 37
Services
Water, sanitation and hygiene (% with access) .....................................92.......................–0.668..................... 71.1........................31.1 ...................... 100.0
Healthcare quality1................................................................................30.........................0.846..................... 5.14........................1.78 ........................ 6.75
Healthcare accessibility1 .......................................................................30.........................0.969..................... 5.85........................2.41 ........................ 6.75
Pillar 3: Workforce and Employment Rank/122 Z-Score Country Value Sample Minimum Sample Maximum
Participation
Labour force participation rate, age 15-64 (%) .....................................42.........................0.430..................... 73.4........................43.4 ........................ 90.6
Labour force participation rate, age 65+ (%) .........................................26.........................0.766..................... 39.5..........................1.6 ........................ 91.2
Economic participation gender gap2 .....................................................—..............................— .........................— ......................0.310 ...................... 0.839
Unemployment rate (%) ..........................................................................6.........................1.039 ....................... 3.3 ..........................0.3 ........................ 32.0
Youth unemployment rate (%) ...............................................................31.........................0.587 ..................... 12.9 ..........................1.6 ........................ 48.2
Talent
Country capacity to attract talent1 ........................................................48.........................0.208..................... 3.65........................1.48 ........................ 6.08
Country capacity to retain talent1..........................................................32.........................0.654..................... 4.16........................1.81 ........................ 5.97
Ease of finding skilled employees1 ......................................................114.......................–1.522..................... 2.93........................2.13 ........................ 5.69
Pay related to productivity1 ...................................................................45.........................0.379..................... 4.15........................2.37 ........................ 5.25
Capacity for innovation1........................................................................67.......................–0.343..................... 3.43........................2.31 ........................ 5.84
Index of Economic Complexity3 ............................................................—..............................— .........................— ......................–1.96 ........................ 2.37
Firm level technology absorption1 .......................................................118.......................–1.562..................... 3.70........................3.17 ........................ 6.23
Scientific and technical journal articles (per 1,000 people) ....................81.......................–0.596................... 0.010......................0.000 ...................... 1.242
Median age of the working population ..................................................94.......................–1.038........................ 30...........................28 ........................... 42
Training
Staff training1 ......................................................................................101.......................–0.989..................... 3.41........................2.51 ........................ 5.57
Training services1 ................................................................................110.......................–1.244..................... 3.32........................2.67 ........................ 6.47
Bhutan

2.1: Country Profiles
NOTESIn the sections for Pillar 1, Pillar 2, Pillar 3 and Pillar 4, values under Country Value, Sample Minimum and Sample Maximum refer to underlying data for each variable.For further details and explanations, please refer to the section “How to Read the Country Profiles”.1 Survey data responses on a 1- to 7-scale (1 = worst score, 7 = best score)2 Data on a 0- to 1-scale (0 = worst score, 1 = best score)3 Data from -1.960 (worst score) to 2.367 (best score)4 Rank number on a list of 185 countries5 Index on a scale of 0 (perfect inequality) to 100 (perfect equality)6 International test scores7 Perception survey data. Percentage of yes responses.8 Score (1 = best, 7 = worst)9 Reported in relation to UK score (100)
The Human Capital Report | 101
BhutanPillar 4: Enabling Environment Rank/122 Z-Score Country Value Sample Minimum Sample Maximum
Infrastructure
Mobile users (per 100 people) ............................................................108.......................–1.220........................ 66...........................17 ......................... 191
Internet users (per 100 people) .............................................................87.......................–0.816........................ 21.............................1 ........................... 95
Quality of domestic transport1 ..............................................................52.........................0.131..................... 4.58........................2.08 ........................ 6.51
Collaboration
State of cluster development1 ..............................................................85.......................–0.593..................... 3.47........................2.33 ........................ 5.49
Business and university R&D collaboration1 ........................................112.......................–1.230..................... 2.68........................2.11 ........................ 5.84
Legal framework
Doing Business Index4 .......................................................................108.......................–1.320...................... 148.............................1 ......................... 180
Social safety net protection1 .................................................................69.......................–0.311..................... 3.44........................2.10 ........................ 6.26
Intellectual property protection and property rights1..............................46.........................0.125 ..................... 4.22 ........................1.62 ........................ 6.31
Social mobility
Social mobility1 .....................................................................................35.........................0.324..................... 4.68........................2.78 ........................ 6.36
Additional indicatorsDemographics Value
Child dependency ratio (%)..................................................................... 45.3Aged dependency ratio (%) ...................................................................... 6.9Fertility rate (births per woman) ................................................................. 2.5Sex ratio at birth (female/male) ............................................................... 0.95Population below age 20 (%) .................................................................. 40.4Population above age 60 (%) .................................................................... 6.7
Education
Public spending on education (% of GDP) ................................................ 4.7Technical/vocational enrolment as % of total
enrolment in secondary school ............................................................. 2Adult literacy (%) ..................................................................................... 52.8Boys not in primary school (%) .................................................................. 11Girls not in primary school (%) ..................................................................... 8Education poverty (% of children age 17-22
with less than 2-4 years schooling) ......................................................—Private enrolment in primary school (% of primary) ................................... 2.9Private enrolment in secondary school (% of secondary) ........................ 10.2PIRLS6 .......................................................................................................—PISA math scores6 .....................................................................................—PISA reading scores6 ..................................................................................—PISA science scores6 .................................................................................—TIMSS 4th grade math6 ..............................................................................—TIMSS 4th grade science6 ..........................................................................—TIMSS 8th grade math6 ..............................................................................—TIMSS 8th grade science6 ..........................................................................—
Health
Prevalence of visual impairment (%) .......................................................... 5.2Public spending on health (% of GDP) ...................................................... 4.1Business impact of heart disease1 .......................................................... 4.36Business impact of cancer1 .................................................................... 4.53Business impact of mental illness1 .......................................................... 4.46Business impact of diabetes1 ................................................................. 3.59Business impact of chronic respiratory disease1 ..................................... 4.20Business impact of HIV/AIDS1 ................................................................ 4.41Business impact of tuberculosis1 ............................................................ 4.26Business impact of malaria1 ................................................................... 4.36
Society Value
Freedom in the World8................................................................................. 4Democracy Index (rank/165) .................................................................... 107Population living in urban area (%) .......................................................... 36.3Gini Index (income)5................................................................................ 38.1Accessibility of digital content1 ............................................................... 4.73Extent of virtual social networks use1 ..................................................... 5.09
Workforce
Economic activity (agriculture) — % of total activity ................................ 60.1Economic activity (industry) — % of total activity ...................................... 9.2Economic activity (services) — % of total activity .................................... 30.6GDP per person employed (US$) ...............................................................—Cooperation in labour-employer relations1 .............................................. 4.23Emigration rate of the tertiary educated (%) .............................................. 0.6Labour force with tertiary education (%) .....................................................—Number of patent applications (per 1,000 people) ......................................—Hiring and firing practices1 ...................................................................... 3.93Retirement age, male .................................................................................—Retirement age, female ...............................................................................—Number of informal sector workers (1,000s) ...............................................—Total employed (1,000s) .......................................................................... 321Total unemployed (1,000s) ......................................................................... 11Unemployment for 12 months or more
as a % of total unemployment .............................................................—Total youth not in education or employment (1,000s) .................................—Unemployment for 12 months or more (1,000s) .........................................—Global Innovation Index (rank/142) .............................................................—Global Talent Index (rank/60) ......................................................................—Quality of Labour Force (rank/60) ...............................................................—Talent Environment (rank/60) ......................................................................—IQ measure9 ........................................................................................... 84.2

2.1: Country Profiles
102 | The Human Capital Report
Rank/122 Score
Year
s (5
yea
r age
gro
ups)
Percent of total population
0–4
5–9
10–14
15–19
20–24
25–29
30–34
35–39
40–44
45–49
50–54
55–59
60–64
65–69
70–74
75–79
80–84
85–89
90–94
95–99
100+
0 1 2 3 4 5 6 77 6 5 4 3 2 1 0
BoliviaHuman Capital Index 2013 99 –0.552
Pillar 1: Education 86 –0.409
Pillar 2: Health and wellness 113 –0.878
Pillar 3: Workforce and employment 69 –0.185
Pillar 4: Enabling environment 97 –0.736
Key Indicators
Total population (1,000s) 10,156.6
Median age of population 22
GDP per capita PPP (constant 2005, international $) 4,552
GDP growth (annual %) 5.2
Male Female Additional indicators
n Total population n Total population Aged dependency: 7.9%
n Labour force participation n Labour force participation Youth dependency: 60.8%
n Primary and secondary enrolment n Primary and secondary enrolment Male labour force participation, age 65+: 1.8%
Female labour force participation, age 65+: 1.3%
Education and workforce distribution

The Human Capital Report | 103
2.1: Country Profiles
HCI s
core
–2.5
–2.0
–1.5
–1.0
–0.5
0.0
0.5
1.0
1.5
2.0
2.5
Overall Index
Enablingenvironment
Workforce andemployment
Health andwellness
Education
BoliviaEmployment types, educational requirements and educational attainment
Percent of population Educational in employment type attainment (%)
Tertiary requirements 9.0 22.7
Professionals 4.8
Technicians and associate professionals 4.1
Secondary requirements 53.7 24.1
Clerks 2.5
Service workers and shop and market sales workers 10.7
Skilled agricultural and fishery workers 24.4
Craft and related trade workers 11.7
Plant and machine operators and assemblers 4.4
Primary requirements 7.8 4.7
Elementary occupations 7.8
Various 1.4
Legislators, senior officials and managers 1.3
Unclassified n/a
Armed forces 0.1
Spread of scores (by pillar and overall)
Bolivia
Lower-middle income economies
Latin America and the Carribean

2.1: Country Profiles
104 | The Human Capital Report
Pillar 1: Education Rank/122 Z-Score Country Value Sample Minimum Sample Maximum
Access
Primary enrolment rate (%) ...................................................................87.......................–0.239........................ 91...........................58 ......................... 100
Secondary enrolment rate (%) ..............................................................68.......................–0.099........................ 70...........................16 ......................... 100
Tertiary enrolment ratio (%) ...................................................................59.......................–0.073........................ 39.............................1 ......................... 103
Education gender gap2 .........................................................................90.........................0.056................... 0.963......................0.645 ...................... 1.000
Quality
Internet access in schools1 ...................................................................88.......................–0.632..................... 3.53........................1.64 ........................ 6.64
Quality of the education system1 ..........................................................75.......................–0.412..................... 3.43........................1.99 ........................ 5.98
Quality of primary schools1 ...................................................................85.......................–0.587..................... 3.30........................1.97 ........................ 6.82
Quality of math & science education1 ...................................................83.......................–0.447..................... 3.61........................1.88 ........................ 6.29
Quality of management schools1 ........................................................110.......................–1.179..................... 3.31........................2.29 ........................ 6.09
Attainment
Primary education attainment (% population age 25+) ..........................60.......................–1.041........................ 52.............................5 ......................... 100
Secondary education attainment (% population age 25+) .....................61.......................–0.610........................ 47.............................2 ......................... 100
Tertiary education attainment (% population age 25+) ..........................31.........................0.350........................ 23.............................0 ........................... 44
Pillar 2: Health and Wellness Rank/122 Z-Score Country Value Sample Minimum Sample Maximum
Survival
Infant mortality (per 1,000 live births) ....................................................99.......................–0.784........................ 39.............................2 ........................... 98
Life expectancy ...................................................................................95.......................–0.674........................ 67...........................50 ........................... 83
Survival gender gap2 ............................................................................74.........................0.080................... 0.972......................0.920 ...................... 0.980
Health
Stunting and wasting (% in children under 5) ........................................38.........................0.115..................... 14.3..........................1.2 ........................ 36.5
Unhealthy life years (% of life expectancy) ............................................58.........................0.199........................ 13.............................8 ........................... 66
Deaths under 60 from non-communicable
diseases (% of all NCD deaths) ......................................................68.......................–0.111 ..................... 28.0 ..........................7.3 ........................ 55.8
Obesity (% of adults with BMI ≥ 30) .....................................................54.......................–0.038..................... 18.9..........................1.1 ........................ 42.8
Business impact of non-communicable diseases1 ..............................122.......................–3.868..................... 2.74........................2.74 ........................ 5.87
Business impact of communicable diseases1 .....................................120.......................–2.083..................... 3.41........................3.13 ........................ 6.90
Well-being
Stress (% of respondents)7 ................................................................103.......................–1.103........................ 45.............................8 ........................... 69
Depression (% of respondents)7 .........................................................103.......................–1.456........................ 21.............................2 ........................... 37
Services
Water, sanitation and hygiene (% with access) .....................................98.......................–0.878..................... 67.0........................31.1 ...................... 100.0
Healthcare quality1................................................................................79.......................–0.621..................... 3.35........................1.78 ........................ 6.75
Healthcare accessibility1 .....................................................................103.......................–1.075..................... 3.35........................2.41 ........................ 6.75
Pillar 3: Workforce and Employment Rank/122 Z-Score Country Value Sample Minimum Sample Maximum
Participation
Labour force participation rate, age 15-64 (%) .....................................39.........................0.482..................... 73.9........................43.4 ........................ 90.6
Labour force participation rate, age 65+ (%) .........................................14.........................1.401..................... 51.8..........................1.6 ........................ 91.2
Economic participation gender gap2 .....................................................71.......................–0.060................... 0.637......................0.310 ...................... 0.839
Unemployment rate (%) ..........................................................................8.........................1.035....................... 3.3..........................0.3 ........................ 32.0
Youth unemployment rate (%) ...............................................................—..............................— .........................— ..........................1.6 ........................ 48.2
Talent
Country capacity to attract talent1 ........................................................66.......................–0.135..................... 3.30........................1.48 ........................ 6.08
Country capacity to retain talent1..........................................................41.........................0.415..................... 3.93........................1.81 ........................ 5.97
Ease of finding skilled employees1 ........................................................58.......................–0.031..................... 3.96........................2.13 ........................ 5.69
Pay related to productivity1 ...................................................................72.......................–0.193..................... 3.80........................2.37 ........................ 5.25
Capacity for innovation1........................................................................60.......................–0.281..................... 3.48........................2.31 ........................ 5.84
Index of Economic Complexity3 ............................................................94.......................–1.097................... –0.94......................–1.96 ........................ 2.37
Firm level technology absorption1 .......................................................109.......................–1.223..................... 3.94........................3.17 ........................ 6.23
Scientific and technical journal articles (per 1,000 people) ....................92.......................–0.613................... 0.005......................0.000 ...................... 1.242
Median age of the working population ..................................................88.......................–0.837........................ 31...........................28 ........................... 42
Training
Staff training1 ........................................................................................97.......................–0.739..................... 3.57........................2.51 ........................ 5.57
Training services1 ..................................................................................97.......................–0.892..................... 3.60........................2.67 ........................ 6.47
Bolivia

2.1: Country Profiles
NOTESIn the sections for Pillar 1, Pillar 2, Pillar 3 and Pillar 4, values under Country Value, Sample Minimum and Sample Maximum refer to underlying data for each variable.For further details and explanations, please refer to the section “How to Read the Country Profiles”.1 Survey data responses on a 1- to 7-scale (1 = worst score, 7 = best score)2 Data on a 0- to 1-scale (0 = worst score, 1 = best score)3 Data from -1.960 (worst score) to 2.367 (best score)4 Rank number on a list of 185 countries5 Index on a scale of 0 (perfect inequality) to 100 (perfect equality)6 International test scores7 Perception survey data. Percentage of yes responses.8 Score (1 = best, 7 = worst)9 Reported in relation to UK score (100)
The Human Capital Report | 105
BoliviaPillar 4: Enabling Environment Rank/122 Z-Score Country Value Sample Minimum Sample Maximum
Infrastructure
Mobile users (per 100 people) ..............................................................97.......................–0.713........................ 83...........................17 ......................... 191
Internet users (per 100 people) .............................................................81.......................–0.494........................ 30.............................1 ........................... 95
Quality of domestic transport1 ............................................................107.......................–1.067..................... 3.54........................2.08 ........................ 6.51
Collaboration
State of cluster development1 ..............................................................77.......................–0.484..................... 3.55........................2.33 ........................ 5.49
Business and university R&D collaboration1 ..........................................61.......................–0.260 ..................... 3.55 ........................2.11 ........................ 5.84
Legal framework
Doing Business Index4 .......................................................................112.......................–1.455...................... 155.............................1 ......................... 180
Social safety net protection1 .................................................................72.......................–0.417..................... 3.33........................2.10 ........................ 6.26
Intellectual property protection and property rights1..............................98.......................–0.877 ..................... 3.19 ........................1.62 ........................ 6.31
Social mobility
Social mobility1 ...................................................................................100.......................–0.855..................... 3.62........................2.78 ........................ 6.36
Additional indicatorsDemographics Value
Child dependency ratio (%)..................................................................... 60.8Aged dependency ratio (%) ...................................................................... 7.9Fertility rate (births per woman) ................................................................. 3.5Sex ratio at birth (female/male) ............................................................... 0.95Population below age 20 (%) .................................................................. 46.9Population above age 60 (%) .................................................................... 7.1
Education
Public spending on education (% of GDP) ................................................ 7.6Technical/vocational enrolment as % of total
enrolment in secondary school ............................................................. 5Adult literacy (%) ..................................................................................... 91.2Boys not in primary school (%) .................................................................... 9Girls not in primary school (%) ..................................................................... 9Education poverty (% of children age 17-22
with less than 2-4 years schooling) ................................................ 0.078Private enrolment in primary school (% of primary) ................................... 8.3Private enrolment in secondary school (% of secondary) ........................ 13.5PIRLS6 .......................................................................................................—PISA math scores6 .....................................................................................—PISA reading scores6 ..................................................................................—PISA science scores6 .................................................................................—TIMSS 4th grade math6 ..............................................................................—TIMSS 4th grade science6 ..........................................................................—TIMSS 8th grade math6 ..............................................................................—TIMSS 8th grade science6 ..........................................................................—
Health
Prevalence of visual impairment (%) .......................................................... 4.3Public spending on health (% of GDP) ...................................................... 4.9Business impact of heart disease1 .......................................................... 2.65Business impact of cancer1 .................................................................... 2.57Business impact of mental illness1 .......................................................... 2.88Business impact of diabetes1 ................................................................. 2.82Business impact of chronic respiratory disease1 ..................................... 2.80Business impact of HIV/AIDS1 ................................................................ 3.13Business impact of tuberculosis1 ............................................................ 3.16Business impact of malaria1 ................................................................... 3.93
Society Value
Freedom in the World8................................................................................. 3Democracy Index (rank/165) ...................................................................... 85Population living in urban area (%) .......................................................... 67.2Gini Index (income)5................................................................................ 56.3Accessibility of digital content1 ............................................................... 3.70Extent of virtual social networks use1 ..................................................... 3.78
Workforce
Economic activity (agriculture) — % of total activity ................................ 32.1Economic activity (industry) — % of total activity .................................... 20.0Economic activity (services) — % of total activity .................................... 47.9GDP per person employed (US$) ......................................................... 8,244Cooperation in labour-employer relations1 .............................................. 3.86Emigration rate of the tertiary educated (%) .............................................. 5.8Labour force with tertiary education (%) ................................................. 15.2Number of patent applications (per 1,000 people) ......................................—Hiring and firing practices1 ...................................................................... 3.59Retirement age, male ................................................................................ 65Retirement age, female .............................................................................. 65Number of informal sector workers (1,000s) ......................................... 2,069Total employed (1,000s) ....................................................................... 5,011Total unemployed (1,000s) ....................................................................... 172Unemployment for 12 months or more
as a % of total unemployment .............................................................—Total youth not in education or employment (1,000s) .................................—Unemployment for 12 months or more (1,000s) .........................................—Global Innovation Index (rank/142) ............................................................ 95Global Talent Index (rank/60) ......................................................................—Quality of Labour Force (rank/60) ...............................................................—Talent Environment (rank/60) ......................................................................—IQ measure9 ........................................................................................... 87.0

2.1: Country Profiles
106 | The Human Capital Report
Rank/122 Score
Year
s (5
yea
r age
gro
ups)
Percent of total population
0–4
5–9
10–14
15–19
20–24
25–29
30–34
35–39
40–44
45–49
50–54
55–59
60–64
65–69
70–74
75–79
80–84
85–89
90–94
95–99
100+
0 1 2 3 4 5 66 5 4 3 2 1 0
BotswanaHuman Capital Index 2013 79 –0.291
Pillar 1: Education 85 –0.386
Pillar 2: Health and wellness 86 –0.270
Pillar 3: Workforce and employment 93 –0.416
Pillar 4: Enabling environment 59 –0.090
Key Indicators
Total population (1,000s) 1,969.3
Median age of population 22
GDP per capita PPP (constant 2005, international $) 14,639
GDP growth (annual %) 6.1
Male Female Additional indicators
n Total population n Total population Aged dependency: 5.6%
n Labour force participation n Labour force participation Youth dependency: 55.0%
n Primary and secondary enrolment n Primary and secondary enrolment Male labour force participation, age 65+: 0.9%
Female labour force participation, age 65+: 0.7%
Education and workforce distribution
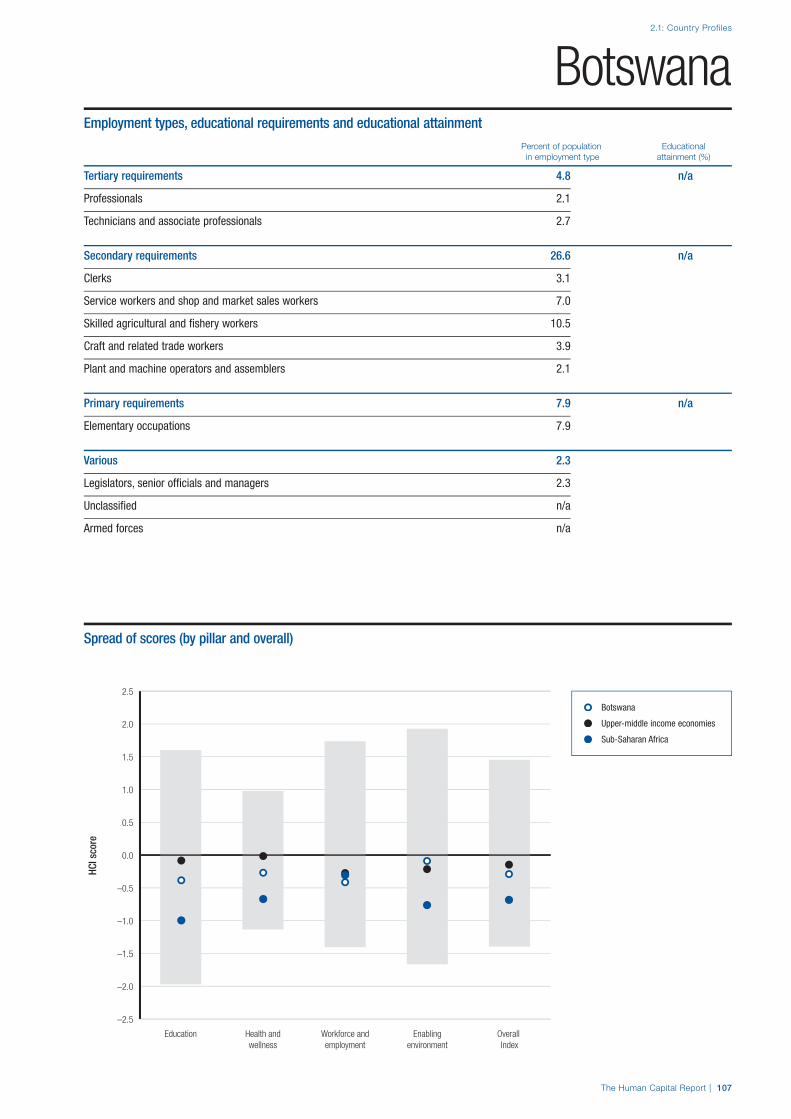
The Human Capital Report | 107
2.1: Country Profiles
HCI s
core
–2.5
–2.0
–1.5
–1.0
–0.5
0.0
0.5
1.0
1.5
2.0
2.5
Overall Index
Enablingenvironment
Workforce andemployment
Health andwellness
Education
BotswanaEmployment types, educational requirements and educational attainment
Percent of population Educational in employment type attainment (%)
Tertiary requirements 4.8 n/a
Professionals 2.1
Technicians and associate professionals 2.7
Secondary requirements 26.6 n/a
Clerks 3.1
Service workers and shop and market sales workers 7.0
Skilled agricultural and fishery workers 10.5
Craft and related trade workers 3.9
Plant and machine operators and assemblers 2.1
Primary requirements 7.9 n/a
Elementary occupations 7.9
Various 2.3
Legislators, senior officials and managers 2.3
Unclassified n/a
Armed forces n/a
Spread of scores (by pillar and overall)
Botswana
Upper-middle income economies
Sub-Saharan Africa
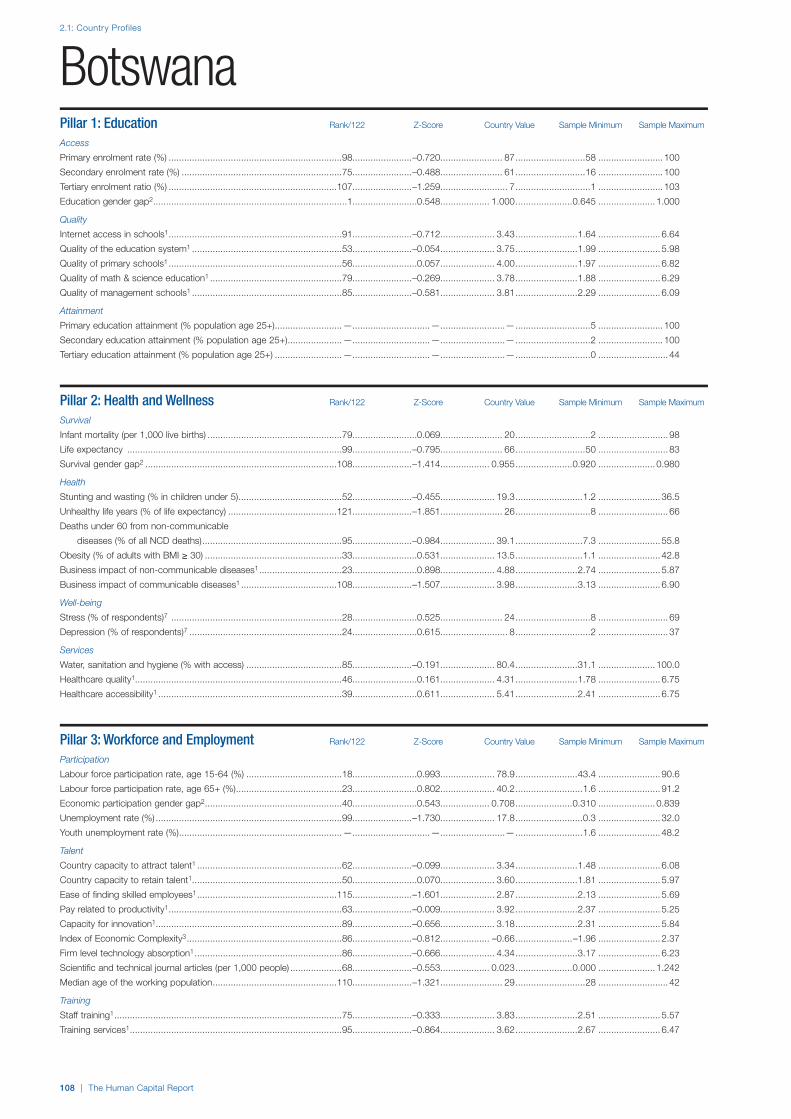
2.1: Country Profiles
108 | The Human Capital Report
Pillar 1: Education Rank/122 Z-Score Country Value Sample Minimum Sample Maximum
Access
Primary enrolment rate (%) ...................................................................98.......................–0.720........................ 87...........................58 ......................... 100
Secondary enrolment rate (%) ..............................................................75.......................–0.488........................ 61...........................16 ......................... 100
Tertiary enrolment ratio (%) .................................................................107.......................–1.259.......................... 7.............................1 ......................... 103
Education gender gap2 ...........................................................................1.........................0.548................... 1.000......................0.645 ...................... 1.000
Quality
Internet access in schools1 ...................................................................91.......................–0.712..................... 3.43........................1.64 ........................ 6.64
Quality of the education system1 ..........................................................53.......................–0.054..................... 3.75........................1.99 ........................ 5.98
Quality of primary schools1 ...................................................................56.........................0.057..................... 4.00........................1.97 ........................ 6.82
Quality of math & science education1 ...................................................79.......................–0.269..................... 3.78........................1.88 ........................ 6.29
Quality of management schools1 ..........................................................85.......................–0.581..................... 3.81........................2.29 ........................ 6.09
Attainment
Primary education attainment (% population age 25+) ..........................—..............................— .........................— .............................5 ......................... 100
Secondary education attainment (% population age 25+) .....................—..............................— .........................— .............................2 ......................... 100
Tertiary education attainment (% population age 25+) ..........................—..............................— .........................— .............................0 ........................... 44
Pillar 2: Health and Wellness Rank/122 Z-Score Country Value Sample Minimum Sample Maximum
Survival
Infant mortality (per 1,000 live births) ....................................................79.........................0.069........................ 20.............................2 ........................... 98
Life expectancy ...................................................................................99.......................–0.795........................ 66...........................50 ........................... 83
Survival gender gap2 ..........................................................................108.......................–1.414................... 0.955......................0.920 ...................... 0.980
Health
Stunting and wasting (% in children under 5) ........................................52.......................–0.455..................... 19.3..........................1.2 ........................ 36.5
Unhealthy life years (% of life expectancy) ..........................................121.......................–1.851........................ 26.............................8 ........................... 66
Deaths under 60 from non-communicable
diseases (% of all NCD deaths) ......................................................95.......................–0.984 ..................... 39.1 ..........................7.3 ........................ 55.8
Obesity (% of adults with BMI ≥ 30) .....................................................33.........................0.531..................... 13.5..........................1.1 ........................ 42.8
Business impact of non-communicable diseases1 ................................23.........................0.898..................... 4.88........................2.74 ........................ 5.87
Business impact of communicable diseases1 .....................................108.......................–1.507..................... 3.98........................3.13 ........................ 6.90
Well-being
Stress (% of respondents)7 ..................................................................28.........................0.525........................ 24.............................8 ........................... 69
Depression (% of respondents)7 ...........................................................24.........................0.615.......................... 8.............................2 ........................... 37
Services
Water, sanitation and hygiene (% with access) .....................................85.......................–0.191..................... 80.4........................31.1 ...................... 100.0
Healthcare quality1................................................................................46.........................0.161..................... 4.31........................1.78 ........................ 6.75
Healthcare accessibility1 .......................................................................39.........................0.611..................... 5.41........................2.41 ........................ 6.75
Pillar 3: Workforce and Employment Rank/122 Z-Score Country Value Sample Minimum Sample Maximum
Participation
Labour force participation rate, age 15-64 (%) .....................................18.........................0.993..................... 78.9........................43.4 ........................ 90.6
Labour force participation rate, age 65+ (%) .........................................23.........................0.802..................... 40.2..........................1.6 ........................ 91.2
Economic participation gender gap2 .....................................................40.........................0.543................... 0.708......................0.310 ...................... 0.839
Unemployment rate (%) ........................................................................99.......................–1.730..................... 17.8..........................0.3 ........................ 32.0
Youth unemployment rate (%) ...............................................................—..............................— .........................— ..........................1.6 ........................ 48.2
Talent
Country capacity to attract talent1 ........................................................62.......................–0.099..................... 3.34........................1.48 ........................ 6.08
Country capacity to retain talent1..........................................................50.........................0.070..................... 3.60........................1.81 ........................ 5.97
Ease of finding skilled employees1 ......................................................115.......................–1.601..................... 2.87........................2.13 ........................ 5.69
Pay related to productivity1 ...................................................................63.......................–0.009..................... 3.92........................2.37 ........................ 5.25
Capacity for innovation1........................................................................89.......................–0.656..................... 3.18........................2.31 ........................ 5.84
Index of Economic Complexity3 ............................................................86.......................–0.812................... –0.66......................–1.96 ........................ 2.37
Firm level technology absorption1 .........................................................86.......................–0.666..................... 4.34........................3.17 ........................ 6.23
Scientific and technical journal articles (per 1,000 people) ....................68.......................–0.553................... 0.023......................0.000 ...................... 1.242
Median age of the working population ................................................110.......................–1.321........................ 29...........................28 ........................... 42
Training
Staff training1 ........................................................................................75.......................–0.333..................... 3.83........................2.51 ........................ 5.57
Training services1 ..................................................................................95.......................–0.864..................... 3.62........................2.67 ........................ 6.47
Botswana

2.1: Country Profiles
NOTESIn the sections for Pillar 1, Pillar 2, Pillar 3 and Pillar 4, values under Country Value, Sample Minimum and Sample Maximum refer to underlying data for each variable.For further details and explanations, please refer to the section “How to Read the Country Profiles”.1 Survey data responses on a 1- to 7-scale (1 = worst score, 7 = best score)2 Data on a 0- to 1-scale (0 = worst score, 1 = best score)3 Data from -1.960 (worst score) to 2.367 (best score)4 Rank number on a list of 185 countries5 Index on a scale of 0 (perfect inequality) to 100 (perfect equality)6 International test scores7 Perception survey data. Percentage of yes responses.8 Score (1 = best, 7 = worst)9 Reported in relation to UK score (100)
The Human Capital Report | 109
BotswanaPillar 4: Enabling Environment Rank/122 Z-Score Country Value Sample Minimum Sample Maximum
Infrastructure
Mobile users (per 100 people) ..............................................................16.........................1.051...................... 143...........................17 ......................... 191
Internet users (per 100 people) ...........................................................108.......................–1.315.......................... 7.............................1 ........................... 95
Quality of domestic transport1 ..............................................................90.......................–0.624 ..................... 3.93 ........................2.08 ........................ 6.51
Collaboration
State of cluster development1 ..............................................................76.......................–0.442..................... 3.58........................2.33 ........................ 5.49
Business and university R&D collaboration1 ..........................................89.......................–0.618 ..................... 3.23 ........................2.11 ........................ 5.84
Legal framework
Doing Business Index4 .........................................................................50.........................0.406........................ 59.............................1 ......................... 180
Social safety net protection1 .................................................................60.......................–0.176..................... 3.59........................2.10 ........................ 6.26
Intellectual property protection and property rights1..............................38.........................0.403 ..................... 4.50 ........................1.62 ........................ 6.31
Social mobility
Social mobility1 .....................................................................................31.........................0.502..................... 4.84........................2.78 ........................ 6.36
Additional indicatorsDemographics Value
Child dependency ratio (%)..................................................................... 55.0Aged dependency ratio (%) ...................................................................... 5.6Fertility rate (births per woman) ................................................................. 2.9Sex ratio at birth (female/male) ............................................................... 0.97Population below age 20 (%) .................................................................. 45.5Population above age 60 (%) .................................................................... 5.3
Education
Public spending on education (% of GDP) ................................................ 7.8Technical/vocational enrolment as % of total
enrolment in secondary school ............................................................. 5Adult literacy (%) ..................................................................................... 85.1Boys not in primary school (%) .................................................................. 13Girls not in primary school (%) ................................................................... 12Education poverty (% of children age 17-22
with less than 2-4 years schooling) ......................................................—Private enrolment in primary school (% of primary) ................................... 5.8Private enrolment in secondary school (% of secondary) .......................... 3.0PIRLS6 .......................................................................................................—PISA math scores6 .....................................................................................—PISA reading scores6 ..................................................................................—PISA science scores6 .................................................................................—TIMSS 4th grade math6 ..............................................................................—TIMSS 4th grade science6 ..........................................................................—TIMSS 8th grade math6 ..............................................................................—TIMSS 8th grade science6 ..........................................................................—
Health
Prevalence of visual impairment (%) .......................................................... 3.3Public spending on health (% of GDP) ...................................................... 5.1Business impact of heart disease1 .......................................................... 4.86Business impact of cancer1 .................................................................... 4.63Business impact of mental illness1 .......................................................... 5.26Business impact of diabetes1 ................................................................. 4.75Business impact of chronic respiratory disease1 ..................................... 4.91Business impact of HIV/AIDS1 ................................................................ 3.03Business impact of tuberculosis1 ............................................................ 3.73Business impact of malaria1 ................................................................... 5.18
Society Value
Freedom in the World8................................................................................. 3Democracy Index (rank/165) ...................................................................... 30Population living in urban area (%) .......................................................... 62.3Gini Index (income)5................................................................................ 61.0Accessibility of digital content1 ............................................................... 4.52Extent of virtual social networks use1 ..................................................... 5.43
Workforce
Economic activity (agriculture) — % of total activity ....................................—Economic activity (industry) — % of total activity ........................................—Economic activity (services) — % of total activity ........................................—GDP per person employed (US$) ...............................................................—Cooperation in labour-employer relations1 .............................................. 3.99Emigration rate of the tertiary educated (%) .............................................. 5.1Labour force with tertiary education (%) ................................................... 0.0Number of patent applications (per 1,000 people) ......................................—Hiring and firing practices1 ...................................................................... 3.46Retirement age, male .................................................................................—Retirement age, female ...............................................................................—Number of informal sector workers (1,000s) ...............................................—Total employed (1,000s) .......................................................................... 584Total unemployed (1,000s) ....................................................................... 126Unemployment for 12 months or more
as a % of total unemployment .............................................................—Total youth not in education or employment (1,000s) .................................—Unemployment for 12 months or more (1,000s) .........................................—Global Innovation Index (rank/142) ............................................................ 91Global Talent Index (rank/60) ......................................................................—Quality of Labour Force (rank/60) ...............................................................—Talent Environment (rank/60) ......................................................................—IQ measure9 ........................................................................................... 77.2

2.1: Country Profiles
110 | The Human Capital Report
Rank/122 Score
Year
s (5
yea
r age
gro
ups)
Percent of total population
0–4
5–9
10–14
15–19
20–24
25–29
30–34
35–39
40–44
45–49
50–54
55–59
60–64
65–69
70–74
75–79
80–84
85–89
90–94
95–99
100+
0 1 2 3 4 55 4 3 2 1 0
BrazilHuman Capital Index 2013 57 –0.054
Pillar 1: Education 88 –0.497
Pillar 2: Health and wellness 49 0.150
Pillar 3: Workforce and employment 45 0.078
Pillar 4: Enabling environment 52 0.054
Key Indicators
Total population (1,000s) 195,210.2
Median age of population 29
GDP per capita PPP (constant 2005, international $) 10,264
GDP growth (annual %) 0.9
Male Female Additional indicators
n Total population n Total population Aged dependency: 10.2%
n Labour force participation n Labour force participation Youth dependency: 37.7%
n Primary and secondary enrolment n Primary and secondary enrolment Male labour force participation, age 65+: 1.1%
Female labour force participation, age 65+: 0.6%
Education and workforce distribution

The Human Capital Report | 111
2.1: Country Profiles
HCI s
core
–2.5
–2.0
–1.5
–1.0
–0.5
0.0
0.5
1.0
1.5
2.0
2.5
Overall Index
Enablingenvironment
Workforce andemployment
Health andwellness
Education
BrazilEmployment types, educational requirements and educational attainment
Percent of population Educational in employment type attainment (%)
Tertiary requirements 9.0 11.3
Professionals 4.2
Technicians and associate professionals 4.8
Secondary requirements 38.9 39.2
Clerks 5.1
Service workers and shop and market sales workers 9.3
Skilled agricultural and fishery workers 11.1
Craft and related trade workers 7.4
Plant and machine operators and assemblers 5.8
Primary requirements 11.1 n/a
Elementary occupations 11.1
Various 3.5
Legislators, senior officials and managers 3.1
Unclassified 0.0
Armed forces 0.4
Spread of scores (by pillar and overall)
Brazil
Upper-middle income economies
Latin America and the Carribean

2.1: Country Profiles
112 | The Human Capital Report
Pillar 1: Education Rank/122 Z-Score Country Value Sample Minimum Sample Maximum
Access
Primary enrolment rate (%) ...................................................................69.........................0.268........................ 96...........................58 ......................... 100
Secondary enrolment rate (%) ..............................................................—..............................— .........................— ...........................16 ......................... 100
Tertiary enrolment ratio (%) ...................................................................76.......................–0.567........................ 26.............................1 ......................... 103
Education gender gap2 ...........................................................................1.........................0.548................... 1.000......................0.645 ...................... 1.000
Quality
Internet access in schools1 ...................................................................86.......................–0.576..................... 3.60........................1.64 ........................ 6.64
Quality of the education system1 ........................................................105.......................–0.915..................... 2.98........................1.99 ........................ 5.98
Quality of primary schools1 .................................................................109.......................–1.314..................... 2.51........................1.97 ........................ 6.82
Quality of math & science education1 .................................................112.......................–1.545..................... 2.56........................1.88 ........................ 6.29
Quality of management schools1 ..........................................................43.........................0.292..................... 4.54........................2.29 ........................ 6.09
Attainment
Primary education attainment (% population age 25+) ..........................—..............................— .........................— .............................5 ......................... 100
Secondary education attainment (% population age 25+) .....................57.......................–0.472........................ 50.............................2 ......................... 100
Tertiary education attainment (% population age 25+) ..........................64.......................–0.693........................ 11.............................0 ........................... 44
Pillar 2: Health and Wellness Rank/122 Z-Score Country Value Sample Minimum Sample Maximum
Survival
Infant mortality (per 1,000 live births) ....................................................64.........................0.338........................ 14.............................2 ........................... 98
Life expectancy ...................................................................................59.........................0.177........................ 74...........................50 ........................... 83
Survival gender gap2 ..............................................................................1.........................0.751................... 0.980......................0.920 ...................... 0.980
Health
Stunting and wasting (% in children under 5) ..........................................7.........................1.248....................... 4.4..........................1.2 ........................ 36.5
Unhealthy life years (% of life expectancy) ............................................59.........................0.186........................ 14.............................8 ........................... 66
Deaths under 60 from non-communicable
diseases (% of all NCD deaths) ......................................................71.......................–0.190 ..................... 29.0 ..........................7.3 ........................ 55.8
Obesity (% of adults with BMI ≥ 30) .....................................................58.......................–0.102..................... 19.5..........................1.1 ........................ 42.8
Business impact of non-communicable diseases1 ................................50.........................0.255..................... 4.60........................2.74 ........................ 5.87
Business impact of communicable diseases1 .......................................53.........................0.382..................... 5.86........................3.13 ........................ 6.90
Well-being
Stress (% of respondents)7 ..................................................................59.......................–0.095........................ 32.............................8 ........................... 69
Depression (% of respondents)7 ...........................................................18.........................0.775.......................... 7.............................2 ........................... 37
Services
Water, sanitation and hygiene (% with access) .....................................71.........................0.256..................... 89.1........................31.1 ...................... 100.0
Healthcare quality1..............................................................................102.......................–0.982..................... 2.91........................1.78 ........................ 6.75
Healthcare accessibility1 .......................................................................93.......................–0.899..................... 3.56........................2.41 ........................ 6.75
Pillar 3: Workforce and Employment Rank/122 Z-Score Country Value Sample Minimum Sample Maximum
Participation
Labour force participation rate, age 15-64 (%) .....................................33.........................0.574..................... 74.8........................43.4 ........................ 90.6
Labour force participation rate, age 65+ (%) .........................................50.......................–0.106..................... 22.6..........................1.6 ........................ 91.2
Economic participation gender gap2 .....................................................66.........................0.053................... 0.650......................0.310 ...................... 0.839
Unemployment rate (%) ........................................................................65.........................0.078....................... 8.3..........................0.3 ........................ 32.0
Youth unemployment rate (%) ...............................................................55.........................0.083..................... 17.8..........................1.6 ........................ 48.2
Talent
Country capacity to attract talent1 ........................................................44.........................0.284..................... 3.73........................1.48 ........................ 6.08
Country capacity to retain talent1..........................................................34.........................0.593..................... 4.11........................1.81 ........................ 5.97
Ease of finding skilled employees1 ......................................................101.......................–1.062..................... 3.25........................2.13 ........................ 5.69
Pay related to productivity1 ...................................................................83.......................–0.472..................... 3.63........................2.37 ........................ 5.25
Capacity for innovation1........................................................................33.........................0.396..................... 4.02........................2.31 ........................ 5.84
Index of Economic Complexity3 ............................................................48.........................0.127..................... 0.23......................–1.96 ........................ 2.37
Firm level technology absorption1 .........................................................48.........................0.258..................... 5.00........................3.17 ........................ 6.23
Scientific and technical journal articles (per 1,000 people) ....................47.......................–0.416................... 0.064......................0.000 ...................... 1.242
Median age of the working population ..................................................59.......................–0.052........................ 35...........................28 ........................... 42
Training
Staff training1 ........................................................................................38.........................0.404..................... 4.30........................2.51 ........................ 5.57
Training services1 ..................................................................................35.........................0.507..................... 4.71........................2.67 ........................ 6.47
Brazil

2.1: Country Profiles
NOTESIn the sections for Pillar 1, Pillar 2, Pillar 3 and Pillar 4, values under Country Value, Sample Minimum and Sample Maximum refer to underlying data for each variable.For further details and explanations, please refer to the section “How to Read the Country Profiles”.1 Survey data responses on a 1- to 7-scale (1 = worst score, 7 = best score)2 Data on a 0- to 1-scale (0 = worst score, 1 = best score)3 Data from -1.960 (worst score) to 2.367 (best score)4 Rank number on a list of 185 countries5 Index on a scale of 0 (perfect inequality) to 100 (perfect equality)6 International test scores7 Perception survey data. Percentage of yes responses.8 Score (1 = best, 7 = worst)9 Reported in relation to UK score (100)
The Human Capital Report | 113
BrazilPillar 4: Enabling Environment Rank/122 Z-Score Country Value Sample Minimum Sample Maximum
Infrastructure
Mobile users (per 100 people) ..............................................................36.........................0.505...................... 124...........................17 ......................... 191
Internet users (per 100 people) .............................................................56.........................0.041........................ 45.............................1 ........................... 95
Quality of domestic transport1 ..............................................................97.......................–0.778 ..................... 3.79 ........................2.08 ........................ 6.51
Collaboration
State of cluster development1 ..............................................................23.........................0.889..................... 4.53........................2.33 ........................ 5.49
Business and university R&D collaboration1 ..........................................44.........................0.218 ..................... 3.98 ........................2.11 ........................ 5.84
Legal framework
Doing Business Index4 .........................................................................96.......................–0.971...................... 130.............................1 ......................... 180
Social safety net protection1 .................................................................38.........................0.450..................... 4.27........................2.10 ........................ 6.26
Intellectual property protection and property rights1..............................53.......................–0.020 ..................... 4.07 ........................1.62 ........................ 6.31
Social mobility
Social mobility1 .....................................................................................51.........................0.150..................... 4.52........................2.78 ........................ 6.36
Additional indicatorsDemographics Value
Child dependency ratio (%)..................................................................... 37.7Aged dependency ratio (%) .................................................................... 10.2Fertility rate (births per woman) ................................................................. 1.9Sex ratio at birth (female/male) ............................................................... 0.95Population below age 20 (%) .................................................................. 33.9Population above age 60 (%) .................................................................. 10.2
Education
Public spending on education (% of GDP) ................................................ 5.8Technical/vocational enrolment as % of total
enrolment in secondary school ............................................................. 6Adult literacy (%) ..................................................................................... 90.4Boys not in primary school (%) .................................................................... 5Girls not in primary school (%) ..................................................................... 3Education poverty (% of children age 17-22
with less than 2-4 years schooling) ......................................................—Private enrolment in primary school (% of primary) ................................. 14.7Private enrolment in secondary school (% of secondary) ........................ 14.3PIRLS6 .......................................................................................................—PISA math scores6 .................................................................................. 386PISA reading scores6 ............................................................................... 412PISA science scores6 .............................................................................. 405TIMSS 4th grade math6 ..............................................................................—TIMSS 4th grade science6 ..........................................................................—TIMSS 8th grade math6 ..............................................................................—TIMSS 8th grade science6 ..........................................................................—
Health
Prevalence of visual impairment (%) .......................................................... 3.1Public spending on health (% of GDP) ...................................................... 8.9Business impact of heart disease1 .......................................................... 3.96Business impact of cancer1 .................................................................... 4.62Business impact of mental illness1 .......................................................... 5.03Business impact of diabetes1 ................................................................. 4.49Business impact of chronic respiratory disease1 ..................................... 4.87Business impact of HIV/AIDS1 ................................................................ 5.45Business impact of tuberculosis1 ............................................................ 5.96Business impact of malaria1 ................................................................... 6.15
Society Value
Freedom in the World8................................................................................. 2Democracy Index (rank/165) ...................................................................... 44Population living in urban area (%) .......................................................... 84.9Gini Index (income)5................................................................................ 54.7Accessibility of digital content1 ............................................................... 4.70Extent of virtual social networks use1 ..................................................... 6.03
Workforce
Economic activity (agriculture) — % of total activity ................................ 17.0Economic activity (industry) — % of total activity .................................... 22.1Economic activity (services) — % of total activity .................................... 60.7GDP per person employed (US$) ....................................................... 13,690Cooperation in labour-employer relations1 .............................................. 4.14Emigration rate of the tertiary educated (%) .............................................. 2.0Labour force with tertiary education (%) ................................................... 9.3Number of patent applications (per 1,000 people) .............................. 0.1162Hiring and firing practices1 ...................................................................... 3.20Retirement age, male ................................................................................ 60Retirement age, female .............................................................................. 60Number of informal sector workers (1,000s) ....................................... 32,493Total employed (1,000s) ..................................................................... 92,689Total unemployed (1,000s) .................................................................... 8,421Unemployment for 12 months or more
as a % of total unemployment .............................................................—Total youth not in education or employment (1,000s) ........................ 6,157.8Unemployment for 12 months or more (1,000s) .........................................—Global Innovation Index (rank/142) ............................................................ 64Global Talent Index (rank/60) ..................................................................... 42Quality of Labour Force (rank/60) .............................................................. 46Talent Environment (rank/60) ..................................................................... 38IQ measure9 ........................................................................................... 86.0

2.1: Country Profiles
114 | The Human Capital Report
Rank/122 Score
Year
s (5
yea
r age
gro
ups)
Percent of total population
0–4
5–9
10–14
15–19
20–24
25–29
30–34
35–39
40–44
45–49
50–54
55–59
60–64
65–69
70–74
75–79
80–84
85–89
90–94
95–99
100+
0 1 2 3 4 55 4 3 2 1 0
BulgariaHuman Capital Index 2013 56 –0.048
Pillar 1: Education 46 0.282
Pillar 2: Health and wellness 33 0.333
Pillar 3: Workforce and employment 100 –0.496
Pillar 4: Enabling environment 74 –0.311
Key Indicators
Total population (1,000s) 7,389.2
Median age of population 42
GDP per capita PPP (constant 2005, international $) 12,178
GDP growth (annual %) 0.8
Male Female Additional indicators
n Total population n Total population Aged dependency: 26.8%
n Labour force participation n Labour force participation Youth dependency: 19.5%
n Primary and secondary enrolment n Primary and secondary enrolment Male labour force participation, age 65+: 0.4%
Female labour force participation, age 65+: 0.2%
Education and workforce distribution

The Human Capital Report | 115
2.1: Country Profiles
HCI s
core
–2.5
–2.0
–1.5
–1.0
–0.5
0.0
0.5
1.0
1.5
2.0
2.5
Overall Index
Enablingenvironment
Workforce andemployment
Health andwellness
Education
BulgariaEmployment types, educational requirements and educational attainment
Percent of population Educational in employment type attainment (%)
Tertiary requirements 11.8 20.7
Professionals 6.6
Technicians and associate professionals 5.2
Secondary requirements 31.3 72.5
Clerks 3.9
Service workers and shop and market sales workers 8.7
Skilled agricultural and fishery workers 2.5
Craft and related trade workers 8.7
Plant and machine operators and assemblers 7.6
Primary requirements 7.5 n/a
Elementary occupations 7.5
Various 5.0
Legislators, senior officials and managers 3.5
Unclassified 1.5
Armed forces n/a
Spread of scores (by pillar and overall)
Bulgaria
Upper-middle income economies
Europe and Central Asia

2.1: Country Profiles
116 | The Human Capital Report
Pillar 1: Education Rank/122 Z-Score Country Value Sample Minimum Sample Maximum
Access
Primary enrolment rate (%) ...................................................................12.........................0.725...................... 100...........................58 ......................... 100
Secondary enrolment rate (%) ..............................................................45.........................0.453........................ 83...........................16 ......................... 100
Tertiary enrolment ratio (%) ...................................................................39.........................0.620........................ 57.............................1 ......................... 103
Education gender gap2 .........................................................................57.........................0.448................... 0.992......................0.645 ...................... 1.000
Quality
Internet access in schools1 ...................................................................47.........................0.319..................... 4.72........................1.64 ........................ 6.64
Quality of the education system1 ..........................................................77.......................–0.423..................... 3.42........................1.99 ........................ 5.98
Quality of primary schools1 ...................................................................51.........................0.186..................... 4.14........................1.97 ........................ 6.82
Quality of math & science education1 ...................................................52.........................0.253..................... 4.28........................1.88 ........................ 6.29
Quality of management schools1 ..........................................................98.......................–0.785..................... 3.64........................2.29 ........................ 6.09
Attainment
Primary education attainment (% population age 25+) ..........................—..............................— .........................— .............................5 ......................... 100
Secondary education attainment (% population age 25+) .....................16.........................1.137........................ 93.............................2 ......................... 100
Tertiary education attainment (% population age 25+) ..........................36.........................0.168........................ 21.............................0 ........................... 44
Pillar 2: Health and Wellness Rank/122 Z-Score Country Value Sample Minimum Sample Maximum
Survival
Infant mortality (per 1,000 live births) ....................................................52.........................0.473........................ 11.............................2 ........................... 98
Life expectancy ...................................................................................59.........................0.177........................ 74...........................50 ........................... 83
Survival gender gap2 ............................................................................28.........................0.714................... 0.979......................0.920 ...................... 0.980
Health
Stunting and wasting (% in children under 5) ........................................12.........................1.060....................... 6.0..........................1.2 ........................ 36.5
Unhealthy life years (% of life expectancy) ............................................22.........................0.636........................ 11.............................8 ........................... 66
Deaths under 60 from non-communicable
diseases (% of all NCD deaths) ......................................................29.........................0.966 ..................... 14.3 ..........................7.3 ........................ 55.8
Obesity (% of adults with BMI ≥ 30) .....................................................70.......................–0.302..................... 21.4..........................1.1 ........................ 42.8
Business impact of non-communicable diseases1 ................................58.........................0.131..................... 4.54........................2.74 ........................ 5.87
Business impact of communicable diseases1 .......................................43.........................0.623..................... 6.10........................3.13 ........................ 6.90
Well-being
Stress (% of respondents)7 ..................................................................28.........................0.525........................ 24.............................8 ........................... 69
Depression (% of respondents)7 ...........................................................18.........................0.775.......................... 7.............................2 ........................... 37
Services
Water, sanitation and hygiene (% with access) .....................................30.........................0.802..................... 99.7........................31.1 ...................... 100.0
Healthcare quality1..............................................................................113.......................–1.200..................... 2.65........................1.78 ........................ 6.75
Healthcare accessibility1 .......................................................................85.......................–0.719..................... 3.78........................2.41 ........................ 6.75
Pillar 3: Workforce and Employment Rank/122 Z-Score Country Value Sample Minimum Sample Maximum
Participation
Labour force participation rate, age 15-64 (%) .....................................79.......................–0.224..................... 67.0........................43.4 ........................ 90.6
Labour force participation rate, age 65+ (%) .......................................117.......................–1.122....................... 2.9..........................1.6 ........................ 91.2
Economic participation gender gap2 .....................................................45.........................0.445................... 0.696......................0.310 ...................... 0.839
Unemployment rate (%) ........................................................................80.......................–0.279..................... 10.2..........................0.3 ........................ 32.0
Youth unemployment rate (%) ...............................................................76.......................–0.472..................... 23.2..........................1.6 ........................ 48.2
Talent
Country capacity to attract talent1 ......................................................115.......................–1.507..................... 1.89........................1.48 ........................ 6.08
Country capacity to retain talent1........................................................118.......................–1.653..................... 1.93........................1.81 ........................ 5.97
Ease of finding skilled employees1 ......................................................108.......................–1.377..................... 3.03........................2.13 ........................ 5.69
Pay related to productivity1 ...................................................................42.........................0.445..................... 4.19........................2.37 ........................ 5.25
Capacity for innovation1........................................................................90.......................–0.660..................... 3.18........................2.31 ........................ 5.84
Index of Economic Complexity3 ............................................................36.........................0.493..................... 0.58......................–1.96 ........................ 2.37
Firm level technology absorption1 .........................................................98.......................–0.922..................... 4.16........................3.17 ........................ 6.23
Scientific and technical journal articles (per 1,000 people) ....................40.......................–0.303................... 0.097......................0.000 ...................... 1.242
Median age of the working population ..................................................11.........................1.340........................ 41...........................28 ........................... 42
Training
Staff training1 ......................................................................................108.......................–1.261..................... 3.24........................2.51 ........................ 5.57
Training services1 ..................................................................................96.......................–0.877..................... 3.61........................2.67 ........................ 6.47
Bulgaria

2.1: Country Profiles
NOTESIn the sections for Pillar 1, Pillar 2, Pillar 3 and Pillar 4, values under Country Value, Sample Minimum and Sample Maximum refer to underlying data for each variable.For further details and explanations, please refer to the section “How to Read the Country Profiles”.1 Survey data responses on a 1- to 7-scale (1 = worst score, 7 = best score)2 Data on a 0- to 1-scale (0 = worst score, 1 = best score)3 Data from -1.960 (worst score) to 2.367 (best score)4 Rank number on a list of 185 countries5 Index on a scale of 0 (perfect inequality) to 100 (perfect equality)6 International test scores7 Perception survey data. Percentage of yes responses.8 Score (1 = best, 7 = worst)9 Reported in relation to UK score (100)
The Human Capital Report | 117
BulgariaPillar 4: Enabling Environment Rank/122 Z-Score Country Value Sample Minimum Sample Maximum
Infrastructure
Mobile users (per 100 people) ..............................................................18.........................0.988...................... 141...........................17 ......................... 191
Internet users (per 100 people) .............................................................49.........................0.255........................ 51.............................1 ........................... 95
Quality of domestic transport1 ..............................................................72.......................–0.289 ..................... 4.22 ........................2.08 ........................ 6.51
Collaboration
State of cluster development1 ..............................................................95.......................–0.788..................... 3.33........................2.33 ........................ 5.49
Business and university R&D collaboration1 ........................................102.......................–0.832..................... 3.04........................2.11 ........................ 5.84
Legal framework
Doing Business Index4 .........................................................................54.........................0.271........................ 66.............................1 ......................... 180
Social safety net protection1 .................................................................73.......................–0.510..................... 3.23........................2.10 ........................ 6.26
Intellectual property protection and property rights1..............................91.......................–0.782 ..................... 3.29 ........................1.62 ........................ 6.31
Social mobility
Social mobility1 ...................................................................................108.......................–1.113..................... 3.38........................2.78 ........................ 6.36
Additional indicatorsDemographics Value
Child dependency ratio (%)..................................................................... 19.5Aged dependency ratio (%) .................................................................... 26.8Fertility rate (births per woman) ................................................................. 1.4Sex ratio at birth (female/male) ............................................................... 0.94Population below age 20 (%) .................................................................. 18.5Population above age 60 (%) .................................................................. 25.5
Education
Public spending on education (% of GDP) ................................................ 4.1Technical/vocational enrolment as % of total
enrolment in secondary school ........................................................... 30Adult literacy (%) ..................................................................................... 98.4Boys not in primary school (%) .................................................................... 1Girls not in primary school (%) ..................................................................... 1Education poverty (% of children age 17-22
with less than 2-4 years schooling) ......................................................—Private enrolment in primary school (% of primary) ................................... 0.8Private enrolment in secondary school (% of secondary) .......................... 1.1PIRLS6 .................................................................................................... 532PISA math scores6 .................................................................................. 428PISA reading scores6 ............................................................................... 429PISA science scores6 .............................................................................. 439TIMSS 4th grade math6 ..............................................................................—TIMSS 4th grade science6 ..........................................................................—TIMSS 8th grade math6 ..............................................................................—TIMSS 8th grade science6 ..........................................................................—
Health
Prevalence of visual impairment (%) .......................................................... 1.1Public spending on health (% of GDP) ...................................................... 7.3Business impact of heart disease1 .......................................................... 4.13Business impact of cancer1 .................................................................... 4.49Business impact of mental illness1 .......................................................... 4.90Business impact of diabetes1 ................................................................. 4.53Business impact of chronic respiratory disease1 ..................................... 4.65Business impact of HIV/AIDS1 ................................................................ 5.91Business impact of tuberculosis1 ............................................................ 5.83Business impact of malaria1 ................................................................... 6.55
Society Value
Freedom in the World8................................................................................. 2Democracy Index (rank/165) ...................................................................... 54Population living in urban area (%) .......................................................... 73.6Gini Index (income)5................................................................................ 28.2Accessibility of digital content1 ............................................................... 5.22Extent of virtual social networks use1 ..................................................... 5.56
Workforce
Economic activity (agriculture) — % of total activity .................................. 6.8Economic activity (industry) — % of total activity .................................... 33.3Economic activity (services) — % of total activity .................................... 59.9GDP per person employed (US$) ....................................................... 19,198Cooperation in labour-employer relations1 .............................................. 4.06Emigration rate of the tertiary educated (%) .............................................. 9.6Labour force with tertiary education (%) ................................................. 25.8Number of patent applications (per 1,000 people) .............................. 0.0383Hiring and firing practices1 ...................................................................... 3.99Retirement age, male ................................................................................ 62Retirement age, female .............................................................................. 60Number of informal sector workers (1,000s) ...............................................—Total employed (1,000s) ....................................................................... 3,053Total unemployed (1,000s) ....................................................................... 348Unemployment for 12 months or more
as a % of total unemployment ......................................................... 46.5Total youth not in education or employment (1,000s) ........................... 203.6Unemployment for 12 months or more (1,000s) ................................... 161.7Global Innovation Index (rank/142) ............................................................ 41Global Talent Index (rank/60) ..................................................................... 49Quality of Labour Force (rank/60) .............................................................. 43Talent Environment (rank/60) ..................................................................... 39IQ measure9 ........................................................................................... 93.3

2.1: Country Profiles
118 | The Human Capital Report
Rank/122 Score
Year
s (5
yea
r age
gro
ups)
Percent of total population
0–4
5–9
10–14
15–19
20–24
25–29
30–34
35–39
40–44
45–49
50–54
55–59
60–64
65–69
70–74
75–79
80–84
85–89
90–94
95–99
100+
0 2 4 6 8 1010 8 6 4 2 0
Burkina FasoHuman Capital Index 2013 119 –1.077
Pillar 1: Education 121 –1.817
Pillar 2: Health and wellness 116 –0.943
Pillar 3: Workforce and employment 87 –0.374
Pillar 4: Enabling environment 117 –1.173
Key Indicators
Total population (1,000s) 15,540.3
Median age of population 17
GDP per capita PPP (constant 2005, international $) 1,304
GDP growth (annual %) 10.0
Male Female Additional indicators
n Total population n Total population Aged dependency: 4.8%
n Labour force participation n Labour force participation Youth dependency: 89.3%
n Primary and secondary enrolment n Primary and secondary enrolment Male labour force participation, age 65+: 1.0%
Female labour force participation, age 65+: 0.6%
Education and workforce distribution

The Human Capital Report | 119
2.1: Country Profiles
HCI s
core
–2.5
–2.0
–1.5
–1.0
–0.5
0.0
0.5
1.0
1.5
2.0
2.5
Overall Index
Enablingenvironment
Workforce andemployment
Health andwellness
Education
Burkina FasoEmployment types, educational requirements and educational attainment
Percent of population Educational in employment type attainment (%)
Tertiary requirements n/a 0.2
Professionals n/a
Technicians and associate professionals n/a
Secondary requirements n/a 1.8
Clerks n/a
Service workers and shop and market sales workers n/a
Skilled agricultural and fishery workers n/a
Craft and related trade workers n/a
Plant and machine operators and assemblers n/a
Primary requirements n/a n/a
Elementary occupations n/a
Various n/a
Legislators, senior officials and managers n/a
Unclassified n/a
Armed forces n/a
Spread of scores (by pillar and overall)
Burkina Faso
Low-income economies
Sub-Saharan Africa

2.1: Country Profiles
120 | The Human Capital Report
Pillar 1: Education Rank/122 Z-Score Country Value Sample Minimum Sample Maximum
Access
Primary enrolment rate (%) .................................................................113.......................–3.418........................ 64...........................58 ......................... 100
Secondary enrolment rate (%) ..............................................................98.......................–2.332........................ 19...........................16 ......................... 100
Tertiary enrolment ratio (%) .................................................................114.......................–1.395.......................... 4.............................1 ......................... 103
Education gender gap2 .......................................................................111.......................–2.280................... 0.786......................0.645 ...................... 1.000
Quality
Internet access in schools1 .................................................................122.......................–2.142..................... 1.64........................1.64 ........................ 6.64
Quality of the education system1 ........................................................108.......................–1.206..................... 2.72........................1.99 ........................ 5.98
Quality of primary schools1 .................................................................102.......................–0.955..................... 2.90........................1.97 ........................ 6.82
Quality of math & science education1 ...................................................82.......................–0.343..................... 3.71........................1.88 ........................ 6.29
Quality of management schools1 ..........................................................96.......................–0.773..................... 3.65........................2.29 ........................ 6.09
Attainment
Primary education attainment (% population age 25+) ..........................72.......................–2.959.......................... 5.............................5 ......................... 100
Secondary education attainment (% population age 25+) .....................84.......................–2.296.......................... 2.............................2 ......................... 100
Tertiary education attainment (% population age 25+) ..........................86.......................–1.705.......................... 0.............................0 ........................... 44
Pillar 2: Health and Wellness Rank/122 Z-Score Country Value Sample Minimum Sample Maximum
Survival
Infant mortality (per 1,000 live births) ..................................................121.......................–2.714........................ 82.............................2 ........................... 98
Life expectancy .................................................................................114.......................–2.011........................ 56...........................50 ........................... 83
Survival gender gap2 ............................................................................89.......................–0.224................... 0.968......................0.920 ...................... 0.980
Health
Stunting and wasting (% in children under 5) ........................................61.......................–0.899..................... 23.2..........................1.2 ........................ 36.5
Unhealthy life years (% of life expectancy) ..........................................117.......................–1.428........................ 23.............................8 ........................... 66
Deaths under 60 from non-communicable
diseases (% of all NCD deaths) ....................................................121.......................–2.156 ..................... 54.0 ..........................7.3 ........................ 55.8
Obesity (% of adults with BMI ≥ 30) .......................................................7.........................1.703....................... 2.4..........................1.1 ........................ 42.8
Business impact of non-communicable diseases1 ................................75.......................–0.317..................... 4.34........................2.74 ........................ 5.87
Business impact of communicable diseases1 .....................................106.......................–1.467..................... 4.02........................3.13 ........................ 6.90
Well-being
Stress (% of respondents)7 ..................................................................33.........................0.370........................ 26.............................8 ........................... 69
Depression (% of respondents)7 ...........................................................56.........................0.137........................ 11.............................2 ........................... 37
Services
Water, sanitation and hygiene (% with access) ...................................111.......................–1.804..................... 49.0........................31.1 ...................... 100.0
Healthcare quality1................................................................................99.......................–0.957..................... 2.94........................1.78 ........................ 6.75
Healthcare accessibility1 .....................................................................118.......................–1.434..................... 2.91........................2.41 ........................ 6.75
Pillar 3: Workforce and Employment Rank/122 Z-Score Country Value Sample Minimum Sample Maximum
Participation
Labour force participation rate, age 15-64 (%) .......................................5.........................1.647..................... 85.3........................43.4 ........................ 90.6
Labour force participation rate, age 65+ (%) .........................................17.........................1.261..................... 49.1..........................1.6 ........................ 91.2
Economic participation gender gap2 .....................................................28.........................0.798................... 0.738......................0.310 ...................... 0.839
Unemployment rate (%) ........................................................................—..............................— .........................— ..........................0.3 ........................ 32.0
Youth unemployment rate (%) .................................................................4.........................1.522 ....................... 3.8 ..........................1.6 ........................ 48.2
Talent
Country capacity to attract talent1 ......................................................103.......................–1.163..................... 2.24........................1.48 ........................ 6.08
Country capacity to retain talent1........................................................102.......................–0.931..................... 2.63........................1.81 ........................ 5.97
Ease of finding skilled employees1 ........................................................46.........................0.252..................... 4.16........................2.13 ........................ 5.69
Pay related to productivity1 .................................................................112.......................–1.392..................... 3.07........................2.37 ........................ 5.25
Capacity for innovation1......................................................................105.......................–0.905..................... 2.98........................2.31 ........................ 5.84
Index of Economic Complexity3 ............................................................—..............................— .........................— ......................–1.96 ........................ 2.37
Firm level technology absorption1 .......................................................120.......................–1.575..................... 3.69........................3.17 ........................ 6.23
Scientific and technical journal articles (per 1,000 people) ....................98.......................–0.618................... 0.003......................0.000 ...................... 1.242
Median age of the working population ................................................117.......................–1.401........................ 29...........................28 ........................... 42
Training
Staff training1 ......................................................................................121.......................–1.805..................... 2.89........................2.51 ........................ 5.57
Training services1 ..................................................................................99.......................–0.923..................... 3.58........................2.67 ........................ 6.47
Burkina Faso

2.1: Country Profiles
NOTESIn the sections for Pillar 1, Pillar 2, Pillar 3 and Pillar 4, values under Country Value, Sample Minimum and Sample Maximum refer to underlying data for each variable.For further details and explanations, please refer to the section “How to Read the Country Profiles”.1 Survey data responses on a 1- to 7-scale (1 = worst score, 7 = best score)2 Data on a 0- to 1-scale (0 = worst score, 1 = best score)3 Data from -1.960 (worst score) to 2.367 (best score)4 Rank number on a list of 185 countries5 Index on a scale of 0 (perfect inequality) to 100 (perfect equality)6 International test scores7 Perception survey data. Percentage of yes responses.8 Score (1 = best, 7 = worst)9 Reported in relation to UK score (100)
The Human Capital Report | 121
Burkina FasoPillar 4: Enabling Environment Rank/122 Z-Score Country Value Sample Minimum Sample Maximum
Infrastructure
Mobile users (per 100 people) ............................................................117.......................–1.817........................ 45...........................17 ......................... 191
Internet users (per 100 people) ...........................................................117.......................–1.458.......................... 3.............................1 ........................... 95
Quality of domestic transport1 ............................................................118.......................–1.854 ..................... 2.85 ........................2.08 ........................ 6.51
Collaboration
State of cluster development1 ............................................................116.......................–1.454..................... 2.85........................2.33 ........................ 5.49
Business and university R&D collaboration1 ..........................................87.......................–0.600..................... 3.24........................2.11 ........................ 5.84
Legal framework
Doing Business Index4 .......................................................................111.......................–1.417...................... 153.............................1 ......................... 180
Social safety net protection1 .................................................................80.......................–0.588..................... 3.14........................2.10 ........................ 6.26
Intellectual property protection and property rights1..............................80.......................–0.540 ..................... 3.54 ........................1.62 ........................ 6.31
Social mobility
Social mobility1 .....................................................................................96.......................–0.827..................... 3.64........................2.78 ........................ 6.36
Additional indicatorsDemographics Value
Child dependency ratio (%)..................................................................... 89.3Aged dependency ratio (%) ...................................................................... 4.8Fertility rate (births per woman) ................................................................. 6.1Sex ratio at birth (female/male) ............................................................... 0.97Population below age 20 (%) .................................................................. 56.9Population above age 60 (%) .................................................................... 3.9
Education
Public spending on education (% of GDP) ................................................ 3.4Technical/vocational enrolment as % of total
enrolment in secondary school ............................................................. 4Adult literacy (%) ..................................................................................... 28.7Boys not in primary school (%) .................................................................. 34Girls not in primary school (%) ................................................................... 37Education poverty (% of children age 17-22
with less than 2-4 years schooling) ................................................ 1.378Private enrolment in primary school (% of primary) ................................. 15.6Private enrolment in secondary school (% of secondary) ........................ 41.1PIRLS6 .......................................................................................................—PISA math scores6 .....................................................................................—PISA reading scores6 ..................................................................................—PISA science scores6 .................................................................................—TIMSS 4th grade math6 ..............................................................................—TIMSS 4th grade science6 ..........................................................................—TIMSS 8th grade math6 ..............................................................................—TIMSS 8th grade science6 ..........................................................................—
Health
Prevalence of visual impairment (%) .......................................................... 6.7Public spending on health (% of GDP) ...................................................... 6.5Business impact of heart disease1 .......................................................... 4.04Business impact of cancer1 .................................................................... 4.45Business impact of mental illness1 .......................................................... 4.66Business impact of diabetes1 ................................................................. 4.37Business impact of chronic respiratory disease1 ..................................... 4.18Business impact of HIV/AIDS1 ................................................................ 4.46Business impact of tuberculosis1 ............................................................ 4.48Business impact of malaria1 ................................................................... 3.12
Society Value
Freedom in the World8................................................................................. 5Democracy Index (rank/165) .................................................................... 127Population living in urban area (%) .......................................................... 27.4Gini Index (income)5................................................................................ 39.8Accessibility of digital content1 ............................................................... 2.62Extent of virtual social networks use1 ..................................................... 4.21
Workforce
Economic activity (agriculture) — % of total activity ....................................—Economic activity (industry) — % of total activity ........................................—Economic activity (services) — % of total activity ........................................—GDP per person employed (US$) ......................................................... 2,625Cooperation in labour-employer relations1 .............................................. 3.96Emigration rate of the tertiary educated (%) .............................................. 2.6Labour force with tertiary education (%) .....................................................—Number of patent applications (per 1,000 people) ......................................—Hiring and firing practices1 ...................................................................... 3.86Retirement age, male .................................................................................—Retirement age, female ...............................................................................—Number of informal sector workers (1,000s) ...............................................—Total employed (1,000s) .............................................................................—Total unemployed (1,000s) ..........................................................................—Unemployment for 12 months or more
as a % of total unemployment .............................................................—Total youth not in education or employment (1,000s) .................................—Unemployment for 12 months or more (1,000s) .........................................—Global Innovation Index (rank/142) .......................................................... 116Global Talent Index (rank/60) ......................................................................—Quality of Labour Force (rank/60) ...............................................................—Talent Environment (rank/60) ......................................................................—IQ measure9 ........................................................................................... 71.0

2.1: Country Profiles
122 | The Human Capital Report
Rank/122 Score
Year
s (5
yea
r age
gro
ups)
Percent of total population
0–4
5–9
10–14
15–19
20–24
25–29
30–34
35–39
40–44
45–49
50–54
55–59
60–64
65–69
70–74
75–79
80–84
85–89
90–94
95–99
100+
0 1 2 3 4 5 6 77 6 5 4 3 2 1 0
CambodiaHuman Capital Index 2013 96 –0.505
Pillar 1: Education 99 –0.839
Pillar 2: Health and wellness 102 –0.596
Pillar 3: Workforce and employment 42 0.104
Pillar 4: Enabling environment 93 –0.688
Key Indicators
Total population (1,000s) 14,364.9
Median age of population 23
GDP per capita PPP (constant 2005, international $) 2,150
GDP growth (annual %) 7.3
Male Female Additional indicators
n Total population n Total population Aged dependency: 8.0%
n Labour force participation n Labour force participation Youth dependency: 50.4%
n Primary and secondary enrolment n Primary and secondary enrolment Male labour force participation, age 65+: 0.7%
Female labour force participation, age 65+: 0.7%
Education and workforce distribution

The Human Capital Report | 123
2.1: Country Profiles
HCI s
core
–2.5
–2.0
–1.5
–1.0
–0.5
0.0
0.5
1.0
1.5
2.0
2.5
Overall Index
Enablingenvironment
Workforce andemployment
Health andwellness
Education
CambodiaEmployment types, educational requirements and educational attainment
Percent of population Educational in employment type attainment (%)
Tertiary requirements n/a n/a
Professionals n/a
Technicians and associate professionals n/a
Secondary requirements n/a 13.4
Clerks n/a
Service workers and shop and market sales workers n/a
Skilled agricultural and fishery workers n/a
Craft and related trade workers n/a
Plant and machine operators and assemblers n/a
Primary requirements n/a 20.1
Elementary occupations n/a
Various n/a
Legislators, senior officials and managers n/a
Unclassified n/a
Armed forces n/a
Spread of scores (by pillar and overall)
Cambodia
Low-income economies
Asia and the Pacific

2.1: Country Profiles
124 | The Human Capital Report
Pillar 1: Education Rank/122 Z-Score Country Value Sample Minimum Sample Maximum
Access
Primary enrolment rate (%) ...................................................................35.........................0.576........................ 98...........................58 ......................... 100
Secondary enrolment rate (%) ..............................................................89.......................–1.511........................ 38...........................16 ......................... 100
Tertiary enrolment ratio (%) ...................................................................88.......................–0.991........................ 14.............................1 ......................... 103
Education gender gap2 .......................................................................104.......................–1.154................... 0.871......................0.645 ...................... 1.000
Quality
Internet access in schools1 ...................................................................78.......................–0.440..................... 3.77........................1.64 ........................ 6.64
Quality of the education system1 ..........................................................64.......................–0.222..................... 3.60........................1.99 ........................ 5.98
Quality of primary schools1 ...................................................................90.......................–0.661..................... 3.22........................1.97 ........................ 6.82
Quality of math & science education1 ...................................................86.......................–0.583..................... 3.48........................1.88 ........................ 6.29
Quality of management schools1 ..........................................................95.......................–0.749..................... 3.67........................2.29 ........................ 6.09
Attainment
Primary education attainment (% population age 25+) ..........................67.......................–1.701........................ 36.............................5 ......................... 100
Secondary education attainment (% population age 25+) .....................79.......................–1.790........................ 15.............................2 ......................... 100
Tertiary education attainment (% population age 25+) ..........................—..............................— .........................— .............................0 ........................... 44
Pillar 2: Health and Wellness Rank/122 Z-Score Country Value Sample Minimum Sample Maximum
Survival
Infant mortality (per 1,000 live births) ....................................................97.......................–0.649........................ 36.............................2 ........................... 98
Life expectancy .................................................................................101.......................–0.917........................ 65...........................50 ........................... 83
Survival gender gap2 ..............................................................................1.........................0.751................... 0.980......................0.920 ...................... 0.980
Health
Stunting and wasting (% in children under 5) ........................................66.......................–1.201..................... 25.9..........................1.2 ........................ 36.5
Unhealthy life years (% of life expectancy) ..........................................107.......................–0.637........................ 18.............................8 ........................... 66
Deaths under 60 from non-communicable
diseases (% of all NCD deaths) ....................................................115.......................–1.566 ..................... 46.5 ..........................7.3 ........................ 55.8
Obesity (% of adults with BMI ≥ 30) .......................................................6.........................1.713....................... 2.3..........................1.1 ........................ 42.8
Business impact of non-communicable diseases1 ................................99.......................–0.807..................... 4.12........................2.74 ........................ 5.87
Business impact of communicable diseases1 .......................................96.......................–0.958..................... 4.52........................3.13 ........................ 6.90
Well-being
Stress (% of respondents)7 ..................................................................64.......................–0.173........................ 33.............................8 ........................... 69
Depression (% of respondents)7 ...........................................................79.......................–0.341........................ 14.............................2 ........................... 37
Services
Water, sanitation and hygiene (% with access) ...................................109.......................–1.749..................... 50.0........................31.1 ...................... 100.0
Healthcare quality1................................................................................89.......................–0.832..................... 3.09........................1.78 ........................ 6.75
Healthcare accessibility1 .......................................................................99.......................–0.971..................... 3.48........................2.41 ........................ 6.75
Pillar 3: Workforce and Employment Rank/122 Z-Score Country Value Sample Minimum Sample Maximum
Participation
Labour force participation rate, age 15-64 (%) .......................................7.........................1.565..................... 84.5........................43.4 ........................ 90.6
Labour force participation rate, age 65+ (%) .........................................12.........................1.494..................... 53.6..........................1.6 ........................ 91.2
Economic participation gender gap2 .....................................................70.......................–0.028................... 0.640......................0.310 ...................... 0.839
Unemployment rate (%) ........................................................................45.........................0.307....................... 7.1..........................0.3 ........................ 32.0
Youth unemployment rate (%) .................................................................3.........................1.563....................... 3.4..........................1.6 ........................ 48.2
Talent
Country capacity to attract talent1 ........................................................42.........................0.346..................... 3.80........................1.48 ........................ 6.08
Country capacity to retain talent1..........................................................40.........................0.427..................... 3.94........................1.81 ........................ 5.97
Ease of finding skilled employees1 ........................................................94.......................–0.860..................... 3.39........................2.13 ........................ 5.69
Pay related to productivity1 ...................................................................27.........................0.780..................... 4.40........................2.37 ........................ 5.25
Capacity for innovation1........................................................................61.......................–0.283..................... 3.48........................2.31 ........................ 5.84
Index of Economic Complexity3 ............................................................90.......................–0.891................... –0.74......................–1.96 ........................ 2.37
Firm level technology absorption1 .........................................................72.......................–0.317..................... 4.59........................3.17 ........................ 6.23
Scientific and technical journal articles (per 1,000 people) ..................108.......................–0.622................... 0.002......................0.000 ...................... 1.242
Median age of the working population ................................................106.......................–1.262........................ 29...........................28 ........................... 42
Training
Staff training1 ........................................................................................57.......................–0.015..................... 4.04........................2.51 ........................ 5.57
Training services1 ..................................................................................82.......................–0.545..................... 3.87........................2.67 ........................ 6.47
Cambodia

2.1: Country Profiles
NOTESIn the sections for Pillar 1, Pillar 2, Pillar 3 and Pillar 4, values under Country Value, Sample Minimum and Sample Maximum refer to underlying data for each variable.For further details and explanations, please refer to the section “How to Read the Country Profiles”.1 Survey data responses on a 1- to 7-scale (1 = worst score, 7 = best score)2 Data on a 0- to 1-scale (0 = worst score, 1 = best score)3 Data from -1.960 (worst score) to 2.367 (best score)4 Rank number on a list of 185 countries5 Index on a scale of 0 (perfect inequality) to 100 (perfect equality)6 International test scores7 Perception survey data. Percentage of yes responses.8 Score (1 = best, 7 = worst)9 Reported in relation to UK score (100)
The Human Capital Report | 125
CambodiaPillar 4: Enabling Environment Rank/122 Z-Score Country Value Sample Minimum Sample Maximum
Infrastructure
Mobile users (per 100 people) ..............................................................85.......................–0.321........................ 96...........................17 ......................... 191
Internet users (per 100 people) ...........................................................116.......................–1.455.......................... 3.............................1 ........................... 95
Quality of domestic transport1 ............................................................108.......................–1.069..................... 3.54........................2.08 ........................ 6.51
Collaboration
State of cluster development1 ..............................................................40.........................0.349..................... 4.14........................2.33 ........................ 5.49
Business and university R&D collaboration1 ..........................................92.......................–0.698 ..................... 3.16 ........................2.11 ........................ 5.84
Legal framework
Doing Business Index4 .........................................................................99.......................–1.029...................... 133.............................1 ......................... 180
Social safety net protection1 .................................................................79.......................–0.587..................... 3.14........................2.10 ........................ 6.26
Intellectual property protection and property rights1..............................87.......................–0.669 ..................... 3.41 ........................1.62 ........................ 6.31
Social mobility
Social mobility1 .....................................................................................91.......................–0.713..................... 3.74........................2.78 ........................ 6.36
Additional indicatorsDemographics Value
Child dependency ratio (%)..................................................................... 50.4Aged dependency ratio (%) ...................................................................... 8.0Fertility rate (births per woman) ................................................................. 3.1Sex ratio at birth (female/male) ............................................................... 0.95Population below age 20 (%) .................................................................. 43.6Population above age 60 (%) .................................................................... 7.2
Education
Public spending on education (% of GDP) ................................................ 2.6Technical/vocational enrolment as % of total
enrolment in secondary school ............................................................. 2Adult literacy (%) ..................................................................................... 73.9Boys not in primary school (%) .................................................................... 4Girls not in primary school (%) ..................................................................... 5Education poverty (% of children age 17-22
with less than 2-4 years schooling) ................................................ 0.392Private enrolment in primary school (% of primary) ................................... 1.5Private enrolment in secondary school (% of secondary) .......................... 2.0PIRLS6 .......................................................................................................—PISA math scores6 .....................................................................................—PISA reading scores6 ..................................................................................—PISA science scores6 .................................................................................—TIMSS 4th grade math6 ..............................................................................—TIMSS 4th grade science6 ..........................................................................—TIMSS 8th grade math6 ..............................................................................—TIMSS 8th grade science6 ..........................................................................—
Health
Prevalence of visual impairment (%) .......................................................... 7.3Public spending on health (% of GDP) ...................................................... 5.7Business impact of heart disease1 .......................................................... 4.02Business impact of cancer1 .................................................................... 4.10Business impact of mental illness1 .......................................................... 4.24Business impact of diabetes1 ................................................................. 4.07Business impact of chronic respiratory disease1 ..................................... 4.16Business impact of HIV/AIDS1 ................................................................ 4.56Business impact of tuberculosis1 ............................................................ 4.44Business impact of malaria1 ................................................................... 4.57
Society Value
Freedom in the World8................................................................................. 6Democracy Index (rank/165) .................................................................... 100Population living in urban area (%) .......................................................... 20.2Gini Index (income)5................................................................................ 36.0Accessibility of digital content1 ............................................................... 4.81Extent of virtual social networks use1 ..................................................... 5.06
Workforce
Economic activity (agriculture) — % of total activity ................................ 55.8Economic activity (industry) — % of total activity .................................... 16.9Economic activity (services) — % of total activity .................................... 27.3GDP per person employed (US$) ......................................................... 5,200Cooperation in labour-employer relations1 .............................................. 4.34Emigration rate of the tertiary educated (%) ............................................ 21.5Labour force with tertiary education (%) ................................................... 2.5Number of patent applications (per 1,000 people) ......................................—Hiring and firing practices1 ...................................................................... 4.72Retirement age, male .................................................................................—Retirement age, female ...............................................................................—Number of informal sector workers (1,000s) ...............................................—Total employed (1,000s) ....................................................................... 6,561Total unemployed (1,000s) ....................................................................... 503Unemployment for 12 months or more
as a % of total unemployment .............................................................—Total youth not in education or employment (1,000s) .................................—Unemployment for 12 months or more (1,000s) .........................................—Global Innovation Index (rank/142) .......................................................... 110Global Talent Index (rank/60) ......................................................................—Quality of Labour Force (rank/60) ...............................................................—Talent Environment (rank/60) ......................................................................—IQ measure9 ........................................................................................... 92.0
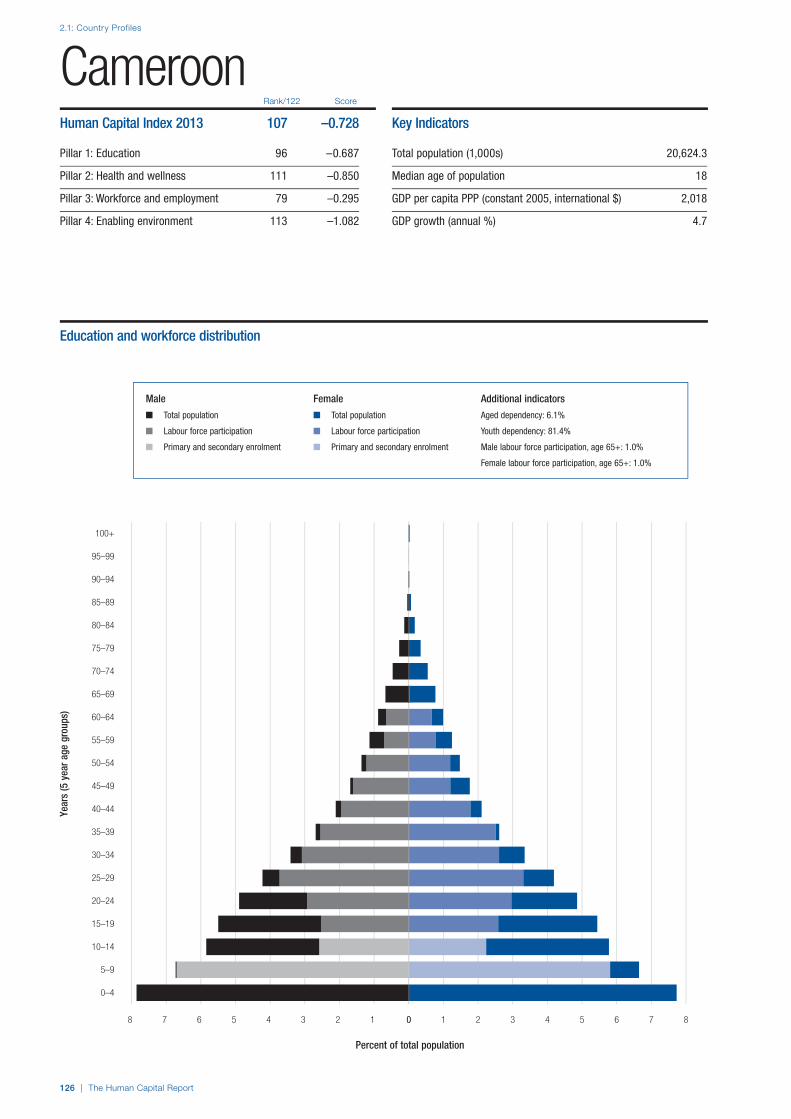
2.1: Country Profiles
126 | The Human Capital Report
Rank/122 Score
Year
s (5
yea
r age
gro
ups)
Percent of total population
0–4
5–9
10–14
15–19
20–24
25–29
30–34
35–39
40–44
45–49
50–54
55–59
60–64
65–69
70–74
75–79
80–84
85–89
90–94
95–99
100+
0 1 2 3 4 5 6 7 88 7 6 5 4 3 2 1 0
CameroonHuman Capital Index 2013 107 –0.728
Pillar 1: Education 96 –0.687
Pillar 2: Health and wellness 111 –0.850
Pillar 3: Workforce and employment 79 –0.295
Pillar 4: Enabling environment 113 –1.082
Key Indicators
Total population (1,000s) 20,624.3
Median age of population 18
GDP per capita PPP (constant 2005, international $) 2,018
GDP growth (annual %) 4.7
Male Female Additional indicators
n Total population n Total population Aged dependency: 6.1%
n Labour force participation n Labour force participation Youth dependency: 81.4%
n Primary and secondary enrolment n Primary and secondary enrolment Male labour force participation, age 65+: 1.0%
Female labour force participation, age 65+: 1.0%
Education and workforce distribution

The Human Capital Report | 127
2.1: Country Profiles
HCI s
core
–2.5
–2.0
–1.5
–1.0
–0.5
0.0
0.5
1.0
1.5
2.0
2.5
Overall Index
Enablingenvironment
Workforce andemployment
Health andwellness
Education
CameroonEmployment types, educational requirements and educational attainment
Percent of population Educational in employment type attainment (%)
Tertiary requirements n/a n/a
Professionals n/a
Technicians and associate professionals n/a
Secondary requirements n/a n/a
Clerks n/a
Service workers and shop and market sales workers n/a
Skilled agricultural and fishery workers n/a
Craft and related trade workers n/a
Plant and machine operators and assemblers n/a
Primary requirements n/a n/a
Elementary occupations n/a
Various n/a
Legislators, senior officials and managers n/a
Unclassified n/a
Armed forces n/a
Spread of scores (by pillar and overall)
Cameroon
Lower-middle income economies
Sub-Saharan Africa
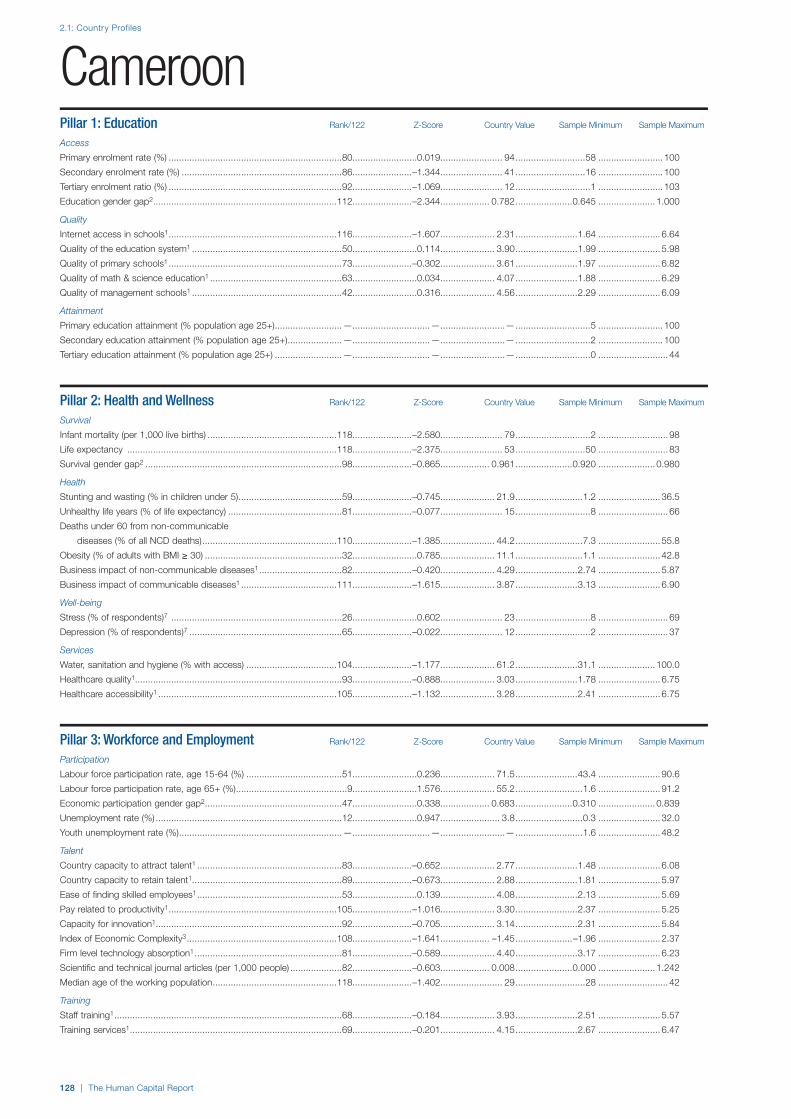
2.1: Country Profiles
128 | The Human Capital Report
Pillar 1: Education Rank/122 Z-Score Country Value Sample Minimum Sample Maximum
Access
Primary enrolment rate (%) ...................................................................80.........................0.019........................ 94...........................58 ......................... 100
Secondary enrolment rate (%) ..............................................................86.......................–1.344........................ 41...........................16 ......................... 100
Tertiary enrolment ratio (%) ...................................................................92.......................–1.069........................ 12.............................1 ......................... 103
Education gender gap2 .......................................................................112.......................–2.344................... 0.782......................0.645 ...................... 1.000
Quality
Internet access in schools1 .................................................................116.......................–1.607..................... 2.31........................1.64 ........................ 6.64
Quality of the education system1 ..........................................................50.........................0.114..................... 3.90........................1.99 ........................ 5.98
Quality of primary schools1 ...................................................................73.......................–0.302..................... 3.61........................1.97 ........................ 6.82
Quality of math & science education1 ...................................................63.........................0.034..................... 4.07........................1.88 ........................ 6.29
Quality of management schools1 ..........................................................42.........................0.316..................... 4.56........................2.29 ........................ 6.09
Attainment
Primary education attainment (% population age 25+) ..........................—..............................— .........................— .............................5 ......................... 100
Secondary education attainment (% population age 25+) .....................—..............................— .........................— .............................2 ......................... 100
Tertiary education attainment (% population age 25+) ..........................—..............................— .........................— .............................0 ........................... 44
Pillar 2: Health and Wellness Rank/122 Z-Score Country Value Sample Minimum Sample Maximum
Survival
Infant mortality (per 1,000 live births) ..................................................118.......................–2.580........................ 79.............................2 ........................... 98
Life expectancy .................................................................................118.......................–2.375........................ 53...........................50 ........................... 83
Survival gender gap2 ............................................................................98.......................–0.865................... 0.961......................0.920 ...................... 0.980
Health
Stunting and wasting (% in children under 5) ........................................59.......................–0.745..................... 21.9..........................1.2 ........................ 36.5
Unhealthy life years (% of life expectancy) ............................................81.......................–0.077........................ 15.............................8 ........................... 66
Deaths under 60 from non-communicable
diseases (% of all NCD deaths) ....................................................110.......................–1.385 ..................... 44.2 ..........................7.3 ........................ 55.8
Obesity (% of adults with BMI ≥ 30) .....................................................32.........................0.785..................... 11.1..........................1.1 ........................ 42.8
Business impact of non-communicable diseases1 ................................82.......................–0.420..................... 4.29........................2.74 ........................ 5.87
Business impact of communicable diseases1 .....................................111.......................–1.615..................... 3.87........................3.13 ........................ 6.90
Well-being
Stress (% of respondents)7 ..................................................................26.........................0.602........................ 23.............................8 ........................... 69
Depression (% of respondents)7 ...........................................................65.......................–0.022........................ 12.............................2 ........................... 37
Services
Water, sanitation and hygiene (% with access) ...................................104.......................–1.177..................... 61.2........................31.1 ...................... 100.0
Healthcare quality1................................................................................93.......................–0.888..................... 3.03........................1.78 ........................ 6.75
Healthcare accessibility1 .....................................................................105.......................–1.132..................... 3.28........................2.41 ........................ 6.75
Pillar 3: Workforce and Employment Rank/122 Z-Score Country Value Sample Minimum Sample Maximum
Participation
Labour force participation rate, age 15-64 (%) .....................................51.........................0.236..................... 71.5........................43.4 ........................ 90.6
Labour force participation rate, age 65+ (%) ...........................................9.........................1.576..................... 55.2..........................1.6 ........................ 91.2
Economic participation gender gap2 .....................................................47.........................0.338................... 0.683......................0.310 ...................... 0.839
Unemployment rate (%) ........................................................................12.........................0.947....................... 3.8..........................0.3 ........................ 32.0
Youth unemployment rate (%) ...............................................................—..............................— .........................— ..........................1.6 ........................ 48.2
Talent
Country capacity to attract talent1 ........................................................83.......................–0.652..................... 2.77........................1.48 ........................ 6.08
Country capacity to retain talent1..........................................................89.......................–0.673..................... 2.88........................1.81 ........................ 5.97
Ease of finding skilled employees1 ........................................................53.........................0.139..................... 4.08........................2.13 ........................ 5.69
Pay related to productivity1 .................................................................105.......................–1.016..................... 3.30........................2.37 ........................ 5.25
Capacity for innovation1........................................................................92.......................–0.705..................... 3.14........................2.31 ........................ 5.84
Index of Economic Complexity3 ..........................................................108.......................–1.641................... –1.45......................–1.96 ........................ 2.37
Firm level technology absorption1 .........................................................81.......................–0.589..................... 4.40........................3.17 ........................ 6.23
Scientific and technical journal articles (per 1,000 people) ....................82.......................–0.603................... 0.008......................0.000 ...................... 1.242
Median age of the working population ................................................118.......................–1.402........................ 29...........................28 ........................... 42
Training
Staff training1 ........................................................................................68.......................–0.184..................... 3.93........................2.51 ........................ 5.57
Training services1 ..................................................................................69.......................–0.201..................... 4.15........................2.67 ........................ 6.47
Cameroon

2.1: Country Profiles
NOTESIn the sections for Pillar 1, Pillar 2, Pillar 3 and Pillar 4, values under Country Value, Sample Minimum and Sample Maximum refer to underlying data for each variable.For further details and explanations, please refer to the section “How to Read the Country Profiles”.1 Survey data responses on a 1- to 7-scale (1 = worst score, 7 = best score)2 Data on a 0- to 1-scale (0 = worst score, 1 = best score)3 Data from -1.960 (worst score) to 2.367 (best score)4 Rank number on a list of 185 countries5 Index on a scale of 0 (perfect inequality) to 100 (perfect equality)6 International test scores7 Perception survey data. Percentage of yes responses.8 Score (1 = best, 7 = worst)9 Reported in relation to UK score (100)
The Human Capital Report | 129
CameroonPillar 4: Enabling Environment Rank/122 Z-Score Country Value Sample Minimum Sample Maximum
Infrastructure
Mobile users (per 100 people) ............................................................114.......................–1.609........................ 52...........................17 ......................... 191
Internet users (per 100 people) ...........................................................109.......................–1.387.......................... 5.............................1 ........................... 95
Quality of domestic transport1 ............................................................109.......................–1.084 ..................... 3.52 ........................2.08 ........................ 6.51
Collaboration
State of cluster development1 ..............................................................81.......................–0.533..................... 3.51........................2.33 ........................ 5.49
Business and university R&D collaboration1 ........................................100.......................–0.823..................... 3.04........................2.11 ........................ 5.84
Legal framework
Doing Business Index4 .......................................................................114.......................–1.572...................... 161.............................1 ......................... 180
Social safety net protection1 ...............................................................121.......................–1.480..................... 2.18........................2.10 ........................ 6.26
Intellectual property protection and property rights1..............................83.......................–0.574 ..................... 3.50 ........................1.62 ........................ 6.31
Social mobility
Social mobility1 .....................................................................................87.......................–0.675..................... 3.78........................2.78 ........................ 6.36
Additional indicatorsDemographics Value
Child dependency ratio (%)..................................................................... 81.4Aged dependency ratio (%) ...................................................................... 6.1Fertility rate (births per woman) ................................................................. 5.2Sex ratio at birth (female/male) ............................................................... 0.97Population below age 20 (%) .................................................................. 54.4Population above age 60 (%) .................................................................... 4.9
Education
Public spending on education (% of GDP) ................................................ 3.2Technical/vocational enrolment as % of total
enrolment in secondary school ........................................................... 20Adult literacy (%) ..................................................................................... 71.3Boys not in primary school (%) ...................................................................—Girls not in primary school (%) ................................................................... 13Education poverty (% of children age 17-22
with less than 2-4 years schooling) ................................................ 0.365Private enrolment in primary school (% of primary) ................................. 20.9Private enrolment in secondary school (% of secondary) ........................ 25.4PIRLS6 .......................................................................................................—PISA math scores6 .....................................................................................—PISA reading scores6 ..................................................................................—PISA science scores6 .................................................................................—TIMSS 4th grade math6 ..............................................................................—TIMSS 4th grade science6 ..........................................................................—TIMSS 8th grade math6 ..............................................................................—TIMSS 8th grade science6 ..........................................................................—
Health
Prevalence of visual impairment (%) .......................................................... 3.9Public spending on health (% of GDP) ...................................................... 5.2Business impact of heart disease1 .......................................................... 3.61Business impact of cancer1 .................................................................... 4.54Business impact of mental illness1 .......................................................... 4.80Business impact of diabetes1 ................................................................. 4.16Business impact of chronic respiratory disease1 ..................................... 4.35Business impact of HIV/AIDS1 ................................................................ 4.05Business impact of tuberculosis1 ............................................................ 4.12Business impact of malaria1 ................................................................... 3.45
Society Value
Freedom in the World8................................................................................. 6Democracy Index (rank/165) .................................................................... 131Population living in urban area (%) .......................................................... 52.7Gini Index (income)5................................................................................ 38.9Accessibility of digital content1 ............................................................... 3.70Extent of virtual social networks use1 ..................................................... 4.83
Workforce
Economic activity (agriculture) — % of total activity ................................ 53.3Economic activity (industry) — % of total activity .................................... 12.6Economic activity (services) — % of total activity .................................... 34.1GDP per person employed (US$) ......................................................... 2,964Cooperation in labour-employer relations1 .............................................. 3.73Emigration rate of the tertiary educated (%) ............................................ 17.3Labour force with tertiary education (%) .....................................................—Number of patent applications (per 1,000 people) ......................................—Hiring and firing practices1 ...................................................................... 4.65Retirement age, male .................................................................................—Retirement age, female ...............................................................................—Number of informal sector workers (1,000s) ...............................................—Total employed (1,000s) ....................................................................... 8,852Total unemployed (1,000s) ....................................................................... 347Unemployment for 12 months or more
as a % of total unemployment ......................................................... 54.8Total youth not in education or employment (1,000s) ........................... 409.1Unemployment for 12 months or more (1,000s) ................................... 190.5Global Innovation Index (rank/142) .......................................................... 125Global Talent Index (rank/60) ......................................................................—Quality of Labour Force (rank/60) ...............................................................—Talent Environment (rank/60) ......................................................................—IQ measure9 ........................................................................................... 68.2
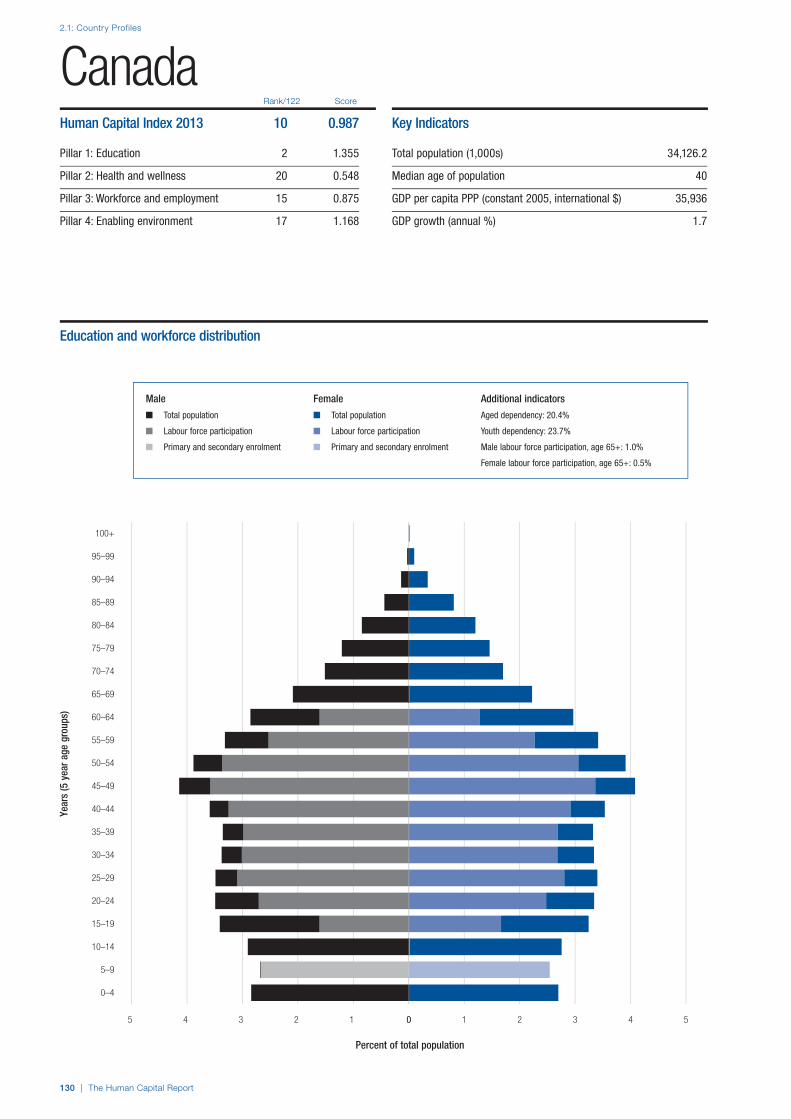
2.1: Country Profiles
130 | The Human Capital Report
Rank/122 Score
Year
s (5
yea
r age
gro
ups)
Percent of total population
0–4
5–9
10–14
15–19
20–24
25–29
30–34
35–39
40–44
45–49
50–54
55–59
60–64
65–69
70–74
75–79
80–84
85–89
90–94
95–99
100+
0 1 2 3 4 55 4 3 2 1 0
CanadaHuman Capital Index 2013 10 0.987
Pillar 1: Education 2 1.355
Pillar 2: Health and wellness 20 0.548
Pillar 3: Workforce and employment 15 0.875
Pillar 4: Enabling environment 17 1.168
Key Indicators
Total population (1,000s) 34,126.2
Median age of population 40
GDP per capita PPP (constant 2005, international $) 35,936
GDP growth (annual %) 1.7
Male Female Additional indicators
n Total population n Total population Aged dependency: 20.4%
n Labour force participation n Labour force participation Youth dependency: 23.7%
n Primary and secondary enrolment n Primary and secondary enrolment Male labour force participation, age 65+: 1.0%
Female labour force participation, age 65+: 0.5%
Education and workforce distribution

The Human Capital Report | 131
2.1: Country Profiles
HCI s
core
–2.5
–2.0
–1.5
–1.0
–0.5
0.0
0.5
1.0
1.5
2.0
2.5
Overall Index
Enablingenvironment
Workforce andemployment
Health andwellness
Education
CanadaEmployment types, educational requirements and educational attainment
Percent of population Educational in employment type attainment (%)
Tertiary requirements 20.4 43.9
Professionals 10.8
Technicians and associate professionals 9.6
Secondary requirements 31.3 n/a
Clerks 8.4
Service workers and shop and market sales workers 9.2
Skilled agricultural and fishery workers 1.3
Craft and related trade workers 6.7
Plant and machine operators and assemblers 5.7
Primary requirements 5.3 n/a
Elementary occupations 5.3
Various 6.9
Legislators, senior officials and managers 5.7
Unclassified 1.2
Armed forces 0.0
Spread of scores (by pillar and overall)
Canada
High-income economies
North America

2.1: Country Profiles
132 | The Human Capital Report
Pillar 1: Education Rank/122 Z-Score Country Value Sample Minimum Sample Maximum
Access
Primary enrolment rate (%) .....................................................................1.........................0.783...................... 100...........................58 ......................... 100
Secondary enrolment rate (%) ..............................................................—..............................— .........................— ...........................16 ......................... 100
Tertiary enrolment ratio (%) ...................................................................—..............................— .........................— .............................1 ......................... 103
Education gender gap2 .........................................................................63.........................0.428................... 0.991......................0.645 ...................... 1.000
Quality
Internet access in schools1 ...................................................................10.........................1.445..................... 6.13........................1.64 ........................ 6.64
Quality of the education system1 ..........................................................10.........................1.624..................... 5.25........................1.99 ........................ 5.98
Quality of primary schools1 ...................................................................13.........................1.438..................... 5.50........................1.97 ........................ 6.82
Quality of math & science education1 ...................................................13.........................1.173..................... 5.16........................1.88 ........................ 6.29
Quality of management schools1 ............................................................7.........................1.668..................... 5.69........................2.29 ........................ 6.09
Attainment
Primary education attainment (% population age 25+) ..........................—..............................— .........................— .............................5 ......................... 100
Secondary education attainment (% population age 25+) .....................—..............................— .........................— .............................2 ......................... 100
Tertiary education attainment (% population age 25+) ............................1.........................2.278 ........................ 44 .............................0 ........................... 44
Pillar 2: Health and Wellness Rank/122 Z-Score Country Value Sample Minimum Sample Maximum
Survival
Infant mortality (per 1,000 live births) ....................................................29.........................0.742.......................... 5.............................2 ........................... 98
Life expectancy .....................................................................................3.........................1.150........................ 82...........................50 ........................... 83
Survival gender gap2 ............................................................................44.........................0.615................... 0.978......................0.920 ...................... 0.980
Health
Stunting and wasting (% in children under 5) ........................................—..............................— .........................— ..........................1.2 ........................ 36.5
Unhealthy life years (% of life expectancy) ............................................23.........................0.608........................ 11.............................8 ........................... 66
Deaths under 60 from non-communicable
diseases (% of all NCD deaths) ......................................................23.........................1.053 ..................... 13.2 ..........................7.3 ........................ 55.8
Obesity (% of adults with BMI ≥ 30) .....................................................87.......................–0.608..................... 24.3..........................1.1 ........................ 42.8
Business impact of non-communicable diseases1 ................................71.......................–0.194..................... 4.39........................2.74 ........................ 5.87
Business impact of communicable diseases1 .......................................21.........................0.992..................... 6.46........................3.13 ........................ 6.90
Well-being
Stress (% of respondents)7 ................................................................103.......................–1.103........................ 45.............................8 ........................... 69
Depression (% of respondents)7 ...........................................................47.........................0.297........................ 10.............................2 ........................... 37
Services
Water, sanitation and hygiene (% with access) .....................................27.........................0.810..................... 99.9........................31.1 ...................... 100.0
Healthcare quality1................................................................................18.........................1.322..................... 5.72........................1.78 ........................ 6.75
Healthcare accessibility1 .......................................................................14.........................1.442..................... 6.42........................2.41 ........................ 6.75
Pillar 3: Workforce and Employment Rank/122 Z-Score Country Value Sample Minimum Sample Maximum
Participation
Labour force participation rate, age 15-64 (%) .....................................24.........................0.880..................... 77.8........................43.4 ........................ 90.6
Labour force participation rate, age 65+ (%) .........................................81.......................–0.689..................... 11.3..........................1.6 ........................ 91.2
Economic participation gender gap2 .....................................................10.........................1.223................... 0.788......................0.310 ...................... 0.839
Unemployment rate (%) ........................................................................61.........................0.141....................... 8.0..........................0.3 ........................ 32.0
Youth unemployment rate (%) ...............................................................44.........................0.391..................... 14.8..........................1.6 ........................ 48.2
Talent
Country capacity to attract talent1 ..........................................................7.........................1.633..................... 5.12........................1.48 ........................ 6.08
Country capacity to retain talent1..........................................................17.........................1.143..................... 4.64........................1.81 ........................ 5.97
Ease of finding skilled employees1 ........................................................31.........................0.729..................... 4.49........................2.13 ........................ 5.69
Pay related to productivity1 ...................................................................23.........................0.913..................... 4.48........................2.37 ........................ 5.25
Capacity for innovation1........................................................................25.........................0.722..................... 4.28........................2.31 ........................ 5.84
Index of Economic Complexity3 ............................................................37.........................0.480..................... 0.57......................–1.96 ........................ 2.37
Firm level technology absorption1 .........................................................31.........................0.887..................... 5.45........................3.17 ........................ 6.23
Scientific and technical journal articles (per 1,000 people) ......................9.........................2.248................... 0.862......................0.000 ...................... 1.242
Median age of the working population ..................................................15.........................1.312........................ 41...........................28 ........................... 42
Training
Staff training1 ........................................................................................29.........................0.633..................... 4.45........................2.51 ........................ 5.57
Training services1 ..................................................................................15.........................1.356..................... 5.38........................2.67 ........................ 6.47
Canada

2.1: Country Profiles
NOTESIn the sections for Pillar 1, Pillar 2, Pillar 3 and Pillar 4, values under Country Value, Sample Minimum and Sample Maximum refer to underlying data for each variable.For further details and explanations, please refer to the section “How to Read the Country Profiles”.1 Survey data responses on a 1- to 7-scale (1 = worst score, 7 = best score)2 Data on a 0- to 1-scale (0 = worst score, 1 = best score)3 Data from -1.960 (worst score) to 2.367 (best score)4 Rank number on a list of 185 countries5 Index on a scale of 0 (perfect inequality) to 100 (perfect equality)6 International test scores7 Perception survey data. Percentage of yes responses.8 Score (1 = best, 7 = worst)9 Reported in relation to UK score (100)
The Human Capital Report | 133
CanadaPillar 4: Enabling Environment Rank/122 Z-Score Country Value Sample Minimum Sample Maximum
Infrastructure
Mobile users (per 100 people) ............................................................100.......................–0.804........................ 80...........................17 ......................... 191
Internet users (per 100 people) .............................................................12.........................1.398........................ 83.............................1 ........................... 95
Quality of domestic transport1 ..............................................................18.........................1.073..................... 5.40........................2.08 ........................ 6.51
Collaboration
State of cluster development1 ..............................................................16.........................1.326..................... 4.84........................2.33 ........................ 5.49
Business and university R&D collaboration1 ..........................................17.........................1.284 ..................... 4.93 ........................2.11 ........................ 5.84
Legal framework
Doing Business Index4 .........................................................................15.........................1.221........................ 17.............................1 ......................... 180
Social safety net protection1 .................................................................13.........................1.562..................... 5.48........................2.10 ........................ 6.26
Intellectual property protection and property rights1................................9.........................1.675 ..................... 5.80 ........................1.62 ........................ 6.31
Social mobility
Social mobility1 .......................................................................................6.........................1.778..................... 5.99........................2.78 ........................ 6.36
Additional indicatorsDemographics Value
Child dependency ratio (%)..................................................................... 23.7Aged dependency ratio (%) .................................................................... 20.4Fertility rate (births per woman) ................................................................. 1.6Sex ratio at birth (female/male) ............................................................... 0.94Population below age 20 (%) .................................................................. 23.0Population above age 60 (%) .................................................................. 19.9
Education
Public spending on education (% of GDP) ................................................ 5.5Technical/vocational enrolment as % of total
enrolment in secondary school ............................................................—Adult literacy (%) .........................................................................................—Boys not in primary school (%) ...................................................................—Girls not in primary school (%) ....................................................................—Education poverty (% of children age 17-22
with less than 2-4 years schooling) ......................................................—Private enrolment in primary school (% of primary) ................................... 6.0Private enrolment in secondary school (% of secondary) .......................... 7.1PIRLS6 .................................................................................................... 548PISA math scores6 .................................................................................. 527PISA reading scores6 ............................................................................... 524PISA science scores6 .............................................................................. 529TIMSS 4th grade math6 ..............................................................................—TIMSS 4th grade science6 ..........................................................................—TIMSS 8th grade math6 ..............................................................................—TIMSS 8th grade science6 ..........................................................................—
Health
Prevalence of visual impairment (%) .......................................................... 0.8Public spending on health (% of GDP) .................................................... 11.2Business impact of heart disease1 .......................................................... 4.25Business impact of cancer1 .................................................................... 4.16Business impact of mental illness1 .......................................................... 4.48Business impact of diabetes1 ................................................................. 4.34Business impact of chronic respiratory disease1 ..................................... 4.74Business impact of HIV/AIDS1 ................................................................ 6.14Business impact of tuberculosis1 ............................................................ 6.53Business impact of malaria1 ................................................................... 6.72
Society Value
Freedom in the World8................................................................................. 1Democracy Index (rank/165) ........................................................................ 8Population living in urban area (%) .......................................................... 80.8Gini Index (income)5................................................................................ 32.6Accessibility of digital content1 ............................................................... 6.11Extent of virtual social networks use1 ..................................................... 6.34
Workforce
Economic activity (agriculture) — % of total activity .................................. 2.4Economic activity (industry) — % of total activity .................................... 21.5Economic activity (services) — % of total activity .................................... 76.5GDP per person employed (US$) ....................................................... 49,540Cooperation in labour-employer relations1 .............................................. 4.93Emigration rate of the tertiary educated (%) .............................................. 4.7Labour force with tertiary education (%) ................................................. 46.5Number of patent applications (per 1,000 people) .............................. 1.0289Hiring and firing practices1 ...................................................................... 4.67Retirement age, male ................................................................................ 65Retirement age, female .............................................................................. 65Number of informal sector workers (1,000s) ...............................................—Total employed (1,000s) ..................................................................... 17,041Total unemployed (1,000s) .................................................................... 1,484Unemployment for 12 months or more
as a % of total unemployment ........................................................... 6.7Total youth not in education or employment (1,000s) ........................... 628.3Unemployment for 12 months or more (1,000s) ..................................... 99.3Global Innovation Index (rank/142) ............................................................ 11Global Talent Index (rank/60) ..................................................................... 14Quality of Labour Force (rank/60) .............................................................. 12Talent Environment (rank/60) ..................................................................... 19IQ measure9 ......................................................................................... 100.4
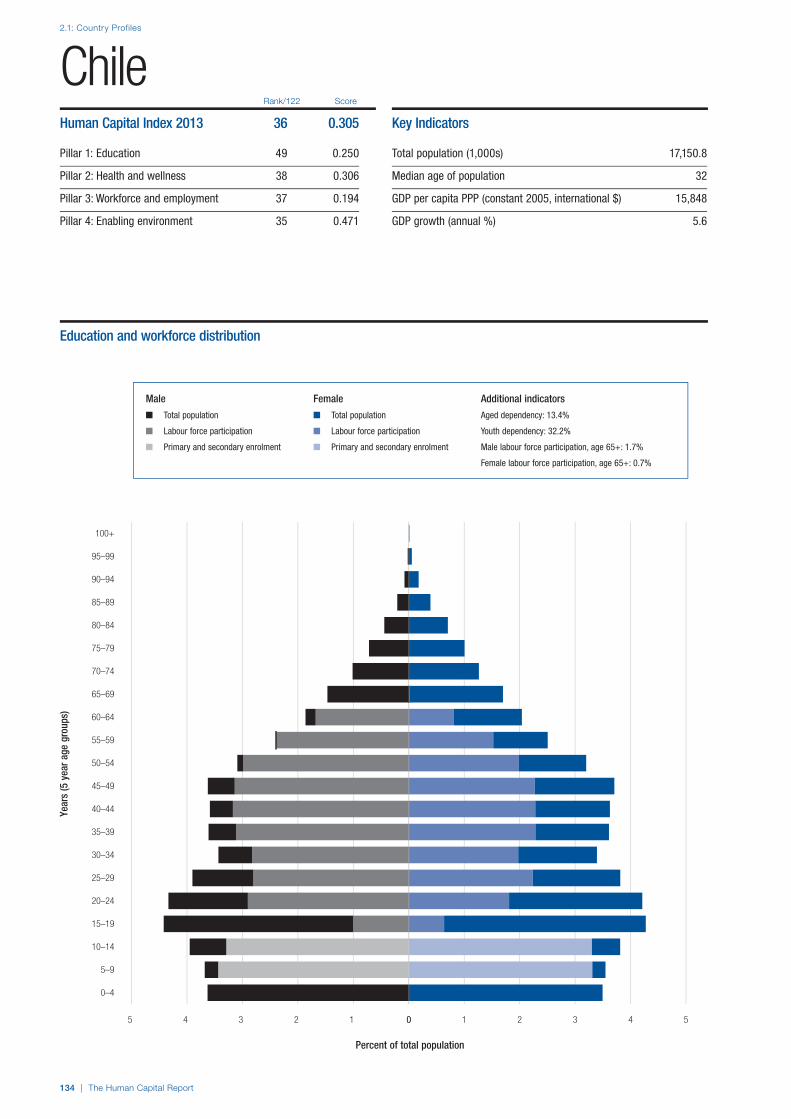
2.1: Country Profiles
134 | The Human Capital Report
Rank/122 Score
Year
s (5
yea
r age
gro
ups)
Percent of total population
0–4
5–9
10–14
15–19
20–24
25–29
30–34
35–39
40–44
45–49
50–54
55–59
60–64
65–69
70–74
75–79
80–84
85–89
90–94
95–99
100+
0 1 2 3 4 55 4 3 2 1 0
ChileHuman Capital Index 2013 36 0.305
Pillar 1: Education 49 0.250
Pillar 2: Health and wellness 38 0.306
Pillar 3: Workforce and employment 37 0.194
Pillar 4: Enabling environment 35 0.471
Key Indicators
Total population (1,000s) 17,150.8
Median age of population 32
GDP per capita PPP (constant 2005, international $) 15,848
GDP growth (annual %) 5.6
Male Female Additional indicators
n Total population n Total population Aged dependency: 13.4%
n Labour force participation n Labour force participation Youth dependency: 32.2%
n Primary and secondary enrolment n Primary and secondary enrolment Male labour force participation, age 65+: 1.7%
Female labour force participation, age 65+: 0.7%
Education and workforce distribution
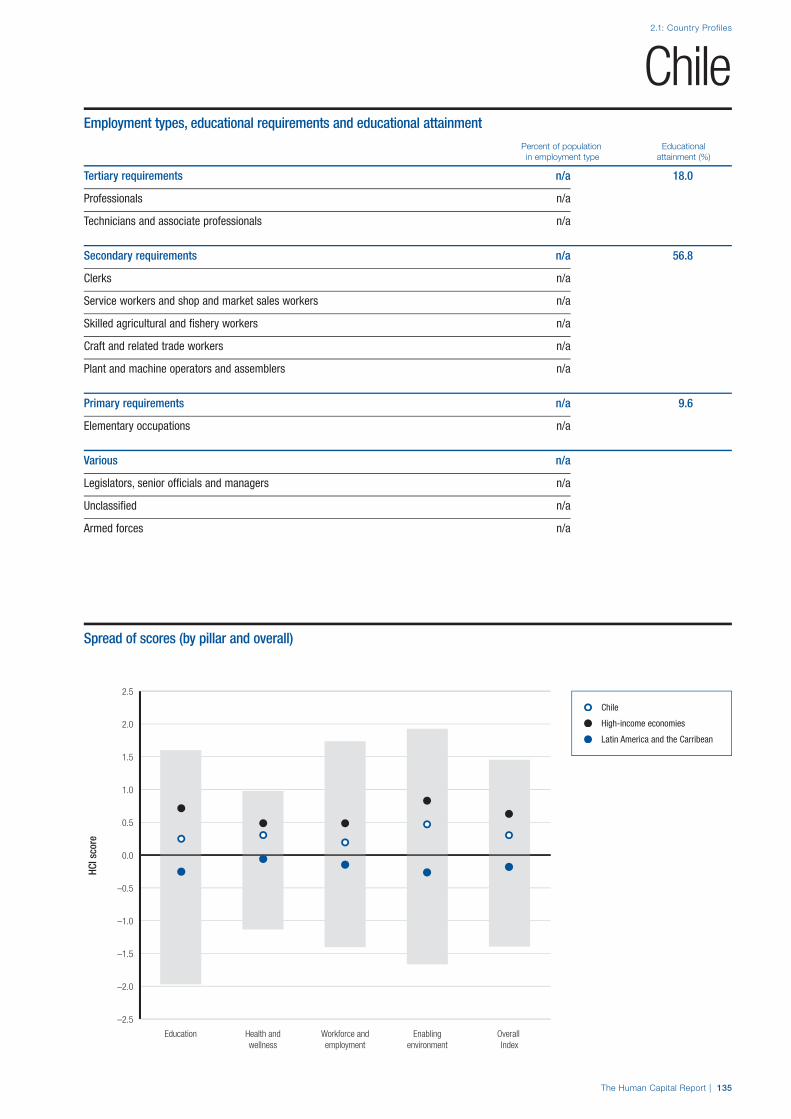
The Human Capital Report | 135
2.1: Country Profiles
HCI s
core
–2.5
–2.0
–1.5
–1.0
–0.5
0.0
0.5
1.0
1.5
2.0
2.5
Overall Index
Enablingenvironment
Workforce andemployment
Health andwellness
Education
ChileEmployment types, educational requirements and educational attainment
Percent of population Educational in employment type attainment (%)
Tertiary requirements n/a 18.0
Professionals n/a
Technicians and associate professionals n/a
Secondary requirements n/a 56.8
Clerks n/a
Service workers and shop and market sales workers n/a
Skilled agricultural and fishery workers n/a
Craft and related trade workers n/a
Plant and machine operators and assemblers n/a
Primary requirements n/a 9.6
Elementary occupations n/a
Various n/a
Legislators, senior officials and managers n/a
Unclassified n/a
Armed forces n/a
Spread of scores (by pillar and overall)
Chile
High-income economies
Latin America and the Carribean

2.1: Country Profiles
136 | The Human Capital Report
Pillar 1: Education Rank/122 Z-Score Country Value Sample Minimum Sample Maximum
Access
Primary enrolment rate (%) ...................................................................81.......................–0.001........................ 93...........................58 ......................... 100
Secondary enrolment rate (%) ..............................................................40.........................0.551........................ 85...........................16 ......................... 100
Tertiary enrolment ratio (%) ...................................................................18.........................1.146........................ 71.............................1 ......................... 103
Education gender gap2 .........................................................................27.........................0.530................... 0.999......................0.645 ...................... 1.000
Quality
Internet access in schools1 ...................................................................44.........................0.422..................... 4.85........................1.64 ........................ 6.64
Quality of the education system1 ..........................................................62.......................–0.200..................... 3.62........................1.99 ........................ 5.98
Quality of primary schools1 ...................................................................91.......................–0.689..................... 3.19........................1.97 ........................ 6.82
Quality of math & science education1 ...................................................90.......................–0.698..................... 3.37........................1.88 ........................ 6.29
Quality of management schools1 ..........................................................15.........................1.261..................... 5.35........................2.29 ........................ 6.09
Attainment
Primary education attainment (% population age 25+) ..........................37.........................0.317........................ 84.............................5 ......................... 100
Secondary education attainment (% population age 25+) .....................33.........................0.442........................ 75.............................2 ......................... 100
Tertiary education attainment (% population age 25+) ..........................42.......................–0.078........................ 18.............................0 ........................... 44
Pillar 2: Health and Wellness Rank/122 Z-Score Country Value Sample Minimum Sample Maximum
Survival
Infant mortality (per 1,000 live births) ....................................................42.........................0.608.......................... 8.............................2 ........................... 98
Life expectancy ...................................................................................30.........................0.785........................ 79...........................50 ........................... 83
Survival gender gap2 ..............................................................................1.........................0.751................... 0.980......................0.920 ...................... 0.980
Health
Stunting and wasting (% in children under 5) ..........................................1.........................1.612....................... 1.2..........................1.2 ........................ 36.5
Unhealthy life years (% of life expectancy) ............................................34.........................0.539........................ 11.............................8 ........................... 66
Deaths under 60 from non-communicable
diseases (% of all NCD deaths) ......................................................43.........................0.612 ..................... 18.8 ..........................7.3 ........................ 55.8
Obesity (% of adults with BMI ≥ 30) ...................................................107.......................–1.115..................... 29.1..........................1.1 ........................ 42.8
Business impact of non-communicable diseases1 ................................55.........................0.171..................... 4.56........................2.74 ........................ 5.87
Business impact of communicable diseases1 .......................................40.........................0.637..................... 6.11........................3.13 ........................ 6.90
Well-being
Stress (% of respondents)7 ..................................................................59.......................–0.095........................ 32.............................8 ........................... 69
Depression (% of respondents)7 ...........................................................85.......................–0.500........................ 15.............................2 ........................... 37
Services
Water, sanitation and hygiene (% with access) .....................................40.........................0.751..................... 98.7........................31.1 ...................... 100.0
Healthcare quality1................................................................................51.........................0.055..................... 4.18........................1.78 ........................ 6.75
Healthcare accessibility1 .......................................................................75.......................–0.530..................... 4.02........................2.41 ........................ 6.75
Pillar 3: Workforce and Employment Rank/122 Z-Score Country Value Sample Minimum Sample Maximum
Participation
Labour force participation rate, age 15-64 (%) .....................................84.......................–0.357..................... 65.7........................43.4 ........................ 90.6
Labour force participation rate, age 65+ (%) .........................................55.......................–0.250..................... 19.8..........................1.6 ........................ 91.2
Economic participation gender gap2 .....................................................96.......................–0.816................... 0.547......................0.310 ...................... 0.839
Unemployment rate (%) ........................................................................44.........................0.309....................... 7.1..........................0.3 ........................ 32.0
Youth unemployment rate (%) ...............................................................58.........................0.001..................... 18.6..........................1.6 ........................ 48.2
Talent
Country capacity to attract talent1 ........................................................19.........................1.031..................... 4.50........................1.48 ........................ 6.08
Country capacity to retain talent1..........................................................11.........................1.557..................... 5.04........................1.81 ........................ 5.97
Ease of finding skilled employees1 ........................................................48.........................0.223..................... 4.14........................2.13 ........................ 5.69
Pay related to productivity1 ...................................................................28.........................0.773..................... 4.39........................2.37 ........................ 5.25
Capacity for innovation1........................................................................56.......................–0.195..................... 3.55........................2.31 ........................ 5.84
Index of Economic Complexity3 ............................................................74.......................–0.483................... –0.35......................–1.96 ........................ 2.37
Firm level technology absorption1 .........................................................42.........................0.393..................... 5.10........................3.17 ........................ 6.23
Scientific and technical journal articles (per 1,000 people) ....................37.......................–0.261................... 0.110......................0.000 ...................... 1.242
Median age of the working population ..................................................49.........................0.444........................ 37...........................28 ........................... 42
Training
Staff training1 ........................................................................................40.........................0.374..................... 4.29........................2.51 ........................ 5.57
Training services1 ..................................................................................39.........................0.356..................... 4.59........................2.67 ........................ 6.47
Chile

2.1: Country Profiles
NOTESIn the sections for Pillar 1, Pillar 2, Pillar 3 and Pillar 4, values under Country Value, Sample Minimum and Sample Maximum refer to underlying data for each variable.For further details and explanations, please refer to the section “How to Read the Country Profiles”.1 Survey data responses on a 1- to 7-scale (1 = worst score, 7 = best score)2 Data on a 0- to 1-scale (0 = worst score, 1 = best score)3 Data from -1.960 (worst score) to 2.367 (best score)4 Rank number on a list of 185 countries5 Index on a scale of 0 (perfect inequality) to 100 (perfect equality)6 International test scores7 Perception survey data. Percentage of yes responses.8 Score (1 = best, 7 = worst)9 Reported in relation to UK score (100)
The Human Capital Report | 137
ChilePillar 4: Enabling Environment Rank/122 Z-Score Country Value Sample Minimum Sample Maximum
Infrastructure
Mobile users (per 100 people) ..............................................................28.........................0.665...................... 130...........................17 ......................... 191
Internet users (per 100 people) .............................................................45.........................0.359........................ 54.............................1 ........................... 95
Quality of domestic transport1 ..............................................................26.........................0.809 ..................... 5.17 ........................2.08 ........................ 6.51
Collaboration
State of cluster development1 ..............................................................45.........................0.259..................... 4.08........................2.33 ........................ 5.49
Business and university R&D collaboration1 ..........................................37.........................0.549 ..................... 4.27 ........................2.11 ........................ 5.84
Legal framework
Doing Business Index4 .........................................................................35.........................0.833........................ 37.............................1 ......................... 180
Social safety net protection1 .................................................................47.........................0.091..................... 3.88........................2.10 ........................ 6.26
Intellectual property protection and property rights1..............................40.........................0.372 ..................... 4.47 ........................1.62 ........................ 6.31
Social mobility
Social mobility1 .....................................................................................38.........................0.301..................... 4.66........................2.78 ........................ 6.36
Additional indicatorsDemographics Value
Child dependency ratio (%)..................................................................... 32.2Aged dependency ratio (%) .................................................................... 13.4Fertility rate (births per woman) ................................................................. 1.9Sex ratio at birth (female/male) ............................................................... 0.96Population below age 20 (%) .................................................................. 30.8Population above age 60 (%) .................................................................. 13.1
Education
Public spending on education (% of GDP) ................................................ 4.1Technical/vocational enrolment as % of total
enrolment in secondary school ........................................................... 24Adult literacy (%) ..................................................................................... 98.6Boys not in primary school (%) .................................................................... 7Girls not in primary school (%) ..................................................................... 7Education poverty (% of children age 17-22
with less than 2-4 years schooling) ......................................................—Private enrolment in primary school (% of primary) ................................. 59.1Private enrolment in secondary school (% of secondary) ........................ 59.0PIRLS6 .......................................................................................................—PISA math scores6 .................................................................................. 421PISA reading scores6 ............................................................................... 449PISA science scores6 .............................................................................. 447TIMSS 4th grade math6 ........................................................................... 462TIMSS 4th grade science6 ....................................................................... 480TIMSS 8th grade math6 ........................................................................... 416TIMSS 8th grade science6 ....................................................................... 461
Health
Prevalence of visual impairment (%) .......................................................... 3.0Public spending on health (% of GDP) ...................................................... 7.5Business impact of heart disease1 .......................................................... 4.43Business impact of cancer1 .................................................................... 4.37Business impact of mental illness1 .......................................................... 4.88Business impact of diabetes1 ................................................................. 4.52Business impact of chronic respiratory disease1 ..................................... 4.60Business impact of HIV/AIDS1 ................................................................ 5.78Business impact of tuberculosis1 ............................................................ 6.18Business impact of malaria1 ................................................................... 6.37
Society Value
Freedom in the World8................................................................................. 1Democracy Index (rank/165) ...................................................................... 36Population living in urban area (%) .......................................................... 89.3Gini Index (income)5................................................................................ 52.1Accessibility of digital content1 ............................................................... 5.47Extent of virtual social networks use1 ..................................................... 6.14
Workforce
Economic activity (agriculture) — % of total activity ................................ 10.6Economic activity (industry) — % of total activity .................................... 23.0Economic activity (services) — % of total activity .................................... 66.4GDP per person employed (US$) ....................................................... 33,860Cooperation in labour-employer relations1 .............................................. 4.64Emigration rate of the tertiary educated (%) .............................................. 6.0Labour force with tertiary education (%) ................................................. 25.9Number of patent applications (per 1,000 people) .............................. 0.1628Hiring and firing practices1 ...................................................................... 3.97Retirement age, male ................................................................................ 65Retirement age, female .............................................................................. 60Number of informal sector workers (1,000s) ...............................................—Total employed (1,000s) ....................................................................... 7,354Total unemployed (1,000s) ....................................................................... 564Unemployment for 12 months or more
as a % of total unemployment ......................................................... 23.8Total youth not in education or employment (1,000s) ........................... 342.4Unemployment for 12 months or more (1,000s) ................................... 134.3Global Innovation Index (rank/142) ............................................................ 46Global Talent Index (rank/60) ..................................................................... 31Quality of Labour Force (rank/60) .............................................................. 30Talent Environment (rank/60) ..................................................................... 27IQ measure9 ........................................................................................... 89.5
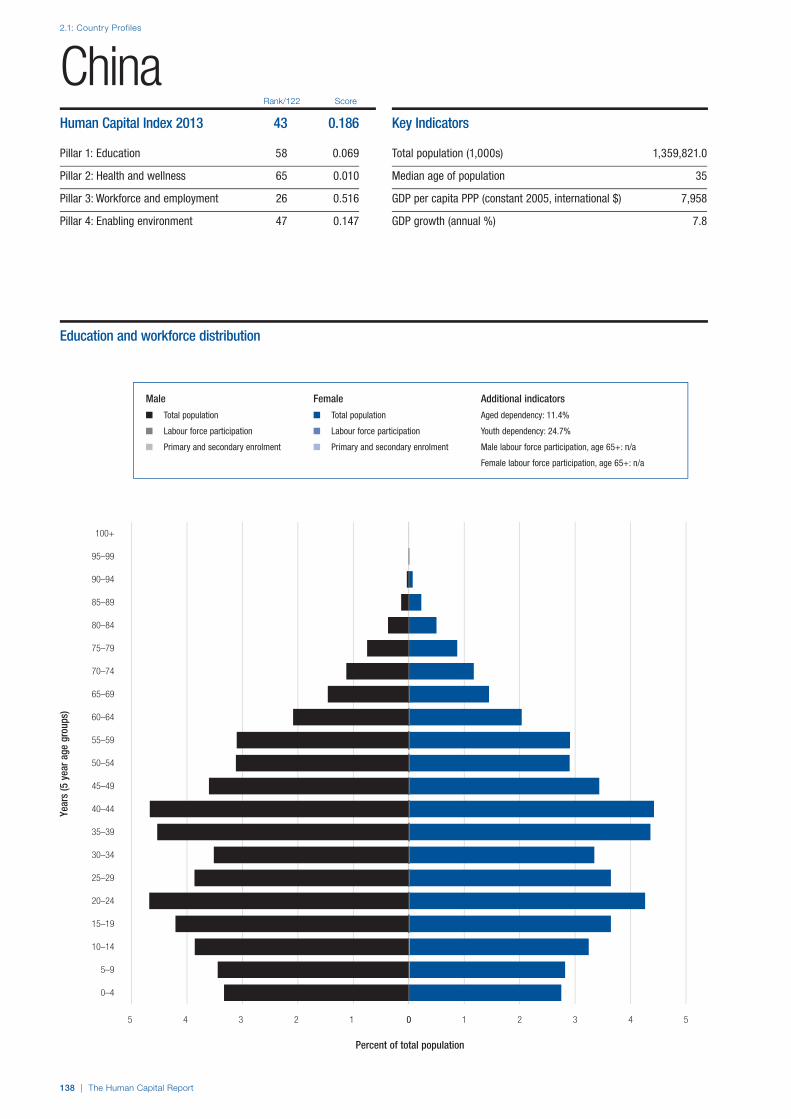
2.1: Country Profiles
138 | The Human Capital Report
Rank/122 Score
Year
s (5
yea
r age
gro
ups)
Percent of total population
0–4
5–9
10–14
15–19
20–24
25–29
30–34
35–39
40–44
45–49
50–54
55–59
60–64
65–69
70–74
75–79
80–84
85–89
90–94
95–99
100+
0 1 2 3 4 55 4 3 2 1 0
ChinaHuman Capital Index 2013 43 0.186
Pillar 1: Education 58 0.069
Pillar 2: Health and wellness 65 0.010
Pillar 3: Workforce and employment 26 0.516
Pillar 4: Enabling environment 47 0.147
Key Indicators
Total population (1,000s) 1,359,821.0
Median age of population 35
GDP per capita PPP (constant 2005, international $) 7,958
GDP growth (annual %) 7.8
Male Female Additional indicators
n Total population n Total population Aged dependency: 11.4%
n Labour force participation n Labour force participation Youth dependency: 24.7%
n Primary and secondary enrolment n Primary and secondary enrolment Male labour force participation, age 65+: n/a
Female labour force participation, age 65+: n/a
Education and workforce distribution
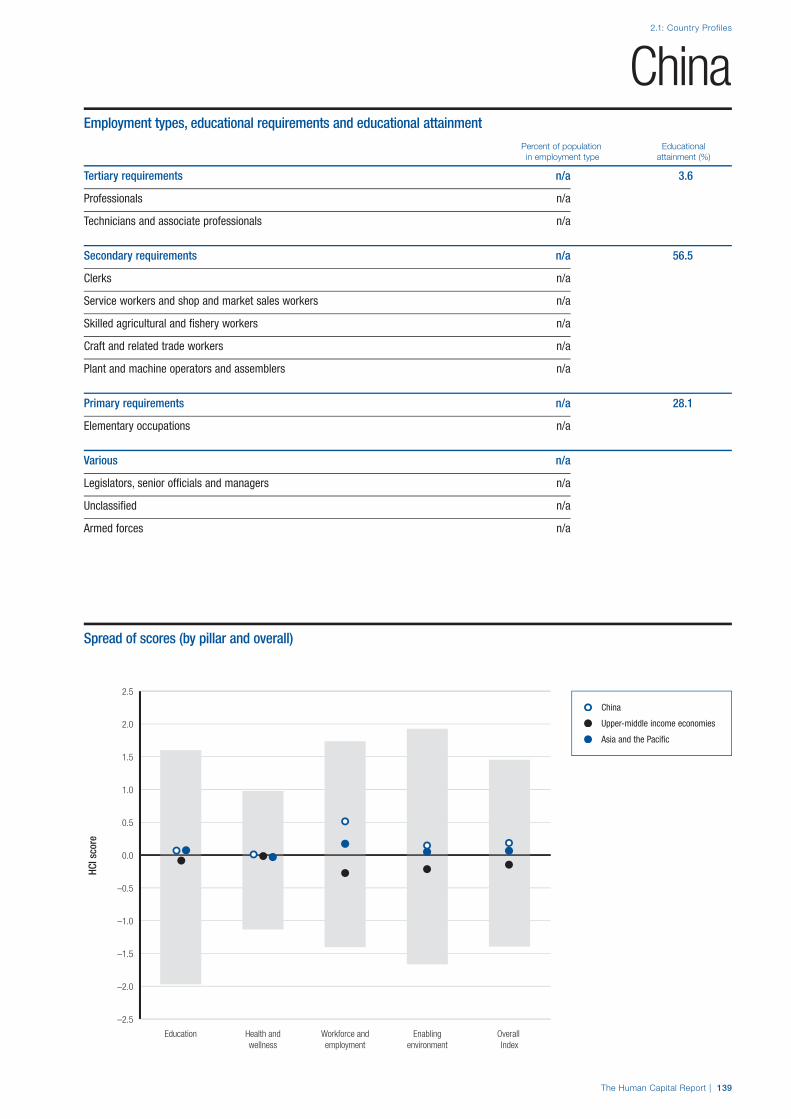
The Human Capital Report | 139
2.1: Country Profiles
HCI s
core
–2.5
–2.0
–1.5
–1.0
–0.5
0.0
0.5
1.0
1.5
2.0
2.5
Overall Index
Enablingenvironment
Workforce andemployment
Health andwellness
Education
ChinaEmployment types, educational requirements and educational attainment
Percent of population Educational in employment type attainment (%)
Tertiary requirements n/a 3.6
Professionals n/a
Technicians and associate professionals n/a
Secondary requirements n/a 56.5
Clerks n/a
Service workers and shop and market sales workers n/a
Skilled agricultural and fishery workers n/a
Craft and related trade workers n/a
Plant and machine operators and assemblers n/a
Primary requirements n/a 28.1
Elementary occupations n/a
Various n/a
Legislators, senior officials and managers n/a
Unclassified n/a
Armed forces n/a
Spread of scores (by pillar and overall)
China
Upper-middle income economies
Asia and the Pacific

2.1: Country Profiles
140 | The Human Capital Report
Pillar 1: Education Rank/122 Z-Score Country Value Sample Minimum Sample Maximum
Access
Primary enrolment rate (%) ...................................................................—..............................— .........................— ...........................58 ......................... 100
Secondary enrolment rate (%) ..............................................................—..............................— .........................— ...........................16 ......................... 100
Tertiary enrolment ratio (%) ...................................................................74.......................–0.523........................ 27.............................1 ......................... 103
Education gender gap2 .........................................................................78.........................0.309................... 0.982......................0.645 ...................... 1.000
Quality
Internet access in schools1 ...................................................................31.........................0.798..................... 5.32........................1.64 ........................ 6.64
Quality of the education system1 ..........................................................43.........................0.248..................... 4.02........................1.99 ........................ 5.98
Quality of primary schools1 ...................................................................47.........................0.296..................... 4.26........................1.97 ........................ 6.82
Quality of math & science education1 ...................................................43.........................0.400..................... 4.42........................1.88 ........................ 6.29
Quality of management schools1 ..........................................................72.......................–0.222..................... 4.11........................2.29 ........................ 6.09
Attainment
Primary education attainment (% population age 25+) ..........................26.........................0.691........................ 93.............................5 ......................... 100
Secondary education attainment (% population age 25+) .....................41.........................0.087........................ 65.............................2 ......................... 100
Tertiary education attainment (% population age 25+) ..........................77.......................–1.394.......................... 4.............................0 ........................... 44
Pillar 2: Health and Wellness Rank/122 Z-Score Country Value Sample Minimum Sample Maximum
Survival
Infant mortality (per 1,000 live births) ....................................................57.........................0.383........................ 13.............................2 ........................... 98
Life expectancy ...................................................................................42.........................0.420........................ 76...........................50 ........................... 83
Survival gender gap2 ..........................................................................115.......................–3.218................... 0.934......................0.920 ...................... 0.980
Health
Stunting and wasting (% in children under 5) ........................................10.........................1.077....................... 5.9..........................1.2 ........................ 36.5
Unhealthy life years (% of life expectancy) ............................................54.........................0.245........................ 13.............................8 ........................... 66
Deaths under 60 from non-communicable
diseases (% of all NCD deaths) ......................................................49.........................0.494 ..................... 20.3 ..........................7.3 ........................ 55.8
Obesity (% of adults with BMI ≥ 30) .....................................................20.........................1.365....................... 5.6..........................1.1 ........................ 42.8
Business impact of non-communicable diseases1 ................................46.........................0.310..................... 4.62........................2.74 ........................ 5.87
Business impact of communicable diseases1 .......................................84.......................–0.311..................... 5.17........................3.13 ........................ 6.90
Well-being
Stress (% of respondents)7 ..................................................................70.......................–0.250........................ 34.............................8 ........................... 69
Depression (% of respondents)7 ...........................................................47.........................0.297........................ 10.............................2 ........................... 37
Services
Water, sanitation and hygiene (% with access) .....................................88.......................–0.297..................... 78.3........................31.1 ...................... 100.0
Healthcare quality1................................................................................61.......................–0.168..................... 3.90........................1.78 ........................ 6.75
Healthcare accessibility1 .......................................................................64.......................–0.201..................... 4.42........................2.41 ........................ 6.75
Pillar 3: Workforce and Employment Rank/122 Z-Score Country Value Sample Minimum Sample Maximum
Participation
Labour force participation rate, age 15-64 (%) .....................................14.........................1.146..................... 80.4........................43.4 ........................ 90.6
Labour force participation rate, age 65+ (%) .........................................56.......................–0.271..................... 19.4..........................1.6 ........................ 91.2
Economic participation gender gap2 .....................................................52.........................0.269................... 0.675......................0.310 ...................... 0.839
Unemployment rate (%) ........................................................................16.........................0.886....................... 4.1..........................0.3 ........................ 32.0
Youth unemployment rate (%) ...............................................................—..............................— .........................— ..........................1.6 ........................ 48.2
Talent
Country capacity to attract talent1 ........................................................21.........................0.918..................... 4.39........................1.48 ........................ 6.08
Country capacity to retain talent1..........................................................28.........................0.770..................... 4.28........................1.81 ........................ 5.97
Ease of finding skilled employees1 ........................................................22.........................1.001..................... 4.68........................2.13 ........................ 5.69
Pay related to productivity1 ...................................................................15.........................1.208..................... 4.66........................2.37 ........................ 5.25
Capacity for innovation1........................................................................27.........................0.610..................... 4.19........................2.31 ........................ 5.84
Index of Economic Complexity3 ............................................................26.........................0.822..................... 0.89......................–1.96 ........................ 2.37
Firm level technology absorption1 .........................................................63.......................–0.176..................... 4.69........................3.17 ........................ 6.23
Scientific and technical journal articles (per 1,000 people) ....................52.......................–0.443................... 0.055......................0.000 ...................... 1.242
Median age of the working population ..................................................45.........................0.608........................ 37...........................28 ........................... 42
Training
Staff training1 ........................................................................................42.........................0.328..................... 4.26........................2.51 ........................ 5.57
Training services1 ..................................................................................57.........................0.064..................... 4.36........................2.67 ........................ 6.47
China

2.1: Country Profiles
NOTESIn the sections for Pillar 1, Pillar 2, Pillar 3 and Pillar 4, values under Country Value, Sample Minimum and Sample Maximum refer to underlying data for each variable.For further details and explanations, please refer to the section “How to Read the Country Profiles”.1 Survey data responses on a 1- to 7-scale (1 = worst score, 7 = best score)2 Data on a 0- to 1-scale (0 = worst score, 1 = best score)3 Data from -1.960 (worst score) to 2.367 (best score)4 Rank number on a list of 185 countries5 Index on a scale of 0 (perfect inequality) to 100 (perfect equality)6 International test scores7 Perception survey data. Percentage of yes responses.8 Score (1 = best, 7 = worst)9 Reported in relation to UK score (100)
The Human Capital Report | 141
ChinaPillar 4: Enabling Environment Rank/122 Z-Score Country Value Sample Minimum Sample Maximum
Infrastructure
Mobile users (per 100 people) ............................................................104.......................–0.996........................ 73...........................17 ......................... 191
Internet users (per 100 people) .............................................................67.......................–0.198........................ 38.............................1 ........................... 95
Quality of domestic transport1 ..............................................................43.........................0.365..................... 4.79........................2.08 ........................ 6.51
Collaboration
State of cluster development1 ..............................................................22.........................1.011..................... 4.61........................2.33 ........................ 5.49
Business and university R&D collaboration1 ..........................................31.........................0.706 ..................... 4.41 ........................2.11 ........................ 5.84
Legal framework
Doing Business Index4 .........................................................................73.......................–0.214........................ 91.............................1 ......................... 180
Social safety net protection1 .................................................................35.........................0.509..................... 4.33........................2.10 ........................ 6.26
Intellectual property protection and property rights1..............................44.........................0.189 ..................... 4.28 ........................1.62 ........................ 6.31
Social mobility
Social mobility1 .....................................................................................59.......................–0.044..................... 4.35........................2.78 ........................ 6.36
Additional indicatorsDemographics Value
Child dependency ratio (%)..................................................................... 24.7Aged dependency ratio (%) .................................................................... 11.4Fertility rate (births per woman) ................................................................. 1.6Sex ratio at birth (female/male) ............................................................... 0.89Population below age 20 (%) .................................................................. 26.1Population above age 60 (%) .................................................................. 12.4
Education
Public spending on education (% of GDP) ................................................ 1.9Technical/vocational enrolment as % of total
enrolment in secondary school ........................................................... 21Adult literacy (%) ..................................................................................... 95.1Boys not in primary school (%) ...................................................................—Girls not in primary school (%) ....................................................................—Education poverty (% of children age 17-22
with less than 2-4 years schooling) ......................................................—Private enrolment in primary school (% of primary) ................................... 5.4Private enrolment in secondary school (% of secondary) ........................ 10.7PIRLS6 .......................................................................................................—PISA math scores6 .....................................................................................—PISA reading scores6 ..................................................................................—PISA science scores6 .................................................................................—TIMSS 4th grade math6 ..............................................................................—TIMSS 4th grade science6 ..........................................................................—TIMSS 8th grade math6 ..............................................................................—TIMSS 8th grade science6 ..........................................................................—
Health
Prevalence of visual impairment (%) .......................................................... 2.7Public spending on health (% of GDP) ...................................................... 5.2Business impact of heart disease1 .......................................................... 4.52Business impact of cancer1 .................................................................... 4.58Business impact of mental illness1 .......................................................... 4.75Business impact of diabetes1 ................................................................. 4.69Business impact of chronic respiratory disease1 ..................................... 4.55Business impact of HIV/AIDS1 ................................................................ 5.14Business impact of tuberculosis1 ............................................................ 5.06Business impact of malaria1 ................................................................... 5.30
Society Value
Freedom in the World8................................................................................. 7Democracy Index (rank/165) .................................................................... 142Population living in urban area (%) .......................................................... 51.8Gini Index (income)5................................................................................ 42.1Accessibility of digital content1 ............................................................... 5.17Extent of virtual social networks use1 ..................................................... 4.73
Workforce
Economic activity (agriculture) — % of total activity ................................ 36.7Economic activity (industry) — % of total activity .................................... 28.7Economic activity (services) — % of total activity .................................... 34.6GDP per person employed (US$) ....................................................... 14,196Cooperation in labour-employer relations1 .............................................. 4.40Emigration rate of the tertiary educated (%) .............................................. 3.8Labour force with tertiary education (%) .....................................................—Number of patent applications (per 1,000 people) .............................. 0.3871Hiring and firing practices1 ...................................................................... 4.42Retirement age, male ................................................................................ 60Retirement age, female .........................................................................50-55Number of informal sector workers (1,000s) ...............................................—Total employed (1,000s) ................................................................... 761,050Total unemployed (1,000s) .................................................................... 9,080Unemployment for 12 months or more
as a % of total unemployment .............................................................—Total youth not in education or employment (1,000s) .................................—Unemployment for 12 months or more (1,000s) .........................................—Global Innovation Index (rank/142) ............................................................ 35Global Talent Index (rank/60) ..................................................................... 33Quality of Labour Force (rank/60) .............................................................. 44Talent Environment (rank/60) ..................................................................... 29IQ measure9 ......................................................................................... 105.9
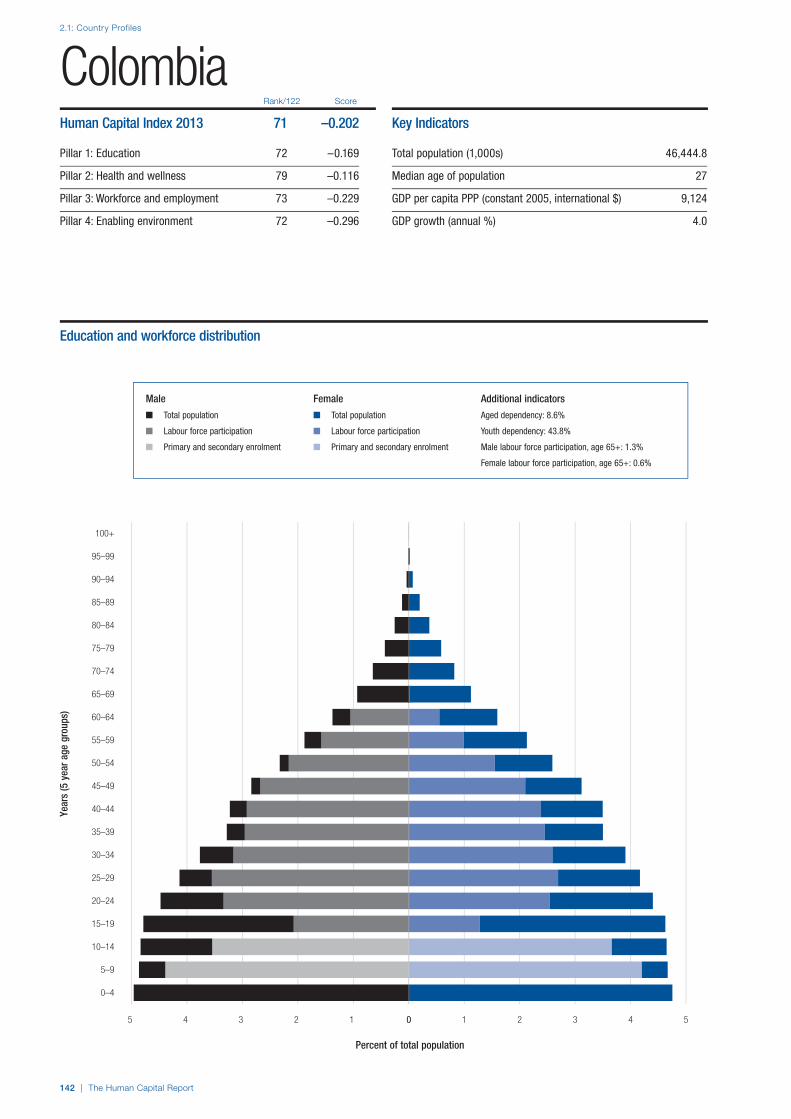
2.1: Country Profiles
142 | The Human Capital Report
Rank/122 Score
Year
s (5
yea
r age
gro
ups)
Percent of total population
0–4
5–9
10–14
15–19
20–24
25–29
30–34
35–39
40–44
45–49
50–54
55–59
60–64
65–69
70–74
75–79
80–84
85–89
90–94
95–99
100+
0 1 2 3 4 55 4 3 2 1 0
ColombiaHuman Capital Index 2013 71 –0.202
Pillar 1: Education 72 –0.169
Pillar 2: Health and wellness 79 –0.116
Pillar 3: Workforce and employment 73 –0.229
Pillar 4: Enabling environment 72 –0.296
Key Indicators
Total population (1,000s) 46,444.8
Median age of population 27
GDP per capita PPP (constant 2005, international $) 9,124
GDP growth (annual %) 4.0
Male Female Additional indicators
n Total population n Total population Aged dependency: 8.6%
n Labour force participation n Labour force participation Youth dependency: 43.8%
n Primary and secondary enrolment n Primary and secondary enrolment Male labour force participation, age 65+: 1.3%
Female labour force participation, age 65+: 0.6%
Education and workforce distribution
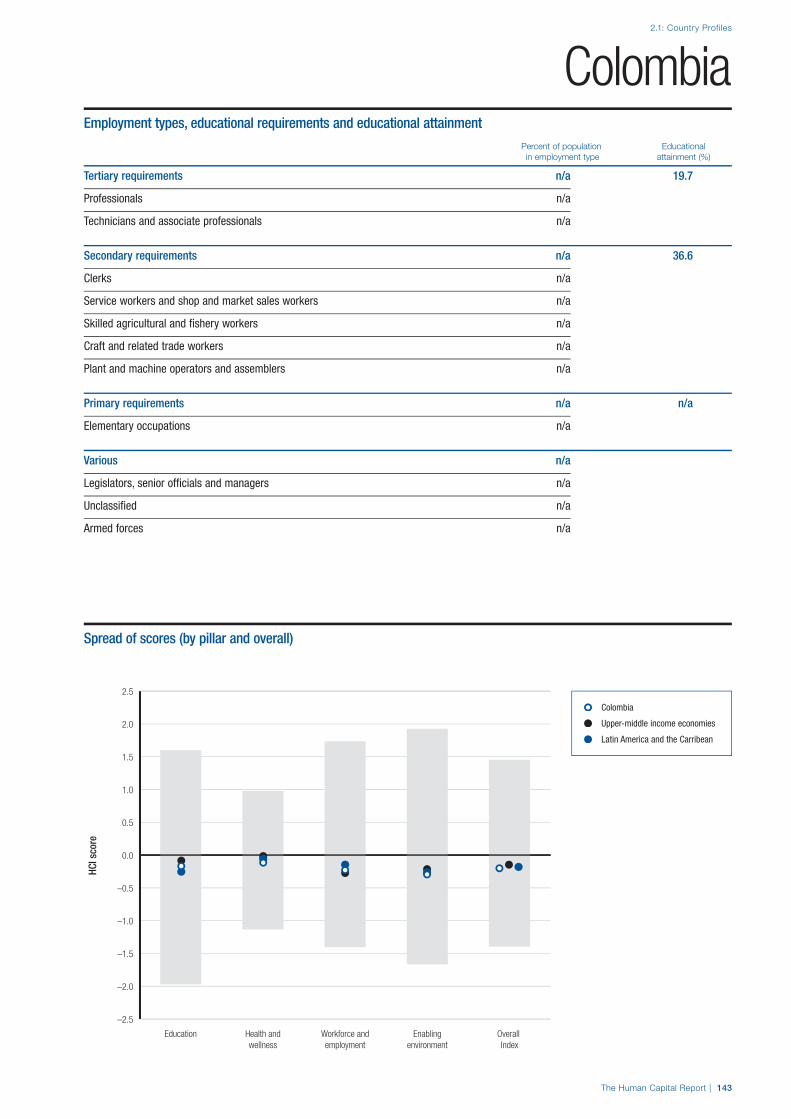
The Human Capital Report | 143
2.1: Country Profiles
HCI s
core
–2.5
–2.0
–1.5
–1.0
–0.5
0.0
0.5
1.0
1.5
2.0
2.5
Overall Index
Enablingenvironment
Workforce andemployment
Health andwellness
Education
ColombiaEmployment types, educational requirements and educational attainment
Percent of population Educational in employment type attainment (%)
Tertiary requirements n/a 19.7
Professionals n/a
Technicians and associate professionals n/a
Secondary requirements n/a 36.6
Clerks n/a
Service workers and shop and market sales workers n/a
Skilled agricultural and fishery workers n/a
Craft and related trade workers n/a
Plant and machine operators and assemblers n/a
Primary requirements n/a n/a
Elementary occupations n/a
Various n/a
Legislators, senior officials and managers n/a
Unclassified n/a
Armed forces n/a
Spread of scores (by pillar and overall)
Colombia
Upper-middle income economies
Latin America and the Carribean

2.1: Country Profiles
144 | The Human Capital Report
Pillar 1: Education Rank/122 Z-Score Country Value Sample Minimum Sample Maximum
Access
Primary enrolment rate (%) ...................................................................93.......................–0.383........................ 90...........................58 ......................... 100
Secondary enrolment rate (%) ..............................................................60.........................0.160........................ 76...........................16 ......................... 100
Tertiary enrolment ratio (%) ...................................................................53.........................0.089........................ 43.............................1 ......................... 103
Education gender gap2 .........................................................................46.........................0.475................... 0.994......................0.645 ...................... 1.000
Quality
Internet access in schools1 ...................................................................72.......................–0.321..................... 3.92........................1.64 ........................ 6.64
Quality of the education system1 ..........................................................72.......................–0.356..................... 3.48........................1.99 ........................ 5.98
Quality of primary schools1 ...................................................................88.......................–0.633..................... 3.25........................1.97 ........................ 6.82
Quality of math & science education1 ...................................................90.......................–0.698..................... 3.37........................1.88 ........................ 6.29
Quality of management schools1 ..........................................................62.......................–0.019..................... 4.28........................2.29 ........................ 6.09
Attainment
Primary education attainment (% population age 25+) ..........................—..............................— .........................— .............................5 ......................... 100
Secondary education attainment (% population age 25+) .....................48.......................–0.253........................ 56.............................2 ......................... 100
Tertiary education attainment (% population age 25+) ..........................39.........................0.080........................ 20.............................0 ........................... 44
Pillar 2: Health and Wellness Rank/122 Z-Score Country Value Sample Minimum Sample Maximum
Survival
Infant mortality (per 1,000 live births) ....................................................68.........................0.293........................ 15.............................2 ........................... 98
Life expectancy ...................................................................................35.........................0.664........................ 78...........................50 ........................... 83
Survival gender gap2 ............................................................................28.........................0.714................... 0.979......................0.920 ...................... 0.980
Health
Stunting and wasting (% in children under 5) ........................................17.........................0.969....................... 6.8..........................1.2 ........................ 36.5
Unhealthy life years (% of life expectancy) ............................................84.......................–0.125........................ 15.............................8 ........................... 66
Deaths under 60 from non-communicable
diseases (% of all NCD deaths) ......................................................70.......................–0.166 ..................... 28.7 ..........................7.3 ........................ 55.8
Obesity (% of adults with BMI ≥ 30) .....................................................51.........................0.046..................... 18.1..........................1.1 ........................ 42.8
Business impact of non-communicable diseases1 ..............................102.......................–0.830..................... 4.11........................2.74 ........................ 5.87
Business impact of communicable diseases1 .......................................89.......................–0.483..................... 5.00........................3.13 ........................ 6.90
Well-being
Stress (% of respondents)7 ..................................................................90.......................–0.638........................ 39.............................8 ........................... 69
Depression (% of respondents)7 ...........................................................85.......................–0.500........................ 15.............................2 ........................... 37
Services
Water, sanitation and hygiene (% with access) .....................................76.........................0.069..................... 85.5........................31.1 ...................... 100.0
Healthcare quality1................................................................................88.......................–0.799..................... 3.13........................1.78 ........................ 6.75
Healthcare accessibility1 .......................................................................91.......................–0.832..................... 3.65........................2.41 ........................ 6.75
Pillar 3: Workforce and Employment Rank/122 Z-Score Country Value Sample Minimum Sample Maximum
Participation
Labour force participation rate, age 15-64 (%) .....................................58.........................0.103..................... 70.2........................43.4 ........................ 90.6
Labour force participation rate, age 65+ (%) .........................................36.........................0.343..................... 31.3..........................1.6 ........................ 91.2
Economic participation gender gap2 .....................................................76.......................–0.194................... 0.621......................0.310 ...................... 0.839
Unemployment rate (%) ........................................................................86.......................–0.584..................... 11.8..........................0.3 ........................ 32.0
Youth unemployment rate (%) ...............................................................74.......................–0.452..................... 23.0..........................1.6 ........................ 48.2
Talent
Country capacity to attract talent1 ........................................................74.......................–0.318..................... 3.11........................1.48 ........................ 6.08
Country capacity to retain talent1..........................................................55.......................–0.031..................... 3.50........................1.81 ........................ 5.97
Ease of finding skilled employees1 ........................................................45.........................0.298..................... 4.19........................2.13 ........................ 5.69
Pay related to productivity1 ...................................................................86.......................–0.542..................... 3.59........................2.37 ........................ 5.25
Capacity for innovation1........................................................................72.......................–0.405..................... 3.38........................2.31 ........................ 5.84
Index of Economic Complexity3 ............................................................50.........................0.074..................... 0.18......................–1.96 ........................ 2.37
Firm level technology absorption1 .........................................................83.......................–0.638..................... 4.36........................3.17 ........................ 6.23
Scientific and technical journal articles (per 1,000 people) ....................78.......................–0.584................... 0.013......................0.000 ...................... 1.242
Median age of the working population ..................................................64.......................–0.179........................ 34...........................28 ........................... 42
Training
Staff training1 ........................................................................................79.......................–0.478..................... 3.74........................2.51 ........................ 5.57
Training services1 ..................................................................................63.......................–0.071..................... 4.25........................2.67 ........................ 6.47
Colombia

2.1: Country Profiles
NOTESIn the sections for Pillar 1, Pillar 2, Pillar 3 and Pillar 4, values under Country Value, Sample Minimum and Sample Maximum refer to underlying data for each variable.For further details and explanations, please refer to the section “How to Read the Country Profiles”.1 Survey data responses on a 1- to 7-scale (1 = worst score, 7 = best score)2 Data on a 0- to 1-scale (0 = worst score, 1 = best score)3 Data from -1.960 (worst score) to 2.367 (best score)4 Rank number on a list of 185 countries5 Index on a scale of 0 (perfect inequality) to 100 (perfect equality)6 International test scores7 Perception survey data. Percentage of yes responses.8 Score (1 = best, 7 = worst)9 Reported in relation to UK score (100)
The Human Capital Report | 145
ColombiaPillar 4: Enabling Environment Rank/122 Z-Score Country Value Sample Minimum Sample Maximum
Infrastructure
Mobile users (per 100 people) ..............................................................80.......................–0.254........................ 98...........................17 ......................... 191
Internet users (per 100 people) .............................................................63.......................–0.123........................ 40.............................1 ........................... 95
Quality of domestic transport1 ............................................................103.......................–0.880..................... 3.70........................2.08 ........................ 6.51
Collaboration
State of cluster development1 ..............................................................64.......................–0.149..................... 3.79........................2.33 ........................ 5.49
Business and university R&D collaboration1 ..........................................48.........................0.076 ..................... 3.85 ........................2.11 ........................ 5.84
Legal framework
Doing Business Index4 .........................................................................42.........................0.678........................ 45.............................1 ......................... 180
Social safety net protection1 .................................................................86.......................–0.691..................... 3.03........................2.10 ........................ 6.26
Intellectual property protection and property rights1..............................81.......................–0.547 ..................... 3.53 ........................1.62 ........................ 6.31
Social mobility
Social mobility1 .....................................................................................94.......................–0.771..................... 3.69........................2.78 ........................ 6.36
Additional indicatorsDemographics Value
Child dependency ratio (%)..................................................................... 43.8Aged dependency ratio (%) ...................................................................... 8.6Fertility rate (births per woman) ................................................................. 2.5Sex ratio at birth (female/male) ............................................................... 0.94Population below age 20 (%) .................................................................. 38.2Population above age 60 (%) .................................................................... 8.6
Education
Public spending on education (% of GDP) ................................................ 4.5Technical/vocational enrolment as % of total
enrolment in secondary school ............................................................. 6Adult literacy (%) ..................................................................................... 93.6Boys not in primary school (%) .................................................................. 10Girls not in primary school (%) ................................................................... 10Education poverty (% of children age 17-22
with less than 2-4 years schooling) ................................................ 0.095Private enrolment in primary school (% of primary) ................................. 18.5Private enrolment in secondary school (% of secondary) ........................ 20.4PIRLS6 .................................................................................................... 448PISA math scores6 .................................................................................. 381PISA reading scores6 ............................................................................... 413PISA science scores6 .............................................................................. 402TIMSS 4th grade math6 ..............................................................................—TIMSS 4th grade science6 ..........................................................................—TIMSS 8th grade math6 ..............................................................................—TIMSS 8th grade science6 ..........................................................................—
Health
Prevalence of visual impairment (%) .......................................................... 4.0Public spending on health (% of GDP) ...................................................... 6.1Business impact of heart disease1 .......................................................... 3.92Business impact of cancer1 .................................................................... 3.97Business impact of mental illness1 .......................................................... 4.40Business impact of diabetes1 ................................................................. 4.22Business impact of chronic respiratory disease1 ..................................... 4.04Business impact of HIV/AIDS1 ................................................................ 4.78Business impact of tuberculosis1 ............................................................ 5.04Business impact of malaria1 ................................................................... 5.18
Society Value
Freedom in the World8................................................................................. 3Democracy Index (rank/165) ...................................................................... 57Population living in urban area (%) .......................................................... 75.6Gini Index (income)5................................................................................ 55.9Accessibility of digital content1 ............................................................... 4.72Extent of virtual social networks use1 ..................................................... 5.55
Workforce
Economic activity (agriculture) — % of total activity ................................ 17.9Economic activity (industry) — % of total activity .................................... 20.0Economic activity (services) — % of total activity .................................... 62.0GDP per person employed (US$) ....................................................... 18,163Cooperation in labour-employer relations1 .............................................. 4.46Emigration rate of the tertiary educated (%) ............................................ 10.4Labour force with tertiary education (%) ................................................. 25.3Number of patent applications (per 1,000 people) .............................. 0.0421Hiring and firing practices1 ...................................................................... 3.76Retirement age, male .................................................................................—Retirement age, female ...............................................................................—Number of informal sector workers (1,000s) ......................................... 9,307Total employed (1,000s) ..................................................................... 19,215Total unemployed (1,000s) .................................................................... 2,562Unemployment for 12 months or more
as a % of total unemployment ......................................................... 14.7Total youth not in education or employment (1,000s) ........................ 1,920.0Unemployment for 12 months or more (1,000s) ................................... 377.3Global Innovation Index (rank/142) ............................................................ 60Global Talent Index (rank/60) ..................................................................... 40Quality of Labour Force (rank/60) .............................................................. 42Talent Environment (rank/60) ..................................................................... 44IQ measure9 ........................................................................................... 83.5

2.1: Country Profiles
146 | The Human Capital Report
Rank/122 Score
Year
s (5
yea
r age
gro
ups)
Percent of total population
0–4
5–9
10–14
15–19
20–24
25–29
30–34
35–39
40–44
45–49
50–54
55–59
60–64
65–69
70–74
75–79
80–84
85–89
90–94
95–99
100+
0 1 2 3 4 55 4 3 2 1 0
Costa RicaHuman Capital Index 2013 35 0.320
Pillar 1: Education 39 0.382
Pillar 2: Health and wellness 30 0.445
Pillar 3: Workforce and employment 28 0.378
Pillar 4: Enabling environment 50 0.077
Key Indicators
Total population (1,000s) 4,669.7
Median age of population 28
GDP per capita PPP (constant 2005, international $) 11,156
GDP growth (annual %) 5.1
Male Female Additional indicators
n Total population n Total population Aged dependency: 9.5%
n Labour force participation n Labour force participation Youth dependency: 36.3%
n Primary and secondary enrolment n Primary and secondary enrolment Male labour force participation, age 65+: 0.9%
Female labour force participation, age 65+: 0.2%
Education and workforce distribution

The Human Capital Report | 147
2.1: Country Profiles
HCI s
core
–2.5
–2.0
–1.5
–1.0
–0.5
0.0
0.5
1.0
1.5
2.0
2.5
Overall Index
Enablingenvironment
Workforce andemployment
Health andwellness
Education
Costa RicaEmployment types, educational requirements and educational attainment
Percent of population Educational in employment type attainment (%)
Tertiary requirements 13.8 18.8
Professionals 6.1
Technicians and associate professionals 7.7
Secondary requirements 28.0 23.5
Clerks 4.9
Service workers and shop and market sales workers 9.1
Skilled agricultural and fishery workers 2.3
Craft and related trade workers 6.6
Plant and machine operators and assemblers 5.1
Primary requirements 14.5 34.5
Elementary occupations 14.5
Various 2.1
Legislators, senior officials and managers 1.9
Unclassified 0.2
Armed forces n/a
Spread of scores (by pillar and overall)
Costa Rica
Upper-middle income economies
Latin America and the Carribean

2.1: Country Profiles
148 | The Human Capital Report
Pillar 1: Education Rank/122 Z-Score Country Value Sample Minimum Sample Maximum
Access
Primary enrolment rate (%) ...................................................................—..............................— .........................— ...........................58 ......................... 100
Secondary enrolment rate (%) ..............................................................—..............................— .........................— ...........................16 ......................... 100
Tertiary enrolment ratio (%) ...................................................................52.........................0.092........................ 43.............................1 ......................... 103
Education gender gap2 ...........................................................................1.........................0.548................... 1.000......................0.645 ...................... 1.000
Quality
Internet access in schools1 ...................................................................52.........................0.207..................... 4.58........................1.64 ........................ 6.64
Quality of the education system1 ..........................................................20.........................1.199..................... 4.87........................1.99 ........................ 5.98
Quality of primary schools1 ...................................................................27.........................0.821..................... 4.83........................1.97 ........................ 6.82
Quality of math & science education1 ...................................................40.........................0.473..................... 4.49........................1.88 ........................ 6.29
Quality of management schools1 ..........................................................15.........................1.261..................... 5.35........................2.29 ........................ 6.09
Attainment
Primary education attainment (% population age 25+) ..........................44.........................0.005........................ 77.............................5 ......................... 100
Secondary education attainment (% population age 25+) .....................63.......................–0.780........................ 42.............................2 ......................... 100
Tertiary education attainment (% population age 25+) ..........................41.......................–0.007........................ 19.............................0 ........................... 44
Pillar 2: Health and Wellness Rank/122 Z-Score Country Value Sample Minimum Sample Maximum
Survival
Infant mortality (per 1,000 live births) ....................................................45.........................0.563.......................... 9.............................2 ........................... 98
Life expectancy ...................................................................................30.........................0.785........................ 79...........................50 ........................... 83
Survival gender gap2 ............................................................................56.........................0.323................... 0.975......................0.920 ...................... 0.980
Health
Stunting and wasting (% in children under 5) ..........................................5.........................1.367....................... 3.3..........................1.2 ........................ 36.5
Unhealthy life years (% of life expectancy) ............................................47.........................0.328........................ 13.............................8 ........................... 66
Deaths under 60 from non-communicable
diseases (% of all NCD deaths) ......................................................56.........................0.258 ..................... 23.3 ..........................7.3 ........................ 55.8
Obesity (% of adults with BMI ≥ 30) .....................................................90.......................–0.640..................... 24.6..........................1.1 ........................ 42.8
Business impact of non-communicable diseases1 ................................40.........................0.420..................... 4.67........................2.74 ........................ 5.87
Business impact of communicable diseases1 .......................................39.........................0.683..................... 6.16........................3.13 ........................ 6.90
Well-being
Stress (% of respondents)7 ..................................................................96.......................–0.870........................ 42.............................8 ........................... 69
Depression (% of respondents)7 ...........................................................47.........................0.297........................ 10.............................2 ........................... 37
Services
Water, sanitation and hygiene (% with access) .....................................54.........................0.570..................... 95.2........................31.1 ...................... 100.0
Healthcare quality1................................................................................27.........................1.036..................... 5.37........................1.78 ........................ 6.75
Healthcare accessibility1 .......................................................................25.........................1.107..................... 6.02........................2.41 ........................ 6.75
Pillar 3: Workforce and Employment Rank/122 Z-Score Country Value Sample Minimum Sample Maximum
Participation
Labour force participation rate, age 15-64 (%) .....................................76.......................–0.203..................... 67.2........................43.4 ........................ 90.6
Labour force participation rate, age 65+ (%) .........................................69.......................–0.498..................... 15.0..........................1.6 ........................ 91.2
Economic participation gender gap2 .....................................................86.......................–0.380................... 0.599......................0.310 ...................... 0.839
Unemployment rate (%) ........................................................................49.........................0.277....................... 7.3..........................0.3 ........................ 32.0
Youth unemployment rate (%) ...............................................................25.........................0.782..................... 11.0..........................1.6 ........................ 48.2
Talent
Country capacity to attract talent1 ........................................................31.........................0.526..................... 3.98........................1.48 ........................ 6.08
Country capacity to retain talent1..........................................................14.........................1.328..................... 4.82........................1.81 ........................ 5.97
Ease of finding skilled employees1 ..........................................................7.........................1.589..................... 5.09........................2.13 ........................ 5.69
Pay related to productivity1 ...................................................................47.........................0.366..................... 4.15........................2.37 ........................ 5.25
Capacity for innovation1........................................................................34.........................0.387..................... 4.01........................2.31 ........................ 5.84
Index of Economic Complexity3 ............................................................45.........................0.155..................... 0.26......................–1.96 ........................ 2.37
Firm level technology absorption1 .........................................................40.........................0.529..................... 5.19........................3.17 ........................ 6.23
Scientific and technical journal articles (per 1,000 people) ....................70.......................–0.557................... 0.021......................0.000 ...................... 1.242
Median age of the working population ..................................................63.......................–0.168........................ 34...........................28 ........................... 42
Training
Staff training1 ........................................................................................21.........................1.017..................... 4.70........................2.51 ........................ 5.57
Training services1 ..................................................................................22.........................0.900..................... 5.02........................2.67 ........................ 6.47
Costa Rica

2.1: Country Profiles
NOTESIn the sections for Pillar 1, Pillar 2, Pillar 3 and Pillar 4, values under Country Value, Sample Minimum and Sample Maximum refer to underlying data for each variable.For further details and explanations, please refer to the section “How to Read the Country Profiles”.1 Survey data responses on a 1- to 7-scale (1 = worst score, 7 = best score)2 Data on a 0- to 1-scale (0 = worst score, 1 = best score)3 Data from -1.960 (worst score) to 2.367 (best score)4 Rank number on a list of 185 countries5 Index on a scale of 0 (perfect inequality) to 100 (perfect equality)6 International test scores7 Perception survey data. Percentage of yes responses.8 Score (1 = best, 7 = worst)9 Reported in relation to UK score (100)
The Human Capital Report | 149
Costa RicaPillar 4: Enabling Environment Rank/122 Z-Score Country Value Sample Minimum Sample Maximum
Infrastructure
Mobile users (per 100 people) ..............................................................89.......................–0.437........................ 92...........................17 ......................... 191
Internet users (per 100 people) .............................................................61.......................–0.062........................ 42.............................1 ........................... 95
Quality of domestic transport1 ..............................................................68.......................–0.226 ..................... 4.27 ........................2.08 ........................ 6.51
Collaboration
State of cluster development1 ..............................................................43.........................0.320..................... 4.12........................2.33 ........................ 5.49
Business and university R&D collaboration1 ..........................................32.........................0.702 ..................... 4.41 ........................2.11 ........................ 5.84
Legal framework
Doing Business Index4 .........................................................................82.......................–0.583...................... 110.............................1 ......................... 180
Social safety net protection1 .................................................................44.........................0.119..................... 3.91........................2.10 ........................ 6.26
Intellectual property protection and property rights1..............................47.........................0.118 ..................... 4.21 ........................1.62 ........................ 6.31
Social mobility
Social mobility1 .....................................................................................29.........................0.744..................... 5.06........................2.78 ........................ 6.36
Additional indicatorsDemographics Value
Child dependency ratio (%)..................................................................... 36.3Aged dependency ratio (%) ...................................................................... 9.5Fertility rate (births per woman) ................................................................. 1.9Sex ratio at birth (female/male) ............................................................... 0.95Population below age 20 (%) .................................................................. 34.1Population above age 60 (%) .................................................................... 9.5
Education
Public spending on education (% of GDP) ................................................ 6.3Technical/vocational enrolment as % of total
enrolment in secondary school ........................................................... 15Adult literacy (%) ..................................................................................... 96.3Boys not in primary school (%) ...................................................................—Girls not in primary school (%) ....................................................................—Education poverty (% of children age 17-22
with less than 2-4 years schooling) ......................................................—Private enrolment in primary school (% of primary) ................................... 8.5Private enrolment in secondary school (% of secondary) .......................... 9.6PIRLS6 .......................................................................................................—PISA math scores6 .....................................................................................—PISA reading scores6 ..................................................................................—PISA science scores6 .................................................................................—TIMSS 4th grade math6 ..............................................................................—TIMSS 4th grade science6 ..........................................................................—TIMSS 8th grade math6 ..............................................................................—TIMSS 8th grade science6 ..........................................................................—
Health
Prevalence of visual impairment (%) .......................................................... 2.5Public spending on health (% of GDP) .................................................... 10.9Business impact of heart disease1 .......................................................... 4.47Business impact of cancer1 .................................................................... 4.37Business impact of mental illness1 .......................................................... 5.30Business impact of diabetes1 ................................................................. 4.50Business impact of chronic respiratory disease1 ..................................... 4.72Business impact of HIV/AIDS1 ................................................................ 5.75Business impact of tuberculosis1 ............................................................ 6.32Business impact of malaria1 ................................................................... 6.40
Society Value
Freedom in the World8................................................................................. 1Democracy Index (rank/165) ...................................................................... 22Population living in urban area (%) .......................................................... 65.1Gini Index (income)5................................................................................ 50.7Accessibility of digital content1 ............................................................... 5.46Extent of virtual social networks use1 ..................................................... 6.04
Workforce
Economic activity (agriculture) — % of total activity ................................ 14.1Economic activity (industry) — % of total activity .................................... 19.8Economic activity (services) — % of total activity .................................... 65.8GDP per person employed (US$) ....................................................... 18,518Cooperation in labour-employer relations1 .............................................. 5.34Emigration rate of the tertiary educated (%) .............................................. 7.1Labour force with tertiary education (%) ................................................. 18.1Number of patent applications (per 1,000 people) .............................. 0.1379Hiring and firing practices1 ...................................................................... 4.23Retirement age, male .................................................................................—Retirement age, female ...............................................................................—Number of informal sector workers (1,000s) ............................................ 754Total employed (1,000s) ....................................................................... 1,902Total unemployed (1,000s) ....................................................................... 150Unemployment for 12 months or more
as a % of total unemployment ......................................................... 11.4Total youth not in education or employment (1,000s) ........................... 176.1Unemployment for 12 months or more (1,000s) ..................................... 17.0Global Innovation Index (rank/142) ............................................................ 39Global Talent Index (rank/60) ......................................................................—Quality of Labour Force (rank/60) ...............................................................—Talent Environment (rank/60) ......................................................................—IQ measure9 ........................................................................................... 89.4

2.1: Country Profiles
150 | The Human Capital Report
Rank/122 Score
Year
s (5
yea
r age
gro
ups)
Percent of total population
0–4
5–9
10–14
15–19
20–24
25–29
30–34
35–39
40–44
45–49
50–54
55–59
60–64
65–69
70–74
75–79
80–84
85–89
90–94
95–99
100+
0 1 2 3 4 5 6 7 88 7 6 5 4 3 2 1 0
Côte d’IvoireHuman Capital Index 2013 109 –0.759
Pillar 1: Education 114 –1.302
Pillar 2: Health and wellness 95 –0.418
Pillar 3: Workforce and employment 72 –0.208
Pillar 4: Enabling environment 114 –1.107
Key Indicators
Total population (1,000s) 18,976.6
Median age of population 19
GDP per capita PPP (constant 2005, international $) 1,757
GDP growth (annual %) 9.5
Male Female Additional indicators
n Total population n Total population Aged dependency: 5.6%
n Labour force participation n Labour force participation Youth dependency: 75.9%
n Primary and secondary enrolment n Primary and secondary enrolment Male labour force participation, age 65+: n/a
Female labour force participation, age 65+: n/a
Education and workforce distribution
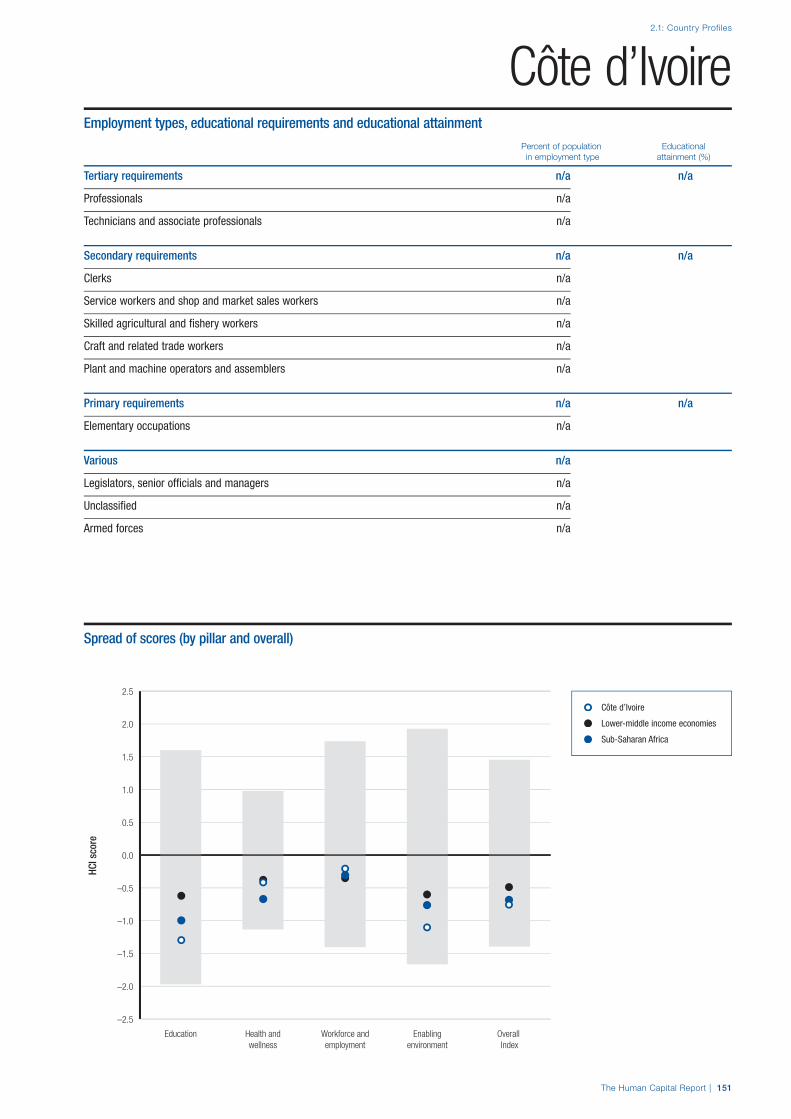
The Human Capital Report | 151
2.1: Country Profiles
HCI s
core
–2.5
–2.0
–1.5
–1.0
–0.5
0.0
0.5
1.0
1.5
2.0
2.5
Overall Index
Enablingenvironment
Workforce andemployment
Health andwellness
Education
Côte d’IvoireEmployment types, educational requirements and educational attainment
Percent of population Educational in employment type attainment (%)
Tertiary requirements n/a n/a
Professionals n/a
Technicians and associate professionals n/a
Secondary requirements n/a n/a
Clerks n/a
Service workers and shop and market sales workers n/a
Skilled agricultural and fishery workers n/a
Craft and related trade workers n/a
Plant and machine operators and assemblers n/a
Primary requirements n/a n/a
Elementary occupations n/a
Various n/a
Legislators, senior officials and managers n/a
Unclassified n/a
Armed forces n/a
Spread of scores (by pillar and overall)
Côte d’Ivoire
Lower-middle income economies
Sub-Saharan Africa

2.1: Country Profiles
152 | The Human Capital Report
Pillar 1: Education Rank/122 Z-Score Country Value Sample Minimum Sample Maximum
Access
Primary enrolment rate (%) .................................................................114.......................–3.771........................ 61...........................58 ......................... 100
Secondary enrolment rate (%) ..............................................................—..............................— .........................— ...........................16 ......................... 100
Tertiary enrolment ratio (%) .................................................................104.......................–1.227.......................... 8.............................1 ......................... 103
Education gender gap2 .......................................................................115.......................–3.299................... 0.709......................0.645 ...................... 1.000
Quality
Internet access in schools1 .................................................................115.......................–1.591..................... 2.33........................1.64 ........................ 6.64
Quality of the education system1 ..........................................................69.......................–0.334..................... 3.50........................1.99 ........................ 5.98
Quality of primary schools1 ...................................................................81.......................–0.504..................... 3.39........................1.97 ........................ 6.82
Quality of math & science education1 ...................................................54.........................0.243..................... 4.27........................1.88 ........................ 6.29
Quality of management schools1 ..........................................................54.........................0.065..................... 4.35........................2.29 ........................ 6.09
Attainment
Primary education attainment (% population age 25+) ..........................—..............................— .........................— .............................5 ......................... 100
Secondary education attainment (% population age 25+) .....................—..............................— .........................— .............................2 ......................... 100
Tertiary education attainment (% population age 25+) ..........................—..............................— .........................— .............................0 ........................... 44
Pillar 2: Health and Wellness Rank/122 Z-Score Country Value Sample Minimum Sample Maximum
Survival
Infant mortality (per 1,000 live births) ..................................................120.......................–2.670........................ 81.............................2 ........................... 98
Life expectancy .................................................................................114.......................–2.011........................ 56...........................50 ........................... 83
Survival gender gap2 ..............................................................................1.........................0.751................... 0.980......................0.920 ...................... 0.980
Health
Stunting and wasting (% in children under 5) ........................................68.......................–1.275..................... 26.5..........................1.2 ........................ 36.5
Unhealthy life years (% of life expectancy) ............................................89.......................–0.239........................ 16.............................8 ........................... 66
Deaths under 60 from non-communicable
diseases (% of all NCD deaths) ....................................................109.......................–1.370 ..................... 44.0 ..........................7.3 ........................ 55.8
Obesity (% of adults with BMI ≥ 30) .....................................................25.........................1.249....................... 6.7..........................1.1 ........................ 42.8
Business impact of non-communicable diseases1 ................................12.........................1.155..................... 5.00........................2.74 ........................ 5.87
Business impact of communicable diseases1 .......................................94.......................–0.894..................... 4.59........................3.13 ........................ 6.90
Well-being
Stress (% of respondents)7 ....................................................................2.........................1.610........................ 10.............................8 ........................... 69
Depression (% of respondents)7 .............................................................4.........................1.412.......................... 3.............................2 ........................... 37
Services
Water, sanitation and hygiene (% with access) ...................................107.......................–1.653..................... 51.9........................31.1 ...................... 100.0
Healthcare quality1................................................................................74.......................–0.573..................... 3.41........................1.78 ........................ 6.75
Healthcare accessibility1 .....................................................................113.......................–1.342..................... 3.02........................2.41 ........................ 6.75
Pillar 3: Workforce and Employment Rank/122 Z-Score Country Value Sample Minimum Sample Maximum
Participation
Labour force participation rate, age 15-64 (%) .....................................75.......................–0.173..................... 67.5........................43.4 ........................ 90.6
Labour force participation rate, age 65+ (%) ...........................................7.........................1.648..................... 56.6..........................1.6 ........................ 91.2
Economic participation gender gap2 .....................................................97.......................–0.821................... 0.547......................0.310 ...................... 0.839
Unemployment rate (%) ........................................................................—..............................— .........................— ..........................0.3 ........................ 32.0
Youth unemployment rate (%) ...............................................................—..............................— .........................— ..........................1.6 ........................ 48.2
Talent
Country capacity to attract talent1 ........................................................56.........................0.042..................... 3.48........................1.48 ........................ 6.08
Country capacity to retain talent1..........................................................75.......................–0.401..................... 3.14........................1.81 ........................ 5.97
Ease of finding skilled employees1 ........................................................36.........................0.621..................... 4.42........................2.13 ........................ 5.69
Pay related to productivity1 ...................................................................84.......................–0.476..................... 3.63........................2.37 ........................ 5.25
Capacity for innovation1......................................................................109.......................–1.047..................... 2.87........................2.31 ........................ 5.84
Index of Economic Complexity3 ............................................................91.......................–1.076................... –0.92......................–1.96 ........................ 2.37
Firm level technology absorption1 .........................................................60.......................–0.133..................... 4.72........................3.17 ........................ 6.23
Scientific and technical journal articles (per 1,000 people) ..................101.......................–0.619................... 0.003......................0.000 ...................... 1.242
Median age of the working population ..................................................95.......................–1.063........................ 30...........................28 ........................... 42
Training
Staff training1 ........................................................................................34.........................0.455..................... 4.34........................2.51 ........................ 5.57
Training services1 ..................................................................................53.........................0.128..................... 4.41........................2.67 ........................ 6.47
Côte d’Ivoire
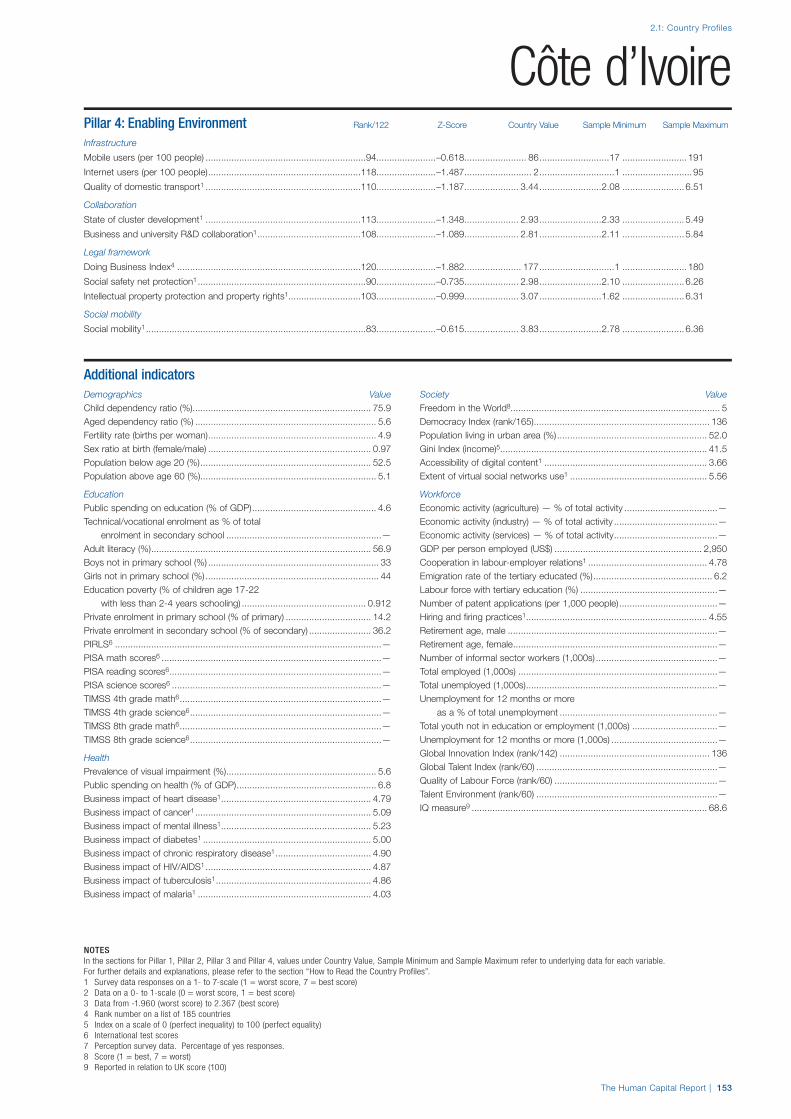
2.1: Country Profiles
NOTESIn the sections for Pillar 1, Pillar 2, Pillar 3 and Pillar 4, values under Country Value, Sample Minimum and Sample Maximum refer to underlying data for each variable.For further details and explanations, please refer to the section “How to Read the Country Profiles”.1 Survey data responses on a 1- to 7-scale (1 = worst score, 7 = best score)2 Data on a 0- to 1-scale (0 = worst score, 1 = best score)3 Data from -1.960 (worst score) to 2.367 (best score)4 Rank number on a list of 185 countries5 Index on a scale of 0 (perfect inequality) to 100 (perfect equality)6 International test scores7 Perception survey data. Percentage of yes responses.8 Score (1 = best, 7 = worst)9 Reported in relation to UK score (100)
The Human Capital Report | 153
Côte d’IvoirePillar 4: Enabling Environment Rank/122 Z-Score Country Value Sample Minimum Sample Maximum
Infrastructure
Mobile users (per 100 people) ..............................................................94.......................–0.618........................ 86...........................17 ......................... 191
Internet users (per 100 people) ...........................................................118.......................–1.487.......................... 2.............................1 ........................... 95
Quality of domestic transport1 ............................................................110.......................–1.187..................... 3.44........................2.08 ........................ 6.51
Collaboration
State of cluster development1 ............................................................113.......................–1.348..................... 2.93........................2.33 ........................ 5.49
Business and university R&D collaboration1 ........................................108.......................–1.089 ..................... 2.81 ........................2.11 ........................ 5.84
Legal framework
Doing Business Index4 .......................................................................120.......................–1.882...................... 177.............................1 ......................... 180
Social safety net protection1 .................................................................90.......................–0.735..................... 2.98........................2.10 ........................ 6.26
Intellectual property protection and property rights1............................103.......................–0.999 ..................... 3.07 ........................1.62 ........................ 6.31
Social mobility
Social mobility1 .....................................................................................83.......................–0.615..................... 3.83........................2.78 ........................ 6.36
Additional indicatorsDemographics Value
Child dependency ratio (%)..................................................................... 75.9Aged dependency ratio (%) ...................................................................... 5.6Fertility rate (births per woman) ................................................................. 4.9Sex ratio at birth (female/male) ............................................................... 0.97Population below age 20 (%) .................................................................. 52.5Population above age 60 (%) .................................................................... 5.1
Education
Public spending on education (% of GDP) ................................................ 4.6Technical/vocational enrolment as % of total
enrolment in secondary school ............................................................—Adult literacy (%) ..................................................................................... 56.9Boys not in primary school (%) .................................................................. 33Girls not in primary school (%) ................................................................... 44Education poverty (% of children age 17-22
with less than 2-4 years schooling) ................................................ 0.912Private enrolment in primary school (% of primary) ................................. 14.2Private enrolment in secondary school (% of secondary) ........................ 36.2PIRLS6 .......................................................................................................—PISA math scores6 .....................................................................................—PISA reading scores6 ..................................................................................—PISA science scores6 .................................................................................—TIMSS 4th grade math6 ..............................................................................—TIMSS 4th grade science6 ..........................................................................—TIMSS 8th grade math6 ..............................................................................—TIMSS 8th grade science6 ..........................................................................—
Health
Prevalence of visual impairment (%) .......................................................... 5.6Public spending on health (% of GDP) ...................................................... 6.8Business impact of heart disease1 .......................................................... 4.79Business impact of cancer1 .................................................................... 5.09Business impact of mental illness1 .......................................................... 5.23Business impact of diabetes1 ................................................................. 5.00Business impact of chronic respiratory disease1 ..................................... 4.90Business impact of HIV/AIDS1 ................................................................ 4.87Business impact of tuberculosis1 ............................................................ 4.86Business impact of malaria1 ................................................................... 4.03
Society Value
Freedom in the World8................................................................................. 5Democracy Index (rank/165) .................................................................... 136Population living in urban area (%) .......................................................... 52.0Gini Index (income)5................................................................................ 41.5Accessibility of digital content1 ............................................................... 3.66Extent of virtual social networks use1 ..................................................... 5.56
Workforce
Economic activity (agriculture) — % of total activity ....................................—Economic activity (industry) — % of total activity ........................................—Economic activity (services) — % of total activity ........................................—GDP per person employed (US$) ......................................................... 2,950Cooperation in labour-employer relations1 .............................................. 4.78Emigration rate of the tertiary educated (%) .............................................. 6.2Labour force with tertiary education (%) .....................................................—Number of patent applications (per 1,000 people) ......................................—Hiring and firing practices1 ...................................................................... 4.55Retirement age, male .................................................................................—Retirement age, female ...............................................................................—Number of informal sector workers (1,000s) ...............................................—Total employed (1,000s) .............................................................................—Total unemployed (1,000s) ..........................................................................—Unemployment for 12 months or more
as a % of total unemployment .............................................................—Total youth not in education or employment (1,000s) .................................—Unemployment for 12 months or more (1,000s) .........................................—Global Innovation Index (rank/142) .......................................................... 136Global Talent Index (rank/60) ......................................................................—Quality of Labour Force (rank/60) ...............................................................—Talent Environment (rank/60) ......................................................................—IQ measure9 ........................................................................................... 68.6

2.1: Country Profiles
154 | The Human Capital Report
Rank/122 Score
Year
s (5
yea
r age
gro
ups)
Percent of total population
0–4
5–9
10–14
15–19
20–24
25–29
30–34
35–39
40–44
45–49
50–54
55–59
60–64
65–69
70–74
75–79
80–84
85–89
90–94
95–99
100+
0 1 2 3 4 55 4 3 2 1 0
CroatiaHuman Capital Index 2013 46 0.099
Pillar 1: Education 38 0.394
Pillar 2: Health and wellness 24 0.526
Pillar 3: Workforce and employment 88 –0.378
Pillar 4: Enabling environment 60 –0.146
Key Indicators
Total population (1,000s) 4,338.0
Median age of population 42
GDP per capita PPP (constant 2005, international $) 16,148
GDP growth (annual %) –2.0
Male Female Additional indicators
n Total population n Total population Aged dependency: 26.1%
n Labour force participation n Labour force participation Youth dependency: 22.8%
n Primary and secondary enrolment n Primary and secondary enrolment Male labour force participation, age 65+: 0.6%
Female labour force participation, age 65+: 0.6%
Education and workforce distribution

The Human Capital Report | 155
2.1: Country Profiles
HCI s
core
–2.5
–2.0
–1.5
–1.0
–0.5
0.0
0.5
1.0
1.5
2.0
2.5
Overall Index
Enablingenvironment
Workforce andemployment
Health andwellness
Education
CroatiaEmployment types, educational requirements and educational attainment
Percent of population Educational in employment type attainment (%)
Tertiary requirements 11.3 13.9
Professionals 4.4
Technicians and associate professionals 6.9
Secondary requirements 29.4 64.1
Clerks 5.6
Service workers and shop and market sales workers 7.2
Skilled agricultural and fishery workers 5.3
Craft and related trade workers 6.4
Plant and machine operators and assemblers 5.0
Primary requirements 3.9 13.1
Elementary occupations 3.9
Various 2.7
Legislators, senior officials and managers 2.4
Unclassified n/a
Armed forces 0.3
Spread of scores (by pillar and overall)
Croatia
High-income economies
Europe and Central Asia

2.1: Country Profiles
156 | The Human Capital Report
Pillar 1: Education Rank/122 Z-Score Country Value Sample Minimum Sample Maximum
Access
Primary enrolment rate (%) ...................................................................63.........................0.294........................ 96...........................58 ......................... 100
Secondary enrolment rate (%) ..............................................................20.........................0.817........................ 91...........................16 ......................... 100
Tertiary enrolment ratio (%) ...................................................................42.........................0.516........................ 54.............................1 ......................... 103
Education gender gap2 .........................................................................41.........................0.482................... 0.995......................0.645 ...................... 1.000
Quality
Internet access in schools1 ...................................................................48.........................0.279..................... 4.67........................1.64 ........................ 6.64
Quality of the education system1 ..........................................................82.......................–0.490..................... 3.36........................1.99 ........................ 5.98
Quality of primary schools1 ...................................................................32.........................0.701..................... 4.70........................1.97 ........................ 6.82
Quality of math & science education1 ...................................................18.........................1.058..................... 5.05........................1.88 ........................ 6.29
Quality of management schools1 ..........................................................68.......................–0.115..................... 4.20........................2.29 ........................ 6.09
Attainment
Primary education attainment (% population age 25+) ..........................—..............................— .........................— .............................5 ......................... 100
Secondary education attainment (% population age 25+) .....................—..............................— .........................— .............................2 ......................... 100
Tertiary education attainment (% population age 25+) ..........................—..............................— .........................— .............................0 ........................... 44
Pillar 2: Health and Wellness Rank/122 Z-Score Country Value Sample Minimum Sample Maximum
Survival
Infant mortality (per 1,000 live births) ....................................................19.........................0.787.......................... 4.............................2 ........................... 98
Life expectancy ...................................................................................38.........................0.542........................ 77...........................50 ........................... 83
Survival gender gap2 ............................................................................28.........................0.714................... 0.979......................0.920 ...................... 0.980
Health
Stunting and wasting (% in children under 5) ........................................—..............................— .........................— ..........................1.2 ........................ 36.5
Unhealthy life years (% of life expectancy) ............................................36.........................0.490........................ 12.............................8 ........................... 66
Deaths under 60 from non-communicable
diseases (% of all NCD deaths) ......................................................21.........................1.076 ..................... 12.9 ..........................7.3 ........................ 55.8
Obesity (% of adults with BMI ≥ 30) .....................................................68.......................–0.292..................... 21.3..........................1.1 ........................ 42.8
Business impact of non-communicable diseases1 ................................10.........................1.217..................... 5.03........................2.74 ........................ 5.87
Business impact of communicable diseases1 .........................................7.........................1.226..................... 6.70........................3.13 ........................ 6.90
Well-being
Stress (% of respondents)7 ..................................................................70.......................–0.250........................ 34.............................8 ........................... 69
Depression (% of respondents)7 ...........................................................65.......................–0.022........................ 12.............................2 ........................... 37
Services
Water, sanitation and hygiene (% with access) .....................................42.........................0.727..................... 98.3........................31.1 ...................... 100.0
Healthcare quality1................................................................................48.........................0.124..................... 4.26........................1.78 ........................ 6.75
Healthcare accessibility1 .......................................................................43.........................0.494..................... 5.27........................2.41 ........................ 6.75
Pillar 3: Workforce and Employment Rank/122 Z-Score Country Value Sample Minimum Sample Maximum
Participation
Labour force participation rate, age 15-64 (%) .....................................91.......................–0.479..................... 64.5........................43.4 ........................ 90.6
Labour force participation rate, age 65+ (%) .......................................105.......................–1.009....................... 5.1..........................1.6 ........................ 91.2
Economic participation gender gap2 .....................................................55.........................0.216................... 0.669......................0.310 ...................... 0.839
Unemployment rate (%) ........................................................................85.......................–0.583..................... 11.8..........................0.3 ........................ 32.0
Youth unemployment rate (%) ...............................................................95.......................–1.326..................... 31.5..........................1.6 ........................ 48.2
Talent
Country capacity to attract talent1 ......................................................114.......................–1.502..................... 1.89........................1.48 ........................ 6.08
Country capacity to retain talent1........................................................112.......................–1.302..................... 2.27........................1.81 ........................ 5.97
Ease of finding skilled employees1 ........................................................70.......................–0.237..................... 3.82........................2.13 ........................ 5.69
Pay related to productivity1 ...................................................................71.......................–0.190..................... 3.81........................2.37 ........................ 5.25
Capacity for innovation1........................................................................96.......................–0.731..................... 3.12........................2.31 ........................ 5.84
Index of Economic Complexity3 ............................................................23.........................0.926..................... 0.99......................–1.96 ........................ 2.37
Firm level technology absorption1 .........................................................67.......................–0.227..................... 4.65........................3.17 ........................ 6.23
Scientific and technical journal articles (per 1,000 people) ....................30.........................0.253................... 0.264......................0.000 ...................... 1.242
Median age of the working population ....................................................6.........................1.441........................ 41...........................28 ........................... 42
Training
Staff training1 ......................................................................................103.......................–1.128..................... 3.32........................2.51 ........................ 5.57
Training services1 ..................................................................................68.......................–0.167..................... 4.17........................2.67 ........................ 6.47
Croatia

2.1: Country Profiles
NOTESIn the sections for Pillar 1, Pillar 2, Pillar 3 and Pillar 4, values under Country Value, Sample Minimum and Sample Maximum refer to underlying data for each variable.For further details and explanations, please refer to the section “How to Read the Country Profiles”.1 Survey data responses on a 1- to 7-scale (1 = worst score, 7 = best score)2 Data on a 0- to 1-scale (0 = worst score, 1 = best score)3 Data from -1.960 (worst score) to 2.367 (best score)4 Rank number on a list of 185 countries5 Index on a scale of 0 (perfect inequality) to 100 (perfect equality)6 International test scores7 Perception survey data. Percentage of yes responses.8 Score (1 = best, 7 = worst)9 Reported in relation to UK score (100)
The Human Capital Report | 157
CroatiaPillar 4: Enabling Environment Rank/122 Z-Score Country Value Sample Minimum Sample Maximum
Infrastructure
Mobile users (per 100 people) ..............................................................47.........................0.273...................... 116...........................17 ......................... 191
Internet users (per 100 people) .............................................................30.........................0.959........................ 71.............................1 ........................... 95
Quality of domestic transport1 ..............................................................31.........................0.626 ..................... 5.01 ........................2.08 ........................ 6.51
Collaboration
State of cluster development1 ............................................................100.......................–0.922..................... 3.23........................2.33 ........................ 5.49
Business and university R&D collaboration1 ..........................................66.......................–0.362..................... 3.46........................2.11 ........................ 5.84
Legal framework
Doing Business Index4 .........................................................................66.......................–0.078........................ 84.............................1 ......................... 180
Social safety net protection1 .................................................................74.......................–0.513..................... 3.23........................2.10 ........................ 6.26
Intellectual property protection and property rights1..............................74.......................–0.421 ..................... 3.66 ........................1.62 ........................ 6.31
Social mobility
Social mobility1 ...................................................................................102.......................–0.878..................... 3.60........................2.78 ........................ 6.36
Additional indicatorsDemographics Value
Child dependency ratio (%)..................................................................... 22.8Aged dependency ratio (%) .................................................................... 26.1Fertility rate (births per woman) ................................................................. 1.4Sex ratio at birth (female/male) ............................................................... 0.94Population below age 20 (%) .................................................................. 21.0Population above age 60 (%) .................................................................. 23.8
Education
Public spending on education (% of GDP) ................................................ 4.3Technical/vocational enrolment as % of total
enrolment in secondary school ........................................................... 37Adult literacy (%) ..................................................................................... 98.9Boys not in primary school (%) .................................................................... 5Girls not in primary school (%) ..................................................................... 3Education poverty (% of children age 17-22
with less than 2-4 years schooling) ......................................................—Private enrolment in primary school (% of primary) ................................... 0.3Private enrolment in secondary school (% of secondary) .......................... 1.5PIRLS6 .................................................................................................... 553PISA math scores6 .................................................................................. 460PISA reading scores6 ............................................................................... 476PISA science scores6 .............................................................................. 486TIMSS 4th grade math6 ........................................................................... 490TIMSS 4th grade science6 ....................................................................... 516TIMSS 8th grade math6 ..............................................................................—TIMSS 8th grade science6 ..........................................................................—
Health
Prevalence of visual impairment (%) .......................................................... 2.1Public spending on health (% of GDP) ...................................................... 7.8Business impact of heart disease1 .......................................................... 4.55Business impact of cancer1 .................................................................... 4.76Business impact of mental illness1 .......................................................... 5.54Business impact of diabetes1 ................................................................. 5.02Business impact of chronic respiratory disease1 ..................................... 5.26Business impact of HIV/AIDS1 ................................................................ 6.63Business impact of tuberculosis1 ............................................................ 6.63Business impact of malaria1 ................................................................... 6.83
Society Value
Freedom in the World8................................................................................. 1Democracy Index (rank/165) ...................................................................... 50Population living in urban area (%) .......................................................... 58.1Gini Index (income)5................................................................................ 33.7Accessibility of digital content1 ............................................................... 5.56Extent of virtual social networks use1 ..................................................... 5.62
Workforce
Economic activity (agriculture) — % of total activity ................................ 15.4Economic activity (industry) — % of total activity .................................... 27.5Economic activity (services) — % of total activity .................................... 56.7GDP per person employed (US$) ....................................................... 25,129Cooperation in labour-employer relations1 .............................................. 3.49Emigration rate of the tertiary educated (%) ............................................ 24.6Labour force with tertiary education (%) ................................................. 20.7Number of patent applications (per 1,000 people) .............................. 0.0579Hiring and firing practices1 ...................................................................... 3.00Retirement age, male ................................................................................ 65Retirement age, female .............................................................................. 61Number of informal sector workers (1,000s) ...............................................—Total employed (1,000s) ....................................................................... 1,541Total unemployed (1,000s) ....................................................................... 206Unemployment for 12 months or more
as a % of total unemployment ......................................................... 57.8Total youth not in education or employment (1,000s) .................................—Unemployment for 12 months or more (1,000s) ................................... 119.0Global Innovation Index (rank/142) ............................................................ 37Global Talent Index (rank/60) ......................................................................—Quality of Labour Force (rank/60) ...............................................................—Talent Environment (rank/60) ......................................................................—IQ measure9 ........................................................................................... 97.5

2.1: Country Profiles
158 | The Human Capital Report
Rank/122 Score
Year
s (5
yea
r age
gro
ups)
Percent of total population
0–4
5–9
10–14
15–19
20–24
25–29
30–34
35–39
40–44
45–49
50–54
55–59
60–64
65–69
70–74
75–79
80–84
85–89
90–94
95–99
100+
0 1 2 3 4 55 4 3 2 1 0
CyprusHuman Capital Index 2013 31 0.452
Pillar 1: Education 16 0.938
Pillar 2: Health and wellness 32 0.352
Pillar 3: Workforce and employment 33 0.252
Pillar 4: Enabling environment 41 0.268
Key Indicators
Total population (1,000s) 1,103.7
Median age of population 34
GDP per capita PPP (constant 2005, international $) 23,475
GDP growth (annual %) –2.4
Male Female Additional indicators
n Total population n Total population Aged dependency: 16.4%
n Labour force participation n Labour force participation Youth dependency: 25.1%
n Primary and secondary enrolment n Primary and secondary enrolment Male labour force participation, age 65+: 0.9%
Female labour force participation, age 65+: 0.3%
Education and workforce distribution

The Human Capital Report | 159
2.1: Country Profiles
HCI s
core
–2.5
–2.0
–1.5
–1.0
–0.5
0.0
0.5
1.0
1.5
2.0
2.5
Overall Index
Enablingenvironment
Workforce andemployment
Health andwellness
Education
CyprusEmployment types, educational requirements and educational attainment
Percent of population Educational in employment type attainment (%)
Tertiary requirements 11.7 30.9
Professionals 6.3
Technicians and associate professionals 5.4
Secondary requirements 22.8 43.3
Clerks 5.8
Service workers and shop and market sales workers 7.4
Skilled agricultural and fishery workers 1.3
Craft and related trade workers 6.1
Plant and machine operators and assemblers 2.3
Primary requirements 6.6 17.3
Elementary occupations 6.6
Various 2.6
Legislators, senior officials and managers 1.8
Unclassified 0.3
Armed forces 0.5
Spread of scores (by pillar and overall)
Cyprus
High-income economies
Europe and Central Asia

2.1: Country Profiles
160 | The Human Capital Report
Pillar 1: Education Rank/122 Z-Score Country Value Sample Minimum Sample Maximum
Access
Primary enrolment rate (%) ...................................................................20.........................0.699........................ 99...........................58 ......................... 100
Secondary enrolment rate (%) ..............................................................29.........................0.721........................ 89...........................16 ......................... 100
Tertiary enrolment ratio (%) ...................................................................46.........................0.295........................ 48.............................1 ......................... 103
Education gender gap2 .........................................................................83.........................0.257................... 0.978......................0.645 ...................... 1.000
Quality
Internet access in schools1 ...................................................................28.........................1.030..................... 5.61........................1.64 ........................ 6.64
Quality of the education system1 ............................................................9.........................1.680..................... 5.30........................1.99 ........................ 5.98
Quality of primary schools1 ...................................................................12.........................1.521..................... 5.59........................1.97 ........................ 6.82
Quality of math & science education1 .....................................................7.........................1.592..................... 5.56........................1.88 ........................ 6.29
Quality of management schools1 ..........................................................17.........................1.201..................... 5.30........................2.29 ........................ 6.09
Attainment
Primary education attainment (% population age 25+) ..........................28.........................0.680........................ 93.............................5 ......................... 100
Secondary education attainment (% population age 25+) .....................32.........................0.483........................ 76.............................2 ......................... 100
Tertiary education attainment (% population age 25+) ..........................14.........................1.095........................ 31.............................0 ........................... 44
Pillar 2: Health and Wellness Rank/122 Z-Score Country Value Sample Minimum Sample Maximum
Survival
Infant mortality (per 1,000 live births) ......................................................8.........................0.832.......................... 3.............................2 ........................... 98
Life expectancy ...................................................................................14.........................1.028........................ 81...........................50 ........................... 83
Survival gender gap2 ............................................................................82.......................–0.084................... 0.970......................0.920 ...................... 0.980
Health
Stunting and wasting (% in children under 5) ........................................—..............................— .........................— ..........................1.2 ........................ 36.5
Unhealthy life years (% of life expectancy) ............................................64.........................0.175........................ 14.............................8 ........................... 66
Deaths under 60 from non-communicable
diseases (% of all NCD deaths) ......................................................12.........................1.234 ..................... 10.9 ..........................7.3 ........................ 55.8
Obesity (% of adults with BMI ≥ 30) .....................................................80.......................–0.513..................... 23.4..........................1.1 ........................ 42.8
Business impact of non-communicable diseases1 ................................21.........................0.965..................... 4.91........................2.74 ........................ 5.87
Business impact of communicable diseases1 .......................................41.........................0.627..................... 6.10........................3.13 ........................ 6.90
Well-being
Stress (% of respondents)7 ................................................................115.......................–2.111........................ 58.............................8 ........................... 69
Depression (% of respondents)7 ...........................................................47.........................0.297........................ 10.............................2 ........................... 37
Services
Water, sanitation and hygiene (% with access) .......................................1.........................0.815................... 100.0........................31.1 ...................... 100.0
Healthcare quality1................................................................................34.........................0.791..................... 5.07........................1.78 ........................ 6.75
Healthcare accessibility1 .......................................................................41.........................0.518..................... 5.30........................2.41 ........................ 6.75
Pillar 3: Workforce and Employment Rank/122 Z-Score Country Value Sample Minimum Sample Maximum
Participation
Labour force participation rate, age 15-64 (%) .....................................47.........................0.369..................... 72.8........................43.4 ........................ 90.6
Labour force participation rate, age 65+ (%) .........................................76.......................–0.617..................... 12.7..........................1.6 ........................ 91.2
Economic participation gender gap2 .....................................................77.......................–0.243................... 0.615......................0.310 ...................... 0.839
Unemployment rate (%) ........................................................................36.........................0.485....................... 6.2..........................0.3 ........................ 32.0
Youth unemployment rate (%) ...............................................................51.........................0.206..................... 16.6..........................1.6 ........................ 48.2
Talent
Country capacity to attract talent1 ........................................................61.......................–0.049..................... 3.39........................1.48 ........................ 6.08
Country capacity to retain talent1..........................................................30.........................0.678..................... 4.19........................1.81 ........................ 5.97
Ease of finding skilled employees1 ..........................................................2.........................1.943..................... 5.33........................2.13 ........................ 5.69
Pay related to productivity1 ...................................................................65.......................–0.042..................... 3.90........................2.37 ........................ 5.25
Capacity for innovation1........................................................................82.......................–0.529..................... 3.28........................2.31 ........................ 5.84
Index of Economic Complexity3 ............................................................—..............................— .........................— ......................–1.96 ........................ 2.37
Firm level technology absorption1 .........................................................35.........................0.596..................... 5.24........................3.17 ........................ 6.23
Scientific and technical journal articles (per 1,000 people) ....................33.......................–0.031................... 0.179......................0.000 ...................... 1.242
Median age of the working population ..................................................51.........................0.323........................ 36...........................28 ........................... 42
Training
Staff training1 ........................................................................................58.......................–0.016..................... 4.04........................2.51 ........................ 5.57
Training services1 ..................................................................................26.........................0.714..................... 4.87........................2.67 ........................ 6.47
Cyprus

2.1: Country Profiles
NOTESIn the sections for Pillar 1, Pillar 2, Pillar 3 and Pillar 4, values under Country Value, Sample Minimum and Sample Maximum refer to underlying data for each variable.For further details and explanations, please refer to the section “How to Read the Country Profiles”.1 Survey data responses on a 1- to 7-scale (1 = worst score, 7 = best score)2 Data on a 0- to 1-scale (0 = worst score, 1 = best score)3 Data from -1.960 (worst score) to 2.367 (best score)4 Rank number on a list of 185 countries5 Index on a scale of 0 (perfect inequality) to 100 (perfect equality)6 International test scores7 Perception survey data. Percentage of yes responses.8 Score (1 = best, 7 = worst)9 Reported in relation to UK score (100)
The Human Capital Report | 161
CyprusPillar 4: Enabling Environment Rank/122 Z-Score Country Value Sample Minimum Sample Maximum
Infrastructure
Mobile users (per 100 people) ..............................................................82.......................–0.276........................ 98...........................17 ......................... 191
Internet users (per 100 people) .............................................................40.........................0.494........................ 58.............................1 ........................... 95
Quality of domestic transport1 ..............................................................55.........................0.072 ..................... 4.53 ........................2.08 ........................ 6.51
Collaboration
State of cluster development1 ..............................................................47.........................0.238..................... 4.06........................2.33 ........................ 5.49
Business and university R&D collaboration1 ..........................................49.........................0.009 ..................... 3.79 ........................2.11 ........................ 5.84
Legal framework
Doing Business Index4 .........................................................................34.........................0.853........................ 36.............................1 ......................... 180
Social safety net protection1 .................................................................37.........................0.459..................... 4.28........................2.10 ........................ 6.26
Intellectual property protection and property rights1..............................36.........................0.461 ..................... 4.56 ........................1.62 ........................ 6.31
Social mobility
Social mobility1 .....................................................................................54.........................0.098..................... 4.48........................2.78 ........................ 6.36
Additional indicatorsDemographics Value
Child dependency ratio (%)..................................................................... 25.1Aged dependency ratio (%) .................................................................... 16.4Fertility rate (births per woman) ................................................................. 1.5Sex ratio at birth (female/male) ............................................................... 0.95Population below age 20 (%) .................................................................. 25.4Population above age 60 (%) .................................................................. 16.3
Education
Public spending on education (% of GDP) ................................................ 7.3Technical/vocational enrolment as % of total
enrolment in secondary school ............................................................. 7Adult literacy (%) ..................................................................................... 98.7Boys not in primary school (%) .................................................................... 1Girls not in primary school (%) ..................................................................... 1Education poverty (% of children age 17-22
with less than 2-4 years schooling) ......................................................—Private enrolment in primary school (% of primary) ................................... 7.6Private enrolment in secondary school (% of secondary) ........................ 17.5PIRLS6 .......................................................................................................—PISA math scores6 .....................................................................................—PISA reading scores6 ..................................................................................—PISA science scores6 .................................................................................—TIMSS 4th grade math6 ..............................................................................—TIMSS 4th grade science6 ..........................................................................—TIMSS 8th grade math6 ..............................................................................—TIMSS 8th grade science6 ..........................................................................—
Health
Prevalence of visual impairment (%) .......................................................... 1.0Public spending on health (% of GDP) ...................................................... 7.4Business impact of heart disease1 .......................................................... 4.52Business impact of cancer1 .................................................................... 4.46Business impact of mental illness1 .......................................................... 5.33Business impact of diabetes1 ................................................................. 4.98Business impact of chronic respiratory disease1 ..................................... 5.28Business impact of HIV/AIDS1 ................................................................ 5.90Business impact of tuberculosis1 ............................................................ 6.02Business impact of malaria1 ................................................................... 6.38
Society Value
Freedom in the World8................................................................................. 1Democracy Index (rank/165) ...................................................................... 41Population living in urban area (%) .......................................................... 70.7Gini Index (income)5....................................................................................—Accessibility of digital content1 ............................................................... 5.63Extent of virtual social networks use1 ..................................................... 5.99
Workforce
Economic activity (agriculture) — % of total activity .................................. 3.9Economic activity (industry) — % of total activity .................................... 21.4Economic activity (services) — % of total activity .................................... 74.7GDP per person employed (US$) ....................................................... 27,360Cooperation in labour-employer relations1 .............................................. 4.67Emigration rate of the tertiary educated (%) ............................................ 34.2Labour force with tertiary education (%) ................................................. 39.5Number of patent applications (per 1,000 people) .............................. 0.0072Hiring and firing practices1 ...................................................................... 4.05Retirement age, male ................................................................................ 65Retirement age, female .............................................................................. 61Number of informal sector workers (1,000s) ...............................................—Total employed (1,000s) .......................................................................... 385Total unemployed (1,000s) ......................................................................... 25Unemployment for 12 months or more
as a % of total unemployment ......................................................... 20.5Total youth not in education or employment (1,000s) ............................. 59.5Unemployment for 12 months or more (1,000s) ....................................... 5.2Global Innovation Index (rank/142) ............................................................ 27Global Talent Index (rank/60) ......................................................................—Quality of Labour Force (rank/60) ...............................................................—Talent Environment (rank/60) ......................................................................—IQ measure9 ........................................................................................... 91.5

2.1: Country Profiles
162 | The Human Capital Report
Rank/122 Score
Year
s (5
yea
r age
gro
ups)
Percent of total population
0–4
5–9
10–14
15–19
20–24
25–29
30–34
35–39
40–44
45–49
50–54
55–59
60–64
65–69
70–74
75–79
80–84
85–89
90–94
95–99
100+
0 1 2 3 4 55 4 3 2 1 05 0
Czech RepublicHuman Capital Index 2013 33 0.387
Pillar 1: Education 36 0.452
Pillar 2: Health and wellness 36 0.310
Pillar 3: Workforce and employment 36 0.210
Pillar 4: Enabling environment 31 0.576
Key Indicators
Total population (1,000s) 10,553.7
Median age of population 40
GDP per capita PPP (constant 2005, international $) 23,763
GDP growth (annual %) –1.3
Male Female Additional indicators
n Total population n Total population Aged dependency: 21.8%
n Labour force participation n Labour force participation Youth dependency: 20.2%
n Primary and secondary enrolment n Primary and secondary enrolment Male labour force participation, age 65+: 0.4%
Female labour force participation, age 65+: 0.3%
Education and workforce distribution

The Human Capital Report | 163
2.1: Country Profiles
HCI s
core
–2.5
–2.0
–1.5
–1.0
–0.5
0.0
0.5
1.0
1.5
2.0
2.5
Overall Index
Enablingenvironment
Workforce andemployment
Health andwellness
Education
Czech RepublicEmployment types, educational requirements and educational attainment
Percent of population Educational in employment type attainment (%)
Tertiary requirements 19.0 16.5
Professionals 6.2
Technicians and associate professionals 12.7
Secondary requirements 30.0 81.6
Clerks 4.0
Service workers and shop and market sales workers 6.7
Skilled agricultural and fishery workers 0.8
Craft and related trade workers 10.7
Plant and machine operators and assemblers 7.7
Primary requirements 4.3 n/a
Elementary occupations 4.3
Various 4.6
Legislators, senior officials and managers 3.7
Unclassified 0.7
Armed forces 0.2
Spread of scores (by pillar and overall)
Czech Republic
High-income economies
Europe and Central Asia
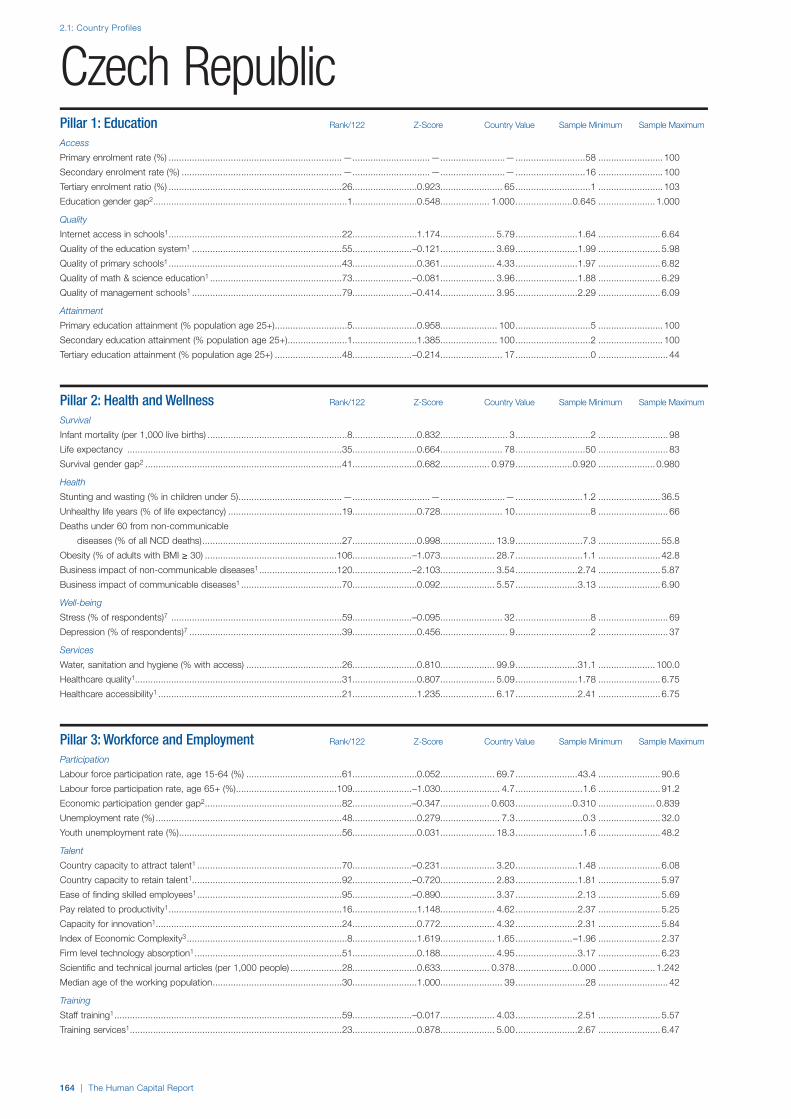
2.1: Country Profiles
164 | The Human Capital Report
Pillar 1: Education Rank/122 Z-Score Country Value Sample Minimum Sample Maximum
Access
Primary enrolment rate (%) ...................................................................—..............................— .........................— ...........................58 ......................... 100
Secondary enrolment rate (%) ..............................................................—..............................— .........................— ...........................16 ......................... 100
Tertiary enrolment ratio (%) ...................................................................26.........................0.923........................ 65.............................1 ......................... 103
Education gender gap2 ...........................................................................1.........................0.548................... 1.000......................0.645 ...................... 1.000
Quality
Internet access in schools1 ...................................................................22.........................1.174..................... 5.79........................1.64 ........................ 6.64
Quality of the education system1 ..........................................................55.......................–0.121..................... 3.69........................1.99 ........................ 5.98
Quality of primary schools1 ...................................................................43.........................0.361..................... 4.33........................1.97 ........................ 6.82
Quality of math & science education1 ...................................................73.......................–0.081..................... 3.96........................1.88 ........................ 6.29
Quality of management schools1 ..........................................................79.......................–0.414..................... 3.95........................2.29 ........................ 6.09
Attainment
Primary education attainment (% population age 25+) ............................5.........................0.958...................... 100.............................5 ......................... 100
Secondary education attainment (% population age 25+) .......................1.........................1.385...................... 100.............................2 ......................... 100
Tertiary education attainment (% population age 25+) ..........................48.......................–0.214........................ 17.............................0 ........................... 44
Pillar 2: Health and Wellness Rank/122 Z-Score Country Value Sample Minimum Sample Maximum
Survival
Infant mortality (per 1,000 live births) ......................................................8.........................0.832.......................... 3.............................2 ........................... 98
Life expectancy ...................................................................................35.........................0.664........................ 78...........................50 ........................... 83
Survival gender gap2 ............................................................................41.........................0.682................... 0.979......................0.920 ...................... 0.980
Health
Stunting and wasting (% in children under 5) ........................................—..............................— .........................— ..........................1.2 ........................ 36.5
Unhealthy life years (% of life expectancy) ............................................19.........................0.728........................ 10.............................8 ........................... 66
Deaths under 60 from non-communicable
diseases (% of all NCD deaths) ......................................................27.........................0.998 ..................... 13.9 ..........................7.3 ........................ 55.8
Obesity (% of adults with BMI ≥ 30) ...................................................106.......................–1.073..................... 28.7..........................1.1 ........................ 42.8
Business impact of non-communicable diseases1 ..............................120.......................–2.103..................... 3.54........................2.74 ........................ 5.87
Business impact of communicable diseases1 .......................................70.........................0.092..................... 5.57........................3.13 ........................ 6.90
Well-being
Stress (% of respondents)7 ..................................................................59.......................–0.095........................ 32.............................8 ........................... 69
Depression (% of respondents)7 ...........................................................39.........................0.456.......................... 9.............................2 ........................... 37
Services
Water, sanitation and hygiene (% with access) .....................................26.........................0.810..................... 99.9........................31.1 ...................... 100.0
Healthcare quality1................................................................................31.........................0.807..................... 5.09........................1.78 ........................ 6.75
Healthcare accessibility1 .......................................................................21.........................1.235..................... 6.17........................2.41 ........................ 6.75
Pillar 3: Workforce and Employment Rank/122 Z-Score Country Value Sample Minimum Sample Maximum
Participation
Labour force participation rate, age 15-64 (%) .....................................61.........................0.052..................... 69.7........................43.4 ........................ 90.6
Labour force participation rate, age 65+ (%) .......................................109.......................–1.030....................... 4.7..........................1.6 ........................ 91.2
Economic participation gender gap2 .....................................................82.......................–0.347................... 0.603......................0.310 ...................... 0.839
Unemployment rate (%) ........................................................................48.........................0.279....................... 7.3..........................0.3 ........................ 32.0
Youth unemployment rate (%) ...............................................................56.........................0.031..................... 18.3..........................1.6 ........................ 48.2
Talent
Country capacity to attract talent1 ........................................................70.......................–0.231..................... 3.20........................1.48 ........................ 6.08
Country capacity to retain talent1..........................................................92.......................–0.720..................... 2.83........................1.81 ........................ 5.97
Ease of finding skilled employees1 ........................................................95.......................–0.890..................... 3.37........................2.13 ........................ 5.69
Pay related to productivity1 ...................................................................16.........................1.148..................... 4.62........................2.37 ........................ 5.25
Capacity for innovation1........................................................................24.........................0.772..................... 4.32........................2.31 ........................ 5.84
Index of Economic Complexity3 ..............................................................8.........................1.619..................... 1.65......................–1.96 ........................ 2.37
Firm level technology absorption1 .........................................................51.........................0.188..................... 4.95........................3.17 ........................ 6.23
Scientific and technical journal articles (per 1,000 people) ....................28.........................0.633................... 0.378......................0.000 ...................... 1.242
Median age of the working population ..................................................30.........................1.000........................ 39...........................28 ........................... 42
Training
Staff training1 ........................................................................................59.......................–0.017..................... 4.03........................2.51 ........................ 5.57
Training services1 ..................................................................................23.........................0.878..................... 5.00........................2.67 ........................ 6.47
Czech Republic

2.1: Country Profiles
NOTESIn the sections for Pillar 1, Pillar 2, Pillar 3 and Pillar 4, values under Country Value, Sample Minimum and Sample Maximum refer to underlying data for each variable.For further details and explanations, please refer to the section “How to Read the Country Profiles”.1 Survey data responses on a 1- to 7-scale (1 = worst score, 7 = best score)2 Data on a 0- to 1-scale (0 = worst score, 1 = best score)3 Data from -1.960 (worst score) to 2.367 (best score)4 Rank number on a list of 185 countries5 Index on a scale of 0 (perfect inequality) to 100 (perfect equality)6 International test scores7 Perception survey data. Percentage of yes responses.8 Score (1 = best, 7 = worst)9 Reported in relation to UK score (100)
The Human Capital Report | 165
Czech RepublicPillar 4: Enabling Environment Rank/122 Z-Score Country Value Sample Minimum Sample Maximum
Infrastructure
Mobile users (per 100 people) ..............................................................37.........................0.481...................... 123...........................17 ......................... 191
Internet users (per 100 people) .............................................................25.........................1.040........................ 73.............................1 ........................... 95
Quality of domestic transport1 ..............................................................11.........................1.582 ..................... 5.85 ........................2.08 ........................ 6.51
Collaboration
State of cluster development1 ..............................................................41.........................0.346..................... 4.14........................2.33 ........................ 5.49
Business and university R&D collaboration1 ..........................................33.........................0.696 ..................... 4.41 ........................2.11 ........................ 5.84
Legal framework
Doing Business Index4 .........................................................................53.........................0.290........................ 65.............................1 ......................... 180
Social safety net protection1 .................................................................31.........................0.614..................... 4.45........................2.10 ........................ 6.26
Intellectual property protection and property rights1..............................65.......................–0.231 ..................... 3.85 ........................1.62 ........................ 6.31
Social mobility
Social mobility1 .....................................................................................33.........................0.364..................... 4.72........................2.78 ........................ 6.36
Additional indicatorsDemographics Value
Child dependency ratio (%)..................................................................... 20.2Aged dependency ratio (%) .................................................................... 21.8Fertility rate (births per woman) ................................................................. 1.4Sex ratio at birth (female/male) ............................................................... 0.94Population below age 20 (%) .................................................................. 20.0Population above age 60 (%) .................................................................. 22.4
Education
Public spending on education (% of GDP) ................................................ 4.2Technical/vocational enrolment as % of total
enrolment in secondary school ........................................................... 40Adult literacy (%) .........................................................................................—Boys not in primary school (%) ...................................................................—Girls not in primary school (%) ....................................................................—Education poverty (% of children age 17-22
with less than 2-4 years schooling) ......................................................—Private enrolment in primary school (% of primary) ................................... 1.6Private enrolment in secondary school (% of secondary) .......................... 8.4PIRLS6 .................................................................................................... 545PISA math scores6 .................................................................................. 493PISA reading scores6 ............................................................................... 478PISA science scores6 .............................................................................. 500TIMSS 4th grade math6 ........................................................................... 511TIMSS 4th grade science6 ....................................................................... 536TIMSS 8th grade math6 ..............................................................................—TIMSS 8th grade science6 ..........................................................................—
Health
Prevalence of visual impairment (%) .......................................................... 1.4Public spending on health (% of GDP) ...................................................... 7.4Business impact of heart disease1 .......................................................... 3.28Business impact of cancer1 .................................................................... 2.90Business impact of mental illness1 .......................................................... 4.02Business impact of diabetes1 ................................................................. 3.56Business impact of chronic respiratory disease1 ..................................... 3.92Business impact of HIV/AIDS1 ................................................................ 5.25Business impact of tuberculosis1 ............................................................ 5.39Business impact of malaria1 ................................................................... 6.07
Society Value
Freedom in the World8................................................................................. 1Democracy Index (rank/165) ...................................................................... 17Population living in urban area (%) .......................................................... 73.4Gini Index (income)5................................................................................ 25.8Accessibility of digital content1 ............................................................... 6.15Extent of virtual social networks use1 ..................................................... 5.98
Workforce
Economic activity (agriculture) — % of total activity .................................. 3.0Economic activity (industry) — % of total activity .................................... 38.4Economic activity (services) — % of total activity .................................... 58.6GDP per person employed (US$) ....................................................... 26,704Cooperation in labour-employer relations1 .............................................. 4.23Emigration rate of the tertiary educated (%) .............................................. 8.5Labour force with tertiary education (%) ................................................. 19.0Number of patent applications (per 1,000 people) .............................. 0.0834Hiring and firing practices1 ...................................................................... 3.27Retirement age, male ................................................................................ 63Retirement age, female .............................................................................. 59Number of informal sector workers (1,000s) ...............................................—Total employed (1,000s) ....................................................................... 4,885Total unemployed (1,000s) ....................................................................... 384Unemployment for 12 months or more
as a % of total unemployment ......................................................... 40.8Total youth not in education or employment (1,000s) ........................... 117.3Unemployment for 12 months or more (1,000s) ................................... 156.5Global Innovation Index (rank/142) ............................................................ 28Global Talent Index (rank/60) ..................................................................... 25Quality of Labour Force (rank/60) .............................................................. 25Talent Environment (rank/60) ..................................................................... 24IQ measure9 ........................................................................................... 98.8
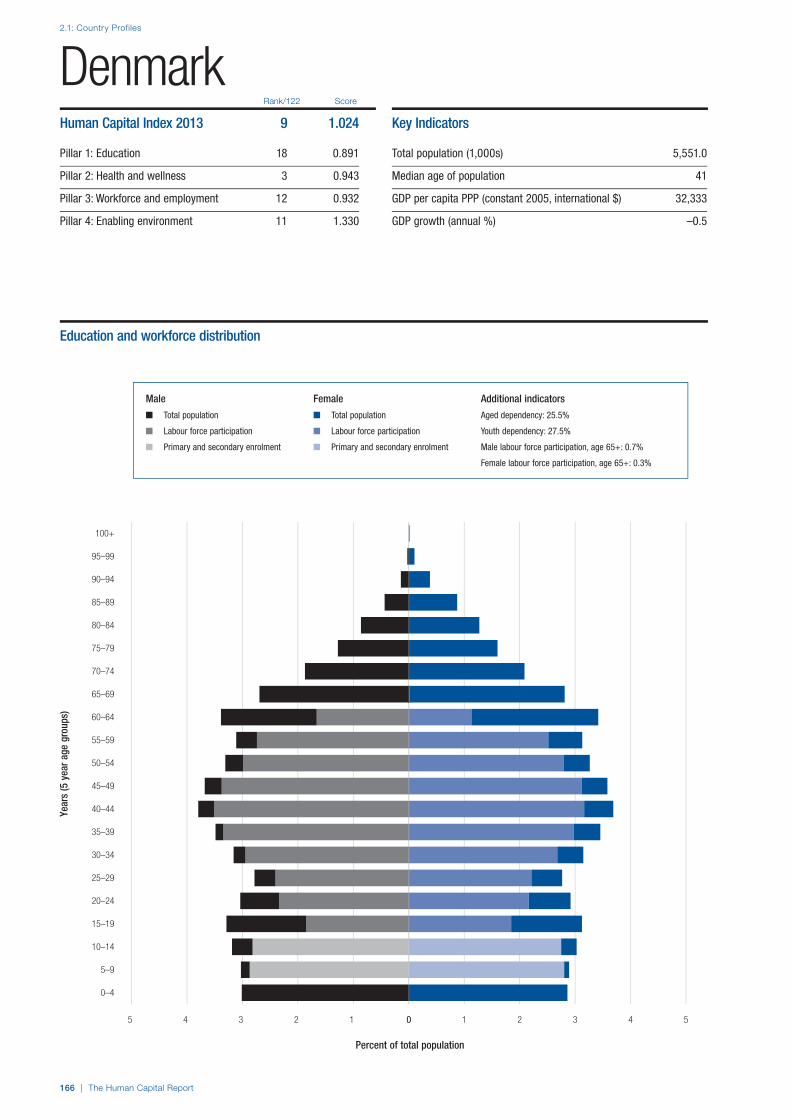
2.1: Country Profiles
166 | The Human Capital Report
Rank/122 Score
Year
s (5
yea
r age
gro
ups)
Percent of total population
0–4
5–9
10–14
15–19
20–24
25–29
30–34
35–39
40–44
45–49
50–54
55–59
60–64
65–69
70–74
75–79
80–84
85–89
90–94
95–99
100+
0 1 2 3 4 55 4 3 2 1 0
DenmarkHuman Capital Index 2013 9 1.024
Pillar 1: Education 18 0.891
Pillar 2: Health and wellness 3 0.943
Pillar 3: Workforce and employment 12 0.932
Pillar 4: Enabling environment 11 1.330
Key Indicators
Total population (1,000s) 5,551.0
Median age of population 41
GDP per capita PPP (constant 2005, international $) 32,333
GDP growth (annual %) –0.5
Male Female Additional indicators
n Total population n Total population Aged dependency: 25.5%
n Labour force participation n Labour force participation Youth dependency: 27.5%
n Primary and secondary enrolment n Primary and secondary enrolment Male labour force participation, age 65+: 0.7%
Female labour force participation, age 65+: 0.3%
Education and workforce distribution

The Human Capital Report | 167
2.1: Country Profiles
HCI s
core
–2.5
–2.0
–1.5
–1.0
–0.5
0.0
0.5
1.0
1.5
2.0
2.5
Overall Index
Enablingenvironment
Workforce andemployment
Health andwellness
Education
DenmarkEmployment types, educational requirements and educational attainment
Percent of population Educational in employment type attainment (%)
Tertiary requirements 21.3 30.7
Professionals 8.7
Technicians and associate professionals 12.6
Secondary requirements 28.5 65.7
Clerks 6.3
Service workers and shop and market sales workers 9.5
Skilled agricultural and fishery workers 1.4
Craft and related trade workers 7.1
Plant and machine operators and assemblers 4.2
Primary requirements 7.4 n/a
Elementary occupations 7.4
Various 5.3
Legislators, senior officials and managers 4.3
Unclassified 0.6
Armed forces 0.4
Spread of scores (by pillar and overall)
Denmark
High-income economies
Europe and Central Asia
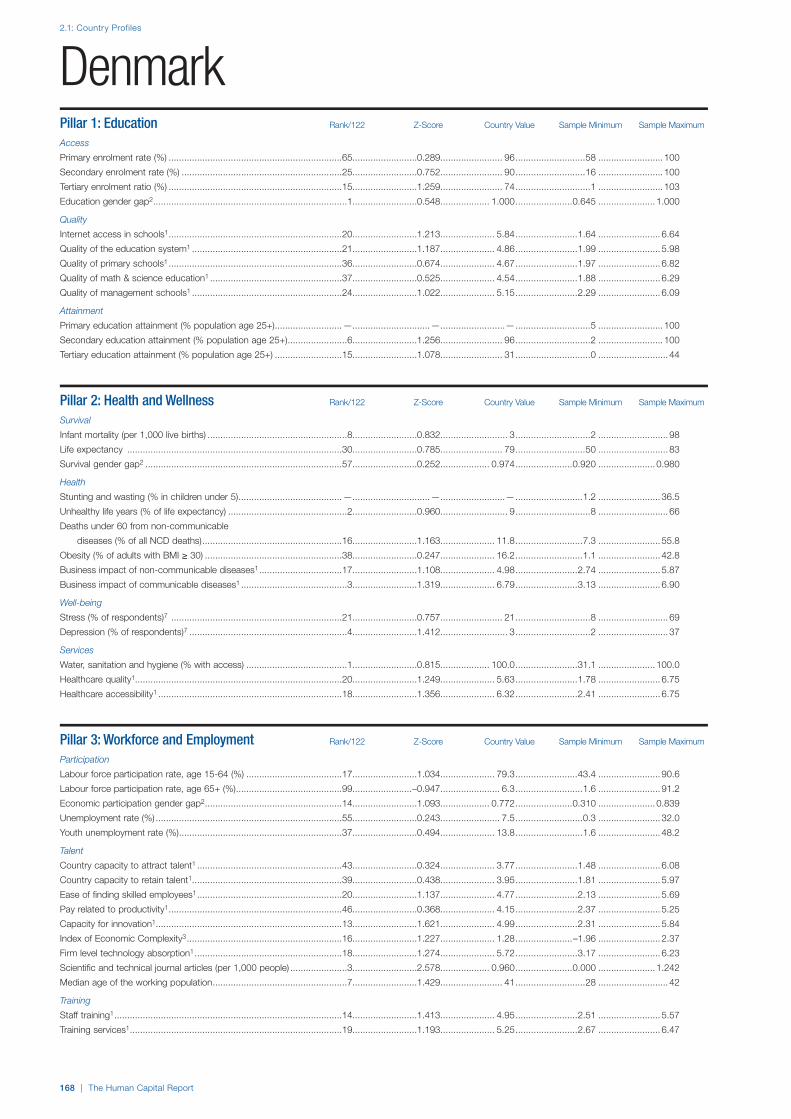
2.1: Country Profiles
168 | The Human Capital Report
Pillar 1: Education Rank/122 Z-Score Country Value Sample Minimum Sample Maximum
Access
Primary enrolment rate (%) ...................................................................65.........................0.289........................ 96...........................58 ......................... 100
Secondary enrolment rate (%) ..............................................................25.........................0.752........................ 90...........................16 ......................... 100
Tertiary enrolment ratio (%) ...................................................................15.........................1.259........................ 74.............................1 ......................... 103
Education gender gap2 ...........................................................................1.........................0.548................... 1.000......................0.645 ...................... 1.000
Quality
Internet access in schools1 ...................................................................20.........................1.213..................... 5.84........................1.64 ........................ 6.64
Quality of the education system1 ..........................................................21.........................1.187..................... 4.86........................1.99 ........................ 5.98
Quality of primary schools1 ...................................................................36.........................0.674..................... 4.67........................1.97 ........................ 6.82
Quality of math & science education1 ...................................................37.........................0.525..................... 4.54........................1.88 ........................ 6.29
Quality of management schools1 ..........................................................24.........................1.022..................... 5.15........................2.29 ........................ 6.09
Attainment
Primary education attainment (% population age 25+) ..........................—..............................— .........................— .............................5 ......................... 100
Secondary education attainment (% population age 25+) .......................6.........................1.256 ........................ 96 .............................2 ......................... 100
Tertiary education attainment (% population age 25+) ..........................15.........................1.078 ........................ 31 .............................0 ........................... 44
Pillar 2: Health and Wellness Rank/122 Z-Score Country Value Sample Minimum Sample Maximum
Survival
Infant mortality (per 1,000 live births) ......................................................8.........................0.832.......................... 3.............................2 ........................... 98
Life expectancy ...................................................................................30.........................0.785........................ 79...........................50 ........................... 83
Survival gender gap2 ............................................................................57.........................0.252................... 0.974......................0.920 ...................... 0.980
Health
Stunting and wasting (% in children under 5) ........................................—..............................— .........................— ..........................1.2 ........................ 36.5
Unhealthy life years (% of life expectancy) ..............................................2.........................0.960 .......................... 9 .............................8 ........................... 66
Deaths under 60 from non-communicable
diseases (% of all NCD deaths) ......................................................16.........................1.163 ..................... 11.8 ..........................7.3 ........................ 55.8
Obesity (% of adults with BMI ≥ 30) .....................................................38.........................0.247 ..................... 16.2 ..........................1.1 ........................ 42.8
Business impact of non-communicable diseases1 ................................17.........................1.108 ..................... 4.98 ........................2.74 ........................ 5.87
Business impact of communicable diseases1 .........................................3.........................1.319 ..................... 6.79 ........................3.13 ........................ 6.90
Well-being
Stress (% of respondents)7 ..................................................................21.........................0.757........................ 21.............................8 ........................... 69
Depression (% of respondents)7 .............................................................4.........................1.412.......................... 3.............................2 ........................... 37
Services
Water, sanitation and hygiene (% with access) .......................................1.........................0.815................... 100.0........................31.1 ...................... 100.0
Healthcare quality1................................................................................20.........................1.249..................... 5.63........................1.78 ........................ 6.75
Healthcare accessibility1 .......................................................................18.........................1.356..................... 6.32........................2.41 ........................ 6.75
Pillar 3: Workforce and Employment Rank/122 Z-Score Country Value Sample Minimum Sample Maximum
Participation
Labour force participation rate, age 15-64 (%) .....................................17.........................1.034..................... 79.3........................43.4 ........................ 90.6
Labour force participation rate, age 65+ (%) .........................................99.......................–0.947....................... 6.3..........................1.6 ........................ 91.2
Economic participation gender gap2 .....................................................14.........................1.093................... 0.772......................0.310 ...................... 0.839
Unemployment rate (%) ........................................................................55.........................0.243....................... 7.5..........................0.3 ........................ 32.0
Youth unemployment rate (%) ...............................................................37.........................0.494..................... 13.8..........................1.6 ........................ 48.2
Talent
Country capacity to attract talent1 ........................................................43.........................0.324..................... 3.77........................1.48 ........................ 6.08
Country capacity to retain talent1..........................................................39.........................0.438..................... 3.95........................1.81 ........................ 5.97
Ease of finding skilled employees1 ........................................................20.........................1.137..................... 4.77........................2.13 ........................ 5.69
Pay related to productivity1 ...................................................................46.........................0.368..................... 4.15........................2.37 ........................ 5.25
Capacity for innovation1........................................................................13.........................1.621..................... 4.99........................2.31 ........................ 5.84
Index of Economic Complexity3 ............................................................16.........................1.227..................... 1.28......................–1.96 ........................ 2.37
Firm level technology absorption1 .........................................................18.........................1.274..................... 5.72........................3.17 ........................ 6.23
Scientific and technical journal articles (per 1,000 people) ......................3.........................2.578................... 0.960......................0.000 ...................... 1.242
Median age of the working population ....................................................7.........................1.429........................ 41...........................28 ........................... 42
Training
Staff training1 ........................................................................................14.........................1.413..................... 4.95........................2.51 ........................ 5.57
Training services1 ..................................................................................19.........................1.193..................... 5.25........................2.67 ........................ 6.47
Denmark

2.1: Country Profiles
NOTESIn the sections for Pillar 1, Pillar 2, Pillar 3 and Pillar 4, values under Country Value, Sample Minimum and Sample Maximum refer to underlying data for each variable.For further details and explanations, please refer to the section “How to Read the Country Profiles”.1 Survey data responses on a 1- to 7-scale (1 = worst score, 7 = best score)2 Data on a 0- to 1-scale (0 = worst score, 1 = best score)3 Data from -1.960 (worst score) to 2.367 (best score)4 Rank number on a list of 185 countries5 Index on a scale of 0 (perfect inequality) to 100 (perfect equality)6 International test scores7 Perception survey data. Percentage of yes responses.8 Score (1 = best, 7 = worst)9 Reported in relation to UK score (100)
The Human Capital Report | 169
DenmarkPillar 4: Enabling Environment Rank/122 Z-Score Country Value Sample Minimum Sample Maximum
Infrastructure
Mobile users (per 100 people) ..............................................................29.........................0.629...................... 128...........................17 ......................... 191
Internet users (per 100 people) ...............................................................6.........................1.648........................ 90.............................1 ........................... 95
Quality of domestic transport1 ..............................................................14.........................1.392 ..................... 5.68 ........................2.08 ........................ 6.51
Collaboration
State of cluster development1 ..............................................................31.........................0.574..................... 4.30........................2.33 ........................ 5.49
Business and university R&D collaboration1 ..........................................20.........................1.151 ..................... 4.81 ........................2.11 ........................ 5.84
Legal framework
Doing Business Index4 ...........................................................................4.........................1.454.......................... 5.............................1 ......................... 180
Social safety net protection1 ...................................................................6.........................2.133..................... 6.10........................2.10 ........................ 6.26
Intellectual property protection and property rights1..............................22.........................1.110 ..................... 5.22 ........................1.62 ........................ 6.31
Social mobility
Social mobility1 .......................................................................................5.........................1.876..................... 6.08........................2.78 ........................ 6.36
Additional indicatorsDemographics Value
Child dependency ratio (%)..................................................................... 27.5Aged dependency ratio (%) .................................................................... 25.5Fertility rate (births per woman) ................................................................. 1.9Sex ratio at birth (female/male) ............................................................... 0.94Population below age 20 (%) .................................................................. 24.3Population above age 60 (%) .................................................................. 23.3
Education
Public spending on education (% of GDP) ................................................ 8.7Technical/vocational enrolment as % of total
enrolment in secondary school ........................................................... 26Adult literacy (%) .........................................................................................—Boys not in primary school (%) .................................................................... 5Girls not in primary school (%) ..................................................................... 3Education poverty (% of children age 17-22
with less than 2-4 years schooling) ......................................................—Private enrolment in primary school (% of primary) ................................. 13.7Private enrolment in secondary school (% of secondary) ........................ 13.8PIRLS6 .................................................................................................... 554PISA math scores6 .................................................................................. 503PISA reading scores6 ............................................................................... 495PISA science scores6 .............................................................................. 499TIMSS 4th grade math6 ........................................................................... 537TIMSS 4th grade science6 ....................................................................... 528TIMSS 8th grade math6 ..............................................................................—TIMSS 8th grade science6 ..........................................................................—
Health
Prevalence of visual impairment (%) .......................................................... 0.8Public spending on health (% of GDP) .................................................... 11.2Business impact of heart disease1 .......................................................... 4.76Business impact of cancer1 .................................................................... 4.53Business impact of mental illness1 .......................................................... 4.87Business impact of diabetes1 ................................................................. 5.25Business impact of chronic respiratory disease1 ..................................... 5.48Business impact of HIV/AIDS1 ................................................................ 6.70Business impact of tuberculosis1 ............................................................ 6.84Business impact of malaria1 ................................................................... 6.82
Society Value
Freedom in the World8................................................................................. 1Democracy Index (rank/165) ........................................................................ 4Population living in urban area (%) .......................................................... 87.1Gini Index (income)5................................................................................ 24.7Accessibility of digital content1 ............................................................... 5.95Extent of virtual social networks use1 ..................................................... 5.93
Workforce
Economic activity (agriculture) — % of total activity .................................. 2.4Economic activity (industry) — % of total activity .................................... 19.9Economic activity (services) — % of total activity .................................... 77.6GDP per person employed (US$) ....................................................... 47,490Cooperation in labour-employer relations1 .............................................. 5.84Emigration rate of the tertiary educated (%) .............................................. 7.8Labour force with tertiary education (%) ................................................. 30.8Number of patent applications (per 1,000 people) .............................. 0.3190Hiring and firing practices1 ...................................................................... 5.05Retirement age, male ................................................................................ 65Retirement age, female .............................................................................. 65Number of informal sector workers (1,000s) ...............................................—Total employed (1,000s) ....................................................................... 2,706Total unemployed (1,000s) ....................................................................... 218Unemployment for 12 months or more
as a % of total unemployment ......................................................... 20.2Total youth not in education or employment (1,000s) .................................—Unemployment for 12 months or more (1,000s) ..................................... 44.1Global Innovation Index (rank/142) .............................................................. 9Global Talent Index (rank/60) ....................................................................... 2Quality of Labour Force (rank/60) ................................................................ 1Talent Environment (rank/60) ....................................................................... 2IQ measure9 ........................................................................................... 97.4

2.1: Country Profiles
170 | The Human Capital Report
Rank/122 Score
Year
s (5
yea
r age
gro
ups)
Percent of total population
0–4
5–9
10–14
15–19
20–24
25–29
30–34
35–39
40–44
45–49
50–54
55–59
60–64
65–69
70–74
75–79
80–84
85–89
90–94
95–99
100+
0 1 2 3 4 5 66 5 4 3 2 1 0
Dominican RepublicHuman Capital Index 2013 95 –0.499
Pillar 1: Education 97 –0.732
Pillar 2: Health and wellness 85 –0.223
Pillar 3: Workforce and employment 91 –0.401
Pillar 4: Enabling environment 91 –0.641
Key Indicators
Total population (1,000s) 10,016.8
Median age of population 25
GDP per capita PPP (constant 2005, international $) 8,794
GDP growth (annual %) 3.9
Male Female Additional indicators
n Total population n Total population Aged dependency: 9.6%
n Labour force participation n Labour force participation Youth dependency: 49.6%
n Primary and secondary enrolment n Primary and secondary enrolment Male labour force participation, age 65+: 1.3%
Female labour force participation, age 65+: 0.3%
Education and workforce distribution

The Human Capital Report | 171
2.1: Country Profiles
HCI s
core
–2.5
–2.0
–1.5
–1.0
–0.5
0.0
0.5
1.0
1.5
2.0
2.5
Overall Index
Enablingenvironment
Workforce andemployment
Health andwellness
Education
Dominican RepublicEmployment types, educational requirements and educational attainment
Percent of population Educational in employment type attainment (%)
Tertiary requirements n/a 10.3
Professionals n/a
Technicians and associate professionals n/a
Secondary requirements n/a 43.6
Clerks n/a
Service workers and shop and market sales workers n/a
Skilled agricultural and fishery workers n/a
Craft and related trade workers n/a
Plant and machine operators and assemblers n/a
Primary requirements n/a 10.2
Elementary occupations n/a
Various n/a
Legislators, senior officials and managers n/a
Unclassified n/a
Armed forces n/a
Spread of scores (by pillar and overall)
Dominican Republic
Upper-middle income economies
Latin America and the Carribean

2.1: Country Profiles
172 | The Human Capital Report
Pillar 1: Education Rank/122 Z-Score Country Value Sample Minimum Sample Maximum
Access
Primary enrolment rate (%) ...................................................................84.......................–0.143........................ 92...........................58 ......................... 100
Secondary enrolment rate (%) ..............................................................73.......................–0.445........................ 62...........................16 ......................... 100
Tertiary enrolment ratio (%) ...................................................................65.......................–0.249........................ 34.............................1 ......................... 103
Education gender gap2 .........................................................................87.........................0.136................... 0.969......................0.645 ...................... 1.000
Quality
Internet access in schools1 ...................................................................87.......................–0.600..................... 3.57........................1.64 ........................ 6.64
Quality of the education system1 ........................................................118.......................–1.408..................... 2.54........................1.99 ........................ 5.98
Quality of primary schools1 .................................................................120.......................–1.747..................... 2.04........................1.97 ........................ 6.82
Quality of math & science education1 .................................................121.......................–1.973..................... 2.15........................1.88 ........................ 6.29
Quality of management schools1 ..........................................................91.......................–0.701..................... 3.71........................2.29 ........................ 6.09
Attainment
Primary education attainment (% population age 25+) ..........................55.......................–0.521........................ 64.............................5 ......................... 100
Secondary education attainment (% population age 25+) .....................53.......................–0.346........................ 54.............................2 ......................... 100
Tertiary education attainment (% population age 25+) ..........................66.......................–0.784........................ 10.............................0 ........................... 44
Pillar 2: Health and Wellness Rank/122 Z-Score Country Value Sample Minimum Sample Maximum
Survival
Infant mortality (per 1,000 live births) ....................................................82.........................0.024........................ 21.............................2 ........................... 98
Life expectancy ...................................................................................72.........................0.056........................ 73...........................50 ........................... 83
Survival gender gap2 ............................................................................79.........................0.004................... 0.971......................0.920 ...................... 0.980
Health
Stunting and wasting (% in children under 5) ........................................13.........................1.037....................... 6.2..........................1.2 ........................ 36.5
Unhealthy life years (% of life expectancy) ............................................65.........................0.155........................ 14.............................8 ........................... 66
Deaths under 60 from non-communicable
diseases (% of all NCD deaths) ......................................................51.........................0.384 ..................... 21.7 ..........................7.3 ........................ 55.8
Obesity (% of adults with BMI ≥ 30) .....................................................73.......................–0.355..................... 21.9..........................1.1 ........................ 42.8
Business impact of non-communicable diseases1 ................................73.......................–0.305..................... 4.34........................2.74 ........................ 5.87
Business impact of communicable diseases1 .......................................88.......................–0.477..................... 5.00........................3.13 ........................ 6.90
Well-being
Stress (% of respondents)7 ..................................................................96.......................–0.870........................ 42.............................8 ........................... 69
Depression (% of respondents)7 ...........................................................97.......................–0.978........................ 18.............................2 ........................... 37
Services
Water, sanitation and hygiene (% with access) .....................................83.......................–0.119..................... 81.8........................31.1 ...................... 100.0
Healthcare quality1................................................................................76.......................–0.602..................... 3.38........................1.78 ........................ 6.75
Healthcare accessibility1 .....................................................................104.......................–1.081..................... 3.34........................2.41 ........................ 6.75
Pillar 3: Workforce and Employment Rank/122 Z-Score Country Value Sample Minimum Sample Maximum
Participation
Labour force participation rate, age 15-64 (%) .....................................68.......................–0.019..................... 69.0........................43.4 ........................ 90.6
Labour force participation rate, age 65+ (%) .........................................52.......................–0.121..................... 22.3..........................1.6 ........................ 91.2
Economic participation gender gap2 .....................................................81.......................–0.326................... 0.605......................0.310 ...................... 0.839
Unemployment rate (%) ........................................................................95.......................–1.062..................... 14.3..........................0.3 ........................ 32.0
Youth unemployment rate (%) ...............................................................92.......................–1.202..................... 30.3..........................1.6 ........................ 48.2
Talent
Country capacity to attract talent1 ........................................................67.......................–0.149..................... 3.29........................1.48 ........................ 6.08
Country capacity to retain talent1..........................................................62.......................–0.113..................... 3.42........................1.81 ........................ 5.97
Ease of finding skilled employees1 ........................................................89.......................–0.632..................... 3.55........................2.13 ........................ 5.69
Pay related to productivity1 ...................................................................91.......................–0.677..................... 3.51........................2.37 ........................ 5.25
Capacity for innovation1........................................................................85.......................–0.611..................... 3.22........................2.31 ........................ 5.84
Index of Economic Complexity3 ............................................................60.......................–0.212................... –0.09......................–1.96 ........................ 2.37
Firm level technology absorption1 .........................................................52.........................0.118..................... 4.90........................3.17 ........................ 6.23
Scientific and technical journal articles (per 1,000 people) ..................121.......................–0.627................... 0.001......................0.000 ...................... 1.242
Median age of the working population ..................................................77.......................–0.426........................ 33...........................28 ........................... 42
Training
Staff training1 ........................................................................................66.......................–0.133..................... 3.96........................2.51 ........................ 5.57
Training services1 ..................................................................................71.......................–0.229..................... 4.12........................2.67 ........................ 6.47
Dominican Republic

2.1: Country Profiles
NOTESIn the sections for Pillar 1, Pillar 2, Pillar 3 and Pillar 4, values under Country Value, Sample Minimum and Sample Maximum refer to underlying data for each variable.For further details and explanations, please refer to the section “How to Read the Country Profiles”.1 Survey data responses on a 1- to 7-scale (1 = worst score, 7 = best score)2 Data on a 0- to 1-scale (0 = worst score, 1 = best score)3 Data from -1.960 (worst score) to 2.367 (best score)4 Rank number on a list of 185 countries5 Index on a scale of 0 (perfect inequality) to 100 (perfect equality)6 International test scores7 Perception survey data. Percentage of yes responses.8 Score (1 = best, 7 = worst)9 Reported in relation to UK score (100)
The Human Capital Report | 173
Dominican RepublicPillar 4: Enabling Environment Rank/122 Z-Score Country Value Sample Minimum Sample Maximum
Infrastructure
Mobile users (per 100 people) ..............................................................91.......................–0.584........................ 87...........................17 ......................... 191
Internet users (per 100 people) .............................................................72.......................–0.298........................ 36.............................1 ........................... 95
Quality of domestic transport1 ..............................................................76.......................–0.342 ..................... 4.17 ........................2.08 ........................ 6.51
Collaboration
State of cluster development1 ..............................................................74.......................–0.392..................... 3.61........................2.33 ........................ 5.49
Business and university R&D collaboration1 ..........................................80.......................–0.524 ..................... 3.31 ........................2.11 ........................ 5.84
Legal framework
Doing Business Index4 .........................................................................86.......................–0.699...................... 116.............................1 ......................... 180
Social safety net protection1 ...............................................................113.......................–1.173..................... 2.51........................2.10 ........................ 6.26
Intellectual property protection and property rights1..............................88.......................–0.683 ..................... 3.39 ........................1.62 ........................ 6.31
Social mobility
Social mobility1 ...................................................................................106.......................–1.078..................... 3.42........................2.78 ........................ 6.36
Additional indicatorsDemographics Value
Child dependency ratio (%)..................................................................... 49.6Aged dependency ratio (%) ...................................................................... 9.6Fertility rate (births per woman) ................................................................. 2.7Sex ratio at birth (female/male) ............................................................... 0.96Population below age 20 (%) .................................................................. 41.0Population above age 60 (%) .................................................................... 8.6
Education
Public spending on education (% of GDP) ................................................ 2.2Technical/vocational enrolment as % of total
enrolment in secondary school ............................................................. 4Adult literacy (%) ..................................................................................... 90.1Boys not in primary school (%) .................................................................... 7Girls not in primary school (%) ..................................................................... 9Education poverty (% of children age 17-22
with less than 2-4 years schooling) ................................................ 0.119Private enrolment in primary school (% of primary) ................................. 23.3Private enrolment in secondary school (% of secondary) ........................ 20.8PIRLS6 .......................................................................................................—PISA math scores6 .....................................................................................—PISA reading scores6 ..................................................................................—PISA science scores6 .................................................................................—TIMSS 4th grade math6 ..............................................................................—TIMSS 4th grade science6 ..........................................................................—TIMSS 8th grade math6 ..............................................................................—TIMSS 8th grade science6 ..........................................................................—
Health
Prevalence of visual impairment (%) .......................................................... 3.2Public spending on health (% of GDP) ...................................................... 5.4Business impact of heart disease1 .......................................................... 4.04Business impact of cancer1 .................................................................... 4.10Business impact of mental illness1 .......................................................... 5.02Business impact of diabetes1 ................................................................. 4.20Business impact of chronic respiratory disease1 ..................................... 4.36Business impact of HIV/AIDS1 ................................................................ 4.65Business impact of tuberculosis1 ............................................................ 5.07Business impact of malaria1 ................................................................... 5.28
Society Value
Freedom in the World8................................................................................. 2Democracy Index (rank/165) ...................................................................... 60Population living in urban area (%) .......................................................... 70.2Gini Index (income)5................................................................................ 47.2Accessibility of digital content1 ............................................................... 5.29Extent of virtual social networks use1 ..................................................... 5.90
Workforce
Economic activity (agriculture) — % of total activity ................................ 12.0Economic activity (industry) — % of total activity .................................... 14.9Economic activity (services) — % of total activity .................................... 52.4GDP per person employed (US$) ....................................................... 14,291Cooperation in labour-employer relations1 .............................................. 4.55Emigration rate of the tertiary educated (%) ............................................ 22.4Labour force with tertiary education (%) ................................................. 18.5Number of patent applications (per 1,000 people) .............................. 0.0338Hiring and firing practices1 ...................................................................... 4.00Retirement age, male .................................................................................—Retirement age, female ...............................................................................—Number of informal sector workers (1,000s) ......................................... 1,484Total employed (1,000s) ....................................................................... 3,754Total unemployed (1,000s) ....................................................................... 625Unemployment for 12 months or more
as a % of total unemployment ......................................................... 22.5Total youth not in education or employment (1,000s) ........................... 177.1Unemployment for 12 months or more (1,000s) ................................... 140.9Global Innovation Index (rank/142) ............................................................ 79Global Talent Index (rank/60) ......................................................................—Quality of Labour Force (rank/60) ...............................................................—Talent Environment (rank/60) ......................................................................—IQ measure9 ........................................................................................... 80.8
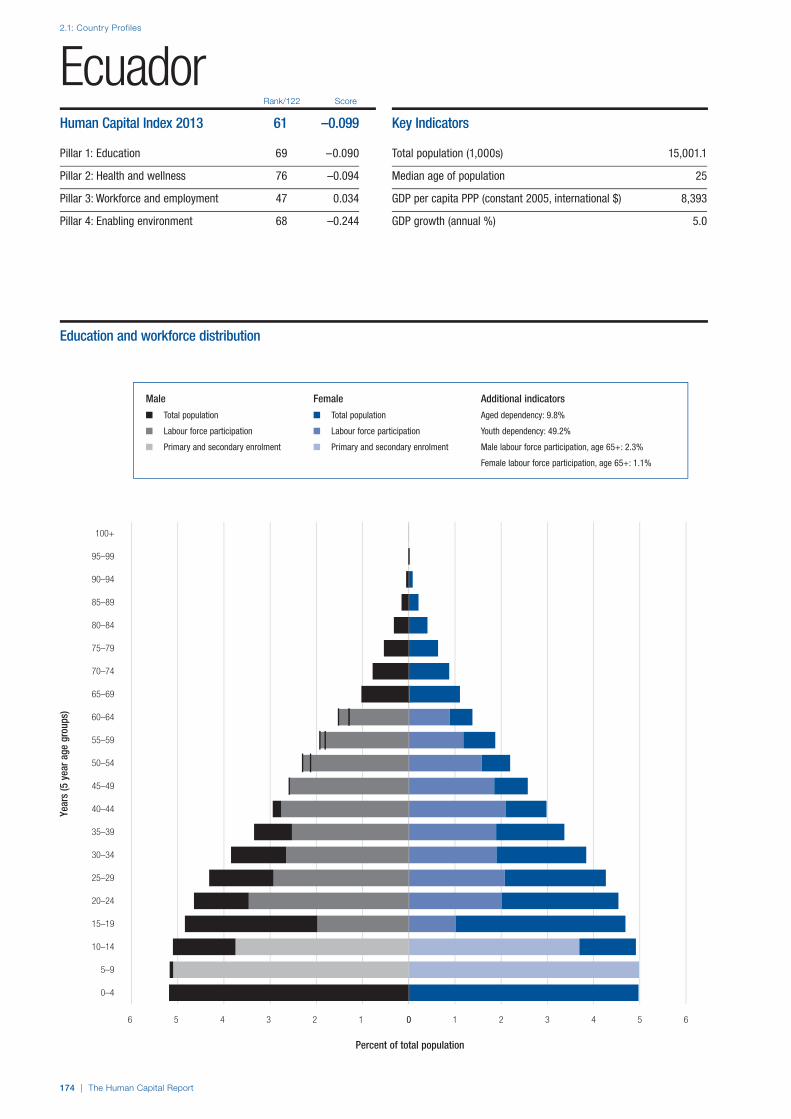
2.1: Country Profiles
174 | The Human Capital Report
Rank/122 Score
Year
s (5
yea
r age
gro
ups)
Percent of total population
0–4
5–9
10–14
15–19
20–24
25–29
30–34
35–39
40–44
45–49
50–54
55–59
60–64
65–69
70–74
75–79
80–84
85–89
90–94
95–99
100+
0 1 2 3 4 5 66 5 4 3 2 1 0
EcuadorHuman Capital Index 2013 61 –0.099
Pillar 1: Education 69 –0.090
Pillar 2: Health and wellness 76 –0.094
Pillar 3: Workforce and employment 47 0.034
Pillar 4: Enabling environment 68 –0.244
Key Indicators
Total population (1,000s) 15,001.1
Median age of population 25
GDP per capita PPP (constant 2005, international $) 8,393
GDP growth (annual %) 5.0
Male Female Additional indicators
n Total population n Total population Aged dependency: 9.8%
n Labour force participation n Labour force participation Youth dependency: 49.2%
n Primary and secondary enrolment n Primary and secondary enrolment Male labour force participation, age 65+: 2.3%
Female labour force participation, age 65+: 1.1%
Education and workforce distribution

The Human Capital Report | 175
2.1: Country Profiles
HCI s
core
–2.5
–2.0
–1.5
–1.0
–0.5
0.0
0.5
1.0
1.5
2.0
2.5
Overall Index
Enablingenvironment
Workforce andemployment
Health andwellness
Education
EcuadorEmployment types, educational requirements and educational attainment
Percent of population Educational in employment type attainment (%)
Tertiary requirements 6.1 11.6
Professionals 3.4
Technicians and associate professionals 2.8
Secondary requirements 23.5 27.4
Clerks 2.9
Service workers and shop and market sales workers 10.3
Skilled agricultural and fishery workers 1.3
Craft and related trade workers 6.1
Plant and machine operators and assemblers 2.8
Primary requirements 10.0 32.1
Elementary occupations 10.0
Various 2.6
Legislators, senior officials and managers 1.2
Unclassified 1.2
Armed forces 0.2
Spread of scores (by pillar and overall)
Ecuador
Upper-middle income economies
Latin America and the Carribean

2.1: Country Profiles
176 | The Human Capital Report
Pillar 1: Education Rank/122 Z-Score Country Value Sample Minimum Sample Maximum
Access
Primary enrolment rate (%) ...................................................................33.........................0.619........................ 99...........................58 ......................... 100
Secondary enrolment rate (%) ..............................................................62.........................0.086........................ 74...........................16 ......................... 100
Tertiary enrolment ratio (%) ...................................................................57.......................–0.027........................ 40.............................1 ......................... 103
Education gender gap2 .........................................................................49.........................0.472................... 0.994......................0.645 ...................... 1.000
Quality
Internet access in schools1 ...................................................................70.......................–0.241..................... 4.02........................1.64 ........................ 6.64
Quality of the education system1 ..........................................................51.........................0.047..................... 3.84........................1.99 ........................ 5.98
Quality of primary schools1 ...................................................................62.......................–0.118..................... 3.81........................1.97 ........................ 6.82
Quality of math & science education1 ...................................................74.......................–0.092..................... 3.95........................1.88 ........................ 6.29
Quality of management schools1 ..........................................................66.......................–0.091..................... 4.22........................2.29 ........................ 6.09
Attainment
Primary education attainment (% population age 25+) ..........................50.......................–0.199........................ 72.............................5 ......................... 100
Secondary education attainment (% population age 25+) .....................68.......................–0.875........................ 40.............................2 ......................... 100
Tertiary education attainment (% population age 25+) ..........................63.......................–0.667........................ 12.............................0 ........................... 44
Pillar 2: Health and Wellness Rank/122 Z-Score Country Value Sample Minimum Sample Maximum
Survival
Infant mortality (per 1,000 live births) ....................................................79.........................0.069........................ 20.............................2 ........................... 98
Life expectancy ...................................................................................42.........................0.420........................ 76...........................50 ........................... 83
Survival gender gap2 ............................................................................50.........................0.417................... 0.976......................0.920 ...................... 0.980
Health
Stunting and wasting (% in children under 5) ........................................44.......................–0.039..................... 15.7..........................1.2 ........................ 36.5
Unhealthy life years (% of life expectancy) ............................................87.......................–0.193........................ 16.............................8 ........................... 66
Deaths under 60 from non-communicable
diseases (% of all NCD deaths) ......................................................74.......................–0.229 ..................... 29.5 ..........................7.3 ........................ 55.8
Obesity (% of adults with BMI ≥ 30) .....................................................75.......................–0.366..................... 22.0..........................1.1 ........................ 42.8
Business impact of non-communicable diseases1 ................................66.......................–0.012..................... 4.48........................2.74 ........................ 5.87
Business impact of communicable diseases1 .......................................90.......................–0.485..................... 4.99........................3.13 ........................ 6.90
Well-being
Stress (% of respondents)7 ................................................................101.......................–1.025........................ 44.............................8 ........................... 69
Depression (% of respondents)7 ...........................................................75.......................–0.182........................ 13.............................2 ........................... 37
Services
Water, sanitation and hygiene (% with access) .....................................62.........................0.425..................... 92.4........................31.1 ...................... 100.0
Healthcare quality1................................................................................49.........................0.118..................... 4.25........................1.78 ........................ 6.75
Healthcare accessibility1 .......................................................................66.......................–0.233..................... 4.38........................2.41 ........................ 6.75
Pillar 3: Workforce and Employment Rank/122 Z-Score Country Value Sample Minimum Sample Maximum
Participation
Labour force participation rate, age 15-64 (%) .....................................54.........................0.175..................... 70.9........................43.4 ........................ 90.6
Labour force participation rate, age 65+ (%) .........................................27.........................0.730..................... 38.8..........................1.6 ........................ 91.2
Economic participation gender gap2 .....................................................84.......................–0.372................... 0.600......................0.310 ...................... 0.839
Unemployment rate (%) ........................................................................26.........................0.714....................... 5.0..........................0.3 ........................ 32.0
Youth unemployment rate (%) ...............................................................39.........................0.463..................... 14.1..........................1.6 ........................ 48.2
Talent
Country capacity to attract talent1 ........................................................29.........................0.638..................... 4.10........................1.48 ........................ 6.08
Country capacity to retain talent1..........................................................37.........................0.525..................... 4.04........................1.81 ........................ 5.97
Ease of finding skilled employees1 ........................................................35.........................0.623..................... 4.42........................2.13 ........................ 5.69
Pay related to productivity1 ...................................................................70.......................–0.183..................... 3.81........................2.37 ........................ 5.25
Capacity for innovation1........................................................................48.......................–0.021..................... 3.69........................2.31 ........................ 5.84
Index of Economic Complexity3 ............................................................87.......................–0.813................... –0.67......................–1.96 ........................ 2.37
Firm level technology absorption1 .........................................................76.......................–0.455..................... 4.49........................3.17 ........................ 6.23
Scientific and technical journal articles (per 1,000 people) ....................90.......................–0.613................... 0.005......................0.000 ...................... 1.242
Median age of the working population ..................................................76.......................–0.416........................ 33...........................28 ........................... 42
Training
Staff training1 ........................................................................................54.........................0.034..................... 4.07........................2.51 ........................ 5.57
Training services1 ..................................................................................79.......................–0.490..................... 3.92........................2.67 ........................ 6.47
Ecuador

2.1: Country Profiles
NOTESIn the sections for Pillar 1, Pillar 2, Pillar 3 and Pillar 4, values under Country Value, Sample Minimum and Sample Maximum refer to underlying data for each variable.For further details and explanations, please refer to the section “How to Read the Country Profiles”.1 Survey data responses on a 1- to 7-scale (1 = worst score, 7 = best score)2 Data on a 0- to 1-scale (0 = worst score, 1 = best score)3 Data from -1.960 (worst score) to 2.367 (best score)4 Rank number on a list of 185 countries5 Index on a scale of 0 (perfect inequality) to 100 (perfect equality)6 International test scores7 Perception survey data. Percentage of yes responses.8 Score (1 = best, 7 = worst)9 Reported in relation to UK score (100)
The Human Capital Report | 177
EcuadorPillar 4: Enabling Environment Rank/122 Z-Score Country Value Sample Minimum Sample Maximum
Infrastructure
Mobile users (per 100 people) ..............................................................69.......................–0.074...................... 105...........................17 ......................... 191
Internet users (per 100 people) .............................................................79.......................–0.444........................ 31.............................1 ........................... 95
Quality of domestic transport1 ..............................................................63.......................–0.018 ..................... 4.45 ........................2.08 ........................ 6.51
Collaboration
State of cluster development1 ..............................................................62.......................–0.056..................... 3.85........................2.33 ........................ 5.49
Business and university R&D collaboration1 ..........................................45.........................0.180 ..................... 3.94 ........................2.11 ........................ 5.84
Legal framework
Doing Business Index4 .......................................................................104.......................–1.145...................... 139.............................1 ......................... 180
Social safety net protection1 .................................................................45.........................0.113..................... 3.90........................2.10 ........................ 6.26
Intellectual property protection and property rights1..............................73.......................–0.412 ..................... 3.67 ........................1.62 ........................ 6.31
Social mobility
Social mobility1 .....................................................................................69.......................–0.337..................... 4.08........................2.78 ........................ 6.36
Additional indicatorsDemographics Value
Child dependency ratio (%)..................................................................... 49.2Aged dependency ratio (%) ...................................................................... 9.8Fertility rate (births per woman) ................................................................. 2.7Sex ratio at birth (female/male) ............................................................... 0.95Population below age 20 (%) .................................................................. 40.5Population above age 60 (%) .................................................................... 8.8
Education
Public spending on education (% of GDP) ................................................ 5.2Technical/vocational enrolment as % of total
enrolment in secondary school ........................................................... 22Adult literacy (%) ..................................................................................... 91.6Boys not in primary school (%) ...................................................................—Girls not in primary school (%) ....................................................................—Education poverty (% of children age 17-22
with less than 2-4 years schooling) ......................................................—Private enrolment in primary school (% of primary) ................................. 25.8Private enrolment in secondary school (% of secondary) ........................ 30.1PIRLS6 .......................................................................................................—PISA math scores6 .....................................................................................—PISA reading scores6 ..................................................................................—PISA science scores6 .................................................................................—TIMSS 4th grade math6 ..............................................................................—TIMSS 4th grade science6 ..........................................................................—TIMSS 8th grade math6 ..............................................................................—TIMSS 8th grade science6 ..........................................................................—
Health
Prevalence of visual impairment (%) .......................................................... 3.8Public spending on health (% of GDP) ...................................................... 7.3Business impact of heart disease1 .......................................................... 4.41Business impact of cancer1 .................................................................... 4.22Business impact of mental illness1 .......................................................... 4.65Business impact of diabetes1 ................................................................. 4.31Business impact of chronic respiratory disease1 ..................................... 4.79Business impact of HIV/AIDS1 ................................................................ 4.77Business impact of tuberculosis1 ............................................................ 5.05Business impact of malaria1 ................................................................... 5.16
Society Value
Freedom in the World8................................................................................. 3Democracy Index (rank/165) ...................................................................... 87Population living in urban area (%) .......................................................... 68.0Gini Index (income)5................................................................................ 49.3Accessibility of digital content1 ............................................................... 4.58Extent of virtual social networks use1 ..................................................... 5.12
Workforce
Economic activity (agriculture) — % of total activity ................................ 28.2Economic activity (industry) — % of total activity .................................... 18.6Economic activity (services) — % of total activity .................................... 53.1GDP per person employed (US$) ....................................................... 13,757Cooperation in labour-employer relations1 .............................................. 4.30Emigration rate of the tertiary educated (%) .............................................. 9.5Labour force with tertiary education (%) ................................................. 26.5Number of patent applications (per 1,000 people) .............................. 0.0463Hiring and firing practices1 ...................................................................... 3.61Retirement age, male ................................................................................ 60Retirement age, female .............................................................................. 60Number of informal sector workers (1,000s) ......................................... 2,691Total employed (1,000s) ....................................................................... 6,209Total unemployed (1,000s) ....................................................................... 326Unemployment for 12 months or more
as a % of total unemployment ......................................................... 37.2Total youth not in education or employment (1,000s) ........................... 427.3Unemployment for 12 months or more (1,000s) ................................... 121.2Global Innovation Index (rank/142) ............................................................ 83Global Talent Index (rank/60) ..................................................................... 50Quality of Labour Force (rank/60) .............................................................. 51Talent Environment (rank/60) ..................................................................... 59IQ measure9 ........................................................................................... 86.3
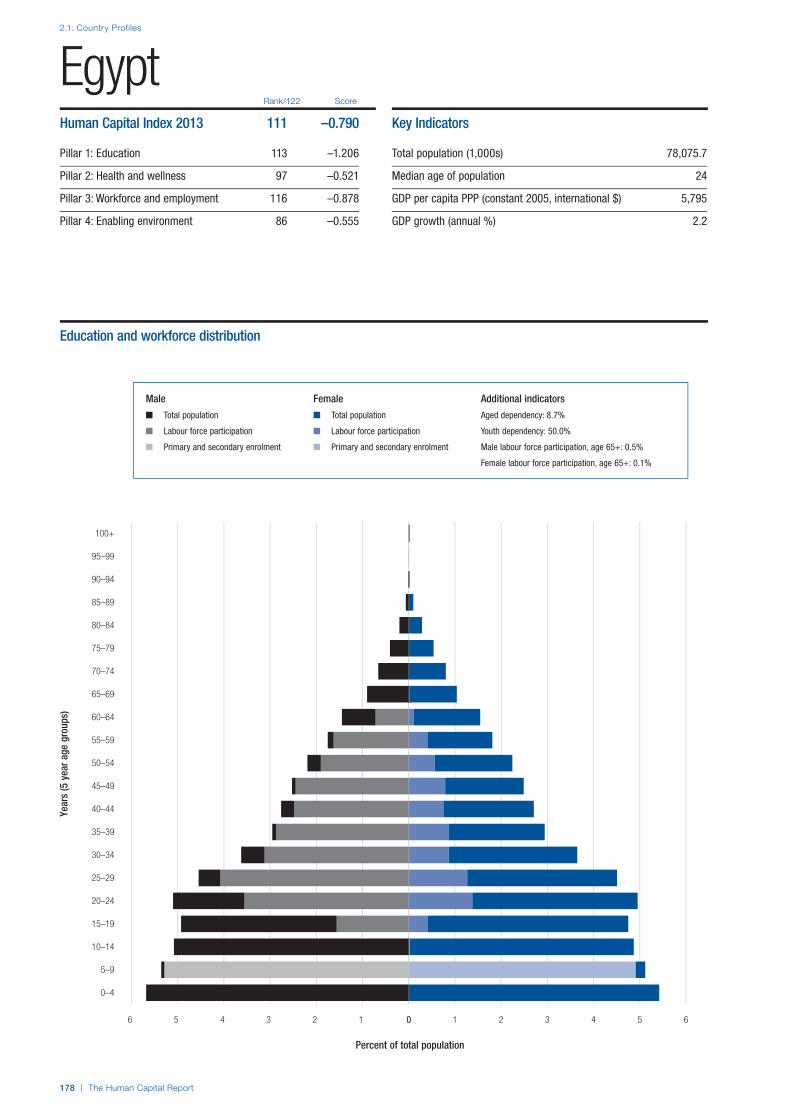
2.1: Country Profiles
178 | The Human Capital Report
Rank/122 Score
Year
s (5
yea
r age
gro
ups)
Percent of total population
0–4
5–9
10–14
15–19
20–24
25–29
30–34
35–39
40–44
45–49
50–54
55–59
60–64
65–69
70–74
75–79
80–84
85–89
90–94
95–99
100+
0 1 2 3 4 5 66 5 4 3 2 1 0
EgyptHuman Capital Index 2013 111 –0.790
Pillar 1: Education 113 –1.206
Pillar 2: Health and wellness 97 –0.521
Pillar 3: Workforce and employment 116 –0.878
Pillar 4: Enabling environment 86 –0.555
Key Indicators
Total population (1,000s) 78,075.7
Median age of population 24
GDP per capita PPP (constant 2005, international $) 5,795
GDP growth (annual %) 2.2
Male Female Additional indicators
n Total population n Total population Aged dependency: 8.7%
n Labour force participation n Labour force participation Youth dependency: 50.0%
n Primary and secondary enrolment n Primary and secondary enrolment Male labour force participation, age 65+: 0.5%
Female labour force participation, age 65+: 0.1%
Education and workforce distribution

The Human Capital Report | 179
2.1: Country Profiles
HCI s
core
–2.5
–2.0
–1.5
–1.0
–0.5
0.0
0.5
1.0
1.5
2.0
2.5
Overall Index
Enablingenvironment
Workforce andemployment
Health andwellness
Education
EgyptEmployment types, educational requirements and educational attainment
Percent of population Educational in employment type attainment (%)
Tertiary requirements 9.0 n/a
Professionals 5.3
Technicians and associate professionals 3.7
Secondary requirements 26.9 n/a
Clerks 1.3
Service workers and shop and market sales workers 3.9
Skilled agricultural and fishery workers 12.6
Craft and related trade workers 6.2
Plant and machine operators and assemblers 2.9
Primary requirements 1.4 n/a
Elementary occupations 1.4
Various 3.4
Legislators, senior officials and managers 3.3
Unclassified 0.0
Armed forces n/a
Spread of scores (by pillar and overall)
Egypt
Lower-middle income economies
Middle East and North Africa

2.1: Country Profiles
180 | The Human Capital Report
Pillar 1: Education Rank/122 Z-Score Country Value Sample Minimum Sample Maximum
Access
Primary enrolment rate (%) ...................................................................42.........................0.522........................ 98...........................58 ......................... 100
Secondary enrolment rate (%) ..............................................................—..............................— .........................— ...........................16 ......................... 100
Tertiary enrolment ratio (%) ...................................................................73.......................–0.487........................ 28.............................1 ......................... 103
Education gender gap2 .........................................................................99.......................–0.448................... 0.925......................0.645 ...................... 1.000
Quality
Internet access in schools1 .................................................................109.......................–1.295..................... 2.70........................1.64 ........................ 6.64
Quality of the education system1 ........................................................120.......................–1.765..................... 2.22........................1.99 ........................ 5.98
Quality of primary schools1 .................................................................122.......................–1.812..................... 1.97........................1.97 ........................ 6.82
Quality of math & science education1 .................................................120.......................–1.963..................... 2.16........................1.88 ........................ 6.29
Quality of management schools1 ........................................................122.......................–2.399..................... 2.29........................2.29 ........................ 6.09
Attainment
Primary education attainment (% population age 25+) ..........................—..............................— .........................— .............................5 ......................... 100
Secondary education attainment (% population age 25+) .....................—..............................— .........................— .............................2 ......................... 100
Tertiary education attainment (% population age 25+) ..........................—..............................— .........................— .............................0 ........................... 44
Pillar 2: Health and Wellness Rank/122 Z-Score Country Value Sample Minimum Sample Maximum
Survival
Infant mortality (per 1,000 live births) ....................................................73.........................0.159........................ 18.............................2 ........................... 98
Life expectancy ...................................................................................72.........................0.056........................ 73...........................50 ........................... 83
Survival gender gap2 ............................................................................46.........................0.504................... 0.977......................0.920 ...................... 0.980
Health
Stunting and wasting (% in children under 5) ........................................52.......................–0.455..................... 19.3..........................1.2 ........................ 36.5
Unhealthy life years (% of life expectancy) ..........................................102.......................–0.528........................ 18.............................8 ........................... 66
Deaths under 60 from non-communicable
diseases (% of all NCD deaths) ......................................................85.......................–0.528 ..................... 33.3 ..........................7.3 ........................ 55.8
Obesity (% of adults with BMI ≥ 30) ...................................................120.......................–1.695..................... 34.6..........................1.1 ........................ 42.8
Business impact of non-communicable diseases1 ..............................110.......................–1.211..................... 3.94........................2.74 ........................ 5.87
Business impact of communicable diseases1 .......................................57.........................0.346..................... 5.82........................3.13 ........................ 6.90
Well-being
Stress (% of respondents)7 ................................................................106.......................–1.258........................ 47.............................8 ........................... 69
Depression (% of respondents)7 ...........................................................79.......................–0.341........................ 14.............................2 ........................... 37
Services
Water, sanitation and hygiene (% with access) .....................................47.........................0.669..................... 97.2........................31.1 ...................... 100.0
Healthcare quality1..............................................................................120.......................–1.495..................... 2.29........................1.78 ........................ 6.75
Healthcare accessibility1 .....................................................................120.......................–1.512..................... 2.81........................2.41 ........................ 6.75
Pillar 3: Workforce and Employment Rank/122 Z-Score Country Value Sample Minimum Sample Maximum
Participation
Labour force participation rate, age 15-64 (%) ...................................112.......................–1.778..................... 51.8........................43.4 ........................ 90.6
Labour force participation rate, age 65+ (%) .........................................85.......................–0.725..................... 10.6..........................1.6 ........................ 91.2
Economic participation gender gap2 ...................................................108.......................–1.612................... 0.454......................0.310 ...................... 0.839
Unemployment rate (%) ........................................................................72.......................–0.050....................... 9.0..........................0.3 ........................ 32.0
Youth unemployment rate (%) ...............................................................80.......................–0.637..................... 24.8..........................1.6 ........................ 48.2
Talent
Country capacity to attract talent1 ......................................................105.......................–1.224..................... 2.18........................1.48 ........................ 6.08
Country capacity to retain talent1........................................................111.......................–1.276..................... 2.30........................1.81 ........................ 5.97
Ease of finding skilled employees1 ........................................................66.......................–0.179..................... 3.86........................2.13 ........................ 5.69
Pay related to productivity1 .................................................................110.......................–1.300..................... 3.13........................2.37 ........................ 5.25
Capacity for innovation1........................................................................97.......................–0.750..................... 3.11........................2.31 ........................ 5.84
Index of Economic Complexity3 ............................................................58.......................–0.163................... –0.05......................–1.96 ........................ 2.37
Firm level technology absorption1 .........................................................95.......................–0.856..................... 4.20........................3.17 ........................ 6.23
Scientific and technical journal articles (per 1,000 people) ....................65.......................–0.534................... 0.028......................0.000 ...................... 1.242
Median age of the working population ..................................................81.......................–0.646........................ 32...........................28 ........................... 42
Training
Staff training1 ......................................................................................117.......................–1.503..................... 3.08........................2.51 ........................ 5.57
Training services1 ..................................................................................92.......................–0.810..................... 3.67........................2.67 ........................ 6.47
Egypt

2.1: Country Profiles
NOTESIn the sections for Pillar 1, Pillar 2, Pillar 3 and Pillar 4, values under Country Value, Sample Minimum and Sample Maximum refer to underlying data for each variable.For further details and explanations, please refer to the section “How to Read the Country Profiles”.1 Survey data responses on a 1- to 7-scale (1 = worst score, 7 = best score)2 Data on a 0- to 1-scale (0 = worst score, 1 = best score)3 Data from -1.960 (worst score) to 2.367 (best score)4 Rank number on a list of 185 countries5 Index on a scale of 0 (perfect inequality) to 100 (perfect equality)6 International test scores7 Perception survey data. Percentage of yes responses.8 Score (1 = best, 7 = worst)9 Reported in relation to UK score (100)
The Human Capital Report | 181
EgyptPillar 4: Enabling Environment Rank/122 Z-Score Country Value Sample Minimum Sample Maximum
Infrastructure
Mobile users (per 100 people) ..............................................................75.......................–0.176...................... 101...........................17 ......................... 191
Internet users (per 100 people) .............................................................66.......................–0.184........................ 39.............................1 ........................... 95
Quality of domestic transport1 ..............................................................89.......................–0.603 ..................... 3.94 ........................2.08 ........................ 6.51
Collaboration
State of cluster development1 ..............................................................44.........................0.278..................... 4.09........................2.33 ........................ 5.49
Business and university R&D collaboration1 ........................................115.......................–1.264..................... 2.65........................2.11 ........................ 5.84
Legal framework
Doing Business Index4 .........................................................................81.......................–0.563...................... 109.............................1 ......................... 180
Social safety net protection1 .................................................................98.......................–0.859..................... 2.85........................2.10 ........................ 6.26
Intellectual property protection and property rights1..............................84.......................–0.603 ..................... 3.47 ........................1.62 ........................ 6.31
Social mobility
Social mobility1 ...................................................................................105.......................–1.018..................... 3.47........................2.78 ........................ 6.36
Additional indicatorsDemographics Value
Child dependency ratio (%)..................................................................... 50.0Aged dependency ratio (%) ...................................................................... 8.7Fertility rate (births per woman) ................................................................. 3.0Sex ratio at birth (female/male) ............................................................... 0.95Population below age 20 (%) .................................................................. 41.1Population above age 60 (%) .................................................................... 8.5
Education
Public spending on education (% of GDP) ................................................ 3.8Technical/vocational enrolment as % of total
enrolment in secondary school ........................................................... 18Adult literacy (%) ..................................................................................... 73.9Boys not in primary school (%) .................................................................... 1Girls not in primary school (%) ..................................................................... 4Education poverty (% of children age 17-22
with less than 2-4 years schooling) ................................................ 0.275Private enrolment in primary school (% of primary) ................................... 7.8Private enrolment in secondary school (% of secondary) .......................... 5.5PIRLS6 .......................................................................................................—PISA math scores6 .....................................................................................—PISA reading scores6 ..................................................................................—PISA science scores6 .................................................................................—TIMSS 4th grade math6 ..............................................................................—TIMSS 4th grade science6 ..........................................................................—TIMSS 8th grade math6 ..............................................................................—TIMSS 8th grade science6 ..........................................................................—
Health
Prevalence of visual impairment (%) ........................................................ 10.5Public spending on health (% of GDP) ...................................................... 4.9Business impact of heart disease1 .......................................................... 3.73Business impact of cancer1 .................................................................... 3.84Business impact of mental illness1 .......................................................... 4.51Business impact of diabetes1 ................................................................. 3.65Business impact of chronic respiratory disease1 ..................................... 3.96Business impact of HIV/AIDS1 ................................................................ 5.97Business impact of tuberculosis1 ............................................................ 5.58Business impact of malaria1 ................................................................... 5.92
Society Value
Freedom in the World8................................................................................. 5Democracy Index (rank/165) .................................................................... 109Population living in urban area (%) .......................................................... 43.7Gini Index (income)5................................................................................ 30.8Accessibility of digital content1 ............................................................... 4.73Extent of virtual social networks use1 ..................................................... 5.91
Workforce
Economic activity (agriculture) — % of total activity ................................ 28.2Economic activity (industry) — % of total activity .................................... 25.3Economic activity (services) — % of total activity .................................... 46.3GDP per person employed (US$) ....................................................... 12,980Cooperation in labour-employer relations1 .............................................. 3.85Emigration rate of the tertiary educated (%) .............................................. 4.7Labour force with tertiary education (%) .....................................................—Number of patent applications (per 1,000 people) .............................. 0.0283Hiring and firing practices1 ...................................................................... 3.28Retirement age, male .................................................................................—Retirement age, female ...............................................................................—Number of informal sector workers (1,000s) ......................................... 8,247Total employed (1,000s) ..................................................................... 23,829Total unemployed (1,000s) .................................................................... 2,351Unemployment for 12 months or more
as a % of total unemployment ......................................................... 84.0Total youth not in education or employment (1,000s) .................................—Unemployment for 12 months or more (1,000s) ................................ 1,974.7Global Innovation Index (rank/142) .......................................................... 108Global Talent Index (rank/60) ..................................................................... 51Quality of Labour Force (rank/60) .............................................................. 53Talent Environment (rank/60) ..................................................................... 42IQ measure9 ........................................................................................... 82.7

2.1: Country Profiles
182 | The Human Capital Report
Rank/122 Score
Year
s (5
yea
r age
gro
ups)
Percent of total population
0–4
5–9
10–14
15–19
20–24
25–29
30–34
35–39
40–44
45–49
50–54
55–59
60–64
65–69
70–74
75–79
80–84
85–89
90–94
95–99
100+
0 1 2 3 4 5 6 77 6 5 4 3 2 1 0
El SalvadorHuman Capital Index 2013 90 –0.405
Pillar 1: Education 95 –0.612
Pillar 2: Health and wellness 92 –0.409
Pillar 3: Workforce and employment 68 –0.175
Pillar 4: Enabling environment 82 –0.425
Key Indicators
Total population (1,000s) 6,218.2
Median age of population 23
GDP per capita PPP (constant 2005, international $) 6,093
GDP growth (annual %) 1.6
Male Female Additional indicators
n Total population n Total population Aged dependency: 11.3%
n Labour force participation n Labour force participation Youth dependency: 52.6%
n Primary and secondary enrolment n Primary and secondary enrolment Male labour force participation, age 65+: 1.6%
Female labour force participation, age 65+: 0.8%
Education and workforce distribution

The Human Capital Report | 183
2.1: Country Profiles
HCI s
core
–2.5
–2.0
–1.5
–1.0
–0.5
0.0
0.5
1.0
1.5
2.0
2.5
Overall Index
Enablingenvironment
Workforce andemployment
Health andwellness
Education
El SalvadorEmployment types, educational requirements and educational attainment
Percent of population Educational in employment type attainment (%)
Tertiary requirements 6.3 6.8
Professionals 1.9
Technicians and associate professionals 4.4
Secondary requirements 32.0 34.9
Clerks 3.0
Service workers and shop and market sales workers 10.9
Skilled agricultural and fishery workers 4.2
Craft and related trade workers 9.8
Plant and machine operators and assemblers 4.2
Primary requirements 17.9 15.2
Elementary occupations 17.9
Various 1.0
Legislators, senior officials and managers 0.9
Unclassified n/a
Armed forces 0.1
Spread of scores (by pillar and overall)
El Salvador
Lower-middle income economies
Latin America and the Carribean

2.1: Country Profiles
184 | The Human Capital Report
Pillar 1: Education Rank/122 Z-Score Country Value Sample Minimum Sample Maximum
Access
Primary enrolment rate (%) ...................................................................64.........................0.289........................ 96...........................58 ......................... 100
Secondary enrolment rate (%) ..............................................................77.......................–0.534........................ 60...........................16 ......................... 100
Tertiary enrolment ratio (%) ...................................................................78.......................–0.607........................ 25.............................1 ......................... 103
Education gender gap2 .........................................................................70.........................0.402................... 0.989......................0.645 ...................... 1.000
Quality
Internet access in schools1 ...................................................................84.......................–0.520..................... 3.67........................1.64 ........................ 6.64
Quality of the education system1 ..........................................................94.......................–0.748..................... 3.13........................1.99 ........................ 5.98
Quality of primary schools1 .................................................................106.......................–1.075..................... 2.77........................1.97 ........................ 6.82
Quality of math & science education1 .................................................108.......................–1.294..................... 2.80........................1.88 ........................ 6.29
Quality of management schools1 ..........................................................81.......................–0.533..................... 3.85........................2.29 ........................ 6.09
Attainment
Primary education attainment (% population age 25+) ..........................57.......................–0.819........................ 57.............................5 ......................... 100
Secondary education attainment (% population age 25+) .....................67.......................–0.805........................ 42.............................2 ......................... 100
Tertiary education attainment (% population age 25+) ..........................73.......................–1.103.......................... 7.............................0 ........................... 44
Pillar 2: Health and Wellness Rank/122 Z-Score Country Value Sample Minimum Sample Maximum
Survival
Infant mortality (per 1,000 live births) ....................................................57.........................0.383........................ 13.............................2 ........................... 98
Life expectancy ...................................................................................77.......................–0.066........................ 72...........................50 ........................... 83
Survival gender gap2 ..............................................................................1.........................0.751................... 0.980......................0.920 ...................... 0.980
Health
Stunting and wasting (% in children under 5) ........................................34.........................0.479..................... 11.1..........................1.2 ........................ 36.5
Unhealthy life years (% of life expectancy) ............................................82.......................–0.107........................ 15.............................8 ........................... 66
Deaths under 60 from non-communicable
diseases (% of all NCD deaths) ......................................................61.........................0.062 ..................... 25.8 ..........................7.3 ........................ 55.8
Obesity (% of adults with BMI ≥ 30) ...................................................102.......................–0.883..................... 26.9..........................1.1 ........................ 42.8
Business impact of non-communicable diseases1 ..............................118.......................–1.503..................... 3.81........................2.74 ........................ 5.87
Business impact of communicable diseases1 .......................................81.......................–0.237..................... 5.24........................3.13 ........................ 6.90
Well-being
Stress (% of respondents)7 ................................................................111.......................–1.413........................ 49.............................8 ........................... 69
Depression (% of respondents)7 ...........................................................79.......................–0.341........................ 14.............................2 ........................... 37
Services
Water, sanitation and hygiene (% with access) .....................................86.......................–0.220..................... 79.8........................31.1 ...................... 100.0
Healthcare quality1..............................................................................118.......................–1.261..................... 2.57........................1.78 ........................ 6.75
Healthcare accessibility1 .....................................................................114.......................–1.366..................... 2.99........................2.41 ........................ 6.75
Pillar 3: Workforce and Employment Rank/122 Z-Score Country Value Sample Minimum Sample Maximum
Participation
Labour force participation rate, age 15-64 (%) .....................................89.......................–0.439..................... 64.9........................43.4 ........................ 90.6
Labour force participation rate, age 65+ (%) .........................................32.........................0.389..................... 32.2..........................1.6 ........................ 91.2
Economic participation gender gap2 .....................................................98.......................–0.856................... 0.543......................0.310 ...................... 0.839
Unemployment rate (%) ........................................................................43.........................0.323....................... 7.0..........................0.3 ........................ 32.0
Youth unemployment rate (%) ...............................................................27.........................0.741..................... 11.4..........................1.6 ........................ 48.2
Talent
Country capacity to attract talent1 ........................................................40.........................0.363..................... 3.81........................1.48 ........................ 6.08
Country capacity to retain talent1..........................................................59.......................–0.068..................... 3.47........................1.81 ........................ 5.97
Ease of finding skilled employees1 ........................................................47.........................0.227..................... 4.14........................2.13 ........................ 5.69
Pay related to productivity1 ...................................................................97.......................–0.774..................... 3.45........................2.37 ........................ 5.25
Capacity for innovation1........................................................................51.......................–0.043..................... 3.67........................2.31 ........................ 5.84
Index of Economic Complexity3 ............................................................56.......................–0.114..................... 0.00......................–1.96 ........................ 2.37
Firm level technology absorption1 .........................................................87.......................–0.743..................... 4.29........................3.17 ........................ 6.23
Scientific and technical journal articles (per 1,000 people) ..................118.......................–0.626................... 0.001......................0.000 ...................... 1.242
Median age of the working population ..................................................92.......................–0.945........................ 31...........................28 ........................... 42
Training
Staff training1 ........................................................................................71.......................–0.203..................... 3.91........................2.51 ........................ 5.57
Training services1 ..................................................................................61.......................–0.033..................... 4.28........................2.67 ........................ 6.47
El Salvador

2.1: Country Profiles
NOTESIn the sections for Pillar 1, Pillar 2, Pillar 3 and Pillar 4, values under Country Value, Sample Minimum and Sample Maximum refer to underlying data for each variable.For further details and explanations, please refer to the section “How to Read the Country Profiles”.1 Survey data responses on a 1- to 7-scale (1 = worst score, 7 = best score)2 Data on a 0- to 1-scale (0 = worst score, 1 = best score)3 Data from -1.960 (worst score) to 2.367 (best score)4 Rank number on a list of 185 countries5 Index on a scale of 0 (perfect inequality) to 100 (perfect equality)6 International test scores7 Perception survey data. Percentage of yes responses.8 Score (1 = best, 7 = worst)9 Reported in relation to UK score (100)
The Human Capital Report | 185
El SalvadorPillar 4: Enabling Environment Rank/122 Z-Score Country Value Sample Minimum Sample Maximum
Infrastructure
Mobile users (per 100 people) ..............................................................23.........................0.778...................... 134...........................17 ......................... 191
Internet users (per 100 people) .............................................................93.......................–0.934........................ 18.............................1 ........................... 95
Quality of domestic transport1 ..............................................................40.........................0.390 ..................... 4.81 ........................2.08 ........................ 6.51
Collaboration
State of cluster development1 ..............................................................46.........................0.248..................... 4.07........................2.33 ........................ 5.49
Business and university R&D collaboration1 ..........................................85.......................–0.593 ..................... 3.25 ........................2.11 ........................ 5.84
Legal framework
Doing Business Index4 .........................................................................84.......................–0.641...................... 113.............................1 ......................... 180
Social safety net protection1 .................................................................94.......................–0.821..................... 2.89........................2.10 ........................ 6.26
Intellectual property protection and property rights1..............................97.......................–0.856 ..................... 3.22 ........................1.62 ........................ 6.31
Social mobility
Social mobility1 ...................................................................................116.......................–1.396..................... 3.13........................2.78 ........................ 6.36
Additional indicatorsDemographics Value
Child dependency ratio (%)..................................................................... 52.6Aged dependency ratio (%) .................................................................... 11.3Fertility rate (births per woman) ................................................................. 2.3Sex ratio at birth (female/male) ............................................................... 0.95Population below age 20 (%) .................................................................. 43.8Population above age 60 (%) .................................................................... 9.4
Education
Public spending on education (% of GDP) ................................................ 3.4Technical/vocational enrolment as % of total
enrolment in secondary school ........................................................... 16Adult literacy (%) ..................................................................................... 84.5Boys not in primary school (%) .................................................................... 4Girls not in primary school (%) ..................................................................... 4Education poverty (% of children age 17-22
with less than 2-4 years schooling) ......................................................—Private enrolment in primary school (% of primary) ................................. 10.1Private enrolment in secondary school (% of secondary) ........................ 16.3PIRLS6 .......................................................................................................—PISA math scores6 .....................................................................................—PISA reading scores6 ..................................................................................—PISA science scores6 .................................................................................—TIMSS 4th grade math6 ..............................................................................—TIMSS 4th grade science6 ..........................................................................—TIMSS 8th grade math6 ..............................................................................—TIMSS 8th grade science6 ..........................................................................—
Health
Prevalence of visual impairment (%) .......................................................... 4.1Public spending on health (% of GDP) ...................................................... 6.8Business impact of heart disease1 .......................................................... 3.80Business impact of cancer1 .................................................................... 4.01Business impact of mental illness1 .......................................................... 4.26Business impact of diabetes1 ................................................................. 3.69Business impact of chronic respiratory disease1 ..................................... 3.26Business impact of HIV/AIDS1 ................................................................ 5.00Business impact of tuberculosis1 ............................................................ 4.56Business impact of malaria1 ................................................................... 6.17
Society Value
Freedom in the World8................................................................................. 2Democracy Index (rank/165) ...................................................................... 61Population living in urban area (%) .......................................................... 65.2Gini Index (income)5................................................................................ 48.3Accessibility of digital content1 ............................................................... 4.82Extent of virtual social networks use1 ..................................................... 5.03
Workforce
Economic activity (agriculture) — % of total activity ................................ 20.8Economic activity (industry) — % of total activity .................................... 21.4Economic activity (services) — % of total activity .................................... 57.8GDP per person employed (US$) ...............................................................—Cooperation in labour-employer relations1 .............................................. 4.22Emigration rate of the tertiary educated (%) ............................................ 31.7Labour force with tertiary education (%) ................................................. 24.8Number of patent applications (per 1,000 people) ......................................—Hiring and firing practices1 ...................................................................... 3.62Retirement age, male .................................................................................—Retirement age, female ...............................................................................—Number of informal sector workers (1,000s) ......................................... 1,242Total employed (1,000s) ....................................................................... 2,398Total unemployed (1,000s) ....................................................................... 182Unemployment for 12 months or more
as a % of total unemployment .............................................................—Total youth not in education or employment (1,000s) ........................... 319.4Unemployment for 12 months or more (1,000s) .........................................—Global Innovation Index (rank/142) ............................................................ 88Global Talent Index (rank/60) ......................................................................—Quality of Labour Force (rank/60) ...............................................................—Talent Environment (rank/60) ......................................................................—IQ measure9 ........................................................................................... 78.9

2.1: Country Profiles
186 | The Human Capital Report
Rank/122 Score
Year
s (5
yea
r age
gro
ups)
Percent of total population
0–4
5–9
10–14
15–19
20–24
25–29
30–34
35–39
40–44
45–49
50–54
55–59
60–64
65–69
70–74
75–79
80–84
85–89
90–94
95–99
100+
0 1 2 3 4 55 4 3 2 1 0
EstoniaHuman Capital Index 2013 27 0.571
Pillar 1: Education 20 0.862
Pillar 2: Health and wellness 22 0.536
Pillar 3: Workforce and employment 39 0.142
Pillar 4: Enabling environment 26 0.745
Key Indicators
Total population (1,000s) 1,298.5
Median age of population 40
GDP per capita PPP (constant 2005, international $) 18,722
GDP growth (annual %) 3.2
Male Female Additional indicators
n Total population n Total population Aged dependency: 26.0%
n Labour force participation n Labour force participation Youth dependency: 22.9%
n Primary and secondary enrolment n Primary and secondary enrolment Male labour force participation, age 65+: 0.6%
Female labour force participation, age 65+: 0.8%
Education and workforce distribution

The Human Capital Report | 187
2.1: Country Profiles
HCI s
core
–2.5
–2.0
–1.5
–1.0
–0.5
0.0
0.5
1.0
1.5
2.0
2.5
Overall Index
Enablingenvironment
Workforce andemployment
Health andwellness
Education
EstoniaEmployment types, educational requirements and educational attainment
Percent of population Educational in employment type attainment (%)
Tertiary requirements 16.3 35.5
Professionals 8.4
Technicians and associate professionals 8.0
Secondary requirements 32.2 n/a
Clerks 3.4
Service workers and shop and market sales workers 8.0
Skilled agricultural and fishery workers 1.2
Craft and related trade workers 10.7
Plant and machine operators and assemblers 8.9
Primary requirements 6.4 n/a
Elementary occupations 6.4
Various 8.0
Legislators, senior officials and managers 7.4
Unclassified 0.7
Armed forces n/a
Spread of scores (by pillar and overall)
Estonia
High-income economies
Europe and Central Asia

2.1: Country Profiles
188 | The Human Capital Report
Pillar 1: Education Rank/122 Z-Score Country Value Sample Minimum Sample Maximum
Access
Primary enrolment rate (%) ...................................................................51.........................0.468........................ 97...........................58 ......................... 100
Secondary enrolment rate (%) ..............................................................17.........................0.860........................ 92...........................16 ......................... 100
Tertiary enrolment ratio (%) ...................................................................27.........................0.901........................ 64.............................1 ......................... 103
Education gender gap2 .........................................................................52.........................0.463................... 0.994......................0.645 ...................... 1.000
Quality
Internet access in schools1 .....................................................................3.........................1.757..................... 6.52........................1.64 ........................ 6.64
Quality of the education system1 ..........................................................39.........................0.382..................... 4.14........................1.99 ........................ 5.98
Quality of primary schools1 ...................................................................15.........................1.162..................... 5.20........................1.97 ........................ 6.82
Quality of math & science education1 ...................................................20.........................0.891..................... 4.89........................1.88 ........................ 6.29
Quality of management schools1 ..........................................................46.........................0.220..................... 4.48........................2.29 ........................ 6.09
Attainment
Primary education attainment (% population age 25+) ..........................—..............................— .........................— .............................5 ......................... 100
Secondary education attainment (% population age 25+) .....................—..............................— .........................— .............................2 ......................... 100
Tertiary education attainment (% population age 25+) ............................6.........................1.518 ........................ 36 .............................0 ........................... 44
Pillar 2: Health and Wellness Rank/122 Z-Score Country Value Sample Minimum Sample Maximum
Survival
Infant mortality (per 1,000 live births) ......................................................8.........................0.832.......................... 3.............................2 ........................... 98
Life expectancy ...................................................................................42.........................0.420........................ 76...........................50 ........................... 83
Survival gender gap2 ............................................................................28.........................0.714................... 0.979......................0.920 ...................... 0.980
Health
Stunting and wasting (% in children under 5) ........................................—..............................— .........................— ..........................1.2 ........................ 36.5
Unhealthy life years (% of life expectancy) ............................................54.........................0.245........................ 13.............................8 ........................... 66
Deaths under 60 from non-communicable
diseases (% of all NCD deaths) ......................................................33.........................0.911 ..................... 15.0 ..........................7.3 ........................ 55.8
Obesity (% of adults with BMI ≥ 30) .....................................................54.......................–0.038..................... 18.9..........................1.1 ........................ 42.8
Business impact of non-communicable diseases1 ................................16.........................1.123..................... 4.98........................2.74 ........................ 5.87
Business impact of communicable diseases1 .......................................30.........................0.812..................... 6.28........................3.13 ........................ 6.90
Well-being
Stress (% of respondents)7 ..................................................................28.........................0.525........................ 24.............................8 ........................... 69
Depression (% of respondents)7 ...........................................................56.........................0.137........................ 11.............................2 ........................... 37
Services
Water, sanitation and hygiene (% with access) .....................................37.........................0.783..................... 99.4........................31.1 ...................... 100.0
Healthcare quality1................................................................................43.........................0.416..................... 4.62........................1.78 ........................ 6.75
Healthcare accessibility1 .......................................................................52.........................0.092..................... 4.78........................2.41 ........................ 6.75
Pillar 3: Workforce and Employment Rank/122 Z-Score Country Value Sample Minimum Sample Maximum
Participation
Labour force participation rate, age 15-64 (%) .....................................38.........................0.492..................... 74.0........................43.4 ........................ 90.6
Labour force participation rate, age 65+ (%) .........................................77.......................–0.627..................... 12.5..........................1.6 ........................ 91.2
Economic participation gender gap2 .....................................................36.........................0.642................... 0.719......................0.310 ...................... 0.839
Unemployment rate (%) ........................................................................98.......................–1.558..................... 16.9..........................0.3 ........................ 32.0
Youth unemployment rate (%) ...............................................................97.......................–1.480..................... 33.0..........................1.6 ........................ 48.2
Talent
Country capacity to attract talent1 ........................................................77.......................–0.418..................... 3.01........................1.48 ........................ 6.08
Country capacity to retain talent1..........................................................82.......................–0.551..................... 3.00........................1.81 ........................ 5.97
Ease of finding skilled employees1 ........................................................96.......................–0.915..................... 3.35........................2.13 ........................ 5.69
Pay related to productivity1 .....................................................................6.........................1.635..................... 4.92........................2.37 ........................ 5.25
Capacity for innovation1........................................................................26.........................0.713..................... 4.27........................2.31 ........................ 5.84
Index of Economic Complexity3 ............................................................29.........................0.713..................... 0.79......................–1.96 ........................ 2.37
Firm level technology absorption1 .........................................................33.........................0.792..................... 5.38........................3.17 ........................ 6.23
Scientific and technical journal articles (per 1,000 people) ....................27.........................0.661................... 0.386......................0.000 ...................... 1.242
Median age of the working population ..................................................23.........................1.125........................ 40...........................28 ........................... 42
Training
Staff training1 ........................................................................................32.........................0.523..................... 4.38........................2.51 ........................ 5.57
Training services1 ..................................................................................33.........................0.527..................... 4.72........................2.67 ........................ 6.47
Estonia

2.1: Country Profiles
NOTESIn the sections for Pillar 1, Pillar 2, Pillar 3 and Pillar 4, values under Country Value, Sample Minimum and Sample Maximum refer to underlying data for each variable.For further details and explanations, please refer to the section “How to Read the Country Profiles”.1 Survey data responses on a 1- to 7-scale (1 = worst score, 7 = best score)2 Data on a 0- to 1-scale (0 = worst score, 1 = best score)3 Data from -1.960 (worst score) to 2.367 (best score)4 Rank number on a list of 185 countries5 Index on a scale of 0 (perfect inequality) to 100 (perfect equality)6 International test scores7 Perception survey data. Percentage of yes responses.8 Score (1 = best, 7 = worst)9 Reported in relation to UK score (100)
The Human Capital Report | 189
EstoniaPillar 4: Enabling Environment Rank/122 Z-Score Country Value Sample Minimum Sample Maximum
Infrastructure
Mobile users (per 100 people) ..............................................................20.........................0.938...................... 139...........................17 ......................... 191
Internet users (per 100 people) .............................................................23.........................1.166........................ 77.............................1 ........................... 95
Quality of domestic transport1 ..............................................................29.........................0.699 ..................... 5.08 ........................2.08 ........................ 6.51
Collaboration
State of cluster development1 ..............................................................69.......................–0.297..................... 3.68........................2.33 ........................ 5.49
Business and university R&D collaboration1 ..........................................34.........................0.675 ..................... 4.39 ........................2.11 ........................ 5.84
Legal framework
Doing Business Index4 .........................................................................19.........................1.143........................ 21.............................1 ......................... 180
Social safety net protection1 .................................................................40.........................0.302..................... 4.11........................2.10 ........................ 6.26
Intellectual property protection and property rights1..............................29.........................0.863 ..................... 4.97 ........................1.62 ........................ 6.31
Social mobility
Social mobility1 .....................................................................................22.........................1.218..................... 5.49........................2.78 ........................ 6.36
Additional indicatorsDemographics Value
Child dependency ratio (%)..................................................................... 22.9Aged dependency ratio (%) .................................................................... 26.0Fertility rate (births per woman) ................................................................. 1.6Sex ratio at birth (female/male) ............................................................... 0.94Population below age 20 (%) .................................................................. 21.1Population above age 60 (%) .................................................................. 23.4
Education
Public spending on education (% of GDP) ................................................ 5.7Technical/vocational enrolment as % of total
enrolment in secondary school ........................................................... 20Adult literacy (%) ..................................................................................... 99.8Boys not in primary school (%) .................................................................... 2Girls not in primary school (%) ..................................................................... 3Education poverty (% of children age 17-22
with less than 2-4 years schooling) ......................................................—Private enrolment in primary school (% of primary) ................................... 4.1Private enrolment in secondary school (% of secondary) .......................... 3.3PIRLS6 .......................................................................................................—PISA math scores6 .................................................................................. 512PISA reading scores6 ............................................................................... 501PISA science scores6 .............................................................................. 528TIMSS 4th grade math6 ..............................................................................—TIMSS 4th grade science6 ..........................................................................—TIMSS 8th grade math6 ..............................................................................—TIMSS 8th grade science6 ..........................................................................—
Health
Prevalence of visual impairment (%) .......................................................... 1.5Public spending on health (% of GDP) ...................................................... 6.0Business impact of heart disease1 .......................................................... 4.49Business impact of cancer1 .................................................................... 4.69Business impact of mental illness1 .......................................................... 5.65Business impact of diabetes1 ................................................................. 5.29Business impact of chronic respiratory disease1 ..................................... 4.80Business impact of HIV/AIDS1 ................................................................ 5.94Business impact of tuberculosis1 ............................................................ 6.17Business impact of malaria1 ................................................................... 6.74
Society Value
Freedom in the World8................................................................................. 1Democracy Index (rank/165) ...................................................................... 34Population living in urban area (%) .......................................................... 69.6Gini Index (income)5................................................................................ 36.0Accessibility of digital content1 ............................................................... 6.41Extent of virtual social networks use1 ..................................................... 6.41
Workforce
Economic activity (agriculture) — % of total activity .................................. 4.4Economic activity (industry) — % of total activity .................................... 31.9Economic activity (services) — % of total activity .................................... 62.9GDP per person employed (US$) ....................................................... 45,481Cooperation in labour-employer relations1 .............................................. 4.94Emigration rate of the tertiary educated (%) .............................................. 9.9Labour force with tertiary education (%) ................................................. 36.1Number of patent applications (per 1,000 people) .............................. 0.0593Hiring and firing practices1 ...................................................................... 4.64Retirement age, male ................................................................................ 64Retirement age, female .............................................................................. 63Number of informal sector workers (1,000s) ...............................................—Total employed (1,000s) .......................................................................... 571Total unemployed (1,000s) ....................................................................... 116Unemployment for 12 months or more
as a % of total unemployment ......................................................... 45.4Total youth not in education or employment (1,000s) ............................. 28.3Unemployment for 12 months or more (1,000s) ..................................... 52.6Global Innovation Index (rank/142) ............................................................ 25Global Talent Index (rank/60) ......................................................................—Quality of Labour Force (rank/60) ...............................................................—Talent Environment (rank/60) ......................................................................—IQ measure9 ........................................................................................... 99.8

2.1: Country Profiles
190 | The Human Capital Report
Rank/122 Score
Year
s (5
yea
r age
gro
ups)
Percent of total population
0–4
5–9
10–14
15–19
20–24
25–29
30–34
35–39
40–44
45–49
50–54
55–59
60–64
65–69
70–74
75–79
80–84
85–89
90–94
95–99
100+
0 1 2 3 4 5 6 7 88 7 6 5 4 3 2 1 0
EthiopiaHuman Capital Index 2013 116 –0.961
Pillar 1: Education 115 –1.380
Pillar 2: Health and wellness 108 –0.749
Pillar 3: Workforce and employment 111 –0.660
Pillar 4: Enabling environment 111 –1.056
Key Indicators
Total population (1,000s) 87,095.3
Median age of population 17
GDP per capita PPP (constant 2005, international $) 981
GDP growth (annual %) 8.5
Male Female Additional indicators
n Total population n Total population Aged dependency: 6.3%
n Labour force participation n Labour force participation Youth dependency: 85.0%
n Primary and secondary enrolment n Primary and secondary enrolment Male labour force participation, age 65+: 0.1%
Female labour force participation, age 65+: 0.1%
Education and workforce distribution

The Human Capital Report | 191
2.1: Country Profiles
HCI s
core
–2.5
–2.0
–1.5
–1.0
–0.5
0.0
0.5
1.0
1.5
2.0
2.5
Overall Index
Enablingenvironment
Workforce andemployment
Health andwellness
Education
EthiopiaEmployment types, educational requirements and educational attainment
Percent of population Educational in employment type attainment (%)
Tertiary requirements 1.0 0.5
Professionals 0.3
Technicians and associate professionals 0.6
Secondary requirements 35.9 n/a
Clerks 0.4
Service workers and shop and market sales workers 4.3
Skilled agricultural and fishery workers 26.3
Craft and related trade workers 4.5
Plant and machine operators and assemblers 0.4
Primary requirements 27.8 17.8
Elementary occupations 27.8
Various 3.7
Legislators, senior officials and managers 0.2
Unclassified 3.4
Armed forces n/a
Spread of scores (by pillar and overall)
Ethiopia
Low-income economies
Sub-Saharan Africa

2.1: Country Profiles
192 | The Human Capital Report
Pillar 1: Education Rank/122 Z-Score Country Value Sample Minimum Sample Maximum
Access
Primary enrolment rate (%) ...................................................................97.......................–0.704........................ 87...........................58 ......................... 100
Secondary enrolment rate (%) ..............................................................—..............................— .........................— ...........................16 ......................... 100
Tertiary enrolment ratio (%) .................................................................106.......................–1.251.......................... 8.............................1 ......................... 103
Education gender gap2 .......................................................................114.......................–2.913................... 0.739......................0.645 ...................... 1.000
Quality
Internet access in schools1 .................................................................108.......................–1.247..................... 2.76........................1.64 ........................ 6.64
Quality of the education system1 ..........................................................93.......................–0.736..................... 3.14........................1.99 ........................ 5.98
Quality of primary schools1 ...................................................................92.......................–0.790..................... 3.08........................1.97 ........................ 6.82
Quality of math & science education1 ...................................................90.......................–0.698..................... 3.37........................1.88 ........................ 6.29
Quality of management schools1 ........................................................102.......................–0.916..................... 3.53........................2.29 ........................ 6.09
Attainment
Primary education attainment (% population age 25+) ..........................69.......................–2.147........................ 25.............................5 ......................... 100
Secondary education attainment (% population age 25+) .....................83.......................–2.107.......................... 7.............................2 ......................... 100
Tertiary education attainment (% population age 25+) ..........................85.......................–1.675.......................... 0.............................0 ........................... 44
Pillar 2: Health and Wellness Rank/122 Z-Score Country Value Sample Minimum Sample Maximum
Survival
Infant mortality (per 1,000 live births) ..................................................107.......................–1.368........................ 52.............................2 ........................... 98
Life expectancy .................................................................................107.......................–1.525........................ 60...........................50 ........................... 83
Survival gender gap2 ............................................................................62.........................0.234................... 0.974......................0.920 ...................... 0.980
Health
Stunting and wasting (% in children under 5) ........................................71.......................–1.349..................... 27.2..........................1.2 ........................ 36.5
Unhealthy life years (% of life expectancy) ............................................97.......................–0.338........................ 17.............................8 ........................... 66
Deaths under 60 from non-communicable
diseases (% of all NCD deaths) ....................................................114.......................–1.543 ..................... 46.2 ..........................7.3 ........................ 55.8
Obesity (% of adults with BMI ≥ 30) .......................................................2.........................1.829....................... 1.2..........................1.1 ........................ 42.8
Business impact of non-communicable diseases1 ................................30.........................0.648..................... 4.77........................2.74 ........................ 5.87
Business impact of communicable diseases1 .....................................107.......................–1.478..................... 4.01........................3.13 ........................ 6.90
Well-being
Stress (% of respondents)7 ..................................................................—..............................— .........................— .............................8 ........................... 69
Depression (% of respondents)7 ...........................................................—..............................— .........................— .............................2 ........................... 37
Services
Water, sanitation and hygiene (% with access) ...................................118.......................–2.521..................... 35.0........................31.1 ...................... 100.0
Healthcare quality1................................................................................83.......................–0.673..................... 3.29........................1.78 ........................ 6.75
Healthcare accessibility1 .......................................................................94.......................–0.901..................... 3.56........................2.41 ........................ 6.75
Pillar 3: Workforce and Employment Rank/122 Z-Score Country Value Sample Minimum Sample Maximum
Participation
Labour force participation rate, age 15-64 (%) .......................................4.........................1.698..................... 85.8........................43.4 ........................ 90.6
Labour force participation rate, age 65+ (%) ...........................................9.........................1.576..................... 55.2..........................1.6 ........................ 91.2
Economic participation gender gap2 .....................................................75.......................–0.184................... 0.622......................0.310 ...................... 0.839
Unemployment rate (%) ......................................................................102.......................–1.940..................... 18.9..........................0.3 ........................ 32.0
Youth unemployment rate (%) ...............................................................81.......................–0.647..................... 24.9..........................1.6 ........................ 48.2
Talent
Country capacity to attract talent1 ........................................................95.......................–0.868..................... 2.54........................1.48 ........................ 6.08
Country capacity to retain talent1..........................................................96.......................–0.793..................... 2.76........................1.81 ........................ 5.97
Ease of finding skilled employees1 ........................................................54.........................0.096..................... 4.05........................2.13 ........................ 5.69
Pay related to productivity1 .................................................................106.......................–1.049..................... 3.28........................2.37 ........................ 5.25
Capacity for innovation1......................................................................119.......................–1.402..................... 2.59........................2.31 ........................ 5.84
Index of Economic Complexity3 ............................................................95.......................–1.098................... –0.94......................–1.96 ........................ 2.37
Firm level technology absorption1 .......................................................114.......................–1.374..................... 3.83........................3.17 ........................ 6.23
Scientific and technical journal articles (per 1,000 people) ..................104.......................–0.621................... 0.002......................0.000 ...................... 1.242
Median age of the working population ................................................113.......................–1.347........................ 29...........................28 ........................... 42
Training
Staff training1 ......................................................................................105.......................–1.161..................... 3.30........................2.51 ........................ 5.57
Training services1 ................................................................................115.......................–1.445..................... 3.16........................2.67 ........................ 6.47
Ethiopia

2.1: Country Profiles
NOTESIn the sections for Pillar 1, Pillar 2, Pillar 3 and Pillar 4, values under Country Value, Sample Minimum and Sample Maximum refer to underlying data for each variable.For further details and explanations, please refer to the section “How to Read the Country Profiles”.1 Survey data responses on a 1- to 7-scale (1 = worst score, 7 = best score)2 Data on a 0- to 1-scale (0 = worst score, 1 = best score)3 Data from -1.960 (worst score) to 2.367 (best score)4 Rank number on a list of 185 countries5 Index on a scale of 0 (perfect inequality) to 100 (perfect equality)6 International test scores7 Perception survey data. Percentage of yes responses.8 Score (1 = best, 7 = worst)9 Reported in relation to UK score (100)
The Human Capital Report | 193
EthiopiaPillar 4: Enabling Environment Rank/122 Z-Score Country Value Sample Minimum Sample Maximum
Infrastructure
Mobile users (per 100 people) ............................................................122.......................–2.658........................ 17...........................17 ......................... 191
Internet users (per 100 people) ...........................................................122.......................–1.526.......................... 1.............................1 ........................... 95
Quality of domestic transport1 ..............................................................93.......................–0.702..................... 3.86........................2.08 ........................ 6.51
Collaboration
State of cluster development1 ............................................................108.......................–1.162..................... 3.06........................2.33 ........................ 5.49
Business and university R&D collaboration1 ..........................................65.......................–0.328..................... 3.49........................2.11 ........................ 5.84
Legal framework
Doing Business Index4 .........................................................................93.......................–0.912...................... 127.............................1 ......................... 180
Social safety net protection1 ...............................................................103.......................–1.000..................... 2.70........................2.10 ........................ 6.26
Intellectual property protection and property rights1..............................78.......................–0.487 ..................... 3.59 ........................1.62 ........................ 6.31
Social mobility
Social mobility1 .....................................................................................92.......................–0.732..................... 3.73........................2.78 ........................ 6.36
Additional indicatorsDemographics Value
Child dependency ratio (%)..................................................................... 85.0Aged dependency ratio (%) ...................................................................... 6.3Fertility rate (births per woman) ................................................................. 5.3Sex ratio at birth (female/male) ............................................................... 0.97Population below age 20 (%) .................................................................. 55.7Population above age 60 (%) .................................................................... 5.1
Education
Public spending on education (% of GDP) ................................................ 4.7Technical/vocational enrolment as % of total
enrolment in secondary school ............................................................. 8Adult literacy (%) ..................................................................................... 39.0Boys not in primary school (%) .................................................................. 10Girls not in primary school (%) ................................................................... 16Education poverty (% of children age 17-22
with less than 2-4 years schooling) ................................................ 1.109Private enrolment in primary school (% of primary) ................................... 9.6Private enrolment in secondary school (% of secondary) ........................ 11.3PIRLS6 .......................................................................................................—PISA math scores6 .....................................................................................—PISA reading scores6 ..................................................................................—PISA science scores6 .................................................................................—TIMSS 4th grade math6 ..............................................................................—TIMSS 4th grade science6 ..........................................................................—TIMSS 8th grade math6 ..............................................................................—TIMSS 8th grade science6 ..........................................................................—
Health
Prevalence of visual impairment (%) .......................................................... 7.1Public spending on health (% of GDP) ...................................................... 4.7Business impact of heart disease1 .......................................................... 4.80Business impact of cancer1 .................................................................... 4.82Business impact of mental illness1 .......................................................... 5.12Business impact of diabetes1 ................................................................. 4.72Business impact of chronic respiratory disease1 ..................................... 4.40Business impact of HIV/AIDS1 ................................................................ 3.87Business impact of tuberculosis1 ............................................................ 3.78Business impact of malaria1 ................................................................... 4.38
Society Value
Freedom in the World8................................................................................. 6Democracy Index (rank/165) .................................................................... 123Population living in urban area (%) .......................................................... 17.3Gini Index (income)5................................................................................ 33.6Accessibility of digital content1 ............................................................... 3.08Extent of virtual social networks use1 ..................................................... 3.94
Workforce
Economic activity (agriculture) — % of total activity ....................................—Economic activity (industry) — % of total activity ........................................—Economic activity (services) — % of total activity ........................................—GDP per person employed (US$) ......................................................... 2,087Cooperation in labour-employer relations1 .............................................. 3.79Emigration rate of the tertiary educated (%) .............................................. 9.8Labour force with tertiary education (%) ................................................... 1.3Number of patent applications (per 1,000 people) .............................. 0.0004Hiring and firing practices1 ...................................................................... 3.60Retirement age, male .................................................................................—Retirement age, female ...............................................................................—Number of informal sector workers (1,000s) ...............................................—Total employed (1,000s) ....................................................................... 4,798Total unemployed (1,000s) .................................................................... 1,117Unemployment for 12 months or more
as a % of total unemployment ......................................................... 37.9Total youth not in education or employment (1,000s) .................................—Unemployment for 12 months or more (1,000s) ................................... 423.4Global Innovation Index (rank/142) .......................................................... 129Global Talent Index (rank/60) ......................................................................—Quality of Labour Force (rank/60) ...............................................................—Talent Environment (rank/60) ......................................................................—IQ measure9 ........................................................................................... 68.5

2.1: Country Profiles
194 | The Human Capital Report
Rank/122 Score
Year
s (5
yea
r age
gro
ups)
Percent of total population
0–4
5–9
10–14
15–19
20–24
25–29
30–34
35–39
40–44
45–49
50–54
55–59
60–64
65–69
70–74
75–79
80–84
85–89
90–94
95–99
100+
0 1 2 3 4 55 4 3 2 1 0
FinlandHuman Capital Index 2013 2 1.406
Pillar 1: Education 1 1.601
Pillar 2: Health and wellness 9 0.844
Pillar 3: Workforce and employment 3 1.250
Pillar 4: Enabling environment 1 1.926
Key Indicators
Total population (1,000s) 5,367.7
Median age of population 42
GDP per capita PPP (constant 2005, international $) 31,810
GDP growth (annual %) –0.2
Male Female Additional indicators
n Total population n Total population Aged dependency: 25.8%
n Labour force participation n Labour force participation Youth dependency: 24.9%
n Primary and secondary enrolment n Primary and secondary enrolment Male labour force participation, age 65+: 0.5%
Female labour force participation, age 65+: 0.2%
Education and workforce distribution

The Human Capital Report | 195
2.1: Country Profiles
HCI s
core
–2.5
–2.0
–1.5
–1.0
–0.5
0.0
0.5
1.0
1.5
2.0
2.5
Overall Index
Enablingenvironment
Workforce andemployment
Health andwellness
Education
FinlandEmployment types, educational requirements and educational attainment
Percent of population Educational in employment type attainment (%)
Tertiary requirements 19.9 31.6
Professionals 10.5
Technicians and associate professionals 9.4
Secondary requirements 28.3 68.4
Clerks 4.0
Service workers and shop and market sales workers 9.4
Skilled agricultural and fishery workers 2.5
Craft and related trade workers 7.4
Plant and machine operators and assemblers 5.0
Primary requirements 5.1 n/a
Elementary occupations 5.1
Various 7.5
Legislators, senior officials and managers 5.7
Unclassified 1.0
Armed forces 0.7
Spread of scores (by pillar and overall)
Finland
High-income economies
Europe and Central Asia

2.1: Country Profiles
196 | The Human Capital Report
Pillar 1: Education Rank/122 Z-Score Country Value Sample Minimum Sample Maximum
Access
Primary enrolment rate (%) ...................................................................40.........................0.544........................ 98...........................58 ......................... 100
Secondary enrolment rate (%) ..............................................................14.........................0.920........................ 93...........................16 ......................... 100
Tertiary enrolment ratio (%) .....................................................................2.........................2.075........................ 95.............................1 ......................... 103
Education gender gap2 ...........................................................................1.........................0.548................... 1.000......................0.645 ...................... 1.000
Quality
Internet access in schools1 .....................................................................2.........................1.797..................... 6.57........................1.64 ........................ 6.64
Quality of the education system1 ............................................................2.........................2.384..................... 5.93........................1.99 ........................ 5.98
Quality of primary schools1 .....................................................................1.........................2.653..................... 6.82........................1.97 ........................ 6.82
Quality of math & science education1 .....................................................2.........................2.323..................... 6.26........................1.88 ........................ 6.29
Quality of management schools1 ..........................................................10.........................1.608..................... 5.64........................2.29 ........................ 6.09
Attainment
Primary education attainment (% population age 25+) ..........................—..............................— .........................— .............................5 ......................... 100
Secondary education attainment (% population age 25+) .....................—..............................— .........................— .............................2 ......................... 100
Tertiary education attainment (% population age 25+) ..........................13.........................1.161........................ 32.............................0 ........................... 44
Pillar 2: Health and Wellness Rank/122 Z-Score Country Value Sample Minimum Sample Maximum
Survival
Infant mortality (per 1,000 live births) ......................................................1.........................0.877.......................... 2.............................2 ........................... 98
Life expectancy ...................................................................................14.........................1.028........................ 81...........................50 ........................... 83
Survival gender gap2 ..............................................................................1.........................0.751................... 0.980......................0.920 ...................... 0.980
Health
Stunting and wasting (% in children under 5) ........................................—..............................— .........................— ..........................1.2 ........................ 36.5
Unhealthy life years (% of life expectancy) ............................................28.........................0.586........................ 11.............................8 ........................... 66
Deaths under 60 from non-communicable
diseases (% of all NCD deaths) ......................................................19.........................1.131 ..................... 12.2 ..........................7.3 ........................ 55.8
Obesity (% of adults with BMI ≥ 30) .....................................................61.......................–0.144..................... 19.9..........................1.1 ........................ 42.8
Business impact of non-communicable diseases1 ................................18.........................1.036..................... 4.95........................2.74 ........................ 5.87
Business impact of communicable diseases1 .........................................1.........................1.430..................... 6.90........................3.13 ........................ 6.90
Well-being
Stress (% of respondents)7 ..................................................................53.......................–0.018........................ 31.............................8 ........................... 69
Depression (% of respondents)7 ...........................................................47.........................0.297........................ 10.............................2 ........................... 37
Services
Water, sanitation and hygiene (% with access) .......................................1.........................0.815................... 100.0........................31.1 ...................... 100.0
Healthcare quality1................................................................................11.........................1.536..................... 5.98........................1.78 ........................ 6.75
Healthcare accessibility1 .........................................................................3.........................1.645..................... 6.67........................2.41 ........................ 6.75
Pillar 3: Workforce and Employment Rank/122 Z-Score Country Value Sample Minimum Sample Maximum
Participation
Labour force participation rate, age 15-64 (%) .....................................34.........................0.553..................... 74.6........................43.4 ........................ 90.6
Labour force participation rate, age 65+ (%) .......................................106.......................–1.019....................... 4.9..........................1.6 ........................ 91.2
Economic participation gender gap2 .....................................................12.........................1.198................... 0.785......................0.310 ...................... 0.839
Unemployment rate (%) ........................................................................66.........................0.066....................... 8.4..........................0.3 ........................ 32.0
Youth unemployment rate (%) ...............................................................62.......................–0.174..................... 20.3..........................1.6 ........................ 48.2
Talent
Country capacity to attract talent1 ........................................................54.........................0.072..................... 3.51........................1.48 ........................ 6.08
Country capacity to retain talent1............................................................2.........................2.377..................... 5.83........................1.81 ........................ 5.97
Ease of finding skilled employees1 ..........................................................1.........................2.464..................... 5.69........................2.13 ........................ 5.69
Pay related to productivity1 ...................................................................51.........................0.248..................... 4.07........................2.37 ........................ 5.25
Capacity for innovation1..........................................................................2.........................2.459..................... 5.66........................2.31 ........................ 5.84
Index of Economic Complexity3 ..............................................................6.........................1.715..................... 1.74......................–1.96 ........................ 2.37
Firm level technology absorption1 ...........................................................7.........................1.704..................... 6.03........................3.17 ........................ 6.23
Scientific and technical journal articles (per 1,000 people) ......................4.........................2.465................... 0.927......................0.000 ...................... 1.242
Median age of the working population ....................................................2.........................1.603........................ 42...........................28 ........................... 42
Training
Staff training1 ..........................................................................................2.........................2.298..................... 5.52........................2.51 ........................ 5.57
Training services1 ....................................................................................6.........................1.978..................... 5.87........................2.67 ........................ 6.47
Finland

2.1: Country Profiles
NOTESIn the sections for Pillar 1, Pillar 2, Pillar 3 and Pillar 4, values under Country Value, Sample Minimum and Sample Maximum refer to underlying data for each variable.For further details and explanations, please refer to the section “How to Read the Country Profiles”.1 Survey data responses on a 1- to 7-scale (1 = worst score, 7 = best score)2 Data on a 0- to 1-scale (0 = worst score, 1 = best score)3 Data from -1.960 (worst score) to 2.367 (best score)4 Rank number on a list of 185 countries5 Index on a scale of 0 (perfect inequality) to 100 (perfect equality)6 International test scores7 Perception survey data. Percentage of yes responses.8 Score (1 = best, 7 = worst)9 Reported in relation to UK score (100)
The Human Capital Report | 197
FinlandPillar 4: Enabling Environment Rank/122 Z-Score Country Value Sample Minimum Sample Maximum
Infrastructure
Mobile users (per 100 people) ................................................................7.........................1.733...................... 166...........................17 ......................... 191
Internet users (per 100 people) ...............................................................7.........................1.625........................ 89.............................1 ........................... 95
Quality of domestic transport1 ................................................................2.........................2.138 ..................... 6.33 ........................2.08 ........................ 6.51
Collaboration
State of cluster development1 ..............................................................10.........................1.671..................... 5.08........................2.33 ........................ 5.49
Business and university R&D collaboration1 ............................................2.........................2.270..................... 5.82........................2.11 ........................ 5.84
Legal framework
Doing Business Index4 .........................................................................10.........................1.337........................ 11.............................1 ......................... 180
Social safety net protection1 ...................................................................3.........................2.206..................... 6.18........................2.10 ........................ 6.26
Intellectual property protection and property rights1................................1.........................2.172 ..................... 6.31 ........................1.62 ........................ 6.31
Social mobility
Social mobility1 .......................................................................................1.........................2.185..................... 6.36........................2.78 ........................ 6.36
Additional indicatorsDemographics Value
Child dependency ratio (%)..................................................................... 24.9Aged dependency ratio (%) .................................................................... 25.8Fertility rate (births per woman) ................................................................. 1.8Sex ratio at birth (female/male) ............................................................... 0.96Population below age 20 (%) .................................................................. 22.8Population above age 60 (%) .................................................................. 24.8
Education
Public spending on education (% of GDP) ................................................ 6.8Technical/vocational enrolment as % of total
enrolment in secondary school ........................................................... 32Adult literacy (%) .........................................................................................—Boys not in primary school (%) .................................................................... 2Girls not in primary school (%) ..................................................................... 2Education poverty (% of children age 17-22
with less than 2-4 years schooling) ......................................................—Private enrolment in primary school (% of primary) ................................... 1.6Private enrolment in secondary school (% of secondary) .......................... 9.4PIRLS6 .................................................................................................... 568PISA math scores6 .................................................................................. 541PISA reading scores6 ............................................................................... 536PISA science scores6 .............................................................................. 554TIMSS 4th grade math6 ........................................................................... 545TIMSS 4th grade science6 ....................................................................... 570TIMSS 8th grade math6 ........................................................................... 514TIMSS 8th grade science6 ....................................................................... 552
Health
Prevalence of visual impairment (%) .......................................................... 0.9Public spending on health (% of GDP) ...................................................... 8.9Business impact of heart disease1 .......................................................... 4.85Business impact of cancer1 .................................................................... 4.78Business impact of mental illness1 .......................................................... 4.77Business impact of diabetes1 ................................................................. 4.65Business impact of chronic respiratory disease1 ..................................... 5.68Business impact of HIV/AIDS1 ................................................................ 6.81Business impact of tuberculosis1 ............................................................ 6.88Business impact of malaria1 ................................................................... 7.00
Society Value
Freedom in the World8................................................................................. 1Democracy Index (rank/165) ........................................................................ 9Population living in urban area (%) .......................................................... 83.8Gini Index (income)5................................................................................ 26.9Accessibility of digital content1 ............................................................... 6.49Extent of virtual social networks use1 ..................................................... 6.43
Workforce
Economic activity (agriculture) — % of total activity .................................. 4.2Economic activity (industry) — % of total activity .................................... 22.9Economic activity (services) — % of total activity .................................... 72.4GDP per person employed (US$) ....................................................... 52,159Cooperation in labour-employer relations1 .............................................. 5.15Emigration rate of the tertiary educated (%) .............................................. 7.2Labour force with tertiary education (%) ................................................. 38.1Number of patent applications (per 1,000 people) .............................. 0.3305Hiring and firing practices1 ...................................................................... 3.70Retirement age, male ................................................................................ 65Retirement age, female .............................................................................. 65Number of informal sector workers (1,000s) ...............................................—Total employed (1,000s) ....................................................................... 2,448Total unemployed (1,000s) ....................................................................... 224Unemployment for 12 months or more
as a % of total unemployment ......................................................... 23.8Total youth not in education or employment (1,000s) .................................—Unemployment for 12 months or more (1,000s) ..................................... 53.4Global Innovation Index (rank/142) .............................................................. 6Global Talent Index (rank/60) ....................................................................... 3Quality of Labour Force (rank/60) ................................................................ 3Talent Environment (rank/60) ....................................................................... 7IQ measure9 ......................................................................................... 100.8

2.1: Country Profiles
198 | The Human Capital Report
Rank/122 Score
Year
s (5
yea
r age
gro
ups)
Percent of total population
0–4
5–9
10–14
15–19
20–24
25–29
30–34
35–39
40–44
45–49
50–54
55–59
60–64
65–69
70–74
75–79
80–84
85–89
90–94
95–99
100+
0 1 2 3 4 55 4 3 2 1 0
FranceHuman Capital Index 2013 21 0.746
Pillar 1: Education 22 0.776
Pillar 2: Health and wellness 14 0.744
Pillar 3: Workforce and employment 25 0.520
Pillar 4: Enabling environment 24 0.943
Key Indicators
Total population (1,000s) 63,230.9
Median age of population 40
GDP per capita PPP (constant 2005, international $) 29,819
GDP growth (annual %) 0.0
Male Female Additional indicators
n Total population n Total population Aged dependency: 25.9%
n Labour force participation n Labour force participation Youth dependency: 28.3%
n Primary and secondary enrolment n Primary and secondary enrolment Male labour force participation, age 65+: 0.2%
Female labour force participation, age 65+: 0.1%
Education and workforce distribution
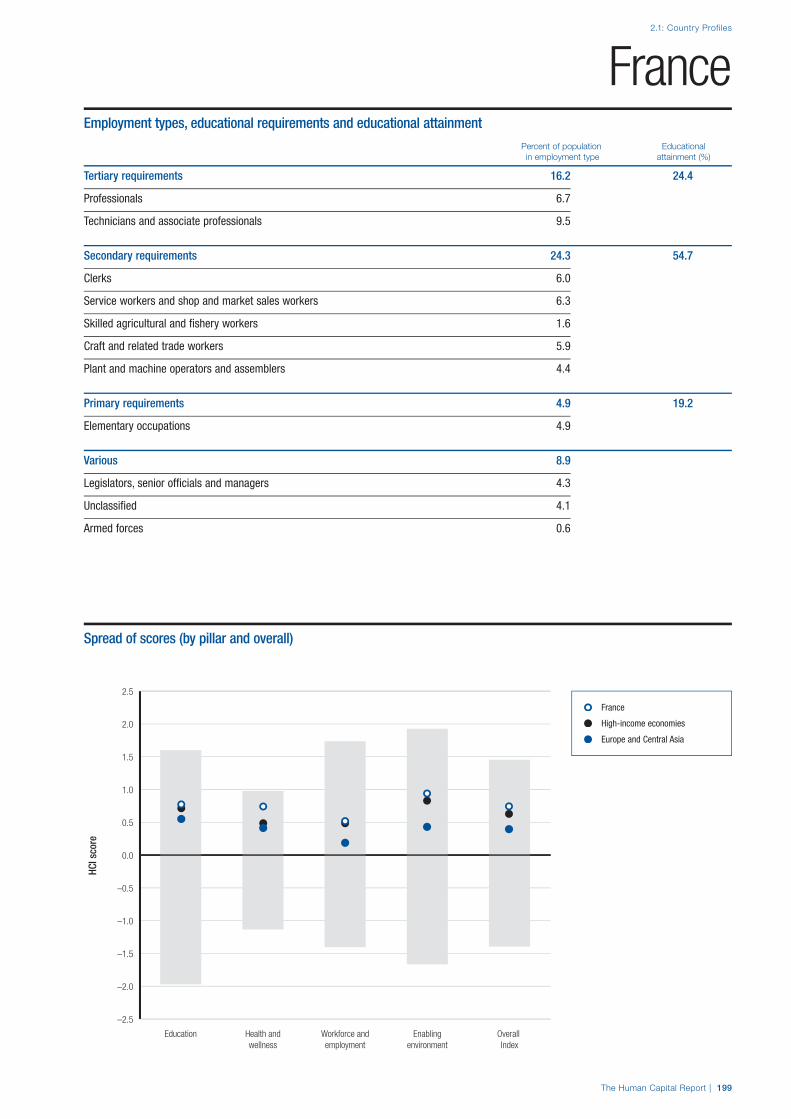
The Human Capital Report | 199
2.1: Country Profiles
HCI s
core
–2.5
–2.0
–1.5
–1.0
–0.5
0.0
0.5
1.0
1.5
2.0
2.5
Overall Index
Enablingenvironment
Workforce andemployment
Health andwellness
Education
FranceEmployment types, educational requirements and educational attainment
Percent of population Educational in employment type attainment (%)
Tertiary requirements 16.2 24.4
Professionals 6.7
Technicians and associate professionals 9.5
Secondary requirements 24.3 54.7
Clerks 6.0
Service workers and shop and market sales workers 6.3
Skilled agricultural and fishery workers 1.6
Craft and related trade workers 5.9
Plant and machine operators and assemblers 4.4
Primary requirements 4.9 19.2
Elementary occupations 4.9
Various 8.9
Legislators, senior officials and managers 4.3
Unclassified 4.1
Armed forces 0.6
Spread of scores (by pillar and overall)
France
High-income economies
Europe and Central Asia

2.1: Country Profiles
200 | The Human Capital Report
Pillar 1: Education Rank/122 Z-Score Country Value Sample Minimum Sample Maximum
Access
Primary enrolment rate (%) ...................................................................21.........................0.682........................ 99...........................58 ......................... 100
Secondary enrolment rate (%) ................................................................3.........................1.162........................ 99...........................16 ......................... 100
Tertiary enrolment ratio (%) ...................................................................35.........................0.650........................ 58.............................1 ......................... 103
Education gender gap2 ...........................................................................1.........................0.548................... 1.000......................0.645 ...................... 1.000
Quality
Internet access in schools1 ...................................................................58.........................0.071..................... 4.41........................1.64 ........................ 6.64
Quality of the education system1 ..........................................................35.........................0.460..................... 4.21........................1.99 ........................ 5.98
Quality of primary schools1 ...................................................................30.........................0.720..................... 4.72........................1.97 ........................ 6.82
Quality of math & science education1 ...................................................12.........................1.205..................... 5.19........................1.88 ........................ 6.29
Quality of management schools1 ............................................................5.........................1.799..................... 5.80........................2.29 ........................ 6.09
Attainment
Primary education attainment (% population age 25+) ..........................13.........................0.899........................ 98.............................5 ......................... 100
Secondary education attainment (% population age 25+) .....................29.........................0.609........................ 79.............................2 ......................... 100
Tertiary education attainment (% population age 25+) ..........................28.........................0.507........................ 24.............................0 ........................... 44
Pillar 2: Health and Wellness Rank/122 Z-Score Country Value Sample Minimum Sample Maximum
Survival
Infant mortality (per 1,000 live births) ......................................................8.........................0.832.......................... 3.............................2 ........................... 98
Life expectancy .....................................................................................3.........................1.150........................ 82...........................50 ........................... 83
Survival gender gap2 ..............................................................................1.........................0.751................... 0.980......................0.920 ...................... 0.980
Health
Stunting and wasting (% in children under 5) ........................................—..............................— .........................— ..........................1.2 ........................ 36.5
Unhealthy life years (% of life expectancy) ............................................23.........................0.608........................ 11.............................8 ........................... 66
Deaths under 60 from non-communicable
diseases (% of all NCD deaths) ......................................................24.........................1.045 ..................... 13.3 ..........................7.3 ........................ 55.8
Obesity (% of adults with BMI ≥ 30) .....................................................37.........................0.310..................... 15.6..........................1.1 ........................ 42.8
Business impact of non-communicable diseases1 ................................78.......................–0.338..................... 4.33........................2.74 ........................ 5.87
Business impact of communicable diseases1 .......................................33.........................0.774..................... 6.25........................3.13 ........................ 6.90
Well-being
Stress (% of respondents)7 ..................................................................85.......................–0.483........................ 37.............................8 ........................... 69
Depression (% of respondents)7 ...........................................................12.........................1.093.......................... 5.............................2 ........................... 37
Services
Water, sanitation and hygiene (% with access) .......................................1.........................0.815................... 100.0........................31.1 ...................... 100.0
Healthcare quality1..................................................................................5.........................1.753..................... 6.24........................1.78 ........................ 6.75
Healthcare accessibility1 .......................................................................17.........................1.359..................... 6.32........................2.41 ........................ 6.75
Pillar 3: Workforce and Employment Rank/122 Z-Score Country Value Sample Minimum Sample Maximum
Participation
Labour force participation rate, age 15-64 (%) .....................................56.........................0.144..................... 70.6........................43.4 ........................ 90.6
Labour force participation rate, age 65+ (%) .......................................121.......................–1.190....................... 1.6..........................1.6 ........................ 91.2
Economic participation gender gap2 .....................................................56.........................0.213................... 0.669......................0.310 ...................... 0.839
Unemployment rate (%) ........................................................................75.......................–0.126....................... 9.4..........................0.3 ........................ 32.0
Youth unemployment rate (%) ...............................................................73.......................–0.400..................... 22.5..........................1.6 ........................ 48.2
Talent
Country capacity to attract talent1 ........................................................36.........................0.423..................... 3.88........................1.48 ........................ 6.08
Country capacity to retain talent1..........................................................52.........................0.042..................... 3.57........................1.81 ........................ 5.97
Ease of finding skilled employees1 ........................................................13.........................1.321..................... 4.90........................2.13 ........................ 5.69
Pay related to productivity1 ...................................................................68.......................–0.149..................... 3.83........................2.37 ........................ 5.25
Capacity for innovation1........................................................................16.........................1.438..................... 4.85........................2.31 ........................ 5.84
Index of Economic Complexity3 ............................................................11.........................1.453..................... 1.49......................–1.96 ........................ 2.37
Firm level technology absorption1 .........................................................29.........................0.903..................... 5.46........................3.17 ........................ 6.23
Scientific and technical journal articles (per 1,000 people) ....................20.........................1.069................... 0.508......................0.000 ...................... 1.242
Median age of the working population ..................................................14.........................1.326........................ 41...........................28 ........................... 42
Training
Staff training1 ........................................................................................36.........................0.447..................... 4.33........................2.51 ........................ 5.57
Training services1 ..................................................................................13.........................1.405..................... 5.42........................2.67 ........................ 6.47
France

2.1: Country Profiles
NOTESIn the sections for Pillar 1, Pillar 2, Pillar 3 and Pillar 4, values under Country Value, Sample Minimum and Sample Maximum refer to underlying data for each variable.For further details and explanations, please refer to the section “How to Read the Country Profiles”.1 Survey data responses on a 1- to 7-scale (1 = worst score, 7 = best score)2 Data on a 0- to 1-scale (0 = worst score, 1 = best score)3 Data from -1.960 (worst score) to 2.367 (best score)4 Rank number on a list of 185 countries5 Index on a scale of 0 (perfect inequality) to 100 (perfect equality)6 International test scores7 Perception survey data. Percentage of yes responses.8 Score (1 = best, 7 = worst)9 Reported in relation to UK score (100)
The Human Capital Report | 201
FrancePillar 4: Enabling Environment Rank/122 Z-Score Country Value Sample Minimum Sample Maximum
Infrastructure
Mobile users (per 100 people) ..............................................................86.......................–0.361........................ 95...........................17 ......................... 191
Internet users (per 100 people) .............................................................16.........................1.276........................ 80.............................1 ........................... 95
Quality of domestic transport1 ..............................................................10.........................1.587 ..................... 5.85 ........................2.08 ........................ 6.51
Collaboration
State of cluster development1 ..............................................................28.........................0.723..................... 4.41........................2.33 ........................ 5.49
Business and university R&D collaboration1 ..........................................30.........................0.754 ..................... 4.46 ........................2.11 ........................ 5.84
Legal framework
Doing Business Index4 .........................................................................32.........................0.891........................ 34.............................1 ......................... 180
Social safety net protection1 .................................................................11.........................1.827..................... 5.77........................2.10 ........................ 6.26
Intellectual property protection and property rights1..............................15.........................1.551 ..................... 5.67 ........................1.62 ........................ 6.31
Social mobility
Social mobility1 .....................................................................................43.........................0.235..................... 4.60........................2.78 ........................ 6.36
Additional indicatorsDemographics Value
Child dependency ratio (%)..................................................................... 28.3Aged dependency ratio (%) .................................................................... 25.9Fertility rate (births per woman) ................................................................. 2.0Sex ratio at birth (female/male) ............................................................... 0.95Population below age 20 (%) .................................................................. 24.4Population above age 60 (%) .................................................................. 23.0
Education
Public spending on education (% of GDP) ................................................ 5.9Technical/vocational enrolment as % of total
enrolment in secondary school ........................................................... 20Adult literacy (%) .........................................................................................—Boys not in primary school (%) .................................................................... 1Girls not in primary school (%) ..................................................................... 1Education poverty (% of children age 17-22
with less than 2-4 years schooling) ......................................................—Private enrolment in primary school (% of primary) ................................. 14.8Private enrolment in secondary school (% of secondary) ........................ 26.2PIRLS6 .................................................................................................... 520PISA math scores6 .................................................................................. 497PISA reading scores6 ............................................................................... 496PISA science scores6 .............................................................................. 498TIMSS 4th grade math6 ..............................................................................—TIMSS 4th grade science6 ..........................................................................—TIMSS 8th grade math6 ..............................................................................—TIMSS 8th grade science6 ..........................................................................—
Health
Prevalence of visual impairment (%) .......................................................... 0.9Public spending on health (% of GDP) .................................................... 11.6Business impact of heart disease1 .......................................................... 3.78Business impact of cancer1 .................................................................... 3.62Business impact of mental illness1 .......................................................... 4.98Business impact of diabetes1 ................................................................. 4.63Business impact of chronic respiratory disease1 ..................................... 4.63Business impact of HIV/AIDS1 ................................................................ 5.83Business impact of tuberculosis1 ............................................................ 6.35Business impact of malaria1 ................................................................... 6.56
Society Value
Freedom in the World8................................................................................. 1Democracy Index (rank/165) ...................................................................... 28Population living in urban area (%) .......................................................... 86.3Gini Index (income)5................................................................................ 32.7Accessibility of digital content1 ............................................................... 5.62Extent of virtual social networks use1 ..................................................... 5.87
Workforce
Economic activity (agriculture) — % of total activity .................................. 2.9Economic activity (industry) — % of total activity .................................... 22.1Economic activity (services) — % of total activity .................................... 74.6GDP per person employed (US$) ....................................................... 52,861Cooperation in labour-employer relations1 .............................................. 3.44Emigration rate of the tertiary educated (%) .............................................. 3.5Labour force with tertiary education (%) ................................................. 32.4Number of patent applications (per 1,000 people) .............................. 0.2650Hiring and firing practices1 ...................................................................... 2.55Retirement age, male ...........................................................................65-67Retirement age, female .........................................................................65-67Number of informal sector workers (1,000s) ...............................................—Total employed (1,000s) ..................................................................... 25,692Total unemployed (1,000s) .................................................................... 2,653Unemployment for 12 months or more
as a % of total unemployment ......................................................... 39.3Total youth not in education or employment (1,000s) ........................... 908.8Unemployment for 12 months or more (1,000s) ................................ 1,042.8Global Innovation Index (rank/142) ............................................................ 20Global Talent Index (rank/60) ..................................................................... 19Quality of Labour Force (rank/60) .............................................................. 13Talent Environment (rank/60) ..................................................................... 11IQ measure9 ........................................................................................... 98.0
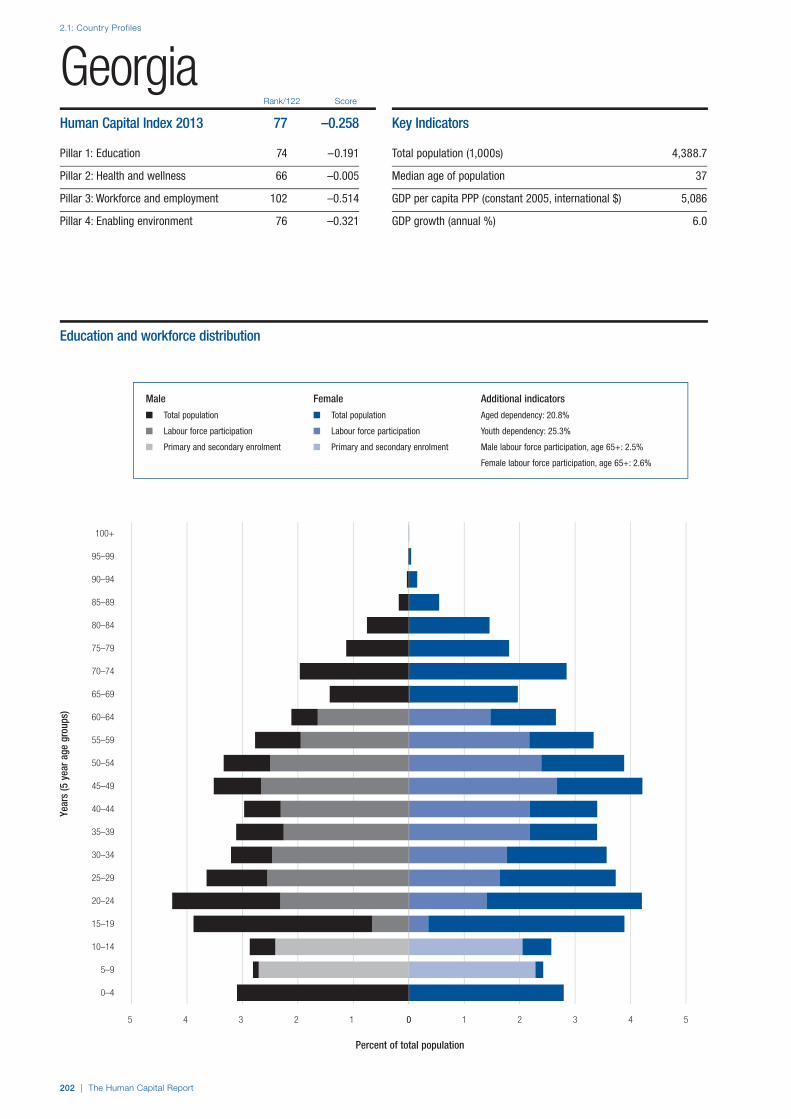
2.1: Country Profiles
202 | The Human Capital Report
Rank/122 Score
Year
s (5
yea
r age
gro
ups)
Percent of total population
0–4
5–9
10–14
15–19
20–24
25–29
30–34
35–39
40–44
45–49
50–54
55–59
60–64
65–69
70–74
75–79
80–84
85–89
90–94
95–99
100+
0 1 2 3 4 55 4 3 2 1 0
GeorgiaHuman Capital Index 2013 77 –0.258
Pillar 1: Education 74 –0.191
Pillar 2: Health and wellness 66 –0.005
Pillar 3: Workforce and employment 102 –0.514
Pillar 4: Enabling environment 76 –0.321
Key Indicators
Total population (1,000s) 4,388.7
Median age of population 37
GDP per capita PPP (constant 2005, international $) 5,086
GDP growth (annual %) 6.0
Male Female Additional indicators
n Total population n Total population Aged dependency: 20.8%
n Labour force participation n Labour force participation Youth dependency: 25.3%
n Primary and secondary enrolment n Primary and secondary enrolment Male labour force participation, age 65+: 2.5%
Female labour force participation, age 65+: 2.6%
Education and workforce distribution

The Human Capital Report | 203
2.1: Country Profiles
HCI s
core
–2.5
–2.0
–1.5
–1.0
–0.5
0.0
0.5
1.0
1.5
2.0
2.5
Overall Index
Enablingenvironment
Workforce andemployment
Health andwellness
Education
GeorgiaEmployment types, educational requirements and educational attainment
Percent of population Educational in employment type attainment (%)
Tertiary requirements n/a 25.8
Professionals n/a
Technicians and associate professionals n/a
Secondary requirements n/a 42.7
Clerks n/a
Service workers and shop and market sales workers n/a
Skilled agricultural and fishery workers n/a
Craft and related trade workers n/a
Plant and machine operators and assemblers n/a
Primary requirements n/a 7.2
Elementary occupations n/a
Various n/a
Legislators, senior officials and managers n/a
Unclassified n/a
Armed forces n/a
Spread of scores (by pillar and overall)
Georgia
Lower-middle income economies
Europe and Central Asia
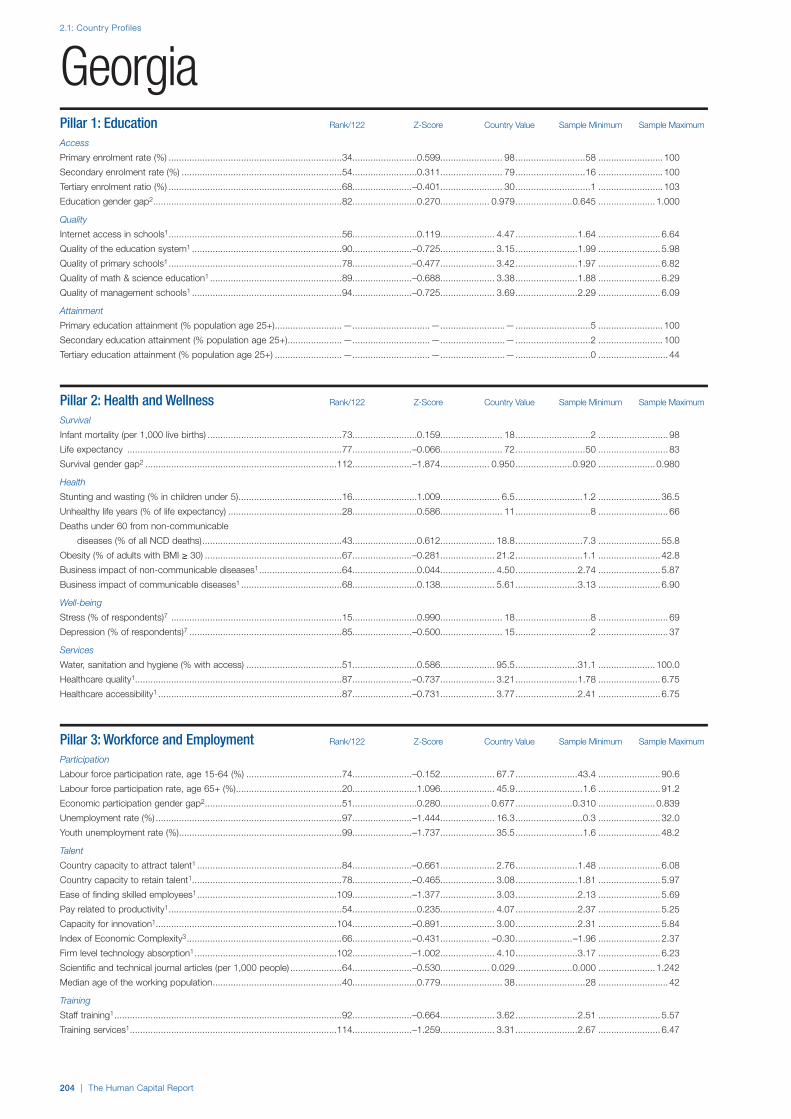
2.1: Country Profiles
204 | The Human Capital Report
Pillar 1: Education Rank/122 Z-Score Country Value Sample Minimum Sample Maximum
Access
Primary enrolment rate (%) ...................................................................34.........................0.599........................ 98...........................58 ......................... 100
Secondary enrolment rate (%) ..............................................................54.........................0.311........................ 79...........................16 ......................... 100
Tertiary enrolment ratio (%) ...................................................................68.......................–0.401........................ 30.............................1 ......................... 103
Education gender gap2 .........................................................................82.........................0.270................... 0.979......................0.645 ...................... 1.000
Quality
Internet access in schools1 ...................................................................56.........................0.119..................... 4.47........................1.64 ........................ 6.64
Quality of the education system1 ..........................................................90.......................–0.725..................... 3.15........................1.99 ........................ 5.98
Quality of primary schools1 ...................................................................78.......................–0.477..................... 3.42........................1.97 ........................ 6.82
Quality of math & science education1 ...................................................89.......................–0.688..................... 3.38........................1.88 ........................ 6.29
Quality of management schools1 ..........................................................94.......................–0.725..................... 3.69........................2.29 ........................ 6.09
Attainment
Primary education attainment (% population age 25+) ..........................—..............................— .........................— .............................5 ......................... 100
Secondary education attainment (% population age 25+) .....................—..............................— .........................— .............................2 ......................... 100
Tertiary education attainment (% population age 25+) ..........................—..............................— .........................— .............................0 ........................... 44
Pillar 2: Health and Wellness Rank/122 Z-Score Country Value Sample Minimum Sample Maximum
Survival
Infant mortality (per 1,000 live births) ....................................................73.........................0.159........................ 18.............................2 ........................... 98
Life expectancy ...................................................................................77.......................–0.066........................ 72...........................50 ........................... 83
Survival gender gap2 ..........................................................................112.......................–1.874................... 0.950......................0.920 ...................... 0.980
Health
Stunting and wasting (% in children under 5) ........................................16.........................1.009....................... 6.5..........................1.2 ........................ 36.5
Unhealthy life years (% of life expectancy) ............................................28.........................0.586........................ 11.............................8 ........................... 66
Deaths under 60 from non-communicable
diseases (% of all NCD deaths) ......................................................43.........................0.612 ..................... 18.8 ..........................7.3 ........................ 55.8
Obesity (% of adults with BMI ≥ 30) .....................................................67.......................–0.281..................... 21.2..........................1.1 ........................ 42.8
Business impact of non-communicable diseases1 ................................64.........................0.044..................... 4.50........................2.74 ........................ 5.87
Business impact of communicable diseases1 .......................................68.........................0.138..................... 5.61........................3.13 ........................ 6.90
Well-being
Stress (% of respondents)7 ..................................................................15.........................0.990........................ 18.............................8 ........................... 69
Depression (% of respondents)7 ...........................................................85.......................–0.500........................ 15.............................2 ........................... 37
Services
Water, sanitation and hygiene (% with access) .....................................51.........................0.586..................... 95.5........................31.1 ...................... 100.0
Healthcare quality1................................................................................87.......................–0.737..................... 3.21........................1.78 ........................ 6.75
Healthcare accessibility1 .......................................................................87.......................–0.731..................... 3.77........................2.41 ........................ 6.75
Pillar 3: Workforce and Employment Rank/122 Z-Score Country Value Sample Minimum Sample Maximum
Participation
Labour force participation rate, age 15-64 (%) .....................................74.......................–0.152..................... 67.7........................43.4 ........................ 90.6
Labour force participation rate, age 65+ (%) .........................................20.........................1.096..................... 45.9..........................1.6 ........................ 91.2
Economic participation gender gap2 .....................................................51.........................0.280................... 0.677......................0.310 ...................... 0.839
Unemployment rate (%) ........................................................................97.......................–1.444..................... 16.3..........................0.3 ........................ 32.0
Youth unemployment rate (%) ...............................................................99.......................–1.737..................... 35.5..........................1.6 ........................ 48.2
Talent
Country capacity to attract talent1 ........................................................84.......................–0.661..................... 2.76........................1.48 ........................ 6.08
Country capacity to retain talent1..........................................................78.......................–0.465..................... 3.08........................1.81 ........................ 5.97
Ease of finding skilled employees1 ......................................................109.......................–1.377..................... 3.03........................2.13 ........................ 5.69
Pay related to productivity1 ...................................................................54.........................0.235..................... 4.07........................2.37 ........................ 5.25
Capacity for innovation1......................................................................104.......................–0.891..................... 3.00........................2.31 ........................ 5.84
Index of Economic Complexity3 ............................................................66.......................–0.431................... –0.30......................–1.96 ........................ 2.37
Firm level technology absorption1 .......................................................102.......................–1.002..................... 4.10........................3.17 ........................ 6.23
Scientific and technical journal articles (per 1,000 people) ....................64.......................–0.530................... 0.029......................0.000 ...................... 1.242
Median age of the working population ..................................................40.........................0.779........................ 38...........................28 ........................... 42
Training
Staff training1 ........................................................................................92.......................–0.664..................... 3.62........................2.51 ........................ 5.57
Training services1 ................................................................................114.......................–1.259..................... 3.31........................2.67 ........................ 6.47
Georgia

2.1: Country Profiles
NOTESIn the sections for Pillar 1, Pillar 2, Pillar 3 and Pillar 4, values under Country Value, Sample Minimum and Sample Maximum refer to underlying data for each variable.For further details and explanations, please refer to the section “How to Read the Country Profiles”.1 Survey data responses on a 1- to 7-scale (1 = worst score, 7 = best score)2 Data on a 0- to 1-scale (0 = worst score, 1 = best score)3 Data from -1.960 (worst score) to 2.367 (best score)4 Rank number on a list of 185 countries5 Index on a scale of 0 (perfect inequality) to 100 (perfect equality)6 International test scores7 Perception survey data. Percentage of yes responses.8 Score (1 = best, 7 = worst)9 Reported in relation to UK score (100)
The Human Capital Report | 205
GeorgiaPillar 4: Enabling Environment Rank/122 Z-Score Country Value Sample Minimum Sample Maximum
Infrastructure
Mobile users (per 100 people) ..............................................................74.......................–0.140...................... 102...........................17 ......................... 191
Internet users (per 100 people) .............................................................69.......................–0.260........................ 37.............................1 ........................... 95
Quality of domestic transport1 ..............................................................47.........................0.195 ..................... 4.64 ........................2.08 ........................ 6.51
Collaboration
State of cluster development1 ............................................................101.......................–0.932..................... 3.23........................2.33 ........................ 5.49
Business and university R&D collaboration1 ........................................114.......................–1.245 ..................... 2.67 ........................2.11 ........................ 5.84
Legal framework
Doing Business Index4 ...........................................................................8.........................1.376.......................... 9.............................1 ......................... 180
Social safety net protection1 ...............................................................111.......................–1.138..................... 2.55........................2.10 ........................ 6.26
Intellectual property protection and property rights1............................105.......................–1.008 ..................... 3.06 ........................1.62 ........................ 6.31
Social mobility
Social mobility1 .....................................................................................41.........................0.263..................... 4.63........................2.78 ........................ 6.36
Additional indicatorsDemographics Value
Child dependency ratio (%)..................................................................... 25.3Aged dependency ratio (%) .................................................................... 20.8Fertility rate (births per woman) ................................................................. 1.8Sex ratio at birth (female/male) ............................................................... 0.91Population below age 20 (%) .................................................................. 25.0Population above age 60 (%) .................................................................. 19.0
Education
Public spending on education (% of GDP) ................................................ 2.7Technical/vocational enrolment as % of total
enrolment in secondary school ............................................................. 1Adult literacy (%) ..................................................................................... 99.7Boys not in primary school (%) .................................................................... 4Girls not in primary school (%) ..................................................................... 6Education poverty (% of children age 17-22
with less than 2-4 years schooling) ................................................ 0.014Private enrolment in primary school (% of primary) ................................... 9.5Private enrolment in secondary school (% of secondary) .......................... 6.4PIRLS6 .................................................................................................... 488PISA math scores6 .....................................................................................—PISA reading scores6 ..................................................................................—PISA science scores6 .................................................................................—TIMSS 4th grade math6 ........................................................................... 450TIMSS 4th grade science6 ....................................................................... 455TIMSS 8th grade math6 ........................................................................... 431TIMSS 8th grade science6 ....................................................................... 420
Health
Prevalence of visual impairment (%) .......................................................... 2.2Public spending on health (% of GDP) ...................................................... 9.9Business impact of heart disease1 .......................................................... 4.20Business impact of cancer1 .................................................................... 4.15Business impact of mental illness1 .......................................................... 4.94Business impact of diabetes1 ................................................................. 4.57Business impact of chronic respiratory disease1 ..................................... 4.64Business impact of HIV/AIDS1 ................................................................ 5.53Business impact of tuberculosis1 ............................................................ 5.37Business impact of malaria1 ................................................................... 5.95
Society Value
Freedom in the World8................................................................................. 3Democracy Index (rank/165) ...................................................................... 93Population living in urban area (%) .......................................................... 53.0Gini Index (income)5................................................................................ 42.1Accessibility of digital content1 ............................................................... 5.11Extent of virtual social networks use1 ..................................................... 5.78
Workforce
Economic activity (agriculture) — % of total activity ................................ 53.4Economic activity (industry) — % of total activity .................................... 10.4Economic activity (services) — % of total activity .................................... 36.2GDP per person employed (US$) ....................................................... 18,039Cooperation in labour-employer relations1 .............................................. 4.18Emigration rate of the tertiary educated (%) .............................................. 2.8Labour force with tertiary education (%) ................................................. 29.9Number of patent applications (per 1,000 people) .............................. 0.0907Hiring and firing practices1 ...................................................................... 4.79Retirement age, male .................................................................................—Retirement age, female ...............................................................................—Number of informal sector workers (1,000s) ...............................................—Total employed (1,000s) ....................................................................... 1,628Total unemployed (1,000s) ....................................................................... 317Unemployment for 12 months or more
as a % of total unemployment .............................................................—Total youth not in education or employment (1,000s) .................................—Unemployment for 12 months or more (1,000s) .........................................—Global Innovation Index (rank/142) ............................................................ 73Global Talent Index (rank/60) ......................................................................—Quality of Labour Force (rank/60) ...............................................................—Talent Environment (rank/60) ......................................................................—IQ measure9 ........................................................................................... 86.5

2.1: Country Profiles
206 | The Human Capital Report
Rank/122 Score
Year
s (5
yea
r age
gro
ups)
Percent of total population
0–4
5–9
10–14
15–19
20–24
25–29
30–34
35–39
40–44
45–49
50–54
55–59
60–64
65–69
70–74
75–79
80–84
85–89
90–94
95–99
100+
0 1 2 3 4 55 4 3 2 1 0
GermanyHuman Capital Index 2013 6 1.109
Pillar 1: Education 19 0.888
Pillar 2: Health and wellness 8 0.877
Pillar 3: Workforce and employment 9 1.149
Pillar 4: Enabling environment 3 1.522
Key Indicators
Total population (1,000s) 83,017.4
Median age of population 44
GDP per capita PPP (constant 2005, international $) 34,766
GDP growth (annual %) 0.7
Male Female Additional indicators
n Total population n Total population Aged dependency: 31.6%
n Labour force participation n Labour force participation Youth dependency: 20.4%
n Primary and secondary enrolment n Primary and secondary enrolment Male labour force participation, age 65+: n/a
Female labour force participation, age 65+: n/a
Education and workforce distribution

The Human Capital Report | 207
2.1: Country Profiles
HCI s
core
–2.5
–2.0
–1.5
–1.0
–0.5
0.0
0.5
1.0
1.5
2.0
2.5
Overall Index
Enablingenvironment
Workforce andemployment
Health andwellness
Education
GermanyEmployment types, educational requirements and educational attainment
Percent of population Educational in employment type attainment (%)
Tertiary requirements 18.7 24.2
Professionals 7.8
Technicians and associate professionals 11.0
Secondary requirements 25.7 66.2
Clerks 6.3
Service workers and shop and market sales workers 6.6
Skilled agricultural and fishery workers 1.0
Craft and related trade workers 8.0
Plant and machine operators and assemblers 3.8
Primary requirements 4.6 3.5
Elementary occupations 4.6
Various 9.2
Legislators, senior officials and managers 3.8
Unclassified 5.0
Armed forces 0.3
Spread of scores (by pillar and overall)
Germany
High-income economies
Europe and Central Asia

2.1: Country Profiles
208 | The Human Capital Report
Pillar 1: Education Rank/122 Z-Score Country Value Sample Minimum Sample Maximum
Access
Primary enrolment rate (%) .....................................................................6.........................0.755...................... 100...........................58 ......................... 100
Secondary enrolment rate (%) ..............................................................—..............................— .........................— ...........................16 ......................... 100
Tertiary enrolment ratio (%) ...................................................................—..............................— .........................— .............................1 ......................... 103
Education gender gap2 .........................................................................76.........................0.347................... 0.985......................0.645 ...................... 1.000
Quality
Internet access in schools1 ...................................................................38.........................0.566..................... 5.03........................1.64 ........................ 6.64
Quality of the education system1 ..........................................................14.........................1.501..................... 5.14........................1.99 ........................ 5.98
Quality of primary schools1 ...................................................................21.........................0.987..................... 5.01........................1.97 ........................ 6.82
Quality of math & science education1 ...................................................18.........................1.058..................... 5.05........................1.88 ........................ 6.29
Quality of management schools1 ..........................................................26.........................0.962..................... 5.10........................2.29 ........................ 6.09
Attainment
Primary education attainment (% population age 25+) ............................4.........................0.958...................... 100.............................5 ......................... 100
Secondary education attainment (% population age 25+) .......................7.........................1.256........................ 96.............................2 ......................... 100
Tertiary education attainment (% population age 25+) ..........................29.........................0.489........................ 24.............................0 ........................... 44
Pillar 2: Health and Wellness Rank/122 Z-Score Country Value Sample Minimum Sample Maximum
Survival
Infant mortality (per 1,000 live births) ......................................................8.........................0.832.......................... 3.............................2 ........................... 98
Life expectancy ...................................................................................14.........................1.028........................ 81...........................50 ........................... 83
Survival gender gap2 ............................................................................44.........................0.615................... 0.978......................0.920 ...................... 0.980
Health
Stunting and wasting (% in children under 5) ..........................................1.........................1.612....................... 1.2..........................1.2 ........................ 36.5
Unhealthy life years (% of life expectancy) ............................................10.........................0.791........................ 10.............................8 ........................... 66
Deaths under 60 from non-communicable
diseases (% of all NCD deaths) ........................................................9.........................1.265 ..................... 10.5 ..........................7.3 ........................ 55.8
Obesity (% of adults with BMI ≥ 30) .....................................................68.......................–0.292..................... 21.3..........................1.1 ........................ 42.8
Business impact of non-communicable diseases1 ................................60.........................0.082..................... 4.52........................2.74 ........................ 5.87
Business impact of communicable diseases1 .......................................15.........................1.052..................... 6.52........................3.13 ........................ 6.90
Well-being
Stress (% of respondents)7 ..................................................................38.........................0.292........................ 27.............................8 ........................... 69
Depression (% of respondents)7 ...........................................................12.........................1.093.......................... 5.............................2 ........................... 37
Services
Water, sanitation and hygiene (% with access) .......................................1.........................0.815................... 100.0........................31.1 ...................... 100.0
Healthcare quality1..................................................................................7.........................1.709..................... 6.19........................1.78 ........................ 6.75
Healthcare accessibility1 .......................................................................16.........................1.388..................... 6.36........................2.41 ........................ 6.75
Pillar 3: Workforce and Employment Rank/122 Z-Score Country Value Sample Minimum Sample Maximum
Participation
Labour force participation rate, age 15-64 (%) .....................................28.........................0.778..................... 76.8........................43.4 ........................ 90.6
Labour force participation rate, age 65+ (%) .......................................111.......................–1.066....................... 4.0..........................1.6 ........................ 91.2
Economic participation gender gap2 .....................................................27.........................0.817................... 0.740......................0.310 ...................... 0.839
Unemployment rate (%) ........................................................................42.........................0.325....................... 7.0..........................0.3 ........................ 32.0
Youth unemployment rate (%) ...............................................................20.........................0.916....................... 9.7..........................1.6 ........................ 48.2
Talent
Country capacity to attract talent1 ........................................................16.........................1.213..................... 4.69........................1.48 ........................ 6.08
Country capacity to retain talent1............................................................8.........................1.606..................... 5.09........................1.81 ........................ 5.97
Ease of finding skilled employees1 ........................................................34.........................0.676..................... 4.45........................2.13 ........................ 5.69
Pay related to productivity1 ...................................................................36.........................0.553..................... 4.26........................2.37 ........................ 5.25
Capacity for innovation1..........................................................................3.........................2.407..................... 5.62........................2.31 ........................ 5.84
Index of Economic Complexity3 ..............................................................2.........................1.998..................... 2.01......................–1.96 ........................ 2.37
Firm level technology absorption1 .........................................................15.........................1.344..................... 5.77........................3.17 ........................ 6.23
Scientific and technical journal articles (per 1,000 people) ....................19.........................1.195................... 0.546......................0.000 ...................... 1.242
Median age of the working population ....................................................1.........................1.667........................ 42...........................28 ........................... 42
Training
Staff training1 ........................................................................................10.........................1.674..................... 5.12........................2.51 ........................ 5.57
Training services1 ....................................................................................2.........................2.276..................... 6.10........................2.67 ........................ 6.47
Germany

2.1: Country Profiles
NOTESIn the sections for Pillar 1, Pillar 2, Pillar 3 and Pillar 4, values under Country Value, Sample Minimum and Sample Maximum refer to underlying data for each variable.For further details and explanations, please refer to the section “How to Read the Country Profiles”.1 Survey data responses on a 1- to 7-scale (1 = worst score, 7 = best score)2 Data on a 0- to 1-scale (0 = worst score, 1 = best score)3 Data from -1.960 (worst score) to 2.367 (best score)4 Rank number on a list of 185 countries5 Index on a scale of 0 (perfect inequality) to 100 (perfect equality)6 International test scores7 Perception survey data. Percentage of yes responses.8 Score (1 = best, 7 = worst)9 Reported in relation to UK score (100)
The Human Capital Report | 209
GermanyPillar 4: Enabling Environment Rank/122 Z-Score Country Value Sample Minimum Sample Maximum
Infrastructure
Mobile users (per 100 people) ..............................................................24.........................0.742...................... 132...........................17 ......................... 191
Internet users (per 100 people) .............................................................12.........................1.398........................ 83.............................1 ........................... 95
Quality of domestic transport1 ................................................................7.........................1.768..................... 6.01........................2.08 ........................ 6.51
Collaboration
State of cluster development1 ................................................................3.........................2.088..................... 5.38........................2.33 ........................ 5.49
Business and university R&D collaboration1 ............................................9.........................1.795 ..................... 5.39 ........................2.11 ........................ 5.84
Legal framework
Doing Business Index4 .........................................................................18.........................1.163........................ 20.............................1 ......................... 180
Social safety net protection1 .................................................................10.........................1.866..................... 5.81........................2.10 ........................ 6.26
Intellectual property protection and property rights1..............................12.........................1.573 ..................... 5.70 ........................1.62 ........................ 6.31
Social mobility
Social mobility1 .....................................................................................20.........................1.303..................... 5.56........................2.78 ........................ 6.36
Additional indicatorsDemographics Value
Child dependency ratio (%)..................................................................... 20.4Aged dependency ratio (%) .................................................................... 31.6Fertility rate (births per woman) ................................................................. 1.4Sex ratio at birth (female/male) ............................................................... 0.94Population below age 20 (%) .................................................................. 18.6Population above age 60 (%) .................................................................. 26.1
Education
Public spending on education (% of GDP) ................................................ 5.1Technical/vocational enrolment as % of total
enrolment in secondary school ........................................................... 20Adult literacy (%) .........................................................................................—Boys not in primary school (%) ...................................................................—Girls not in primary school (%) ....................................................................—Education poverty (% of children age 17-22
with less than 2-4 years schooling) ......................................................—Private enrolment in primary school (% of primary) ................................... 4.1Private enrolment in secondary school (% of secondary) .......................... 8.5PIRLS6 .................................................................................................... 541PISA math scores6 .................................................................................. 513PISA reading scores6 ............................................................................... 497PISA science scores6 .............................................................................. 520TIMSS 4th grade math6 ........................................................................... 528TIMSS 4th grade science6 ....................................................................... 528TIMSS 8th grade math6 ..............................................................................—TIMSS 8th grade science6 ..........................................................................—
Health
Prevalence of visual impairment (%) .......................................................... 0.9Public spending on health (% of GDP) .................................................... 11.1Business impact of heart disease1 .......................................................... 4.29Business impact of cancer1 .................................................................... 4.37Business impact of mental illness1 .......................................................... 4.07Business impact of diabetes1 ................................................................. 4.75Business impact of chronic respiratory disease1 ..................................... 5.10Business impact of HIV/AIDS1 ................................................................ 6.23Business impact of tuberculosis1 ............................................................ 6.58Business impact of malaria1 ................................................................... 6.76
Society Value
Freedom in the World8................................................................................. 1Democracy Index (rank/165) ...................................................................... 14Population living in urban area (%) .......................................................... 74.1Gini Index (income)5................................................................................ 28.3Accessibility of digital content1 ............................................................... 6.08Extent of virtual social networks use1 ..................................................... 5.87
Workforce
Economic activity (agriculture) — % of total activity .................................. 1.6Economic activity (industry) — % of total activity .................................... 28.3Economic activity (services) — % of total activity .................................... 70.1GDP per person employed (US$) ....................................................... 43,276Cooperation in labour-employer relations1 .............................................. 5.20Emigration rate of the tertiary educated (%) .............................................. 5.8Labour force with tertiary education (%) ................................................. 27.5Number of patent applications (per 1,000 people) .............................. 0.7160Hiring and firing practices1 ...................................................................... 3.30Retirement age, male ................................................................................ 65Retirement age, female .............................................................................. 65Number of informal sector workers (1,000s) ...............................................—Total employed (1,000s) ..................................................................... 38,939Total unemployed (1,000s) .................................................................... 2,948Unemployment for 12 months or more
as a % of total unemployment ......................................................... 51.9Total youth not in education or employment (1,000s) ........................... 416.9Unemployment for 12 months or more (1,000s) ................................ 1,529.6Global Innovation Index (rank/142) ............................................................ 15Global Talent Index (rank/60) ..................................................................... 13Quality of Labour Force (rank/60) ................................................................ 9Talent Environment (rank/60) ..................................................................... 12IQ measure9 ........................................................................................... 98.6
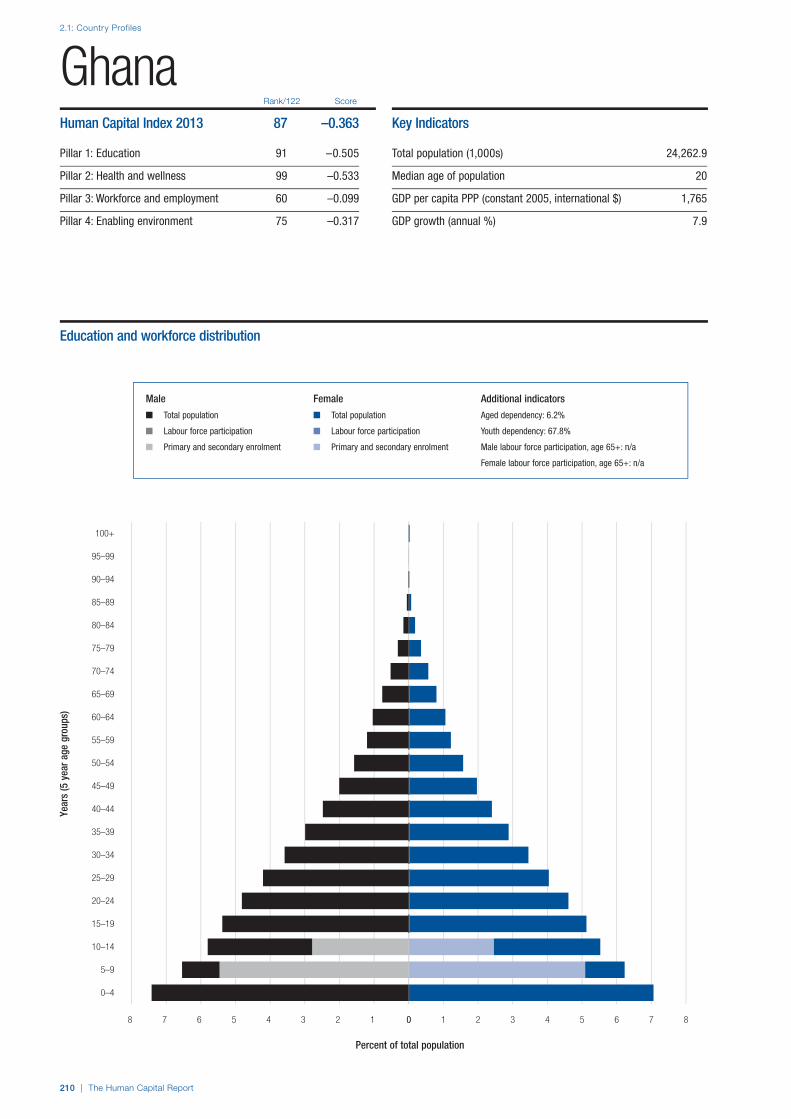
2.1: Country Profiles
210 | The Human Capital Report
Rank/122 Score
Year
s (5
yea
r age
gro
ups)
Percent of total population
0–4
5–9
10–14
15–19
20–24
25–29
30–34
35–39
40–44
45–49
50–54
55–59
60–64
65–69
70–74
75–79
80–84
85–89
90–94
95–99
100+
0 1 2 3 4 5 6 7 88 7 6 5 4 3 2 1 0
GhanaHuman Capital Index 2013 87 –0.363
Pillar 1: Education 91 –0.505
Pillar 2: Health and wellness 99 –0.533
Pillar 3: Workforce and employment 60 –0.099
Pillar 4: Enabling environment 75 –0.317
Key Indicators
Total population (1,000s) 24,262.9
Median age of population 20
GDP per capita PPP (constant 2005, international $) 1,765
GDP growth (annual %) 7.9
Male Female Additional indicators
n Total population n Total population Aged dependency: 6.2%
n Labour force participation n Labour force participation Youth dependency: 67.8%
n Primary and secondary enrolment n Primary and secondary enrolment Male labour force participation, age 65+: n/a
Female labour force participation, age 65+: n/a
Education and workforce distribution
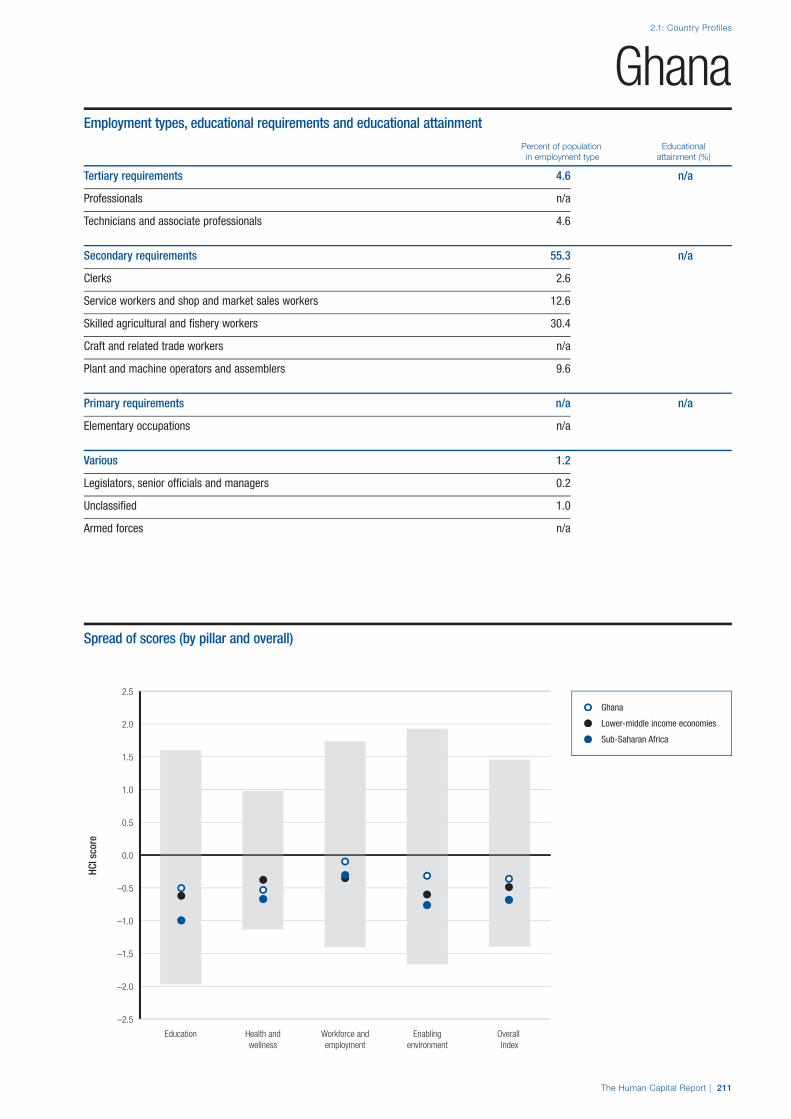
The Human Capital Report | 211
2.1: Country Profiles
HCI s
core
–2.5
–2.0
–1.5
–1.0
–0.5
0.0
0.5
1.0
1.5
2.0
2.5
Overall Index
Enablingenvironment
Workforce andemployment
Health andwellness
Education
GhanaEmployment types, educational requirements and educational attainment
Percent of population Educational in employment type attainment (%)
Tertiary requirements 4.6 n/a
Professionals n/a
Technicians and associate professionals 4.6
Secondary requirements 55.3 n/a
Clerks 2.6
Service workers and shop and market sales workers 12.6
Skilled agricultural and fishery workers 30.4
Craft and related trade workers n/a
Plant and machine operators and assemblers 9.6
Primary requirements n/a n/a
Elementary occupations n/a
Various 1.2
Legislators, senior officials and managers 0.2
Unclassified 1.0
Armed forces n/a
Spread of scores (by pillar and overall)
Ghana
Lower-middle income economies
Sub-Saharan Africa
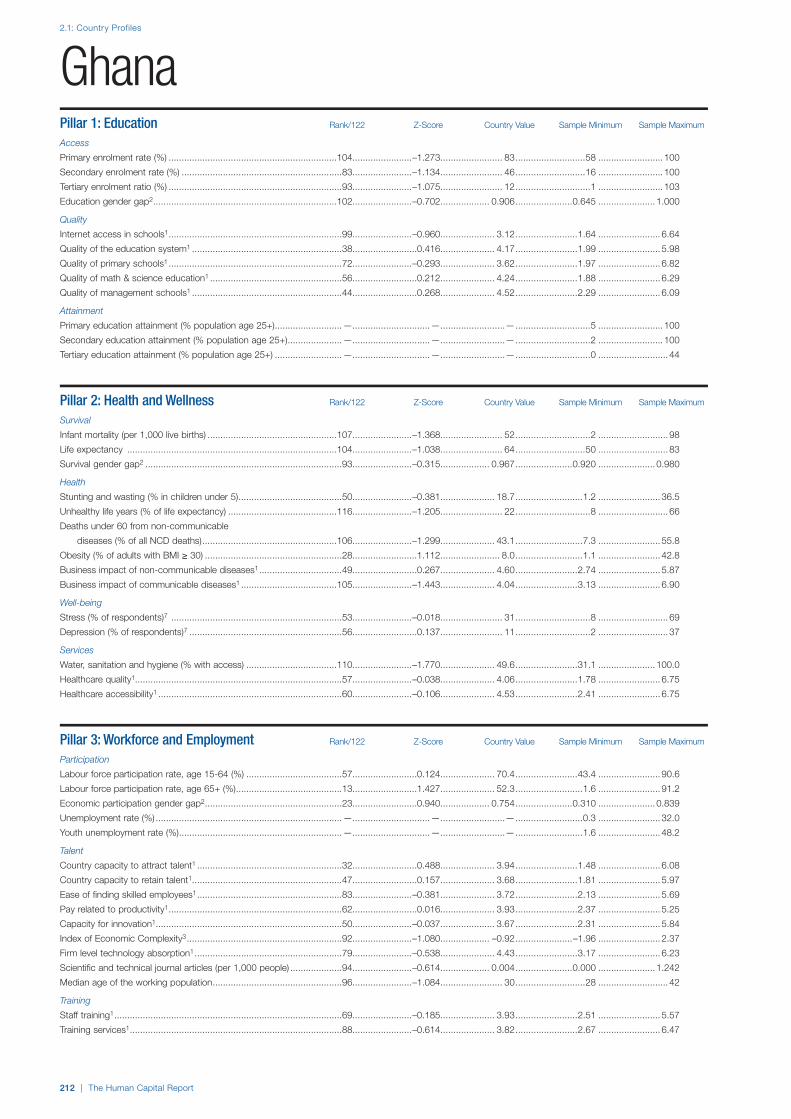
2.1: Country Profiles
212 | The Human Capital Report
Pillar 1: Education Rank/122 Z-Score Country Value Sample Minimum Sample Maximum
Access
Primary enrolment rate (%) .................................................................104.......................–1.273........................ 83...........................58 ......................... 100
Secondary enrolment rate (%) ..............................................................83.......................–1.134........................ 46...........................16 ......................... 100
Tertiary enrolment ratio (%) ...................................................................93.......................–1.075........................ 12.............................1 ......................... 103
Education gender gap2 .......................................................................102.......................–0.702................... 0.906......................0.645 ...................... 1.000
Quality
Internet access in schools1 ...................................................................99.......................–0.960..................... 3.12........................1.64 ........................ 6.64
Quality of the education system1 ..........................................................38.........................0.416..................... 4.17........................1.99 ........................ 5.98
Quality of primary schools1 ...................................................................72.......................–0.293..................... 3.62........................1.97 ........................ 6.82
Quality of math & science education1 ...................................................56.........................0.212..................... 4.24........................1.88 ........................ 6.29
Quality of management schools1 ..........................................................44.........................0.268..................... 4.52........................2.29 ........................ 6.09
Attainment
Primary education attainment (% population age 25+) ..........................—..............................— .........................— .............................5 ......................... 100
Secondary education attainment (% population age 25+) .....................—..............................— .........................— .............................2 ......................... 100
Tertiary education attainment (% population age 25+) ..........................—..............................— .........................— .............................0 ........................... 44
Pillar 2: Health and Wellness Rank/122 Z-Score Country Value Sample Minimum Sample Maximum
Survival
Infant mortality (per 1,000 live births) ..................................................107.......................–1.368........................ 52.............................2 ........................... 98
Life expectancy .................................................................................104.......................–1.038........................ 64...........................50 ........................... 83
Survival gender gap2 ............................................................................93.......................–0.315................... 0.967......................0.920 ...................... 0.980
Health
Stunting and wasting (% in children under 5) ........................................50.......................–0.381..................... 18.7..........................1.2 ........................ 36.5
Unhealthy life years (% of life expectancy) ..........................................116.......................–1.205........................ 22.............................8 ........................... 66
Deaths under 60 from non-communicable
diseases (% of all NCD deaths) ....................................................106.......................–1.299 ..................... 43.1 ..........................7.3 ........................ 55.8
Obesity (% of adults with BMI ≥ 30) .....................................................28.........................1.112....................... 8.0..........................1.1 ........................ 42.8
Business impact of non-communicable diseases1 ................................49.........................0.267..................... 4.60........................2.74 ........................ 5.87
Business impact of communicable diseases1 .....................................105.......................–1.443..................... 4.04........................3.13 ........................ 6.90
Well-being
Stress (% of respondents)7 ..................................................................53.......................–0.018........................ 31.............................8 ........................... 69
Depression (% of respondents)7 ...........................................................56.........................0.137........................ 11.............................2 ........................... 37
Services
Water, sanitation and hygiene (% with access) ...................................110.......................–1.770..................... 49.6........................31.1 ...................... 100.0
Healthcare quality1................................................................................57.......................–0.038..................... 4.06........................1.78 ........................ 6.75
Healthcare accessibility1 .......................................................................60.......................–0.106..................... 4.53........................2.41 ........................ 6.75
Pillar 3: Workforce and Employment Rank/122 Z-Score Country Value Sample Minimum Sample Maximum
Participation
Labour force participation rate, age 15-64 (%) .....................................57.........................0.124..................... 70.4........................43.4 ........................ 90.6
Labour force participation rate, age 65+ (%) .........................................13.........................1.427..................... 52.3..........................1.6 ........................ 91.2
Economic participation gender gap2 .....................................................23.........................0.940................... 0.754......................0.310 ...................... 0.839
Unemployment rate (%) ........................................................................—..............................— .........................— ..........................0.3 ........................ 32.0
Youth unemployment rate (%) ...............................................................—..............................— .........................— ..........................1.6 ........................ 48.2
Talent
Country capacity to attract talent1 ........................................................32.........................0.488..................... 3.94........................1.48 ........................ 6.08
Country capacity to retain talent1..........................................................47.........................0.157..................... 3.68........................1.81 ........................ 5.97
Ease of finding skilled employees1 ........................................................83.......................–0.381..................... 3.72........................2.13 ........................ 5.69
Pay related to productivity1 ...................................................................62.........................0.016..................... 3.93........................2.37 ........................ 5.25
Capacity for innovation1........................................................................50.......................–0.037..................... 3.67........................2.31 ........................ 5.84
Index of Economic Complexity3 ............................................................92.......................–1.080................... –0.92......................–1.96 ........................ 2.37
Firm level technology absorption1 .........................................................79.......................–0.538..................... 4.43........................3.17 ........................ 6.23
Scientific and technical journal articles (per 1,000 people) ....................94.......................–0.614................... 0.004......................0.000 ...................... 1.242
Median age of the working population ..................................................96.......................–1.084........................ 30...........................28 ........................... 42
Training
Staff training1 ........................................................................................69.......................–0.185..................... 3.93........................2.51 ........................ 5.57
Training services1 ..................................................................................88.......................–0.614..................... 3.82........................2.67 ........................ 6.47
Ghana

2.1: Country Profiles
NOTESIn the sections for Pillar 1, Pillar 2, Pillar 3 and Pillar 4, values under Country Value, Sample Minimum and Sample Maximum refer to underlying data for each variable.For further details and explanations, please refer to the section “How to Read the Country Profiles”.1 Survey data responses on a 1- to 7-scale (1 = worst score, 7 = best score)2 Data on a 0- to 1-scale (0 = worst score, 1 = best score)3 Data from -1.960 (worst score) to 2.367 (best score)4 Rank number on a list of 185 countries5 Index on a scale of 0 (perfect inequality) to 100 (perfect equality)6 International test scores7 Perception survey data. Percentage of yes responses.8 Score (1 = best, 7 = worst)9 Reported in relation to UK score (100)
The Human Capital Report | 213
GhanaPillar 4: Enabling Environment Rank/122 Z-Score Country Value Sample Minimum Sample Maximum
Infrastructure
Mobile users (per 100 people) ..............................................................96.......................–0.656........................ 85...........................17 ......................... 191
Internet users (per 100 people) .............................................................98.......................–1.062........................ 14.............................1 ........................... 95
Quality of domestic transport1 ..............................................................53.........................0.119 ..................... 4.57 ........................2.08 ........................ 6.51
Collaboration
State of cluster development1 ..............................................................72.......................–0.345..................... 3.65........................2.33 ........................ 5.49
Business and university R&D collaboration1 ..........................................68.......................–0.391 ..................... 3.43 ........................2.11 ........................ 5.84
Legal framework
Doing Business Index4 .........................................................................52.........................0.310........................ 64.............................1 ......................... 180
Social safety net protection1 .................................................................67.......................–0.244..................... 3.52........................2.10 ........................ 6.26
Intellectual property protection and property rights1..............................54.......................–0.027 ..................... 4.06 ........................1.62 ........................ 6.31
Social mobility
Social mobility1 .....................................................................................80.......................–0.560..................... 3.88........................2.78 ........................ 6.36
Additional indicatorsDemographics Value
Child dependency ratio (%)..................................................................... 67.8Aged dependency ratio (%) ...................................................................... 6.2Fertility rate (births per woman) ................................................................. 4.2Sex ratio at birth (female/male) ............................................................... 0.97Population below age 20 (%) .................................................................. 49.7Population above age 60 (%) .................................................................... 5.4
Education
Public spending on education (% of GDP) ................................................ 8.2Technical/vocational enrolment as % of total
enrolment in secondary school ............................................................. 4Adult literacy (%) ..................................................................................... 71.5Boys not in primary school (%) .................................................................. 17Girls not in primary school (%) ................................................................... 18Education poverty (% of children age 17-22
with less than 2-4 years schooling) ................................................ 0.369Private enrolment in primary school (% of primary) ................................. 22.1Private enrolment in secondary school (% of secondary) ........................ 16.0PIRLS6 .......................................................................................................—PISA math scores6 .....................................................................................—PISA reading scores6 ..................................................................................—PISA science scores6 .................................................................................—TIMSS 4th grade math6 ..............................................................................—TIMSS 4th grade science6 ..........................................................................—TIMSS 8th grade math6 ........................................................................... 331TIMSS 8th grade science6 ....................................................................... 306
Health
Prevalence of visual impairment (%) .......................................................... 4.2Public spending on health (% of GDP) ...................................................... 4.8Business impact of heart disease1 .......................................................... 4.44Business impact of cancer1 .................................................................... 4.65Business impact of mental illness1 .......................................................... 5.24Business impact of diabetes1 ................................................................. 4.31Business impact of chronic respiratory disease1 ..................................... 4.36Business impact of HIV/AIDS1 ................................................................ 4.41Business impact of tuberculosis1 ............................................................ 4.46Business impact of malaria1 ................................................................... 3.26
Society Value
Freedom in the World8................................................................................. 1Democracy Index (rank/165) ...................................................................... 78Population living in urban area (%) .......................................................... 52.5Gini Index (income)5................................................................................ 42.8Accessibility of digital content1 ............................................................... 4.17Extent of virtual social networks use1 ..................................................... 5.24
Workforce
Economic activity (agriculture) — % of total activity ....................................—Economic activity (industry) — % of total activity ........................................—Economic activity (services) — % of total activity ........................................—GDP per person employed (US$) ......................................................... 4,448Cooperation in labour-employer relations1 .............................................. 4.31Emigration rate of the tertiary educated (%) ............................................ 44.7Labour force with tertiary education (%) ................................................. 31.0Number of patent applications (per 1,000 people) ......................................—Hiring and firing practices1 ...................................................................... 4.54Retirement age, male .................................................................................—Retirement age, female ...............................................................................—Number of informal sector workers (1,000s) ...............................................—Total employed (1,000s) .............................................................................—Total unemployed (1,000s) ..........................................................................—Unemployment for 12 months or more
as a % of total unemployment .............................................................—Total youth not in education or employment (1,000s) .................................—Unemployment for 12 months or more (1,000s) .........................................—Global Innovation Index (rank/142) ............................................................ 94Global Talent Index (rank/60) ......................................................................—Quality of Labour Force (rank/60) ...............................................................—Talent Environment (rank/60) ......................................................................—IQ measure9 ........................................................................................... 70.5
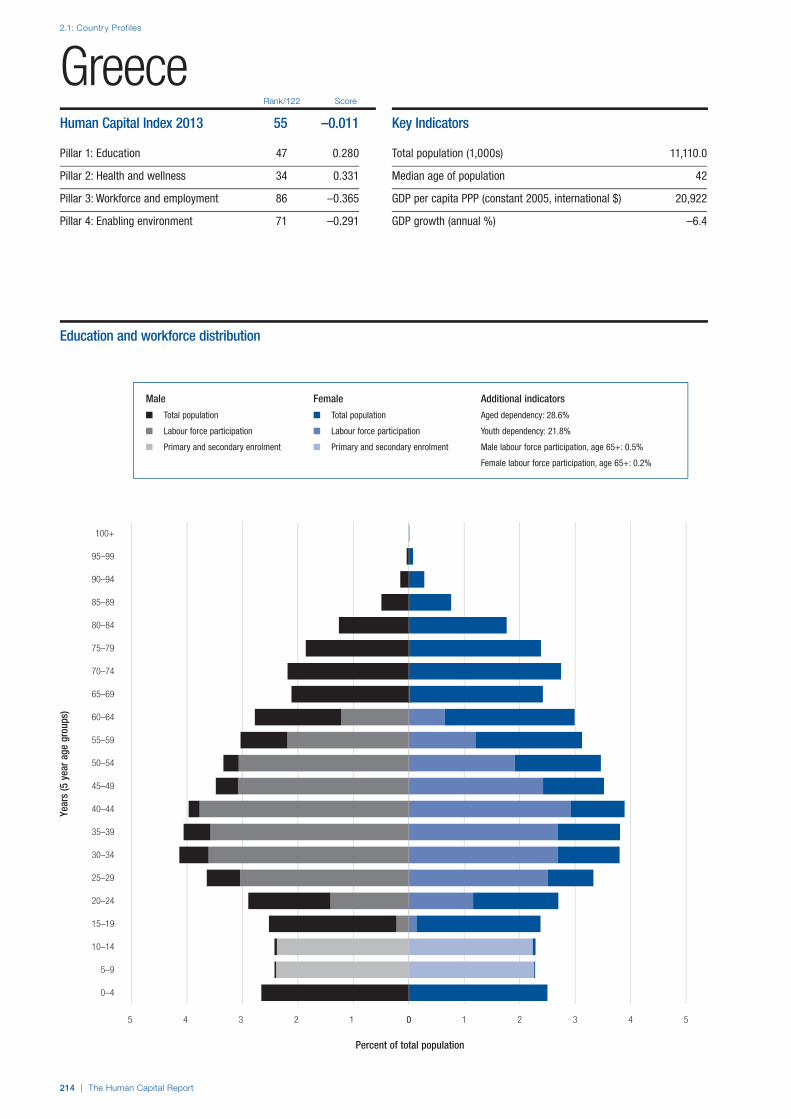
2.1: Country Profiles
214 | The Human Capital Report
Rank/122 Score
Year
s (5
yea
r age
gro
ups)
Percent of total population
0–4
5–9
10–14
15–19
20–24
25–29
30–34
35–39
40–44
45–49
50–54
55–59
60–64
65–69
70–74
75–79
80–84
85–89
90–94
95–99
100+
0 1 2 3 4 55 4 3 2 1 0
GreeceHuman Capital Index 2013 55 –0.011
Pillar 1: Education 47 0.280
Pillar 2: Health and wellness 34 0.331
Pillar 3: Workforce and employment 86 –0.365
Pillar 4: Enabling environment 71 –0.291
Key Indicators
Total population (1,000s) 11,110.0
Median age of population 42
GDP per capita PPP (constant 2005, international $) 20,922
GDP growth (annual %) –6.4
Male Female Additional indicators
n Total population n Total population Aged dependency: 28.6%
n Labour force participation n Labour force participation Youth dependency: 21.8%
n Primary and secondary enrolment n Primary and secondary enrolment Male labour force participation, age 65+: 0.5%
Female labour force participation, age 65+: 0.2%
Education and workforce distribution

The Human Capital Report | 215
2.1: Country Profiles
HCI s
core
–2.5
–2.0
–1.5
–1.0
–0.5
0.0
0.5
1.0
1.5
2.0
2.5
Overall Index
Enablingenvironment
Workforce andemployment
Health andwellness
Education
GreeceEmployment types, educational requirements and educational attainment
Percent of population Educational in employment type attainment (%)
Tertiary requirements 11.4 20.0
Professionals 7.1
Technicians and associate professionals 4.2
Secondary requirements 29.7 36.3
Clerks 5.9
Service workers and shop and market sales workers 7.5
Skilled agricultural and fishery workers 5.3
Craft and related trade workers 7.3
Plant and machine operators and assemblers 3.7
Primary requirements 3.6 30.2
Elementary occupations 3.6
Various 6.0
Legislators, senior officials and managers 5.1
Unclassified 0.8
Armed forces n/a
Spread of scores (by pillar and overall)
Greece
High-income economies
Europe and Central Asia

2.1: Country Profiles
216 | The Human Capital Report
Pillar 1: Education Rank/122 Z-Score Country Value Sample Minimum Sample Maximum
Access
Primary enrolment rate (%) ...................................................................26.........................0.670........................ 99...........................58 ......................... 100
Secondary enrolment rate (%) ................................................................6.........................1.122........................ 98...........................16 ......................... 100
Tertiary enrolment ratio (%) .....................................................................4.........................1.856........................ 89.............................1 ......................... 103
Education gender gap2 .........................................................................50.........................0.469................... 0.994......................0.645 ...................... 1.000
Quality
Internet access in schools1 ...................................................................74.......................–0.329..................... 3.91........................1.64 ........................ 6.64
Quality of the education system1 ..........................................................97.......................–0.781..................... 3.10........................1.99 ........................ 5.98
Quality of primary schools1 ...................................................................65.......................–0.164..................... 3.76........................1.97 ........................ 6.82
Quality of math & science education1 ...................................................52.........................0.253..................... 4.28........................1.88 ........................ 6.29
Quality of management schools1 ..........................................................81.......................–0.533..................... 3.85........................2.29 ........................ 6.09
Attainment
Primary education attainment (% population age 25+) ..........................27.........................0.690........................ 93.............................5 ......................... 100
Secondary education attainment (% population age 25+) .....................43.........................0.005........................ 63.............................2 ......................... 100
Tertiary education attainment (% population age 25+) ..........................37.........................0.106........................ 20.............................0 ........................... 44
Pillar 2: Health and Wellness Rank/122 Z-Score Country Value Sample Minimum Sample Maximum
Survival
Infant mortality (per 1,000 live births) ....................................................19.........................0.787.......................... 4.............................2 ........................... 98
Life expectancy ...................................................................................14.........................1.028........................ 81...........................50 ........................... 83
Survival gender gap2 ............................................................................59.........................0.236................... 0.974......................0.920 ...................... 0.980
Health
Stunting and wasting (% in children under 5) ........................................—..............................— .........................— ..........................1.2 ........................ 36.5
Unhealthy life years (% of life expectancy) ............................................28.........................0.586........................ 11.............................8 ........................... 66
Deaths under 60 from non-communicable
diseases (% of all NCD deaths) ......................................................11.........................1.257 ..................... 10.6 ..........................7.3 ........................ 55.8
Obesity (% of adults with BMI ≥ 30) .....................................................48.........................0.109..................... 17.5..........................1.1 ........................ 42.8
Business impact of non-communicable diseases1 ................................14.........................1.131..................... 4.99........................2.74 ........................ 5.87
Business impact of communicable diseases1 .......................................27.........................0.892..................... 6.36........................3.13 ........................ 6.90
Well-being
Stress (% of respondents)7 ................................................................118.......................–2.963........................ 69.............................8 ........................... 69
Depression (% of respondents)7 ...........................................................18.........................0.775.......................... 7.............................2 ........................... 37
Services
Water, sanitation and hygiene (% with access) .....................................35.........................0.783..................... 99.4........................31.1 ...................... 100.0
Healthcare quality1................................................................................65.......................–0.326..................... 3.71........................1.78 ........................ 6.75
Healthcare accessibility1 .......................................................................55.........................0.003..................... 4.67........................2.41 ........................ 6.75
Pillar 3: Workforce and Employment Rank/122 Z-Score Country Value Sample Minimum Sample Maximum
Participation
Labour force participation rate, age 15-64 (%) .....................................69.......................–0.060..................... 68.6........................43.4 ........................ 90.6
Labour force participation rate, age 65+ (%) .......................................111.......................–1.066....................... 4.0..........................1.6 ........................ 91.2
Economic participation gender gap2 .....................................................72.......................–0.090................... 0.633......................0.310 ...................... 0.839
Unemployment rate (%) ........................................................................87.......................–0.590..................... 11.8..........................0.3 ........................ 32.0
Youth unemployment rate (%) ...............................................................96.......................–1.470..................... 32.9..........................1.6 ........................ 48.2
Talent
Country capacity to attract talent1 ......................................................102.......................–1.141..................... 2.26........................1.48 ........................ 6.08
Country capacity to retain talent1..........................................................74.......................–0.396..................... 3.15........................1.81 ........................ 5.97
Ease of finding skilled employees1 ........................................................27.........................0.849..................... 4.57........................2.13 ........................ 5.69
Pay related to productivity1 .................................................................108.......................–1.216..................... 3.18........................2.37 ........................ 5.25
Capacity for innovation1......................................................................103.......................–0.880..................... 3.00........................2.31 ........................ 5.84
Index of Economic Complexity3 ............................................................49.........................0.090..................... 0.19......................–1.96 ........................ 2.37
Firm level technology absorption1 .........................................................77.......................–0.465..................... 4.48........................3.17 ........................ 6.23
Scientific and technical journal articles (per 1,000 people) ....................24.........................0.810................... 0.431......................0.000 ...................... 1.242
Median age of the working population ..................................................16.........................1.271........................ 40...........................28 ........................... 42
Training
Staff training1 ......................................................................................100.......................–0.889..................... 3.47........................2.51 ........................ 5.57
Training services1 ..................................................................................85.......................–0.595..................... 3.83........................2.67 ........................ 6.47
Greece

2.1: Country Profiles
NOTESIn the sections for Pillar 1, Pillar 2, Pillar 3 and Pillar 4, values under Country Value, Sample Minimum and Sample Maximum refer to underlying data for each variable.For further details and explanations, please refer to the section “How to Read the Country Profiles”.1 Survey data responses on a 1- to 7-scale (1 = worst score, 7 = best score)2 Data on a 0- to 1-scale (0 = worst score, 1 = best score)3 Data from -1.960 (worst score) to 2.367 (best score)4 Rank number on a list of 185 countries5 Index on a scale of 0 (perfect inequality) to 100 (perfect equality)6 International test scores7 Perception survey data. Percentage of yes responses.8 Score (1 = best, 7 = worst)9 Reported in relation to UK score (100)
The Human Capital Report | 217
GreecePillar 4: Enabling Environment Rank/122 Z-Score Country Value Sample Minimum Sample Maximum
Infrastructure
Mobile users (per 100 people) ..............................................................64.......................–0.018...................... 106...........................17 ......................... 191
Internet users (per 100 people) .............................................................46.........................0.327........................ 53.............................1 ........................... 95
Quality of domestic transport1 ..............................................................48.........................0.163 ..................... 4.61 ........................2.08 ........................ 6.51
Collaboration
State of cluster development1 ............................................................111.......................–1.277..................... 2.98........................2.33 ........................ 5.49
Business and university R&D collaboration1 ........................................104.......................–0.858 ..................... 3.01 ........................2.11 ........................ 5.84
Legal framework
Doing Business Index4 .........................................................................62.........................0.038........................ 78.............................1 ......................... 180
Social safety net protection1 .................................................................55.......................–0.097..................... 3.68........................2.10 ........................ 6.26
Intellectual property protection and property rights1..............................68.......................–0.288 ..................... 3.80 ........................1.62 ........................ 6.31
Social mobility
Social mobility1 .....................................................................................81.......................–0.609..................... 3.84........................2.78 ........................ 6.36
Additional indicatorsDemographics Value
Child dependency ratio (%)..................................................................... 21.8Aged dependency ratio (%) .................................................................... 28.6Fertility rate (births per woman) ................................................................. 1.5Sex ratio at birth (female/male) ............................................................... 0.94Population below age 20 (%) .................................................................. 19.5Population above age 60 (%) .................................................................. 24.9
Education
Public spending on education (% of GDP) ................................................ 4.1Technical/vocational enrolment as % of total
enrolment in secondary school ........................................................... 16Adult literacy (%) ..................................................................................... 97.3Boys not in primary school (%) .................................................................... 1Girls not in primary school (%) ..................................................................... 1Education poverty (% of children age 17-22
with less than 2-4 years schooling) ......................................................—Private enrolment in primary school (% of primary) ................................... 7.2Private enrolment in secondary school (% of secondary) .......................... 4.8PIRLS6 .......................................................................................................—PISA math scores6 .................................................................................. 466PISA reading scores6 ............................................................................... 483PISA science scores6 .............................................................................. 470TIMSS 4th grade math6 ..............................................................................—TIMSS 4th grade science6 ..........................................................................—TIMSS 8th grade math6 ..............................................................................—TIMSS 8th grade science6 ..........................................................................—
Health
Prevalence of visual impairment (%) .......................................................... 0.9Public spending on health (% of GDP) .................................................... 10.8Business impact of heart disease1 .......................................................... 4.65Business impact of cancer1 .................................................................... 4.61Business impact of mental illness1 .......................................................... 5.19Business impact of diabetes1 ................................................................. 5.12Business impact of chronic respiratory disease1 ..................................... 5.37Business impact of HIV/AIDS1 ................................................................ 6.11Business impact of tuberculosis1 ............................................................ 6.45Business impact of malaria1 ................................................................... 6.52
Society Value
Freedom in the World8................................................................................. 2Democracy Index (rank/165) ...................................................................... 33Population living in urban area (%) .......................................................... 61.7Gini Index (income)5................................................................................ 34.3Accessibility of digital content1 ............................................................... 5.13Extent of virtual social networks use1 ..................................................... 5.40
Workforce
Economic activity (agriculture) — % of total activity ................................ 12.4Economic activity (industry) — % of total activity .................................... 17.8Economic activity (services) — % of total activity .................................... 69.7GDP per person employed (US$) ....................................................... 33,366Cooperation in labour-employer relations1 .............................................. 3.73Emigration rate of the tertiary educated (%) ............................................ 12.2Labour force with tertiary education (%) ................................................. 28.3Number of patent applications (per 1,000 people) .............................. 0.0670Hiring and firing practices1 ...................................................................... 3.54Retirement age, male ................................................................................ 65Retirement age, female .............................................................................. 62Number of informal sector workers (1,000s) ...............................................—Total employed (1,000s) ....................................................................... 4,427Total unemployed (1,000s) ....................................................................... 594Unemployment for 12 months or more
as a % of total unemployment ......................................................... 47.7Total youth not in education or employment (1,000s) ........................... 161.9Unemployment for 12 months or more (1,000s) ................................... 283.6Global Innovation Index (rank/142) ............................................................ 55Global Talent Index (rank/60) ..................................................................... 23Quality of Labour Force (rank/60) .............................................................. 33Talent Environment (rank/60) ..................................................................... 37IQ measure9 ........................................................................................... 93.1

2.1: Country Profiles
218 | The Human Capital Report
Rank/122 Score
Year
s (5
yea
r age
gro
ups)
Percent of total population
0–4
5–9
10–14
15–19
20–24
25–29
30–34
35–39
40–44
45–49
50–54
55–59
60–64
65–69
70–74
75–79
80–84
85–89
90–94
95–99
100+
0 1 2 3 4 5 6 7 88 7 6 5 4 3 2 1 0
GuatemalaHuman Capital Index 2013 84 –0.341
Pillar 1: Education 105 –0.968
Pillar 2: Health and wellness 81 –0.196
Pillar 3: Workforce and employment 46 0.035
Pillar 4: Enabling environment 65 –0.234
Key Indicators
Total population (1,000s) 14,341.6
Median age of population 19
GDP per capita PPP (constant 2005, international $) 4,396
GDP growth (annual %) 3.0
Male Female Additional indicators
n Total population n Total population Aged dependency: 8.2%
n Labour force participation n Labour force participation Youth dependency: 76.8%
n Primary and secondary enrolment n Primary and secondary enrolment Male labour force participation, age 65+: 1.5%
Female labour force participation, age 65+: 0.6%
Education and workforce distribution

The Human Capital Report | 219
2.1: Country Profiles
HCI s
core
–2.5
–2.0
–1.5
–1.0
–0.5
0.0
0.5
1.0
1.5
2.0
2.5
Overall Index
Enablingenvironment
Workforce andemployment
Health andwellness
Education
GuatemalaEmployment types, educational requirements and educational attainment
Percent of population Educational in employment type attainment (%)
Tertiary requirements n/a 3.4
Professionals n/a
Technicians and associate professionals n/a
Secondary requirements n/a 11.3
Clerks n/a
Service workers and shop and market sales workers n/a
Skilled agricultural and fishery workers n/a
Craft and related trade workers n/a
Plant and machine operators and assemblers n/a
Primary requirements n/a 15.0
Elementary occupations n/a
Various n/a
Legislators, senior officials and managers n/a
Unclassified n/a
Armed forces n/a
Spread of scores (by pillar and overall)
Guatemala
Lower-middle income economies
Latin America and the Carribean

2.1: Country Profiles
220 | The Human Capital Report
Pillar 1: Education Rank/122 Z-Score Country Value Sample Minimum Sample Maximum
Access
Primary enrolment rate (%) ...................................................................39.........................0.549........................ 98...........................58 ......................... 100
Secondary enrolment rate (%) ..............................................................84.......................–1.140........................ 46...........................16 ......................... 100
Tertiary enrolment ratio (%) ...................................................................86.......................–0.864........................ 18.............................1 ......................... 103
Education gender gap2 .........................................................................93.......................–0.100................... 0.951......................0.645 ...................... 1.000
Quality
Internet access in schools1 ...................................................................96.......................–0.848..................... 3.26........................1.64 ........................ 6.64
Quality of the education system1 ........................................................113.......................–1.307..................... 2.63........................1.99 ........................ 5.98
Quality of primary schools1 .................................................................115.......................–1.554..................... 2.25........................1.97 ........................ 6.82
Quality of math & science education1 .................................................115.......................–1.733..................... 2.38........................1.88 ........................ 6.29
Quality of management schools1 ..........................................................35.........................0.543..................... 4.75........................2.29 ........................ 6.09
Attainment
Primary education attainment (% population age 25+) ..........................68.......................–1.941........................ 30.............................5 ......................... 100
Secondary education attainment (% population age 25+) .....................80.......................–1.817........................ 15.............................2 ......................... 100
Tertiary education attainment (% population age 25+) ..........................78.......................–1.410.......................... 3.............................0 ........................... 44
Pillar 2: Health and Wellness Rank/122 Z-Score Country Value Sample Minimum Sample Maximum
Survival
Infant mortality (per 1,000 live births) ....................................................85.......................–0.111........................ 24.............................2 ........................... 98
Life expectancy ...................................................................................88.......................–0.430........................ 69...........................50 ........................... 83
Survival gender gap2 ..............................................................................1.........................0.751................... 0.980......................0.920 ...................... 0.980
Health
Stunting and wasting (% in children under 5) ........................................65.......................–1.053..................... 24.6..........................1.2 ........................ 36.5
Unhealthy life years (% of life expectancy) ............................................51.........................0.264........................ 13.............................8 ........................... 66
Deaths under 60 from non-communicable
diseases (% of all NCD deaths) ......................................................97.......................–1.055 ..................... 40.0 ..........................7.3 ........................ 55.8
Obesity (% of adults with BMI ≥ 30) .....................................................65.......................–0.228..................... 20.7..........................1.1 ........................ 42.8
Business impact of non-communicable diseases1 ................................27.........................0.799..................... 4.84........................2.74 ........................ 5.87
Business impact of communicable diseases1 .......................................52.........................0.432..................... 5.91........................3.13 ........................ 6.90
Well-being
Stress (% of respondents)7 ..................................................................79.......................–0.405........................ 36.............................8 ........................... 69
Depression (% of respondents)7 ...........................................................65.......................–0.022........................ 12.............................2 ........................... 37
Services
Water, sanitation and hygiene (% with access) .....................................74.........................0.143..................... 86.9........................31.1 ...................... 100.0
Healthcare quality1................................................................................73.......................–0.566..................... 3.42........................1.78 ........................ 6.75
Healthcare accessibility1 .....................................................................111.......................–1.260..................... 3.12........................2.41 ........................ 6.75
Pillar 3: Workforce and Employment Rank/122 Z-Score Country Value Sample Minimum Sample Maximum
Participation
Labour force participation rate, age 15-64 (%) .....................................64.........................0.021..................... 69.4........................43.4 ........................ 90.6
Labour force participation rate, age 65+ (%) .........................................21.........................0.978..................... 43.6..........................1.6 ........................ 91.2
Economic participation gender gap2 ...................................................100.......................–0.999................... 0.526......................0.310 ...................... 0.839
Unemployment rate (%) ..........................................................................9.........................1.001....................... 3.5..........................0.3 ........................ 32.0
Youth unemployment rate (%) ...............................................................—..............................— .........................— ..........................1.6 ........................ 48.2
Talent
Country capacity to attract talent1 ........................................................75.......................–0.376..................... 3.05........................1.48 ........................ 6.08
Country capacity to retain talent1..........................................................42.........................0.405..................... 3.92........................1.81 ........................ 5.97
Ease of finding skilled employees1 ........................................................68.......................–0.230..................... 3.83........................2.13 ........................ 5.69
Pay related to productivity1 ...................................................................44.........................0.382..................... 4.16........................2.37 ........................ 5.25
Capacity for innovation1........................................................................47.........................0.021..................... 3.72........................2.31 ........................ 5.84
Index of Economic Complexity3 ............................................................61.......................–0.253................... –0.13......................–1.96 ........................ 2.37
Firm level technology absorption1 .........................................................38.........................0.563..................... 5.22........................3.17 ........................ 6.23
Scientific and technical journal articles (per 1,000 people) ..................114.......................–0.623................... 0.002......................0.000 ...................... 1.242
Median age of the working population ................................................108.......................–1.269........................ 29...........................28 ........................... 42
Training
Staff training1 ........................................................................................25.........................0.785..................... 4.55........................2.51 ........................ 5.57
Training services1 ..................................................................................55.........................0.117..................... 4.40........................2.67 ........................ 6.47
Guatemala

2.1: Country Profiles
NOTESIn the sections for Pillar 1, Pillar 2, Pillar 3 and Pillar 4, values under Country Value, Sample Minimum and Sample Maximum refer to underlying data for each variable.For further details and explanations, please refer to the section “How to Read the Country Profiles”.1 Survey data responses on a 1- to 7-scale (1 = worst score, 7 = best score)2 Data on a 0- to 1-scale (0 = worst score, 1 = best score)3 Data from -1.960 (worst score) to 2.367 (best score)4 Rank number on a list of 185 countries5 Index on a scale of 0 (perfect inequality) to 100 (perfect equality)6 International test scores7 Perception survey data. Percentage of yes responses.8 Score (1 = best, 7 = worst)9 Reported in relation to UK score (100)
The Human Capital Report | 221
GuatemalaPillar 4: Enabling Environment Rank/122 Z-Score Country Value Sample Minimum Sample Maximum
Infrastructure
Mobile users (per 100 people) ..............................................................19.........................0.979...................... 140...........................17 ......................... 191
Internet users (per 100 people) ...........................................................103.......................–1.147........................ 12.............................1 ........................... 95
Quality of domestic transport1 ..............................................................82.......................–0.447 ..................... 4.08 ........................2.08 ........................ 6.51
Collaboration
State of cluster development1 ..............................................................42.........................0.323..................... 4.12........................2.33 ........................ 5.49
Business and university R&D collaboration1 ..........................................52.......................–0.033 ..................... 3.75 ........................2.11 ........................ 5.84
Legal framework
Doing Business Index4 .........................................................................74.......................–0.253........................ 93.............................1 ......................... 180
Social safety net protection1 ...............................................................104.......................–1.022..................... 2.67........................2.10 ........................ 6.26
Intellectual property protection and property rights1..............................89.......................–0.712 ..................... 3.36 ........................1.62 ........................ 6.31
Social mobility
Social mobility1 .....................................................................................47.........................0.209..................... 4.58........................2.78 ........................ 6.36
Additional indicatorsDemographics Value
Child dependency ratio (%)..................................................................... 76.8Aged dependency ratio (%) ...................................................................... 8.2Fertility rate (births per woman) ................................................................. 4.2Sex ratio at birth (female/male) ............................................................... 0.95Population below age 20 (%) .................................................................. 52.6Population above age 60 (%) .................................................................... 6.4
Education
Public spending on education (% of GDP) ................................................ 2.8Technical/vocational enrolment as % of total
enrolment in secondary school ........................................................... 28Adult literacy (%) ..................................................................................... 75.9Boys not in primary school (%) .................................................................... 1Girls not in primary school (%) ..................................................................... 3Education poverty (% of children age 17-22
with less than 2-4 years schooling) ................................................ 0.547Private enrolment in primary school (% of primary) ................................. 10.2Private enrolment in secondary school (% of secondary) ........................ 62.5PIRLS6 .......................................................................................................—PISA math scores6 .....................................................................................—PISA reading scores6 ..................................................................................—PISA science scores6 .................................................................................—TIMSS 4th grade math6 ..............................................................................—TIMSS 4th grade science6 ..........................................................................—TIMSS 8th grade math6 ..............................................................................—TIMSS 8th grade science6 ..........................................................................—
Health
Prevalence of visual impairment (%) .......................................................... 5.2Public spending on health (% of GDP) ...................................................... 6.7Business impact of heart disease1 .......................................................... 4.73Business impact of cancer1 .................................................................... 4.66Business impact of mental illness1 .......................................................... 5.70Business impact of diabetes1 ................................................................. 4.49Business impact of chronic respiratory disease1 ..................................... 4.62Business impact of HIV/AIDS1 ................................................................ 5.79Business impact of tuberculosis1 ............................................................ 6.04Business impact of malaria1 ................................................................... 5.89
Society Value
Freedom in the World8................................................................................. 3Democracy Index (rank/165) ...................................................................... 81Population living in urban area (%) .......................................................... 50.2Gini Index (income)5................................................................................ 55.9Accessibility of digital content1 ............................................................... 5.07Extent of virtual social networks use1 ..................................................... 5.57
Workforce
Economic activity (agriculture) — % of total activity ....................................—Economic activity (industry) — % of total activity ........................................—Economic activity (services) — % of total activity ........................................—GDP per person employed (US$) ....................................................... 13,761Cooperation in labour-employer relations1 .............................................. 5.12Emigration rate of the tertiary educated (%) ............................................ 23.9Labour force with tertiary education (%) ................................................... 6.9Number of patent applications (per 1,000 people) .............................. 0.0231Hiring and firing practices1 ...................................................................... 4.24Retirement age, male .................................................................................—Retirement age, female ...............................................................................—Number of informal sector workers (1,000s) ...............................................—Total employed (1,000s) ....................................................................... 5,566Total unemployed (1,000s) ....................................................................... 203Unemployment for 12 months or more
as a % of total unemployment ......................................................... 17.2Total youth not in education or employment (1,000s) .................................—Unemployment for 12 months or more (1,000s) ..................................... 34.9Global Innovation Index (rank/142) ............................................................ 87Global Talent Index (rank/60) ......................................................................—Quality of Labour Force (rank/60) ...............................................................—Talent Environment (rank/60) ......................................................................—IQ measure9 ........................................................................................... 78.5
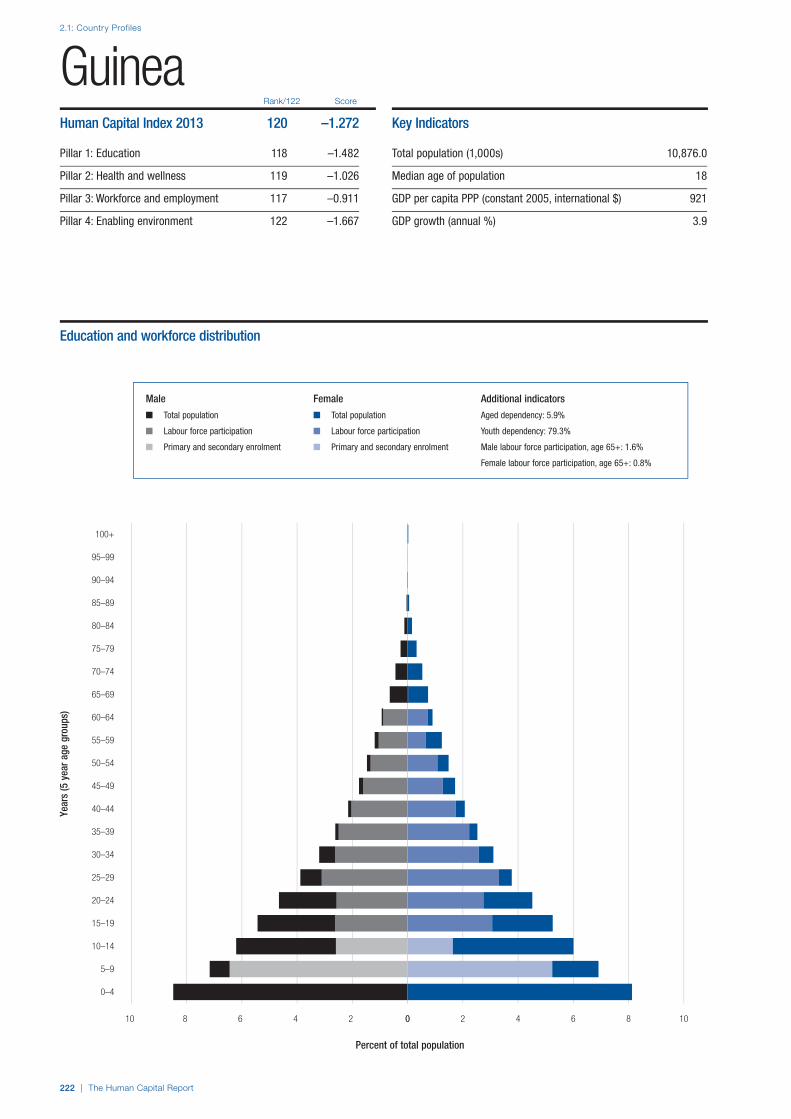
2.1: Country Profiles
222 | The Human Capital Report
Rank/122 Score
Year
s (5
yea
r age
gro
ups)
Percent of total population
0–4
5–9
10–14
15–19
20–24
25–29
30–34
35–39
40–44
45–49
50–54
55–59
60–64
65–69
70–74
75–79
80–84
85–89
90–94
95–99
100+
0 2 4 6 8 1010 8 6 4 2 0
GuineaHuman Capital Index 2013 120 –1.272
Pillar 1: Education 118 –1.482
Pillar 2: Health and wellness 119 –1.026
Pillar 3: Workforce and employment 117 –0.911
Pillar 4: Enabling environment 122 –1.667
Key Indicators
Total population (1,000s) 10,876.0
Median age of population 18
GDP per capita PPP (constant 2005, international $) 921
GDP growth (annual %) 3.9
Male Female Additional indicators
n Total population n Total population Aged dependency: 5.9%
n Labour force participation n Labour force participation Youth dependency: 79.3%
n Primary and secondary enrolment n Primary and secondary enrolment Male labour force participation, age 65+: 1.6%
Female labour force participation, age 65+: 0.8%
Education and workforce distribution

The Human Capital Report | 223
2.1: Country Profiles
HCI s
core
–2.5
–2.0
–1.5
–1.0
–0.5
0.0
0.5
1.0
1.5
2.0
2.5
Overall Index
Enablingenvironment
Workforce andemployment
Health andwellness
Education
GuineaEmployment types, educational requirements and educational attainment
Percent of population Educational in employment type attainment (%)
Tertiary requirements n/a n/a
Professionals n/a
Technicians and associate professionals n/a
Secondary requirements n/a n/a
Clerks n/a
Service workers and shop and market sales workers n/a
Skilled agricultural and fishery workers n/a
Craft and related trade workers n/a
Plant and machine operators and assemblers n/a
Primary requirements n/a n/a
Elementary occupations n/a
Various n/a
Legislators, senior officials and managers n/a
Unclassified n/a
Armed forces n/a
Spread of scores (by pillar and overall)
Guinea
Low-income economies
Sub-Saharan Africa

2.1: Country Profiles
224 | The Human Capital Report
Pillar 1: Education Rank/122 Z-Score Country Value Sample Minimum Sample Maximum
Access
Primary enrolment rate (%) .................................................................103.......................–1.232........................ 83...........................58 ......................... 100
Secondary enrolment rate (%) ..............................................................91.......................–1.641........................ 35...........................16 ......................... 100
Tertiary enrolment ratio (%) ...................................................................96.......................–1.113........................ 11.............................1 ......................... 103
Education gender gap2 .........................................................................—..............................— .........................— ......................0.645 ...................... 1.000
Quality
Internet access in schools1 .................................................................120.......................–2.006..................... 1.81........................1.64 ........................ 6.64
Quality of the education system1 ........................................................116.......................–1.385..................... 2.56........................1.99 ........................ 5.98
Quality of primary schools1 .................................................................113.......................–1.508..................... 2.30........................1.97 ........................ 6.82
Quality of math & science education1 ...................................................94.......................–0.771..................... 3.30........................1.88 ........................ 6.29
Quality of management schools1 ........................................................121.......................–2.196..................... 2.46........................2.29 ........................ 6.09
Attainment
Primary education attainment (% population age 25+) ..........................—..............................— .........................— .............................5 ......................... 100
Secondary education attainment (% population age 25+) .....................—..............................— .........................— .............................2 ......................... 100
Tertiary education attainment (% population age 25+) ..........................—..............................— .........................— .............................0 ........................... 44
Pillar 2: Health and Wellness Rank/122 Z-Score Country Value Sample Minimum Sample Maximum
Survival
Infant mortality (per 1,000 live births) ..................................................118.......................–2.580........................ 79.............................2 ........................... 98
Life expectancy .................................................................................117.......................–2.132........................ 55...........................50 ........................... 83
Survival gender gap2 ............................................................................—..............................—.........................—......................0.920 ...................... 0.980
Health
Stunting and wasting (% in children under 5) ........................................64.......................–1.007..................... 24.2..........................1.2 ........................ 36.5
Unhealthy life years (% of life expectancy) ............................................72.........................0.014........................ 15.............................8 ........................... 66
Deaths under 60 from non-communicable
diseases (% of all NCD deaths) ....................................................119.......................–1.818 ..................... 49.7 ..........................7.3 ........................ 55.8
Obesity (% of adults with BMI ≥ 30) .....................................................12.........................1.460....................... 4.7..........................1.1 ........................ 42.8
Business impact of non-communicable diseases1 ................................93.......................–0.617..................... 4.20........................2.74 ........................ 5.87
Business impact of communicable diseases1 .....................................115.......................–1.924..................... 3.56........................3.13 ........................ 6.90
Well-being
Stress (% of respondents)7 ..................................................................24.........................0.680........................ 22.............................8 ........................... 69
Depression (% of respondents)7 ...........................................................79.......................–0.341........................ 14.............................2 ........................... 37
Services
Water, sanitation and hygiene (% with access) ...................................113.......................–1.967..................... 45.8........................31.1 ...................... 100.0
Healthcare quality1..............................................................................121.......................–1.533..................... 2.24........................1.78 ........................ 6.75
Healthcare accessibility1 .....................................................................121.......................–1.579..................... 2.73........................2.41 ........................ 6.75
Pillar 3: Workforce and Employment Rank/122 Z-Score Country Value Sample Minimum Sample Maximum
Participation
Labour force participation rate, age 15-64 (%) .....................................45.........................0.410..................... 73.2........................43.4 ........................ 90.6
Labour force participation rate, age 65+ (%) .........................................18.........................1.220..................... 48.3..........................1.6 ........................ 91.2
Economic participation gender gap2 .....................................................—..............................— .........................— ......................0.310 ...................... 0.839
Unemployment rate (%) ........................................................................—..............................— .........................— ..........................0.3 ........................ 32.0
Youth unemployment rate (%) ...............................................................—..............................— .........................— ..........................1.6 ........................ 48.2
Talent
Country capacity to attract talent1 ........................................................85.......................–0.700..................... 2.72........................1.48 ........................ 6.08
Country capacity to retain talent1..........................................................93.......................–0.742..................... 2.81........................1.81 ........................ 5.97
Ease of finding skilled employees1 ......................................................103.......................–1.158..................... 3.18........................2.13 ........................ 5.69
Pay related to productivity1 .................................................................115.......................–1.784..................... 2.83........................2.37 ........................ 5.25
Capacity for innovation1......................................................................121.......................–1.462..................... 2.54........................2.31 ........................ 5.84
Index of Economic Complexity3 ..........................................................109.......................–1.691................... –1.50......................–1.96 ........................ 2.37
Firm level technology absorption1 .......................................................112.......................–1.283..................... 3.90........................3.17 ........................ 6.23
Scientific and technical journal articles (per 1,000 people) ..................122.......................–0.627................... 0.000......................0.000 ...................... 1.242
Median age of the working population ................................................103.......................–1.167........................ 30...........................28 ........................... 42
Training
Staff training1 ......................................................................................110.......................–1.303..................... 3.21........................2.51 ........................ 5.57
Training services1 ................................................................................118.......................–1.562..................... 3.07........................2.67 ........................ 6.47
Guinea

2.1: Country Profiles
NOTESIn the sections for Pillar 1, Pillar 2, Pillar 3 and Pillar 4, values under Country Value, Sample Minimum and Sample Maximum refer to underlying data for each variable.For further details and explanations, please refer to the section “How to Read the Country Profiles”.1 Survey data responses on a 1- to 7-scale (1 = worst score, 7 = best score)2 Data on a 0- to 1-scale (0 = worst score, 1 = best score)3 Data from -1.960 (worst score) to 2.367 (best score)4 Rank number on a list of 185 countries5 Index on a scale of 0 (perfect inequality) to 100 (perfect equality)6 International test scores7 Perception survey data. Percentage of yes responses.8 Score (1 = best, 7 = worst)9 Reported in relation to UK score (100)
The Human Capital Report | 225
GuineaPillar 4: Enabling Environment Rank/122 Z-Score Country Value Sample Minimum Sample Maximum
Infrastructure
Mobile users (per 100 people) ............................................................118.......................–1.854........................ 44...........................17 ......................... 191
Internet users (per 100 people) ...........................................................121.......................–1.519.......................... 1.............................1 ........................... 95
Quality of domestic transport1 ............................................................122.......................–2.744 ..................... 2.08 ........................2.08 ........................ 6.51
Collaboration
State of cluster development1 ............................................................105.......................–1.007..................... 3.17........................2.33 ........................ 5.49
Business and university R&D collaboration1 ........................................120.......................–1.771 ..................... 2.19 ........................2.11 ........................ 5.84
Legal framework
Doing Business Index4 .......................................................................121.......................–1.901...................... 178.............................1 ......................... 180
Social safety net protection1 ...............................................................112.......................–1.156..................... 2.53........................2.10 ........................ 6.26
Intellectual property protection and property rights1............................119.......................–1.452 ..................... 2.61 ........................1.62 ........................ 6.31
Social mobility
Social mobility1 ...................................................................................118.......................–1.598..................... 2.95........................2.78 ........................ 6.36
Additional indicatorsDemographics Value
Child dependency ratio (%)..................................................................... 79.3Aged dependency ratio (%) ...................................................................... 5.9Fertility rate (births per woman) ................................................................. 5.4Sex ratio at birth (female/male) ............................................................... 0.97Population below age 20 (%) .................................................................. 53.6Population above age 60 (%) .................................................................... 5.0
Education
Public spending on education (% of GDP) ................................................ 3.1Technical/vocational enrolment as % of total
enrolment in secondary school ............................................................. 5Adult literacy (%) ..................................................................................... 25.3Boys not in primary school (%) .................................................................. 10Girls not in primary school (%) ................................................................... 24Education poverty (% of children age 17-22
with less than 2-4 years schooling) ................................................ 1.084Private enrolment in primary school (% of primary) ................................. 27.5Private enrolment in secondary school (% of secondary) ........................ 33.5PIRLS6 .......................................................................................................—PISA math scores6 .....................................................................................—PISA reading scores6 ..................................................................................—PISA science scores6 .................................................................................—TIMSS 4th grade math6 ..............................................................................—TIMSS 4th grade science6 ..........................................................................—TIMSS 8th grade math6 ..............................................................................—TIMSS 8th grade science6 ..........................................................................—
Health
Prevalence of visual impairment (%) .......................................................... 6.6Public spending on health (% of GDP) ...................................................... 6.0Business impact of heart disease1 .......................................................... 3.91Business impact of cancer1 .................................................................... 4.47Business impact of mental illness1 .......................................................... 4.36Business impact of diabetes1 ................................................................. 4.25Business impact of chronic respiratory disease1 ..................................... 4.03Business impact of HIV/AIDS1 ................................................................ 3.87Business impact of tuberculosis1 ............................................................ 3.90Business impact of malaria1 ................................................................... 2.92
Society Value
Freedom in the World8................................................................................. 5Democracy Index (rank/165) .................................................................... 146Population living in urban area (%) .......................................................... 35.9Gini Index (income)5................................................................................ 39.4Accessibility of digital content1 ............................................................... 2.71Extent of virtual social networks use1 ..................................................... 4.17
Workforce
Economic activity (agriculture) — % of total activity ....................................—Economic activity (industry) — % of total activity ........................................—Economic activity (services) — % of total activity ........................................—GDP per person employed (US$) ...............................................................—Cooperation in labour-employer relations1 .............................................. 4.04Emigration rate of the tertiary educated (%) .............................................. 4.7Labour force with tertiary education (%) ................................................... 3.2Number of patent applications (per 1,000 people) ......................................—Hiring and firing practices1 ...................................................................... 4.21Retirement age, male .................................................................................—Retirement age, female ...............................................................................—Number of informal sector workers (1,000s) ...............................................—Total employed (1,000s) ....................................................................... 4,570Total unemployed (1,000s) ......................................................................... 75Unemployment for 12 months or more
as a % of total unemployment .............................................................—Total youth not in education or employment (1,000s) .................................—Unemployment for 12 months or more (1,000s) .........................................—Global Innovation Index (rank/142) .......................................................... 126Global Talent Index (rank/60) ......................................................................—Quality of Labour Force (rank/60) ...............................................................—Talent Environment (rank/60) ......................................................................—IQ measure9 ........................................................................................... 66.5

2.1: Country Profiles
226 | The Human Capital Report
Rank/122 Score
Year
s (5
yea
r age
gro
ups)
Percent of total population
0–4
5–9
10–14
15–19
20–24
25–29
30–34
35–39
40–44
45–49
50–54
55–59
60–64
65–69
70–74
75–79
80–84
85–89
90–94
95–99
100+
0 1 2 3 4 5 6 77 6 5 4 3 2 1 0
HondurasHuman Capital Index 2013 100 –0.560
Pillar 1: Education 103 –0.947
Pillar 2: Health and wellness 89 –0.335
Pillar 3: Workforce and employment 90 –0.397
Pillar 4: Enabling environment 87 –0.561
Key Indicators
Total population (1,000s) 7,621.2
Median age of population 21
GDP per capita PPP (constant 2005, international $) 3,614
GDP growth (annual %) 3.5
Male Female Additional indicators
n Total population n Total population Aged dependency: 7.3%
n Labour force participation n Labour force participation Youth dependency: 62.5%
n Primary and secondary enrolment n Primary and secondary enrolment Male labour force participation, age 65+: 1.8%
Female labour force participation, age 65+: 0.8%
Education and workforce distribution
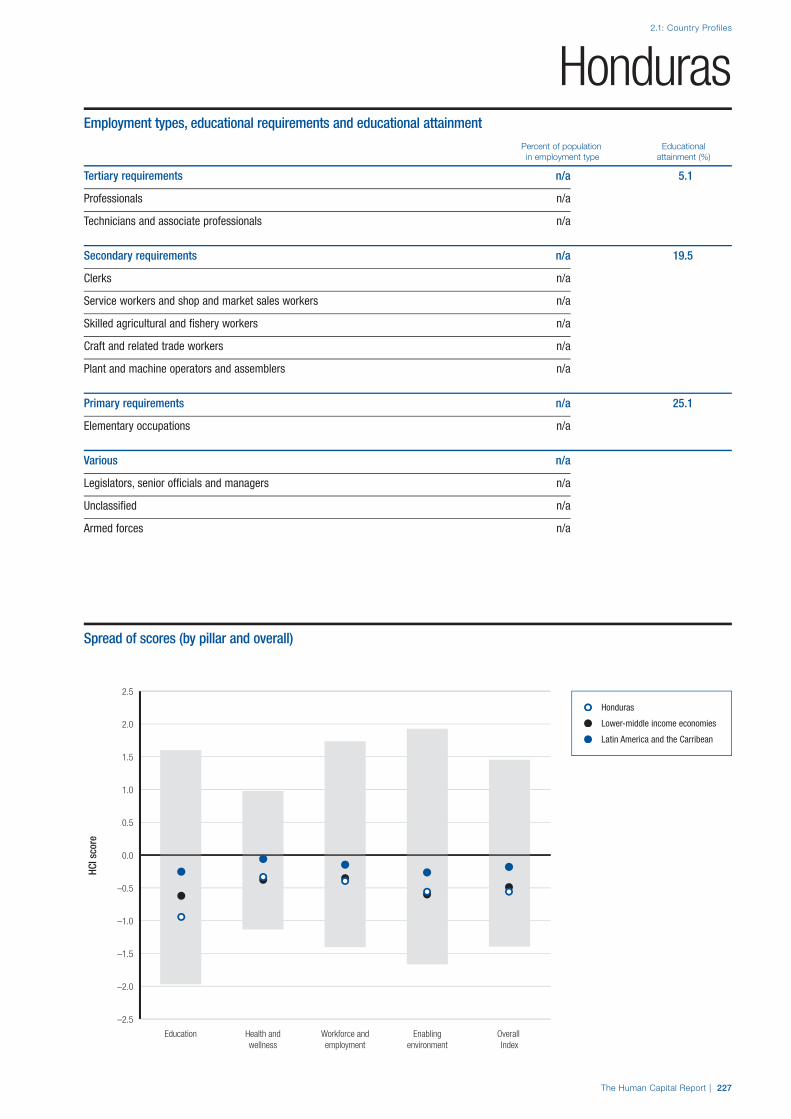
The Human Capital Report | 227
2.1: Country Profiles
HCI s
core
–2.5
–2.0
–1.5
–1.0
–0.5
0.0
0.5
1.0
1.5
2.0
2.5
Overall Index
Enablingenvironment
Workforce andemployment
Health andwellness
Education
HondurasEmployment types, educational requirements and educational attainment
Percent of population Educational in employment type attainment (%)
Tertiary requirements n/a 5.1
Professionals n/a
Technicians and associate professionals n/a
Secondary requirements n/a 19.5
Clerks n/a
Service workers and shop and market sales workers n/a
Skilled agricultural and fishery workers n/a
Craft and related trade workers n/a
Plant and machine operators and assemblers n/a
Primary requirements n/a 25.1
Elementary occupations n/a
Various n/a
Legislators, senior officials and managers n/a
Unclassified n/a
Armed forces n/a
Spread of scores (by pillar and overall)
Honduras
Lower-middle income economies
Latin America and the Carribean

2.1: Country Profiles
228 | The Human Capital Report
Pillar 1: Education Rank/122 Z-Score Country Value Sample Minimum Sample Maximum
Access
Primary enrolment rate (%) ...................................................................52.........................0.459........................ 97...........................58 ......................... 100
Secondary enrolment rate (%) ..............................................................—..............................— .........................— ...........................16 ......................... 100
Tertiary enrolment ratio (%) ...................................................................81.......................–0.758........................ 21.............................1 ......................... 103
Education gender gap2 .........................................................................19.........................0.546................... 1.000......................0.645 ...................... 1.000
Quality
Internet access in schools1 .................................................................100.......................–0.968..................... 3.11........................1.64 ........................ 6.64
Quality of the education system1 ........................................................119.......................–1.519..................... 2.44........................1.99 ........................ 5.98
Quality of primary schools1 .................................................................116.......................–1.572..................... 2.23........................1.97 ........................ 6.82
Quality of math & science education1 .................................................119.......................–1.900..................... 2.22........................1.88 ........................ 6.29
Quality of management schools1 ........................................................107.......................–1.119..................... 3.36........................2.29 ........................ 6.09
Attainment
Primary education attainment (% population age 25+) ..........................59.......................–0.996........................ 53.............................5 ......................... 100
Secondary education attainment (% population age 25+) .....................76.......................–1.336........................ 28.............................2 ......................... 100
Tertiary education attainment (% population age 25+) ..........................76.......................–1.255.......................... 5.............................0 ........................... 44
Pillar 2: Health and Wellness Rank/122 Z-Score Country Value Sample Minimum Sample Maximum
Survival
Infant mortality (per 1,000 live births) ....................................................73.........................0.159........................ 18.............................2 ........................... 98
Life expectancy ...................................................................................59.........................0.177........................ 74...........................50 ........................... 83
Survival gender gap2 ............................................................................47.........................0.459................... 0.976......................0.920 ...................... 0.980
Health
Stunting and wasting (% in children under 5) ........................................44.......................–0.039..................... 15.7..........................1.2 ........................ 36.5
Unhealthy life years (% of life expectancy) ............................................90.......................–0.264........................ 16.............................8 ........................... 66
Deaths under 60 from non-communicable
diseases (% of all NCD deaths) ......................................................63.......................–0.025 ..................... 26.9 ..........................7.3 ........................ 55.8
Obesity (% of adults with BMI ≥ 30) .....................................................59.......................–0.133..................... 19.8..........................1.1 ........................ 42.8
Business impact of non-communicable diseases1 ..............................106.......................–0.942..................... 4.06........................2.74 ........................ 5.87
Business impact of communicable diseases1 .......................................91.......................–0.572..................... 4.91........................3.13 ........................ 6.90
Well-being
Stress (% of respondents)7 ..................................................................70.......................–0.250........................ 34.............................8 ........................... 69
Depression (% of respondents)7 ...........................................................95.......................–0.819........................ 17.............................2 ........................... 37
Services
Water, sanitation and hygiene (% with access) .....................................78.........................0.043..................... 85.0........................31.1 ...................... 100.0
Healthcare quality1..............................................................................108.......................–1.070..................... 2.80........................1.78 ........................ 6.75
Healthcare accessibility1 .....................................................................117.......................–1.417..................... 2.93........................2.41 ........................ 6.75
Pillar 3: Workforce and Employment Rank/122 Z-Score Country Value Sample Minimum Sample Maximum
Participation
Labour force participation rate, age 15-64 (%) .....................................94.......................–0.531..................... 64.0........................43.4 ........................ 90.6
Labour force participation rate, age 65+ (%) .........................................28.........................0.647..................... 37.2..........................1.6 ........................ 91.2
Economic participation gender gap2 .....................................................83.......................–0.362................... 0.601......................0.310 ...................... 0.839
Unemployment rate (%) ........................................................................14.........................0.924....................... 3.9..........................0.3 ........................ 32.0
Youth unemployment rate (%) .................................................................9.........................1.193....................... 7.0..........................1.6 ........................ 48.2
Talent
Country capacity to attract talent1 ........................................................87.......................–0.740..................... 2.68........................1.48 ........................ 6.08
Country capacity to retain talent1........................................................104.......................–0.987..................... 2.58........................1.81 ........................ 5.97
Ease of finding skilled employees1 ......................................................105.......................–1.207..................... 3.15........................2.13 ........................ 5.69
Pay related to productivity1 .................................................................103.......................–0.960..................... 3.34........................2.37 ........................ 5.25
Capacity for innovation1........................................................................98.......................–0.766..................... 3.09........................2.31 ........................ 5.84
Index of Economic Complexity3 ............................................................81.......................–0.701................... –0.56......................–1.96 ........................ 2.37
Firm level technology absorption1 .........................................................65.......................–0.184..................... 4.68........................3.17 ........................ 6.23
Scientific and technical journal articles (per 1,000 people) ..................120.......................–0.626................... 0.001......................0.000 ...................... 1.242
Median age of the working population ................................................102.......................–1.166........................ 30...........................28 ........................... 42
Training
Staff training1 ........................................................................................67.......................–0.154..................... 3.95........................2.51 ........................ 5.57
Training services1 ..................................................................................90.......................–0.741..................... 3.72........................2.67 ........................ 6.47
Honduras

2.1: Country Profiles
NOTESIn the sections for Pillar 1, Pillar 2, Pillar 3 and Pillar 4, values under Country Value, Sample Minimum and Sample Maximum refer to underlying data for each variable.For further details and explanations, please refer to the section “How to Read the Country Profiles”.1 Survey data responses on a 1- to 7-scale (1 = worst score, 7 = best score)2 Data on a 0- to 1-scale (0 = worst score, 1 = best score)3 Data from -1.960 (worst score) to 2.367 (best score)4 Rank number on a list of 185 countries5 Index on a scale of 0 (perfect inequality) to 100 (perfect equality)6 International test scores7 Perception survey data. Percentage of yes responses.8 Score (1 = best, 7 = worst)9 Reported in relation to UK score (100)
The Human Capital Report | 229
HondurasPillar 4: Enabling Environment Rank/122 Z-Score Country Value Sample Minimum Sample Maximum
Infrastructure
Mobile users (per 100 people) ..............................................................70.......................–0.091...................... 104...........................17 ......................... 191
Internet users (per 100 people) .............................................................95.......................–0.998........................ 16.............................1 ........................... 95
Quality of domestic transport1 ..............................................................73.......................–0.306 ..................... 4.20 ........................2.08 ........................ 6.51
Collaboration
State of cluster development1 ..............................................................57.........................0.069..................... 3.94........................2.33 ........................ 5.49
Business and university R&D collaboration1 ..........................................75.......................–0.488 ..................... 3.34 ........................2.11 ........................ 5.84
Legal framework
Doing Business Index4 .........................................................................92.......................–0.874...................... 125.............................1 ......................... 180
Social safety net protection1 ...............................................................106.......................–1.048..................... 2.64........................2.10 ........................ 6.26
Intellectual property protection and property rights1..............................96.......................–0.854 ..................... 3.22 ........................1.62 ........................ 6.31
Social mobility
Social mobility1 .....................................................................................75.......................–0.455..................... 3.98........................2.78 ........................ 6.36
Additional indicatorsDemographics Value
Child dependency ratio (%)..................................................................... 62.5Aged dependency ratio (%) ...................................................................... 7.3Fertility rate (births per woman) ................................................................. 3.3Sex ratio at birth (female/male) ............................................................... 0.95Population below age 20 (%) .................................................................. 48.1Population above age 60 (%) .................................................................... 6.2
Education
Public spending on education (% of GDP) ................................................ 3.6Technical/vocational enrolment as % of total
enrolment in secondary school ............................................................—Adult literacy (%) ..................................................................................... 85.1Boys not in primary school (%) .................................................................... 3Girls not in primary school (%) ..................................................................... 2Education poverty (% of children age 17-22
with less than 2-4 years schooling) ................................................ 0.259Private enrolment in primary school (% of primary) ................................... 9.5Private enrolment in secondary school (% of secondary) ........................ 26.9PIRLS6 .......................................................................................................—PISA math scores6 .....................................................................................—PISA reading scores6 ..................................................................................—PISA science scores6 .................................................................................—TIMSS 4th grade math6 ..............................................................................—TIMSS 4th grade science6 ..........................................................................—TIMSS 8th grade math6 ..............................................................................—TIMSS 8th grade science6 ..........................................................................—
Health
Prevalence of visual impairment (%) .......................................................... 4.6Public spending on health (% of GDP) ...................................................... 8.6Business impact of heart disease1 .......................................................... 4.20Business impact of cancer1 .................................................................... 4.09Business impact of mental illness1 .......................................................... 4.62Business impact of diabetes1 ................................................................. 3.52Business impact of chronic respiratory disease1 ..................................... 3.85Business impact of HIV/AIDS1 ................................................................ 4.49Business impact of tuberculosis1 ............................................................ 5.07Business impact of malaria1 ................................................................... 5.16
Society Value
Freedom in the World8................................................................................. 4Democracy Index (rank/165) ...................................................................... 85Population living in urban area (%) .......................................................... 52.7Gini Index (income)5................................................................................ 57.0Accessibility of digital content1 ............................................................... 4.48Extent of virtual social networks use1 ..................................................... 5.25
Workforce
Economic activity (agriculture) — % of total activity ................................ 36.0Economic activity (industry) — % of total activity .................................... 19.5Economic activity (services) — % of total activity .................................... 44.2GDP per person employed (US$) ...............................................................—Cooperation in labour-employer relations1 .............................................. 4.37Emigration rate of the tertiary educated (%) ............................................ 24.8Labour force with tertiary education (%) .....................................................—Number of patent applications (per 1,000 people) .............................. 0.0335Hiring and firing practices1 ...................................................................... 3.46Retirement age, male .................................................................................—Retirement age, female ...............................................................................—Number of informal sector workers (1,000s) ......................................... 1,454Total employed (1,000s) ....................................................................... 3,254Total unemployed (1,000s) ....................................................................... 134Unemployment for 12 months or more
as a % of total unemployment .............................................................—Total youth not in education or employment (1,000s) ........................... 746.2Unemployment for 12 months or more (1,000s) .........................................—Global Innovation Index (rank/142) .......................................................... 107Global Talent Index (rank/60) ......................................................................—Quality of Labour Force (rank/60) ...............................................................—Talent Environment (rank/60) ......................................................................—IQ measure9 ........................................................................................... 81.0

2.1: Country Profiles
230 | The Human Capital Report
Rank/122 Score
Year
s (5
yea
r age
gro
ups)
Percent of total population
0–4
5–9
10–14
15–19
20–24
25–29
30–34
35–39
40–44
45–49
50–54
55–59
60–64
65–69
70–74
75–79
80–84
85–89
90–94
95–99
100+
0 1 2 3 4 55 4 3 2 1 0
HungaryHuman Capital Index 2013 54 0.000
Pillar 1: Education 33 0.530
Pillar 2: Health and wellness 73 –0.064
Pillar 3: Workforce and employment 77 –0.275
Pillar 4: Enabling environment 62 –0.190
Key Indicators
Total population (1,000s) 10,014.6
Median age of population 40
GDP per capita PPP (constant 2005, international $) 17,033
GDP growth (annual %) –1.7
Male Female Additional indicators
n Total population n Total population Aged dependency: 24.4%
n Labour force participation n Labour force participation Youth dependency: 21.3%
n Primary and secondary enrolment n Primary and secondary enrolment Male labour force participation, age 65+: 0.2%
Female labour force participation, age 65+: 0.1%
Education and workforce distribution
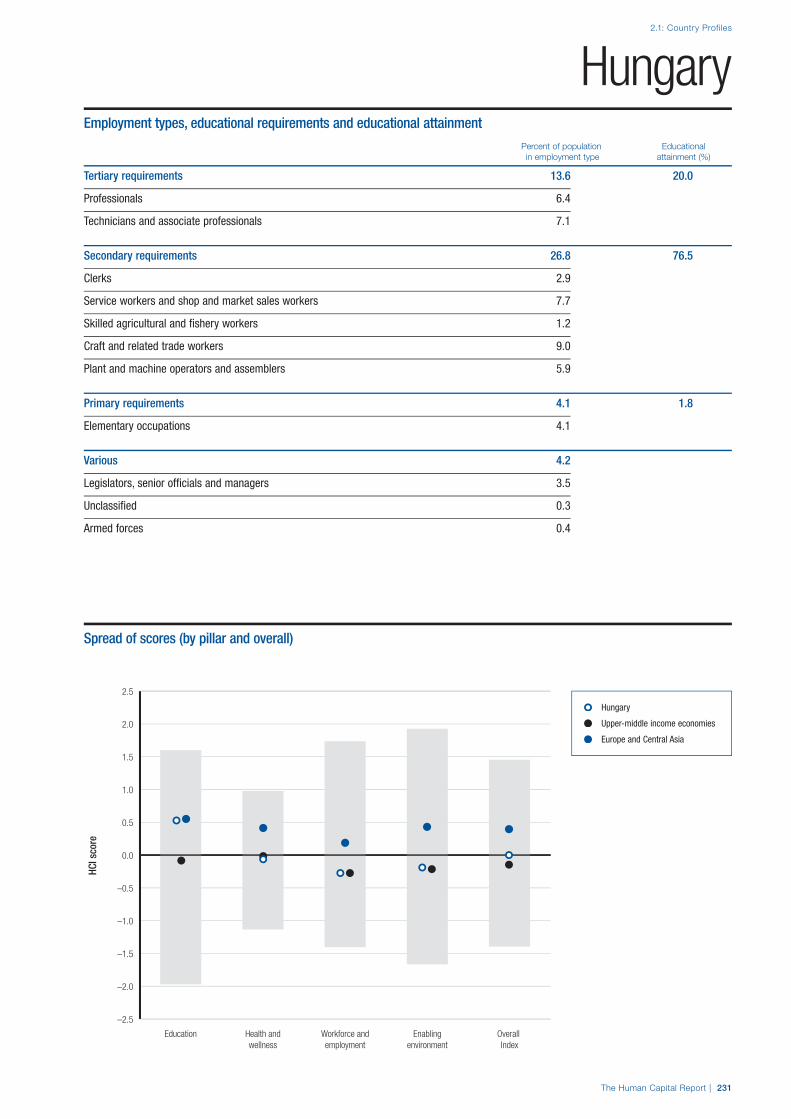
The Human Capital Report | 231
2.1: Country Profiles
HCI s
core
–2.5
–2.0
–1.5
–1.0
–0.5
0.0
0.5
1.0
1.5
2.0
2.5
Overall Index
Enablingenvironment
Workforce andemployment
Health andwellness
Education
HungaryEmployment types, educational requirements and educational attainment
Percent of population Educational in employment type attainment (%)
Tertiary requirements 13.6 20.0
Professionals 6.4
Technicians and associate professionals 7.1
Secondary requirements 26.8 76.5
Clerks 2.9
Service workers and shop and market sales workers 7.7
Skilled agricultural and fishery workers 1.2
Craft and related trade workers 9.0
Plant and machine operators and assemblers 5.9
Primary requirements 4.1 1.8
Elementary occupations 4.1
Various 4.2
Legislators, senior officials and managers 3.5
Unclassified 0.3
Armed forces 0.4
Spread of scores (by pillar and overall)
Hungary
Upper-middle income economies
Europe and Central Asia
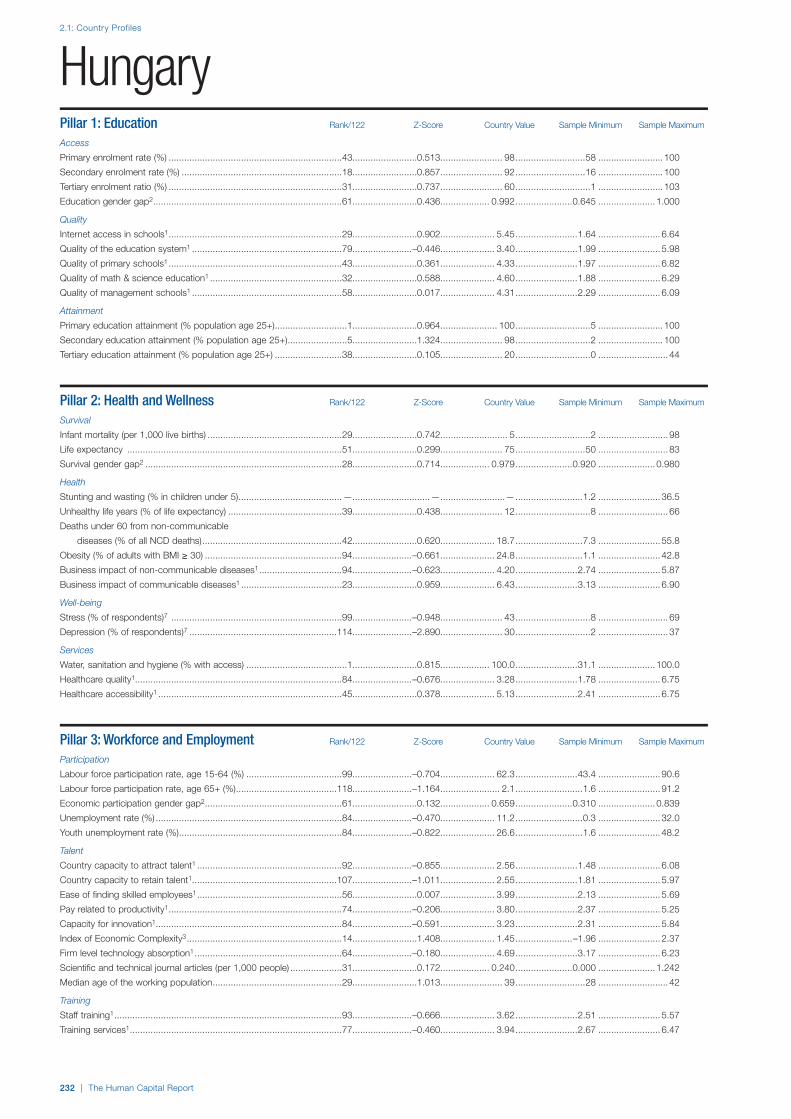
2.1: Country Profiles
232 | The Human Capital Report
Pillar 1: Education Rank/122 Z-Score Country Value Sample Minimum Sample Maximum
Access
Primary enrolment rate (%) ...................................................................43.........................0.513........................ 98...........................58 ......................... 100
Secondary enrolment rate (%) ..............................................................18.........................0.857........................ 92...........................16 ......................... 100
Tertiary enrolment ratio (%) ...................................................................31.........................0.737........................ 60.............................1 ......................... 103
Education gender gap2 .........................................................................61.........................0.436................... 0.992......................0.645 ...................... 1.000
Quality
Internet access in schools1 ...................................................................29.........................0.902..................... 5.45........................1.64 ........................ 6.64
Quality of the education system1 ..........................................................79.......................–0.446..................... 3.40........................1.99 ........................ 5.98
Quality of primary schools1 ...................................................................43.........................0.361..................... 4.33........................1.97 ........................ 6.82
Quality of math & science education1 ...................................................32.........................0.588..................... 4.60........................1.88 ........................ 6.29
Quality of management schools1 ..........................................................58.........................0.017..................... 4.31........................2.29 ........................ 6.09
Attainment
Primary education attainment (% population age 25+) ............................1.........................0.964...................... 100.............................5 ......................... 100
Secondary education attainment (% population age 25+) .......................5.........................1.324........................ 98.............................2 ......................... 100
Tertiary education attainment (% population age 25+) ..........................38.........................0.105........................ 20.............................0 ........................... 44
Pillar 2: Health and Wellness Rank/122 Z-Score Country Value Sample Minimum Sample Maximum
Survival
Infant mortality (per 1,000 live births) ....................................................29.........................0.742.......................... 5.............................2 ........................... 98
Life expectancy ...................................................................................51.........................0.299........................ 75...........................50 ........................... 83
Survival gender gap2 ............................................................................28.........................0.714................... 0.979......................0.920 ...................... 0.980
Health
Stunting and wasting (% in children under 5) ........................................—..............................— .........................— ..........................1.2 ........................ 36.5
Unhealthy life years (% of life expectancy) ............................................39.........................0.438........................ 12.............................8 ........................... 66
Deaths under 60 from non-communicable
diseases (% of all NCD deaths) ......................................................42.........................0.620 ..................... 18.7 ..........................7.3 ........................ 55.8
Obesity (% of adults with BMI ≥ 30) .....................................................94.......................–0.661..................... 24.8..........................1.1 ........................ 42.8
Business impact of non-communicable diseases1 ................................94.......................–0.623..................... 4.20........................2.74 ........................ 5.87
Business impact of communicable diseases1 .......................................23.........................0.959..................... 6.43........................3.13 ........................ 6.90
Well-being
Stress (% of respondents)7 ..................................................................99.......................–0.948........................ 43.............................8 ........................... 69
Depression (% of respondents)7 .........................................................114.......................–2.890........................ 30.............................2 ........................... 37
Services
Water, sanitation and hygiene (% with access) .......................................1.........................0.815................... 100.0........................31.1 ...................... 100.0
Healthcare quality1................................................................................84.......................–0.676..................... 3.28........................1.78 ........................ 6.75
Healthcare accessibility1 .......................................................................45.........................0.378..................... 5.13........................2.41 ........................ 6.75
Pillar 3: Workforce and Employment Rank/122 Z-Score Country Value Sample Minimum Sample Maximum
Participation
Labour force participation rate, age 15-64 (%) .....................................99.......................–0.704..................... 62.3........................43.4 ........................ 90.6
Labour force participation rate, age 65+ (%) .......................................118.......................–1.164....................... 2.1..........................1.6 ........................ 91.2
Economic participation gender gap2 .....................................................61.........................0.132................... 0.659......................0.310 ...................... 0.839
Unemployment rate (%) ........................................................................84.......................–0.470..................... 11.2..........................0.3 ........................ 32.0
Youth unemployment rate (%) ...............................................................84.......................–0.822..................... 26.6..........................1.6 ........................ 48.2
Talent
Country capacity to attract talent1 ........................................................92.......................–0.855..................... 2.56........................1.48 ........................ 6.08
Country capacity to retain talent1........................................................107.......................–1.011..................... 2.55........................1.81 ........................ 5.97
Ease of finding skilled employees1 ........................................................56.........................0.007..................... 3.99........................2.13 ........................ 5.69
Pay related to productivity1 ...................................................................74.......................–0.206..................... 3.80........................2.37 ........................ 5.25
Capacity for innovation1........................................................................84.......................–0.591..................... 3.23........................2.31 ........................ 5.84
Index of Economic Complexity3 ............................................................14.........................1.408..................... 1.45......................–1.96 ........................ 2.37
Firm level technology absorption1 .........................................................64.......................–0.180..................... 4.69........................3.17 ........................ 6.23
Scientific and technical journal articles (per 1,000 people) ....................31.........................0.172................... 0.240......................0.000 ...................... 1.242
Median age of the working population ..................................................29.........................1.013........................ 39...........................28 ........................... 42
Training
Staff training1 ........................................................................................93.......................–0.666..................... 3.62........................2.51 ........................ 5.57
Training services1 ..................................................................................77.......................–0.460..................... 3.94........................2.67 ........................ 6.47
Hungary

2.1: Country Profiles
NOTESIn the sections for Pillar 1, Pillar 2, Pillar 3 and Pillar 4, values under Country Value, Sample Minimum and Sample Maximum refer to underlying data for each variable.For further details and explanations, please refer to the section “How to Read the Country Profiles”.1 Survey data responses on a 1- to 7-scale (1 = worst score, 7 = best score)2 Data on a 0- to 1-scale (0 = worst score, 1 = best score)3 Data from -1.960 (worst score) to 2.367 (best score)4 Rank number on a list of 185 countries5 Index on a scale of 0 (perfect inequality) to 100 (perfect equality)6 International test scores7 Perception survey data. Percentage of yes responses.8 Score (1 = best, 7 = worst)9 Reported in relation to UK score (100)
The Human Capital Report | 233
HungaryPillar 4: Enabling Environment Rank/122 Z-Score Country Value Sample Minimum Sample Maximum
Infrastructure
Mobile users (per 100 people) ..............................................................43.........................0.300...................... 117...........................17 ......................... 191
Internet users (per 100 people) .............................................................39.........................0.541........................ 59.............................1 ........................... 95
Quality of domestic transport1 ..............................................................87.......................–0.573 ..................... 3.97 ........................2.08 ........................ 6.51
Collaboration
State of cluster development1 ..............................................................98.......................–0.869..................... 3.27........................2.33 ........................ 5.49
Business and university R&D collaboration1 ..........................................38.........................0.538 ..................... 4.26 ........................2.11 ........................ 5.84
Legal framework
Doing Business Index4 .........................................................................47.........................0.503........................ 54.............................1 ......................... 180
Social safety net protection1 .................................................................96.......................–0.825..................... 2.89........................2.10 ........................ 6.26
Intellectual property protection and property rights1..............................69.......................–0.307 ..................... 3.78 ........................1.62 ........................ 6.31
Social mobility
Social mobility1 ...................................................................................104.......................–1.017..................... 3.47........................2.78 ........................ 6.36
Additional indicatorsDemographics Value
Child dependency ratio (%)..................................................................... 21.3Aged dependency ratio (%) .................................................................... 24.4Fertility rate (births per woman) ................................................................. 1.3Sex ratio at birth (female/male) ............................................................... 0.94Population below age 20 (%) .................................................................. 20.6Population above age 60 (%) .................................................................. 22.6
Education
Public spending on education (% of GDP) ................................................ 4.9Technical/vocational enrolment as % of total
enrolment in secondary school ........................................................... 16Adult literacy (%) ..................................................................................... 99.0Boys not in primary school (%) .................................................................... 3Girls not in primary school (%) ..................................................................... 2Education poverty (% of children age 17-22
with less than 2-4 years schooling) ......................................................—Private enrolment in primary school (% of primary) ................................... 9.2Private enrolment in secondary school (% of secondary) ........................ 13.4PIRLS6 .................................................................................................... 539PISA math scores6 .................................................................................. 490PISA reading scores6 ............................................................................... 494PISA science scores6 .............................................................................. 503TIMSS 4th grade math6 ........................................................................... 515TIMSS 4th grade science6 ....................................................................... 534TIMSS 8th grade math6 ........................................................................... 505TIMSS 8th grade science6 ....................................................................... 522
Health
Prevalence of visual impairment (%) .......................................................... 2.0Public spending on health (% of GDP) ...................................................... 7.7Business impact of heart disease1 .......................................................... 3.80Business impact of cancer1 .................................................................... 3.69Business impact of mental illness1 .......................................................... 4.28Business impact of diabetes1 ................................................................. 4.35Business impact of chronic respiratory disease1 ..................................... 4.88Business impact of HIV/AIDS1 ................................................................ 6.32Business impact of tuberculosis1 ............................................................ 6.18Business impact of malaria1 ................................................................... 6.78
Society Value
Freedom in the World8................................................................................. 1Democracy Index (rank/165) ...................................................................... 49Population living in urban area (%) .......................................................... 69.9Gini Index (income)5................................................................................ 31.2Accessibility of digital content1 ............................................................... 6.09Extent of virtual social networks use1 ..................................................... 5.57
Workforce
Economic activity (agriculture) — % of total activity .................................. 4.8Economic activity (industry) — % of total activity .................................... 30.7Economic activity (services) — % of total activity .................................... 64.3GDP per person employed (US$) ....................................................... 20,889Cooperation in labour-employer relations1 .............................................. 4.17Emigration rate of the tertiary educated (%) ............................................ 12.8Labour force with tertiary education (%) ................................................. 23.9Number of patent applications (per 1,000 people) .............................. 0.0697Hiring and firing practices1 ...................................................................... 4.14Retirement age, male ................................................................................ 65Retirement age, female .............................................................................. 65Number of informal sector workers (1,000s) ...............................................—Total employed (1,000s) ....................................................................... 3,781Total unemployed (1,000s) ....................................................................... 475Unemployment for 12 months or more
as a % of total unemployment ......................................................... 50.2Total youth not in education or employment (1,000s) ........................... 156.9Unemployment for 12 months or more (1,000s) ................................... 238.3Global Innovation Index (rank/142) ............................................................ 31Global Talent Index (rank/60) ..................................................................... 30Quality of Labour Force (rank/60) .............................................................. 32Talent Environment (rank/60) ..................................................................... 28IQ measure9 ........................................................................................... 98.2

2.1: Country Profiles
234 | The Human Capital Report
Rank/122 Score
Year
s (5
yea
r age
gro
ups)
Percent of total population
0–4
5–9
10–14
15–19
20–24
25–29
30–34
35–39
40–44
45–49
50–54
55–59
60–64
65–69
70–74
75–79
80–84
85–89
90–94
95–99
100+
0 1 2 3 4 55 4 3 2 1 0
IcelandHuman Capital Index 2013 14 0.957
Pillar 1: Education 8 1.075
Pillar 2: Health and wellness 5 0.900
Pillar 3: Workforce and employment 16 0.826
Pillar 4: Enabling environment 20 1.026
Key Indicators
Total population (1,000s) 318.0
Median age of population 35
GDP per capita PPP (constant 2005, international $) 34,029
GDP growth (annual %) 1.6
Male Female Additional indicators
n Total population n Total population Aged dependency: 18.1%
n Labour force participation n Labour force participation Youth dependency: 31.3%
n Primary and secondary enrolment n Primary and secondary enrolment Male labour force participation, age 65+: 1.2%
Female labour force participation, age 65+: 0.9%
Education and workforce distribution

The Human Capital Report | 235
2.1: Country Profiles
HCI s
core
–2.5
–2.0
–1.5
–1.0
–0.5
0.0
0.5
1.0
1.5
2.0
2.5
Overall Index
Enablingenvironment
Workforce andemployment
Health andwellness
Education
IcelandEmployment types, educational requirements and educational attainment
Percent of population Educational in employment type attainment (%)
Tertiary requirements 18.8 27.6
Professionals 10.1
Technicians and associate professionals 8.8
Secondary requirements 34.7 61.8
Clerks 5.1
Service workers and shop and market sales workers 12.7
Skilled agricultural and fishery workers 3.7
Craft and related trade workers 9.1
Plant and machine operators and assemblers 4.1
Primary requirements 5.0 n/a
Elementary occupations 5.0
Various 5.6
Legislators, senior officials and managers 5.1
Unclassified 0.6
Armed forces n/a
Spread of scores (by pillar and overall)
Iceland
High-income economies
Europe and Central Asia

2.1: Country Profiles
236 | The Human Capital Report
Pillar 1: Education Rank/122 Z-Score Country Value Sample Minimum Sample Maximum
Access
Primary enrolment rate (%) ...................................................................27.........................0.667........................ 99...........................58 ......................... 100
Secondary enrolment rate (%) ..............................................................30.........................0.703........................ 88...........................16 ......................... 100
Tertiary enrolment ratio (%) ...................................................................10.........................1.445........................ 79.............................1 ......................... 103
Education gender gap2 ...........................................................................1.........................0.548................... 1.000......................0.645 ...................... 1.000
Quality
Internet access in schools1 .....................................................................1.........................1.853..................... 6.64........................1.64 ........................ 6.64
Quality of the education system1 ..........................................................16.........................1.434..................... 5.08........................1.99 ........................ 5.98
Quality of primary schools1 ...................................................................14.........................1.337..................... 5.39........................1.97 ........................ 6.82
Quality of math & science education1 ...................................................20.........................0.891..................... 4.89........................1.88 ........................ 6.29
Quality of management schools1 ..........................................................21.........................1.094..................... 5.21........................2.29 ........................ 6.09
Attainment
Primary education attainment (% population age 25+) ..........................—..............................— .........................— .............................5 ......................... 100
Secondary education attainment (% population age 25+) .....................18.........................1.064........................ 91.............................2 ......................... 100
Tertiary education attainment (% population age 25+) ..........................22.........................0.791........................ 28.............................0 ........................... 44
Pillar 2: Health and Wellness Rank/122 Z-Score Country Value Sample Minimum Sample Maximum
Survival
Infant mortality (per 1,000 live births) ......................................................1.........................0.877.......................... 2.............................2 ........................... 98
Life expectancy .....................................................................................3.........................1.150........................ 82...........................50 ........................... 83
Survival gender gap2 ............................................................................88.......................–0.127................... 0.970......................0.920 ...................... 0.980
Health
Stunting and wasting (% in children under 5) ........................................—..............................— .........................— ..........................1.2 ........................ 36.5
Unhealthy life years (% of life expectancy) ..............................................5.........................0.811 ........................ 10 .............................8 ........................... 66
Deaths under 60 from non-communicable
diseases (% of all NCD deaths) ........................................................6.........................1.312 ....................... 9.9 ..........................7.3 ........................ 55.8
Obesity (% of adults with BMI ≥ 30) .....................................................73.......................–0.355 ..................... 21.9 ..........................1.1 ........................ 42.8
Business impact of non-communicable diseases1 ..................................4.........................1.882 ..................... 5.33 ........................2.74 ........................ 5.87
Business impact of communicable diseases1 .........................................5.........................1.275 ..................... 6.74 ........................3.13 ........................ 6.90
Well-being
Stress (% of respondents)7 ..................................................................50.........................0.060........................ 30.............................8 ........................... 69
Depression (% of respondents)7 ...........................................................12.........................1.093.......................... 5.............................2 ........................... 37
Services
Water, sanitation and hygiene (% with access) .......................................1.........................0.815................... 100.0........................31.1 ...................... 100.0
Healthcare quality1................................................................................14.........................1.452..................... 5.88........................1.78 ........................ 6.75
Healthcare accessibility1 .......................................................................13.........................1.451..................... 6.44........................2.41 ........................ 6.75
Pillar 3: Workforce and Employment Rank/122 Z-Score Country Value Sample Minimum Sample Maximum
Participation
Labour force participation rate, age 15-64 (%) .......................................8.........................1.483..................... 83.7........................43.4 ........................ 90.6
Labour force participation rate, age 65+ (%) .........................................49.......................–0.096..................... 22.8..........................1.6 ........................ 91.2
Economic participation gender gap2 .....................................................24.........................0.937................... 0.754......................0.310 ...................... 0.839
Unemployment rate (%) ........................................................................58.........................0.225....................... 7.6..........................0.3 ........................ 32.0
Youth unemployment rate (%) ...............................................................50.........................0.247..................... 16.2..........................1.6 ........................ 48.2
Talent
Country capacity to attract talent1 ........................................................58.......................–0.024..................... 3.41........................1.48 ........................ 6.08
Country capacity to retain talent1..........................................................22.........................0.937..................... 4.44........................1.81 ........................ 5.97
Ease of finding skilled employees1 ..........................................................6.........................1.602..................... 5.10........................2.13 ........................ 5.69
Pay related to productivity1 ...................................................................53.........................0.242..................... 4.07........................2.37 ........................ 5.25
Capacity for innovation1........................................................................29.........................0.561..................... 4.15........................2.31 ........................ 5.84
Index of Economic Complexity3 ............................................................—..............................— .........................— ......................–1.96 ........................ 2.37
Firm level technology absorption1 ...........................................................2.........................1.927 ..................... 6.19 ........................3.17 ........................ 6.23
Scientific and technical journal articles (per 1,000 people) ....................11.........................2.113 ................... 0.821 ......................0.000 ...................... 1.242
Median age of the working population ..................................................41.........................0.754 ........................ 38 ...........................28 ........................... 42
Training
Staff training1 ........................................................................................22.........................0.950..................... 4.66........................2.51 ........................ 5.57
Training services1 ..................................................................................34.........................0.524..................... 4.72........................2.67 ........................ 6.47
Iceland

2.1: Country Profiles
NOTESIn the sections for Pillar 1, Pillar 2, Pillar 3 and Pillar 4, values under Country Value, Sample Minimum and Sample Maximum refer to underlying data for each variable.For further details and explanations, please refer to the section “How to Read the Country Profiles”.1 Survey data responses on a 1- to 7-scale (1 = worst score, 7 = best score)2 Data on a 0- to 1-scale (0 = worst score, 1 = best score)3 Data from -1.960 (worst score) to 2.367 (best score)4 Rank number on a list of 185 countries5 Index on a scale of 0 (perfect inequality) to 100 (perfect equality)6 International test scores7 Perception survey data. Percentage of yes responses.8 Score (1 = best, 7 = worst)9 Reported in relation to UK score (100)
The Human Capital Report | 237
IcelandPillar 4: Enabling Environment Rank/122 Z-Score Country Value Sample Minimum Sample Maximum
Infrastructure
Mobile users (per 100 people) ..............................................................65.......................–0.029...................... 106...........................17 ......................... 191
Internet users (per 100 people) ...............................................................1.........................1.827........................ 95.............................1 ........................... 95
Quality of domestic transport1 ..............................................................22.........................0.882 ..................... 5.24 ........................2.08 ........................ 6.51
Collaboration
State of cluster development1 ..............................................................51.........................0.199..................... 4.03........................2.33 ........................ 5.49
Business and university R&D collaboration1 ..........................................23.........................1.099 ..................... 4.77 ........................2.11 ........................ 5.84
Legal framework
Doing Business Index4 .........................................................................13.........................1.279........................ 14.............................1 ......................... 180
Social safety net protection1 .................................................................16.........................1.434..................... 5.34........................2.10 ........................ 6.26
Intellectual property protection and property rights1..............................28.........................0.894 ..................... 5.00 ........................1.62 ........................ 6.31
Social mobility
Social mobility1 .....................................................................................10.........................1.650..................... 5.88........................2.78 ........................ 6.36
Additional indicatorsDemographics Value
Child dependency ratio (%)..................................................................... 31.3Aged dependency ratio (%) .................................................................... 18.1Fertility rate (births per woman) ................................................................. 2.1Sex ratio at birth (female/male) ............................................................... 0.96Population below age 20 (%) .................................................................. 28.3Population above age 60 (%) .................................................................. 17.0
Education
Public spending on education (% of GDP) ................................................ 7.8Technical/vocational enrolment as % of total
enrolment in secondary school ........................................................... 21Adult literacy (%) .........................................................................................—Boys not in primary school (%) .................................................................... 1Girls not in primary school (%) ..................................................................... 1Education poverty (% of children age 17-22
with less than 2-4 years schooling) ......................................................—Private enrolment in primary school (% of primary) ................................... 2.0Private enrolment in secondary school (% of secondary) ........................ 12.3PIRLS6 .......................................................................................................—PISA math scores6 .................................................................................. 507PISA reading scores6 ............................................................................... 500PISA science scores6 .............................................................................. 496TIMSS 4th grade math6 ..............................................................................—TIMSS 4th grade science6 ..........................................................................—TIMSS 8th grade math6 ..............................................................................—TIMSS 8th grade science6 ..........................................................................—
Health
Prevalence of visual impairment (%) .......................................................... 0.8Public spending on health (% of GDP) ...................................................... 9.1Business impact of heart disease1 .......................................................... 5.07Business impact of cancer1 .................................................................... 4.95Business impact of mental illness1 .......................................................... 5.52Business impact of diabetes1 ................................................................. 5.38Business impact of chronic respiratory disease1 ..................................... 5.71Business impact of HIV/AIDS1 ................................................................ 6.52Business impact of tuberculosis1 ............................................................ 6.77Business impact of malaria1 ................................................................... 6.94
Society Value
Freedom in the World8................................................................................. 1Democracy Index (rank/165) ........................................................................ 3Population living in urban area (%) .......................................................... 93.8Gini Index (income)5....................................................................................—Accessibility of digital content1 ............................................................... 6.55Extent of virtual social networks use1 ..................................................... 6.67
Workforce
Economic activity (agriculture) — % of total activity .................................. 5.5Economic activity (industry) — % of total activity .................................... 18.1Economic activity (services) — % of total activity .................................... 75.2GDP per person employed (US$) ....................................................... 44,647Cooperation in labour-employer relations1 .............................................. 5.47Emigration rate of the tertiary educated (%) ............................................ 21.0Labour force with tertiary education (%) ................................................. 29.5Number of patent applications (per 1,000 people) .............................. 0.2232Hiring and firing practices1 ...................................................................... 5.32Retirement age, male ................................................................................ 68Retirement age, female .............................................................................. 66Number of informal sector workers (1,000s) ...............................................—Total employed (1,000s) .......................................................................... 167Total unemployed (1,000s) ......................................................................... 14Unemployment for 12 months or more
as a % of total unemployment ......................................................... 20.4Total youth not in education or employment (1,000s) ............................... 3.9Unemployment for 12 months or more (1,000s) ....................................... 2.8Global Innovation Index (rank/142) ............................................................ 13Global Talent Index (rank/60) ......................................................................—Quality of Labour Force (rank/60) ...............................................................—Talent Environment (rank/60) ......................................................................—IQ measure9 ........................................................................................... 98.4

2.1: Country Profiles
238 | The Human Capital Report
Rank/122 Score
Year
s (5
yea
r age
gro
ups)
Percent of total population
0–4
5–9
10–14
15–19
20–24
25–29
30–34
35–39
40–44
45–49
50–54
55–59
60–64
65–69
70–74
75–79
80–84
85–89
90–94
95–99
100+
0 1 2 3 4 5 66 5 4 3 2 1 0
IndiaHuman Capital Index 2013 78 –0.270
Pillar 1: Education 63 0.020
Pillar 2: Health and wellness 112 –0.868
Pillar 3: Workforce and employment 49 0.005
Pillar 4: Enabling environment 67 –0.239
Key Indicators
Total population (1,000s) 1,205,625.0
Median age of population 25
GDP per capita PPP (constant 2005, international $) 3,341
GDP growth (annual %) 3.2
Male Female Additional indicators
n Total population n Total population Aged dependency: 7.8%
n Labour force participation n Labour force participation Youth dependency: 46.6%
n Primary and secondary enrolment n Primary and secondary enrolment Male labour force participation, age 65+: n/a
Female labour force participation, age 65+: n/a
Education and workforce distribution
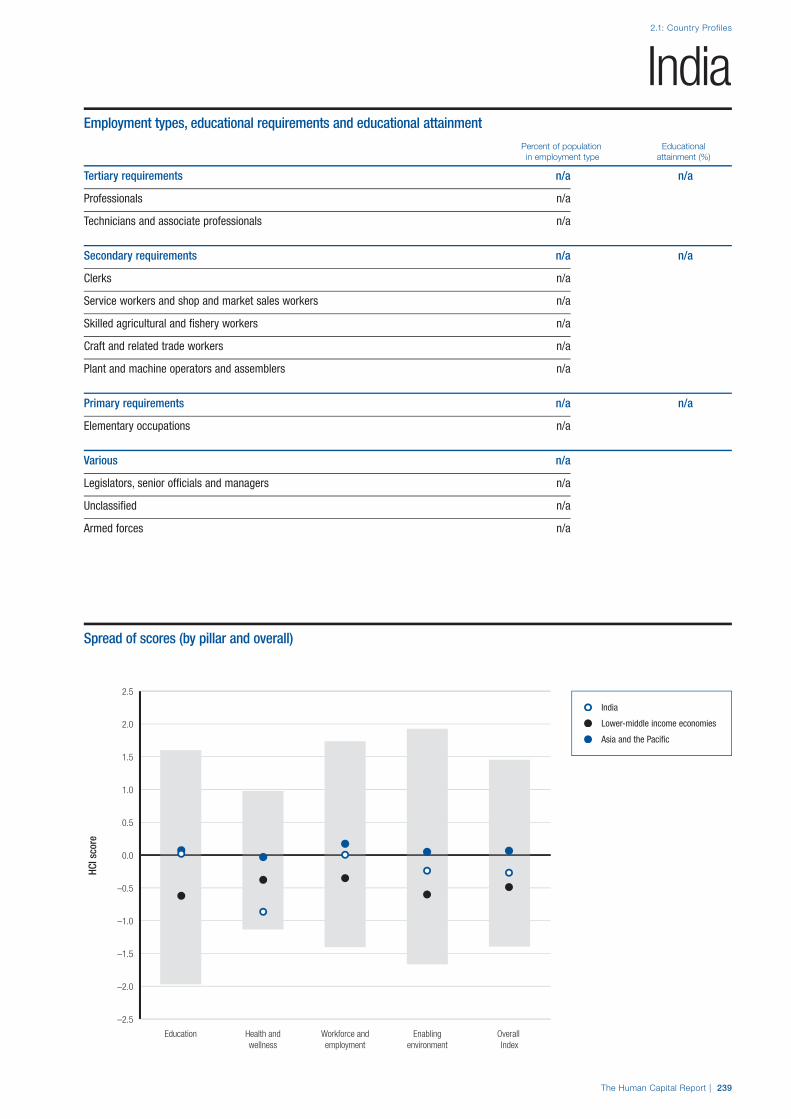
The Human Capital Report | 239
2.1: Country Profiles
HCI s
core
–2.5
–2.0
–1.5
–1.0
–0.5
0.0
0.5
1.0
1.5
2.0
2.5
Overall Index
Enablingenvironment
Workforce andemployment
Health andwellness
Education
IndiaEmployment types, educational requirements and educational attainment
Percent of population Educational in employment type attainment (%)
Tertiary requirements n/a n/a
Professionals n/a
Technicians and associate professionals n/a
Secondary requirements n/a n/a
Clerks n/a
Service workers and shop and market sales workers n/a
Skilled agricultural and fishery workers n/a
Craft and related trade workers n/a
Plant and machine operators and assemblers n/a
Primary requirements n/a n/a
Elementary occupations n/a
Various n/a
Legislators, senior officials and managers n/a
Unclassified n/a
Armed forces n/a
Spread of scores (by pillar and overall)
India
Lower-middle income economies
Asia and the Pacific

2.1: Country Profiles
240 | The Human Capital Report
Pillar 1: Education Rank/122 Z-Score Country Value Sample Minimum Sample Maximum
Access
Primary enrolment rate (%) ...................................................................32.........................0.623........................ 99...........................58 ......................... 100
Secondary enrolment rate (%) ..............................................................—..............................— .........................— ...........................16 ......................... 100
Tertiary enrolment ratio (%) ...................................................................85.......................–0.863........................ 18.............................1 ......................... 103
Education gender gap2 .......................................................................107.......................–1.405................... 0.852......................0.645 ...................... 1.000
Quality
Internet access in schools1 ...................................................................67.......................–0.185..................... 4.09........................1.64 ........................ 6.64
Quality of the education system1 ..........................................................28.........................0.673..................... 4.40........................1.99 ........................ 5.98
Quality of primary schools1 ...................................................................69.......................–0.265..................... 3.65........................1.97 ........................ 6.82
Quality of math & science education1 ...................................................27.........................0.703..................... 4.71........................1.88 ........................ 6.29
Quality of management schools1 ..........................................................29.........................0.878..................... 5.03........................2.29 ........................ 6.09
Attainment
Primary education attainment (% population age 25+) ..........................—..............................— .........................— .............................5 ......................... 100
Secondary education attainment (% population age 25+) .....................—..............................— .........................— .............................2 ......................... 100
Tertiary education attainment (% population age 25+) ..........................—..............................— .........................— .............................0 ........................... 44
Pillar 2: Health and Wellness Rank/122 Z-Score Country Value Sample Minimum Sample Maximum
Survival
Infant mortality (per 1,000 live births) ..................................................104.......................–1.143........................ 47.............................2 ........................... 98
Life expectancy .................................................................................101.......................–0.917........................ 65...........................50 ........................... 83
Survival gender gap2 ..........................................................................117.......................–3.498................... 0.931......................0.920 ...................... 0.980
Health
Stunting and wasting (% in children under 5) ........................................78.......................–2.123..................... 34.0..........................1.2 ........................ 36.5
Unhealthy life years (% of life expectancy) ............................................67.........................0.131........................ 14.............................8 ........................... 66
Deaths under 60 from non-communicable
diseases (% of all NCD deaths) ......................................................89.......................–0.693 ..................... 35.4 ..........................7.3 ........................ 55.8
Obesity (% of adults with BMI ≥ 30) .......................................................5.........................1.756....................... 1.9..........................1.1 ........................ 42.8
Business impact of non-communicable diseases1 ..............................109.......................–1.173..................... 3.95........................2.74 ........................ 5.87
Business impact of communicable diseases1 .......................................93.......................–0.778..................... 4.70........................3.13 ........................ 6.90
Well-being
Stress (% of respondents)7 ..................................................................42.........................0.215........................ 28.............................8 ........................... 69
Depression (% of respondents)7 .........................................................103.......................–1.456........................ 21.............................2 ........................... 37
Services
Water, sanitation and hygiene (% with access) ...................................101.......................–1.068..................... 63.3........................31.1 ...................... 100.0
Healthcare quality1................................................................................77.......................–0.614..................... 3.36........................1.78 ........................ 6.75
Healthcare accessibility1 .......................................................................89.......................–0.791..................... 3.70........................2.41 ........................ 6.75
Pillar 3: Workforce and Employment Rank/122 Z-Score Country Value Sample Minimum Sample Maximum
Participation
Labour force participation rate, age 15-64 (%) ...................................105.......................–1.175..................... 57.7........................43.4 ........................ 90.6
Labour force participation rate, age 65+ (%) .........................................42.........................0.204..................... 28.6..........................1.6 ........................ 91.2
Economic participation gender gap2 ...................................................107.......................–1.568................... 0.459......................0.310 ...................... 0.839
Unemployment rate (%) ........................................................................74.......................–0.107....................... 9.3..........................0.3 ........................ 32.0
Youth unemployment rate (%) ...............................................................22.........................0.833..................... 10.5..........................1.6 ........................ 48.2
Talent
Country capacity to attract talent1 ........................................................45.........................0.271..................... 3.72........................1.48 ........................ 6.08
Country capacity to retain talent1..........................................................45.........................0.253..................... 3.78........................1.81 ........................ 5.97
Ease of finding skilled employees1 ........................................................24.........................0.914..................... 4.62........................2.13 ........................ 5.69
Pay related to productivity1 ...................................................................52.........................0.245..................... 4.07........................2.37 ........................ 5.25
Capacity for innovation1........................................................................37.........................0.319..................... 3.96........................2.31 ........................ 5.84
Index of Economic Complexity3 ............................................................47.........................0.127..................... 0.23......................–1.96 ........................ 2.37
Firm level technology absorption1 .........................................................45.........................0.327..................... 5.05........................3.17 ........................ 6.23
Scientific and technical journal articles (per 1,000 people) ....................76.......................–0.574................... 0.016......................0.000 ...................... 1.242
Median age of the working population ..................................................75.......................–0.390........................ 33...........................28 ........................... 42
Training
Staff training1 ........................................................................................47.........................0.183..................... 4.16........................2.51 ........................ 5.57
Training services1 ..................................................................................43.........................0.225..................... 4.48........................2.67 ........................ 6.47
India

2.1: Country Profiles
NOTESIn the sections for Pillar 1, Pillar 2, Pillar 3 and Pillar 4, values under Country Value, Sample Minimum and Sample Maximum refer to underlying data for each variable.For further details and explanations, please refer to the section “How to Read the Country Profiles”.1 Survey data responses on a 1- to 7-scale (1 = worst score, 7 = best score)2 Data on a 0- to 1-scale (0 = worst score, 1 = best score)3 Data from -1.960 (worst score) to 2.367 (best score)4 Rank number on a list of 185 countries5 Index on a scale of 0 (perfect inequality) to 100 (perfect equality)6 International test scores7 Perception survey data. Percentage of yes responses.8 Score (1 = best, 7 = worst)9 Reported in relation to UK score (100)
The Human Capital Report | 241
IndiaPillar 4: Enabling Environment Rank/122 Z-Score Country Value Sample Minimum Sample Maximum
Infrastructure
Mobile users (per 100 people) ............................................................105.......................–1.031........................ 72...........................17 ......................... 191
Internet users (per 100 people) ...........................................................105.......................–1.206........................ 10.............................1 ........................... 95
Quality of domestic transport1 ..............................................................46.........................0.256..................... 4.69........................2.08 ........................ 6.51
Collaboration
State of cluster development1 ..............................................................14.........................1.389..................... 4.88........................2.33 ........................ 5.49
Business and university R&D collaboration1 ..........................................42.........................0.238 ..................... 4.00 ........................2.11 ........................ 5.84
Legal framework
Doing Business Index4 .........................................................................98.......................–1.009...................... 132.............................1 ......................... 180
Social safety net protection1 ...............................................................105.......................–1.027..................... 2.67........................2.10 ........................ 6.26
Intellectual property protection and property rights1..............................56.......................–0.061 ..................... 4.03 ........................1.62 ........................ 6.31
Social mobility
Social mobility1 .....................................................................................39.........................0.298..................... 4.66........................2.78 ........................ 6.36
Additional indicatorsDemographics Value
Child dependency ratio (%)..................................................................... 46.6Aged dependency ratio (%) ...................................................................... 7.8Fertility rate (births per woman) ................................................................. 2.7Sex ratio at birth (female/male) ............................................................... 0.89Population below age 20 (%) .................................................................. 39.9Population above age 60 (%) .................................................................... 7.7
Education
Public spending on education (% of GDP) ................................................ 3.3Technical/vocational enrolment as % of total
enrolment in secondary school ............................................................. 1Adult literacy (%) ..................................................................................... 62.8Boys not in primary school (%) .................................................................... 1Girls not in primary school (%) ..................................................................... 1Education poverty (% of children age 17-22
with less than 2-4 years schooling) ................................................ 0.439Private enrolment in primary school (% of primary) ................................. 17.0Private enrolment in secondary school (% of secondary) ........................ 41.9PIRLS6 .......................................................................................................—PISA math scores6 .....................................................................................—PISA reading scores6 ..................................................................................—PISA science scores6 .................................................................................—TIMSS 4th grade math6 ..............................................................................—TIMSS 4th grade science6 ..........................................................................—TIMSS 8th grade math6 ..............................................................................—TIMSS 8th grade science6 ..........................................................................—
Health
Prevalence of visual impairment (%) .......................................................... 7.7Public spending on health (% of GDP) ...................................................... 3.9Business impact of heart disease1 .......................................................... 3.54Business impact of cancer1 .................................................................... 4.09Business impact of mental illness1 .......................................................... 4.65Business impact of diabetes1 ................................................................. 3.55Business impact of chronic respiratory disease1 ..................................... 3.96Business impact of HIV/AIDS1 ................................................................ 4.81Business impact of tuberculosis1 ............................................................ 4.74Business impact of malaria1 ................................................................... 4.56
Society Value
Freedom in the World8................................................................................. 2Democracy Index (rank/165) ...................................................................... 38Population living in urban area (%) .......................................................... 31.7Gini Index (income)5................................................................................ 33.9Accessibility of digital content1 ............................................................... 4.83Extent of virtual social networks use1 ..................................................... 5.35
Workforce
Economic activity (agriculture) — % of total activity ................................ 51.1Economic activity (industry) — % of total activity .................................... 22.4Economic activity (services) — % of total activity .................................... 26.6GDP per person employed (US$) ......................................................... 8,939Cooperation in labour-employer relations1 .............................................. 4.40Emigration rate of the tertiary educated (%) .............................................. 4.3Labour force with tertiary education (%) ................................................... 9.8Number of patent applications (per 1,000 people) .............................. 0.0351Hiring and firing practices1 ...................................................................... 4.14Retirement age, male ...........................................................................58-60Retirement age, female .........................................................................58-60Number of informal sector workers (1,000s) ..................................... 185,876Total employed (1,000s) .............................................................................—Total unemployed (1,000s) .................................................................. 39,112Unemployment for 12 months or more
as a % of total unemployment .............................................................—Total youth not in education or employment (1,000s) .................................—Unemployment for 12 months or more (1,000s) .........................................—Global Innovation Index (rank/142) ............................................................ 66Global Talent Index (rank/60) ..................................................................... 35Quality of Labour Force (rank/60) .............................................................. 22Talent Environment (rank/60) ..................................................................... 45IQ measure9 ........................................................................................... 82.6

2.1: Country Profiles
242 | The Human Capital Report
Rank/122 Score
Year
s (5
yea
r age
gro
ups)
Percent of total population
0–4
5–9
10–14
15–19
20–24
25–29
30–34
35–39
40–44
45–49
50–54
55–59
60–64
65–69
70–74
75–79
80–84
85–89
90–94
95–99
100+
0 1 2 3 4 55 4 3 2 1 0
IndonesiaHuman Capital Index 2013 53 0.001
Pillar 1: Education 61 0.040
Pillar 2: Health and wellness 84 –0.215
Pillar 3: Workforce and employment 32 0.262
Pillar 4: Enabling environment 58 –0.082
Key Indicators
Total population (1,000s) 240,676.5
Median age of population 27
GDP per capita PPP (constant 2005, international $) 4,272
GDP growth (annual %) 6.2
Male Female Additional indicators
n Total population n Total population Aged dependency: 7.7%
n Labour force participation n Labour force participation Youth dependency: 45.8%
n Primary and secondary enrolment n Primary and secondary enrolment Male labour force participation, age 65+: 1.3%
Female labour force participation, age 65+: 0.8%
Education and workforce distribution
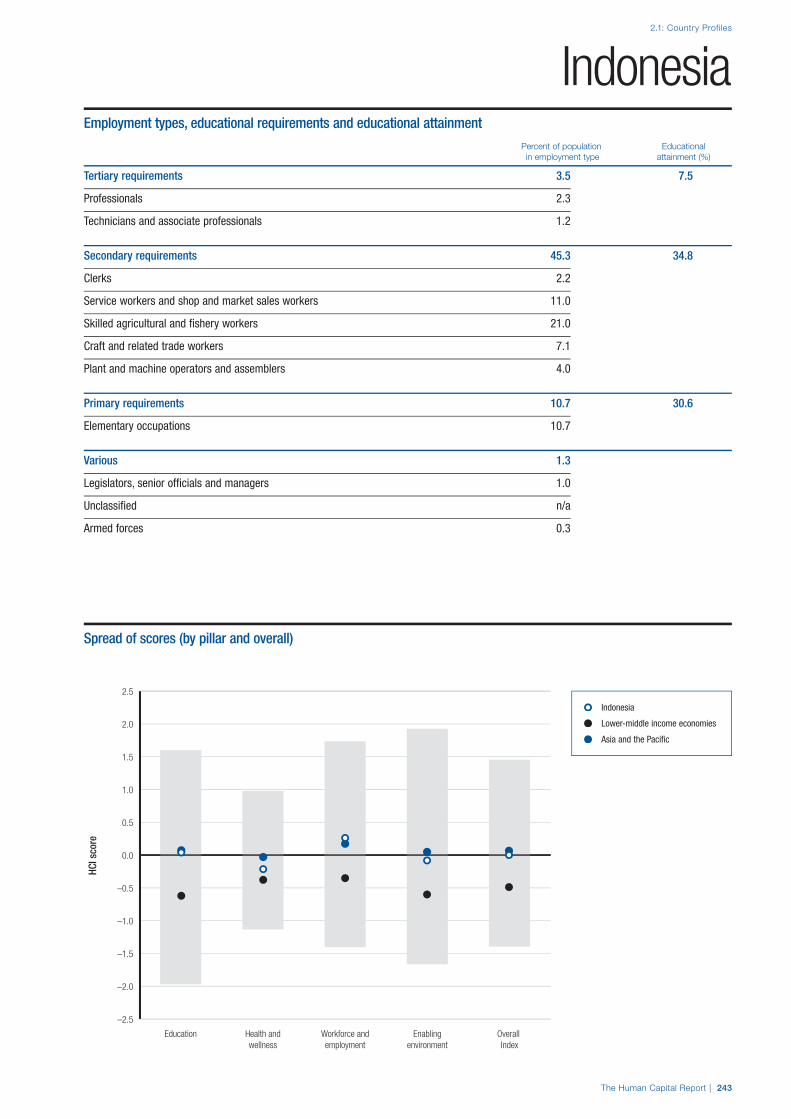
The Human Capital Report | 243
2.1: Country Profiles
HCI s
core
–2.5
–2.0
–1.5
–1.0
–0.5
0.0
0.5
1.0
1.5
2.0
2.5
Overall Index
Enablingenvironment
Workforce andemployment
Health andwellness
Education
IndonesiaEmployment types, educational requirements and educational attainment
Percent of population Educational in employment type attainment (%)
Tertiary requirements 3.5 7.5
Professionals 2.3
Technicians and associate professionals 1.2
Secondary requirements 45.3 34.8
Clerks 2.2
Service workers and shop and market sales workers 11.0
Skilled agricultural and fishery workers 21.0
Craft and related trade workers 7.1
Plant and machine operators and assemblers 4.0
Primary requirements 10.7 30.6
Elementary occupations 10.7
Various 1.3
Legislators, senior officials and managers 1.0
Unclassified n/a
Armed forces 0.3
Spread of scores (by pillar and overall)
Indonesia
Lower-middle income economies
Asia and the Pacific

2.1: Country Profiles
244 | The Human Capital Report
Pillar 1: Education Rank/122 Z-Score Country Value Sample Minimum Sample Maximum
Access
Primary enrolment rate (%) ...................................................................28.........................0.664........................ 99...........................58 ......................... 100
Secondary enrolment rate (%) ..............................................................61.........................0.093........................ 74...........................16 ......................... 100
Tertiary enrolment ratio (%) ...................................................................77.......................–0.596........................ 25.............................1 ......................... 103
Education gender gap2 .........................................................................85.........................0.196................... 0.973......................0.645 ...................... 1.000
Quality
Internet access in schools1 ...................................................................46.........................0.359..................... 4.77........................1.64 ........................ 6.64
Quality of the education system1 ..........................................................30.........................0.595..................... 4.33........................1.99 ........................ 5.98
Quality of primary schools1 ...................................................................46.........................0.306..................... 4.27........................1.97 ........................ 6.82
Quality of math & science education1 ...................................................29.........................0.651..................... 4.66........................1.88 ........................ 6.29
Quality of management schools1 ..........................................................47.........................0.184..................... 4.45........................2.29 ........................ 6.09
Attainment
Primary education attainment (% population age 25+) ..........................49.......................–0.159........................ 73.............................5 ......................... 100
Secondary education attainment (% population age 25+) .....................64.......................–0.781........................ 42.............................2 ......................... 100
Tertiary education attainment (% population age 25+) ..........................72.......................–1.036.......................... 8.............................0 ........................... 44
Pillar 2: Health and Wellness Rank/122 Z-Score Country Value Sample Minimum Sample Maximum
Survival
Infant mortality (per 1,000 live births) ....................................................86.......................–0.156........................ 25.............................2 ........................... 98
Life expectancy ...................................................................................88.......................–0.430........................ 69...........................50 ........................... 83
Survival gender gap2 ............................................................................95.......................–0.416................... 0.966......................0.920 ...................... 0.980
Health
Stunting and wasting (% in children under 5) ........................................72.......................–1.383..................... 27.5..........................1.2 ........................ 36.5
Unhealthy life years (% of life expectancy) ............................................51.........................0.264........................ 13.............................8 ........................... 66
Deaths under 60 from non-communicable
diseases (% of all NCD deaths) ......................................................78.......................–0.308 ..................... 30.5 ..........................7.3 ........................ 55.8
Obesity (% of adults with BMI ≥ 30) .....................................................12.........................1.460....................... 4.7..........................1.1 ........................ 42.8
Business impact of non-communicable diseases1 ..............................119.......................–2.064..................... 3.55........................2.74 ........................ 5.87
Business impact of communicable diseases1 .....................................109.......................–1.546..................... 3.94........................3.13 ........................ 6.90
Well-being
Stress (% of respondents)7 ....................................................................2.........................1.610........................ 10.............................8 ........................... 69
Depression (% of respondents)7 .............................................................1.........................1.571.......................... 2.............................2 ........................... 37
Services
Water, sanitation and hygiene (% with access) .....................................91.......................–0.641..................... 71.6........................31.1 ...................... 100.0
Healthcare quality1................................................................................63.......................–0.271..................... 3.78........................1.78 ........................ 6.75
Healthcare accessibility1 .......................................................................84.......................–0.704..................... 3.80........................2.41 ........................ 6.75
Pillar 3: Workforce and Employment Rank/122 Z-Score Country Value Sample Minimum Sample Maximum
Participation
Labour force participation rate, age 15-64 (%) .....................................61.........................0.052..................... 69.7........................43.4 ........................ 90.6
Labour force participation rate, age 65+ (%) .........................................25.........................0.776..................... 39.7..........................1.6 ........................ 91.2
Economic participation gender gap2 .....................................................90.......................–0.667................... 0.565......................0.310 ...................... 0.839
Unemployment rate (%) ........................................................................46.........................0.305....................... 7.1..........................0.3 ........................ 32.0
Youth unemployment rate (%) ...............................................................70.......................–0.370..................... 22.2..........................1.6 ........................ 48.2
Talent
Country capacity to attract talent1 ........................................................22.........................0.846..................... 4.31........................1.48 ........................ 6.08
Country capacity to retain talent1..........................................................35.........................0.552..................... 4.07........................1.81 ........................ 5.97
Ease of finding skilled employees1 ........................................................39.........................0.466..................... 4.31........................2.13 ........................ 5.69
Pay related to productivity1 ...................................................................24.........................0.841..................... 4.44........................2.37 ........................ 5.25
Capacity for innovation1........................................................................23.........................0.867..................... 4.39........................2.31 ........................ 5.84
Index of Economic Complexity3 ............................................................57.......................–0.148................... –0.03......................–1.96 ........................ 2.37
Firm level technology absorption1 .........................................................43.........................0.373..................... 5.08........................3.17 ........................ 6.23
Scientific and technical journal articles (per 1,000 people) ..................116.......................–0.625................... 0.001......................0.000 ...................... 1.242
Median age of the working population ..................................................61.......................–0.139........................ 34...........................28 ........................... 42
Training
Staff training1 ........................................................................................23.........................0.859..................... 4.60........................2.51 ........................ 5.57
Training services1 ..................................................................................44.........................0.197..................... 4.46........................2.67 ........................ 6.47
Indonesia

2.1: Country Profiles
NOTESIn the sections for Pillar 1, Pillar 2, Pillar 3 and Pillar 4, values under Country Value, Sample Minimum and Sample Maximum refer to underlying data for each variable.For further details and explanations, please refer to the section “How to Read the Country Profiles”.1 Survey data responses on a 1- to 7-scale (1 = worst score, 7 = best score)2 Data on a 0- to 1-scale (0 = worst score, 1 = best score)3 Data from -1.960 (worst score) to 2.367 (best score)4 Rank number on a list of 185 countries5 Index on a scale of 0 (perfect inequality) to 100 (perfect equality)6 International test scores7 Perception survey data. Percentage of yes responses.8 Score (1 = best, 7 = worst)9 Reported in relation to UK score (100)
The Human Capital Report | 245
IndonesiaPillar 4: Enabling Environment Rank/122 Z-Score Country Value Sample Minimum Sample Maximum
Infrastructure
Mobile users (per 100 people) ..............................................................72.......................–0.117...................... 103...........................17 ......................... 191
Internet users (per 100 people) .............................................................92.......................–0.923........................ 18.............................1 ........................... 95
Quality of domestic transport1 ..............................................................79.......................–0.414 ..................... 4.11 ........................2.08 ........................ 6.51
Collaboration
State of cluster development1 ..............................................................26.........................0.750..................... 4.43........................2.33 ........................ 5.49
Business and university R&D collaboration1 ..........................................28.........................0.789 ..................... 4.49 ........................2.11 ........................ 5.84
Legal framework
Doing Business Index4 .........................................................................94.......................–0.932...................... 128.............................1 ......................... 180
Social safety net protection1 .................................................................41.........................0.281..................... 4.09........................2.10 ........................ 6.26
Intellectual property protection and property rights1..............................59.......................–0.103 ..................... 3.98 ........................1.62 ........................ 6.31
Social mobility
Social mobility1 .....................................................................................61.......................–0.072..................... 4.32........................2.78 ........................ 6.36
Additional indicatorsDemographics Value
Child dependency ratio (%)..................................................................... 45.8Aged dependency ratio (%) ...................................................................... 7.7Fertility rate (births per woman) ................................................................. 2.5Sex ratio at birth (female/male) ............................................................... 0.95Population below age 20 (%) .................................................................. 38.5Population above age 60 (%) .................................................................... 7.6
Education
Public spending on education (% of GDP) ................................................ 2.8Technical/vocational enrolment as % of total
enrolment in secondary school ........................................................... 18Adult literacy (%) ..................................................................................... 92.8Boys not in primary school (%) .................................................................... 2Girls not in primary school (%) ..................................................................... 7Education poverty (% of children age 17-22
with less than 2-4 years schooling) ................................................ 0.059Private enrolment in primary school (% of primary) ................................. 17.1Private enrolment in secondary school (% of secondary) ........................ 41.4PIRLS6 .................................................................................................... 428PISA math scores6 .................................................................................. 371PISA reading scores6 ............................................................................... 402PISA science scores6 .............................................................................. 383TIMSS 4th grade math6 ..............................................................................—TIMSS 4th grade science6 ..........................................................................—TIMSS 8th grade math6 ........................................................................... 386TIMSS 8th grade science6 ....................................................................... 406
Health
Prevalence of visual impairment (%) .......................................................... 4.5Public spending on health (% of GDP) ...................................................... 2.7Business impact of heart disease1 .......................................................... 3.44Business impact of cancer1 .................................................................... 3.39Business impact of mental illness1 .......................................................... 3.76Business impact of diabetes1 ................................................................. 3.40Business impact of chronic respiratory disease1 ..................................... 3.79Business impact of HIV/AIDS1 ................................................................ 3.79Business impact of tuberculosis1 ............................................................ 3.79Business impact of malaria1 ................................................................... 4.24
Society Value
Freedom in the World8................................................................................. 2Democracy Index (rank/165) ...................................................................... 53Population living in urban area (%) .......................................................... 51.4Gini Index (income)5................................................................................ 38.1Accessibility of digital content1 ............................................................... 4.87Extent of virtual social networks use1 ..................................................... 5.92
Workforce
Economic activity (agriculture) — % of total activity ................................ 35.9Economic activity (industry) — % of total activity .................................... 20.6Economic activity (services) — % of total activity .................................... 43.5GDP per person employed (US$) ....................................................... 11,037Cooperation in labour-employer relations1 .............................................. 4.56Emigration rate of the tertiary educated (%) .............................................. 2.9Labour force with tertiary education (%) ................................................... 7.1Number of patent applications (per 1,000 people) .............................. 0.0243Hiring and firing practices1 ...................................................................... 4.27Retirement age, male .................................................................................—Retirement age, female ...............................................................................—Number of informal sector workers (1,000s) ...............................................—Total employed (1,000s) ................................................................... 108,208Total unemployed (1,000s) .................................................................... 8,320Unemployment for 12 months or more
as a % of total unemployment .............................................................—Total youth not in education or employment (1,000s) ...................... 10,535.4Unemployment for 12 months or more (1,000s) .........................................—Global Innovation Index (rank/142) ............................................................ 85Global Talent Index (rank/60) ..................................................................... 58Quality of Labour Force (rank/60) .............................................................. 54Talent Environment (rank/60) ..................................................................... 56IQ measure9 ........................................................................................... 85.8

2.1: Country Profiles
246 | The Human Capital Report
Rank/122 Score
Year
s (5
yea
r age
gro
ups)
Percent of total population
0–4
5–9
10–14
15–19
20–24
25–29
30–34
35–39
40–44
45–49
50–54
55–59
60–64
65–69
70–74
75–79
80–84
85–89
90–94
95–99
100+
0 1 2 3 4 5 6 7 88 7 6 5 4 3 2 1 0
Iran, Islamic Rep.Human Capital Index 2013 94 –0.487
Pillar 1: Education 68 –0.051
Pillar 2: Health and wellness 87 –0.274
Pillar 3: Workforce and employment 119 –1.059
Pillar 4: Enabling environment 88 –0.564
Key Indicators
Total population (1,000s) 74,462.3
Median age of population 27
GDP per capita PPP (constant 2005, international $) 10,405
GDP growth (annual %) 1.8
Male Female Additional indicators
n Total population n Total population Aged dependency: 7.2%
n Labour force participation n Labour force participation Youth dependency: 33.2%
n Primary and secondary enrolment n Primary and secondary enrolment Male labour force participation, age 65+: 0.8%
Female labour force participation, age 65+: 0.1%
Education and workforce distribution
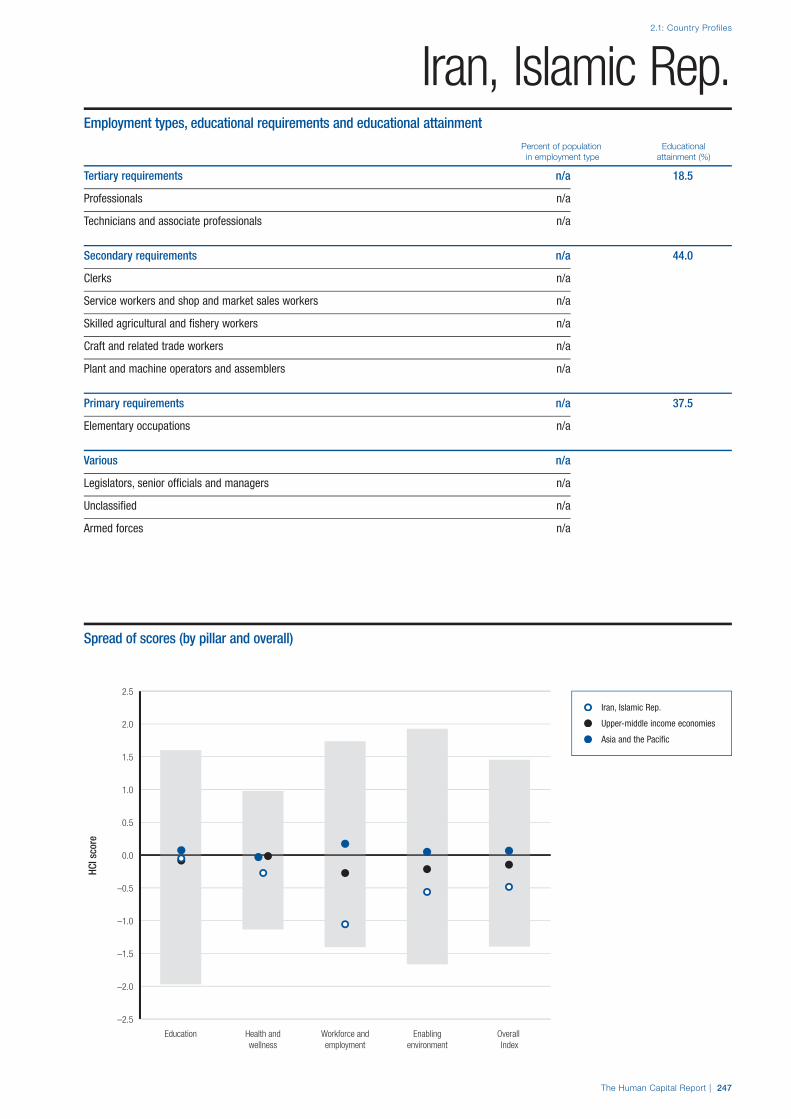
The Human Capital Report | 247
2.1: Country Profiles
HCI s
core
–2.5
–2.0
–1.5
–1.0
–0.5
0.0
0.5
1.0
1.5
2.0
2.5
Overall Index
Enablingenvironment
Workforce andemployment
Health andwellness
Education
Iran, Islamic Rep.Employment types, educational requirements and educational attainment
Percent of population Educational in employment type attainment (%)
Tertiary requirements n/a 18.5
Professionals n/a
Technicians and associate professionals n/a
Secondary requirements n/a 44.0
Clerks n/a
Service workers and shop and market sales workers n/a
Skilled agricultural and fishery workers n/a
Craft and related trade workers n/a
Plant and machine operators and assemblers n/a
Primary requirements n/a 37.5
Elementary occupations n/a
Various n/a
Legislators, senior officials and managers n/a
Unclassified n/a
Armed forces n/a
Spread of scores (by pillar and overall)
Iran, Islamic Rep.
Upper-middle income economies
Asia and the Pacific
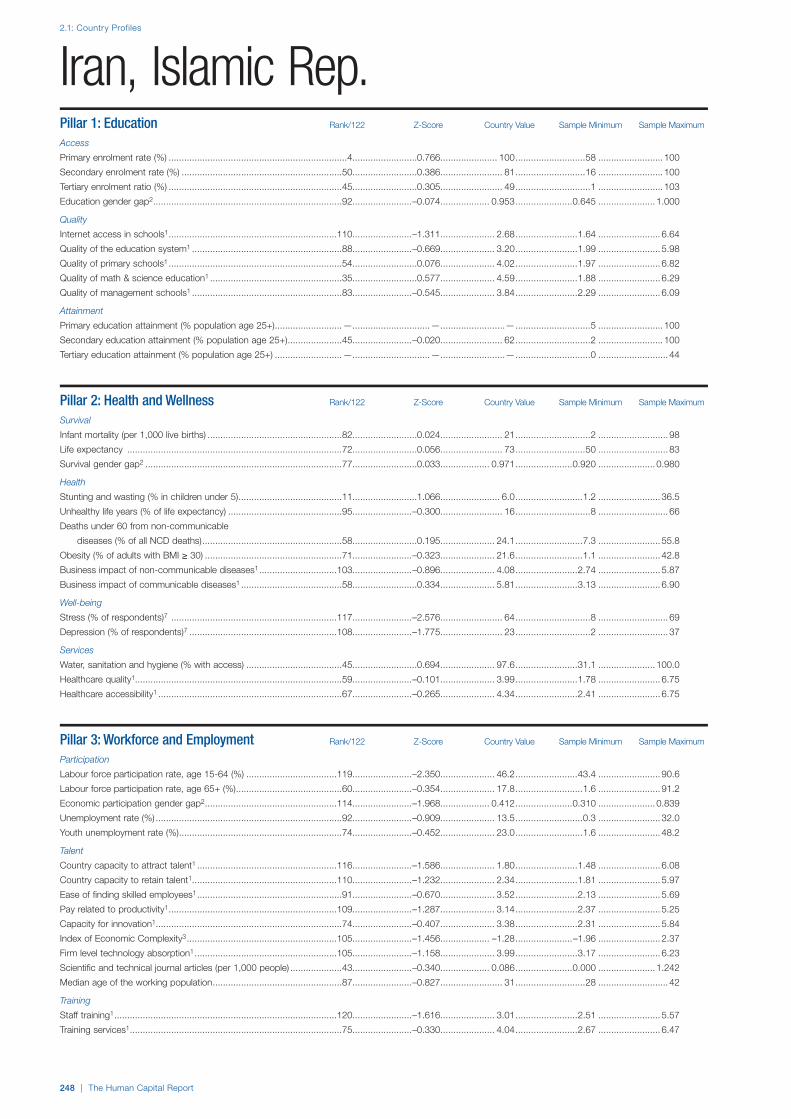
2.1: Country Profiles
248 | The Human Capital Report
Pillar 1: Education Rank/122 Z-Score Country Value Sample Minimum Sample Maximum
Access
Primary enrolment rate (%) .....................................................................4.........................0.766...................... 100...........................58 ......................... 100
Secondary enrolment rate (%) ..............................................................50.........................0.386........................ 81...........................16 ......................... 100
Tertiary enrolment ratio (%) ...................................................................45.........................0.305........................ 49.............................1 ......................... 103
Education gender gap2 .........................................................................92.......................–0.074................... 0.953......................0.645 ...................... 1.000
Quality
Internet access in schools1 .................................................................110.......................–1.311..................... 2.68........................1.64 ........................ 6.64
Quality of the education system1 ..........................................................88.......................–0.669..................... 3.20........................1.99 ........................ 5.98
Quality of primary schools1 ...................................................................54.........................0.076..................... 4.02........................1.97 ........................ 6.82
Quality of math & science education1 ...................................................35.........................0.577..................... 4.59........................1.88 ........................ 6.29
Quality of management schools1 ..........................................................83.......................–0.545..................... 3.84........................2.29 ........................ 6.09
Attainment
Primary education attainment (% population age 25+) ..........................—..............................— .........................— .............................5 ......................... 100
Secondary education attainment (% population age 25+) .....................45.......................–0.020........................ 62.............................2 ......................... 100
Tertiary education attainment (% population age 25+) ..........................—..............................— .........................— .............................0 ........................... 44
Pillar 2: Health and Wellness Rank/122 Z-Score Country Value Sample Minimum Sample Maximum
Survival
Infant mortality (per 1,000 live births) ....................................................82.........................0.024........................ 21.............................2 ........................... 98
Life expectancy ...................................................................................72.........................0.056........................ 73...........................50 ........................... 83
Survival gender gap2 ............................................................................77.........................0.033................... 0.971......................0.920 ...................... 0.980
Health
Stunting and wasting (% in children under 5) ........................................11.........................1.066....................... 6.0..........................1.2 ........................ 36.5
Unhealthy life years (% of life expectancy) ............................................95.......................–0.300........................ 16.............................8 ........................... 66
Deaths under 60 from non-communicable
diseases (% of all NCD deaths) ......................................................58.........................0.195 ..................... 24.1 ..........................7.3 ........................ 55.8
Obesity (% of adults with BMI ≥ 30) .....................................................71.......................–0.323..................... 21.6..........................1.1 ........................ 42.8
Business impact of non-communicable diseases1 ..............................103.......................–0.896..................... 4.08........................2.74 ........................ 5.87
Business impact of communicable diseases1 .......................................58.........................0.334..................... 5.81........................3.13 ........................ 6.90
Well-being
Stress (% of respondents)7 ................................................................117.......................–2.576........................ 64.............................8 ........................... 69
Depression (% of respondents)7 .........................................................108.......................–1.775........................ 23.............................2 ........................... 37
Services
Water, sanitation and hygiene (% with access) .....................................45.........................0.694..................... 97.6........................31.1 ...................... 100.0
Healthcare quality1................................................................................59.......................–0.101..................... 3.99........................1.78 ........................ 6.75
Healthcare accessibility1 .......................................................................67.......................–0.265..................... 4.34........................2.41 ........................ 6.75
Pillar 3: Workforce and Employment Rank/122 Z-Score Country Value Sample Minimum Sample Maximum
Participation
Labour force participation rate, age 15-64 (%) ...................................119.......................–2.350..................... 46.2........................43.4 ........................ 90.6
Labour force participation rate, age 65+ (%) .........................................60.......................–0.354..................... 17.8..........................1.6 ........................ 91.2
Economic participation gender gap2 ...................................................114.......................–1.968................... 0.412......................0.310 ...................... 0.839
Unemployment rate (%) ........................................................................92.......................–0.909..................... 13.5..........................0.3 ........................ 32.0
Youth unemployment rate (%) ...............................................................74.......................–0.452..................... 23.0..........................1.6 ........................ 48.2
Talent
Country capacity to attract talent1 ......................................................116.......................–1.586..................... 1.80........................1.48 ........................ 6.08
Country capacity to retain talent1........................................................110.......................–1.232..................... 2.34........................1.81 ........................ 5.97
Ease of finding skilled employees1 ........................................................91.......................–0.670..................... 3.52........................2.13 ........................ 5.69
Pay related to productivity1 .................................................................109.......................–1.287..................... 3.14........................2.37 ........................ 5.25
Capacity for innovation1........................................................................74.......................–0.407..................... 3.38........................2.31 ........................ 5.84
Index of Economic Complexity3 ..........................................................105.......................–1.456................... –1.28......................–1.96 ........................ 2.37
Firm level technology absorption1 .......................................................105.......................–1.158..................... 3.99........................3.17 ........................ 6.23
Scientific and technical journal articles (per 1,000 people) ....................43.......................–0.340................... 0.086......................0.000 ...................... 1.242
Median age of the working population ..................................................87.......................–0.827........................ 31...........................28 ........................... 42
Training
Staff training1 ......................................................................................120.......................–1.616..................... 3.01........................2.51 ........................ 5.57
Training services1 ..................................................................................75.......................–0.330..................... 4.04........................2.67 ........................ 6.47
Iran, Islamic Rep.

2.1: Country Profiles
NOTESIn the sections for Pillar 1, Pillar 2, Pillar 3 and Pillar 4, values under Country Value, Sample Minimum and Sample Maximum refer to underlying data for each variable.For further details and explanations, please refer to the section “How to Read the Country Profiles”.1 Survey data responses on a 1- to 7-scale (1 = worst score, 7 = best score)2 Data on a 0- to 1-scale (0 = worst score, 1 = best score)3 Data from -1.960 (worst score) to 2.367 (best score)4 Rank number on a list of 185 countries5 Index on a scale of 0 (perfect inequality) to 100 (perfect equality)6 International test scores7 Perception survey data. Percentage of yes responses.8 Score (1 = best, 7 = worst)9 Reported in relation to UK score (100)
The Human Capital Report | 249
Iran, Islamic Rep.Pillar 4: Enabling Environment Rank/122 Z-Score Country Value Sample Minimum Sample Maximum
Infrastructure
Mobile users (per 100 people) ............................................................102.......................–0.945........................ 75...........................17 ......................... 191
Internet users (per 100 people) .............................................................87.......................–0.816........................ 21.............................1 ........................... 95
Quality of domestic transport1 ..............................................................44.........................0.324..................... 4.75........................2.08 ........................ 6.51
Collaboration
State of cluster development1 ..............................................................87.......................–0.636..................... 3.44........................2.33 ........................ 5.49
Business and university R&D collaboration1 ..........................................79.......................–0.516 ..................... 3.32 ........................2.11 ........................ 5.84
Legal framework
Doing Business Index4 .......................................................................106.......................–1.261...................... 145.............................1 ......................... 180
Social safety net protection1 .................................................................50.........................0.012..................... 3.80........................2.10 ........................ 6.26
Intellectual property protection and property rights1..............................79.......................–0.539 ..................... 3.54 ........................1.62 ........................ 6.31
Social mobility
Social mobility1 .....................................................................................89.......................–0.700..................... 3.76........................2.78 ........................ 6.36
Additional indicatorsDemographics Value
Child dependency ratio (%)..................................................................... 33.2Aged dependency ratio (%) ...................................................................... 7.2Fertility rate (births per woman) ................................................................. 1.9Sex ratio at birth (female/male) ............................................................... 0.95Population below age 20 (%) .................................................................. 33.3Population above age 60 (%) .................................................................... 7.4
Education
Public spending on education (% of GDP) ................................................ 4.7Technical/vocational enrolment as % of total
enrolment in secondary school ........................................................... 11Adult literacy (%) ..................................................................................... 85.0Boys not in primary school (%) .................................................................... 1Girls not in primary school (%) ..................................................................... 4Education poverty (% of children age 17-22
with less than 2-4 years schooling) ......................................................—Private enrolment in primary school (% of primary) ................................... 7.3Private enrolment in secondary school (% of secondary) ........................ 11.9PIRLS6 .................................................................................................... 457PISA math scores6 .....................................................................................—PISA reading scores6 ..................................................................................—PISA science scores6 .................................................................................—TIMSS 4th grade math6 ........................................................................... 431TIMSS 4th grade science6 ....................................................................... 453TIMSS 8th grade math6 ........................................................................... 415TIMSS 8th grade science6 ....................................................................... 474
Health
Prevalence of visual impairment (%) .......................................................... 3.5Public spending on health (% of GDP) ...................................................... 6.0Business impact of heart disease1 .......................................................... 3.75Business impact of cancer1 .................................................................... 4.03Business impact of mental illness1 .......................................................... 4.15Business impact of diabetes1 ................................................................. 4.28Business impact of chronic respiratory disease1 ..................................... 4.18Business impact of HIV/AIDS1 ................................................................ 5.52Business impact of tuberculosis1 ............................................................ 5.75Business impact of malaria1 ................................................................... 6.16
Society Value
Freedom in the World8................................................................................. 6Democracy Index (rank/165) .................................................................... 158Population living in urban area (%) .......................................................... 69.2Gini Index (income)5................................................................................ 38.3Accessibility of digital content1 ............................................................... 3.87Extent of virtual social networks use1 ..................................................... 3.33
Workforce
Economic activity (agriculture) — % of total activity ................................ 21.2Economic activity (industry) — % of total activity .................................... 32.2Economic activity (services) — % of total activity .................................... 46.5GDP per person employed (US$) ....................................................... 15,915Cooperation in labour-employer relations1 .............................................. 3.67Emigration rate of the tertiary educated (%) ............................................ 14.3Labour force with tertiary education (%) ................................................. 18.8Number of patent applications (per 1,000 people) .............................. 0.0877Hiring and firing practices1 ...................................................................... 3.43Retirement age, male .................................................................................—Retirement age, female ...............................................................................—Number of informal sector workers (1,000s) ...............................................—Total employed (1,000s) ..................................................................... 20,657Total unemployed (1,000s) .................................................................... 3,218Unemployment for 12 months or more
as a % of total unemployment ......................................................... 33.2Total youth not in education or employment (1,000s) ........................ 5,330.0Unemployment for 12 months or more (1,000s) ................................ 1,068.0Global Innovation Index (rank/142) .......................................................... 113Global Talent Index (rank/60) ..................................................................... 55Quality of Labour Force (rank/60) .............................................................. 52Talent Environment (rank/60) ..................................................................... 55IQ measure9 ........................................................................................... 85.6

2.1: Country Profiles
250 | The Human Capital Report
Rank/122 Score
Year
s (5
yea
r age
gro
ups)
Percent of total population
0–4
5–9
10–14
15–19
20–24
25–29
30–34
35–39
40–44
45–49
50–54
55–59
60–64
65–69
70–74
75–79
80–84
85–89
90–94
95–99
100+
0 1 2 3 4 55 4 3 2 1 0
IrelandHuman Capital Index 2013 20 0.824
Pillar 1: Education 9 1.033
Pillar 2: Health and wellness 25 0.516
Pillar 3: Workforce and employment 22 0.645
Pillar 4: Enabling environment 19 1.103
Key Indicators
Total population (1,000s) 4,467.6
Median age of population 34
GDP per capita PPP (constant 2005, international $) 36,755
GDP growth (annual %) 0.9
Male Female Additional indicators
n Total population n Total population Aged dependency: 16.8%
n Labour force participation n Labour force participation Youth dependency: 31.7%
n Primary and secondary enrolment n Primary and secondary enrolment Male labour force participation, age 65+: 0.7%
Female labour force participation, age 65+: 0.3%
Education and workforce distribution

The Human Capital Report | 251
2.1: Country Profiles
HCI s
core
–2.5
–2.0
–1.5
–1.0
–0.5
0.0
0.5
1.0
1.5
2.0
2.5
Overall Index
Enablingenvironment
Workforce andemployment
Health andwellness
Education
IrelandEmployment types, educational requirements and educational attainment
Percent of population Educational in employment type attainment (%)
Tertiary requirements 13.8 32.2
Professionals 10.0
Technicians and associate professionals 3.7
Secondary requirements 31.5 35.8
Clerks 7.5
Service workers and shop and market sales workers 10.5
Skilled agricultural and fishery workers 0.4
Craft and related trade workers 8.6
Plant and machine operators and assemblers 4.4
Primary requirements 5.5 18.4
Elementary occupations 5.5
Various 9.0
Legislators, senior officials and managers 8.8
Unclassified n/a
Armed forces 0.2
Spread of scores (by pillar and overall)
Ireland
High-income economies
Europe and Central Asia

2.1: Country Profiles
252 | The Human Capital Report
Pillar 1: Education Rank/122 Z-Score Country Value Sample Minimum Sample Maximum
Access
Primary enrolment rate (%) .....................................................................9.........................0.748...................... 100...........................58 ......................... 100
Secondary enrolment rate (%) ................................................................2.........................1.166........................ 99...........................16 ......................... 100
Tertiary enrolment ratio (%) ...................................................................22.........................1.047........................ 68.............................1 ......................... 103
Education gender gap2 .........................................................................25.........................0.533................... 0.999......................0.645 ...................... 1.000
Quality
Internet access in schools1 ...................................................................39.........................0.534..................... 4.99........................1.64 ........................ 6.64
Quality of the education system1 ............................................................5.........................1.859..................... 5.46........................1.99 ........................ 5.98
Quality of primary schools1 .....................................................................8.........................1.613..................... 5.69........................1.97 ........................ 6.82
Quality of math & science education1 ...................................................20.........................0.891..................... 4.89........................1.88 ........................ 6.29
Quality of management schools1 ..........................................................18.........................1.165..................... 5.27........................2.29 ........................ 6.09
Attainment
Primary education attainment (% population age 25+) ..........................—..............................— .........................— .............................5 ......................... 100
Secondary education attainment (% population age 25+) .....................30.........................0.590........................ 79.............................2 ......................... 100
Tertiary education attainment (% population age 25+) ..........................12.........................1.215........................ 32.............................0 ........................... 44
Pillar 2: Health and Wellness Rank/122 Z-Score Country Value Sample Minimum Sample Maximum
Survival
Infant mortality (per 1,000 live births) ......................................................8.........................0.832.......................... 3.............................2 ........................... 98
Life expectancy ...................................................................................14.........................1.028........................ 81...........................50 ........................... 83
Survival gender gap2 ............................................................................59.........................0.236................... 0.974......................0.920 ...................... 0.980
Health
Stunting and wasting (% in children under 5) ........................................—..............................— .........................— ..........................1.2 ........................ 36.5
Unhealthy life years (% of life expectancy) ............................................10.........................0.791........................ 10.............................8 ........................... 66
Deaths under 60 from non-communicable
diseases (% of all NCD deaths) ......................................................25.........................1.037 ..................... 13.4 ..........................7.3 ........................ 55.8
Obesity (% of adults with BMI ≥ 30) .....................................................89.......................–0.629..................... 24.5..........................1.1 ........................ 42.8
Business impact of non-communicable diseases1 ................................41.........................0.414..................... 4.67........................2.74 ........................ 5.87
Business impact of communicable diseases1 .......................................12.........................1.088..................... 6.56........................3.13 ........................ 6.90
Well-being
Stress (% of respondents)7 ..................................................................90.......................–0.638........................ 39.............................8 ........................... 69
Depression (% of respondents)7 ...........................................................18.........................0.775.......................... 7.............................2 ........................... 37
Services
Water, sanitation and hygiene (% with access) .....................................33.........................0.786..................... 99.4........................31.1 ...................... 100.0
Healthcare quality1................................................................................41.........................0.486..................... 4.70........................1.78 ........................ 6.75
Healthcare accessibility1 .......................................................................42.........................0.502..................... 5.28........................2.41 ........................ 6.75
Pillar 3: Workforce and Employment Rank/122 Z-Score Country Value Sample Minimum Sample Maximum
Participation
Labour force participation rate, age 15-64 (%) .....................................65.........................0.011..................... 69.3........................43.4 ........................ 90.6
Labour force participation rate, age 65+ (%) .........................................90.......................–0.823....................... 8.7..........................1.6 ........................ 91.2
Economic participation gender gap2 .....................................................26.........................0.915................... 0.751......................0.310 ...................... 0.839
Unemployment rate (%) ........................................................................93.......................–0.936..................... 13.6..........................0.3 ........................ 32.0
Youth unemployment rate (%) ...............................................................88.......................–0.915..................... 27.5..........................1.6 ........................ 48.2
Talent
Country capacity to attract talent1 ........................................................10.........................1.545..................... 5.03........................1.48 ........................ 6.08
Country capacity to retain talent1..........................................................36.........................0.538..................... 4.05........................1.81 ........................ 5.97
Ease of finding skilled employees1 ..........................................................5.........................1.609..................... 5.10........................2.13 ........................ 5.69
Pay related to productivity1 ...................................................................33.........................0.651..................... 4.32........................2.37 ........................ 5.25
Capacity for innovation1........................................................................19.........................1.176..................... 4.64........................2.31 ........................ 5.84
Index of Economic Complexity3 ............................................................17.........................1.193..................... 1.25......................–1.96 ........................ 2.37
Firm level technology absorption1 .........................................................22.........................1.124..................... 5.62........................3.17 ........................ 6.23
Scientific and technical journal articles (per 1,000 people) ....................16.........................1.489................... 0.634......................0.000 ...................... 1.242
Median age of the working population ..................................................44.........................0.611........................ 37...........................28 ........................... 42
Training
Staff training1 ........................................................................................19.........................1.193..................... 4.81........................2.51 ........................ 5.57
Training services1 ..................................................................................21.........................0.932..................... 5.04........................2.67 ........................ 6.47
Ireland

2.1: Country Profiles
NOTESIn the sections for Pillar 1, Pillar 2, Pillar 3 and Pillar 4, values under Country Value, Sample Minimum and Sample Maximum refer to underlying data for each variable.For further details and explanations, please refer to the section “How to Read the Country Profiles”.1 Survey data responses on a 1- to 7-scale (1 = worst score, 7 = best score)2 Data on a 0- to 1-scale (0 = worst score, 1 = best score)3 Data from -1.960 (worst score) to 2.367 (best score)4 Rank number on a list of 185 countries5 Index on a scale of 0 (perfect inequality) to 100 (perfect equality)6 International test scores7 Perception survey data. Percentage of yes responses.8 Score (1 = best, 7 = worst)9 Reported in relation to UK score (100)
The Human Capital Report | 253
IrelandPillar 4: Enabling Environment Rank/122 Z-Score Country Value Sample Minimum Sample Maximum
Infrastructure
Mobile users (per 100 people) ..............................................................59.........................0.039...................... 108...........................17 ......................... 191
Internet users (per 100 people) .............................................................22.........................1.177........................ 77.............................1 ........................... 95
Quality of domestic transport1 ..............................................................39.........................0.410 ..................... 4.83 ........................2.08 ........................ 6.51
Collaboration
State of cluster development1 ..............................................................19.........................1.275..................... 4.80........................2.33 ........................ 5.49
Business and university R&D collaboration1 ..........................................12.........................1.577 ..................... 5.20 ........................2.11 ........................ 5.84
Legal framework
Doing Business Index4 .........................................................................14.........................1.260........................ 15.............................1 ......................... 180
Social safety net protection1 .................................................................15.........................1.447..................... 5.35........................2.10 ........................ 6.26
Intellectual property protection and property rights1..............................16.........................1.463 ..................... 5.59 ........................1.62 ........................ 6.31
Social mobility
Social mobility1 .....................................................................................21.........................1.276..................... 5.54........................2.78 ........................ 6.36
Additional indicatorsDemographics Value
Child dependency ratio (%)..................................................................... 31.7Aged dependency ratio (%) .................................................................... 16.8Fertility rate (births per woman) ................................................................. 2.0Sex ratio at birth (female/male) ............................................................... 0.94Population below age 20 (%) .................................................................. 27.5Population above age 60 (%) .................................................................. 16.1
Education
Public spending on education (% of GDP) ................................................ 6.5Technical/vocational enrolment as % of total
enrolment in secondary school ........................................................... 16Adult literacy (%) .........................................................................................—Boys not in primary school (%) .................................................................... 1Girls not in primary school (%) ....................................................................—Education poverty (% of children age 17-22
with less than 2-4 years schooling) ......................................................—Private enrolment in primary school (% of primary) ................................... 0.8Private enrolment in secondary school (% of secondary) .......................... 0.7PIRLS6 .................................................................................................... 552PISA math scores6 .................................................................................. 487PISA reading scores6 ............................................................................... 496PISA science scores6 .............................................................................. 508TIMSS 4th grade math6 ........................................................................... 527TIMSS 4th grade science6 ....................................................................... 516TIMSS 8th grade math6 ..............................................................................—TIMSS 8th grade science6 ..........................................................................—
Health
Prevalence of visual impairment (%) .......................................................... 1.0Public spending on health (% of GDP) ...................................................... 9.4Business impact of heart disease1 .......................................................... 4.48Business impact of cancer1 .................................................................... 4.30Business impact of mental illness1 .......................................................... 4.81Business impact of diabetes1 ................................................................. 4.65Business impact of chronic respiratory disease1 ..................................... 5.10Business impact of HIV/AIDS1 ................................................................ 6.36Business impact of tuberculosis1 ............................................................ 6.48Business impact of malaria1 ................................................................... 6.83
Society Value
Freedom in the World8................................................................................. 1Democracy Index (rank/165) ...................................................................... 13Population living in urban area (%) .......................................................... 62.5Gini Index (income)5................................................................................ 34.3Accessibility of digital content1 ............................................................... 5.41Extent of virtual social networks use1 ..................................................... 6.12
Workforce
Economic activity (agriculture) — % of total activity .................................. 4.6Economic activity (industry) — % of total activity .................................... 18.9Economic activity (services) — % of total activity .................................... 76.2GDP per person employed (US$) ....................................................... 56,749Cooperation in labour-employer relations1 .............................................. 5.35Emigration rate of the tertiary educated (%) ............................................ 33.7Labour force with tertiary education (%) ................................................. 39.9Number of patent applications (per 1,000 people) .............................. 0.1256Hiring and firing practices1 ...................................................................... 4.23Retirement age, male ................................................................................ 65Retirement age, female .............................................................................. 65Number of informal sector workers (1,000s) ...............................................—Total employed (1,000s) ....................................................................... 1,848Total unemployed (1,000s) ....................................................................... 291Unemployment for 12 months or more
as a % of total unemployment ......................................................... 48.9Total youth not in education or employment (1,000s) .................................—Unemployment for 12 months or more (1,000s) ................................... 142.4Global Innovation Index (rank/142) ............................................................ 10Global Talent Index (rank/60) ..................................................................... 16Quality of Labour Force (rank/60) .............................................................. 14Talent Environment (rank/60) ..................................................................... 13IQ measure9 ........................................................................................... 95.7

2.1: Country Profiles
254 | The Human Capital Report
Rank/122 Score
Year
s (5
yea
r age
gro
ups)
Percent of total population
0–4
5–9
10–14
15–19
20–24
25–29
30–34
35–39
40–44
45–49
50–54
55–59
60–64
65–69
70–74
75–79
80–84
85–89
90–94
95–99
100+
0 1 2 3 4 5 66 5 4 3 2 1 0
IsraelHuman Capital Index 2013 25 0.587
Pillar 1: Education 27 0.651
Pillar 2: Health and wellness 29 0.457
Pillar 3: Workforce and employment 20 0.674
Pillar 4: Enabling environment 32 0.568
Key Indicators
Total population (1,000s) 7,420.4
Median age of population 30
GDP per capita PPP (constant 2005, international $) 26,719
GDP growth (annual %) 4.7
Male Female Additional indicators
n Total population n Total population Aged dependency: 16.7%
n Labour force participation n Labour force participation Youth dependency: 43.7%
n Primary and secondary enrolment n Primary and secondary enrolment Male labour force participation, age 65+: 1.0%
Female labour force participation, age 65+: 0.5%
Education and workforce distribution
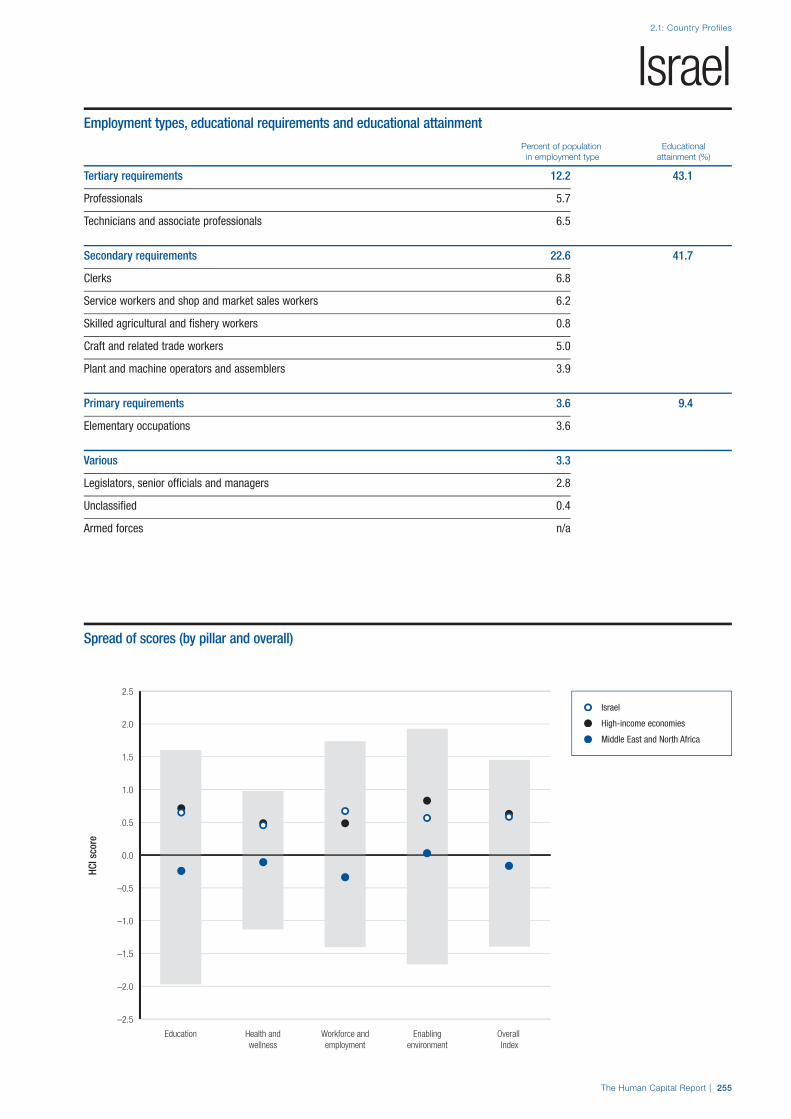
The Human Capital Report | 255
2.1: Country Profiles
HCI s
core
–2.5
–2.0
–1.5
–1.0
–0.5
0.0
0.5
1.0
1.5
2.0
2.5
Overall Index
Enablingenvironment
Workforce andemployment
Health andwellness
Education
IsraelEmployment types, educational requirements and educational attainment
Percent of population Educational in employment type attainment (%)
Tertiary requirements 12.2 43.1
Professionals 5.7
Technicians and associate professionals 6.5
Secondary requirements 22.6 41.7
Clerks 6.8
Service workers and shop and market sales workers 6.2
Skilled agricultural and fishery workers 0.8
Craft and related trade workers 5.0
Plant and machine operators and assemblers 3.9
Primary requirements 3.6 9.4
Elementary occupations 3.6
Various 3.3
Legislators, senior officials and managers 2.8
Unclassified 0.4
Armed forces n/a
Spread of scores (by pillar and overall)
Israel
High-income economies
Middle East and North Africa
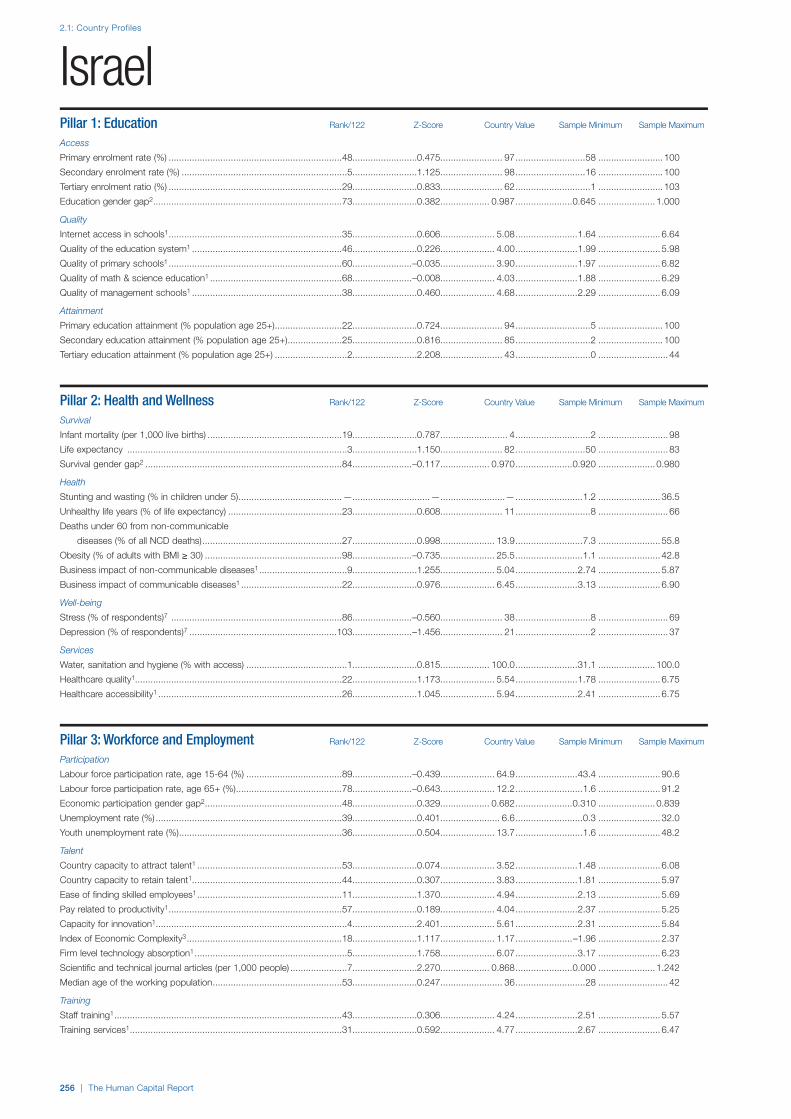
2.1: Country Profiles
256 | The Human Capital Report
Pillar 1: Education Rank/122 Z-Score Country Value Sample Minimum Sample Maximum
Access
Primary enrolment rate (%) ...................................................................48.........................0.475........................ 97...........................58 ......................... 100
Secondary enrolment rate (%) ................................................................5.........................1.125........................ 98...........................16 ......................... 100
Tertiary enrolment ratio (%) ...................................................................29.........................0.833........................ 62.............................1 ......................... 103
Education gender gap2 .........................................................................73.........................0.382................... 0.987......................0.645 ...................... 1.000
Quality
Internet access in schools1 ...................................................................35.........................0.606..................... 5.08........................1.64 ........................ 6.64
Quality of the education system1 ..........................................................46.........................0.226..................... 4.00........................1.99 ........................ 5.98
Quality of primary schools1 ...................................................................60.......................–0.035..................... 3.90........................1.97 ........................ 6.82
Quality of math & science education1 ...................................................68.......................–0.008..................... 4.03........................1.88 ........................ 6.29
Quality of management schools1 ..........................................................38.........................0.460..................... 4.68........................2.29 ........................ 6.09
Attainment
Primary education attainment (% population age 25+) ..........................22.........................0.724........................ 94.............................5 ......................... 100
Secondary education attainment (% population age 25+) .....................25.........................0.816........................ 85.............................2 ......................... 100
Tertiary education attainment (% population age 25+) ............................2.........................2.208........................ 43.............................0 ........................... 44
Pillar 2: Health and Wellness Rank/122 Z-Score Country Value Sample Minimum Sample Maximum
Survival
Infant mortality (per 1,000 live births) ....................................................19.........................0.787.......................... 4.............................2 ........................... 98
Life expectancy .....................................................................................3.........................1.150........................ 82...........................50 ........................... 83
Survival gender gap2 ............................................................................84.......................–0.117................... 0.970......................0.920 ...................... 0.980
Health
Stunting and wasting (% in children under 5) ........................................—..............................— .........................— ..........................1.2 ........................ 36.5
Unhealthy life years (% of life expectancy) ............................................23.........................0.608........................ 11.............................8 ........................... 66
Deaths under 60 from non-communicable
diseases (% of all NCD deaths) ......................................................27.........................0.998 ..................... 13.9 ..........................7.3 ........................ 55.8
Obesity (% of adults with BMI ≥ 30) .....................................................98.......................–0.735..................... 25.5..........................1.1 ........................ 42.8
Business impact of non-communicable diseases1 ..................................9.........................1.255..................... 5.04........................2.74 ........................ 5.87
Business impact of communicable diseases1 .......................................22.........................0.976..................... 6.45........................3.13 ........................ 6.90
Well-being
Stress (% of respondents)7 ..................................................................86.......................–0.560........................ 38.............................8 ........................... 69
Depression (% of respondents)7 .........................................................103.......................–1.456........................ 21.............................2 ........................... 37
Services
Water, sanitation and hygiene (% with access) .......................................1.........................0.815................... 100.0........................31.1 ...................... 100.0
Healthcare quality1................................................................................22.........................1.173..................... 5.54........................1.78 ........................ 6.75
Healthcare accessibility1 .......................................................................26.........................1.045..................... 5.94........................2.41 ........................ 6.75
Pillar 3: Workforce and Employment Rank/122 Z-Score Country Value Sample Minimum Sample Maximum
Participation
Labour force participation rate, age 15-64 (%) .....................................89.......................–0.439..................... 64.9........................43.4 ........................ 90.6
Labour force participation rate, age 65+ (%) .........................................78.......................–0.643..................... 12.2..........................1.6 ........................ 91.2
Economic participation gender gap2 .....................................................48.........................0.329................... 0.682......................0.310 ...................... 0.839
Unemployment rate (%) ........................................................................39.........................0.401....................... 6.6..........................0.3 ........................ 32.0
Youth unemployment rate (%) ...............................................................36.........................0.504..................... 13.7..........................1.6 ........................ 48.2
Talent
Country capacity to attract talent1 ........................................................53.........................0.074..................... 3.52........................1.48 ........................ 6.08
Country capacity to retain talent1..........................................................44.........................0.307..................... 3.83........................1.81 ........................ 5.97
Ease of finding skilled employees1 ........................................................11.........................1.370..................... 4.94........................2.13 ........................ 5.69
Pay related to productivity1 ...................................................................57.........................0.189..................... 4.04........................2.37 ........................ 5.25
Capacity for innovation1..........................................................................4.........................2.401..................... 5.61........................2.31 ........................ 5.84
Index of Economic Complexity3 ............................................................18.........................1.117..................... 1.17......................–1.96 ........................ 2.37
Firm level technology absorption1 ...........................................................5.........................1.758..................... 6.07........................3.17 ........................ 6.23
Scientific and technical journal articles (per 1,000 people) ......................7.........................2.270................... 0.868......................0.000 ...................... 1.242
Median age of the working population ..................................................53.........................0.247........................ 36...........................28 ........................... 42
Training
Staff training1 ........................................................................................43.........................0.306..................... 4.24........................2.51 ........................ 5.57
Training services1 ..................................................................................31.........................0.592..................... 4.77........................2.67 ........................ 6.47
Israel

2.1: Country Profiles
NOTESIn the sections for Pillar 1, Pillar 2, Pillar 3 and Pillar 4, values under Country Value, Sample Minimum and Sample Maximum refer to underlying data for each variable.For further details and explanations, please refer to the section “How to Read the Country Profiles”.1 Survey data responses on a 1- to 7-scale (1 = worst score, 7 = best score)2 Data on a 0- to 1-scale (0 = worst score, 1 = best score)3 Data from -1.960 (worst score) to 2.367 (best score)4 Rank number on a list of 185 countries5 Index on a scale of 0 (perfect inequality) to 100 (perfect equality)6 International test scores7 Perception survey data. Percentage of yes responses.8 Score (1 = best, 7 = worst)9 Reported in relation to UK score (100)
The Human Capital Report | 257
IsraelPillar 4: Enabling Environment Rank/122 Z-Score Country Value Sample Minimum Sample Maximum
Infrastructure
Mobile users (per 100 people) ..............................................................40.........................0.429...................... 122...........................17 ......................... 191
Internet users (per 100 people) .............................................................31.........................0.934........................ 70.............................1 ........................... 95
Quality of domestic transport1 ..............................................................84.......................–0.502 ..................... 4.03 ........................2.08 ........................ 6.51
Collaboration
State of cluster development1 ..............................................................36.........................0.389..................... 4.17........................2.33 ........................ 5.49
Business and university R&D collaboration1 ............................................8.........................1.811..................... 5.40........................2.11 ........................ 5.84
Legal framework
Doing Business Index4 .........................................................................36.........................0.814........................ 38.............................1 ......................... 180
Social safety net protection1 .................................................................36.........................0.489..................... 4.31........................2.10 ........................ 6.26
Intellectual property protection and property rights1..............................31.........................0.711 ..................... 4.82 ........................1.62 ........................ 6.31
Social mobility
Social mobility1 .....................................................................................55.........................0.040..................... 4.42........................2.78 ........................ 6.36
Additional indicatorsDemographics Value
Child dependency ratio (%)..................................................................... 43.7Aged dependency ratio (%) .................................................................... 16.7Fertility rate (births per woman) ................................................................. 2.9Sex ratio at birth (female/male) ............................................................... 0.95Population below age 20 (%) .................................................................. 34.8Population above age 60 (%) .................................................................. 14.9
Education
Public spending on education (% of GDP) ................................................ 6.0Technical/vocational enrolment as % of total
enrolment in secondary school ........................................................... 19Adult literacy (%) ..................................................................................... 91.8Boys not in primary school (%) .................................................................... 3Girls not in primary school (%) ..................................................................... 2Education poverty (% of children age 17-22
with less than 2-4 years schooling) ......................................................—Private enrolment in primary school (% of primary) ................................. 21.6Private enrolment in secondary school (% of secondary) ........................ 10.5PIRLS6 .................................................................................................... 541PISA math scores6 .................................................................................. 447PISA reading scores6 ............................................................................... 474PISA science scores6 .............................................................................. 455TIMSS 4th grade math6 ..............................................................................—TIMSS 4th grade science6 ..........................................................................—TIMSS 8th grade math6 ........................................................................... 516TIMSS 8th grade science6 ....................................................................... 516
Health
Prevalence of visual impairment (%) .......................................................... 0.9Public spending on health (% of GDP) ...................................................... 7.7Business impact of heart disease1 .......................................................... 4.68Business impact of cancer1 .................................................................... 4.60Business impact of mental illness1 .......................................................... 5.36Business impact of diabetes1 ................................................................. 5.15Business impact of chronic respiratory disease1 ..................................... 5.43Business impact of HIV/AIDS1 ................................................................ 6.54Business impact of tuberculosis1 ............................................................ 6.31Business impact of malaria1 ................................................................... 6.49
Society Value
Freedom in the World8................................................................................. 1Democracy Index (rank/165) ...................................................................... 37Population living in urban area (%) .......................................................... 91.9Gini Index (income)5................................................................................ 39.2Accessibility of digital content1 ............................................................... 5.73Extent of virtual social networks use1 ..................................................... 6.08
Workforce
Economic activity (agriculture) — % of total activity .................................. 1.7Economic activity (industry) — % of total activity .................................... 20.4Economic activity (services) — % of total activity .................................... 77.1GDP per person employed (US$) ....................................................... 44,366Cooperation in labour-employer relations1 .............................................. 4.45Emigration rate of the tertiary educated (%) .............................................. 7.8Labour force with tertiary education (%) ................................................. 45.1Number of patent applications (per 1,000 people) .............................. 0.9280Hiring and firing practices1 ...................................................................... 4.14Retirement age, male ................................................................................ 68Retirement age, female .............................................................................. 64Number of informal sector workers (1,000s) ...............................................—Total employed (1,000s) ....................................................................... 2,938Total unemployed (1,000s) ....................................................................... 209Unemployment for 12 months or more
as a % of total unemployment ......................................................... 24.2Total youth not in education or employment (1,000s) ........................... 357.4Unemployment for 12 months or more (1,000s) ..................................... 50.6Global Innovation Index (rank/142) ............................................................ 14Global Talent Index (rank/60) ..................................................................... 10Quality of Labour Force (rank/60) ................................................................ 2Talent Environment (rank/60) ....................................................................... 9IQ measure9 ........................................................................................... 94.4

2.1: Country Profiles
258 | The Human Capital Report
Rank/122 Score
Year
s (5
yea
r age
gro
ups)
Percent of total population
0–4
5–9
10–14
15–19
20–24
25–29
30–34
35–39
40–44
45–49
50–54
55–59
60–64
65–69
70–74
75–79
80–84
85–89
90–94
95–99
100+
0 1 2 3 4 55 4 3 2 1 0
ItalyHuman Capital Index 2013 37 0.266
Pillar 1: Education 40 0.378
Pillar 2: Health and wellness 19 0.601
Pillar 3: Workforce and employment 75 –0.243
Pillar 4: Enabling environment 39 0.329
Key Indicators
Total population (1,000s) 60,509.0
Median age of population 43
GDP per capita PPP (constant 2005, international $) 26,328
GDP growth (annual %) –2.4
Male Female Additional indicators
n Total population n Total population Aged dependency: 30.9%
n Labour force participation n Labour force participation Youth dependency: 21.4%
n Primary and secondary enrolment n Primary and secondary enrolment Male labour force participation, age 65+: 0.5%
Female labour force participation, age 65+: 0.1%
Education and workforce distribution

The Human Capital Report | 259
2.1: Country Profiles
HCI s
core
–2.5
–2.0
–1.5
–1.0
–0.5
0.0
0.5
1.0
1.5
2.0
2.5
Overall Index
Enablingenvironment
Workforce andemployment
Health andwellness
Education
ItalyEmployment types, educational requirements and educational attainment
Percent of population Educational in employment type attainment (%)
Tertiary requirements 14.2 12.1
Professionals 4.7
Technicians and associate professionals 9.5
Secondary requirements 22.4 61.0
Clerks 5.2
Service workers and shop and market sales workers 5.1
Skilled agricultural and fishery workers 1.0
Craft and related trade workers 7.4
Plant and machine operators and assemblers 3.8
Primary requirements 4.2 19.9
Elementary occupations 4.2
Various 4.1
Legislators, senior officials and managers 3.7
Unclassified n/a
Armed forces 0.5
Spread of scores (by pillar and overall)
Italy
High-income economies
Europe and Central Asia

2.1: Country Profiles
260 | The Human Capital Report
Pillar 1: Education Rank/122 Z-Score Country Value Sample Minimum Sample Maximum
Access
Primary enrolment rate (%) ...................................................................24.........................0.676........................ 99...........................58 ......................... 100
Secondary enrolment rate (%) ..............................................................11.........................0.946........................ 94...........................16 ......................... 100
Tertiary enrolment ratio (%) ...................................................................25.........................0.929........................ 65.............................1 ......................... 103
Education gender gap2 .........................................................................58.........................0.447................... 0.992......................0.645 ...................... 1.000
Quality
Internet access in schools1 ...................................................................84.......................–0.520..................... 3.67........................1.64 ........................ 6.64
Quality of the education system1 ..........................................................60.......................–0.177..................... 3.64........................1.99 ........................ 5.98
Quality of primary schools1 ...................................................................33.........................0.683..................... 4.68........................1.97 ........................ 6.82
Quality of math & science education1 ...................................................55.........................0.232..................... 4.26........................1.88 ........................ 6.29
Quality of management schools1 ..........................................................30.........................0.818..................... 4.98........................2.29 ........................ 6.09
Attainment
Primary education attainment (% population age 25+) ..........................25.........................0.703........................ 94.............................5 ......................... 100
Secondary education attainment (% population age 25+) .....................36.........................0.407........................ 74.............................2 ......................... 100
Tertiary education attainment (% population age 25+) ..........................61.......................–0.614........................ 12.............................0 ........................... 44
Pillar 2: Health and Wellness Rank/122 Z-Score Country Value Sample Minimum Sample Maximum
Survival
Infant mortality (per 1,000 live births) ......................................................8.........................0.832.......................... 3.............................2 ........................... 98
Life expectancy .....................................................................................3.........................1.150........................ 82...........................50 ........................... 83
Survival gender gap2 ............................................................................66.........................0.205................... 0.973......................0.920 ...................... 0.980
Health
Stunting and wasting (% in children under 5) ........................................—..............................— .........................— ..........................1.2 ........................ 36.5
Unhealthy life years (% of life expectancy) ..............................................5.........................0.811 ........................ 10 .............................8 ........................... 66
Deaths under 60 from non-communicable
diseases (% of all NCD deaths) ........................................................2.........................1.493 ....................... 7.6 ..........................7.3 ........................ 55.8
Obesity (% of adults with BMI ≥ 30) .....................................................45.........................0.141 ..................... 17.2 ..........................1.1 ........................ 42.8
Business impact of non-communicable diseases1 ................................22.........................0.911 ..................... 4.89 ........................2.74 ........................ 5.87
Business impact of communicable diseases1 .......................................26.........................0.905 ..................... 6.38 ........................3.13 ........................ 6.90
Well-being
Stress (% of respondents)7 ................................................................108.......................–1.335........................ 48.............................8 ........................... 69
Depression (% of respondents)7 ...........................................................56.........................0.137........................ 11.............................2 ........................... 37
Services
Water, sanitation and hygiene (% with access) .......................................1.........................0.815................... 100.0........................31.1 ...................... 100.0
Healthcare quality1................................................................................35.........................0.720..................... 4.99........................1.78 ........................ 6.75
Healthcare accessibility1 .......................................................................27.........................1.030..................... 5.92........................2.41 ........................ 6.75
Pillar 3: Workforce and Employment Rank/122 Z-Score Country Value Sample Minimum Sample Maximum
Participation
Labour force participation rate, age 15-64 (%) .....................................98.......................–0.694..................... 62.4........................43.4 ........................ 90.6
Labour force participation rate, age 65+ (%) .......................................116.......................–1.112....................... 3.1..........................1.6 ........................ 91.2
Economic participation gender gap2 .....................................................87.......................–0.443................... 0.591......................0.310 ...................... 0.839
Unemployment rate (%) ........................................................................68.........................0.061....................... 8.4..........................0.3 ........................ 32.0
Youth unemployment rate (%) ...............................................................89.......................–0.945..................... 27.8..........................1.6 ........................ 48.2
Talent
Country capacity to attract talent1 ......................................................101.......................–1.016..................... 2.39........................1.48 ........................ 6.08
Country capacity to retain talent1..........................................................99.......................–0.895..................... 2.66........................1.81 ........................ 5.97
Ease of finding skilled employees1 ........................................................41.........................0.434..................... 4.29........................2.13 ........................ 5.69
Pay related to productivity1 .................................................................119.......................–1.910..................... 2.76........................2.37 ........................ 5.25
Capacity for innovation1........................................................................28.........................0.567..................... 4.15........................2.31 ........................ 5.84
Index of Economic Complexity3 ............................................................15.........................1.272..................... 1.32......................–1.96 ........................ 2.37
Firm level technology absorption1 .........................................................97.......................–0.880..................... 4.19........................3.17 ........................ 6.23
Scientific and technical journal articles (per 1,000 people) ....................23.........................0.854................... 0.444......................0.000 ...................... 1.242
Median age of the working population ....................................................4.........................1.511........................ 41...........................28 ........................... 42
Training
Staff training1 ......................................................................................111.......................–1.307..................... 3.21........................2.51 ........................ 5.57
Training services1 ..................................................................................29.........................0.617..................... 4.79........................2.67 ........................ 6.47
Italy

2.1: Country Profiles
NOTESIn the sections for Pillar 1, Pillar 2, Pillar 3 and Pillar 4, values under Country Value, Sample Minimum and Sample Maximum refer to underlying data for each variable.For further details and explanations, please refer to the section “How to Read the Country Profiles”.1 Survey data responses on a 1- to 7-scale (1 = worst score, 7 = best score)2 Data on a 0- to 1-scale (0 = worst score, 1 = best score)3 Data from -1.960 (worst score) to 2.367 (best score)4 Rank number on a list of 185 countries5 Index on a scale of 0 (perfect inequality) to 100 (perfect equality)6 International test scores7 Perception survey data. Percentage of yes responses.8 Score (1 = best, 7 = worst)9 Reported in relation to UK score (100)
The Human Capital Report | 261
ItalyPillar 4: Enabling Environment Rank/122 Z-Score Country Value Sample Minimum Sample Maximum
Infrastructure
Mobile users (per 100 people) ................................................................8.........................1.495...................... 158...........................17 ......................... 191
Internet users (per 100 people) .............................................................41.........................0.463........................ 57.............................1 ........................... 95
Quality of domestic transport1 ..............................................................83.......................–0.479..................... 4.05........................2.08 ........................ 6.51
Collaboration
State of cluster development1 ................................................................1.........................2.240..................... 5.49........................2.33 ........................ 5.49
Business and university R&D collaboration1 ..........................................54.......................–0.078..................... 3.71........................2.11 ........................ 5.84
Legal framework
Doing Business Index4 .........................................................................60.........................0.135........................ 73.............................1 ......................... 180
Social safety net protection1 .................................................................43.........................0.131..................... 3.92........................2.10 ........................ 6.26
Intellectual property protection and property rights1..............................57.......................–0.094 ..................... 3.99 ........................1.62 ........................ 6.31
Social mobility
Social mobility1 ...................................................................................101.......................–0.855..................... 3.62........................2.78 ........................ 6.36
Additional indicatorsDemographics Value
Child dependency ratio (%)..................................................................... 21.4Aged dependency ratio (%) .................................................................... 30.9Fertility rate (births per woman) ................................................................. 1.4Sex ratio at birth (female/male) ............................................................... 0.94Population below age 20 (%) .................................................................. 18.9Population above age 60 (%) .................................................................. 26.5
Education
Public spending on education (% of GDP) ................................................ 4.5Technical/vocational enrolment as % of total
enrolment in secondary school ........................................................... 37Adult literacy (%) ..................................................................................... 99.0Boys not in primary school (%) .................................................................... 1Girls not in primary school (%) ..................................................................... 1Education poverty (% of children age 17-22
with less than 2-4 years schooling) ......................................................—Private enrolment in primary school (% of primary) ................................... 6.9Private enrolment in secondary school (% of secondary) .......................... 8.4PIRLS6 .................................................................................................... 541PISA math scores6 .................................................................................. 483PISA reading scores6 ............................................................................... 486PISA science scores6 .............................................................................. 489TIMSS 4th grade math6 ........................................................................... 508TIMSS 4th grade science6 ....................................................................... 524TIMSS 8th grade math6 ........................................................................... 498TIMSS 8th grade science6 ....................................................................... 501
Health
Prevalence of visual impairment (%) .......................................................... 1.1Public spending on health (% of GDP) ...................................................... 9.5Business impact of heart disease1 .......................................................... 4.60Business impact of cancer1 .................................................................... 4.44Business impact of mental illness1 .......................................................... 5.24Business impact of diabetes1 ................................................................. 5.08Business impact of chronic respiratory disease1 ..................................... 5.09Business impact of HIV/AIDS1 ................................................................ 5.98Business impact of tuberculosis1 ............................................................ 6.47Business impact of malaria1 ................................................................... 6.68
Society Value
Freedom in the World8................................................................................. 2Democracy Index (rank/165) ...................................................................... 32Population living in urban area (%) .......................................................... 68.6Gini Index (income)5................................................................................ 36.0Accessibility of digital content1 ............................................................... 4.58Extent of virtual social networks use1 ..................................................... 5.79
Workforce
Economic activity (agriculture) — % of total activity .................................. 3.7Economic activity (industry) — % of total activity .................................... 28.5Economic activity (services) — % of total activity .................................... 67.8GDP per person employed (US$) ....................................................... 45,170Cooperation in labour-employer relations1 .............................................. 3.41Emigration rate of the tertiary educated (%) .............................................. 9.7Labour force with tertiary education (%) ................................................. 17.2Number of patent applications (per 1,000 people) .............................. 0.1607Hiring and firing practices1 ...................................................................... 2.55Retirement age, male ................................................ 66 years and 3 monthsRetirement age, female .............................................. 62 years and 3 monthsNumber of informal sector workers (1,000s) ...............................................—Total employed (1,000s) ..................................................................... 22,872Total unemployed (1,000s) .................................................................... 2,102Unemployment for 12 months or more
as a % of total unemployment .............................................................—Total youth not in education or employment (1,000s) ........................ 1,203.0Unemployment for 12 months or more (1,000s) .........................................—Global Innovation Index (rank/142) ............................................................ 29Global Talent Index (rank/60) ..................................................................... 23Quality of Labour Force (rank/60) .............................................................. 28Talent Environment (rank/60) ..................................................................... 30IQ measure9 ........................................................................................... 95.9

2.1: Country Profiles
262 | The Human Capital Report
Rank/122 Score
Year
s (5
yea
r age
gro
ups)
Percent of total population
0–4
5–9
10–14
15–19
20–24
25–29
30–34
35–39
40–44
45–49
50–54
55–59
60–64
65–69
70–74
75–79
80–84
85–89
90–94
95–99
100+
0 1 2 3 4 5 66 5 4 3 2 1 0
JamaicaHuman Capital Index 2013 68 –0.171
Pillar 1: Education 81 –0.285
Pillar 2: Health and wellness 50 0.126
Pillar 3: Workforce and employment 76 –0.246
Pillar 4: Enabling environment 69 –0.279
Key Indicators
Total population (1,000s) 2,741.5
Median age of population 27
GDP per capita PPP (constant 2005, international $) 7,083
GDP growth (annual %) –0.3
Male Female Additional indicators
n Total population n Total population Aged dependency: 12.4%
n Labour force participation n Labour force participation Youth dependency: 46.0%
n Primary and secondary enrolment n Primary and secondary enrolment Male labour force participation, age 65+: 1.6%
Female labour force participation, age 65+: 0.8%
Education and workforce distribution

The Human Capital Report | 263
2.1: Country Profiles
HCI s
core
–2.5
–2.0
–1.5
–1.0
–0.5
0.0
0.5
1.0
1.5
2.0
2.5
Overall Index
Enablingenvironment
Workforce andemployment
Health andwellness
Education
JamaicaEmployment types, educational requirements and educational attainment
Percent of population Educational in employment type attainment (%)
Tertiary requirements 0.0 n/a
Professionals n/a
Technicians and associate professionals 0.0
Secondary requirements 43.4 n/a
Clerks 6.1
Service workers and shop and market sales workers 13.0
Skilled agricultural and fishery workers 11.3
Craft and related trade workers 9.1
Plant and machine operators and assemblers 4.0
Primary requirements 9.6 n/a
Elementary occupations 9.6
Various 0.1
Legislators, senior officials and managers 0.0
Unclassified 0.1
Armed forces n/a
Spread of scores (by pillar and overall)
Jamaica
Upper-middle income economies
Latin America and the Carribean

2.1: Country Profiles
264 | The Human Capital Report
Pillar 1: Education Rank/122 Z-Score Country Value Sample Minimum Sample Maximum
Access
Primary enrolment rate (%) .................................................................105.......................–1.300........................ 82...........................58 ......................... 100
Secondary enrolment rate (%) ..............................................................42.........................0.493........................ 84...........................16 ......................... 100
Tertiary enrolment ratio (%) ...................................................................75.......................–0.553........................ 26.............................1 ......................... 103
Education gender gap2 .........................................................................72.........................0.394................... 0.988......................0.645 ...................... 1.000
Quality
Internet access in schools1 ...................................................................66.......................–0.145..................... 4.14........................1.64 ........................ 6.64
Quality of the education system1 ..........................................................54.......................–0.110..................... 3.70........................1.99 ........................ 5.98
Quality of primary schools1 ...................................................................79.......................–0.486..................... 3.41........................1.97 ........................ 6.82
Quality of math & science education1 ...................................................97.......................–0.865..................... 3.21........................1.88 ........................ 6.29
Quality of management schools1 ..........................................................61.........................0.005..................... 4.30........................2.29 ........................ 6.09
Attainment
Primary education attainment (% population age 25+) ..........................—..............................— .........................— .............................5 ......................... 100
Secondary education attainment (% population age 25+) .....................—..............................— .........................— .............................2 ......................... 100
Tertiary education attainment (% population age 25+) ..........................—..............................— .........................— .............................0 ........................... 44
Pillar 2: Health and Wellness Rank/122 Z-Score Country Value Sample Minimum Sample Maximum
Survival
Infant mortality (per 1,000 live births) ....................................................69.........................0.248........................ 16.............................2 ........................... 98
Life expectancy ...................................................................................51.........................0.299........................ 75...........................50 ........................... 83
Survival gender gap2 ..............................................................................1.........................0.751................... 0.980......................0.920 ...................... 0.980
Health
Stunting and wasting (% in children under 5) ..........................................6.........................1.265....................... 4.2..........................1.2 ........................ 36.5
Unhealthy life years (% of life expectancy) ............................................73.......................–0.006........................ 15.............................8 ........................... 66
Deaths under 60 from non-communicable
diseases (% of all NCD deaths) ......................................................41.........................0.628 ..................... 18.6 ..........................7.3 ........................ 55.8
Obesity (% of adults with BMI ≥ 30) .....................................................90.......................–0.640..................... 24.6..........................1.1 ........................ 42.8
Business impact of non-communicable diseases1 ................................81.......................–0.398..................... 4.30........................2.74 ........................ 5.87
Business impact of communicable diseases1 .......................................73.........................0.036..................... 5.51........................3.13 ........................ 6.90
Well-being
Stress (% of respondents)7 ..................................................................50.........................0.060........................ 30.............................8 ........................... 69
Depression (% of respondents)7 ...........................................................75.......................–0.182........................ 13.............................2 ........................... 37
Services
Water, sanitation and hygiene (% with access) .....................................75.........................0.125..................... 86.6........................31.1 ...................... 100.0
Healthcare quality1................................................................................66.......................–0.391..................... 3.63........................1.78 ........................ 6.75
Healthcare accessibility1 .......................................................................57.......................–0.037..................... 4.62........................2.41 ........................ 6.75
Pillar 3: Workforce and Employment Rank/122 Z-Score Country Value Sample Minimum Sample Maximum
Participation
Labour force participation rate, age 15-64 (%) .....................................70.......................–0.111..................... 68.1........................43.4 ........................ 90.6
Labour force participation rate, age 65+ (%) .........................................41.........................0.214..................... 28.8..........................1.6 ........................ 91.2
Economic participation gender gap2 .....................................................34.........................0.661................... 0.721......................0.310 ...................... 0.839
Unemployment rate (%) ........................................................................89.......................–0.695..................... 12.4..........................0.3 ........................ 32.0
Youth unemployment rate (%) ...............................................................86.......................–0.873..................... 27.1..........................1.6 ........................ 48.2
Talent
Country capacity to attract talent1 ........................................................80.......................–0.464..................... 2.96........................1.48 ........................ 6.08
Country capacity to retain talent1..........................................................84.......................–0.584..................... 2.97........................1.81 ........................ 5.97
Ease of finding skilled employees1 ........................................................62.......................–0.103..................... 3.91........................2.13 ........................ 5.69
Pay related to productivity1 ...................................................................80.......................–0.450..................... 3.65........................2.37 ........................ 5.25
Capacity for innovation1........................................................................53.......................–0.123..................... 3.61........................2.31 ........................ 5.84
Index of Economic Complexity3 ............................................................75.......................–0.516................... –0.38......................–1.96 ........................ 2.37
Firm level technology absorption1 .........................................................58.......................–0.079..................... 4.76........................3.17 ........................ 6.23
Scientific and technical journal articles (per 1,000 people) ....................72.......................–0.566................... 0.019......................0.000 ...................... 1.242
Median age of the working population ..................................................56.........................0.011........................ 35...........................28 ........................... 42
Training
Staff training1 ........................................................................................55.........................0.025..................... 4.06........................2.51 ........................ 5.57
Training services1 ..................................................................................73.......................–0.277..................... 4.09........................2.67 ........................ 6.47
Jamaica

2.1: Country Profiles
NOTESIn the sections for Pillar 1, Pillar 2, Pillar 3 and Pillar 4, values under Country Value, Sample Minimum and Sample Maximum refer to underlying data for each variable.For further details and explanations, please refer to the section “How to Read the Country Profiles”.1 Survey data responses on a 1- to 7-scale (1 = worst score, 7 = best score)2 Data on a 0- to 1-scale (0 = worst score, 1 = best score)3 Data from -1.960 (worst score) to 2.367 (best score)4 Rank number on a list of 185 countries5 Index on a scale of 0 (perfect inequality) to 100 (perfect equality)6 International test scores7 Perception survey data. Percentage of yes responses.8 Score (1 = best, 7 = worst)9 Reported in relation to UK score (100)
The Human Capital Report | 265
JamaicaPillar 4: Enabling Environment Rank/122 Z-Score Country Value Sample Minimum Sample Maximum
Infrastructure
Mobile users (per 100 people) ..............................................................61.........................0.031...................... 108...........................17 ......................... 191
Internet users (per 100 people) .............................................................78.......................–0.441........................ 32.............................1 ........................... 95
Quality of domestic transport1 ..............................................................61.........................0.012 ..................... 4.48 ........................2.08 ........................ 6.51
Collaboration
State of cluster development1 ..............................................................52.........................0.183..................... 4.02........................2.33 ........................ 5.49
Business and university R&D collaboration1 ..........................................59.......................–0.208 ..................... 3.60 ........................2.11 ........................ 5.84
Legal framework
Doing Business Index4 .........................................................................72.......................–0.195........................ 90.............................1 ......................... 180
Social safety net protection1 ...............................................................116.......................–1.236..................... 2.44........................2.10 ........................ 6.26
Intellectual property protection and property rights1..............................63.......................–0.175 ..................... 3.91 ........................1.62 ........................ 6.31
Social mobility
Social mobility1 .....................................................................................78.......................–0.486..................... 3.95........................2.78 ........................ 6.36
Additional indicatorsDemographics Value
Child dependency ratio (%)..................................................................... 46.0Aged dependency ratio (%) .................................................................... 12.4Fertility rate (births per woman) ................................................................. 2.4Sex ratio at birth (female/male) ............................................................... 0.95Population below age 20 (%) .................................................................. 38.8Population above age 60 (%) .................................................................. 10.6
Education
Public spending on education (% of GDP) ................................................ 6.4Technical/vocational enrolment as % of total
enrolment in secondary school ............................................................—Adult literacy (%) ..................................................................................... 87.0Boys not in primary school (%) .................................................................. 17Girls not in primary school (%) ................................................................... 19Education poverty (% of children age 17-22
with less than 2-4 years schooling) ................................................ 0.009Private enrolment in primary school (% of primary) ................................. 10.9Private enrolment in secondary school (% of secondary) .......................... 5.7PIRLS6 .......................................................................................................—PISA math scores6 .....................................................................................—PISA reading scores6 ..................................................................................—PISA science scores6 .................................................................................—TIMSS 4th grade math6 ..............................................................................—TIMSS 4th grade science6 ..........................................................................—TIMSS 8th grade math6 ..............................................................................—TIMSS 8th grade science6 ..........................................................................—
Health
Prevalence of visual impairment (%) .......................................................... 2.8Public spending on health (% of GDP) ...................................................... 4.9Business impact of heart disease1 .......................................................... 4.19Business impact of cancer1 .................................................................... 4.03Business impact of mental illness1 .......................................................... 5.07Business impact of diabetes1 ................................................................. 3.71Business impact of chronic respiratory disease1 ..................................... 4.51Business impact of HIV/AIDS1 ................................................................ 4.71Business impact of tuberculosis1 ............................................................ 5.86Business impact of malaria1 ................................................................... 5.97
Society Value
Freedom in the World8................................................................................. 2Democracy Index (rank/165) ...................................................................... 39Population living in urban area (%) .......................................................... 52.2Gini Index (income)5................................................................................ 45.5Accessibility of digital content1 ............................................................... 5.34Extent of virtual social networks use1 ..................................................... 5.89
Workforce
Economic activity (agriculture) — % of total activity ................................ 17.6Economic activity (industry) — % of total activity .................................... 16.1Economic activity (services) — % of total activity .................................... 66.3GDP per person employed (US$) ......................................................... 8,668Cooperation in labour-employer relations1 .............................................. 4.10Emigration rate of the tertiary educated (%) ............................................ 84.7Labour force with tertiary education (%) .....................................................—Number of patent applications (per 1,000 people) .............................. 0.0412Hiring and firing practices1 ...................................................................... 4.39Retirement age, male .................................................................................—Retirement age, female ...............................................................................—Number of informal sector workers (1,000s) ...............................................—Total employed (1,000s) ....................................................................... 1,095Total unemployed (1,000s) ....................................................................... 155Unemployment for 12 months or more
as a % of total unemployment .............................................................—Total youth not in education or employment (1,000s) .................................—Unemployment for 12 months or more (1,000s) .........................................—Global Innovation Index (rank/142) ............................................................ 82Global Talent Index (rank/60) ......................................................................—Quality of Labour Force (rank/60) ...............................................................—Talent Environment (rank/60) ......................................................................—IQ measure9 ........................................................................................... 71.0
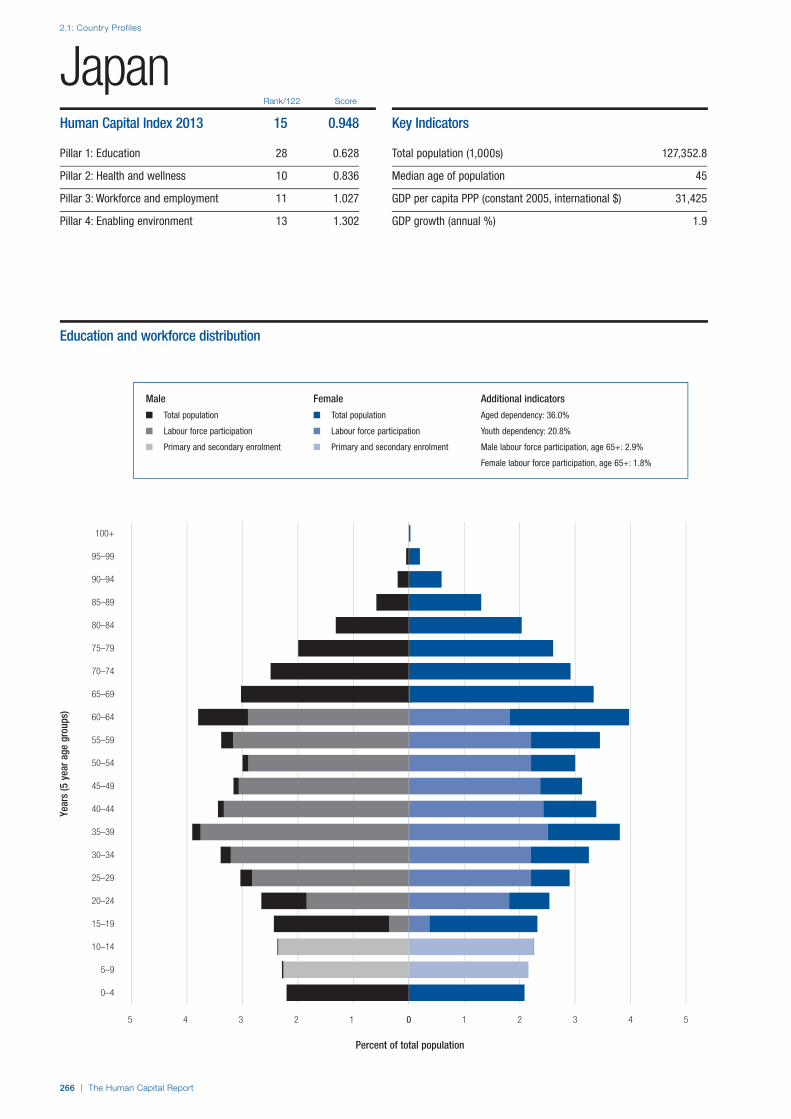
2.1: Country Profiles
266 | The Human Capital Report
Rank/122 Score
Year
s (5
yea
r age
gro
ups)
Percent of total population
0–4
5–9
10–14
15–19
20–24
25–29
30–34
35–39
40–44
45–49
50–54
55–59
60–64
65–69
70–74
75–79
80–84
85–89
90–94
95–99
100+
0 1 2 3 4 55 4 3 2 1 0
JapanHuman Capital Index 2013 15 0.948
Pillar 1: Education 28 0.628
Pillar 2: Health and wellness 10 0.836
Pillar 3: Workforce and employment 11 1.027
Pillar 4: Enabling environment 13 1.302
Key Indicators
Total population (1,000s) 127,352.8
Median age of population 45
GDP per capita PPP (constant 2005, international $) 31,425
GDP growth (annual %) 1.9
Male Female Additional indicators
n Total population n Total population Aged dependency: 36.0%
n Labour force participation n Labour force participation Youth dependency: 20.8%
n Primary and secondary enrolment n Primary and secondary enrolment Male labour force participation, age 65+: 2.9%
Female labour force participation, age 65+: 1.8%
Education and workforce distribution
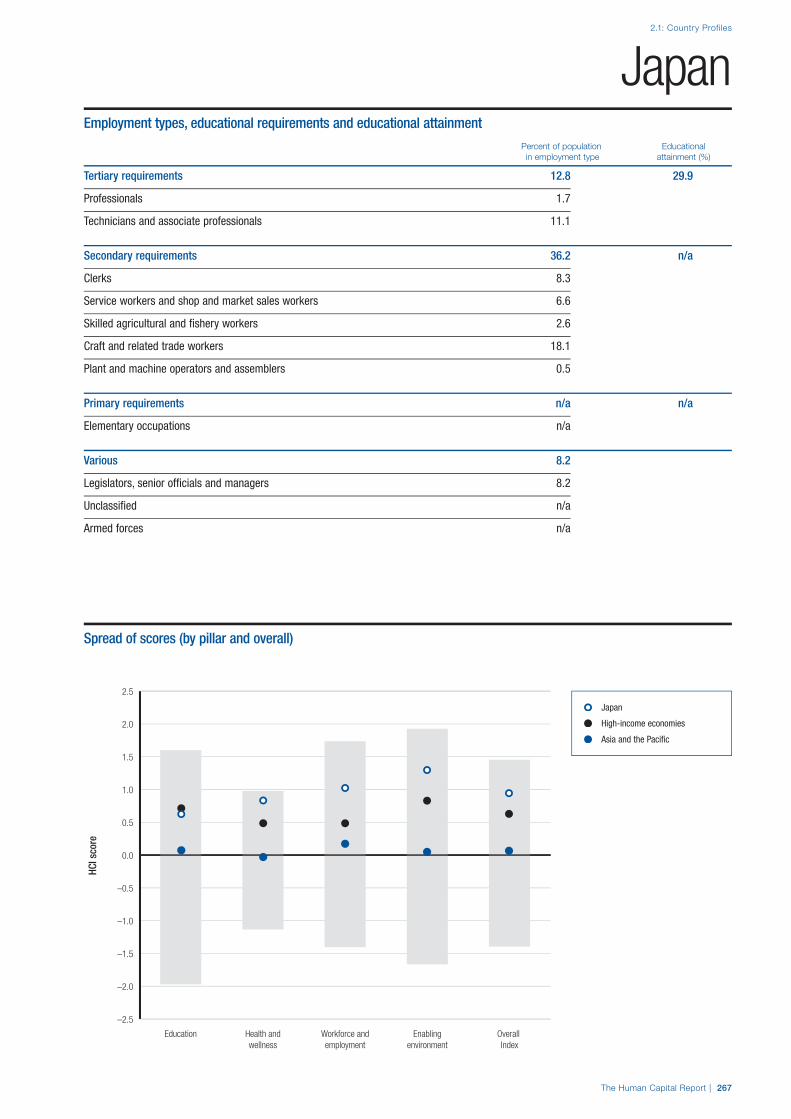
The Human Capital Report | 267
2.1: Country Profiles
HCI s
core
–2.5
–2.0
–1.5
–1.0
–0.5
0.0
0.5
1.0
1.5
2.0
2.5
Overall Index
Enablingenvironment
Workforce andemployment
Health andwellness
Education
JapanEmployment types, educational requirements and educational attainment
Percent of population Educational in employment type attainment (%)
Tertiary requirements 12.8 29.9
Professionals 1.7
Technicians and associate professionals 11.1
Secondary requirements 36.2 n/a
Clerks 8.3
Service workers and shop and market sales workers 6.6
Skilled agricultural and fishery workers 2.6
Craft and related trade workers 18.1
Plant and machine operators and assemblers 0.5
Primary requirements n/a n/a
Elementary occupations n/a
Various 8.2
Legislators, senior officials and managers 8.2
Unclassified n/a
Armed forces n/a
Spread of scores (by pillar and overall)
Japan
High-income economies
Asia and the Pacific

2.1: Country Profiles
268 | The Human Capital Report
Pillar 1: Education Rank/122 Z-Score Country Value Sample Minimum Sample Maximum
Access
Primary enrolment rate (%) .....................................................................3.........................0.780...................... 100...........................58 ......................... 100
Secondary enrolment rate (%) ................................................................1.........................1.188...................... 100...........................16 ......................... 100
Tertiary enrolment ratio (%) ...................................................................33.........................0.729........................ 60.............................1 ......................... 103
Education gender gap2 .........................................................................74.........................0.375................... 0.987......................0.645 ...................... 1.000
Quality
Internet access in schools1 ...................................................................33.........................0.670..................... 5.16........................1.64 ........................ 6.64
Quality of the education system1 ..........................................................41.........................0.337..................... 4.10........................1.99 ........................ 5.98
Quality of primary schools1 ...................................................................17.........................1.079..................... 5.11........................1.97 ........................ 6.82
Quality of math & science education1 ...................................................29.........................0.651..................... 4.66........................1.88 ........................ 6.29
Quality of management schools1 ..........................................................75.......................–0.306..................... 4.04........................2.29 ........................ 6.09
Attainment
Primary education attainment (% population age 25+) ..........................34.........................0.403........................ 86.............................5 ......................... 100
Secondary education attainment (% population age 25+) .....................—..............................— .........................— .............................2 ......................... 100
Tertiary education attainment (% population age 25+) ..........................17.........................1.003........................ 30.............................0 ........................... 44
Pillar 2: Health and Wellness Rank/122 Z-Score Country Value Sample Minimum Sample Maximum
Survival
Infant mortality (per 1,000 live births) ......................................................1.........................0.877.......................... 2.............................2 ........................... 98
Life expectancy .....................................................................................1.........................1.271........................ 83...........................50 ........................... 83
Survival gender gap2 ............................................................................28.........................0.714................... 0.979......................0.920 ...................... 0.980
Health
Stunting and wasting (% in children under 5) ........................................—..............................— .........................— ..........................1.2 ........................ 36.5
Unhealthy life years (% of life expectancy) ..............................................1.........................1.031 .......................... 8 .............................8 ........................... 66
Deaths under 60 from non-communicable
diseases (% of all NCD deaths) ........................................................5.........................1.352 ....................... 9.4 ..........................7.3 ........................ 55.8
Obesity (% of adults with BMI ≥ 30) .......................................................9.........................1.481 ....................... 4.5 ..........................1.1 ........................ 42.8
Business impact of non-communicable diseases1 ................................43.........................0.393 ..................... 4.66 ........................2.74 ........................ 5.87
Business impact of communicable diseases1 .......................................49.........................0.488 ..................... 5.96 ........................3.13 ........................ 6.90
Well-being
Stress (% of respondents)7 ..................................................................42.........................0.215........................ 28.............................8 ........................... 69
Depression (% of respondents)7 ...........................................................97.......................–0.978........................ 18.............................2 ........................... 37
Services
Water, sanitation and hygiene (% with access) .......................................1.........................0.815................... 100.0........................31.1 ...................... 100.0
Healthcare quality1..................................................................................8.........................1.661..................... 6.13........................1.78 ........................ 6.75
Healthcare accessibility1 .......................................................................10.........................1.542..................... 6.55........................2.41 ........................ 6.75
Pillar 3: Workforce and Employment Rank/122 Z-Score Country Value Sample Minimum Sample Maximum
Participation
Labour force participation rate, age 15-64 (%) .....................................36.........................0.502..................... 74.1........................43.4 ........................ 90.6
Labour force participation rate, age 65+ (%) .........................................54.......................–0.152..................... 21.7..........................1.6 ........................ 91.2
Economic participation gender gap2 .....................................................88.......................–0.577................... 0.576......................0.310 ...................... 0.839
Unemployment rate (%) ........................................................................27.........................0.695....................... 5.1..........................0.3 ........................ 32.0
Youth unemployment rate (%) ...............................................................16.........................0.967....................... 9.2..........................1.6 ........................ 48.2
Talent
Country capacity to attract talent1 ........................................................65.......................–0.120..................... 3.32........................1.48 ........................ 6.08
Country capacity to retain talent1..........................................................26.........................0.807..................... 4.31........................1.81 ........................ 5.97
Ease of finding skilled employees1 ........................................................26.........................0.871..................... 4.59........................2.13 ........................ 5.69
Pay related to productivity1 ...................................................................11.........................1.252..................... 4.69........................2.37 ........................ 5.25
Capacity for innovation1..........................................................................6.........................2.331..................... 5.56........................2.31 ........................ 5.84
Index of Economic Complexity3 ..............................................................1.........................2.370..................... 2.37......................–1.96 ........................ 2.37
Firm level technology absorption1 ...........................................................6.........................1.750..................... 6.06........................3.17 ........................ 6.23
Scientific and technical journal articles (per 1,000 people) ....................25.........................0.681................... 0.392......................0.000 ...................... 1.242
Median age of the working population ....................................................5.........................1.494........................ 41...........................28 ........................... 42
Training
Staff training1 ..........................................................................................4.........................2.029..................... 5.35........................2.51 ........................ 5.57
Training services1 ..................................................................................10.........................1.534..................... 5.52........................2.67 ........................ 6.47
Japan

2.1: Country Profiles
NOTESIn the sections for Pillar 1, Pillar 2, Pillar 3 and Pillar 4, values under Country Value, Sample Minimum and Sample Maximum refer to underlying data for each variable.For further details and explanations, please refer to the section “How to Read the Country Profiles”.1 Survey data responses on a 1- to 7-scale (1 = worst score, 7 = best score)2 Data on a 0- to 1-scale (0 = worst score, 1 = best score)3 Data from -1.960 (worst score) to 2.367 (best score)4 Rank number on a list of 185 countries5 Index on a scale of 0 (perfect inequality) to 100 (perfect equality)6 International test scores7 Perception survey data. Percentage of yes responses.8 Score (1 = best, 7 = worst)9 Reported in relation to UK score (100)
The Human Capital Report | 269
JapanPillar 4: Enabling Environment Rank/122 Z-Score Country Value Sample Minimum Sample Maximum
Infrastructure
Mobile users (per 100 people) ..............................................................67.......................–0.062...................... 105...........................17 ......................... 191
Internet users (per 100 people) .............................................................17.........................1.274........................ 80.............................1 ........................... 95
Quality of domestic transport1 ................................................................3.........................2.091..................... 6.29........................2.08 ........................ 6.51
Collaboration
State of cluster development1 ................................................................6.........................1.860..................... 5.22........................2.33 ........................ 5.49
Business and university R&D collaboration1 ..........................................16.........................1.311..................... 4.96........................2.11 ........................ 5.84
Legal framework
Doing Business Index4 .........................................................................22.........................1.085........................ 24.............................1 ......................... 180
Social safety net protection1 .................................................................19.........................1.153..................... 5.03........................2.10 ........................ 6.26
Intellectual property protection and property rights1..............................10.........................1.648 ..................... 5.77 ........................1.62 ........................ 6.31
Social mobility
Social mobility1 .....................................................................................16.........................1.362..................... 5.62........................2.78 ........................ 6.36
Additional indicatorsDemographics Value
Child dependency ratio (%)..................................................................... 20.8Aged dependency ratio (%) .................................................................... 36.0Fertility rate (births per woman) ................................................................. 1.3Sex ratio at birth (female/male) ............................................................... 0.94Population below age 20 (%) .................................................................. 18.0Population above age 60 (%) .................................................................. 30.7
Education
Public spending on education (% of GDP) ................................................ 3.8Technical/vocational enrolment as % of total
enrolment in secondary school ........................................................... 12Adult literacy (%) .........................................................................................—Boys not in primary school (%) ...................................................................—Girls not in primary school (%) ....................................................................—Education poverty (% of children age 17-22
with less than 2-4 years schooling) ......................................................—Private enrolment in primary school (% of primary) ................................... 1.1Private enrolment in secondary school (% of secondary) ........................ 19.1PIRLS6 .......................................................................................................—PISA math scores6 .................................................................................. 529PISA reading scores6 ............................................................................... 520PISA science scores6 .............................................................................. 539TIMSS 4th grade math6 ........................................................................... 585TIMSS 4th grade science6 ....................................................................... 559TIMSS 8th grade math6 ........................................................................... 570TIMSS 8th grade science6 ....................................................................... 558
Health
Prevalence of visual impairment (%) .......................................................... 0.5Public spending on health (% of GDP) ...................................................... 9.3Business impact of heart disease1 .......................................................... 4.75Business impact of cancer1 .................................................................... 4.54Business impact of mental illness1 .......................................................... 4.05Business impact of diabetes1 ................................................................. 4.73Business impact of chronic respiratory disease1 ..................................... 5.21Business impact of HIV/AIDS1 ................................................................ 5.81Business impact of tuberculosis1 ............................................................ 5.92Business impact of malaria1 ................................................................... 6.17
Society Value
Freedom in the World8................................................................................. 1Democracy Index (rank/165) ...................................................................... 23Population living in urban area (%) .......................................................... 91.7Gini Index (income)5................................................................................ 24.9Accessibility of digital content1 ............................................................... 6.24Extent of virtual social networks use1 ..................................................... 5.72
Workforce
Economic activity (agriculture) — % of total activity .................................. 3.7Economic activity (industry) — % of total activity .................................... 25.3Economic activity (services) — % of total activity .................................... 69.7GDP per person employed (US$) ....................................................... 44,567Cooperation in labour-employer relations1 .............................................. 5.57Emigration rate of the tertiary educated (%) .............................................. 1.2Labour force with tertiary education (%) ................................................. 41.4Number of patent applications (per 1,000 people) .............................. 2.6902Hiring and firing practices1 ...................................................................... 2.90Retirement age, male ................................................................................ 65Retirement age, female .............................................................................. 65Number of informal sector workers (1,000s) ...............................................—Total employed (1,000s) ..................................................................... 62,570Total unemployed (1,000s) .................................................................... 3,340Unemployment for 12 months or more
as a % of total unemployment ......................................................... 36.2Total youth not in education or employment (1,000s) .................................—Unemployment for 12 months or more (1,000s) ................................ 1,210.0Global Innovation Index (rank/142) ............................................................ 22Global Talent Index (rank/60) ..................................................................... 27Quality of Labour Force (rank/60) .............................................................. 21Talent Environment (rank/60) ..................................................................... 21IQ measure9 ......................................................................................... 104.1

2.1: Country Profiles
270 | The Human Capital Report
Rank/122 Score
Year
s (5
yea
r age
gro
ups)
Percent of total population
0–4
5–9
10–14
15–19
20–24
25–29
30–34
35–39
40–44
45–49
50–54
55–59
60–64
65–69
70–74
75–79
80–84
85–89
90–94
95–99
100+
0 1 2 3 4 5 6 7 88 7 6 5 4 3 2 1 0
JordanHuman Capital Index 2013 52 0.005
Pillar 1: Education 44 0.350
Pillar 2: Health and wellness 68 –0.015
Pillar 3: Workforce and employment 97 –0.481
Pillar 4: Enabling environment 46 0.167
Key Indicators
Total population (1,000s) 6,454.6
Median age of population 22
GDP per capita PPP (constant 2005, international $) 5,298
GDP growth (annual %) 2.8
Male Female Additional indicators
n Total population n Total population Aged dependency: 5.5%
n Labour force participation n Labour force participation Youth dependency: 57.0%
n Primary and secondary enrolment n Primary and secondary enrolment Male labour force participation, age 65+: n/a
Female labour force participation, age 65+: n/a
Education and workforce distribution

The Human Capital Report | 271
2.1: Country Profiles
HCI s
core
–2.5
–2.0
–1.5
–1.0
–0.5
0.0
0.5
1.0
1.5
2.0
2.5
Overall Index
Enablingenvironment
Workforce andemployment
Health andwellness
Education
JordanEmployment types, educational requirements and educational attainment
Percent of population Educational in employment type attainment (%)
Tertiary requirements n/a 16.2
Professionals n/a
Technicians and associate professionals n/a
Secondary requirements n/a 47.0
Clerks n/a
Service workers and shop and market sales workers n/a
Skilled agricultural and fishery workers n/a
Craft and related trade workers n/a
Plant and machine operators and assemblers n/a
Primary requirements n/a 11.0
Elementary occupations n/a
Various n/a
Legislators, senior officials and managers n/a
Unclassified n/a
Armed forces n/a
Spread of scores (by pillar and overall)
Jordan
Upper-middle income economies
Middle East and North Africa

2.1: Country Profiles
272 | The Human Capital Report
Pillar 1: Education Rank/122 Z-Score Country Value Sample Minimum Sample Maximum
Access
Primary enrolment rate (%) ...................................................................88.......................–0.314........................ 91...........................58 ......................... 100
Secondary enrolment rate (%) ..............................................................38.........................0.582........................ 86...........................16 ......................... 100
Tertiary enrolment ratio (%) ...................................................................61.......................–0.104........................ 38.............................1 ......................... 103
Education gender gap2 .........................................................................75.........................0.362................... 0.986......................0.645 ...................... 1.000
Quality
Internet access in schools1 ...................................................................40.........................0.518..................... 4.97........................1.64 ........................ 6.64
Quality of the education system1 ..........................................................26.........................0.908..................... 4.61........................1.99 ........................ 5.98
Quality of primary schools1 ...................................................................37.........................0.646..................... 4.64........................1.97 ........................ 6.82
Quality of math & science education1 ...................................................25.........................0.745..................... 4.75........................1.88 ........................ 6.29
Quality of management schools1 ..........................................................41.........................0.340..................... 4.58........................2.29 ........................ 6.09
Attainment
Primary education attainment (% population age 25+) ..........................36.........................0.350........................ 85.............................5 ......................... 100
Secondary education attainment (% population age 25+) .....................34.........................0.417........................ 74.............................2 ......................... 100
Tertiary education attainment (% population age 25+) ..........................50.......................–0.245........................ 16.............................0 ........................... 44
Pillar 2: Health and Wellness Rank/122 Z-Score Country Value Sample Minimum Sample Maximum
Survival
Infant mortality (per 1,000 live births) ....................................................73.........................0.159........................ 18.............................2 ........................... 98
Life expectancy ...................................................................................59.........................0.177........................ 74...........................50 ........................... 83
Survival gender gap2 ............................................................................80.......................–0.033................... 0.971......................0.920 ...................... 0.980
Health
Stunting and wasting (% in children under 5) ..........................................9.........................1.179....................... 5.0..........................1.2 ........................ 36.5
Unhealthy life years (% of life expectancy) ............................................77.......................–0.039........................ 15.............................8 ........................... 66
Deaths under 60 from non-communicable
diseases (% of all NCD deaths) ......................................................84.......................–0.497 ..................... 32.9 ..........................7.3 ........................ 55.8
Obesity (% of adults with BMI ≥ 30) ...................................................119.......................–1.664..................... 34.3..........................1.1 ........................ 42.8
Business impact of non-communicable diseases1 ..................................8.........................1.326..................... 5.08........................2.74 ........................ 5.87
Business impact of communicable diseases1 .......................................14.........................1.077..................... 6.55........................3.13 ........................ 6.90
Well-being
Stress (% of respondents)7 ................................................................112.......................–1.646........................ 52.............................8 ........................... 69
Depression (% of respondents)7 .........................................................110.......................–2.094........................ 25.............................2 ........................... 37
Services
Water, sanitation and hygiene (% with access) .....................................48.........................0.665..................... 97.1........................31.1 ...................... 100.0
Healthcare quality1................................................................................36.........................0.697..................... 4.96........................1.78 ........................ 6.75
Healthcare accessibility1 .......................................................................44.........................0.475..................... 5.24........................2.41 ........................ 6.75
Pillar 3: Workforce and Employment Rank/122 Z-Score Country Value Sample Minimum Sample Maximum
Participation
Labour force participation rate, age 15-64 (%) ...................................121.......................–2.637..................... 43.4........................43.4 ........................ 90.6
Labour force participation rate, age 65+ (%) .........................................99.......................–0.947....................... 6.3..........................1.6 ........................ 91.2
Economic participation gender gap2 ...................................................110.......................–1.816................... 0.430......................0.310 ...................... 0.839
Unemployment rate (%) ........................................................................90.......................–0.718..................... 12.5..........................0.3 ........................ 32.0
Youth unemployment rate (%) ...............................................................85.......................–0.863..................... 27.0..........................1.6 ........................ 48.2
Talent
Country capacity to attract talent1 ........................................................—..............................— .........................— ........................1.48 ........................ 6.08
Country capacity to retain talent1..........................................................48.........................0.137..................... 3.66........................1.81 ........................ 5.97
Ease of finding skilled employees1 ........................................................—..............................— .........................— ........................2.13 ........................ 5.69
Pay related to productivity1 ...................................................................49.........................0.343..................... 4.13........................2.37 ........................ 5.25
Capacity for innovation1........................................................................59.......................–0.271..................... 3.49........................2.31 ........................ 5.84
Index of Economic Complexity3 ............................................................42.........................0.206..................... 0.31......................–1.96 ........................ 2.37
Firm level technology absorption1 .........................................................24.........................1.089..................... 5.59........................3.17 ........................ 6.23
Scientific and technical journal articles (per 1,000 people) ....................48.......................–0.417................... 0.063......................0.000 ...................... 1.242
Median age of the working population ..................................................91.......................–0.920........................ 31...........................28 ........................... 42
Training
Staff training1 ........................................................................................72.......................–0.264..................... 3.88........................2.51 ........................ 5.57
Training services1 ..................................................................................40.........................0.348..................... 4.58........................2.67 ........................ 6.47
Jordan

2.1: Country Profiles
NOTESIn the sections for Pillar 1, Pillar 2, Pillar 3 and Pillar 4, values under Country Value, Sample Minimum and Sample Maximum refer to underlying data for each variable.For further details and explanations, please refer to the section “How to Read the Country Profiles”.1 Survey data responses on a 1- to 7-scale (1 = worst score, 7 = best score)2 Data on a 0- to 1-scale (0 = worst score, 1 = best score)3 Data from -1.960 (worst score) to 2.367 (best score)4 Rank number on a list of 185 countries5 Index on a scale of 0 (perfect inequality) to 100 (perfect equality)6 International test scores7 Perception survey data. Percentage of yes responses.8 Score (1 = best, 7 = worst)9 Reported in relation to UK score (100)
The Human Capital Report | 273
JordanPillar 4: Enabling Environment Rank/122 Z-Score Country Value Sample Minimum Sample Maximum
Infrastructure
Mobile users (per 100 people) ..............................................................42.........................0.327...................... 118...........................17 ......................... 191
Internet users (per 100 people) .............................................................75.......................–0.319........................ 35.............................1 ........................... 95
Quality of domestic transport1 ..............................................................30.........................0.627 ..................... 5.01 ........................2.08 ........................ 6.51
Collaboration
State of cluster development1 ..............................................................24.........................0.847..................... 4.50........................2.33 ........................ 5.49
Business and university R&D collaboration1 ..........................................74.......................–0.473 ..................... 3.36 ........................2.11 ........................ 5.84
Legal framework
Doing Business Index4 .........................................................................79.......................–0.505...................... 106.............................1 ......................... 180
Social safety net protection1 .................................................................42.........................0.196..................... 4.00........................2.10 ........................ 6.26
Intellectual property protection and property rights1..............................30.........................0.836 ..................... 4.94 ........................1.62 ........................ 6.31
Social mobility
Social mobility1 .....................................................................................58.......................–0.032..................... 4.36........................2.78 ........................ 6.36
Additional indicatorsDemographics Value
Child dependency ratio (%)..................................................................... 57.0Aged dependency ratio (%) ...................................................................... 5.5Fertility rate (births per woman) ................................................................. 3.6Sex ratio at birth (female/male) ............................................................... 0.94Population below age 20 (%) .................................................................. 45.3Population above age 60 (%) .................................................................... 5.3
Education
Public spending on education (% of GDP) ................................................ 4.9Technical/vocational enrolment as % of total
enrolment in secondary school ............................................................. 3Adult literacy (%) ..................................................................................... 95.9Boys not in primary school (%) .................................................................... 9Girls not in primary school (%) ..................................................................... 9Education poverty (% of children age 17-22
with less than 2-4 years schooling) ................................................ 0.036Private enrolment in primary school (% of primary) ................................. 33.1Private enrolment in secondary school (% of secondary) ........................ 18.6PIRLS6 .......................................................................................................—PISA math scores6 .................................................................................. 387PISA reading scores6 ............................................................................... 405PISA science scores6 .............................................................................. 415TIMSS 4th grade math6 ..............................................................................—TIMSS 4th grade science6 ..........................................................................—TIMSS 8th grade math6 ........................................................................... 406TIMSS 8th grade science6 ....................................................................... 449
Health
Prevalence of visual impairment (%) .......................................................... 2.4Public spending on health (% of GDP) ...................................................... 8.4Business impact of heart disease1 .......................................................... 5.03Business impact of cancer1 .................................................................... 4.95Business impact of mental illness1 .......................................................... 5.49Business impact of diabetes1 ................................................................. 4.79Business impact of chronic respiratory disease1 ..................................... 5.12Business impact of HIV/AIDS1 ................................................................ 6.55Business impact of tuberculosis1 ............................................................ 6.50Business impact of malaria1 ................................................................... 6.60
Society Value
Freedom in the World8................................................................................. 6Democracy Index (rank/165) .................................................................... 121Population living in urban area (%) .......................................................... 83.0Gini Index (income)5................................................................................ 35.4Accessibility of digital content1 ............................................................... 5.34Extent of virtual social networks use1 ..................................................... 6.01
Workforce
Economic activity (agriculture) — % of total activity .................................. 1.7Economic activity (industry) — % of total activity .................................... 18.1Economic activity (services) — % of total activity .................................... 80.1GDP per person employed (US$) ....................................................... 19,443Cooperation in labour-employer relations1 .............................................. 4.60Emigration rate of the tertiary educated (%) .............................................. 7.4Labour force with tertiary education (%) .....................................................—Number of patent applications (per 1,000 people) .............................. 0.0620Hiring and firing practices1 ...................................................................... 3.98Retirement age, male .................................................................................—Retirement age, female ...............................................................................—Number of informal sector workers (1,000s) ...............................................—Total employed (1,000s) .............................................................................—Total unemployed (1,000s) ..........................................................................—Unemployment for 12 months or more
as a % of total unemployment .............................................................—Total youth not in education or employment (1,000s) .................................—Unemployment for 12 months or more (1,000s) .........................................—Global Innovation Index (rank/142) ............................................................ 61Global Talent Index (rank/60) ......................................................................—Quality of Labour Force (rank/60) ...............................................................—Talent Environment (rank/60) ......................................................................—IQ measure9 ........................................................................................... 86.7

2.1: Country Profiles
274 | The Human Capital Report
Rank/122 Score
Year
s (5
yea
r age
gro
ups)
Percent of total population
0–4
5–9
10–14
15–19
20–24
25–29
30–34
35–39
40–44
45–49
50–54
55–59
60–64
65–69
70–74
75–79
80–84
85–89
90–94
95–99
100+
0 1 2 3 4 5 66 5 4 3 2 1 0
KazakhstanHuman Capital Index 2013 45 0.124
Pillar 1: Education 43 0.359
Pillar 2: Health and wellness 69 –0.031
Pillar 3: Workforce and employment 40 0.107
Pillar 4: Enabling environment 51 0.061
Key Indicators
Total population (1,000s) 15,921.1
Median age of population 29
GDP per capita PPP (constant 2005, international $) 11,973
GDP growth (annual %) 5.0
Male Female Additional indicators
n Total population n Total population Aged dependency: 9.7%
n Labour force participation n Labour force participation Youth dependency: 36.4%
n Primary and secondary enrolment n Primary and secondary enrolment Male labour force participation, age 65+: 0.2%
Female labour force participation, age 65+: 0.2%
Education and workforce distribution

The Human Capital Report | 275
2.1: Country Profiles
HCI s
core
–2.5
–2.0
–1.5
–1.0
–0.5
0.0
0.5
1.0
1.5
2.0
2.5
Overall Index
Enablingenvironment
Workforce andemployment
Health andwellness
Education
KazakhstanEmployment types, educational requirements and educational attainment
Percent of population Educational in employment type attainment (%)
Tertiary requirements 12.6 25.5
Professionals 4.2
Technicians and associate professionals 8.4
Secondary requirements 33.3 42.8
Clerks 6.0
Service workers and shop and market sales workers 1.4
Skilled agricultural and fishery workers 9.0
Craft and related trade workers 10.7
Plant and machine operators and assemblers 6.2
Primary requirements 6.0 0.6
Elementary occupations 6.0
Various n/a
Legislators, senior officials and managers n/a
Unclassified n/a
Armed forces n/a
Spread of scores (by pillar and overall)
Kazakhstan
Upper-middle income economies
Europe and Central Asia
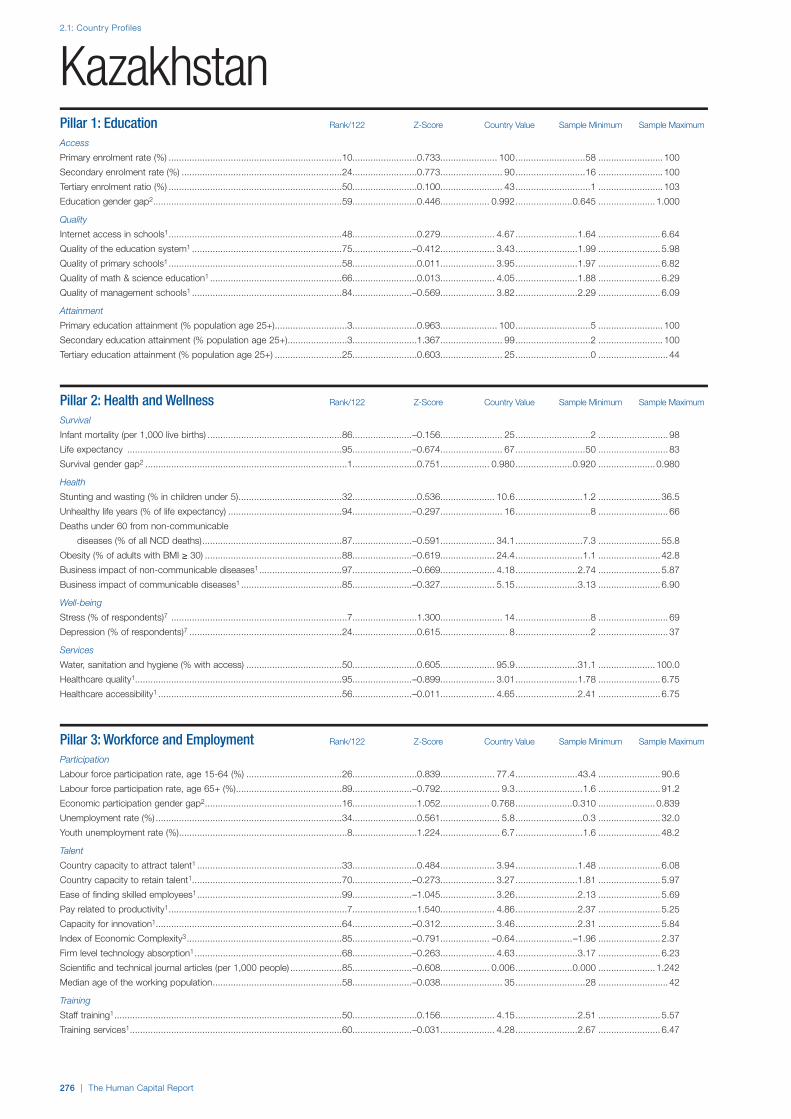
2.1: Country Profiles
276 | The Human Capital Report
Pillar 1: Education Rank/122 Z-Score Country Value Sample Minimum Sample Maximum
Access
Primary enrolment rate (%) ...................................................................10.........................0.733...................... 100...........................58 ......................... 100
Secondary enrolment rate (%) ..............................................................24.........................0.773........................ 90...........................16 ......................... 100
Tertiary enrolment ratio (%) ...................................................................50.........................0.100........................ 43.............................1 ......................... 103
Education gender gap2 .........................................................................59.........................0.446................... 0.992......................0.645 ...................... 1.000
Quality
Internet access in schools1 ...................................................................48.........................0.279..................... 4.67........................1.64 ........................ 6.64
Quality of the education system1 ..........................................................75.......................–0.412..................... 3.43........................1.99 ........................ 5.98
Quality of primary schools1 ...................................................................58.........................0.011..................... 3.95........................1.97 ........................ 6.82
Quality of math & science education1 ...................................................66.........................0.013..................... 4.05........................1.88 ........................ 6.29
Quality of management schools1 ..........................................................84.......................–0.569..................... 3.82........................2.29 ........................ 6.09
Attainment
Primary education attainment (% population age 25+) ............................3.........................0.963...................... 100.............................5 ......................... 100
Secondary education attainment (% population age 25+) .......................3.........................1.367........................ 99.............................2 ......................... 100
Tertiary education attainment (% population age 25+) ..........................25.........................0.603........................ 25.............................0 ........................... 44
Pillar 2: Health and Wellness Rank/122 Z-Score Country Value Sample Minimum Sample Maximum
Survival
Infant mortality (per 1,000 live births) ....................................................86.......................–0.156........................ 25.............................2 ........................... 98
Life expectancy ...................................................................................95.......................–0.674........................ 67...........................50 ........................... 83
Survival gender gap2 ..............................................................................1.........................0.751................... 0.980......................0.920 ...................... 0.980
Health
Stunting and wasting (% in children under 5) ........................................32.........................0.536..................... 10.6..........................1.2 ........................ 36.5
Unhealthy life years (% of life expectancy) ............................................94.......................–0.297........................ 16.............................8 ........................... 66
Deaths under 60 from non-communicable
diseases (% of all NCD deaths) ......................................................87.......................–0.591 ..................... 34.1 ..........................7.3 ........................ 55.8
Obesity (% of adults with BMI ≥ 30) .....................................................88.......................–0.619..................... 24.4..........................1.1 ........................ 42.8
Business impact of non-communicable diseases1 ................................97.......................–0.669..................... 4.18........................2.74 ........................ 5.87
Business impact of communicable diseases1 .......................................85.......................–0.327..................... 5.15........................3.13 ........................ 6.90
Well-being
Stress (% of respondents)7 ....................................................................7.........................1.300........................ 14.............................8 ........................... 69
Depression (% of respondents)7 ...........................................................24.........................0.615.......................... 8.............................2 ........................... 37
Services
Water, sanitation and hygiene (% with access) .....................................50.........................0.605..................... 95.9........................31.1 ...................... 100.0
Healthcare quality1................................................................................95.......................–0.899..................... 3.01........................1.78 ........................ 6.75
Healthcare accessibility1 .......................................................................56.......................–0.011..................... 4.65........................2.41 ........................ 6.75
Pillar 3: Workforce and Employment Rank/122 Z-Score Country Value Sample Minimum Sample Maximum
Participation
Labour force participation rate, age 15-64 (%) .....................................26.........................0.839..................... 77.4........................43.4 ........................ 90.6
Labour force participation rate, age 65+ (%) .........................................89.......................–0.792....................... 9.3..........................1.6 ........................ 91.2
Economic participation gender gap2 .....................................................16.........................1.052................... 0.768......................0.310 ...................... 0.839
Unemployment rate (%) ........................................................................34.........................0.561....................... 5.8..........................0.3 ........................ 32.0
Youth unemployment rate (%) .................................................................8.........................1.224....................... 6.7..........................1.6 ........................ 48.2
Talent
Country capacity to attract talent1 ........................................................33.........................0.484..................... 3.94........................1.48 ........................ 6.08
Country capacity to retain talent1..........................................................70.......................–0.273..................... 3.27........................1.81 ........................ 5.97
Ease of finding skilled employees1 ........................................................99.......................–1.045..................... 3.26........................2.13 ........................ 5.69
Pay related to productivity1 .....................................................................7.........................1.540..................... 4.86........................2.37 ........................ 5.25
Capacity for innovation1........................................................................64.......................–0.312..................... 3.46........................2.31 ........................ 5.84
Index of Economic Complexity3 ............................................................85.......................–0.791................... –0.64......................–1.96 ........................ 2.37
Firm level technology absorption1 .........................................................68.......................–0.263..................... 4.63........................3.17 ........................ 6.23
Scientific and technical journal articles (per 1,000 people) ....................85.......................–0.608................... 0.006......................0.000 ...................... 1.242
Median age of the working population ..................................................58.......................–0.038........................ 35...........................28 ........................... 42
Training
Staff training1 ........................................................................................50.........................0.156..................... 4.15........................2.51 ........................ 5.57
Training services1 ..................................................................................60.......................–0.031..................... 4.28........................2.67 ........................ 6.47
Kazakhstan

2.1: Country Profiles
NOTESIn the sections for Pillar 1, Pillar 2, Pillar 3 and Pillar 4, values under Country Value, Sample Minimum and Sample Maximum refer to underlying data for each variable.For further details and explanations, please refer to the section “How to Read the Country Profiles”.1 Survey data responses on a 1- to 7-scale (1 = worst score, 7 = best score)2 Data on a 0- to 1-scale (0 = worst score, 1 = best score)3 Data from -1.960 (worst score) to 2.367 (best score)4 Rank number on a list of 185 countries5 Index on a scale of 0 (perfect inequality) to 100 (perfect equality)6 International test scores7 Perception survey data. Percentage of yes responses.8 Score (1 = best, 7 = worst)9 Reported in relation to UK score (100)
The Human Capital Report | 277
KazakhstanPillar 4: Enabling Environment Rank/122 Z-Score Country Value Sample Minimum Sample Maximum
Infrastructure
Mobile users (per 100 people) ................................................................9.........................1.431...................... 156...........................17 ......................... 191
Internet users (per 100 people) .............................................................56.........................0.041........................ 45.............................1 ........................... 95
Quality of domestic transport1 ..............................................................33.........................0.599..................... 4.99........................2.08 ........................ 6.51
Collaboration
State of cluster development1 ............................................................109.......................–1.173..................... 3.05........................2.33 ........................ 5.49
Business and university R&D collaboration1 ..........................................69.......................–0.393..................... 3.43........................2.11 ........................ 5.84
Legal framework
Doing Business Index4 .........................................................................45.........................0.600........................ 49.............................1 ......................... 180
Social safety net protection1 .................................................................53.......................–0.030..................... 3.75........................2.10 ........................ 6.26
Intellectual property protection and property rights1..............................62.......................–0.148 ..................... 3.94 ........................1.62 ........................ 6.31
Social mobility
Social mobility1 .....................................................................................71.......................–0.376..................... 4.05........................2.78 ........................ 6.36
Additional indicatorsDemographics Value
Child dependency ratio (%)..................................................................... 36.4Aged dependency ratio (%) ...................................................................... 9.7Fertility rate (births per woman) ................................................................. 2.5Sex ratio at birth (female/male) ............................................................... 1.06Population below age 20 (%) .................................................................. 33.5Population above age 60 (%) .................................................................... 9.8
Education
Public spending on education (% of GDP) ................................................ 3.1Technical/vocational enrolment as % of total
enrolment in secondary school ............................................................. 7Adult literacy (%) ..................................................................................... 99.7Boys not in primary school (%) .................................................................... 1Girls not in primary school (%) ..................................................................... 1Education poverty (% of children age 17-22
with less than 2-4 years schooling) ................................................ 0.007Private enrolment in primary school (% of primary) ................................... 0.9Private enrolment in secondary school (% of secondary) .......................... 0.8PIRLS6 .......................................................................................................—PISA math scores6 .................................................................................. 405PISA reading scores6 ............................................................................... 390PISA science scores6 .............................................................................. 400TIMSS 4th grade math6 ........................................................................... 501TIMSS 4th grade science6 ....................................................................... 495TIMSS 8th grade math6 ........................................................................... 487TIMSS 8th grade science6 ....................................................................... 490
Health
Prevalence of visual impairment (%) .......................................................... 1.5Public spending on health (% of GDP) ...................................................... 3.9Business impact of heart disease1 .......................................................... 3.94Business impact of cancer1 .................................................................... 4.08Business impact of mental illness1 .......................................................... 4.69Business impact of diabetes1 ................................................................. 4.41Business impact of chronic respiratory disease1 ..................................... 3.78Business impact of HIV/AIDS1 ................................................................ 5.45Business impact of tuberculosis1 ............................................................ 4.44Business impact of malaria1 ................................................................... 5.57
Society Value
Freedom in the World8................................................................................. 6Democracy Index (rank/165) .................................................................... 143Population living in urban area (%) .......................................................... 53.5Gini Index (income)5................................................................................ 29.0Accessibility of digital content1 ............................................................... 5.29Extent of virtual social networks use1 ..................................................... 5.28
Workforce
Economic activity (agriculture) — % of total activity ................................ 26.5Economic activity (industry) — % of total activity .................................... 19.0Economic activity (services) — % of total activity .................................... 54.6GDP per person employed (US$) ....................................................... 24,271Cooperation in labour-employer relations1 .............................................. 4.68Emigration rate of the tertiary educated (%) .............................................. 1.2Labour force with tertiary education (%) ................................................. 50.0Number of patent applications (per 1,000 people) .............................. 0.1088Hiring and firing practices1 ...................................................................... 4.60Retirement age, male .................................................................................—Retirement age, female ...............................................................................—Number of informal sector workers (1,000s) ...............................................—Total employed (1,000s) ....................................................................... 8,114Total unemployed (1,000s) ....................................................................... 497Unemployment for 12 months or more
as a % of total unemployment ......................................................... 20.0Total youth not in education or employment (1,000s) ........................... 164.2Unemployment for 12 months or more (1,000s) ..................................... 99.3Global Innovation Index (rank/142) ............................................................ 84Global Talent Index (rank/60) ..................................................................... 53Quality of Labour Force (rank/60) .............................................................. 58Talent Environment (rank/60) ..................................................................... 50IQ measure9 ........................................................................................... 84.7

2.1: Country Profiles
278 | The Human Capital Report
Rank/122 Score
Year
s (5
yea
r age
gro
ups)
Percent of total population
0–4
5–9
10–14
15–19
20–24
25–29
30–34
35–39
40–44
45–49
50–54
55–59
60–64
65–69
70–74
75–79
80–84
85–89
90–94
95–99
100+
0 2 4 6 8 1010 8 6 4 2 0
KenyaHuman Capital Index 2013 81 –0.306
Pillar 1: Education 90 –0.503
Pillar 2: Health and wellness 103 –0.603
Pillar 3: Workforce and employment 35 0.226
Pillar 4: Enabling environment 79 –0.347
Key Indicators
Total population (1,000s) 40,909.2
Median age of population 19
GDP per capita PPP (constant 2005, international $) 1,517
GDP growth (annual %) 4.3
Male Female Additional indicators
n Total population n Total population Aged dependency: 4.8%
n Labour force participation n Labour force participation Youth dependency: 77.6%
n Primary and secondary enrolment n Primary and secondary enrolment Male labour force participation, age 65+: n/a
Female labour force participation, age 65+: n/a
Education and workforce distribution

The Human Capital Report | 279
2.1: Country Profiles
HCI s
core
–2.5
–2.0
–1.5
–1.0
–0.5
0.0
0.5
1.0
1.5
2.0
2.5
Overall Index
Enablingenvironment
Workforce andemployment
Health andwellness
Education
KenyaEmployment types, educational requirements and educational attainment
Percent of population Educational in employment type attainment (%)
Tertiary requirements n/a n/a
Professionals n/a
Technicians and associate professionals n/a
Secondary requirements n/a 35.6
Clerks n/a
Service workers and shop and market sales workers n/a
Skilled agricultural and fishery workers n/a
Craft and related trade workers n/a
Plant and machine operators and assemblers n/a
Primary requirements n/a 17.5
Elementary occupations n/a
Various n/a
Legislators, senior officials and managers n/a
Unclassified n/a
Armed forces n/a
Spread of scores (by pillar and overall)
Kenya
Low-income economies
Sub-Saharan Africa
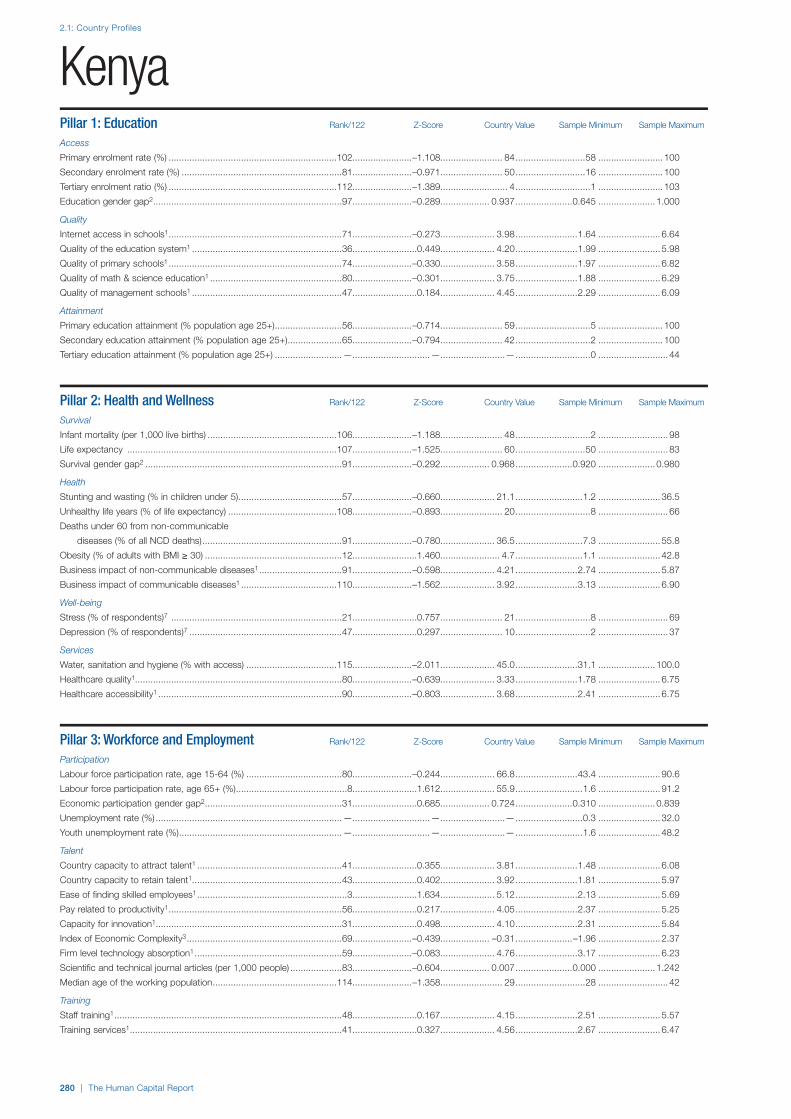
2.1: Country Profiles
280 | The Human Capital Report
Pillar 1: Education Rank/122 Z-Score Country Value Sample Minimum Sample Maximum
Access
Primary enrolment rate (%) .................................................................102.......................–1.108........................ 84...........................58 ......................... 100
Secondary enrolment rate (%) ..............................................................81.......................–0.971........................ 50...........................16 ......................... 100
Tertiary enrolment ratio (%) .................................................................112.......................–1.389.......................... 4.............................1 ......................... 103
Education gender gap2 .........................................................................97.......................–0.289................... 0.937......................0.645 ...................... 1.000
Quality
Internet access in schools1 ...................................................................71.......................–0.273..................... 3.98........................1.64 ........................ 6.64
Quality of the education system1 ..........................................................36.........................0.449..................... 4.20........................1.99 ........................ 5.98
Quality of primary schools1 ...................................................................74.......................–0.330..................... 3.58........................1.97 ........................ 6.82
Quality of math & science education1 ...................................................80.......................–0.301..................... 3.75........................1.88 ........................ 6.29
Quality of management schools1 ..........................................................47.........................0.184..................... 4.45........................2.29 ........................ 6.09
Attainment
Primary education attainment (% population age 25+) ..........................56.......................–0.714........................ 59.............................5 ......................... 100
Secondary education attainment (% population age 25+) .....................65.......................–0.794........................ 42.............................2 ......................... 100
Tertiary education attainment (% population age 25+) ..........................—..............................— .........................— .............................0 ........................... 44
Pillar 2: Health and Wellness Rank/122 Z-Score Country Value Sample Minimum Sample Maximum
Survival
Infant mortality (per 1,000 live births) ..................................................106.......................–1.188........................ 48.............................2 ........................... 98
Life expectancy .................................................................................107.......................–1.525........................ 60...........................50 ........................... 83
Survival gender gap2 ............................................................................91.......................–0.292................... 0.968......................0.920 ...................... 0.980
Health
Stunting and wasting (% in children under 5) ........................................57.......................–0.660..................... 21.1..........................1.2 ........................ 36.5
Unhealthy life years (% of life expectancy) ..........................................108.......................–0.893........................ 20.............................8 ........................... 66
Deaths under 60 from non-communicable
diseases (% of all NCD deaths) ......................................................91.......................–0.780 ..................... 36.5 ..........................7.3 ........................ 55.8
Obesity (% of adults with BMI ≥ 30) .....................................................12.........................1.460....................... 4.7..........................1.1 ........................ 42.8
Business impact of non-communicable diseases1 ................................91.......................–0.598..................... 4.21........................2.74 ........................ 5.87
Business impact of communicable diseases1 .....................................110.......................–1.562..................... 3.92........................3.13 ........................ 6.90
Well-being
Stress (% of respondents)7 ..................................................................21.........................0.757........................ 21.............................8 ........................... 69
Depression (% of respondents)7 ...........................................................47.........................0.297........................ 10.............................2 ........................... 37
Services
Water, sanitation and hygiene (% with access) ...................................115.......................–2.011..................... 45.0........................31.1 ...................... 100.0
Healthcare quality1................................................................................80.......................–0.639..................... 3.33........................1.78 ........................ 6.75
Healthcare accessibility1 .......................................................................90.......................–0.803..................... 3.68........................2.41 ........................ 6.75
Pillar 3: Workforce and Employment Rank/122 Z-Score Country Value Sample Minimum Sample Maximum
Participation
Labour force participation rate, age 15-64 (%) .....................................80.......................–0.244..................... 66.8........................43.4 ........................ 90.6
Labour force participation rate, age 65+ (%) ...........................................8.........................1.612..................... 55.9..........................1.6 ........................ 91.2
Economic participation gender gap2 .....................................................31.........................0.685................... 0.724......................0.310 ...................... 0.839
Unemployment rate (%) ........................................................................—..............................— .........................— ..........................0.3 ........................ 32.0
Youth unemployment rate (%) ...............................................................—..............................— .........................— ..........................1.6 ........................ 48.2
Talent
Country capacity to attract talent1 ........................................................41.........................0.355..................... 3.81........................1.48 ........................ 6.08
Country capacity to retain talent1..........................................................43.........................0.402..................... 3.92........................1.81 ........................ 5.97
Ease of finding skilled employees1 ..........................................................3.........................1.634..................... 5.12........................2.13 ........................ 5.69
Pay related to productivity1 ...................................................................56.........................0.217..................... 4.05........................2.37 ........................ 5.25
Capacity for innovation1........................................................................31.........................0.498..................... 4.10........................2.31 ........................ 5.84
Index of Economic Complexity3 ............................................................69.......................–0.439................... –0.31......................–1.96 ........................ 2.37
Firm level technology absorption1 .........................................................59.......................–0.083..................... 4.76........................3.17 ........................ 6.23
Scientific and technical journal articles (per 1,000 people) ....................83.......................–0.604................... 0.007......................0.000 ...................... 1.242
Median age of the working population ................................................114.......................–1.358........................ 29...........................28 ........................... 42
Training
Staff training1 ........................................................................................48.........................0.167..................... 4.15........................2.51 ........................ 5.57
Training services1 ..................................................................................41.........................0.327..................... 4.56........................2.67 ........................ 6.47
Kenya
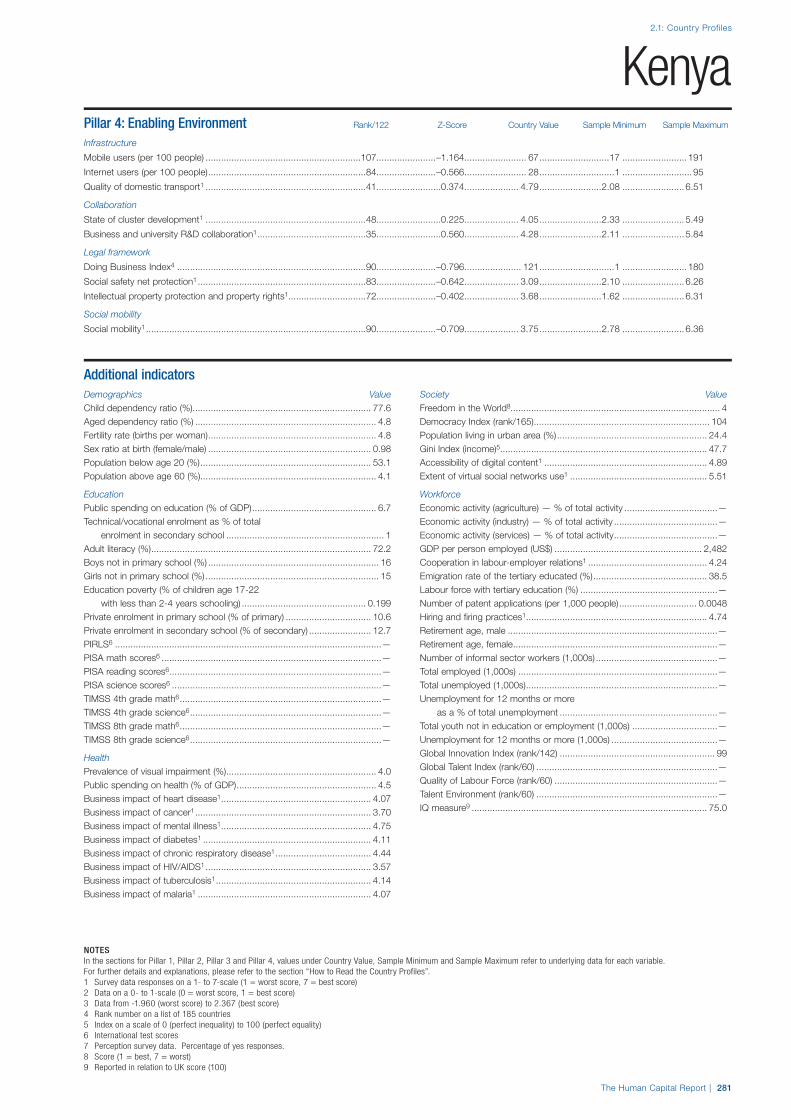
2.1: Country Profiles
NOTESIn the sections for Pillar 1, Pillar 2, Pillar 3 and Pillar 4, values under Country Value, Sample Minimum and Sample Maximum refer to underlying data for each variable.For further details and explanations, please refer to the section “How to Read the Country Profiles”.1 Survey data responses on a 1- to 7-scale (1 = worst score, 7 = best score)2 Data on a 0- to 1-scale (0 = worst score, 1 = best score)3 Data from -1.960 (worst score) to 2.367 (best score)4 Rank number on a list of 185 countries5 Index on a scale of 0 (perfect inequality) to 100 (perfect equality)6 International test scores7 Perception survey data. Percentage of yes responses.8 Score (1 = best, 7 = worst)9 Reported in relation to UK score (100)
The Human Capital Report | 281
KenyaPillar 4: Enabling Environment Rank/122 Z-Score Country Value Sample Minimum Sample Maximum
Infrastructure
Mobile users (per 100 people) ............................................................107.......................–1.164........................ 67...........................17 ......................... 191
Internet users (per 100 people) .............................................................84.......................–0.566........................ 28.............................1 ........................... 95
Quality of domestic transport1 ..............................................................41.........................0.374..................... 4.79........................2.08 ........................ 6.51
Collaboration
State of cluster development1 ..............................................................48.........................0.225..................... 4.05........................2.33 ........................ 5.49
Business and university R&D collaboration1 ..........................................35.........................0.560 ..................... 4.28 ........................2.11 ........................ 5.84
Legal framework
Doing Business Index4 .........................................................................90.......................–0.796...................... 121.............................1 ......................... 180
Social safety net protection1 .................................................................83.......................–0.642..................... 3.09........................2.10 ........................ 6.26
Intellectual property protection and property rights1..............................72.......................–0.402 ..................... 3.68 ........................1.62 ........................ 6.31
Social mobility
Social mobility1 .....................................................................................90.......................–0.709..................... 3.75........................2.78 ........................ 6.36
Additional indicatorsDemographics Value
Child dependency ratio (%)..................................................................... 77.6Aged dependency ratio (%) ...................................................................... 4.8Fertility rate (births per woman) ................................................................. 4.8Sex ratio at birth (female/male) ............................................................... 0.98Population below age 20 (%) .................................................................. 53.1Population above age 60 (%) .................................................................... 4.1
Education
Public spending on education (% of GDP) ................................................ 6.7Technical/vocational enrolment as % of total
enrolment in secondary school ............................................................. 1Adult literacy (%) ..................................................................................... 72.2Boys not in primary school (%) .................................................................. 16Girls not in primary school (%) ................................................................... 15Education poverty (% of children age 17-22
with less than 2-4 years schooling) ................................................ 0.199Private enrolment in primary school (% of primary) ................................. 10.6Private enrolment in secondary school (% of secondary) ........................ 12.7PIRLS6 .......................................................................................................—PISA math scores6 .....................................................................................—PISA reading scores6 ..................................................................................—PISA science scores6 .................................................................................—TIMSS 4th grade math6 ..............................................................................—TIMSS 4th grade science6 ..........................................................................—TIMSS 8th grade math6 ..............................................................................—TIMSS 8th grade science6 ..........................................................................—
Health
Prevalence of visual impairment (%) .......................................................... 4.0Public spending on health (% of GDP) ...................................................... 4.5Business impact of heart disease1 .......................................................... 4.07Business impact of cancer1 .................................................................... 3.70Business impact of mental illness1 .......................................................... 4.75Business impact of diabetes1 ................................................................. 4.11Business impact of chronic respiratory disease1 ..................................... 4.44Business impact of HIV/AIDS1 ................................................................ 3.57Business impact of tuberculosis1 ............................................................ 4.14Business impact of malaria1 ................................................................... 4.07
Society Value
Freedom in the World8................................................................................. 4Democracy Index (rank/165) .................................................................... 104Population living in urban area (%) .......................................................... 24.4Gini Index (income)5................................................................................ 47.7Accessibility of digital content1 ............................................................... 4.89Extent of virtual social networks use1 ..................................................... 5.51
Workforce
Economic activity (agriculture) — % of total activity ....................................—Economic activity (industry) — % of total activity ........................................—Economic activity (services) — % of total activity ........................................—GDP per person employed (US$) ......................................................... 2,482Cooperation in labour-employer relations1 .............................................. 4.24Emigration rate of the tertiary educated (%) ............................................ 38.5Labour force with tertiary education (%) .....................................................—Number of patent applications (per 1,000 people) .............................. 0.0048Hiring and firing practices1 ...................................................................... 4.74Retirement age, male .................................................................................—Retirement age, female ...............................................................................—Number of informal sector workers (1,000s) ...............................................—Total employed (1,000s) .............................................................................—Total unemployed (1,000s) ..........................................................................—Unemployment for 12 months or more
as a % of total unemployment .............................................................—Total youth not in education or employment (1,000s) .................................—Unemployment for 12 months or more (1,000s) .........................................—Global Innovation Index (rank/142) ............................................................ 99Global Talent Index (rank/60) ......................................................................—Quality of Labour Force (rank/60) ...............................................................—Talent Environment (rank/60) ......................................................................—IQ measure9 ........................................................................................... 75.0

2.1: Country Profiles
282 | The Human Capital Report
Rank/122 Score
Year
s (5
yea
r age
gro
ups)
Percent of total population
0–4
5–9
10–14
15–19
20–24
25–29
30–34
35–39
40–44
45–49
50–54
55–59
60–64
65–69
70–74
75–79
80–84
85–89
90–94
95–99
100+
0 1 2 3 4 55 4 3 2 1 0
Korea, Rep.Human Capital Index 2013 23 0.640
Pillar 1: Education 17 0.899
Pillar 2: Health and wellness 27 0.481
Pillar 3: Workforce and employment 23 0.596
Pillar 4: Enabling environment 30 0.582
Key Indicators
Total population (1,000s) 48,453.9
Median age of population 38
GDP per capita PPP (constant 2005, international $) 27,991
GDP growth (annual %) 2.0
Male Female Additional indicators
n Total population n Total population Aged dependency: 15.2%
n Labour force participation n Labour force participation Youth dependency: 22.3%
n Primary and secondary enrolment n Primary and secondary enrolment Male labour force participation, age 65+: 1.9%
Female labour force participation, age 65+: 1.4%
Education and workforce distribution

The Human Capital Report | 283
2.1: Country Profiles
HCI s
core
–2.5
–2.0
–1.5
–1.0
–0.5
0.0
0.5
1.0
1.5
2.0
2.5
Overall Index
Enablingenvironment
Workforce andemployment
Health andwellness
Education
Korea, Rep.Employment types, educational requirements and educational attainment
Percent of population Educational in employment type attainment (%)
Tertiary requirements n/a 35.3
Professionals n/a
Technicians and associate professionals n/a
Secondary requirements n/a 47.6
Clerks n/a
Service workers and shop and market sales workers n/a
Skilled agricultural and fishery workers n/a
Craft and related trade workers n/a
Plant and machine operators and assemblers n/a
Primary requirements n/a 11.4
Elementary occupations n/a
Various n/a
Legislators, senior officials and managers n/a
Unclassified n/a
Armed forces n/a
Spread of scores (by pillar and overall)
Korea, Rep.
High-income economies
Asia and the Pacific

2.1: Country Profiles
284 | The Human Capital Report
Pillar 1: Education Rank/122 Z-Score Country Value Sample Minimum Sample Maximum
Access
Primary enrolment rate (%) ...................................................................30.........................0.650........................ 99...........................58 ......................... 100
Secondary enrolment rate (%) ................................................................7.........................1.034........................ 96...........................16 ......................... 100
Tertiary enrolment ratio (%) .....................................................................1.........................2.378...................... 103.............................1 ......................... 103
Education gender gap2 .........................................................................91.........................0.008................... 0.959......................0.645 ...................... 1.000
Quality
Internet access in schools1 ...................................................................11.........................1.429..................... 6.11........................1.64 ........................ 6.64
Quality of the education system1 ..........................................................52.........................0.024..................... 3.82........................1.99 ........................ 5.98
Quality of primary schools1 ...................................................................20.........................0.996..................... 5.02........................1.97 ........................ 6.82
Quality of math & science education1 ...................................................17.........................1.111..................... 5.10........................1.88 ........................ 6.29
Quality of management schools1 ..........................................................47.........................0.184..................... 4.45........................2.29 ........................ 6.09
Attainment
Primary education attainment (% population age 25+) ..........................21.........................0.728........................ 94.............................5 ......................... 100
Secondary education attainment (% population age 25+) .....................26.........................0.748........................ 83.............................2 ......................... 100
Tertiary education attainment (% population age 25+) ............................7.........................1.499........................ 35.............................0 ........................... 44
Pillar 2: Health and Wellness Rank/122 Z-Score Country Value Sample Minimum Sample Maximum
Survival
Infant mortality (per 1,000 live births) ....................................................19.........................0.787.......................... 4.............................2 ........................... 98
Life expectancy ...................................................................................14.........................1.028........................ 81...........................50 ........................... 83
Survival gender gap2 ............................................................................68.........................0.177................... 0.973......................0.920 ...................... 0.980
Health
Stunting and wasting (% in children under 5) ........................................—..............................— .........................— ..........................1.2 ........................ 36.5
Unhealthy life years (% of life expectancy) ............................................46.........................0.380........................ 12.............................8 ........................... 66
Deaths under 60 from non-communicable
diseases (% of all NCD deaths) ......................................................43.........................0.612 ..................... 18.8 ..........................7.3 ........................ 55.8
Obesity (% of adults with BMI ≥ 30) .....................................................27.........................1.186....................... 7.3..........................1.1 ........................ 42.8
Business impact of non-communicable diseases1 ..............................105.......................–0.926..................... 4.06........................2.74 ........................ 5.87
Business impact of communicable diseases1 .......................................74.........................0.029..................... 5.51........................3.13 ........................ 6.90
Well-being
Stress (% of respondents)7 ..................................................................42.........................0.215........................ 28.............................8 ........................... 69
Depression (% of respondents)7 ...........................................................65.......................–0.022........................ 12.............................2 ........................... 37
Services
Water, sanitation and hygiene (% with access) .....................................38.........................0.758..................... 98.9........................31.1 ...................... 100.0
Healthcare quality1................................................................................25.........................1.120..................... 5.47........................1.78 ........................ 6.75
Healthcare accessibility1 .......................................................................34.........................0.904..................... 5.77........................2.41 ........................ 6.75
Pillar 3: Workforce and Employment Rank/122 Z-Score Country Value Sample Minimum Sample Maximum
Participation
Labour force participation rate, age 15-64 (%) .....................................86.......................–0.428..................... 65.0........................43.4 ........................ 90.6
Labour force participation rate, age 65+ (%) .........................................39.........................0.245..................... 29.4..........................1.6 ........................ 91.2
Economic participation gender gap2 ...................................................102.......................–1.143................... 0.509......................0.310 ...................... 0.839
Unemployment rate (%) ........................................................................11.........................0.962....................... 3.7..........................0.3 ........................ 32.0
Youth unemployment rate (%) ...............................................................21.........................0.905....................... 9.8..........................1.6 ........................ 48.2
Talent
Country capacity to attract talent1 ........................................................25.........................0.678..................... 4.14........................1.48 ........................ 6.08
Country capacity to retain talent1..........................................................23.........................0.922..................... 4.42........................1.81 ........................ 5.97
Ease of finding skilled employees1 ........................................................78.......................–0.322..................... 3.76........................2.13 ........................ 5.69
Pay related to productivity1 ...................................................................18.........................1.113..................... 4.60........................2.37 ........................ 5.25
Capacity for innovation1........................................................................21.........................1.063..................... 4.55........................2.31 ........................ 5.84
Index of Economic Complexity3 ............................................................12.........................1.451..................... 1.49......................–1.96 ........................ 2.37
Firm level technology absorption1 .........................................................19.........................1.251..................... 5.71........................3.17 ........................ 6.23
Scientific and technical journal articles (per 1,000 people) ....................22.........................0.922................... 0.464......................0.000 ...................... 1.242
Median age of the working population ..................................................27.........................1.025........................ 39...........................28 ........................... 42
Training
Staff training1 ........................................................................................45.........................0.260..................... 4.21........................2.51 ........................ 5.57
Training services1 ..................................................................................28.........................0.636..................... 4.81........................2.67 ........................ 6.47
Korea, Rep.

2.1: Country Profiles
NOTESIn the sections for Pillar 1, Pillar 2, Pillar 3 and Pillar 4, values under Country Value, Sample Minimum and Sample Maximum refer to underlying data for each variable.For further details and explanations, please refer to the section “How to Read the Country Profiles”.1 Survey data responses on a 1- to 7-scale (1 = worst score, 7 = best score)2 Data on a 0- to 1-scale (0 = worst score, 1 = best score)3 Data from -1.960 (worst score) to 2.367 (best score)4 Rank number on a list of 185 countries5 Index on a scale of 0 (perfect inequality) to 100 (perfect equality)6 International test scores7 Perception survey data. Percentage of yes responses.8 Score (1 = best, 7 = worst)9 Reported in relation to UK score (100)
The Human Capital Report | 285
Korea, Rep.Pillar 4: Enabling Environment Rank/122 Z-Score Country Value Sample Minimum Sample Maximum
Infrastructure
Mobile users (per 100 people) ..............................................................58.........................0.042...................... 109...........................17 ......................... 191
Internet users (per 100 people) .............................................................11.........................1.426........................ 84.............................1 ........................... 95
Quality of domestic transport1 ................................................................8.........................1.627..................... 5.89........................2.08 ........................ 6.51
Collaboration
State of cluster development1 ..............................................................25.........................0.793..................... 4.46........................2.33 ........................ 5.49
Business and university R&D collaboration1 ..........................................24.........................0.998 ..................... 4.68 ........................2.11 ........................ 5.84
Legal framework
Doing Business Index4 ...........................................................................7.........................1.396.......................... 8.............................1 ......................... 180
Social safety net protection1 .................................................................76.......................–0.545..................... 3.19........................2.10 ........................ 6.26
Intellectual property protection and property rights1..............................43.........................0.192 ..................... 4.29 ........................1.62 ........................ 6.31
Social mobility
Social mobility1 .....................................................................................88.......................–0.691..................... 3.76........................2.78 ........................ 6.36
Additional indicatorsDemographics Value
Child dependency ratio (%)..................................................................... 22.3Aged dependency ratio (%) .................................................................... 15.2Fertility rate (births per woman) ................................................................. 1.2Sex ratio at birth (female/male) ............................................................... 0.93Population below age 20 (%) .................................................................. 23.3Population above age 60 (%) .................................................................. 15.6
Education
Public spending on education (% of GDP) ................................................ 5.0Technical/vocational enrolment as % of total
enrolment in secondary school ........................................................... 12Adult literacy (%) .........................................................................................—Boys not in primary school (%) .................................................................... 1Girls not in primary school (%) ..................................................................... 2Education poverty (% of children age 17-22
with less than 2-4 years schooling) ......................................................—Private enrolment in primary school (% of primary) ................................... 1.4Private enrolment in secondary school (% of secondary) ........................ 31.6PIRLS6 .......................................................................................................—PISA math scores6 .................................................................................. 546PISA reading scores6 ............................................................................... 539PISA science scores6 .............................................................................. 538TIMSS 4th grade math6 ........................................................................... 605TIMSS 4th grade science6 ....................................................................... 587TIMSS 8th grade math6 ........................................................................... 613TIMSS 8th grade science6 ....................................................................... 560
Health
Prevalence of visual impairment (%) .......................................................... 0.9Public spending on health (% of GDP) ...................................................... 7.2Business impact of heart disease1 .......................................................... 4.00Business impact of cancer1 .................................................................... 3.80Business impact of mental illness1 .......................................................... 4.29Business impact of diabetes1 ................................................................. 3.98Business impact of chronic respiratory disease1 ..................................... 4.26Business impact of HIV/AIDS1 ................................................................ 5.35Business impact of tuberculosis1 ............................................................ 5.50Business impact of malaria1 ................................................................... 5.67
Society Value
Freedom in the World8................................................................................. 1Democracy Index (rank/165) ...................................................................... 20Population living in urban area (%) .......................................................... 83.5Gini Index (income)5................................................................................ 31.6Accessibility of digital content1 ............................................................... 6.24Extent of virtual social networks use1 ..................................................... 5.87
Workforce
Economic activity (agriculture) — % of total activity .................................. 6.6Economic activity (industry) — % of total activity .................................... 17.0Economic activity (services) — % of total activity .................................... 76.4GDP per person employed (US$) ....................................................... 45,158Cooperation in labour-employer relations1 .............................................. 3.51Emigration rate of the tertiary educated (%) .............................................. 7.5Labour force with tertiary education (%) ................................................. 35.0Number of patent applications (per 1,000 people) .............................. 3.6927Hiring and firing practices1 ...................................................................... 3.46Retirement age, male .................................................................................—Retirement age, female ...............................................................................—Number of informal sector workers (1,000s) ...............................................—Total employed (1,000s) ..................................................................... 23,829Total unemployed (1,000s) ....................................................................... 920Unemployment for 12 months or more
as a % of total unemployment ........................................................... 0.3Total youth not in education or employment (1,000s) .................................—Unemployment for 12 months or more (1,000s) ....................................... 3.0Global Innovation Index (rank/142) ............................................................ 18Global Talent Index (rank/60) ..................................................................... 22Quality of Labour Force (rank/60) .............................................................. 23Talent Environment (rank/60) ..................................................................... 17IQ measure9 ......................................................................................... 104.8
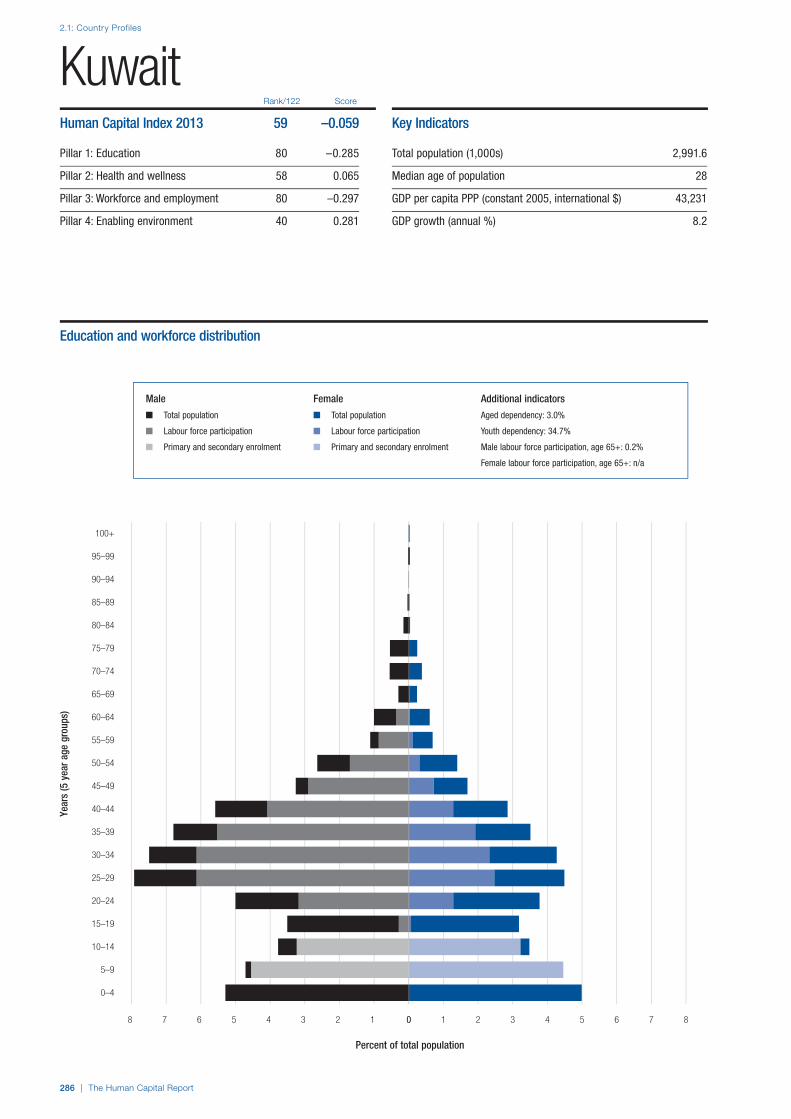
2.1: Country Profiles
286 | The Human Capital Report
Rank/122 Score
Year
s (5
yea
r age
gro
ups)
Percent of total population
0–4
5–9
10–14
15–19
20–24
25–29
30–34
35–39
40–44
45–49
50–54
55–59
60–64
65–69
70–74
75–79
80–84
85–89
90–94
95–99
100+
0 1 2 3 4 5 6 7 88 7 6 5 4 3 2 1 0
KuwaitHuman Capital Index 2013 59 –0.059
Pillar 1: Education 80 –0.285
Pillar 2: Health and wellness 58 0.065
Pillar 3: Workforce and employment 80 –0.297
Pillar 4: Enabling environment 40 0.281
Key Indicators
Total population (1,000s) 2,991.6
Median age of population 28
GDP per capita PPP (constant 2005, international $) 43,231
GDP growth (annual %) 8.2
Male Female Additional indicators
n Total population n Total population Aged dependency: 3.0%
n Labour force participation n Labour force participation Youth dependency: 34.7%
n Primary and secondary enrolment n Primary and secondary enrolment Male labour force participation, age 65+: 0.2%
Female labour force participation, age 65+: n/a
Education and workforce distribution

The Human Capital Report | 287
2.1: Country Profiles
HCI s
core
–2.5
–2.0
–1.5
–1.0
–0.5
0.0
0.5
1.0
1.5
2.0
2.5
Overall Index
Enablingenvironment
Workforce andemployment
Health andwellness
Education
KuwaitEmployment types, educational requirements and educational attainment
Percent of population Educational in employment type attainment (%)
Tertiary requirements n/a 8.3
Professionals n/a
Technicians and associate professionals n/a
Secondary requirements n/a 35.7
Clerks n/a
Service workers and shop and market sales workers n/a
Skilled agricultural and fishery workers n/a
Craft and related trade workers n/a
Plant and machine operators and assemblers n/a
Primary requirements n/a 6.6
Elementary occupations n/a
Various n/a
Legislators, senior officials and managers n/a
Unclassified n/a
Armed forces n/a
Spread of scores (by pillar and overall)
Kuwait
High-income economies
Middle East and North Africa
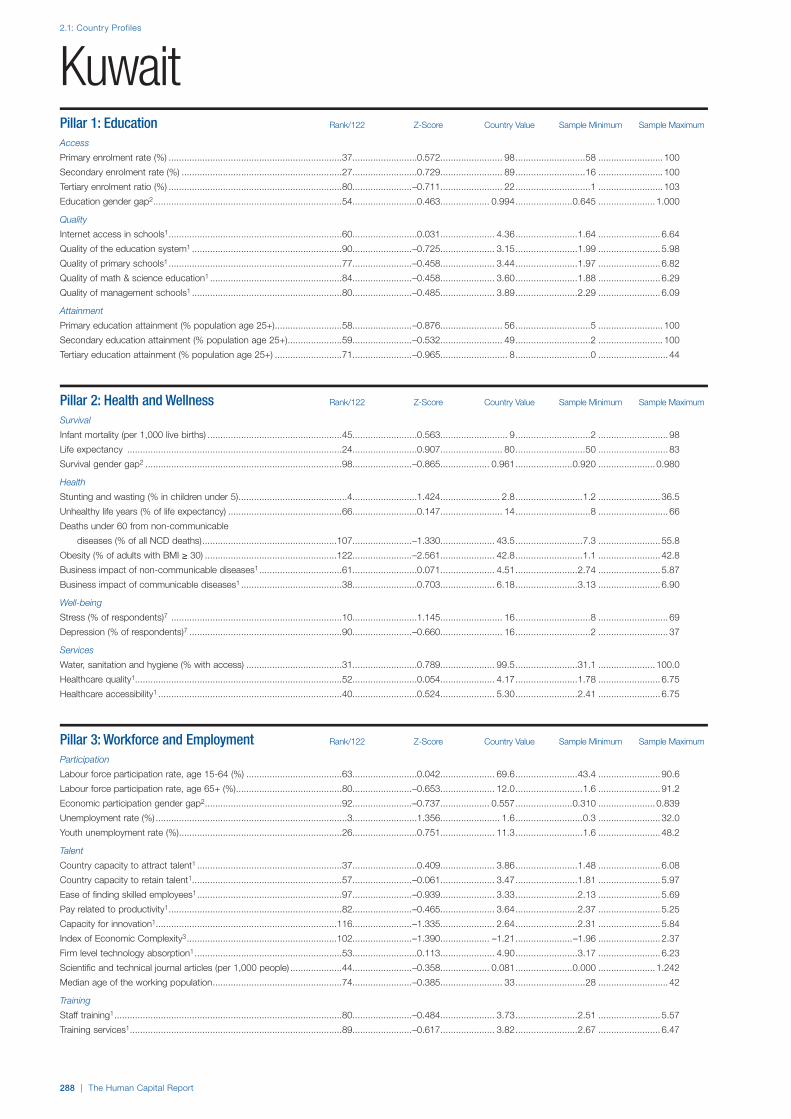
2.1: Country Profiles
288 | The Human Capital Report
Pillar 1: Education Rank/122 Z-Score Country Value Sample Minimum Sample Maximum
Access
Primary enrolment rate (%) ...................................................................37.........................0.572........................ 98...........................58 ......................... 100
Secondary enrolment rate (%) ..............................................................27.........................0.729........................ 89...........................16 ......................... 100
Tertiary enrolment ratio (%) ...................................................................80.......................–0.711........................ 22.............................1 ......................... 103
Education gender gap2 .........................................................................54.........................0.463................... 0.994......................0.645 ...................... 1.000
Quality
Internet access in schools1 ...................................................................60.........................0.031..................... 4.36........................1.64 ........................ 6.64
Quality of the education system1 ..........................................................90.......................–0.725..................... 3.15........................1.99 ........................ 5.98
Quality of primary schools1 ...................................................................77.......................–0.458..................... 3.44........................1.97 ........................ 6.82
Quality of math & science education1 ...................................................84.......................–0.458..................... 3.60........................1.88 ........................ 6.29
Quality of management schools1 ..........................................................80.......................–0.485..................... 3.89........................2.29 ........................ 6.09
Attainment
Primary education attainment (% population age 25+) ..........................58.......................–0.876........................ 56.............................5 ......................... 100
Secondary education attainment (% population age 25+) .....................59.......................–0.532........................ 49.............................2 ......................... 100
Tertiary education attainment (% population age 25+) ..........................71.......................–0.965.......................... 8.............................0 ........................... 44
Pillar 2: Health and Wellness Rank/122 Z-Score Country Value Sample Minimum Sample Maximum
Survival
Infant mortality (per 1,000 live births) ....................................................45.........................0.563.......................... 9.............................2 ........................... 98
Life expectancy ...................................................................................24.........................0.907........................ 80...........................50 ........................... 83
Survival gender gap2 ............................................................................98.......................–0.865................... 0.961......................0.920 ...................... 0.980
Health
Stunting and wasting (% in children under 5) ..........................................4.........................1.424....................... 2.8..........................1.2 ........................ 36.5
Unhealthy life years (% of life expectancy) ............................................66.........................0.147........................ 14.............................8 ........................... 66
Deaths under 60 from non-communicable
diseases (% of all NCD deaths) ....................................................107.......................–1.330 ..................... 43.5 ..........................7.3 ........................ 55.8
Obesity (% of adults with BMI ≥ 30) ...................................................122.......................–2.561..................... 42.8..........................1.1 ........................ 42.8
Business impact of non-communicable diseases1 ................................61.........................0.071..................... 4.51........................2.74 ........................ 5.87
Business impact of communicable diseases1 .......................................38.........................0.703..................... 6.18........................3.13 ........................ 6.90
Well-being
Stress (% of respondents)7 ..................................................................10.........................1.145........................ 16.............................8 ........................... 69
Depression (% of respondents)7 ...........................................................90.......................–0.660........................ 16.............................2 ........................... 37
Services
Water, sanitation and hygiene (% with access) .....................................31.........................0.789..................... 99.5........................31.1 ...................... 100.0
Healthcare quality1................................................................................52.........................0.054..................... 4.17........................1.78 ........................ 6.75
Healthcare accessibility1 .......................................................................40.........................0.524..................... 5.30........................2.41 ........................ 6.75
Pillar 3: Workforce and Employment Rank/122 Z-Score Country Value Sample Minimum Sample Maximum
Participation
Labour force participation rate, age 15-64 (%) .....................................63.........................0.042..................... 69.6........................43.4 ........................ 90.6
Labour force participation rate, age 65+ (%) .........................................80.......................–0.653..................... 12.0..........................1.6 ........................ 91.2
Economic participation gender gap2 .....................................................92.......................–0.737................... 0.557......................0.310 ...................... 0.839
Unemployment rate (%) ..........................................................................3.........................1.356....................... 1.6..........................0.3 ........................ 32.0
Youth unemployment rate (%) ...............................................................26.........................0.751..................... 11.3..........................1.6 ........................ 48.2
Talent
Country capacity to attract talent1 ........................................................37.........................0.409..................... 3.86........................1.48 ........................ 6.08
Country capacity to retain talent1..........................................................57.......................–0.061..................... 3.47........................1.81 ........................ 5.97
Ease of finding skilled employees1 ........................................................97.......................–0.939..................... 3.33........................2.13 ........................ 5.69
Pay related to productivity1 ...................................................................82.......................–0.465..................... 3.64........................2.37 ........................ 5.25
Capacity for innovation1......................................................................116.......................–1.335..................... 2.64........................2.31 ........................ 5.84
Index of Economic Complexity3 ..........................................................102.......................–1.390................... –1.21......................–1.96 ........................ 2.37
Firm level technology absorption1 .........................................................53.........................0.113..................... 4.90........................3.17 ........................ 6.23
Scientific and technical journal articles (per 1,000 people) ....................44.......................–0.358................... 0.081......................0.000 ...................... 1.242
Median age of the working population ..................................................74.......................–0.385........................ 33...........................28 ........................... 42
Training
Staff training1 ........................................................................................80.......................–0.484..................... 3.73........................2.51 ........................ 5.57
Training services1 ..................................................................................89.......................–0.617..................... 3.82........................2.67 ........................ 6.47
Kuwait
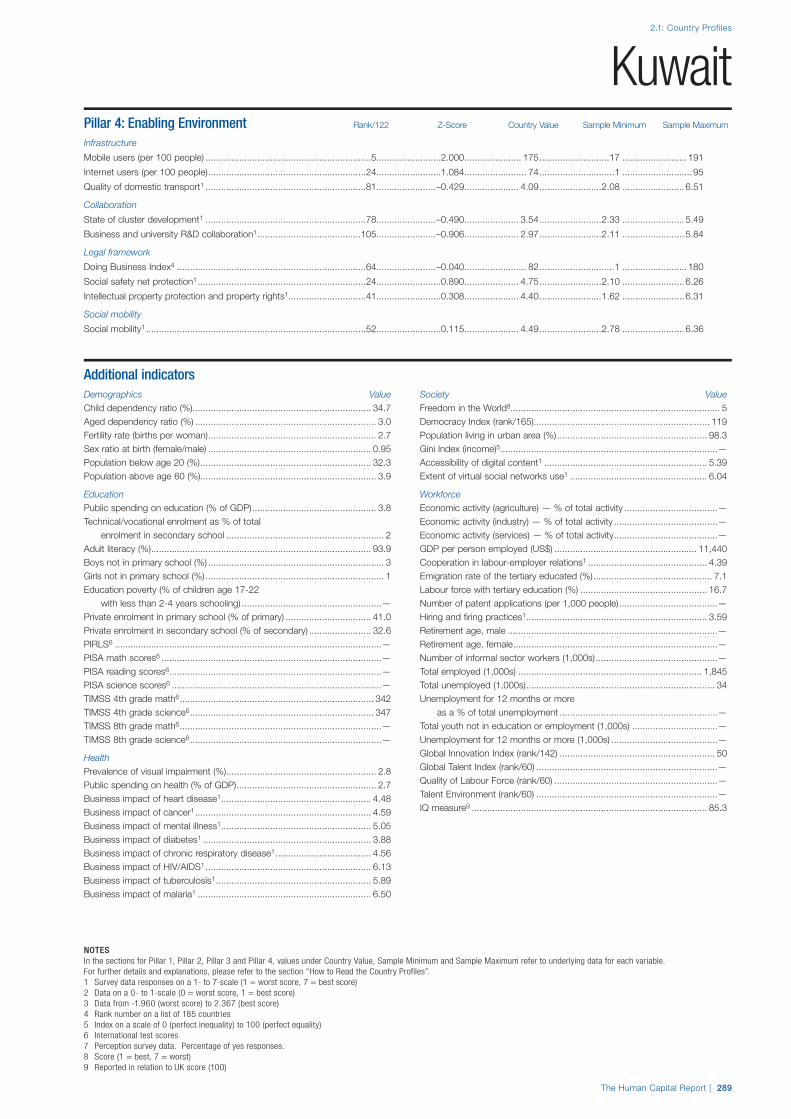
2.1: Country Profiles
NOTESIn the sections for Pillar 1, Pillar 2, Pillar 3 and Pillar 4, values under Country Value, Sample Minimum and Sample Maximum refer to underlying data for each variable.For further details and explanations, please refer to the section “How to Read the Country Profiles”.1 Survey data responses on a 1- to 7-scale (1 = worst score, 7 = best score)2 Data on a 0- to 1-scale (0 = worst score, 1 = best score)3 Data from -1.960 (worst score) to 2.367 (best score)4 Rank number on a list of 185 countries5 Index on a scale of 0 (perfect inequality) to 100 (perfect equality)6 International test scores7 Perception survey data. Percentage of yes responses.8 Score (1 = best, 7 = worst)9 Reported in relation to UK score (100)
The Human Capital Report | 289
KuwaitPillar 4: Enabling Environment Rank/122 Z-Score Country Value Sample Minimum Sample Maximum
Infrastructure
Mobile users (per 100 people) ................................................................5.........................2.000...................... 175...........................17 ......................... 191
Internet users (per 100 people) .............................................................24.........................1.084........................ 74.............................1 ........................... 95
Quality of domestic transport1 ..............................................................81.......................–0.429..................... 4.09........................2.08 ........................ 6.51
Collaboration
State of cluster development1 ..............................................................78.......................–0.490..................... 3.54........................2.33 ........................ 5.49
Business and university R&D collaboration1 ........................................105.......................–0.906..................... 2.97........................2.11 ........................ 5.84
Legal framework
Doing Business Index4 .........................................................................64.......................–0.040........................ 82.............................1 ......................... 180
Social safety net protection1 .................................................................24.........................0.890..................... 4.75........................2.10 ........................ 6.26
Intellectual property protection and property rights1..............................41.........................0.308 ..................... 4.40 ........................1.62 ........................ 6.31
Social mobility
Social mobility1 .....................................................................................52.........................0.115..................... 4.49........................2.78 ........................ 6.36
Additional indicatorsDemographics Value
Child dependency ratio (%)..................................................................... 34.7Aged dependency ratio (%) ...................................................................... 3.0Fertility rate (births per woman) ................................................................. 2.7Sex ratio at birth (female/male) ............................................................... 0.95Population below age 20 (%) .................................................................. 32.3Population above age 60 (%) .................................................................... 3.9
Education
Public spending on education (% of GDP) ................................................ 3.8Technical/vocational enrolment as % of total
enrolment in secondary school ............................................................. 2Adult literacy (%) ..................................................................................... 93.9Boys not in primary school (%) .................................................................... 3Girls not in primary school (%) ..................................................................... 1Education poverty (% of children age 17-22
with less than 2-4 years schooling) ......................................................—Private enrolment in primary school (% of primary) ................................. 41.0Private enrolment in secondary school (% of secondary) ........................ 32.6PIRLS6 .......................................................................................................—PISA math scores6 .....................................................................................—PISA reading scores6 ..................................................................................—PISA science scores6 .................................................................................—TIMSS 4th grade math6 ........................................................................... 342TIMSS 4th grade science6 ....................................................................... 347TIMSS 8th grade math6 ..............................................................................—TIMSS 8th grade science6 ..........................................................................—
Health
Prevalence of visual impairment (%) .......................................................... 2.8Public spending on health (% of GDP) ...................................................... 2.7Business impact of heart disease1 .......................................................... 4.48Business impact of cancer1 .................................................................... 4.59Business impact of mental illness1 .......................................................... 5.05Business impact of diabetes1 ................................................................. 3.88Business impact of chronic respiratory disease1 ..................................... 4.56Business impact of HIV/AIDS1 ................................................................ 6.13Business impact of tuberculosis1 ............................................................ 5.89Business impact of malaria1 ................................................................... 6.50
Society Value
Freedom in the World8................................................................................. 5Democracy Index (rank/165) .................................................................... 119Population living in urban area (%) .......................................................... 98.3Gini Index (income)5....................................................................................—Accessibility of digital content1 ............................................................... 5.39Extent of virtual social networks use1 ..................................................... 6.04
Workforce
Economic activity (agriculture) — % of total activity ....................................—Economic activity (industry) — % of total activity ........................................—Economic activity (services) — % of total activity ........................................—GDP per person employed (US$) ....................................................... 11,440Cooperation in labour-employer relations1 .............................................. 4.39Emigration rate of the tertiary educated (%) .............................................. 7.1Labour force with tertiary education (%) ................................................. 16.7Number of patent applications (per 1,000 people) ......................................—Hiring and firing practices1 ...................................................................... 3.59Retirement age, male .................................................................................—Retirement age, female ...............................................................................—Number of informal sector workers (1,000s) ...............................................—Total employed (1,000s) ....................................................................... 1,845Total unemployed (1,000s) ......................................................................... 34Unemployment for 12 months or more
as a % of total unemployment .............................................................—Total youth not in education or employment (1,000s) .................................—Unemployment for 12 months or more (1,000s) .........................................—Global Innovation Index (rank/142) ............................................................ 50Global Talent Index (rank/60) ......................................................................—Quality of Labour Force (rank/60) ...............................................................—Talent Environment (rank/60) ......................................................................—IQ measure9 ........................................................................................... 85.3

2.1: Country Profiles
290 | The Human Capital Report
Rank/122 Score
Year
s (5
yea
r age
gro
ups)
Percent of total population
0–4
5–9
10–14
15–19
20–24
25–29
30–34
35–39
40–44
45–49
50–54
55–59
60–64
65–69
70–74
75–79
80–84
85–89
90–94
95–99
100+
0 1 2 3 4 5 66 5 4 3 2 1 0
Kyrgyz RepublicHuman Capital Index 2013 92 –0.440
Pillar 1: Education 78 –0.233
Pillar 2: Health and wellness 75 –0.073
Pillar 3: Workforce and employment 112 –0.673
Pillar 4: Enabling environment 100 –0.781
Key Indicators
Total population (1,000s) 5,334.2
Median age of population 24
GDP per capita PPP (constant 2005, international $) 2,077
GDP growth (annual %) –0.9
Male Female Additional indicators
n Total population n Total population Aged dependency: 6.8%
n Labour force participation n Labour force participation Youth dependency: 45.9%
n Primary and secondary enrolment n Primary and secondary enrolment Male labour force participation, age 65+: 0.3%
Female labour force participation, age 65+: 0.2%
Education and workforce distribution

The Human Capital Report | 291
2.1: Country Profiles
HCI s
core
–2.5
–2.0
–1.5
–1.0
–0.5
0.0
0.5
1.0
1.5
2.0
2.5
Overall Index
Enablingenvironment
Workforce andemployment
Health andwellness
Education
Kyrgyz RepublicEmployment types, educational requirements and educational attainment
Percent of population Educational in employment type attainment (%)
Tertiary requirements 9.0 17.9
Professionals 5.3
Technicians and associate professionals 3.7
Secondary requirements 41.8 68.4
Clerks 1.2
Service workers and shop and market sales workers 9.2
Skilled agricultural and fishery workers 19.2
Craft and related trade workers 8.6
Plant and machine operators and assemblers 3.6
Primary requirements 4.0 2.3
Elementary occupations 4.0
Various 1.3
Legislators, senior officials and managers 1.3
Unclassified n/a
Armed forces n/a
Spread of scores (by pillar and overall)
Kyrgyz Republic
Low-income economies
Europe and Central Asia
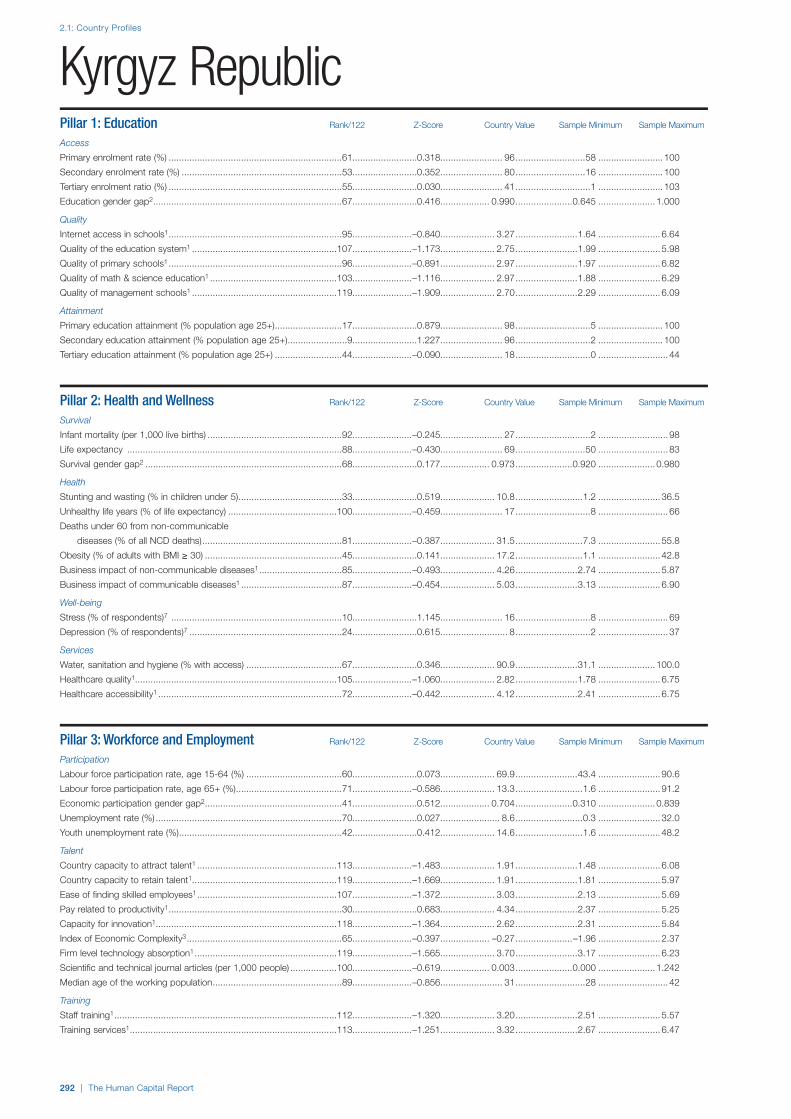
2.1: Country Profiles
292 | The Human Capital Report
Pillar 1: Education Rank/122 Z-Score Country Value Sample Minimum Sample Maximum
Access
Primary enrolment rate (%) ...................................................................61.........................0.318........................ 96...........................58 ......................... 100
Secondary enrolment rate (%) ..............................................................53.........................0.352........................ 80...........................16 ......................... 100
Tertiary enrolment ratio (%) ...................................................................55.........................0.030........................ 41.............................1 ......................... 103
Education gender gap2 .........................................................................67.........................0.416................... 0.990......................0.645 ...................... 1.000
Quality
Internet access in schools1 ...................................................................95.......................–0.840..................... 3.27........................1.64 ........................ 6.64
Quality of the education system1 ........................................................107.......................–1.173..................... 2.75........................1.99 ........................ 5.98
Quality of primary schools1 ...................................................................96.......................–0.891..................... 2.97........................1.97 ........................ 6.82
Quality of math & science education1 .................................................103.......................–1.116..................... 2.97........................1.88 ........................ 6.29
Quality of management schools1 ........................................................119.......................–1.909..................... 2.70........................2.29 ........................ 6.09
Attainment
Primary education attainment (% population age 25+) ..........................17.........................0.879........................ 98.............................5 ......................... 100
Secondary education attainment (% population age 25+) .......................9.........................1.227........................ 96.............................2 ......................... 100
Tertiary education attainment (% population age 25+) ..........................44.......................–0.090........................ 18.............................0 ........................... 44
Pillar 2: Health and Wellness Rank/122 Z-Score Country Value Sample Minimum Sample Maximum
Survival
Infant mortality (per 1,000 live births) ....................................................92.......................–0.245........................ 27.............................2 ........................... 98
Life expectancy ...................................................................................88.......................–0.430........................ 69...........................50 ........................... 83
Survival gender gap2 ............................................................................68.........................0.177................... 0.973......................0.920 ...................... 0.980
Health
Stunting and wasting (% in children under 5) ........................................33.........................0.519..................... 10.8..........................1.2 ........................ 36.5
Unhealthy life years (% of life expectancy) ..........................................100.......................–0.459........................ 17.............................8 ........................... 66
Deaths under 60 from non-communicable
diseases (% of all NCD deaths) ......................................................81.......................–0.387 ..................... 31.5 ..........................7.3 ........................ 55.8
Obesity (% of adults with BMI ≥ 30) .....................................................45.........................0.141..................... 17.2..........................1.1 ........................ 42.8
Business impact of non-communicable diseases1 ................................85.......................–0.493..................... 4.26........................2.74 ........................ 5.87
Business impact of communicable diseases1 .......................................87.......................–0.454..................... 5.03........................3.13 ........................ 6.90
Well-being
Stress (% of respondents)7 ..................................................................10.........................1.145........................ 16.............................8 ........................... 69
Depression (% of respondents)7 ...........................................................24.........................0.615.......................... 8.............................2 ........................... 37
Services
Water, sanitation and hygiene (% with access) .....................................67.........................0.346..................... 90.9........................31.1 ...................... 100.0
Healthcare quality1..............................................................................105.......................–1.060..................... 2.82........................1.78 ........................ 6.75
Healthcare accessibility1 .......................................................................72.......................–0.442..................... 4.12........................2.41 ........................ 6.75
Pillar 3: Workforce and Employment Rank/122 Z-Score Country Value Sample Minimum Sample Maximum
Participation
Labour force participation rate, age 15-64 (%) .....................................60.........................0.073..................... 69.9........................43.4 ........................ 90.6
Labour force participation rate, age 65+ (%) .........................................71.......................–0.586..................... 13.3..........................1.6 ........................ 91.2
Economic participation gender gap2 .....................................................41.........................0.512................... 0.704......................0.310 ...................... 0.839
Unemployment rate (%) ........................................................................70.........................0.027....................... 8.6..........................0.3 ........................ 32.0
Youth unemployment rate (%) ...............................................................42.........................0.412..................... 14.6..........................1.6 ........................ 48.2
Talent
Country capacity to attract talent1 ......................................................113.......................–1.483..................... 1.91........................1.48 ........................ 6.08
Country capacity to retain talent1........................................................119.......................–1.669..................... 1.91........................1.81 ........................ 5.97
Ease of finding skilled employees1 ......................................................107.......................–1.372..................... 3.03........................2.13 ........................ 5.69
Pay related to productivity1 ...................................................................30.........................0.683..................... 4.34........................2.37 ........................ 5.25
Capacity for innovation1......................................................................118.......................–1.364..................... 2.62........................2.31 ........................ 5.84
Index of Economic Complexity3 ............................................................65.......................–0.397................... –0.27......................–1.96 ........................ 2.37
Firm level technology absorption1 .......................................................119.......................–1.565..................... 3.70........................3.17 ........................ 6.23
Scientific and technical journal articles (per 1,000 people) ..................100.......................–0.619................... 0.003......................0.000 ...................... 1.242
Median age of the working population ..................................................89.......................–0.856........................ 31...........................28 ........................... 42
Training
Staff training1 ......................................................................................112.......................–1.320..................... 3.20........................2.51 ........................ 5.57
Training services1 ................................................................................113.......................–1.251..................... 3.32........................2.67 ........................ 6.47
Kyrgyz Republic

2.1: Country Profiles
NOTESIn the sections for Pillar 1, Pillar 2, Pillar 3 and Pillar 4, values under Country Value, Sample Minimum and Sample Maximum refer to underlying data for each variable.For further details and explanations, please refer to the section “How to Read the Country Profiles”.1 Survey data responses on a 1- to 7-scale (1 = worst score, 7 = best score)2 Data on a 0- to 1-scale (0 = worst score, 1 = best score)3 Data from -1.960 (worst score) to 2.367 (best score)4 Rank number on a list of 185 countries5 Index on a scale of 0 (perfect inequality) to 100 (perfect equality)6 International test scores7 Perception survey data. Percentage of yes responses.8 Score (1 = best, 7 = worst)9 Reported in relation to UK score (100)
The Human Capital Report | 293
Kyrgyz RepublicPillar 4: Enabling Environment Rank/122 Z-Score Country Value Sample Minimum Sample Maximum
Infrastructure
Mobile users (per 100 people) ..............................................................46.........................0.274...................... 116...........................17 ......................... 191
Internet users (per 100 people) .............................................................90.......................–0.851........................ 20.............................1 ........................... 95
Quality of domestic transport1 ..............................................................45.........................0.256 ..................... 4.69 ........................2.08 ........................ 6.51
Collaboration
State of cluster development1 ............................................................119.......................–1.673..................... 2.70........................2.33 ........................ 5.49
Business and university R&D collaboration1 ........................................119.......................–1.738 ..................... 2.22 ........................2.11 ........................ 5.84
Legal framework
Doing Business Index4 .........................................................................57.........................0.193........................ 70.............................1 ......................... 180
Social safety net protection1 ...............................................................115.......................–1.209..................... 2.47........................2.10 ........................ 6.26
Intellectual property protection and property rights1............................118.......................–1.444 ..................... 2.61 ........................1.62 ........................ 6.31
Social mobility
Social mobility1 .....................................................................................98.......................–0.837..................... 3.63........................2.78 ........................ 6.36
Additional indicatorsDemographics Value
Child dependency ratio (%)..................................................................... 45.9Aged dependency ratio (%) ...................................................................... 6.8Fertility rate (births per woman) ................................................................. 2.8Sex ratio at birth (female/male) ............................................................... 0.93Population below age 20 (%) .................................................................. 41.3Population above age 60 (%) .................................................................... 6.3
Education
Public spending on education (% of GDP) ................................................ 5.8Technical/vocational enrolment as % of total
enrolment in secondary school ............................................................. 9Adult literacy (%) ..................................................................................... 99.2Boys not in primary school (%) .................................................................... 4Girls not in primary school (%) ..................................................................... 4Education poverty (% of children age 17-22
with less than 2-4 years schooling) ................................................ 0.008Private enrolment in primary school (% of primary) ................................... 0.7Private enrolment in secondary school (% of secondary) .......................... 1.8PIRLS6 .......................................................................................................—PISA math scores6 .................................................................................. 331PISA reading scores6 ............................................................................... 314PISA science scores6 .............................................................................. 330TIMSS 4th grade math6 ..............................................................................—TIMSS 4th grade science6 ..........................................................................—TIMSS 8th grade math6 ..............................................................................—TIMSS 8th grade science6 ..........................................................................—
Health
Prevalence of visual impairment (%) .......................................................... 2.4Public spending on health (% of GDP) ...................................................... 6.5Business impact of heart disease1 .......................................................... 3.69Business impact of cancer1 .................................................................... 4.28Business impact of mental illness1 .......................................................... 4.63Business impact of diabetes1 ................................................................. 4.56Business impact of chronic respiratory disease1 ..................................... 4.14Business impact of HIV/AIDS1 ................................................................ 5.15Business impact of tuberculosis1 ............................................................ 4.50Business impact of malaria1 ................................................................... 5.43
Society Value
Freedom in the World8................................................................................. 5Democracy Index (rank/165) .................................................................... 106Population living in urban area (%) .......................................................... 35.5Gini Index (income)5................................................................................ 33.4Accessibility of digital content1 ............................................................... 4.91Extent of virtual social networks use1 ..................................................... 4.95
Workforce
Economic activity (agriculture) — % of total activity ................................ 34.0Economic activity (industry) — % of total activity .................................... 20.6Economic activity (services) — % of total activity .................................... 45.3GDP per person employed (US$) ......................................................... 7,216Cooperation in labour-employer relations1 .............................................. 4.13Emigration rate of the tertiary educated (%) .............................................. 0.9Labour force with tertiary education (%) ................................................... 2.5Number of patent applications (per 1,000 people) .............................. 0.0262Hiring and firing practices1 ...................................................................... 4.34Retirement age, male .................................................................................—Retirement age, female ...............................................................................—Number of informal sector workers (1,000s) ...............................................—Total employed (1,000s) ....................................................................... 2,244Total unemployed (1,000s) ....................................................................... 212Unemployment for 12 months or more
as a % of total unemployment .............................................................—Total youth not in education or employment (1,000s) ........................... 218.0Unemployment for 12 months or more (1,000s) .........................................—Global Innovation Index (rank/142) .......................................................... 117Global Talent Index (rank/60) ......................................................................—Quality of Labour Force (rank/60) ...............................................................—Talent Environment (rank/60) ......................................................................—IQ measure9 ........................................................................................... 74.4
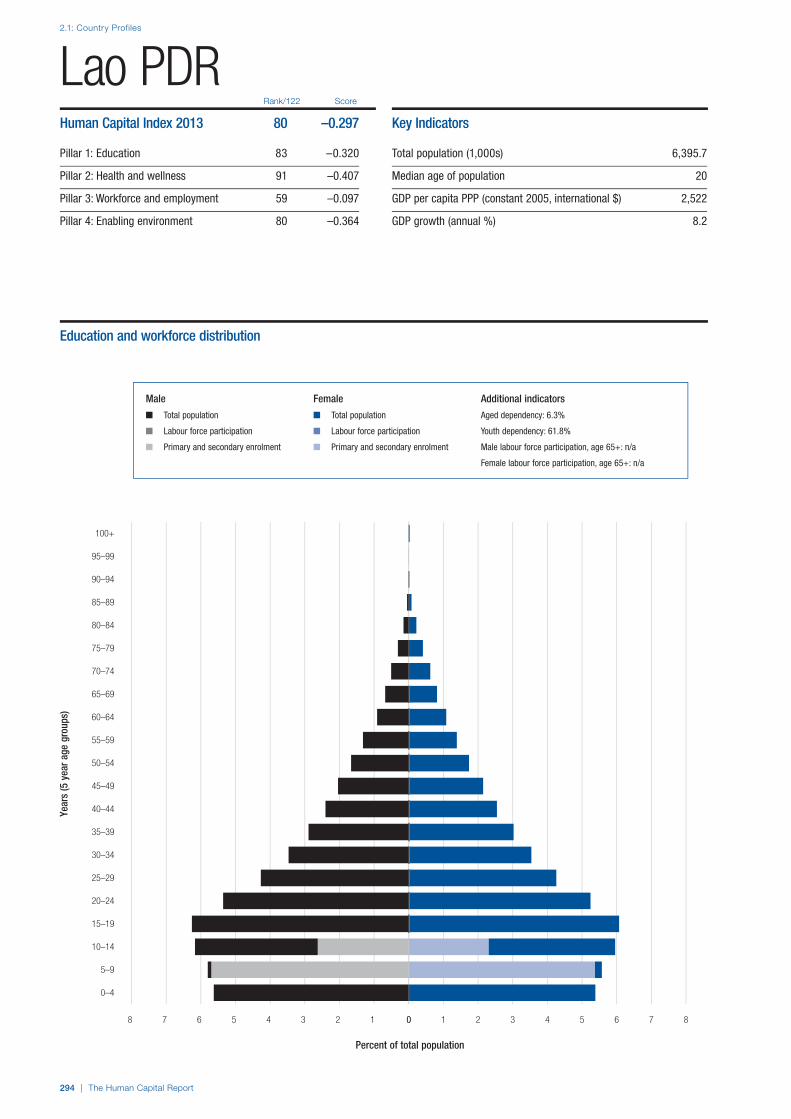
2.1: Country Profiles
294 | The Human Capital Report
Rank/122 Score
Year
s (5
yea
r age
gro
ups)
Percent of total population
0–4
5–9
10–14
15–19
20–24
25–29
30–34
35–39
40–44
45–49
50–54
55–59
60–64
65–69
70–74
75–79
80–84
85–89
90–94
95–99
100+
0 1 2 3 4 5 6 7 88 7 6 5 4 3 2 1 0
Lao PDRHuman Capital Index 2013 80 –0.297
Pillar 1: Education 83 –0.320
Pillar 2: Health and wellness 91 –0.407
Pillar 3: Workforce and employment 59 –0.097
Pillar 4: Enabling environment 80 –0.364
Key Indicators
Total population (1,000s) 6,395.7
Median age of population 20
GDP per capita PPP (constant 2005, international $) 2,522
GDP growth (annual %) 8.2
Male Female Additional indicators
n Total population n Total population Aged dependency: 6.3%
n Labour force participation n Labour force participation Youth dependency: 61.8%
n Primary and secondary enrolment n Primary and secondary enrolment Male labour force participation, age 65+: n/a
Female labour force participation, age 65+: n/a
Education and workforce distribution

The Human Capital Report | 295
2.1: Country Profiles
HCI s
core
–2.5
–2.0
–1.5
–1.0
–0.5
0.0
0.5
1.0
1.5
2.0
2.5
Overall Index
Enablingenvironment
Workforce andemployment
Health andwellness
Education
Lao PDREmployment types, educational requirements and educational attainment
Percent of population Educational in employment type attainment (%)
Tertiary requirements n/a n/a
Professionals n/a
Technicians and associate professionals n/a
Secondary requirements n/a n/a
Clerks n/a
Service workers and shop and market sales workers n/a
Skilled agricultural and fishery workers n/a
Craft and related trade workers n/a
Plant and machine operators and assemblers n/a
Primary requirements n/a n/a
Elementary occupations n/a
Various n/a
Legislators, senior officials and managers n/a
Unclassified n/a
Armed forces n/a
Spread of scores (by pillar and overall)
Lao PDR
Lower-middle income economies
Asia and the Pacific

2.1: Country Profiles
296 | The Human Capital Report
Pillar 1: Education Rank/122 Z-Score Country Value Sample Minimum Sample Maximum
Access
Primary enrolment rate (%) ...................................................................50.........................0.470........................ 97...........................58 ......................... 100
Secondary enrolment rate (%) ..............................................................87.......................–1.378........................ 41...........................16 ......................... 100
Tertiary enrolment ratio (%) ...................................................................87.......................–0.870........................ 18.............................1 ......................... 103
Education gender gap2 .........................................................................—..............................— .........................— ......................0.645 ...................... 1.000
Quality
Internet access in schools1 ...................................................................76.......................–0.353..................... 3.88........................1.64 ........................ 6.64
Quality of the education system1 ..........................................................47.........................0.181..................... 3.96........................1.99 ........................ 5.98
Quality of primary schools1 ...................................................................66.......................–0.173..................... 3.75........................1.97 ........................ 6.82
Quality of math & science education1 ...................................................78.......................–0.228..................... 3.82........................1.88 ........................ 6.29
Quality of management schools1 ..........................................................71.......................–0.210..................... 4.12........................2.29 ........................ 6.09
Attainment
Primary education attainment (% population age 25+) ..........................—..............................— .........................— .............................5 ......................... 100
Secondary education attainment (% population age 25+) .....................—..............................— .........................— .............................2 ......................... 100
Tertiary education attainment (% population age 25+) ..........................—..............................— .........................— .............................0 ........................... 44
Pillar 2: Health and Wellness Rank/122 Z-Score Country Value Sample Minimum Sample Maximum
Survival
Infant mortality (per 1,000 live births) ....................................................95.......................–0.560........................ 34.............................2 ........................... 98
Life expectancy ...................................................................................93.......................–0.552........................ 68...........................50 ........................... 83
Survival gender gap2 ............................................................................—..............................—.........................—......................0.920 ...................... 0.980
Health
Stunting and wasting (% in children under 5) ........................................72.......................–1.383..................... 27.5..........................1.2 ........................ 36.5
Unhealthy life years (% of life expectancy) ..........................................112.......................–0.991........................ 21.............................8 ........................... 66
Deaths under 60 from non-communicable
diseases (% of all NCD deaths) ......................................................90.......................–0.717 ..................... 35.7 ..........................7.3 ........................ 55.8
Obesity (% of adults with BMI ≥ 30) .......................................................8.........................1.640....................... 3.0..........................1.1 ........................ 42.8
Business impact of non-communicable diseases1 ..............................117.......................–1.487..................... 3.81........................2.74 ........................ 5.87
Business impact of communicable diseases1 .....................................113.......................–1.723..................... 3.76........................3.13 ........................ 6.90
Well-being
Stress (% of respondents)7 ..................................................................59.......................–0.095........................ 32.............................8 ........................... 69
Depression (% of respondents)7 .............................................................1.........................1.571.......................... 2.............................2 ........................... 37
Services
Water, sanitation and hygiene (% with access) .....................................99.......................–0.942..................... 65.8........................31.1 ...................... 100.0
Healthcare quality1................................................................................58.......................–0.081..................... 4.01........................1.78 ........................ 6.75
Healthcare accessibility1 .......................................................................53.........................0.033..................... 4.70........................2.41 ........................ 6.75
Pillar 3: Workforce and Employment Rank/122 Z-Score Country Value Sample Minimum Sample Maximum
Participation
Labour force participation rate, age 15-64 (%) .....................................12.........................1.197..................... 80.9........................43.4 ........................ 90.6
Labour force participation rate, age 65+ (%) .........................................35.........................0.358..................... 31.6..........................1.6 ........................ 91.2
Economic participation gender gap2 .....................................................—..............................— .........................— ......................0.310 ...................... 0.839
Unemployment rate (%) ........................................................................—..............................— .........................— ..........................0.3 ........................ 32.0
Youth unemployment rate (%) ...............................................................—..............................— .........................— ..........................1.6 ........................ 48.2
Talent
Country capacity to attract talent1 ........................................................59.......................–0.028..................... 3.41........................1.48 ........................ 6.08
Country capacity to retain talent1..........................................................31.........................0.670..................... 4.18........................1.81 ........................ 5.97
Ease of finding skilled employees1 ......................................................104.......................–1.186..................... 3.16........................2.13 ........................ 5.69
Pay related to productivity1 .....................................................................8.........................1.500..................... 4.84........................2.37 ........................ 5.25
Capacity for innovation1........................................................................42.........................0.093..................... 3.78........................2.31 ........................ 5.84
Index of Economic Complexity3 ............................................................93.......................–1.095................... –0.93......................–1.96 ........................ 2.37
Firm level technology absorption1 .........................................................78.......................–0.489..................... 4.47........................3.17 ........................ 6.23
Scientific and technical journal articles (per 1,000 people) ..................107.......................–0.622................... 0.002......................0.000 ...................... 1.242
Median age of the working population ................................................111.......................–1.325........................ 29...........................28 ........................... 42
Training
Staff training1 ........................................................................................49.........................0.166..................... 4.15........................2.51 ........................ 5.57
Training services1 ..................................................................................80.......................–0.504..................... 3.91........................2.67 ........................ 6.47
Lao PDR

2.1: Country Profiles
NOTESIn the sections for Pillar 1, Pillar 2, Pillar 3 and Pillar 4, values under Country Value, Sample Minimum and Sample Maximum refer to underlying data for each variable.For further details and explanations, please refer to the section “How to Read the Country Profiles”.1 Survey data responses on a 1- to 7-scale (1 = worst score, 7 = best score)2 Data on a 0- to 1-scale (0 = worst score, 1 = best score)3 Data from -1.960 (worst score) to 2.367 (best score)4 Rank number on a list of 185 countries5 Index on a scale of 0 (perfect inequality) to 100 (perfect equality)6 International test scores7 Perception survey data. Percentage of yes responses.8 Score (1 = best, 7 = worst)9 Reported in relation to UK score (100)
The Human Capital Report | 297
Lao PDRPillar 4: Enabling Environment Rank/122 Z-Score Country Value Sample Minimum Sample Maximum
Infrastructure
Mobile users (per 100 people) ..............................................................92.......................–0.586........................ 87...........................17 ......................... 191
Internet users (per 100 people) ...........................................................106.......................–1.244.......................... 9.............................1 ........................... 95
Quality of domestic transport1 ..............................................................80.......................–0.416 ..................... 4.11 ........................2.08 ........................ 6.51
Collaboration
State of cluster development1 ..............................................................35.........................0.523..................... 4.26........................2.33 ........................ 5.49
Business and university R&D collaboration1 ..........................................72.......................–0.454 ..................... 3.37 ........................2.11 ........................ 5.84
Legal framework
Doing Business Index4 .......................................................................115.......................–1.611...................... 163.............................1 ......................... 180
Social safety net protection1 .................................................................33.........................0.588..................... 4.42........................2.10 ........................ 6.26
Intellectual property protection and property rights1..............................66.......................–0.236 ..................... 3.85 ........................1.62 ........................ 6.31
Social mobility
Social mobility1 .....................................................................................50.........................0.156..................... 4.53........................2.78 ........................ 6.36
Additional indicatorsDemographics Value
Child dependency ratio (%)..................................................................... 61.8Aged dependency ratio (%) ...................................................................... 6.3Fertility rate (births per woman) ................................................................. 3.5Sex ratio at birth (female/male) ............................................................... 0.96Population below age 20 (%) .................................................................. 49.3Population above age 60 (%) .................................................................... 5.6
Education
Public spending on education (% of GDP) ................................................ 3.3Technical/vocational enrolment as % of total
enrolment in secondary school ............................................................. 1Adult literacy (%) ..................................................................................... 72.7Boys not in primary school (%) .................................................................... 2Girls not in primary school (%) ..................................................................... 4Education poverty (% of children age 17-22
with less than 2-4 years schooling) ................................................ 0.213Private enrolment in primary school (% of primary) ................................... 3.8Private enrolment in secondary school (% of secondary) .......................... 2.9PIRLS6 .......................................................................................................—PISA math scores6 .....................................................................................—PISA reading scores6 ..................................................................................—PISA science scores6 .................................................................................—TIMSS 4th grade math6 ..............................................................................—TIMSS 4th grade science6 ..........................................................................—TIMSS 8th grade math6 ..............................................................................—TIMSS 8th grade science6 ..........................................................................—
Health
Prevalence of visual impairment (%) .......................................................... 8.5Public spending on health (% of GDP) ...................................................... 2.8Business impact of heart disease1 .......................................................... 3.72Business impact of cancer1 .................................................................... 3.85Business impact of mental illness1 .......................................................... 3.82Business impact of diabetes1 ................................................................. 3.84Business impact of chronic respiratory disease1 ..................................... 3.84Business impact of HIV/AIDS1 ................................................................ 3.87Business impact of tuberculosis1 ............................................................ 3.69Business impact of malaria1 ................................................................... 3.73
Society Value
Freedom in the World8................................................................................. 7Democracy Index (rank/165) .................................................................... 156Population living in urban area (%) .......................................................... 35.3Gini Index (income)5................................................................................ 36.7Accessibility of digital content1 ............................................................... 4.97Extent of virtual social networks use1 ..................................................... 4.94
Workforce
Economic activity (agriculture) — % of total activity ....................................—Economic activity (industry) — % of total activity ........................................—Economic activity (services) — % of total activity ........................................—GDP per person employed (US$) ...............................................................—Cooperation in labour-employer relations1 .............................................. 5.32Emigration rate of the tertiary educated (%) ............................................ 37.2Labour force with tertiary education (%) .....................................................—Number of patent applications (per 1,000 people) ......................................—Hiring and firing practices1 ...................................................................... 4.11Retirement age, male .................................................................................—Retirement age, female ...............................................................................—Number of informal sector workers (1,000s) ...............................................—Total employed (1,000s) ....................................................................... 2,740Total unemployed (1,000s) ......................................................................... 38Unemployment for 12 months or more
as a % of total unemployment .............................................................—Total youth not in education or employment (1,000s) .................................—Unemployment for 12 months or more (1,000s) .........................................—Global Innovation Index (rank/142) .............................................................—Global Talent Index (rank/60) ......................................................................—Quality of Labour Force (rank/60) ...............................................................—Talent Environment (rank/60) ......................................................................—IQ measure9 ........................................................................................... 89.0
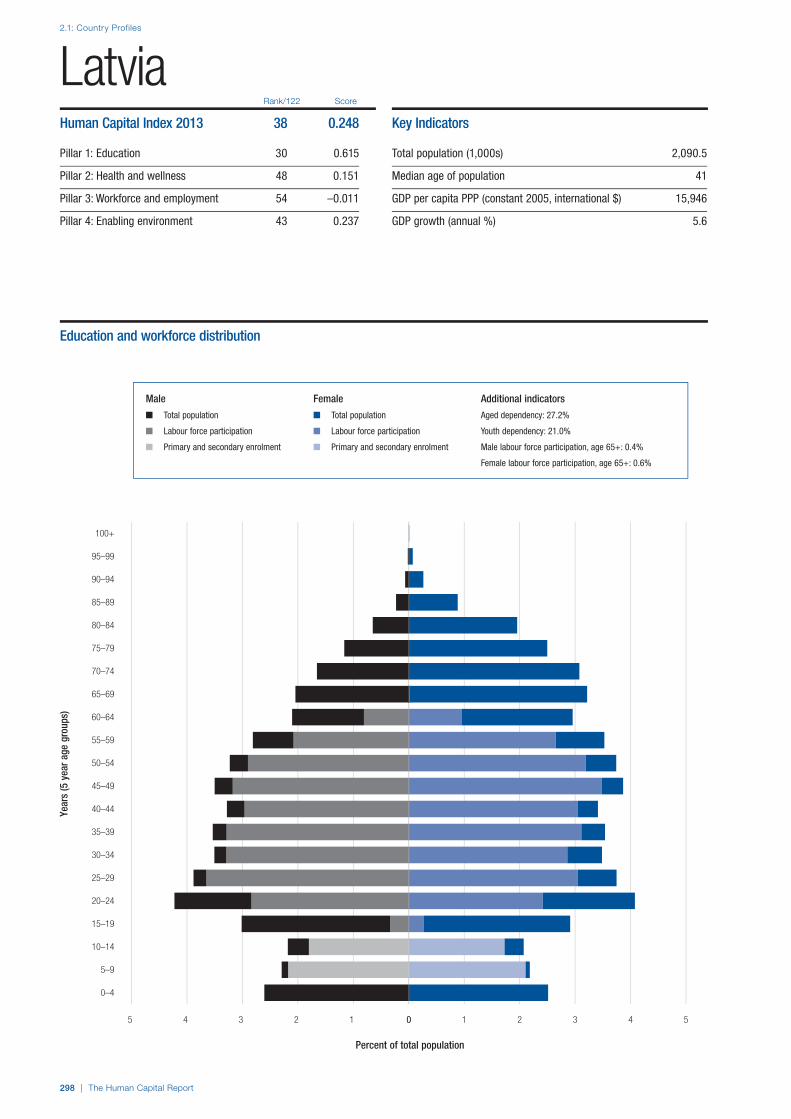
2.1: Country Profiles
298 | The Human Capital Report
Rank/122 Score
Year
s (5
yea
r age
gro
ups)
Percent of total population
0–4
5–9
10–14
15–19
20–24
25–29
30–34
35–39
40–44
45–49
50–54
55–59
60–64
65–69
70–74
75–79
80–84
85–89
90–94
95–99
100+
0 1 2 3 4 55 4 3 2 1 0
LatviaHuman Capital Index 2013 38 0.248
Pillar 1: Education 30 0.615
Pillar 2: Health and wellness 48 0.151
Pillar 3: Workforce and employment 54 –0.011
Pillar 4: Enabling environment 43 0.237
Key Indicators
Total population (1,000s) 2,090.5
Median age of population 41
GDP per capita PPP (constant 2005, international $) 15,946
GDP growth (annual %) 5.6
Male Female Additional indicators
n Total population n Total population Aged dependency: 27.2%
n Labour force participation n Labour force participation Youth dependency: 21.0%
n Primary and secondary enrolment n Primary and secondary enrolment Male labour force participation, age 65+: 0.4%
Female labour force participation, age 65+: 0.6%
Education and workforce distribution

The Human Capital Report | 299
2.1: Country Profiles
HCI s
core
–2.5
–2.0
–1.5
–1.0
–0.5
0.0
0.5
1.0
1.5
2.0
2.5
Overall Index
Enablingenvironment
Workforce andemployment
Health andwellness
Education
LatviaEmployment types, educational requirements and educational attainment
Percent of population Educational in employment type attainment (%)
Tertiary requirements 20.1 25.9
Professionals 9.3
Technicians and associate professionals 10.7
Secondary requirements 30.3 64.6
Clerks 3.0
Service workers and shop and market sales workers 8.1
Skilled agricultural and fishery workers 2.6
Craft and related trade workers 10.1
Plant and machine operators and assemblers 6.6
Primary requirements 9.1 0.9
Elementary occupations 9.1
Various 7.6
Legislators, senior officials and managers 5.7
Unclassified 1.8
Armed forces 0.1
Spread of scores (by pillar and overall)
Latvia
High-income economies
Europe and Central Asia
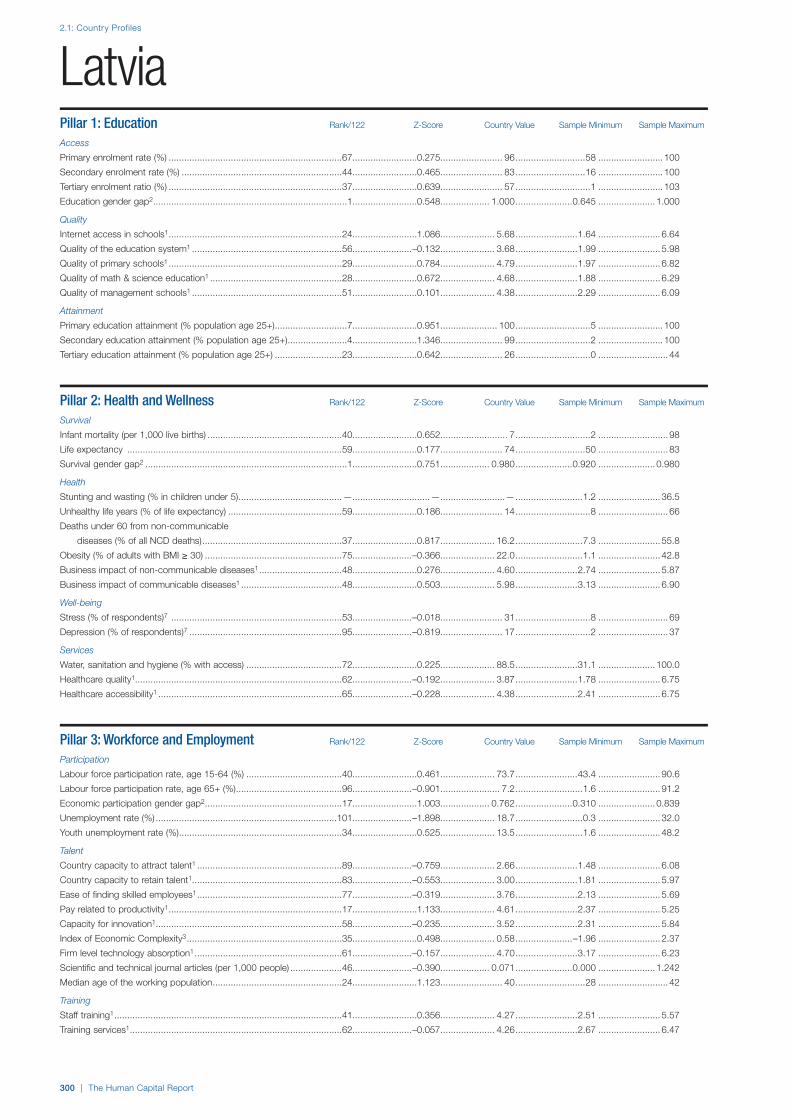
2.1: Country Profiles
300 | The Human Capital Report
Pillar 1: Education Rank/122 Z-Score Country Value Sample Minimum Sample Maximum
Access
Primary enrolment rate (%) ...................................................................67.........................0.275........................ 96...........................58 ......................... 100
Secondary enrolment rate (%) ..............................................................44.........................0.465........................ 83...........................16 ......................... 100
Tertiary enrolment ratio (%) ...................................................................37.........................0.639........................ 57.............................1 ......................... 103
Education gender gap2 ...........................................................................1.........................0.548................... 1.000......................0.645 ...................... 1.000
Quality
Internet access in schools1 ...................................................................24.........................1.086..................... 5.68........................1.64 ........................ 6.64
Quality of the education system1 ..........................................................56.......................–0.132..................... 3.68........................1.99 ........................ 5.98
Quality of primary schools1 ...................................................................29.........................0.784..................... 4.79........................1.97 ........................ 6.82
Quality of math & science education1 ...................................................28.........................0.672..................... 4.68........................1.88 ........................ 6.29
Quality of management schools1 ..........................................................51.........................0.101..................... 4.38........................2.29 ........................ 6.09
Attainment
Primary education attainment (% population age 25+) ............................7.........................0.951...................... 100.............................5 ......................... 100
Secondary education attainment (% population age 25+) .......................4.........................1.346........................ 99.............................2 ......................... 100
Tertiary education attainment (% population age 25+) ..........................23.........................0.642........................ 26.............................0 ........................... 44
Pillar 2: Health and Wellness Rank/122 Z-Score Country Value Sample Minimum Sample Maximum
Survival
Infant mortality (per 1,000 live births) ....................................................40.........................0.652.......................... 7.............................2 ........................... 98
Life expectancy ...................................................................................59.........................0.177........................ 74...........................50 ........................... 83
Survival gender gap2 ..............................................................................1.........................0.751................... 0.980......................0.920 ...................... 0.980
Health
Stunting and wasting (% in children under 5) ........................................—..............................— .........................— ..........................1.2 ........................ 36.5
Unhealthy life years (% of life expectancy) ............................................59.........................0.186........................ 14.............................8 ........................... 66
Deaths under 60 from non-communicable
diseases (% of all NCD deaths) ......................................................37.........................0.817 ..................... 16.2 ..........................7.3 ........................ 55.8
Obesity (% of adults with BMI ≥ 30) .....................................................75.......................–0.366..................... 22.0..........................1.1 ........................ 42.8
Business impact of non-communicable diseases1 ................................48.........................0.276..................... 4.60........................2.74 ........................ 5.87
Business impact of communicable diseases1 .......................................48.........................0.503..................... 5.98........................3.13 ........................ 6.90
Well-being
Stress (% of respondents)7 ..................................................................53.......................–0.018........................ 31.............................8 ........................... 69
Depression (% of respondents)7 ...........................................................95.......................–0.819........................ 17.............................2 ........................... 37
Services
Water, sanitation and hygiene (% with access) .....................................72.........................0.225..................... 88.5........................31.1 ...................... 100.0
Healthcare quality1................................................................................62.......................–0.192..................... 3.87........................1.78 ........................ 6.75
Healthcare accessibility1 .......................................................................65.......................–0.228..................... 4.38........................2.41 ........................ 6.75
Pillar 3: Workforce and Employment Rank/122 Z-Score Country Value Sample Minimum Sample Maximum
Participation
Labour force participation rate, age 15-64 (%) .....................................40.........................0.461..................... 73.7........................43.4 ........................ 90.6
Labour force participation rate, age 65+ (%) .........................................96.......................–0.901....................... 7.2..........................1.6 ........................ 91.2
Economic participation gender gap2 .....................................................17.........................1.003................... 0.762......................0.310 ...................... 0.839
Unemployment rate (%) ......................................................................101.......................–1.898..................... 18.7..........................0.3 ........................ 32.0
Youth unemployment rate (%) ...............................................................34.........................0.525..................... 13.5..........................1.6 ........................ 48.2
Talent
Country capacity to attract talent1 ........................................................89.......................–0.759..................... 2.66........................1.48 ........................ 6.08
Country capacity to retain talent1..........................................................83.......................–0.553..................... 3.00........................1.81 ........................ 5.97
Ease of finding skilled employees1 ........................................................77.......................–0.319..................... 3.76........................2.13 ........................ 5.69
Pay related to productivity1 ...................................................................17.........................1.133..................... 4.61........................2.37 ........................ 5.25
Capacity for innovation1........................................................................58.......................–0.235..................... 3.52........................2.31 ........................ 5.84
Index of Economic Complexity3 ............................................................35.........................0.498..................... 0.58......................–1.96 ........................ 2.37
Firm level technology absorption1 .........................................................61.......................–0.157..................... 4.70........................3.17 ........................ 6.23
Scientific and technical journal articles (per 1,000 people) ....................46.......................–0.390................... 0.071......................0.000 ...................... 1.242
Median age of the working population ..................................................24.........................1.123........................ 40...........................28 ........................... 42
Training
Staff training1 ........................................................................................41.........................0.356..................... 4.27........................2.51 ........................ 5.57
Training services1 ..................................................................................62.......................–0.057..................... 4.26........................2.67 ........................ 6.47
Latvia

2.1: Country Profiles
NOTESIn the sections for Pillar 1, Pillar 2, Pillar 3 and Pillar 4, values under Country Value, Sample Minimum and Sample Maximum refer to underlying data for each variable.For further details and explanations, please refer to the section “How to Read the Country Profiles”.1 Survey data responses on a 1- to 7-scale (1 = worst score, 7 = best score)2 Data on a 0- to 1-scale (0 = worst score, 1 = best score)3 Data from -1.960 (worst score) to 2.367 (best score)4 Rank number on a list of 185 countries5 Index on a scale of 0 (perfect inequality) to 100 (perfect equality)6 International test scores7 Perception survey data. Percentage of yes responses.8 Score (1 = best, 7 = worst)9 Reported in relation to UK score (100)
The Human Capital Report | 301
LatviaPillar 4: Enabling Environment Rank/122 Z-Score Country Value Sample Minimum Sample Maximum
Infrastructure
Mobile users (per 100 people) ..............................................................73.......................–0.122...................... 103...........................17 ......................... 191
Internet users (per 100 people) .............................................................28.........................0.994........................ 72.............................1 ........................... 95
Quality of domestic transport1 ..............................................................35.........................0.553 ..................... 4.95 ........................2.08 ........................ 6.51
Collaboration
State of cluster development1 ..............................................................91.......................–0.675..................... 3.41........................2.33 ........................ 5.49
Business and university R&D collaboration1 ..........................................58.......................–0.207 ..................... 3.60 ........................2.11 ........................ 5.84
Legal framework
Doing Business Index4 .........................................................................23.........................1.066........................ 25.............................1 ......................... 180
Social safety net protection1 .................................................................49.........................0.024..................... 3.81........................2.10 ........................ 6.26
Intellectual property protection and property rights1..............................49.........................0.059 ..................... 4.15 ........................1.62 ........................ 6.31
Social mobility
Social mobility1 .....................................................................................32.........................0.441..................... 4.79........................2.78 ........................ 6.36
Additional indicatorsDemographics Value
Child dependency ratio (%)..................................................................... 21.0Aged dependency ratio (%) .................................................................... 27.2Fertility rate (births per woman) ................................................................. 1.5Sex ratio at birth (female/male) ............................................................... 0.95Population below age 20 (%) .................................................................. 20.3Population above age 60 (%) .................................................................. 24.0
Education
Public spending on education (% of GDP) ................................................ 5.0Technical/vocational enrolment as % of total
enrolment in secondary school ........................................................... 25Adult literacy (%) ..................................................................................... 99.8Boys not in primary school (%) .................................................................... 5Girls not in primary school (%) ..................................................................... 4Education poverty (% of children age 17-22
with less than 2-4 years schooling) ......................................................—Private enrolment in primary school (% of primary) ................................... 1.1Private enrolment in secondary school (% of secondary) .......................... 1.5PIRLS6 .......................................................................................................—PISA math scores6 .................................................................................. 482PISA reading scores6 ............................................................................... 484PISA science scores6 .............................................................................. 494TIMSS 4th grade math6 ..............................................................................—TIMSS 4th grade science6 ..........................................................................—TIMSS 8th grade math6 ..............................................................................—TIMSS 8th grade science6 ..........................................................................—
Health
Prevalence of visual impairment (%) .......................................................... 1.6Public spending on health (% of GDP) ...................................................... 6.2Business impact of heart disease1 .......................................................... 4.08Business impact of cancer1 .................................................................... 4.24Business impact of mental illness1 .......................................................... 5.12Business impact of diabetes1 ................................................................. 4.88Business impact of chronic respiratory disease1 ..................................... 4.69Business impact of HIV/AIDS1 ................................................................ 5.65Business impact of tuberculosis1 ............................................................ 5.73Business impact of malaria1 ................................................................... 6.55
Society Value
Freedom in the World8................................................................................. 2Democracy Index (rank/165) ...................................................................... 47Population living in urban area (%) .......................................................... 67.7Gini Index (income)5................................................................................ 34.8Accessibility of digital content1 ............................................................... 5.93Extent of virtual social networks use1 ..................................................... 5.87
Workforce
Economic activity (agriculture) — % of total activity .................................. 9.5Economic activity (industry) — % of total activity .................................... 23.3Economic activity (services) — % of total activity .................................... 66.7GDP per person employed (US$) ....................................................... 28,935Cooperation in labour-employer relations1 .............................................. 4.53Emigration rate of the tertiary educated (%) .............................................. 8.5Labour force with tertiary education (%) ................................................. 29.2Number of patent applications (per 1,000 people) .............................. 0.0875Hiring and firing practices1 ...................................................................... 4.23Retirement age, male ................................................................................ 62Retirement age, female .............................................................................. 62Number of informal sector workers (1,000s) ...............................................—Total employed (1,000s) .......................................................................... 941Total unemployed (1,000s) ....................................................................... 216Unemployment for 12 months or more
as a % of total unemployment ......................................................... 45.0Total youth not in education or employment (1,000s) ............................. 60.7Unemployment for 12 months or more (1,000s) ..................................... 97.3Global Innovation Index (rank/142) ............................................................ 33Global Talent Index (rank/60) ......................................................................—Quality of Labour Force (rank/60) ...............................................................—Talent Environment (rank/60) ......................................................................—IQ measure9 ........................................................................................... 96.1

2.1: Country Profiles
302 | The Human Capital Report
Rank/122 Score
Year
s (5
yea
r age
gro
ups)
Percent of total population
0–4
5–9
10–14
15–19
20–24
25–29
30–34
35–39
40–44
45–49
50–54
55–59
60–64
65–69
70–74
75–79
80–84
85–89
90–94
95–99
100+
0 1 2 3 4 55 4 3 2 1 0
LebanonHuman Capital Index 2013 74 –0.220
Pillar 1: Education 32 0.548
Pillar 2: Health and wellness 77 –0.099
Pillar 3: Workforce and employment 96 –0.458
Pillar 4: Enabling environment 104 –0.870
Key Indicators
Total population (1,000s) 4,341.1
Median age of population 29
GDP per capita PPP (constant 2005, international $) 12,592
GDP growth (annual %) 1.4
Male Female Additional indicators
n Total population n Total population Aged dependency: 12.5%
n Labour force participation n Labour force participation Youth dependency: 34.9%
n Primary and secondary enrolment n Primary and secondary enrolment Male labour force participation, age 65+: 1.2%
Female labour force participation, age 65+: 0.1%
Education and workforce distribution

The Human Capital Report | 303
2.1: Country Profiles
HCI s
core
–2.5
–2.0
–1.5
–1.0
–0.5
0.0
0.5
1.0
1.5
2.0
2.5
Overall Index
Enablingenvironment
Workforce andemployment
Health andwellness
Education
LebanonEmployment types, educational requirements and educational attainment
Percent of population Educational in employment type attainment (%)
Tertiary requirements 6.9 15.3
Professionals 3.6
Technicians and associate professionals 3.4
Secondary requirements 17.8 38.8
Clerks 2.7
Service workers and shop and market sales workers 4.4
Skilled agricultural and fishery workers 1.6
Craft and related trade workers 6.1
Plant and machine operators and assemblers 2.9
Primary requirements 4.0 24.1
Elementary occupations 4.0
Various 8.4
Legislators, senior officials and managers 4.2
Unclassified 1.6
Armed forces 2.6
Spread of scores (by pillar and overall)
Lebanon
Upper-middle income economies
Middle East and North Africa

2.1: Country Profiles
304 | The Human Capital Report
Pillar 1: Education Rank/122 Z-Score Country Value Sample Minimum Sample Maximum
Access
Primary enrolment rate (%) ...................................................................55.........................0.435........................ 97...........................58 ......................... 100
Secondary enrolment rate (%) ..............................................................59.........................0.168........................ 76...........................16 ......................... 100
Tertiary enrolment ratio (%) ...................................................................36.........................0.650........................ 58.............................1 ......................... 103
Education gender gap2 .........................................................................79.........................0.286................... 0.980......................0.645 ...................... 1.000
Quality
Internet access in schools1 ...................................................................93.......................–0.744..................... 3.39........................1.64 ........................ 6.64
Quality of the education system1 ..........................................................13.........................1.523..................... 5.16........................1.99 ........................ 5.98
Quality of primary schools1 .....................................................................7.........................1.650..................... 5.73........................1.97 ........................ 6.82
Quality of math & science education1 .....................................................4.........................1.863..................... 5.82........................1.88 ........................ 6.29
Quality of management schools1 ..........................................................13.........................1.333..................... 5.41........................2.29 ........................ 6.09
Attainment
Primary education attainment (% population age 25+) ..........................40.........................0.064........................ 78.............................5 ......................... 100
Secondary education attainment (% population age 25+) .....................51.......................–0.334........................ 54.............................2 ......................... 100
Tertiary education attainment (% population age 25+) ..........................52.......................–0.323........................ 15.............................0 ........................... 44
Pillar 2: Health and Wellness Rank/122 Z-Score Country Value Sample Minimum Sample Maximum
Survival
Infant mortality (per 1,000 live births) ....................................................42.........................0.608.......................... 8.............................2 ........................... 98
Life expectancy ...................................................................................59.........................0.177........................ 74...........................50 ........................... 83
Survival gender gap2 ..............................................................................1.........................0.751................... 0.980......................0.920 ...................... 0.980
Health
Stunting and wasting (% in children under 5) ........................................35.........................0.428..................... 11.6..........................1.2 ........................ 36.5
Unhealthy life years (% of life expectancy) ............................................90.......................–0.264........................ 16.............................8 ........................... 66
Deaths under 60 from non-communicable
diseases (% of all NCD deaths) ......................................................57.........................0.227 ..................... 23.7 ..........................7.3 ........................ 55.8
Obesity (% of adults with BMI ≥ 30) ...................................................105.......................–1.020..................... 28.2..........................1.1 ........................ 42.8
Business impact of non-communicable diseases1 ................................53.........................0.201..................... 4.57........................2.74 ........................ 5.87
Business impact of communicable diseases1 .......................................28.........................0.854..................... 6.33........................3.13 ........................ 6.90
Well-being
Stress (% of respondents)7 ................................................................114.......................–1.723........................ 53.............................8 ........................... 69
Depression (% of respondents)7 .........................................................112.......................–2.253........................ 26.............................2 ........................... 37
Services
Water, sanitation and hygiene (% with access) .......................................1.........................0.815................... 100.0........................31.1 ...................... 100.0
Healthcare quality1................................................................................42.........................0.437..................... 4.64........................1.78 ........................ 6.75
Healthcare accessibility1 .......................................................................82.......................–0.630..................... 3.89........................2.41 ........................ 6.75
Pillar 3: Workforce and Employment Rank/122 Z-Score Country Value Sample Minimum Sample Maximum
Participation
Labour force participation rate, age 15-64 (%) ...................................117.......................–2.044..................... 49.2........................43.4 ........................ 90.6
Labour force participation rate, age 65+ (%) .........................................71.......................–0.586..................... 13.3..........................1.6 ........................ 91.2
Economic participation gender gap2 ...................................................109.......................–1.706................... 0.442......................0.310 ...................... 0.839
Unemployment rate (%) ........................................................................71.......................–0.047....................... 9.0..........................0.3 ........................ 32.0
Youth unemployment rate (%) ...............................................................68.......................–0.359..................... 22.1..........................1.6 ........................ 48.2
Talent
Country capacity to attract talent1 ........................................................99.......................–0.992..................... 2.42........................1.48 ........................ 6.08
Country capacity to retain talent1..........................................................97.......................–0.876..................... 2.68........................1.81 ........................ 5.97
Ease of finding skilled employees1 ........................................................30.........................0.751..................... 4.51........................2.13 ........................ 5.69
Pay related to productivity1 ...................................................................50.........................0.291..................... 4.10........................2.37 ........................ 5.25
Capacity for innovation1........................................................................78.......................–0.433..................... 3.36........................2.31 ........................ 5.84
Index of Economic Complexity3 ............................................................40.........................0.291..................... 0.39......................–1.96 ........................ 2.37
Firm level technology absorption1 .........................................................75.......................–0.451..................... 4.49........................3.17 ........................ 6.23
Scientific and technical journal articles (per 1,000 people) ....................50.......................–0.425................... 0.061......................0.000 ...................... 1.242
Median age of the working population ..................................................72.......................–0.321........................ 33...........................28 ........................... 42
Training
Staff training1 ........................................................................................85.......................–0.554..................... 3.69........................2.51 ........................ 5.57
Training services1 ..................................................................................54.........................0.127..................... 4.41........................2.67 ........................ 6.47
Lebanon

2.1: Country Profiles
NOTESIn the sections for Pillar 1, Pillar 2, Pillar 3 and Pillar 4, values under Country Value, Sample Minimum and Sample Maximum refer to underlying data for each variable.For further details and explanations, please refer to the section “How to Read the Country Profiles”.1 Survey data responses on a 1- to 7-scale (1 = worst score, 7 = best score)2 Data on a 0- to 1-scale (0 = worst score, 1 = best score)3 Data from -1.960 (worst score) to 2.367 (best score)4 Rank number on a list of 185 countries5 Index on a scale of 0 (perfect inequality) to 100 (perfect equality)6 International test scores7 Perception survey data. Percentage of yes responses.8 Score (1 = best, 7 = worst)9 Reported in relation to UK score (100)
The Human Capital Report | 305
LebanonPillar 4: Enabling Environment Rank/122 Z-Score Country Value Sample Minimum Sample Maximum
Infrastructure
Mobile users (per 100 people) ............................................................101.......................–0.836........................ 79...........................17 ......................... 191
Internet users (per 100 people) .............................................................47.........................0.291........................ 52.............................1 ........................... 95
Quality of domestic transport1 ............................................................121.......................–2.335 ..................... 2.44 ........................2.08 ........................ 6.51
Collaboration
State of cluster development1 ............................................................103.......................–0.948..................... 3.22........................2.33 ........................ 5.49
Business and university R&D collaboration1 ..........................................96.......................–0.732..................... 3.13........................2.11 ........................ 5.84
Legal framework
Doing Business Index4 .........................................................................85.......................–0.680...................... 115.............................1 ......................... 180
Social safety net protection1 ...............................................................117.......................–1.302..................... 2.37........................2.10 ........................ 6.26
Intellectual property protection and property rights1............................100.......................–0.905 ..................... 3.16 ........................1.62 ........................ 6.31
Social mobility
Social mobility1 .....................................................................................72.......................–0.384..................... 4.04........................2.78 ........................ 6.36
Additional indicatorsDemographics Value
Child dependency ratio (%)..................................................................... 34.9Aged dependency ratio (%) .................................................................... 12.5Fertility rate (births per woman) ................................................................. 1.6Sex ratio at birth (female/male) ............................................................... 0.95Population below age 20 (%) .................................................................. 33.9Population above age 60 (%) .................................................................. 11.9
Education
Public spending on education (% of GDP) ................................................ 1.6Technical/vocational enrolment as % of total
enrolment in secondary school ........................................................... 17Adult literacy (%) ..................................................................................... 89.6Boys not in primary school (%) .................................................................... 3Girls not in primary school (%) ..................................................................... 3Education poverty (% of children age 17-22
with less than 2-4 years schooling) ......................................................—Private enrolment in primary school (% of primary) ................................. 73.7Private enrolment in secondary school (% of secondary) ........................ 61.3PIRLS6 .......................................................................................................—PISA math scores6 .....................................................................................—PISA reading scores6 ..................................................................................—PISA science scores6 .................................................................................—TIMSS 4th grade math6 ..............................................................................—TIMSS 4th grade science6 ..........................................................................—TIMSS 8th grade math6 ........................................................................... 449TIMSS 8th grade science6 ....................................................................... 406
Health
Prevalence of visual impairment (%) .......................................................... 3.5Public spending on health (% of GDP) ...................................................... 6.3Business impact of heart disease1 .......................................................... 4.34Business impact of cancer1 .................................................................... 4.08Business impact of mental illness1 .......................................................... 5.18Business impact of diabetes1 ................................................................. 4.68Business impact of chronic respiratory disease1 ..................................... 4.58Business impact of HIV/AIDS1 ................................................................ 6.11Business impact of tuberculosis1 ............................................................ 6.40Business impact of malaria1 ................................................................... 6.47
Society Value
Freedom in the World8................................................................................. 5Democracy Index (rank/165) ...................................................................... 99Population living in urban area (%) .......................................................... 87.4Gini Index (income)5....................................................................................—Accessibility of digital content1 ............................................................... 4.17Extent of virtual social networks use1 ..................................................... 5.67
Workforce
Economic activity (agriculture) — % of total activity ....................................—Economic activity (industry) — % of total activity ........................................—Economic activity (services) — % of total activity ........................................—GDP per person employed (US$) ...............................................................—Cooperation in labour-employer relations1 .............................................. 4.17Emigration rate of the tertiary educated (%) ............................................ 43.9Labour force with tertiary education (%) ................................................. 24.1Number of patent applications (per 1,000 people) .............................. 0.0650Hiring and firing practices1 ...................................................................... 4.18Retirement age, male ................................................................................ 64Retirement age, female .............................................................................. 64Number of informal sector workers (1,000s) ...............................................—Total employed (1,000s) ....................................................................... 1,118Total unemployed (1,000s) ....................................................................... 110Unemployment for 12 months or more
as a % of total unemployment .............................................................—Total youth not in education or employment (1,000s) .................................—Unemployment for 12 months or more (1,000s) .........................................—Global Innovation Index (rank/142) ............................................................ 75Global Talent Index (rank/60) ......................................................................—Quality of Labour Force (rank/60) ...............................................................—Talent Environment (rank/60) ......................................................................—IQ measure9 ........................................................................................... 84.6

2.1: Country Profiles
306 | The Human Capital Report
Rank/122 Score
Year
s (5
yea
r age
gro
ups)
Percent of total population
0–4
5–9
10–14
15–19
20–24
25–29
30–34
35–39
40–44
45–49
50–54
55–59
60–64
65–69
70–74
75–79
80–84
85–89
90–94
95–99
100+
0 1 2 3 4 5 6 7 88 7 6 5 4 3 2 1 0
LesothoHuman Capital Index 2013 108 –0.751
Pillar 1: Education 110 –1.084
Pillar 2: Health and wellness 101 –0.588
Pillar 3: Workforce and employment 95 –0.438
Pillar 4: Enabling environment 107 –0.894
Key Indicators
Total population (1,000s) 2,008.9
Median age of population 20
GDP per capita PPP (constant 2005, international $) 1,692
GDP growth (annual %) 4.0
Male Female Additional indicators
n Total population n Total population Aged dependency: 7.4%
n Labour force participation n Labour force participation Youth dependency: 64.8%
n Primary and secondary enrolment n Primary and secondary enrolment Male labour force participation, age 65+: n/a
Female labour force participation, age 65+: n/a
Education and workforce distribution

The Human Capital Report | 307
2.1: Country Profiles
HCI s
core
–2.5
–2.0
–1.5
–1.0
–0.5
0.0
0.5
1.0
1.5
2.0
2.5
Overall Index
Enablingenvironment
Workforce andemployment
Health andwellness
Education
LesothoEmployment types, educational requirements and educational attainment
Percent of population Educational in employment type attainment (%)
Tertiary requirements n/a 1.9
Professionals n/a
Technicians and associate professionals n/a
Secondary requirements n/a 15.5
Clerks n/a
Service workers and shop and market sales workers n/a
Skilled agricultural and fishery workers n/a
Craft and related trade workers n/a
Plant and machine operators and assemblers n/a
Primary requirements n/a 20.1
Elementary occupations n/a
Various n/a
Legislators, senior officials and managers n/a
Unclassified n/a
Armed forces n/a
Spread of scores (by pillar and overall)
Lesotho
Lower-middle income economies
Sub-Saharan Africa

2.1: Country Profiles
308 | The Human Capital Report
Pillar 1: Education Rank/122 Z-Score Country Value Sample Minimum Sample Maximum
Access
Primary enrolment rate (%) .................................................................110.......................–2.173........................ 75...........................58 ......................... 100
Secondary enrolment rate (%) ..............................................................93.......................–1.771........................ 32...........................16 ......................... 100
Tertiary enrolment ratio (%) .................................................................115.......................–1.408.......................... 4.............................1 ......................... 103
Education gender gap2 ...........................................................................1.........................0.548................... 1.000......................0.645 ...................... 1.000
Quality
Internet access in schools1 .................................................................104.......................–1.064..................... 2.99........................1.64 ........................ 6.64
Quality of the education system1 ..........................................................61.......................–0.188..................... 3.63........................1.99 ........................ 5.98
Quality of primary schools1 ...................................................................83.......................–0.550..................... 3.34........................1.97 ........................ 6.82
Quality of math & science education1 ...................................................88.......................–0.677..................... 3.39........................1.88 ........................ 6.29
Quality of management schools1 ........................................................106.......................–1.107..................... 3.37........................2.29 ........................ 6.09
Attainment
Primary education attainment (% population age 25+) ..........................66.......................–1.480........................ 41.............................5 ......................... 100
Secondary education attainment (% population age 25+) .....................78.......................–1.587........................ 21.............................2 ......................... 100
Tertiary education attainment (% population age 25+) ..........................82.......................–1.548.......................... 2.............................0 ........................... 44
Pillar 2: Health and Wellness Rank/122 Z-Score Country Value Sample Minimum Sample Maximum
Survival
Infant mortality (per 1,000 live births) ..................................................113.......................–1.862........................ 63.............................2 ........................... 98
Life expectancy .................................................................................122.......................–2.740........................ 50...........................50 ........................... 83
Survival gender gap2 ..............................................................................1.........................0.751................... 0.980......................0.920 ...................... 0.980
Health
Stunting and wasting (% in children under 5) ........................................58.......................–0.700..................... 21.5..........................1.2 ........................ 36.5
Unhealthy life years (% of life expectancy) ..........................................108.......................–0.893........................ 20.............................8 ........................... 66
Deaths under 60 from non-communicable
diseases (% of all NCD deaths) ......................................................82.......................–0.449 ..................... 32.3 ..........................7.3 ........................ 55.8
Obesity (% of adults with BMI ≥ 30) .....................................................44.........................0.173..................... 16.9..........................1.1 ........................ 42.8
Business impact of non-communicable diseases1 ................................13.........................1.142..................... 4.99........................2.74 ........................ 5.87
Business impact of communicable diseases1 .....................................103.......................–1.225..................... 4.26........................3.13 ........................ 6.90
Well-being
Stress (% of respondents)7 ..................................................................21.........................0.757........................ 21.............................8 ........................... 69
Depression (% of respondents)7 ...........................................................—..............................— .........................— .............................2 ........................... 37
Services
Water, sanitation and hygiene (% with access) ...................................108.......................–1.657..................... 51.8........................31.1 ...................... 100.0
Healthcare quality1................................................................................69.......................–0.493..................... 3.51........................1.78 ........................ 6.75
Healthcare accessibility1 .......................................................................73.......................–0.447..................... 4.12........................2.41 ........................ 6.75
Pillar 3: Workforce and Employment Rank/122 Z-Score Country Value Sample Minimum Sample Maximum
Participation
Labour force participation rate, age 15-64 (%) .....................................78.......................–0.214..................... 67.1........................43.4 ........................ 90.6
Labour force participation rate, age 65+ (%) .........................................19.........................1.179..................... 47.5..........................1.6 ........................ 91.2
Economic participation gender gap2 .......................................................4.........................1.466................... 0.816......................0.310 ...................... 0.839
Unemployment rate (%) ........................................................................—..............................— .........................— ..........................0.3 ........................ 32.0
Youth unemployment rate (%) ...............................................................98.......................–1.624..................... 34.4..........................1.6 ........................ 48.2
Talent
Country capacity to attract talent1 ........................................................68.......................–0.161..................... 3.27........................1.48 ........................ 6.08
Country capacity to retain talent1..........................................................79.......................–0.470..................... 3.08........................1.81 ........................ 5.97
Ease of finding skilled employees1 ........................................................23.........................0.929..................... 4.63........................2.13 ........................ 5.69
Pay related to productivity1 .................................................................101.......................–0.883..................... 3.38........................2.37 ........................ 5.25
Capacity for innovation1......................................................................112.......................–1.104..................... 2.83........................2.31 ........................ 5.84
Index of Economic Complexity3 ............................................................—..............................— .........................— ......................–1.96 ........................ 2.37
Firm level technology absorption1 .......................................................121.......................–1.579..................... 3.69........................3.17 ........................ 6.23
Scientific and technical journal articles (per 1,000 people) ..................113.......................–0.623................... 0.002......................0.000 ...................... 1.242
Median age of the working population ................................................121.......................–1.594........................ 28...........................28 ........................... 42
Training
Staff training1 ........................................................................................95.......................–0.699..................... 3.60........................2.51 ........................ 5.57
Training services1 ..................................................................................91.......................–0.748..................... 3.71........................2.67 ........................ 6.47
Lesotho

2.1: Country Profiles
NOTESIn the sections for Pillar 1, Pillar 2, Pillar 3 and Pillar 4, values under Country Value, Sample Minimum and Sample Maximum refer to underlying data for each variable.For further details and explanations, please refer to the section “How to Read the Country Profiles”.1 Survey data responses on a 1- to 7-scale (1 = worst score, 7 = best score)2 Data on a 0- to 1-scale (0 = worst score, 1 = best score)3 Data from -1.960 (worst score) to 2.367 (best score)4 Rank number on a list of 185 countries5 Index on a scale of 0 (perfect inequality) to 100 (perfect equality)6 International test scores7 Perception survey data. Percentage of yes responses.8 Score (1 = best, 7 = worst)9 Reported in relation to UK score (100)
The Human Capital Report | 309
LesothoPillar 4: Enabling Environment Rank/122 Z-Score Country Value Sample Minimum Sample Maximum
Infrastructure
Mobile users (per 100 people) ............................................................111.......................–1.497........................ 56...........................17 ......................... 191
Internet users (per 100 people) ...........................................................113.......................–1.415.......................... 4.............................1 ........................... 95
Quality of domestic transport1 ..............................................................85.......................–0.532..................... 4.01........................2.08 ........................ 6.51
Collaboration
State of cluster development1 ..............................................................75.......................–0.411..................... 3.60........................2.33 ........................ 5.49
Business and university R&D collaboration1 ........................................110.......................–1.183..................... 2.72........................2.11 ........................ 5.84
Legal framework
Doing Business Index4 .......................................................................101.......................–1.087...................... 136.............................1 ......................... 180
Social safety net protection1 .................................................................68.......................–0.285..................... 3.47........................2.10 ........................ 6.26
Intellectual property protection and property rights1..............................92.......................–0.807 ..................... 3.27 ........................1.62 ........................ 6.31
Social mobility
Social mobility1 .....................................................................................97.......................–0.827..................... 3.64........................2.78 ........................ 6.36
Additional indicatorsDemographics Value
Child dependency ratio (%)..................................................................... 64.8Aged dependency ratio (%) ...................................................................... 7.4Fertility rate (births per woman) ................................................................. 3.4Sex ratio at birth (female/male) ............................................................... 0.97Population below age 20 (%) .................................................................. 49.7Population above age 60 (%) .................................................................... 6.3
Education
Public spending on education (% of GDP) .............................................. 13.0Technical/vocational enrolment as % of total
enrolment in secondary school ............................................................. 2Adult literacy (%) ..................................................................................... 75.8Boys not in primary school (%) .................................................................. 26Girls not in primary school (%) ................................................................... 24Education poverty (% of children age 17-22
with less than 2-4 years schooling) ................................................ 0.237Private enrolment in primary school (% of primary) ................................... 0.7Private enrolment in secondary school (% of secondary) .......................... 1.2PIRLS6 .......................................................................................................—PISA math scores6 .....................................................................................—PISA reading scores6 ..................................................................................—PISA science scores6 .................................................................................—TIMSS 4th grade math6 ..............................................................................—TIMSS 4th grade science6 ..........................................................................—TIMSS 8th grade math6 ..............................................................................—TIMSS 8th grade science6 ..........................................................................—
Health
Prevalence of visual impairment (%) .......................................................... 3.7Public spending on health (% of GDP) .................................................... 12.8Business impact of heart disease1 .......................................................... 4.85Business impact of cancer1 .................................................................... 5.22Business impact of mental illness1 .......................................................... 5.37Business impact of diabetes1 ................................................................. 4.21Business impact of chronic respiratory disease1 ..................................... 5.31Business impact of HIV/AIDS1 ................................................................ 2.97Business impact of tuberculosis1 ............................................................ 3.76Business impact of malaria1 ................................................................... 6.05
Society Value
Freedom in the World8................................................................................. 2Democracy Index (rank/165) ...................................................................... 55Population living in urban area (%) .......................................................... 28.3Gini Index (income)5................................................................................ 52.5Accessibility of digital content1 ............................................................... 3.70Extent of virtual social networks use1 ..................................................... 4.37
Workforce
Economic activity (agriculture) — % of total activity ....................................—Economic activity (industry) — % of total activity ........................................—Economic activity (services) — % of total activity ........................................—GDP per person employed (US$) ...............................................................—Cooperation in labour-employer relations1 .............................................. 3.78Emigration rate of the tertiary educated (%) .............................................. 4.1Labour force with tertiary education (%) .....................................................—Number of patent applications (per 1,000 people) ......................................—Hiring and firing practices1 ...................................................................... 3.85Retirement age, male .................................................................................—Retirement age, female ...............................................................................—Number of informal sector workers (1,000s) ............................................ 160Total employed (1,000s) .............................................................................—Total unemployed (1,000s) ....................................................................... 192Unemployment for 12 months or more
as a % of total unemployment .............................................................—Total youth not in education or employment (1,000s) .................................—Unemployment for 12 months or more (1,000s) .........................................—Global Innovation Index (rank/142) .......................................................... 124Global Talent Index (rank/60) ......................................................................—Quality of Labour Force (rank/60) ...............................................................—Talent Environment (rank/60) ......................................................................—IQ measure9 ........................................................................................... 68.7

2.1: Country Profiles
310 | The Human Capital Report
Rank/122 Score
Year
s (5
yea
r age
gro
ups)
Percent of total population
0–4
5–9
10–14
15–19
20–24
25–29
30–34
35–39
40–44
45–49
50–54
55–59
60–64
65–69
70–74
75–79
80–84
85–89
90–94
95–99
100+
0 1 2 3 4 55 4 3 2 1 0
LithuaniaHuman Capital Index 2013 34 0.360
Pillar 1: Education 23 0.745
Pillar 2: Health and wellness 41 0.252
Pillar 3: Workforce and employment 56 –0.018
Pillar 4: Enabling environment 36 0.462
Key Indicators
Total population (1,000s) 3,068.5
Median age of population 39
GDP per capita PPP (constant 2005, international $) 18,776
GDP growth (annual %) 3.7
Male Female Additional indicators
n Total population n Total population Aged dependency: 22.4%
n Labour force participation n Labour force participation Youth dependency: 22.0%
n Primary and secondary enrolment n Primary and secondary enrolment Male labour force participation, age 65+: 0.4%
Female labour force participation, age 65+: 0.4%
Education and workforce distribution

The Human Capital Report | 311
2.1: Country Profiles
HCI s
core
–2.5
–2.0
–1.5
–1.0
–0.5
0.0
0.5
1.0
1.5
2.0
2.5
Overall Index
Enablingenvironment
Workforce andemployment
Health andwellness
Education
LithuaniaEmployment types, educational requirements and educational attainment
Percent of population Educational in employment type attainment (%)
Tertiary requirements 17.5 29.3
Professionals 10.8
Technicians and associate professionals 6.7
Secondary requirements 31.3 42.0
Clerks 2.8
Service workers and shop and market sales workers 7.4
Skilled agricultural and fishery workers 3.1
Craft and related trade workers 11.9
Plant and machine operators and assemblers 6.2
Primary requirements 6.1 6.9
Elementary occupations 6.1
Various 6.3
Legislators, senior officials and managers 6.2
Unclassified n/a
Armed forces 0.1
Spread of scores (by pillar and overall)
Lithuania
High-income economies
Europe and Central Asia

2.1: Country Profiles
312 | The Human Capital Report
Pillar 1: Education Rank/122 Z-Score Country Value Sample Minimum Sample Maximum
Access
Primary enrolment rate (%) ...................................................................79.........................0.020........................ 94...........................58 ......................... 100
Secondary enrolment rate (%) ..............................................................22.........................0.802........................ 91...........................16 ......................... 100
Tertiary enrolment ratio (%) ...................................................................21.........................1.100........................ 69.............................1 ......................... 103
Education gender gap2 .........................................................................40.........................0.487................... 0.995......................0.645 ...................... 1.000
Quality
Internet access in schools1 ...................................................................21.........................1.197..................... 5.82........................1.64 ........................ 6.64
Quality of the education system1 ..........................................................49.........................0.170..................... 3.95........................1.99 ........................ 5.98
Quality of primary schools1 ...................................................................23.........................0.968..................... 4.99........................1.97 ........................ 6.82
Quality of math & science education1 ...................................................13.........................1.173..................... 5.16........................1.88 ........................ 6.29
Quality of management schools1 ..........................................................52.........................0.089..................... 4.37........................2.29 ........................ 6.09
Attainment
Primary education attainment (% population age 25+) ..........................12.........................0.905........................ 99.............................5 ......................... 100
Secondary education attainment (% population age 25+) .....................17.........................1.077........................ 92.............................2 ......................... 100
Tertiary education attainment (% population age 25+) ..........................19.........................0.949........................ 29.............................0 ........................... 44
Pillar 2: Health and Wellness Rank/122 Z-Score Country Value Sample Minimum Sample Maximum
Survival
Infant mortality (per 1,000 live births) ....................................................29.........................0.742.......................... 5.............................2 ........................... 98
Life expectancy ...................................................................................59.........................0.177........................ 74...........................50 ........................... 83
Survival gender gap2 ............................................................................28.........................0.714................... 0.979......................0.920 ...................... 0.980
Health
Stunting and wasting (% in children under 5) ........................................—..............................— .........................— ..........................1.2 ........................ 36.5
Unhealthy life years (% of life expectancy) ............................................77.......................–0.039........................ 15.............................8 ........................... 66
Deaths under 60 from non-communicable
diseases (% of all NCD deaths) ......................................................40.........................0.644 ..................... 18.4 ..........................7.3 ........................ 55.8
Obesity (% of adults with BMI ≥ 30) .....................................................92.......................–0.650..................... 24.7..........................1.1 ........................ 42.8
Business impact of non-communicable diseases1 ................................54.........................0.185..................... 4.56........................2.74 ........................ 5.87
Business impact of communicable diseases1 .......................................44.........................0.605..................... 6.08........................3.13 ........................ 6.90
Well-being
Stress (% of respondents)7 ..................................................................10.........................1.145........................ 16.............................8 ........................... 69
Depression (% of respondents)7 ...........................................................97.......................–0.978........................ 18.............................2 ........................... 37
Services
Water, sanitation and hygiene (% with access) .....................................64.........................0.403..................... 92.0........................31.1 ...................... 100.0
Healthcare quality1................................................................................54.........................0.031..................... 4.15........................1.78 ........................ 6.75
Healthcare accessibility1 .......................................................................46.........................0.301..................... 5.03........................2.41 ........................ 6.75
Pillar 3: Workforce and Employment Rank/122 Z-Score Country Value Sample Minimum Sample Maximum
Participation
Labour force participation rate, age 15-64 (%) .....................................55.........................0.154..................... 70.7........................43.4 ........................ 90.6
Labour force participation rate, age 65+ (%) .......................................110.......................–1.035....................... 4.6..........................1.6 ........................ 91.2
Economic participation gender gap2 .....................................................22.........................0.946................... 0.755......................0.310 ...................... 0.839
Unemployment rate (%) ......................................................................100.......................–1.732..................... 17.8..........................0.3 ........................ 32.0
Youth unemployment rate (%) ...............................................................49.........................0.299..................... 15.7..........................1.6 ........................ 48.2
Talent
Country capacity to attract talent1 ......................................................109.......................–1.260..................... 2.14........................1.48 ........................ 6.08
Country capacity to retain talent1........................................................108.......................–1.037..................... 2.53........................1.81 ........................ 5.97
Ease of finding skilled employees1 ........................................................87.......................–0.602..................... 3.57........................2.13 ........................ 5.69
Pay related to productivity1 ...................................................................12.........................1.248..................... 4.69........................2.37 ........................ 5.25
Capacity for innovation1........................................................................36.........................0.327..................... 3.96........................2.31 ........................ 5.84
Index of Economic Complexity3 ............................................................33.........................0.595..................... 0.68......................–1.96 ........................ 2.37
Firm level technology absorption1 .........................................................39.........................0.557..................... 5.21........................3.17 ........................ 6.23
Scientific and technical journal articles (per 1,000 people) ....................35.......................–0.241................... 0.116......................0.000 ...................... 1.242
Median age of the working population ..................................................36.........................0.872........................ 39...........................28 ........................... 42
Training
Staff training1 ........................................................................................52.........................0.131..................... 4.13........................2.51 ........................ 5.57
Training services1 ..................................................................................37.........................0.489..................... 4.69........................2.67 ........................ 6.47
Lithuania
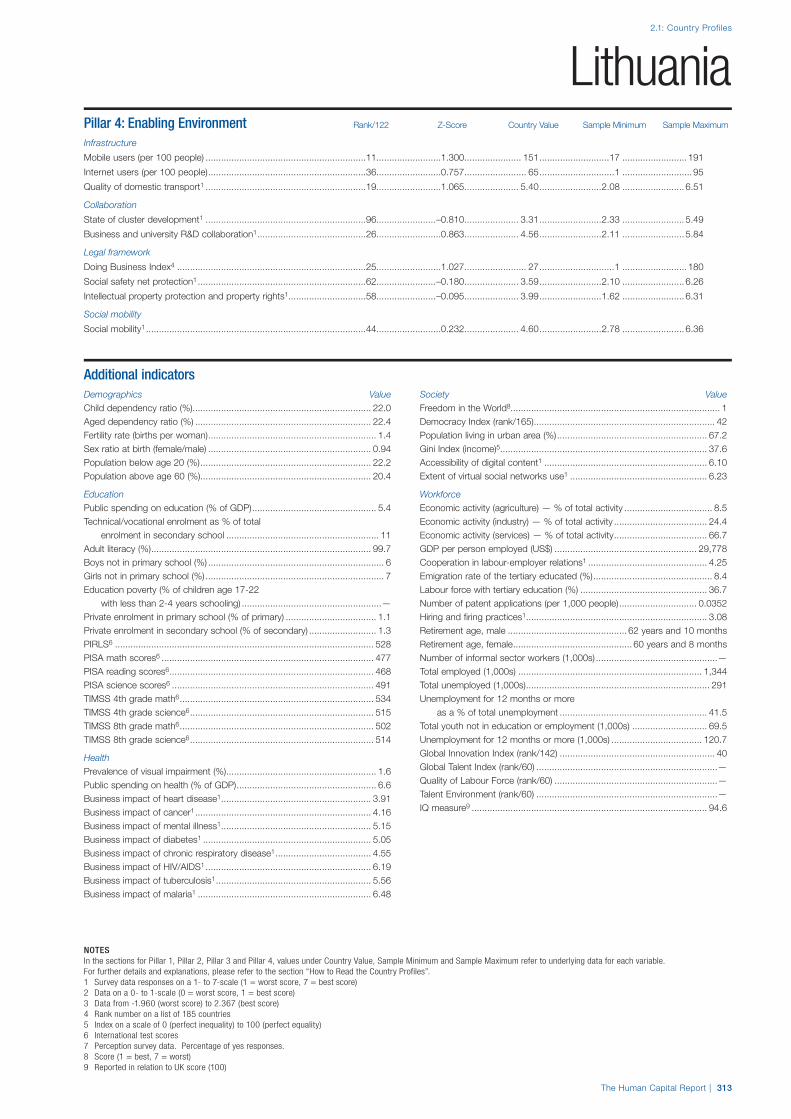
2.1: Country Profiles
NOTESIn the sections for Pillar 1, Pillar 2, Pillar 3 and Pillar 4, values under Country Value, Sample Minimum and Sample Maximum refer to underlying data for each variable.For further details and explanations, please refer to the section “How to Read the Country Profiles”.1 Survey data responses on a 1- to 7-scale (1 = worst score, 7 = best score)2 Data on a 0- to 1-scale (0 = worst score, 1 = best score)3 Data from -1.960 (worst score) to 2.367 (best score)4 Rank number on a list of 185 countries5 Index on a scale of 0 (perfect inequality) to 100 (perfect equality)6 International test scores7 Perception survey data. Percentage of yes responses.8 Score (1 = best, 7 = worst)9 Reported in relation to UK score (100)
The Human Capital Report | 313
LithuaniaPillar 4: Enabling Environment Rank/122 Z-Score Country Value Sample Minimum Sample Maximum
Infrastructure
Mobile users (per 100 people) ..............................................................11.........................1.300...................... 151...........................17 ......................... 191
Internet users (per 100 people) .............................................................36.........................0.757........................ 65.............................1 ........................... 95
Quality of domestic transport1 ..............................................................19.........................1.065 ..................... 5.40 ........................2.08 ........................ 6.51
Collaboration
State of cluster development1 ..............................................................96.......................–0.810..................... 3.31........................2.33 ........................ 5.49
Business and university R&D collaboration1 ..........................................26.........................0.863 ..................... 4.56 ........................2.11 ........................ 5.84
Legal framework
Doing Business Index4 .........................................................................25.........................1.027........................ 27.............................1 ......................... 180
Social safety net protection1 .................................................................62.......................–0.180..................... 3.59........................2.10 ........................ 6.26
Intellectual property protection and property rights1..............................58.......................–0.095 ..................... 3.99 ........................1.62 ........................ 6.31
Social mobility
Social mobility1 .....................................................................................44.........................0.232..................... 4.60........................2.78 ........................ 6.36
Additional indicatorsDemographics Value
Child dependency ratio (%)..................................................................... 22.0Aged dependency ratio (%) .................................................................... 22.4Fertility rate (births per woman) ................................................................. 1.4Sex ratio at birth (female/male) ............................................................... 0.94Population below age 20 (%) .................................................................. 22.2Population above age 60 (%) .................................................................. 20.4
Education
Public spending on education (% of GDP) ................................................ 5.4Technical/vocational enrolment as % of total
enrolment in secondary school ........................................................... 11Adult literacy (%) ..................................................................................... 99.7Boys not in primary school (%) .................................................................... 6Girls not in primary school (%) ..................................................................... 7Education poverty (% of children age 17-22
with less than 2-4 years schooling) ......................................................—Private enrolment in primary school (% of primary) ................................... 1.1Private enrolment in secondary school (% of secondary) .......................... 1.3PIRLS6 .................................................................................................... 528PISA math scores6 .................................................................................. 477PISA reading scores6 ............................................................................... 468PISA science scores6 .............................................................................. 491TIMSS 4th grade math6 ........................................................................... 534TIMSS 4th grade science6 ....................................................................... 515TIMSS 8th grade math6 ........................................................................... 502TIMSS 8th grade science6 ....................................................................... 514
Health
Prevalence of visual impairment (%) .......................................................... 1.6Public spending on health (% of GDP) ...................................................... 6.6Business impact of heart disease1 .......................................................... 3.91Business impact of cancer1 .................................................................... 4.16Business impact of mental illness1 .......................................................... 5.15Business impact of diabetes1 ................................................................. 5.05Business impact of chronic respiratory disease1 ..................................... 4.55Business impact of HIV/AIDS1 ................................................................ 6.19Business impact of tuberculosis1 ............................................................ 5.56Business impact of malaria1 ................................................................... 6.48
Society Value
Freedom in the World8................................................................................. 1Democracy Index (rank/165) ...................................................................... 42Population living in urban area (%) .......................................................... 67.2Gini Index (income)5................................................................................ 37.6Accessibility of digital content1 ............................................................... 6.10Extent of virtual social networks use1 ..................................................... 6.23
Workforce
Economic activity (agriculture) — % of total activity .................................. 8.5Economic activity (industry) — % of total activity .................................... 24.4Economic activity (services) — % of total activity .................................... 66.7GDP per person employed (US$) ....................................................... 29,778Cooperation in labour-employer relations1 .............................................. 4.25Emigration rate of the tertiary educated (%) .............................................. 8.4Labour force with tertiary education (%) ................................................. 36.7Number of patent applications (per 1,000 people) .............................. 0.0352Hiring and firing practices1 ...................................................................... 3.08Retirement age, male .............................................. 62 years and 10 monthsRetirement age, female .............................................. 60 years and 8 monthsNumber of informal sector workers (1,000s) ...............................................—Total employed (1,000s) ....................................................................... 1,344Total unemployed (1,000s) ....................................................................... 291Unemployment for 12 months or more
as a % of total unemployment ......................................................... 41.5Total youth not in education or employment (1,000s) ............................. 69.5Unemployment for 12 months or more (1,000s) ................................... 120.7Global Innovation Index (rank/142) ............................................................ 40Global Talent Index (rank/60) ......................................................................—Quality of Labour Force (rank/60) ...............................................................—Talent Environment (rank/60) ......................................................................—IQ measure9 ........................................................................................... 94.6

2.1: Country Profiles
314 | The Human Capital Report
Rank/122 Score
Year
s (5
yea
r age
gro
ups)
Percent of total population
0–4
5–9
10–14
15–19
20–24
25–29
30–34
35–39
40–44
45–49
50–54
55–59
60–64
65–69
70–74
75–79
80–84
85–89
90–94
95–99
100+
0 1 2 3 4 55 4 3 2 1 0
LuxembourgHuman Capital Index 2013 17 0.881
Pillar 1: Education 35 0.522
Pillar 2: Health and wellness 16 0.704
Pillar 3: Workforce and employment 13 0.928
Pillar 4: Enabling environment 9 1.372
Key Indicators
Total population (1,000s) 507.9
Median age of population 39
GDP per capita PPP (constant 2005, international $) 66,808
GDP growth (annual %) 0.3
Male Female Additional indicators
n Total population n Total population Aged dependency: 20.5%
n Labour force participation n Labour force participation Youth dependency: 25.8%
n Primary and secondary enrolment n Primary and secondary enrolment Male labour force participation, age 65+: n/a
Female labour force participation, age 65+: n/a
Education and workforce distribution

The Human Capital Report | 315
2.1: Country Profiles
HCI s
core
–2.5
–2.0
–1.5
–1.0
–0.5
0.0
0.5
1.0
1.5
2.0
2.5
Overall Index
Enablingenvironment
Workforce andemployment
Health andwellness
Education
LuxembourgEmployment types, educational requirements and educational attainment
Percent of population Educational in employment type attainment (%)
Tertiary requirements 13.4 33.2
Professionals 5.9
Technicians and associate professionals 7.5
Secondary requirements 19.3 n/a
Clerks 6.8
Service workers and shop and market sales workers 3.7
Skilled agricultural and fishery workers 1.1
Craft and related trade workers 5.4
Plant and machine operators and assemblers 2.3
Primary requirements 4.5 n/a
Elementary occupations 4.5
Various 7.1
Legislators, senior officials and managers 2.8
Unclassified 4.1
Armed forces 0.2
Spread of scores (by pillar and overall)
Luxembourg
High-income economies
Europe and Central Asia

2.1: Country Profiles
316 | The Human Capital Report
Pillar 1: Education Rank/122 Z-Score Country Value Sample Minimum Sample Maximum
Access
Primary enrolment rate (%) ...................................................................74.........................0.148........................ 95...........................58 ......................... 100
Secondary enrolment rate (%) ..............................................................34.........................0.627........................ 87...........................16 ......................... 100
Tertiary enrolment ratio (%) ...................................................................83.......................–0.850........................ 18.............................1 ......................... 103
Education gender gap2 .........................................................................38.........................0.496................... 0.996......................0.645 ...................... 1.000
Quality
Internet access in schools1 .....................................................................8.........................1.469..................... 6.16........................1.64 ........................ 6.64
Quality of the education system1 ..........................................................28.........................0.673..................... 4.40........................1.99 ........................ 5.98
Quality of primary schools1 ...................................................................33.........................0.683..................... 4.68........................1.97 ........................ 6.82
Quality of math & science education1 ...................................................39.........................0.483..................... 4.50........................1.88 ........................ 6.29
Quality of management schools1 ..........................................................47.........................0.184..................... 4.45........................2.29 ........................ 6.09
Attainment
Primary education attainment (% population age 25+) ..........................—..............................— .........................— .............................5 ......................... 100
Secondary education attainment (% population age 25+) .....................—..............................— .........................— .............................2 ......................... 100
Tertiary education attainment (% population age 25+) ..........................10.........................1.303........................ 33.............................0 ........................... 44
Pillar 2: Health and Wellness Rank/122 Z-Score Country Value Sample Minimum Sample Maximum
Survival
Infant mortality (per 1,000 live births) ......................................................1.........................0.877.......................... 2.............................2 ........................... 98
Life expectancy .....................................................................................3.........................1.150........................ 82...........................50 ........................... 83
Survival gender gap2 ............................................................................75.........................0.078................... 0.972......................0.920 ...................... 0.980
Health
Stunting and wasting (% in children under 5) ........................................—..............................— .........................— ..........................1.2 ........................ 36.5
Unhealthy life years (% of life expectancy) ............................................23.........................0.608........................ 11.............................8 ........................... 66
Deaths under 60 from non-communicable
diseases (% of all NCD deaths) ......................................................22.........................1.068 ..................... 13.0 ..........................7.3 ........................ 55.8
Obesity (% of adults with BMI ≥ 30) .....................................................80.......................–0.513..................... 23.4..........................1.1 ........................ 42.8
Business impact of non-communicable diseases1 ................................20.........................0.966..................... 4.91........................2.74 ........................ 5.87
Business impact of communicable diseases1 .......................................18.........................1.012..................... 6.48........................3.13 ........................ 6.90
Well-being
Stress (% of respondents)7 ..................................................................92.......................–0.715........................ 40.............................8 ........................... 69
Depression (% of respondents)7 ...........................................................18.........................0.775.......................... 7.............................2 ........................... 37
Services
Water, sanitation and hygiene (% with access) .......................................1.........................0.815................... 100.0........................31.1 ...................... 100.0
Healthcare quality1................................................................................10.........................1.574..................... 6.03........................1.78 ........................ 6.75
Healthcare accessibility1 .......................................................................12.........................1.457..................... 6.44........................2.41 ........................ 6.75
Pillar 3: Workforce and Employment Rank/122 Z-Score Country Value Sample Minimum Sample Maximum
Participation
Labour force participation rate, age 15-64 (%) .....................................71.......................–0.122..................... 68.0........................43.4 ........................ 90.6
Labour force participation rate, age 65+ (%) .......................................115.......................–1.097....................... 3.4..........................1.6 ........................ 91.2
Economic participation gender gap2 .......................................................5.........................1.452................... 0.815......................0.310 ...................... 0.839
Unemployment rate (%) ........................................................................20.........................0.829....................... 4.4..........................0.3 ........................ 32.0
Youth unemployment rate (%) ...............................................................40.........................0.453..................... 14.2..........................1.6 ........................ 48.2
Talent
Country capacity to attract talent1 ..........................................................6.........................1.934..................... 5.43........................1.48 ........................ 6.08
Country capacity to retain talent1..........................................................10.........................1.581..................... 5.06........................1.81 ........................ 5.97
Ease of finding skilled employees1 ........................................................42.........................0.412..................... 4.27........................2.13 ........................ 5.69
Pay related to productivity1 ...................................................................41.........................0.451..................... 4.20........................2.37 ........................ 5.25
Capacity for innovation1........................................................................11.........................1.712..................... 5.06........................2.31 ........................ 5.84
Index of Economic Complexity3 ............................................................—..............................— .........................— ......................–1.96 ........................ 2.37
Firm level technology absorption1 .........................................................11.........................1.523..................... 5.90........................3.17 ........................ 6.23
Scientific and technical journal articles (per 1,000 people) ....................29.........................0.289................... 0.275......................0.000 ...................... 1.242
Median age of the working population ..................................................19.........................1.211........................ 40...........................28 ........................... 42
Training
Staff training1 ..........................................................................................3.........................2.086..................... 5.38........................2.51 ........................ 5.57
Training services1 ..................................................................................18.........................1.204..................... 5.26........................2.67 ........................ 6.47
Luxembourg
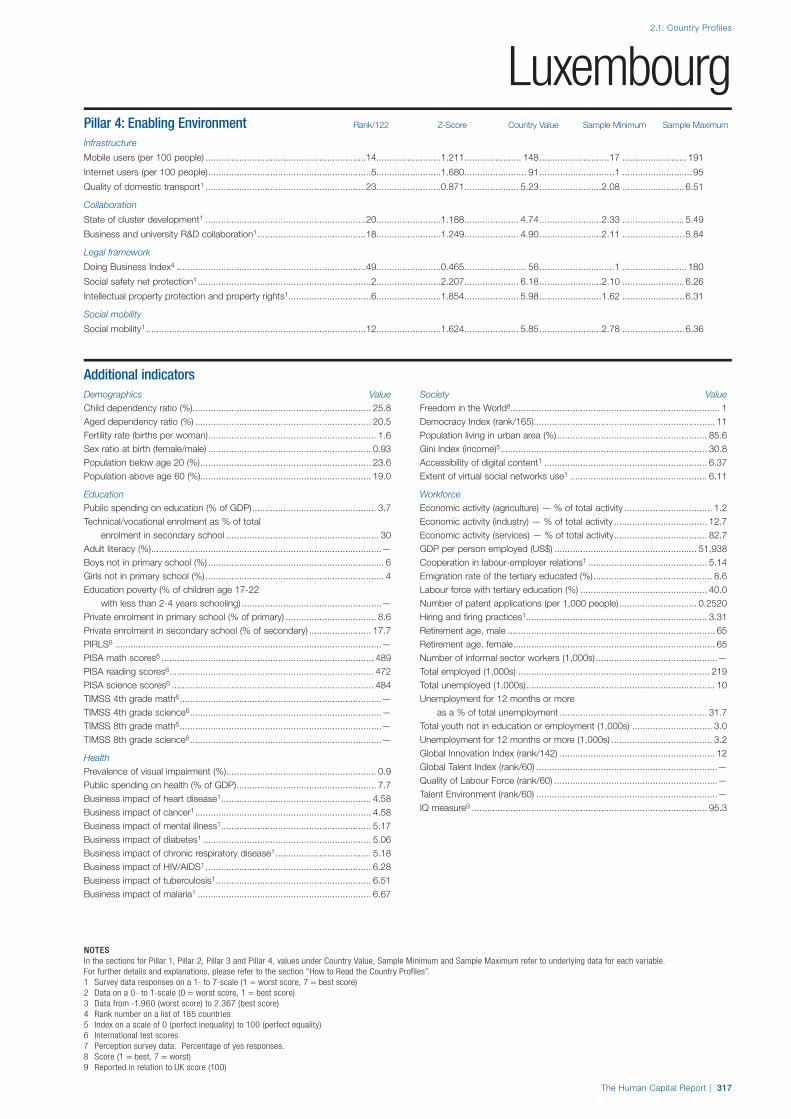
2.1: Country Profiles
NOTESIn the sections for Pillar 1, Pillar 2, Pillar 3 and Pillar 4, values under Country Value, Sample Minimum and Sample Maximum refer to underlying data for each variable.For further details and explanations, please refer to the section “How to Read the Country Profiles”.1 Survey data responses on a 1- to 7-scale (1 = worst score, 7 = best score)2 Data on a 0- to 1-scale (0 = worst score, 1 = best score)3 Data from -1.960 (worst score) to 2.367 (best score)4 Rank number on a list of 185 countries5 Index on a scale of 0 (perfect inequality) to 100 (perfect equality)6 International test scores7 Perception survey data. Percentage of yes responses.8 Score (1 = best, 7 = worst)9 Reported in relation to UK score (100)
The Human Capital Report | 317
LuxembourgPillar 4: Enabling Environment Rank/122 Z-Score Country Value Sample Minimum Sample Maximum
Infrastructure
Mobile users (per 100 people) ..............................................................14.........................1.211...................... 148...........................17 ......................... 191
Internet users (per 100 people) ...............................................................5.........................1.680........................ 91.............................1 ........................... 95
Quality of domestic transport1 ..............................................................23.........................0.871 ..................... 5.23 ........................2.08 ........................ 6.51
Collaboration
State of cluster development1 ..............................................................20.........................1.188..................... 4.74........................2.33 ........................ 5.49
Business and university R&D collaboration1 ..........................................18.........................1.249 ..................... 4.90 ........................2.11 ........................ 5.84
Legal framework
Doing Business Index4 .........................................................................49.........................0.465........................ 56.............................1 ......................... 180
Social safety net protection1 ...................................................................2.........................2.207..................... 6.18........................2.10 ........................ 6.26
Intellectual property protection and property rights1................................6.........................1.854 ..................... 5.98 ........................1.62 ........................ 6.31
Social mobility
Social mobility1 .....................................................................................12.........................1.624..................... 5.85........................2.78 ........................ 6.36
Additional indicatorsDemographics Value
Child dependency ratio (%)..................................................................... 25.8Aged dependency ratio (%) .................................................................... 20.5Fertility rate (births per woman) ................................................................. 1.6Sex ratio at birth (female/male) ............................................................... 0.93Population below age 20 (%) .................................................................. 23.6Population above age 60 (%) .................................................................. 19.0
Education
Public spending on education (% of GDP) ................................................ 3.7Technical/vocational enrolment as % of total
enrolment in secondary school ........................................................... 30Adult literacy (%) .........................................................................................—Boys not in primary school (%) .................................................................... 6Girls not in primary school (%) ..................................................................... 4Education poverty (% of children age 17-22
with less than 2-4 years schooling) ......................................................—Private enrolment in primary school (% of primary) ................................... 8.6Private enrolment in secondary school (% of secondary) ........................ 17.7PIRLS6 .......................................................................................................—PISA math scores6 .................................................................................. 489PISA reading scores6 ............................................................................... 472PISA science scores6 .............................................................................. 484TIMSS 4th grade math6 ..............................................................................—TIMSS 4th grade science6 ..........................................................................—TIMSS 8th grade math6 ..............................................................................—TIMSS 8th grade science6 ..........................................................................—
Health
Prevalence of visual impairment (%) .......................................................... 0.9Public spending on health (% of GDP) ...................................................... 7.7Business impact of heart disease1 .......................................................... 4.58Business impact of cancer1 .................................................................... 4.58Business impact of mental illness1 .......................................................... 5.17Business impact of diabetes1 ................................................................. 5.06Business impact of chronic respiratory disease1 ..................................... 5.18Business impact of HIV/AIDS1 ................................................................ 6.28Business impact of tuberculosis1 ............................................................ 6.51Business impact of malaria1 ................................................................... 6.67
Society Value
Freedom in the World8................................................................................. 1Democracy Index (rank/165) ...................................................................... 11Population living in urban area (%) .......................................................... 85.6Gini Index (income)5................................................................................ 30.8Accessibility of digital content1 ............................................................... 6.37Extent of virtual social networks use1 ..................................................... 6.11
Workforce
Economic activity (agriculture) — % of total activity .................................. 1.2Economic activity (industry) — % of total activity .................................... 12.7Economic activity (services) — % of total activity .................................... 82.7GDP per person employed (US$) ....................................................... 51,938Cooperation in labour-employer relations1 .............................................. 5.14Emigration rate of the tertiary educated (%) .............................................. 8.6Labour force with tertiary education (%) ................................................. 40.0Number of patent applications (per 1,000 people) .............................. 0.2520Hiring and firing practices1 ...................................................................... 3.31Retirement age, male ................................................................................ 65Retirement age, female .............................................................................. 65Number of informal sector workers (1,000s) ...............................................—Total employed (1,000s) .......................................................................... 219Total unemployed (1,000s) ......................................................................... 10Unemployment for 12 months or more
as a % of total unemployment ......................................................... 31.7Total youth not in education or employment (1,000s) ............................... 3.0Unemployment for 12 months or more (1,000s) ....................................... 3.2Global Innovation Index (rank/142) ............................................................ 12Global Talent Index (rank/60) ......................................................................—Quality of Labour Force (rank/60) ...............................................................—Talent Environment (rank/60) ......................................................................—IQ measure9 ........................................................................................... 95.3

2.1: Country Profiles
318 | The Human Capital Report
Rank/122 Score
Year
s (5
yea
r age
gro
ups)
Percent of total population
0–4
5–9
10–14
15–19
20–24
25–29
30–34
35–39
40–44
45–49
50–54
55–59
60–64
65–69
70–74
75–79
80–84
85–89
90–94
95–99
100+
0 1 2 3 4 55 4 3 2 1 0
Macedonia, FYRHuman Capital Index 2013 65 –0.160
Pillar 1: Education 52 0.165
Pillar 2: Health and wellness 63 0.013
Pillar 3: Workforce and employment 115 –0.784
Pillar 4: Enabling environment 54 –0.033
Key Indicators
Total population (1,000s) 2,102.2
Median age of population 36
GDP per capita PPP (constant 2005, international $) 9,323
GDP growth (annual %) –0.3
Male Female Additional indicators
n Total population n Total population Aged dependency: 16.4%
n Labour force participation n Labour force participation Youth dependency: 24.6%
n Primary and secondary enrolment n Primary and secondary enrolment Male labour force participation, age 65+: 0.3%
Female labour force participation, age 65+: 0.1%
Education and workforce distribution

The Human Capital Report | 319
2.1: Country Profiles
HCI s
core
–2.5
–2.0
–1.5
–1.0
–0.5
0.0
0.5
1.0
1.5
2.0
2.5
Overall Index
Enablingenvironment
Workforce andemployment
Health andwellness
Education
Macedonia, FYREmployment types, educational requirements and educational attainment
Percent of population Educational in employment type attainment (%)
Tertiary requirements n/a 12.2
Professionals n/a
Technicians and associate professionals n/a
Secondary requirements n/a 35.6
Clerks n/a
Service workers and shop and market sales workers n/a
Skilled agricultural and fishery workers n/a
Craft and related trade workers n/a
Plant and machine operators and assemblers n/a
Primary requirements n/a 30.8
Elementary occupations n/a
Various n/a
Legislators, senior officials and managers n/a
Unclassified n/a
Armed forces n/a
Spread of scores (by pillar and overall)
Macedonia, FYR
Upper-middle income economies
Europe and Central Asia
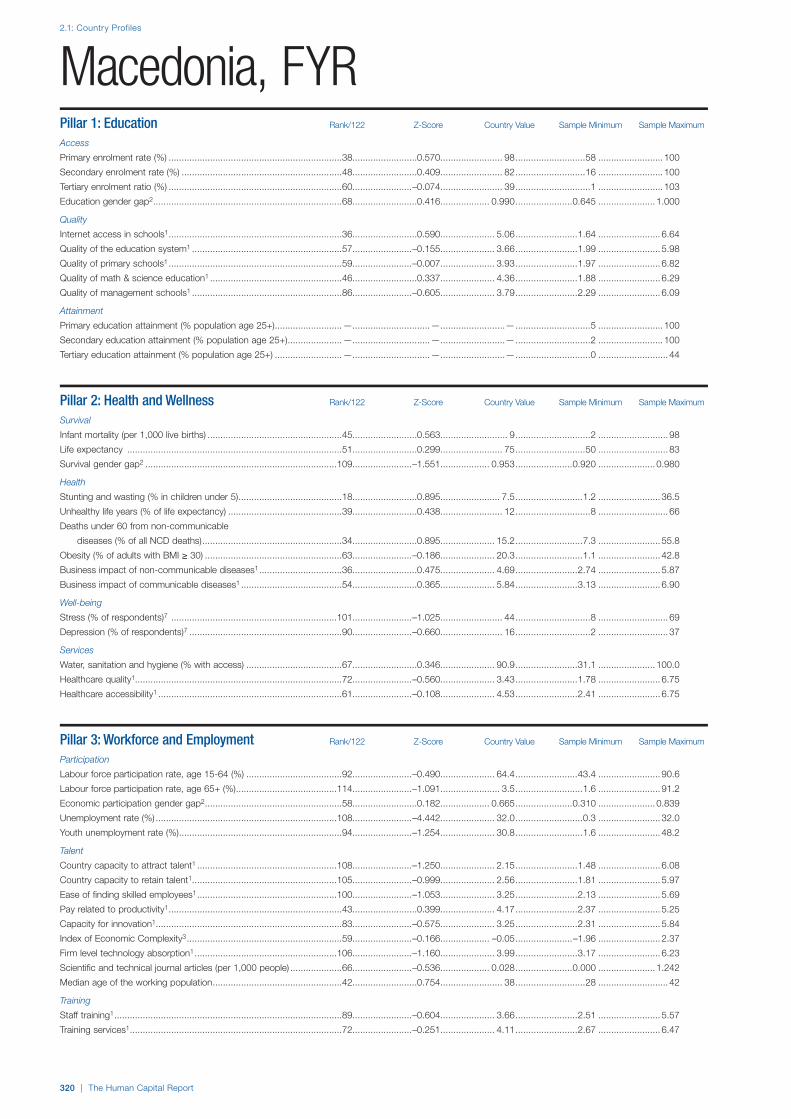
2.1: Country Profiles
320 | The Human Capital Report
Pillar 1: Education Rank/122 Z-Score Country Value Sample Minimum Sample Maximum
Access
Primary enrolment rate (%) ...................................................................38.........................0.570........................ 98...........................58 ......................... 100
Secondary enrolment rate (%) ..............................................................48.........................0.409........................ 82...........................16 ......................... 100
Tertiary enrolment ratio (%) ...................................................................60.......................–0.074........................ 39.............................1 ......................... 103
Education gender gap2 .........................................................................68.........................0.416................... 0.990......................0.645 ...................... 1.000
Quality
Internet access in schools1 ...................................................................36.........................0.590..................... 5.06........................1.64 ........................ 6.64
Quality of the education system1 ..........................................................57.......................–0.155..................... 3.66........................1.99 ........................ 5.98
Quality of primary schools1 ...................................................................59.......................–0.007..................... 3.93........................1.97 ........................ 6.82
Quality of math & science education1 ...................................................46.........................0.337..................... 4.36........................1.88 ........................ 6.29
Quality of management schools1 ..........................................................86.......................–0.605..................... 3.79........................2.29 ........................ 6.09
Attainment
Primary education attainment (% population age 25+) ..........................—..............................— .........................— .............................5 ......................... 100
Secondary education attainment (% population age 25+) .....................—..............................— .........................— .............................2 ......................... 100
Tertiary education attainment (% population age 25+) ..........................—..............................— .........................— .............................0 ........................... 44
Pillar 2: Health and Wellness Rank/122 Z-Score Country Value Sample Minimum Sample Maximum
Survival
Infant mortality (per 1,000 live births) ....................................................45.........................0.563.......................... 9.............................2 ........................... 98
Life expectancy ...................................................................................51.........................0.299........................ 75...........................50 ........................... 83
Survival gender gap2 ..........................................................................109.......................–1.551................... 0.953......................0.920 ...................... 0.980
Health
Stunting and wasting (% in children under 5) ........................................18.........................0.895....................... 7.5..........................1.2 ........................ 36.5
Unhealthy life years (% of life expectancy) ............................................39.........................0.438........................ 12.............................8 ........................... 66
Deaths under 60 from non-communicable
diseases (% of all NCD deaths) ......................................................34.........................0.895 ..................... 15.2 ..........................7.3 ........................ 55.8
Obesity (% of adults with BMI ≥ 30) .....................................................63.......................–0.186..................... 20.3..........................1.1 ........................ 42.8
Business impact of non-communicable diseases1 ................................36.........................0.475..................... 4.69........................2.74 ........................ 5.87
Business impact of communicable diseases1 .......................................54.........................0.365..................... 5.84........................3.13 ........................ 6.90
Well-being
Stress (% of respondents)7 ................................................................101.......................–1.025........................ 44.............................8 ........................... 69
Depression (% of respondents)7 ...........................................................90.......................–0.660........................ 16.............................2 ........................... 37
Services
Water, sanitation and hygiene (% with access) .....................................67.........................0.346..................... 90.9........................31.1 ...................... 100.0
Healthcare quality1................................................................................72.......................–0.560..................... 3.43........................1.78 ........................ 6.75
Healthcare accessibility1 .......................................................................61.......................–0.108..................... 4.53........................2.41 ........................ 6.75
Pillar 3: Workforce and Employment Rank/122 Z-Score Country Value Sample Minimum Sample Maximum
Participation
Labour force participation rate, age 15-64 (%) .....................................92.......................–0.490..................... 64.4........................43.4 ........................ 90.6
Labour force participation rate, age 65+ (%) .......................................114.......................–1.091....................... 3.5..........................1.6 ........................ 91.2
Economic participation gender gap2 .....................................................58.........................0.182................... 0.665......................0.310 ...................... 0.839
Unemployment rate (%) ......................................................................108.......................–4.442..................... 32.0..........................0.3 ........................ 32.0
Youth unemployment rate (%) ...............................................................94.......................–1.254..................... 30.8..........................1.6 ........................ 48.2
Talent
Country capacity to attract talent1 ......................................................108.......................–1.250..................... 2.15........................1.48 ........................ 6.08
Country capacity to retain talent1........................................................105.......................–0.999..................... 2.56........................1.81 ........................ 5.97
Ease of finding skilled employees1 ......................................................100.......................–1.053..................... 3.25........................2.13 ........................ 5.69
Pay related to productivity1 ...................................................................43.........................0.399..................... 4.17........................2.37 ........................ 5.25
Capacity for innovation1........................................................................83.......................–0.575..................... 3.25........................2.31 ........................ 5.84
Index of Economic Complexity3 ............................................................59.......................–0.166................... –0.05......................–1.96 ........................ 2.37
Firm level technology absorption1 .......................................................106.......................–1.160..................... 3.99........................3.17 ........................ 6.23
Scientific and technical journal articles (per 1,000 people) ....................66.......................–0.536................... 0.028......................0.000 ...................... 1.242
Median age of the working population ..................................................42.........................0.754........................ 38...........................28 ........................... 42
Training
Staff training1 ........................................................................................89.......................–0.604..................... 3.66........................2.51 ........................ 5.57
Training services1 ..................................................................................72.......................–0.251..................... 4.11........................2.67 ........................ 6.47
Macedonia, FYR
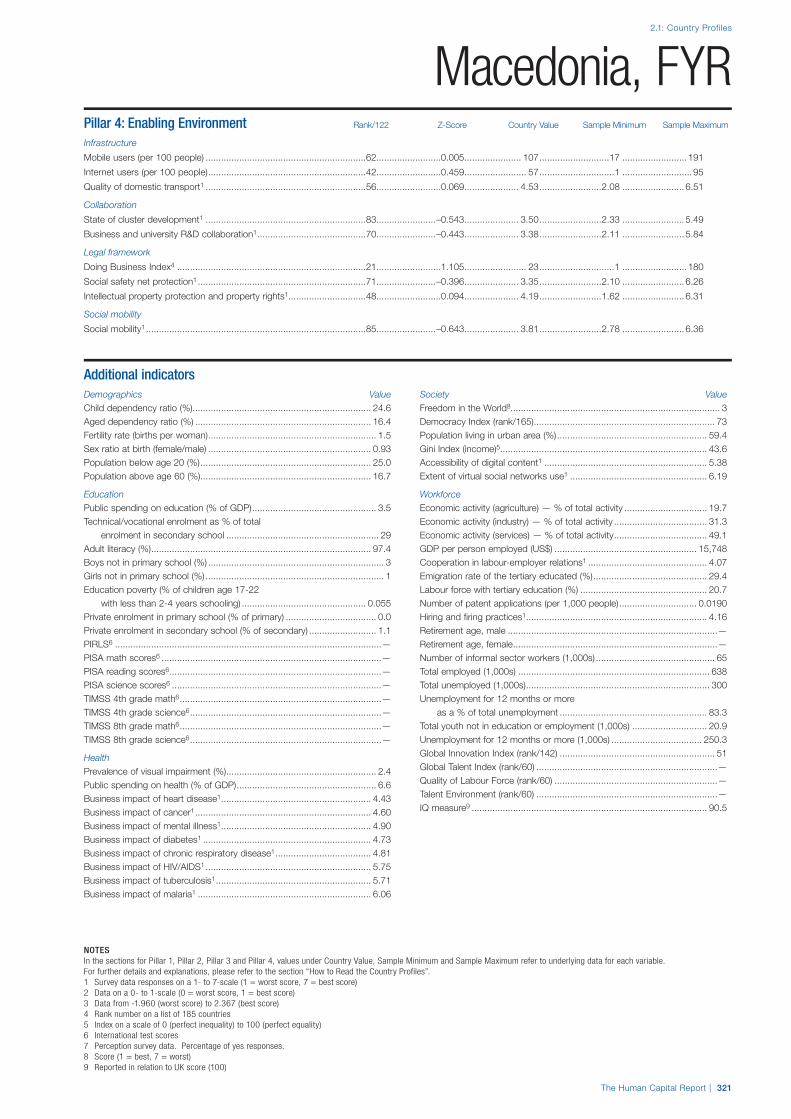
2.1: Country Profiles
NOTESIn the sections for Pillar 1, Pillar 2, Pillar 3 and Pillar 4, values under Country Value, Sample Minimum and Sample Maximum refer to underlying data for each variable.For further details and explanations, please refer to the section “How to Read the Country Profiles”.1 Survey data responses on a 1- to 7-scale (1 = worst score, 7 = best score)2 Data on a 0- to 1-scale (0 = worst score, 1 = best score)3 Data from -1.960 (worst score) to 2.367 (best score)4 Rank number on a list of 185 countries5 Index on a scale of 0 (perfect inequality) to 100 (perfect equality)6 International test scores7 Perception survey data. Percentage of yes responses.8 Score (1 = best, 7 = worst)9 Reported in relation to UK score (100)
The Human Capital Report | 321
Macedonia, FYRPillar 4: Enabling Environment Rank/122 Z-Score Country Value Sample Minimum Sample Maximum
Infrastructure
Mobile users (per 100 people) ..............................................................62.........................0.005...................... 107...........................17 ......................... 191
Internet users (per 100 people) .............................................................42.........................0.459........................ 57.............................1 ........................... 95
Quality of domestic transport1 ..............................................................56.........................0.069 ..................... 4.53 ........................2.08 ........................ 6.51
Collaboration
State of cluster development1 ..............................................................83.......................–0.543..................... 3.50........................2.33 ........................ 5.49
Business and university R&D collaboration1 ..........................................70.......................–0.443 ..................... 3.38 ........................2.11 ........................ 5.84
Legal framework
Doing Business Index4 .........................................................................21.........................1.105........................ 23.............................1 ......................... 180
Social safety net protection1 .................................................................71.......................–0.396..................... 3.35........................2.10 ........................ 6.26
Intellectual property protection and property rights1..............................48.........................0.094 ..................... 4.19 ........................1.62 ........................ 6.31
Social mobility
Social mobility1 .....................................................................................85.......................–0.643..................... 3.81........................2.78 ........................ 6.36
Additional indicatorsDemographics Value
Child dependency ratio (%)..................................................................... 24.6Aged dependency ratio (%) .................................................................... 16.4Fertility rate (births per woman) ................................................................. 1.5Sex ratio at birth (female/male) ............................................................... 0.93Population below age 20 (%) .................................................................. 25.0Population above age 60 (%) .................................................................. 16.7
Education
Public spending on education (% of GDP) ................................................ 3.5Technical/vocational enrolment as % of total
enrolment in secondary school ........................................................... 29Adult literacy (%) ..................................................................................... 97.4Boys not in primary school (%) .................................................................... 3Girls not in primary school (%) ..................................................................... 1Education poverty (% of children age 17-22
with less than 2-4 years schooling) ................................................ 0.055Private enrolment in primary school (% of primary) ................................... 0.0Private enrolment in secondary school (% of secondary) .......................... 1.1PIRLS6 .......................................................................................................—PISA math scores6 .....................................................................................—PISA reading scores6 ..................................................................................—PISA science scores6 .................................................................................—TIMSS 4th grade math6 ..............................................................................—TIMSS 4th grade science6 ..........................................................................—TIMSS 8th grade math6 ..............................................................................—TIMSS 8th grade science6 ..........................................................................—
Health
Prevalence of visual impairment (%) .......................................................... 2.4Public spending on health (% of GDP) ...................................................... 6.6Business impact of heart disease1 .......................................................... 4.43Business impact of cancer1 .................................................................... 4.60Business impact of mental illness1 .......................................................... 4.90Business impact of diabetes1 ................................................................. 4.73Business impact of chronic respiratory disease1 ..................................... 4.81Business impact of HIV/AIDS1 ................................................................ 5.75Business impact of tuberculosis1 ............................................................ 5.71Business impact of malaria1 ................................................................... 6.06
Society Value
Freedom in the World8................................................................................. 3Democracy Index (rank/165) ...................................................................... 73Population living in urban area (%) .......................................................... 59.4Gini Index (income)5................................................................................ 43.6Accessibility of digital content1 ............................................................... 5.38Extent of virtual social networks use1 ..................................................... 6.19
Workforce
Economic activity (agriculture) — % of total activity ................................ 19.7Economic activity (industry) — % of total activity .................................... 31.3Economic activity (services) — % of total activity .................................... 49.1GDP per person employed (US$) ....................................................... 15,748Cooperation in labour-employer relations1 .............................................. 4.07Emigration rate of the tertiary educated (%) ............................................ 29.4Labour force with tertiary education (%) ................................................. 20.7Number of patent applications (per 1,000 people) .............................. 0.0190Hiring and firing practices1 ...................................................................... 4.16Retirement age, male .................................................................................—Retirement age, female ...............................................................................—Number of informal sector workers (1,000s) .............................................. 65Total employed (1,000s) .......................................................................... 638Total unemployed (1,000s) ....................................................................... 300Unemployment for 12 months or more
as a % of total unemployment ......................................................... 83.3Total youth not in education or employment (1,000s) ............................. 20.9Unemployment for 12 months or more (1,000s) ................................... 250.3Global Innovation Index (rank/142) ............................................................ 51Global Talent Index (rank/60) ......................................................................—Quality of Labour Force (rank/60) ...............................................................—Talent Environment (rank/60) ......................................................................—IQ measure9 ........................................................................................... 90.5
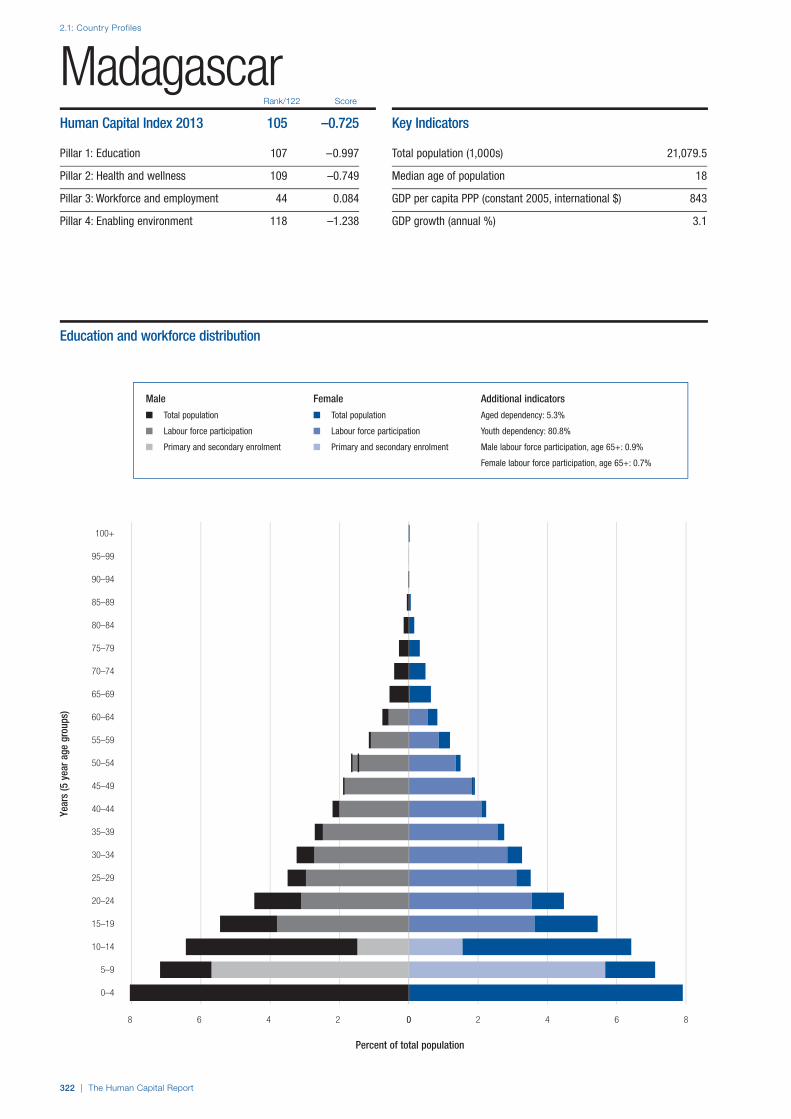
2.1: Country Profiles
322 | The Human Capital Report
Rank/122 Score
Year
s (5
yea
r age
gro
ups)
Percent of total population
0–4
5–9
10–14
15–19
20–24
25–29
30–34
35–39
40–44
45–49
50–54
55–59
60–64
65–69
70–74
75–79
80–84
85–89
90–94
95–99
100+
0 2 4 6 88 6 4 2 0
MadagascarHuman Capital Index 2013 105 –0.725
Pillar 1: Education 107 –0.997
Pillar 2: Health and wellness 109 –0.749
Pillar 3: Workforce and employment 44 0.084
Pillar 4: Enabling environment 118 –1.238
Key Indicators
Total population (1,000s) 21,079.5
Median age of population 18
GDP per capita PPP (constant 2005, international $) 843
GDP growth (annual %) 3.1
Male Female Additional indicators
n Total population n Total population Aged dependency: 5.3%
n Labour force participation n Labour force participation Youth dependency: 80.8%
n Primary and secondary enrolment n Primary and secondary enrolment Male labour force participation, age 65+: 0.9%
Female labour force participation, age 65+: 0.7%
Education and workforce distribution

The Human Capital Report | 323
2.1: Country Profiles
HCI s
core
–2.5
–2.0
–1.5
–1.0
–0.5
0.0
0.5
1.0
1.5
2.0
2.5
Overall Index
Enablingenvironment
Workforce andemployment
Health andwellness
Education
MadagascarEmployment types, educational requirements and educational attainment
Percent of population Educational in employment type attainment (%)
Tertiary requirements n/a n/a
Professionals n/a
Technicians and associate professionals n/a
Secondary requirements n/a n/a
Clerks n/a
Service workers and shop and market sales workers n/a
Skilled agricultural and fishery workers n/a
Craft and related trade workers n/a
Plant and machine operators and assemblers n/a
Primary requirements n/a n/a
Elementary occupations n/a
Various n/a
Legislators, senior officials and managers n/a
Unclassified n/a
Armed forces n/a
Spread of scores (by pillar and overall)
Madagascar
Low-income economies
Sub-Saharan Africa

2.1: Country Profiles
324 | The Human Capital Report
Pillar 1: Education Rank/122 Z-Score Country Value Sample Minimum Sample Maximum
Access
Primary enrolment rate (%) .................................................................106.......................–1.637........................ 80...........................58 ......................... 100
Secondary enrolment rate (%) ..............................................................96.......................–2.123........................ 24...........................16 ......................... 100
Tertiary enrolment ratio (%) .................................................................111.......................–1.386.......................... 4.............................1 ......................... 103
Education gender gap2 .........................................................................86.........................0.192................... 0.973......................0.645 ...................... 1.000
Quality
Internet access in schools1 .................................................................114.......................–1.575..................... 2.35........................1.64 ........................ 6.64
Quality of the education system1 ........................................................101.......................–0.871..................... 3.02........................1.99 ........................ 5.98
Quality of primary schools1 .................................................................107.......................–1.176..................... 2.66........................1.97 ........................ 6.82
Quality of math & science education1 ...................................................71.......................–0.071..................... 3.97........................1.88 ........................ 6.29
Quality of management schools1 ..........................................................76.......................–0.330..................... 4.02........................2.29 ........................ 6.09
Attainment
Primary education attainment (% population age 25+) ..........................—..............................— .........................— .............................5 ......................... 100
Secondary education attainment (% population age 25+) .....................—..............................— .........................— .............................2 ......................... 100
Tertiary education attainment (% population age 25+) ..........................—..............................— .........................— .............................0 ........................... 44
Pillar 2: Health and Wellness Rank/122 Z-Score Country Value Sample Minimum Sample Maximum
Survival
Infant mortality (per 1,000 live births) ..................................................102.......................–0.964........................ 43.............................2 ........................... 98
Life expectancy ...................................................................................99.......................–0.795........................ 66...........................50 ........................... 83
Survival gender gap2 ............................................................................67.........................0.191................... 0.973......................0.920 ...................... 0.980
Health
Stunting and wasting (% in children under 5) ........................................77.......................–1.924..................... 32.2..........................1.2 ........................ 36.5
Unhealthy life years (% of life expectancy) ..........................................115.......................–1.095........................ 21.............................8 ........................... 66
Deaths under 60 from non-communicable
diseases (% of all NCD deaths) ......................................................93.......................–0.874 ..................... 37.7 ..........................7.3 ........................ 55.8
Obesity (% of adults with BMI ≥ 30) .......................................................4.........................1.777....................... 1.7..........................1.1 ........................ 42.8
Business impact of non-communicable diseases1 ................................80.......................–0.366..................... 4.32........................2.74 ........................ 5.87
Business impact of communicable diseases1 .....................................102.......................–1.204..................... 4.28........................3.13 ........................ 6.90
Well-being
Stress (% of respondents)7 ..................................................................86.......................–0.560........................ 38.............................8 ........................... 69
Depression (% of respondents)7 ...........................................................24.........................0.615.......................... 8.............................2 ........................... 37
Services
Water, sanitation and hygiene (% with access) ...................................121.......................–2.724..................... 31.1........................31.1 ...................... 100.0
Healthcare quality1..............................................................................110.......................–1.089..................... 2.78........................1.78 ........................ 6.75
Healthcare accessibility1 .....................................................................119.......................–1.477..................... 2.86........................2.41 ........................ 6.75
Pillar 3: Workforce and Employment Rank/122 Z-Score Country Value Sample Minimum Sample Maximum
Participation
Labour force participation rate, age 15-64 (%) .......................................2.........................1.872..................... 87.5........................43.4 ........................ 90.6
Labour force participation rate, age 65+ (%) ...........................................5.........................1.963..................... 62.7..........................1.6 ........................ 91.2
Economic participation gender gap2 .....................................................46.........................0.411................... 0.692......................0.310 ...................... 0.839
Unemployment rate (%) ........................................................................13.........................0.943....................... 3.8..........................0.3 ........................ 32.0
Youth unemployment rate (%) .................................................................2.........................1.677....................... 2.3..........................1.6 ........................ 48.2
Talent
Country capacity to attract talent1 ........................................................76.......................–0.411..................... 3.02........................1.48 ........................ 6.08
Country capacity to retain talent1..........................................................81.......................–0.541..................... 3.01........................1.81 ........................ 5.97
Ease of finding skilled employees1 ........................................................51.........................0.179..................... 4.11........................2.13 ........................ 5.69
Pay related to productivity1 ...................................................................48.........................0.360..................... 4.14........................2.37 ........................ 5.25
Capacity for innovation1........................................................................63.......................–0.306..................... 3.46........................2.31 ........................ 5.84
Index of Economic Complexity3 ............................................................83.......................–0.782................... –0.64......................–1.96 ........................ 2.37
Firm level technology absorption1 .........................................................91.......................–0.776..................... 4.26........................3.17 ........................ 6.23
Scientific and technical journal articles (per 1,000 people) ..................111.......................–0.623................... 0.002......................0.000 ...................... 1.242
Median age of the working population ..................................................99.......................–1.141........................ 30...........................28 ........................... 42
Training
Staff training1 ........................................................................................87.......................–0.587..................... 3.67........................2.51 ........................ 5.57
Training services1 ..................................................................................98.......................–0.893..................... 3.60........................2.67 ........................ 6.47
Madagascar

2.1: Country Profiles
NOTESIn the sections for Pillar 1, Pillar 2, Pillar 3 and Pillar 4, values under Country Value, Sample Minimum and Sample Maximum refer to underlying data for each variable.For further details and explanations, please refer to the section “How to Read the Country Profiles”.1 Survey data responses on a 1- to 7-scale (1 = worst score, 7 = best score)2 Data on a 0- to 1-scale (0 = worst score, 1 = best score)3 Data from -1.960 (worst score) to 2.367 (best score)4 Rank number on a list of 185 countries5 Index on a scale of 0 (perfect inequality) to 100 (perfect equality)6 International test scores7 Perception survey data. Percentage of yes responses.8 Score (1 = best, 7 = worst)9 Reported in relation to UK score (100)
The Human Capital Report | 325
MadagascarPillar 4: Enabling Environment Rank/122 Z-Score Country Value Sample Minimum Sample Maximum
Infrastructure
Mobile users (per 100 people) ............................................................119.......................–1.953........................ 41...........................17 ......................... 191
Internet users (per 100 people) ...........................................................120.......................–1.498.......................... 2.............................1 ........................... 95
Quality of domestic transport1 ............................................................112.......................–1.272 ..................... 3.36 ........................2.08 ........................ 6.51
Collaboration
State of cluster development1 ............................................................110.......................–1.257..................... 2.99........................2.33 ........................ 5.49
Business and university R&D collaboration1 ..........................................84.......................–0.570..................... 3.27........................2.11 ........................ 5.84
Legal framework
Doing Business Index4 .......................................................................105.......................–1.203...................... 142.............................1 ......................... 180
Social safety net protection1 ...............................................................101.......................–0.908..................... 2.80........................2.10 ........................ 6.26
Intellectual property protection and property rights1............................112.......................–1.136 ..................... 2.93 ........................1.62 ........................ 6.31
Social mobility
Social mobility1 ...................................................................................113.......................–1.342..................... 3.18........................2.78 ........................ 6.36
Additional indicatorsDemographics Value
Child dependency ratio (%)..................................................................... 80.8Aged dependency ratio (%) ...................................................................... 5.3Fertility rate (births per woman) ................................................................. 4.8Sex ratio at birth (female/male) ............................................................... 0.97Population below age 20 (%) .................................................................. 54.3Population above age 60 (%) .................................................................... 4.4
Education
Public spending on education (% of GDP) ................................................ 2.8Technical/vocational enrolment as % of total
enrolment in secondary school ............................................................. 4Adult literacy (%) ..................................................................................... 64.5Boys not in primary school (%) .................................................................. 21Girls not in primary school (%) ................................................................... 20Education poverty (% of children age 17-22
with less than 2-4 years schooling) ................................................ 0.759Private enrolment in primary school (% of primary) ................................. 17.8Private enrolment in secondary school (% of secondary) ........................ 40.3PIRLS6 .......................................................................................................—PISA math scores6 .....................................................................................—PISA reading scores6 ..................................................................................—PISA science scores6 .................................................................................—TIMSS 4th grade math6 ..............................................................................—TIMSS 4th grade science6 ..........................................................................—TIMSS 8th grade math6 ..............................................................................—TIMSS 8th grade science6 ..........................................................................—
Health
Prevalence of visual impairment (%) .......................................................... 4.9Public spending on health (% of GDP) ...................................................... 4.1Business impact of heart disease1 .......................................................... 3.69Business impact of cancer1 .................................................................... 4.60Business impact of mental illness1 .......................................................... 4.77Business impact of diabetes1 ................................................................. 4.48Business impact of chronic respiratory disease1 ..................................... 4.04Business impact of HIV/AIDS1 ................................................................ 4.98Business impact of tuberculosis1 ............................................................ 4.44Business impact of malaria1 ................................................................... 3.42
Society Value
Freedom in the World8................................................................................. 6Democracy Index (rank/165) .................................................................... 117Population living in urban area (%) .......................................................... 33.2Gini Index (income)5................................................................................ 44.1Accessibility of digital content1 ............................................................... 3.76Extent of virtual social networks use1 ..................................................... 5.17
Workforce
Economic activity (agriculture) — % of total activity ....................................—Economic activity (industry) — % of total activity ........................................—Economic activity (services) — % of total activity ........................................—GDP per person employed (US$) ......................................................... 1,362Cooperation in labour-employer relations1 .............................................. 4.37Emigration rate of the tertiary educated (%) .............................................. 7.7Labour force with tertiary education (%) ................................................... 3.4Number of patent applications (per 1,000 people) .............................. 0.0029Hiring and firing practices1 ...................................................................... 4.29Retirement age, male .................................................................................—Retirement age, female ...............................................................................—Number of informal sector workers (1,000s) ......................................... 1,271Total employed (1,000s) ..................................................................... 10,255Total unemployed (1,000s) ....................................................................... 410Unemployment for 12 months or more
as a % of total unemployment .............................................................—Total youth not in education or employment (1,000s) ........................... 346.5Unemployment for 12 months or more (1,000s) .........................................—Global Innovation Index (rank/142) .......................................................... 140Global Talent Index (rank/60) ......................................................................—Quality of Labour Force (rank/60) ...............................................................—Talent Environment (rank/60) ......................................................................—IQ measure9 ........................................................................................... 78.3
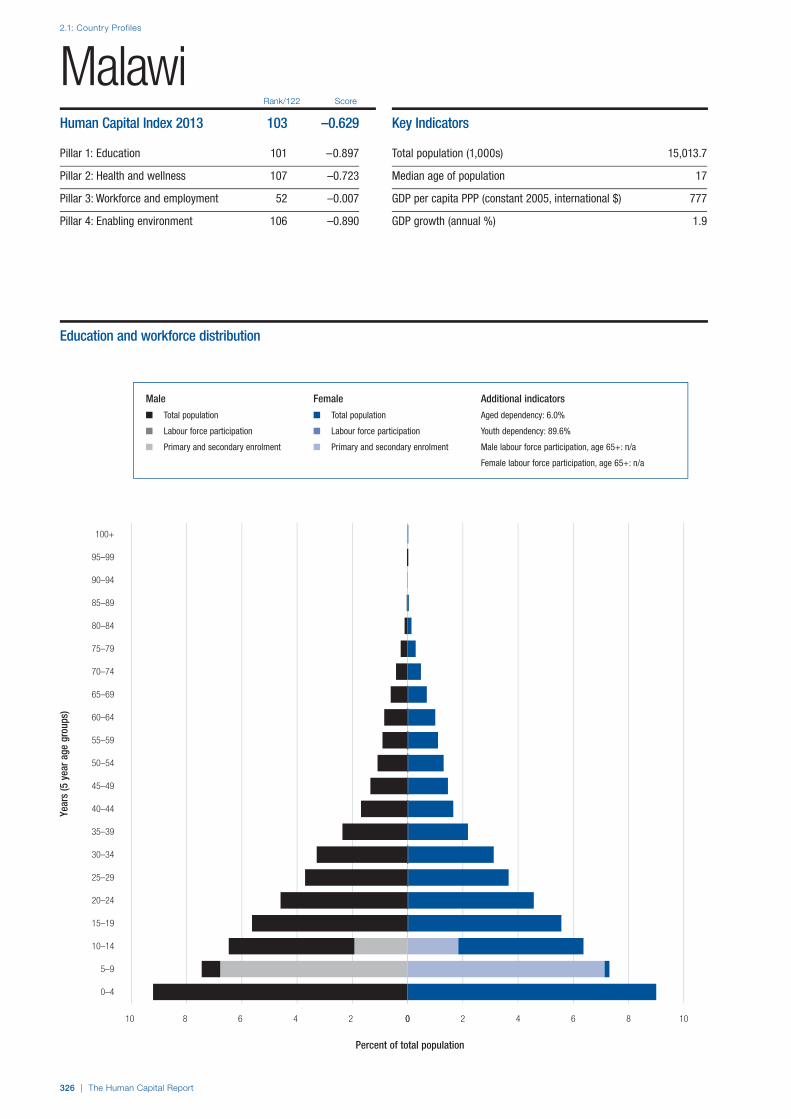
2.1: Country Profiles
326 | The Human Capital Report
Rank/122 Score
Year
s (5
yea
r age
gro
ups)
Percent of total population
0–4
5–9
10–14
15–19
20–24
25–29
30–34
35–39
40–44
45–49
50–54
55–59
60–64
65–69
70–74
75–79
80–84
85–89
90–94
95–99
100+
0 2 4 6 8 1010 8 6 4 2 0
MalawiHuman Capital Index 2013 103 –0.629
Pillar 1: Education 101 –0.897
Pillar 2: Health and wellness 107 –0.723
Pillar 3: Workforce and employment 52 –0.007
Pillar 4: Enabling environment 106 –0.890
Key Indicators
Total population (1,000s) 15,013.7
Median age of population 17
GDP per capita PPP (constant 2005, international $) 777
GDP growth (annual %) 1.9
Male Female Additional indicators
n Total population n Total population Aged dependency: 6.0%
n Labour force participation n Labour force participation Youth dependency: 89.6%
n Primary and secondary enrolment n Primary and secondary enrolment Male labour force participation, age 65+: n/a
Female labour force participation, age 65+: n/a
Education and workforce distribution

The Human Capital Report | 327
2.1: Country Profiles
HCI s
core
–2.5
–2.0
–1.5
–1.0
–0.5
0.0
0.5
1.0
1.5
2.0
2.5
Overall Index
Enablingenvironment
Workforce andemployment
Health andwellness
Education
MalawiEmployment types, educational requirements and educational attainment
Percent of population Educational in employment type attainment (%)
Tertiary requirements n/a 0.5
Professionals n/a
Technicians and associate professionals n/a
Secondary requirements n/a 8.1
Clerks n/a
Service workers and shop and market sales workers n/a
Skilled agricultural and fishery workers n/a
Craft and related trade workers n/a
Plant and machine operators and assemblers n/a
Primary requirements n/a 11.2
Elementary occupations n/a
Various n/a
Legislators, senior officials and managers n/a
Unclassified n/a
Armed forces n/a
Spread of scores (by pillar and overall)
Malawi
Low-income economies
Sub-Saharan Africa

2.1: Country Profiles
328 | The Human Capital Report
Pillar 1: Education Rank/122 Z-Score Country Value Sample Minimum Sample Maximum
Access
Primary enrolment rate (%) ...................................................................47.........................0.484........................ 97...........................58 ......................... 100
Secondary enrolment rate (%) ..............................................................95.......................–1.875........................ 29...........................16 ......................... 100
Tertiary enrolment ratio (%) .................................................................116.......................–1.511.......................... 1.............................1 ......................... 103
Education gender gap2 .......................................................................100.......................–0.524................... 0.919......................0.645 ...................... 1.000
Quality
Internet access in schools1 .................................................................107.......................–1.231..................... 2.78........................1.64 ........................ 6.64
Quality of the education system1 ..........................................................79.......................–0.446..................... 3.40........................1.99 ........................ 5.98
Quality of primary schools1 .................................................................104.......................–0.974..................... 2.88........................1.97 ........................ 6.82
Quality of math & science education1 ...................................................96.......................–0.844..................... 3.23........................1.88 ........................ 6.29
Quality of management schools1 ........................................................108.......................–1.155..................... 3.33........................2.29 ........................ 6.09
Attainment
Primary education attainment (% population age 25+) ..........................—..............................— .........................— .............................5 ......................... 100
Secondary education attainment (% population age 25+) .....................—..............................— .........................— .............................2 ......................... 100
Tertiary education attainment (% population age 25+) ..........................—..............................— .........................— .............................0 ........................... 44
Pillar 2: Health and Wellness Rank/122 Z-Score Country Value Sample Minimum Sample Maximum
Survival
Infant mortality (per 1,000 live births) ..................................................109.......................–1.413........................ 53.............................2 ........................... 98
Life expectancy .................................................................................111.......................–1.768........................ 58...........................50 ........................... 83
Survival gender gap2 ............................................................................90.......................–0.239................... 0.968......................0.920 ...................... 0.980
Health
Stunting and wasting (% in children under 5) ........................................67.......................–1.212..................... 26.0..........................1.2 ........................ 36.5
Unhealthy life years (% of life expectancy) ..........................................119.......................–1.581........................ 24.............................8 ........................... 66
Deaths under 60 from non-communicable
diseases (% of all NCD deaths) ....................................................118.......................–1.810 ..................... 49.6 ..........................7.3 ........................ 55.8
Obesity (% of adults with BMI ≥ 30) .......................................................9.........................1.481....................... 4.5..........................1.1 ........................ 42.8
Business impact of non-communicable diseases1 ................................74.......................–0.314..................... 4.34........................2.74 ........................ 5.87
Business impact of communicable diseases1 .....................................122.......................–2.357..................... 3.13........................3.13 ........................ 6.90
Well-being
Stress (% of respondents)7 ..................................................................20.........................0.835........................ 20.............................8 ........................... 69
Depression (% of respondents)7 ...........................................................39.........................0.456.......................... 9.............................2 ........................... 37
Services
Water, sanitation and hygiene (% with access) .....................................97.......................–0.810..................... 68.3........................31.1 ...................... 100.0
Healthcare quality1................................................................................92.......................–0.859..................... 3.06........................1.78 ........................ 6.75
Healthcare accessibility1 .......................................................................76.......................–0.537..................... 4.01........................2.41 ........................ 6.75
Pillar 3: Workforce and Employment Rank/122 Z-Score Country Value Sample Minimum Sample Maximum
Participation
Labour force participation rate, age 15-64 (%) .......................................9.........................1.371..................... 82.6........................43.4 ........................ 90.6
Labour force participation rate, age 65+ (%) ...........................................1.........................3.434..................... 91.2..........................1.6 ........................ 91.2
Economic participation gender gap2 .......................................................3.........................1.517................... 0.822......................0.310 ...................... 0.839
Unemployment rate (%) ........................................................................—..............................— .........................— ..........................0.3 ........................ 32.0
Youth unemployment rate (%) ...............................................................—..............................— .........................— ..........................1.6 ........................ 48.2
Talent
Country capacity to attract talent1 ........................................................49.........................0.183..................... 3.63........................1.48 ........................ 6.08
Country capacity to retain talent1..........................................................65.......................–0.227..................... 3.31........................1.81 ........................ 5.97
Ease of finding skilled employees1 ........................................................50.........................0.183..................... 4.11........................2.13 ........................ 5.69
Pay related to productivity1 ...................................................................59.........................0.106..................... 3.99........................2.37 ........................ 5.25
Capacity for innovation1......................................................................102.......................–0.867..................... 3.01........................2.31 ........................ 5.84
Index of Economic Complexity3 ............................................................97.......................–1.240................... –1.07......................–1.96 ........................ 2.37
Firm level technology absorption1 .......................................................115.......................–1.379..................... 3.83........................3.17 ........................ 6.23
Scientific and technical journal articles (per 1,000 people) ....................96.......................–0.616................... 0.004......................0.000 ...................... 1.242
Median age of the working population ................................................119.......................–1.447........................ 29...........................28 ........................... 42
Training
Staff training1 ........................................................................................73.......................–0.297..................... 3.85........................2.51 ........................ 5.57
Training services1 ..................................................................................93.......................–0.812..................... 3.66........................2.67 ........................ 6.47
Malawi

2.1: Country Profiles
NOTESIn the sections for Pillar 1, Pillar 2, Pillar 3 and Pillar 4, values under Country Value, Sample Minimum and Sample Maximum refer to underlying data for each variable.For further details and explanations, please refer to the section “How to Read the Country Profiles”.1 Survey data responses on a 1- to 7-scale (1 = worst score, 7 = best score)2 Data on a 0- to 1-scale (0 = worst score, 1 = best score)3 Data from -1.960 (worst score) to 2.367 (best score)4 Rank number on a list of 185 countries5 Index on a scale of 0 (perfect inequality) to 100 (perfect equality)6 International test scores7 Perception survey data. Percentage of yes responses.8 Score (1 = best, 7 = worst)9 Reported in relation to UK score (100)
The Human Capital Report | 329
MalawiPillar 4: Enabling Environment Rank/122 Z-Score Country Value Sample Minimum Sample Maximum
Infrastructure
Mobile users (per 100 people) ............................................................121.......................–2.393........................ 26...........................17 ......................... 191
Internet users (per 100 people) ...........................................................115.......................–1.446.......................... 3.............................1 ........................... 95
Quality of domestic transport1 ..............................................................74.......................–0.313..................... 4.20........................2.08 ........................ 6.51
Collaboration
State of cluster development1 ..............................................................70.......................–0.307..................... 3.67........................2.33 ........................ 5.49
Business and university R&D collaboration1 ..........................................97.......................–0.758 ..................... 3.10 ........................2.11 ........................ 5.84
Legal framework
Doing Business Index4 .......................................................................113.......................–1.494...................... 157.............................1 ......................... 180
Social safety net protection1 .................................................................61.......................–0.178..................... 3.59........................2.10 ........................ 6.26
Intellectual property protection and property rights1..............................75.......................–0.467 ..................... 3.61 ........................1.62 ........................ 6.31
Social mobility
Social mobility1 .....................................................................................86.......................–0.658..................... 3.79........................2.78 ........................ 6.36
Additional indicatorsDemographics Value
Child dependency ratio (%)..................................................................... 89.6Aged dependency ratio (%) ...................................................................... 6.0Fertility rate (births per woman) ................................................................. 5.8Sex ratio at birth (female/male) ............................................................... 0.98Population below age 20 (%) .................................................................. 57.0Population above age 60 (%) .................................................................... 4.9
Education
Public spending on education (% of GDP) ................................................ 5.4Technical/vocational enrolment as % of total
enrolment in secondary school ............................................................—Adult literacy (%) ..................................................................................... 61.3Boys not in primary school (%) .................................................................... 9Girls not in primary school (%) ..................................................................... 2Education poverty (% of children age 17-22
with less than 2-4 years schooling) ................................................ 0.346Private enrolment in primary school (% of primary) ................................... 1.1Private enrolment in secondary school (% of secondary) ........................ 12.5PIRLS6 .......................................................................................................—PISA math scores6 .....................................................................................—PISA reading scores6 ..................................................................................—PISA science scores6 .................................................................................—TIMSS 4th grade math6 ..............................................................................—TIMSS 4th grade science6 ..........................................................................—TIMSS 8th grade math6 ..............................................................................—TIMSS 8th grade science6 ..........................................................................—
Health
Prevalence of visual impairment (%) .......................................................... 4.3Public spending on health (% of GDP) ...................................................... 8.4Business impact of heart disease1 .......................................................... 4.10Business impact of cancer1 .................................................................... 3.92Business impact of mental illness1 .......................................................... 4.88Business impact of diabetes1 ................................................................. 4.26Business impact of chronic respiratory disease1 ..................................... 4.54Business impact of HIV/AIDS1 ................................................................ 2.85Business impact of tuberculosis1 ............................................................ 3.68Business impact of malaria1 ................................................................... 2.88
Society Value
Freedom in the World8................................................................................. 3Democracy Index (rank/165) ...................................................................... 75Population living in urban area (%) .......................................................... 15.8Gini Index (income)5................................................................................ 43.9Accessibility of digital content1 ............................................................... 3.95Extent of virtual social networks use1 ..................................................... 4.61
Workforce
Economic activity (agriculture) — % of total activity ....................................—Economic activity (industry) — % of total activity ........................................—Economic activity (services) — % of total activity ........................................—GDP per person employed (US$) ......................................................... 1,841Cooperation in labour-employer relations1 .............................................. 4.09Emigration rate of the tertiary educated (%) ............................................ 20.9Labour force with tertiary education (%) .....................................................—Number of patent applications (per 1,000 people) .............................. 0.0208Hiring and firing practices1 ...................................................................... 4.04Retirement age, male .................................................................................—Retirement age, female ...............................................................................—Number of informal sector workers (1,000s) ...............................................—Total employed (1,000s) .............................................................................—Total unemployed (1,000s) ..........................................................................—Unemployment for 12 months or more
as a % of total unemployment .............................................................—Total youth not in education or employment (1,000s) .................................—Unemployment for 12 months or more (1,000s) .........................................—Global Innovation Index (rank/142) .......................................................... 119Global Talent Index (rank/60) ......................................................................—Quality of Labour Force (rank/60) ...............................................................—Talent Environment (rank/60) ......................................................................—IQ measure9 ........................................................................................... 61.9
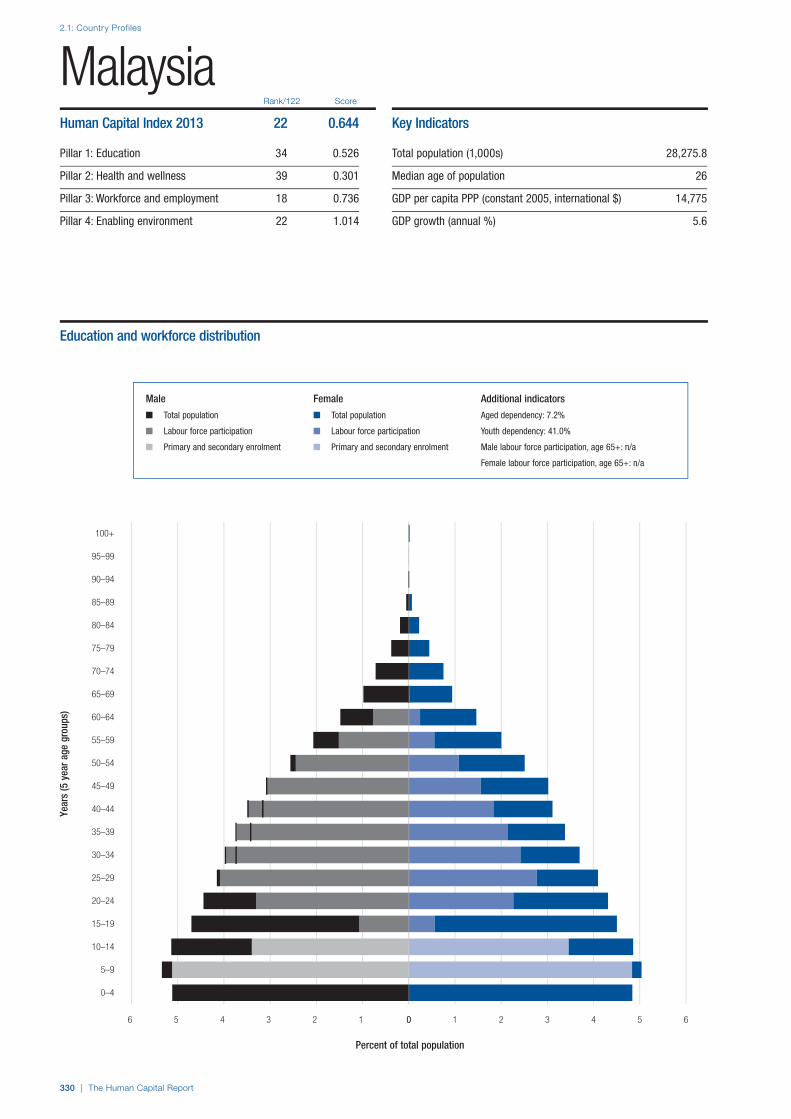
2.1: Country Profiles
330 | The Human Capital Report
Rank/122 Score
Year
s (5
yea
r age
gro
ups)
Percent of total population
0–4
5–9
10–14
15–19
20–24
25–29
30–34
35–39
40–44
45–49
50–54
55–59
60–64
65–69
70–74
75–79
80–84
85–89
90–94
95–99
100+
0 1 2 3 4 5 66 5 4 3 2 1 0
MalaysiaHuman Capital Index 2013 22 0.644
Pillar 1: Education 34 0.526
Pillar 2: Health and wellness 39 0.301
Pillar 3: Workforce and employment 18 0.736
Pillar 4: Enabling environment 22 1.014
Key Indicators
Total population (1,000s) 28,275.8
Median age of population 26
GDP per capita PPP (constant 2005, international $) 14,775
GDP growth (annual %) 5.6
Male Female Additional indicators
n Total population n Total population Aged dependency: 7.2%
n Labour force participation n Labour force participation Youth dependency: 41.0%
n Primary and secondary enrolment n Primary and secondary enrolment Male labour force participation, age 65+: n/a
Female labour force participation, age 65+: n/a
Education and workforce distribution

The Human Capital Report | 331
2.1: Country Profiles
HCI s
core
–2.5
–2.0
–1.5
–1.0
–0.5
0.0
0.5
1.0
1.5
2.0
2.5
Overall Index
Enablingenvironment
Workforce andemployment
Health andwellness
Education
MalaysiaEmployment types, educational requirements and educational attainment
Percent of population Educational in employment type attainment (%)
Tertiary requirements 10.3 16.4
Professionals 3.0
Technicians and associate professionals 7.3
Secondary requirements 32.3 51.8
Clerks 5.2
Service workers and shop and market sales workers 8.7
Skilled agricultural and fishery workers 6.2
Craft and related trade workers 5.6
Plant and machine operators and assemblers 6.6
Primary requirements 5.9 23.0
Elementary occupations 5.9
Various 3.7
Legislators, senior officials and managers 3.7
Unclassified n/a
Armed forces n/a
Spread of scores (by pillar and overall)
Malaysia
Upper-middle income economies
Asia and the Pacific

2.1: Country Profiles
332 | The Human Capital Report
Pillar 1: Education Rank/122 Z-Score Country Value Sample Minimum Sample Maximum
Access
Primary enrolment rate (%) ...................................................................62.........................0.297........................ 96...........................58 ......................... 100
Secondary enrolment rate (%) ..............................................................70.......................–0.161........................ 69...........................16 ......................... 100
Tertiary enrolment ratio (%) ...................................................................54.........................0.066........................ 42.............................1 ......................... 103
Education gender gap2 .........................................................................65.........................0.425................... 0.991......................0.645 ...................... 1.000
Quality
Internet access in schools1 ...................................................................32.........................0.678..................... 5.17........................1.64 ........................ 6.64
Quality of the education system1 ..........................................................18.........................1.344..................... 5.00........................1.99 ........................ 5.98
Quality of primary schools1 ...................................................................27.........................0.821..................... 4.83........................1.97 ........................ 6.82
Quality of math & science education1 ...................................................23.........................0.860..................... 4.86........................1.88 ........................ 6.29
Quality of management schools1 ..........................................................33.........................0.663..................... 4.85........................2.29 ........................ 6.09
Attainment
Primary education attainment (% population age 25+) ..........................30.........................0.601........................ 91.............................5 ......................... 100
Secondary education attainment (% population age 25+) .....................39.........................0.195........................ 68.............................2 ......................... 100
Tertiary education attainment (% population age 25+) ..........................—..............................— .........................— .............................0 ........................... 44
Pillar 2: Health and Wellness Rank/122 Z-Score Country Value Sample Minimum Sample Maximum
Survival
Infant mortality (per 1,000 live births) ....................................................35.........................0.697.......................... 6.............................2 ........................... 98
Life expectancy ...................................................................................59.........................0.177........................ 74...........................50 ........................... 83
Survival gender gap2 ............................................................................68.........................0.177................... 0.973......................0.920 ...................... 0.980
Health
Stunting and wasting (% in children under 5) ........................................48.......................–0.216..................... 17.2..........................1.2 ........................ 36.5
Unhealthy life years (% of life expectancy) ............................................59.........................0.186........................ 14.............................8 ........................... 66
Deaths under 60 from non-communicable
diseases (% of all NCD deaths) ......................................................78.......................–0.308 ..................... 30.5 ..........................7.3 ........................ 55.8
Obesity (% of adults with BMI ≥ 30) .....................................................35.........................0.468..................... 14.1..........................1.1 ........................ 42.8
Business impact of non-communicable diseases1 ................................72.......................–0.260..................... 4.36........................2.74 ........................ 5.87
Business impact of communicable diseases1 .......................................83.......................–0.287..................... 5.19........................3.13 ........................ 6.90
Well-being
Stress (% of respondents)7 ..................................................................28.........................0.525........................ 24.............................8 ........................... 69
Depression (% of respondents)7 ...........................................................39.........................0.456.......................... 9.............................2 ........................... 37
Services
Water, sanitation and hygiene (% with access) .....................................44.........................0.702..................... 97.8........................31.1 ...................... 100.0
Healthcare quality1................................................................................28.........................1.011..................... 5.34........................1.78 ........................ 6.75
Healthcare accessibility1 .......................................................................35.........................0.884..................... 5.74........................2.41 ........................ 6.75
Pillar 3: Workforce and Employment Rank/122 Z-Score Country Value Sample Minimum Sample Maximum
Participation
Labour force participation rate, age 15-64 (%) .....................................97.......................–0.653..................... 62.8........................43.4 ........................ 90.6
Labour force participation rate, age 65+ (%) .........................................38.........................0.271..................... 29.9..........................1.6 ........................ 91.2
Economic participation gender gap2 .....................................................85.......................–0.380................... 0.599......................0.310 ...................... 0.839
Unemployment rate (%) ..........................................................................6.........................1.039....................... 3.3..........................0.3 ........................ 32.0
Youth unemployment rate (%) ...............................................................24.........................0.792..................... 10.9..........................1.6 ........................ 48.2
Talent
Country capacity to attract talent1 ........................................................18.........................1.154..................... 4.63........................1.48 ........................ 6.08
Country capacity to retain talent1..........................................................18.........................1.134..................... 4.63........................1.81 ........................ 5.97
Ease of finding skilled employees1 ........................................................12.........................1.337..................... 4.91........................2.13 ........................ 5.69
Pay related to productivity1 .....................................................................1.........................2.165..................... 5.25........................2.37 ........................ 5.25
Capacity for innovation1........................................................................15.........................1.466..................... 4.87........................2.31 ........................ 5.84
Index of Economic Complexity3 ............................................................31.........................0.683..................... 0.76......................–1.96 ........................ 2.37
Firm level technology absorption1 .........................................................30.........................0.900..................... 5.46........................3.17 ........................ 6.23
Scientific and technical journal articles (per 1,000 people) ....................54.......................–0.467................... 0.048......................0.000 ...................... 1.242
Median age of the working population ..................................................80.......................–0.493........................ 33...........................28 ........................... 42
Training
Staff training1 ........................................................................................11.........................1.571..................... 5.05........................2.51 ........................ 5.57
Training services1 ..................................................................................17.........................1.258..................... 5.30........................2.67 ........................ 6.47
Malaysia

2.1: Country Profiles
NOTESIn the sections for Pillar 1, Pillar 2, Pillar 3 and Pillar 4, values under Country Value, Sample Minimum and Sample Maximum refer to underlying data for each variable.For further details and explanations, please refer to the section “How to Read the Country Profiles”.1 Survey data responses on a 1- to 7-scale (1 = worst score, 7 = best score)2 Data on a 0- to 1-scale (0 = worst score, 1 = best score)3 Data from -1.960 (worst score) to 2.367 (best score)4 Rank number on a list of 185 countries5 Index on a scale of 0 (perfect inequality) to 100 (perfect equality)6 International test scores7 Perception survey data. Percentage of yes responses.8 Score (1 = best, 7 = worst)9 Reported in relation to UK score (100)
The Human Capital Report | 333
MalaysiaPillar 4: Enabling Environment Rank/122 Z-Score Country Value Sample Minimum Sample Maximum
Infrastructure
Mobile users (per 100 people) ..............................................................31.........................0.587...................... 127...........................17 ......................... 191
Internet users (per 100 people) .............................................................38.........................0.612........................ 61.............................1 ........................... 95
Quality of domestic transport1 ..............................................................27.........................0.793 ..................... 5.16 ........................2.08 ........................ 6.51
Collaboration
State of cluster development1 ..............................................................12.........................1.612..................... 5.04........................2.33 ........................ 5.49
Business and university R&D collaboration1 ..........................................15.........................1.383 ..................... 5.02 ........................2.11 ........................ 5.84
Legal framework
Doing Business Index4 .........................................................................11.........................1.318........................ 12.............................1 ......................... 180
Social safety net protection1 .................................................................25.........................0.834..................... 4.69........................2.10 ........................ 6.26
Intellectual property protection and property rights1..............................27.........................0.897 ..................... 5.01 ........................1.62 ........................ 6.31
Social mobility
Social mobility1 .....................................................................................26.........................1.090..................... 5.37........................2.78 ........................ 6.36
Additional indicatorsDemographics Value
Child dependency ratio (%)..................................................................... 41.0Aged dependency ratio (%) ...................................................................... 7.2Fertility rate (births per woman) ................................................................. 2.1Sex ratio at birth (female/male) ............................................................... 0.93Population below age 20 (%) .................................................................. 37.7Population above age 60 (%) .................................................................... 7.8
Education
Public spending on education (% of GDP) ................................................ 5.1Technical/vocational enrolment as % of total
enrolment in secondary school ............................................................. 6Adult literacy (%) ..................................................................................... 93.1Boys not in primary school (%) .................................................................... 4Girls not in primary school (%) ..................................................................... 4Education poverty (% of children age 17-22
with less than 2-4 years schooling) ......................................................—Private enrolment in primary school (% of primary) ................................... 1.0Private enrolment in secondary school (% of secondary) .......................... 4.5PIRLS6 .......................................................................................................—PISA math scores6 .....................................................................................—PISA reading scores6 ..................................................................................—PISA science scores6 .................................................................................—TIMSS 4th grade math6 ..............................................................................—TIMSS 4th grade science6 ..........................................................................—TIMSS 8th grade math6 ........................................................................... 440TIMSS 8th grade science6 ....................................................................... 426
Health
Prevalence of visual impairment (%) .......................................................... 4.9Public spending on health (% of GDP) ...................................................... 3.6Business impact of heart disease1 .......................................................... 4.19Business impact of cancer1 .................................................................... 4.33Business impact of mental illness1 .......................................................... 4.85Business impact of diabetes1 ................................................................. 4.04Business impact of chronic respiratory disease1 ..................................... 4.42Business impact of HIV/AIDS1 ................................................................ 5.03Business impact of tuberculosis1 ............................................................ 5.15Business impact of malaria1 ................................................................... 5.40
Society Value
Freedom in the World8................................................................................. 4Democracy Index (rank/165) ...................................................................... 64Population living in urban area (%) .......................................................... 73.4Gini Index (income)5................................................................................ 46.2Accessibility of digital content1 ............................................................... 5.51Extent of virtual social networks use1 ..................................................... 5.99
Workforce
Economic activity (agriculture) — % of total activity ................................ 13.3Economic activity (industry) — % of total activity .................................... 27.6Economic activity (services) — % of total activity .................................... 59.2GDP per person employed (US$) ....................................................... 26,009Cooperation in labour-employer relations1 .............................................. 5.19Emigration rate of the tertiary educated (%) ............................................ 10.5Labour force with tertiary education (%) ................................................. 24.2Number of patent applications (per 1,000 people) .............................. 0.2282Hiring and firing practices1 ...................................................................... 4.47Retirement age, male ................................................................................ 60Retirement age, female .............................................................................. 60Number of informal sector workers (1,000s) ...............................................—Total employed (1,000s) ..................................................................... 11,777Total unemployed (1,000s) ....................................................................... 396Unemployment for 12 months or more
as a % of total unemployment ........................................................... 5.7Total youth not in education or employment (1,000s) ........................... 844.7Unemployment for 12 months or more (1,000s) ..................................... 22.7Global Innovation Index (rank/142) ............................................................ 32Global Talent Index (rank/60) ..................................................................... 36Quality of Labour Force (rank/60) .............................................................. 27Talent Environment (rank/60) ..................................................................... 36IQ measure9 ........................................................................................... 92.0

2.1: Country Profiles
334 | The Human Capital Report
Rank/122 Score
Year
s (5
yea
r age
gro
ups)
Percent of total population
0–4
5–9
10–14
15–19
20–24
25–29
30–34
35–39
40–44
45–49
50–54
55–59
60–64
65–69
70–74
75–79
80–84
85–89
90–94
95–99
100+
0 2 4 6 8 1010 8 6 4 2 0
MaliHuman Capital Index 2013 118 –1.034
Pillar 1: Education 120 –1.747
Pillar 2: Health and wellness 110 –0.826
Pillar 3: Workforce and employment 107 –0.614
Pillar 4: Enabling environment 109 –0.949
Key Indicators
Total population (1,000s) 13,986.0
Median age of population 17
GDP per capita PPP (constant 2005, international $) 1,047
GDP growth (annual %) –1.2
Male Female Additional indicators
n Total population n Total population Aged dependency: 5.8%
n Labour force participation n Labour force participation Youth dependency: 93.0%
n Primary and secondary enrolment n Primary and secondary enrolment Male labour force participation, age 65+: 0.8%
Female labour force participation, age 65+: 0.3%
Education and workforce distribution

The Human Capital Report | 335
2.1: Country Profiles
HCI s
core
–2.5
–2.0
–1.5
–1.0
–0.5
0.0
0.5
1.0
1.5
2.0
2.5
Overall Index
Enablingenvironment
Workforce andemployment
Health andwellness
Education
MaliEmployment types, educational requirements and educational attainment
Percent of population Educational in employment type attainment (%)
Tertiary requirements n/a 1.9
Professionals n/a
Technicians and associate professionals n/a
Secondary requirements n/a 8.4
Clerks n/a
Service workers and shop and market sales workers n/a
Skilled agricultural and fishery workers n/a
Craft and related trade workers n/a
Plant and machine operators and assemblers n/a
Primary requirements n/a 8.3
Elementary occupations n/a
Various n/a
Legislators, senior officials and managers n/a
Unclassified n/a
Armed forces n/a
Spread of scores (by pillar and overall)
Mali
Low-income economies
Sub-Saharan Africa

2.1: Country Profiles
336 | The Human Capital Report
Pillar 1: Education Rank/122 Z-Score Country Value Sample Minimum Sample Maximum
Access
Primary enrolment rate (%) .................................................................112.......................–3.096........................ 67...........................58 ......................... 100
Secondary enrolment rate (%) ..............................................................94.......................–1.816........................ 31...........................16 ......................... 100
Tertiary enrolment ratio (%) .................................................................108.......................–1.310.......................... 6.............................1 ......................... 103
Education gender gap2 .......................................................................116.......................–3.299................... 0.709......................0.645 ...................... 1.000
Quality
Internet access in schools1 .................................................................101.......................–0.976..................... 3.10........................1.64 ........................ 6.64
Quality of the education system1 ........................................................106.......................–1.027..................... 2.88........................1.99 ........................ 5.98
Quality of primary schools1 .................................................................108.......................–1.278..................... 2.55........................1.97 ........................ 6.82
Quality of math & science education1 .................................................106.......................–1.189..................... 2.90........................1.88 ........................ 6.29
Quality of management schools1 ........................................................103.......................–1.036..................... 3.43........................2.29 ........................ 6.09
Attainment
Primary education attainment (% population age 25+) ..........................70.......................–2.402........................ 19.............................5 ......................... 100
Secondary education attainment (% population age 25+) .....................81.......................–1.984........................ 10.............................2 ......................... 100
Tertiary education attainment (% population age 25+) ..........................81.......................–1.546.......................... 2.............................0 ........................... 44
Pillar 2: Health and Wellness Rank/122 Z-Score Country Value Sample Minimum Sample Maximum
Survival
Infant mortality (per 1,000 live births) ..................................................122.......................–3.433........................ 98.............................2 ........................... 98
Life expectancy .................................................................................121.......................–2.619........................ 51...........................50 ........................... 83
Survival gender gap2 ............................................................................49.........................0.449................... 0.976......................0.920 ...................... 0.980
Health
Stunting and wasting (% in children under 5) ........................................70.......................–1.320..................... 26.9..........................1.2 ........................ 36.5
Unhealthy life years (% of life expectancy) ..........................................101.......................–0.502........................ 18.............................8 ........................... 66
Deaths under 60 from non-communicable
diseases (% of all NCD deaths) ....................................................116.......................–1.598 ..................... 46.9 ..........................7.3 ........................ 55.8
Obesity (% of adults with BMI ≥ 30) .....................................................15.........................1.450....................... 4.8..........................1.1 ........................ 42.8
Business impact of non-communicable diseases1 ..............................116.......................–1.393..................... 3.86........................2.74 ........................ 5.87
Business impact of communicable diseases1 .....................................119.......................–2.051..................... 3.44........................3.13 ........................ 6.90
Well-being
Stress (% of respondents)7 ....................................................................1.........................1.765.......................... 8.............................8 ........................... 69
Depression (% of respondents)7 ...........................................................24.........................0.615.......................... 8.............................2 ........................... 37
Services
Water, sanitation and hygiene (% with access) ...................................116.......................–2.075..................... 43.7........................31.1 ...................... 100.0
Healthcare quality1................................................................................71.......................–0.550..................... 3.44........................1.78 ........................ 6.75
Healthcare accessibility1 .......................................................................68.......................–0.303..................... 4.29........................2.41 ........................ 6.75
Pillar 3: Workforce and Employment Rank/122 Z-Score Country Value Sample Minimum Sample Maximum
Participation
Labour force participation rate, age 15-64 (%) ...................................110.......................–1.532..................... 54.2........................43.4 ........................ 90.6
Labour force participation rate, age 65+ (%) .........................................51.......................–0.111..................... 22.5..........................1.6 ........................ 91.2
Economic participation gender gap2 .....................................................89.......................–0.644................... 0.568......................0.310 ...................... 0.839
Unemployment rate (%) ........................................................................50.........................0.275....................... 7.3..........................0.3 ........................ 32.0
Youth unemployment rate (%) ...............................................................—..............................— .........................— ..........................1.6 ........................ 48.2
Talent
Country capacity to attract talent1 ........................................................60.......................–0.035..................... 3.40........................1.48 ........................ 6.08
Country capacity to retain talent1..........................................................54.........................0.006..................... 3.54........................1.81 ........................ 5.97
Ease of finding skilled employees1 ........................................................43.........................0.376..................... 4.25........................2.13 ........................ 5.69
Pay related to productivity1 ...................................................................98.......................–0.783..................... 3.44........................2.37 ........................ 5.25
Capacity for innovation1........................................................................91.......................–0.666..................... 3.17........................2.31 ........................ 5.84
Index of Economic Complexity3 ..........................................................101.......................–1.315................... –1.14......................–1.96 ........................ 2.37
Firm level technology absorption1 .........................................................74.......................–0.401..................... 4.53........................3.17 ........................ 6.23
Scientific and technical journal articles (per 1,000 people) ..................112.......................–0.623................... 0.002......................0.000 ...................... 1.242
Median age of the working population ................................................115.......................–1.368........................ 29...........................28 ........................... 42
Training
Staff training1 ......................................................................................114.......................–1.432..................... 3.13........................2.51 ........................ 5.57
Training services1 ................................................................................101.......................–0.962..................... 3.54........................2.67 ........................ 6.47
Mali
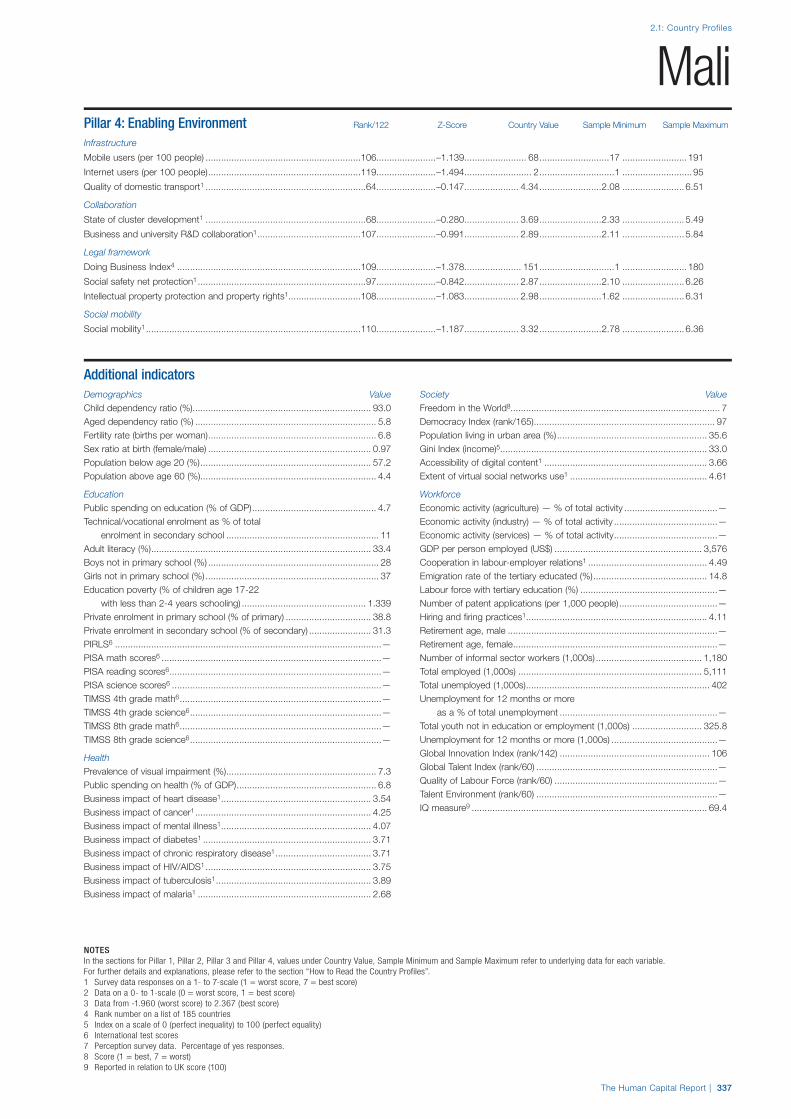
2.1: Country Profiles
NOTESIn the sections for Pillar 1, Pillar 2, Pillar 3 and Pillar 4, values under Country Value, Sample Minimum and Sample Maximum refer to underlying data for each variable.For further details and explanations, please refer to the section “How to Read the Country Profiles”.1 Survey data responses on a 1- to 7-scale (1 = worst score, 7 = best score)2 Data on a 0- to 1-scale (0 = worst score, 1 = best score)3 Data from -1.960 (worst score) to 2.367 (best score)4 Rank number on a list of 185 countries5 Index on a scale of 0 (perfect inequality) to 100 (perfect equality)6 International test scores7 Perception survey data. Percentage of yes responses.8 Score (1 = best, 7 = worst)9 Reported in relation to UK score (100)
The Human Capital Report | 337
MaliPillar 4: Enabling Environment Rank/122 Z-Score Country Value Sample Minimum Sample Maximum
Infrastructure
Mobile users (per 100 people) ............................................................106.......................–1.139........................ 68...........................17 ......................... 191
Internet users (per 100 people) ...........................................................119.......................–1.494.......................... 2.............................1 ........................... 95
Quality of domestic transport1 ..............................................................64.......................–0.147..................... 4.34........................2.08 ........................ 6.51
Collaboration
State of cluster development1 ..............................................................68.......................–0.280..................... 3.69........................2.33 ........................ 5.49
Business and university R&D collaboration1 ........................................107.......................–0.991..................... 2.89........................2.11 ........................ 5.84
Legal framework
Doing Business Index4 .......................................................................109.......................–1.378...................... 151.............................1 ......................... 180
Social safety net protection1 .................................................................97.......................–0.842..................... 2.87........................2.10 ........................ 6.26
Intellectual property protection and property rights1............................108.......................–1.083 ..................... 2.98 ........................1.62 ........................ 6.31
Social mobility
Social mobility1 ...................................................................................110.......................–1.187..................... 3.32........................2.78 ........................ 6.36
Additional indicatorsDemographics Value
Child dependency ratio (%)..................................................................... 93.0Aged dependency ratio (%) ...................................................................... 5.8Fertility rate (births per woman) ................................................................. 6.8Sex ratio at birth (female/male) ............................................................... 0.97Population below age 20 (%) .................................................................. 57.2Population above age 60 (%) .................................................................... 4.4
Education
Public spending on education (% of GDP) ................................................ 4.7Technical/vocational enrolment as % of total
enrolment in secondary school ........................................................... 11Adult literacy (%) ..................................................................................... 33.4Boys not in primary school (%) .................................................................. 28Girls not in primary school (%) ................................................................... 37Education poverty (% of children age 17-22
with less than 2-4 years schooling) ................................................ 1.339Private enrolment in primary school (% of primary) ................................. 38.8Private enrolment in secondary school (% of secondary) ........................ 31.3PIRLS6 .......................................................................................................—PISA math scores6 .....................................................................................—PISA reading scores6 ..................................................................................—PISA science scores6 .................................................................................—TIMSS 4th grade math6 ..............................................................................—TIMSS 4th grade science6 ..........................................................................—TIMSS 8th grade math6 ..............................................................................—TIMSS 8th grade science6 ..........................................................................—
Health
Prevalence of visual impairment (%) .......................................................... 7.3Public spending on health (% of GDP) ...................................................... 6.8Business impact of heart disease1 .......................................................... 3.54Business impact of cancer1 .................................................................... 4.25Business impact of mental illness1 .......................................................... 4.07Business impact of diabetes1 ................................................................. 3.71Business impact of chronic respiratory disease1 ..................................... 3.71Business impact of HIV/AIDS1 ................................................................ 3.75Business impact of tuberculosis1 ............................................................ 3.89Business impact of malaria1 ................................................................... 2.68
Society Value
Freedom in the World8................................................................................. 7Democracy Index (rank/165) ...................................................................... 97Population living in urban area (%) .......................................................... 35.6Gini Index (income)5................................................................................ 33.0Accessibility of digital content1 ............................................................... 3.66Extent of virtual social networks use1 ..................................................... 4.61
Workforce
Economic activity (agriculture) — % of total activity ....................................—Economic activity (industry) — % of total activity ........................................—Economic activity (services) — % of total activity ........................................—GDP per person employed (US$) ......................................................... 3,576Cooperation in labour-employer relations1 .............................................. 4.49Emigration rate of the tertiary educated (%) ............................................ 14.8Labour force with tertiary education (%) .....................................................—Number of patent applications (per 1,000 people) ......................................—Hiring and firing practices1 ...................................................................... 4.11Retirement age, male .................................................................................—Retirement age, female ...............................................................................—Number of informal sector workers (1,000s) ......................................... 1,180Total employed (1,000s) ....................................................................... 5,111Total unemployed (1,000s) ....................................................................... 402Unemployment for 12 months or more
as a % of total unemployment .............................................................—Total youth not in education or employment (1,000s) ........................... 325.8Unemployment for 12 months or more (1,000s) .........................................—Global Innovation Index (rank/142) .......................................................... 106Global Talent Index (rank/60) ......................................................................—Quality of Labour Force (rank/60) ...............................................................—Talent Environment (rank/60) ......................................................................—IQ measure9 ........................................................................................... 69.4
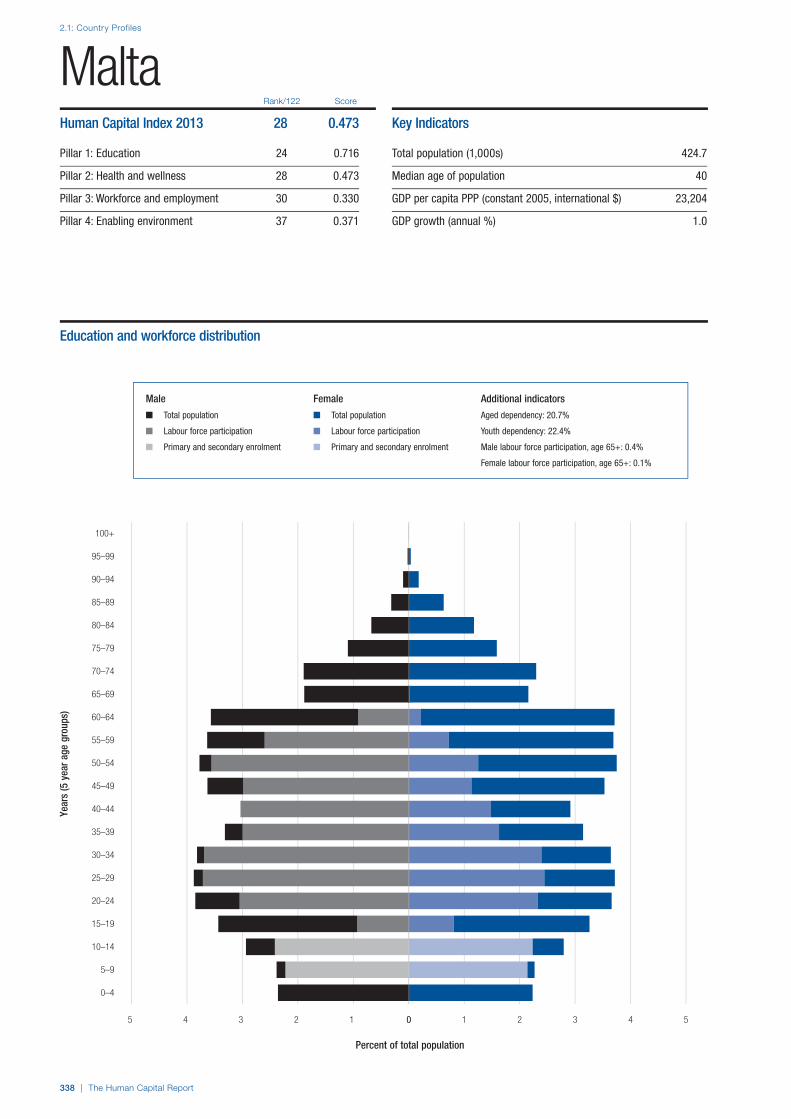
2.1: Country Profiles
338 | The Human Capital Report
Rank/122 Score
Year
s (5
yea
r age
gro
ups)
Percent of total population
0–4
5–9
10–14
15–19
20–24
25–29
30–34
35–39
40–44
45–49
50–54
55–59
60–64
65–69
70–74
75–79
80–84
85–89
90–94
95–99
100+
0 1 2 3 4 55 4 3 2 1 0
MaltaHuman Capital Index 2013 28 0.473
Pillar 1: Education 24 0.716
Pillar 2: Health and wellness 28 0.473
Pillar 3: Workforce and employment 30 0.330
Pillar 4: Enabling environment 37 0.371
Key Indicators
Total population (1,000s) 424.7
Median age of population 40
GDP per capita PPP (constant 2005, international $) 23,204
GDP growth (annual %) 1.0
Male Female Additional indicators
n Total population n Total population Aged dependency: 20.7%
n Labour force participation n Labour force participation Youth dependency: 22.4%
n Primary and secondary enrolment n Primary and secondary enrolment Male labour force participation, age 65+: 0.4%
Female labour force participation, age 65+: 0.1%
Education and workforce distribution

The Human Capital Report | 339
2.1: Country Profiles
HCI s
core
–2.5
–2.0
–1.5
–1.0
–0.5
0.0
0.5
1.0
1.5
2.0
2.5
Overall Index
Enablingenvironment
Workforce andemployment
Health andwellness
Education
MaltaEmployment types, educational requirements and educational attainment
Percent of population Educational in employment type attainment (%)
Tertiary requirements 9.2 13.5
Professionals 3.5
Technicians and associate professionals 5.7
Secondary requirements 26.1 49.8
Clerks 7.0
Service workers and shop and market sales workers 5.3
Skilled agricultural and fishery workers 7.2
Craft and related trade workers 0.8
Plant and machine operators and assemblers 5.8
Primary requirements 3.6 28.3
Elementary occupations 3.6
Various 6.1
Legislators, senior officials and managers 0.5
Unclassified n/a
Armed forces 5.6
Spread of scores (by pillar and overall)
Malta
High-income economies
Europe and Central Asia
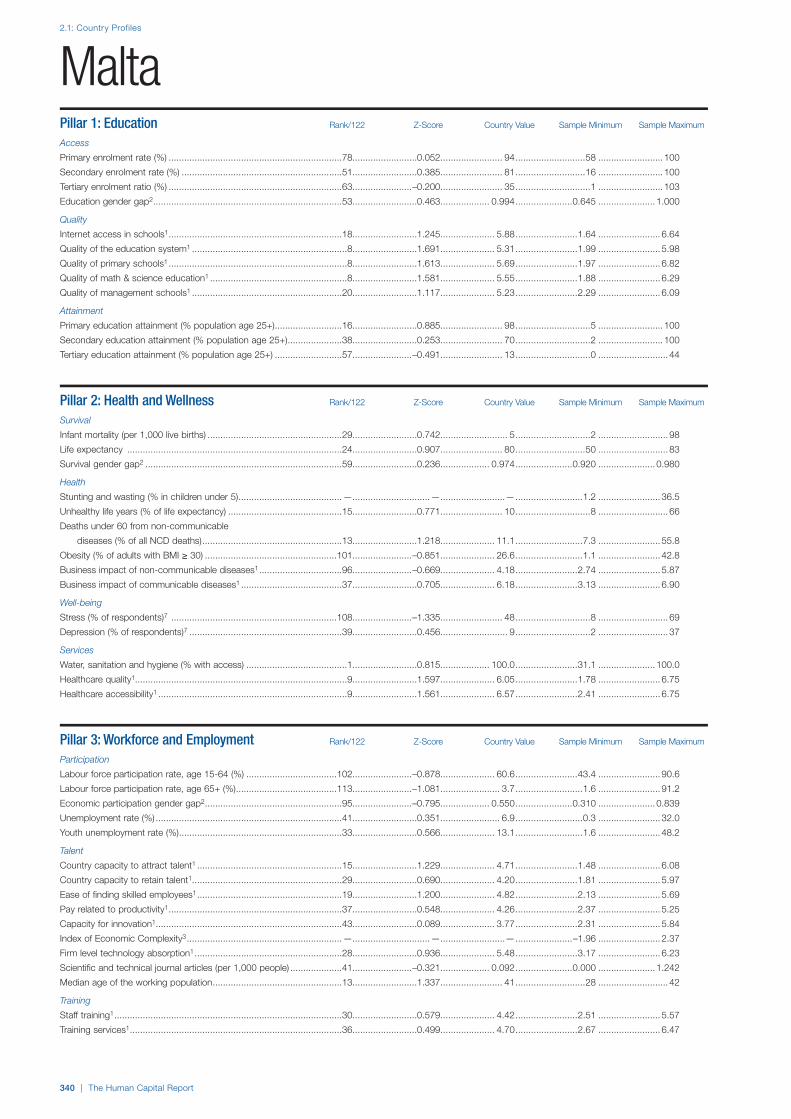
2.1: Country Profiles
340 | The Human Capital Report
Pillar 1: Education Rank/122 Z-Score Country Value Sample Minimum Sample Maximum
Access
Primary enrolment rate (%) ...................................................................78.........................0.052........................ 94...........................58 ......................... 100
Secondary enrolment rate (%) ..............................................................51.........................0.385........................ 81...........................16 ......................... 100
Tertiary enrolment ratio (%) ...................................................................63.......................–0.200........................ 35.............................1 ......................... 103
Education gender gap2 .........................................................................53.........................0.463................... 0.994......................0.645 ...................... 1.000
Quality
Internet access in schools1 ...................................................................18.........................1.245..................... 5.88........................1.64 ........................ 6.64
Quality of the education system1 ............................................................8.........................1.691..................... 5.31........................1.99 ........................ 5.98
Quality of primary schools1 .....................................................................8.........................1.613..................... 5.69........................1.97 ........................ 6.82
Quality of math & science education1 .....................................................8.........................1.581..................... 5.55........................1.88 ........................ 6.29
Quality of management schools1 ..........................................................20.........................1.117..................... 5.23........................2.29 ........................ 6.09
Attainment
Primary education attainment (% population age 25+) ..........................16.........................0.885........................ 98.............................5 ......................... 100
Secondary education attainment (% population age 25+) .....................38.........................0.253........................ 70.............................2 ......................... 100
Tertiary education attainment (% population age 25+) ..........................57.......................–0.491........................ 13.............................0 ........................... 44
Pillar 2: Health and Wellness Rank/122 Z-Score Country Value Sample Minimum Sample Maximum
Survival
Infant mortality (per 1,000 live births) ....................................................29.........................0.742.......................... 5.............................2 ........................... 98
Life expectancy ...................................................................................24.........................0.907........................ 80...........................50 ........................... 83
Survival gender gap2 ............................................................................59.........................0.236................... 0.974......................0.920 ...................... 0.980
Health
Stunting and wasting (% in children under 5) ........................................—..............................— .........................— ..........................1.2 ........................ 36.5
Unhealthy life years (% of life expectancy) ............................................15.........................0.771........................ 10.............................8 ........................... 66
Deaths under 60 from non-communicable
diseases (% of all NCD deaths) ......................................................13.........................1.218 ..................... 11.1 ..........................7.3 ........................ 55.8
Obesity (% of adults with BMI ≥ 30) ...................................................101.......................–0.851..................... 26.6..........................1.1 ........................ 42.8
Business impact of non-communicable diseases1 ................................96.......................–0.669..................... 4.18........................2.74 ........................ 5.87
Business impact of communicable diseases1 .......................................37.........................0.705..................... 6.18........................3.13 ........................ 6.90
Well-being
Stress (% of respondents)7 ................................................................108.......................–1.335........................ 48.............................8 ........................... 69
Depression (% of respondents)7 ...........................................................39.........................0.456.......................... 9.............................2 ........................... 37
Services
Water, sanitation and hygiene (% with access) .......................................1.........................0.815................... 100.0........................31.1 ...................... 100.0
Healthcare quality1..................................................................................9.........................1.597..................... 6.05........................1.78 ........................ 6.75
Healthcare accessibility1 .........................................................................9.........................1.561..................... 6.57........................2.41 ........................ 6.75
Pillar 3: Workforce and Employment Rank/122 Z-Score Country Value Sample Minimum Sample Maximum
Participation
Labour force participation rate, age 15-64 (%) ...................................102.......................–0.878..................... 60.6........................43.4 ........................ 90.6
Labour force participation rate, age 65+ (%) .......................................113.......................–1.081....................... 3.7..........................1.6 ........................ 91.2
Economic participation gender gap2 .....................................................95.......................–0.795................... 0.550......................0.310 ...................... 0.839
Unemployment rate (%) ........................................................................41.........................0.351....................... 6.9..........................0.3 ........................ 32.0
Youth unemployment rate (%) ...............................................................33.........................0.566..................... 13.1..........................1.6 ........................ 48.2
Talent
Country capacity to attract talent1 ........................................................15.........................1.229..................... 4.71........................1.48 ........................ 6.08
Country capacity to retain talent1..........................................................29.........................0.690..................... 4.20........................1.81 ........................ 5.97
Ease of finding skilled employees1 ........................................................19.........................1.200..................... 4.82........................2.13 ........................ 5.69
Pay related to productivity1 ...................................................................37.........................0.548..................... 4.26........................2.37 ........................ 5.25
Capacity for innovation1........................................................................43.........................0.089..................... 3.77........................2.31 ........................ 5.84
Index of Economic Complexity3 ............................................................—..............................— .........................— ......................–1.96 ........................ 2.37
Firm level technology absorption1 .........................................................28.........................0.936..................... 5.48........................3.17 ........................ 6.23
Scientific and technical journal articles (per 1,000 people) ....................41.......................–0.321................... 0.092......................0.000 ...................... 1.242
Median age of the working population ..................................................13.........................1.337........................ 41...........................28 ........................... 42
Training
Staff training1 ........................................................................................30.........................0.579..................... 4.42........................2.51 ........................ 5.57
Training services1 ..................................................................................36.........................0.499..................... 4.70........................2.67 ........................ 6.47
Malta

2.1: Country Profiles
NOTESIn the sections for Pillar 1, Pillar 2, Pillar 3 and Pillar 4, values under Country Value, Sample Minimum and Sample Maximum refer to underlying data for each variable.For further details and explanations, please refer to the section “How to Read the Country Profiles”.1 Survey data responses on a 1- to 7-scale (1 = worst score, 7 = best score)2 Data on a 0- to 1-scale (0 = worst score, 1 = best score)3 Data from -1.960 (worst score) to 2.367 (best score)4 Rank number on a list of 185 countries5 Index on a scale of 0 (perfect inequality) to 100 (perfect equality)6 International test scores7 Perception survey data. Percentage of yes responses.8 Score (1 = best, 7 = worst)9 Reported in relation to UK score (100)
The Human Capital Report | 341
MaltaPillar 4: Enabling Environment Rank/122 Z-Score Country Value Sample Minimum Sample Maximum
Infrastructure
Mobile users (per 100 people) ..............................................................35.........................0.523...................... 125...........................17 ......................... 191
Internet users (per 100 people) .............................................................33.........................0.906........................ 69.............................1 ........................... 95
Quality of domestic transport1 ..............................................................70.......................–0.284 ..................... 4.22 ........................2.08 ........................ 6.51
Collaboration
State of cluster development1 ..............................................................58.........................0.022..................... 3.91........................2.33 ........................ 5.49
Business and university R&D collaboration1 ..........................................50.......................–0.011 ..................... 3.77 ........................2.11 ........................ 5.84
Legal framework
Doing Business Index4 .........................................................................77.......................–0.427...................... 102.............................1 ......................... 180
Social safety net protection1 .................................................................21.........................0.977..................... 4.84........................2.10 ........................ 6.26
Intellectual property protection and property rights1..............................23.........................1.090 ..................... 5.20 ........................1.62 ........................ 6.31
Social mobility
Social mobility1 .....................................................................................30.........................0.543..................... 4.88........................2.78 ........................ 6.36
Additional indicatorsDemographics Value
Child dependency ratio (%)..................................................................... 22.4Aged dependency ratio (%) .................................................................... 20.7Fertility rate (births per woman) ................................................................. 1.4Sex ratio at birth (female/male) ............................................................... 0.94Population below age 20 (%) .................................................................. 22.1Population above age 60 (%) .................................................................. 21.5
Education
Public spending on education (% of GDP) ................................................ 5.4Technical/vocational enrolment as % of total
enrolment in secondary school ........................................................... 15Adult literacy (%) ..................................................................................... 92.4Boys not in primary school (%) .................................................................... 7Girls not in primary school (%) ..................................................................... 6Education poverty (% of children age 17-22
with less than 2-4 years schooling) ......................................................—Private enrolment in primary school (% of primary) ................................. 40.5Private enrolment in secondary school (% of secondary) ........................ 28.9PIRLS6 .................................................................................................... 477PISA math scores6 .....................................................................................—PISA reading scores6 ..................................................................................—PISA science scores6 .................................................................................—TIMSS 4th grade math6 ........................................................................... 496TIMSS 4th grade science6 ....................................................................... 446TIMSS 8th grade math6 ..............................................................................—TIMSS 8th grade science6 ..........................................................................—
Health
Prevalence of visual impairment (%) .......................................................... 1.0Public spending on health (% of GDP) ...................................................... 8.7Business impact of heart disease1 .......................................................... 4.29Business impact of cancer1 .................................................................... 3.92Business impact of mental illness1 .......................................................... 4.62Business impact of diabetes1 ................................................................. 3.96Business impact of chronic respiratory disease1 ..................................... 4.11Business impact of HIV/AIDS1 ................................................................ 5.87Business impact of tuberculosis1 ............................................................ 6.02Business impact of malaria1 ................................................................... 6.65
Society Value
Freedom in the World8................................................................................. 1Democracy Index (rank/165) ...................................................................... 15Population living in urban area (%) .......................................................... 95.0Gini Index (income)5....................................................................................—Accessibility of digital content1 ............................................................... 6.26Extent of virtual social networks use1 ..................................................... 6.43
Workforce
Economic activity (agriculture) — % of total activity .................................. 1.1Economic activity (industry) — % of total activity .................................... 24.4Economic activity (services) — % of total activity .................................... 73.2GDP per person employed (US$) ....................................................... 32,664Cooperation in labour-employer relations1 .............................................. 5.03Emigration rate of the tertiary educated (%) ............................................ 58.3Labour force with tertiary education (%) ................................................. 20.2Number of patent applications (per 1,000 people) .............................. 0.0353Hiring and firing practices1 ...................................................................... 3.89Retirement age, male ................................................................................ 61Retirement age, female .............................................................................. 60Number of informal sector workers (1,000s) ...............................................—Total employed (1,000s) .......................................................................... 164Total unemployed (1,000s) ......................................................................... 12Unemployment for 12 months or more
as a % of total unemployment ......................................................... 47.5Total youth not in education or employment (1,000s) ............................... 5.6Unemployment for 12 months or more (1,000s) ....................................... 5.8Global Innovation Index (rank/142) ............................................................ 24Global Talent Index (rank/60) ......................................................................—Quality of Labour Force (rank/60) ...............................................................—Talent Environment (rank/60) ......................................................................—IQ measure9 ........................................................................................... 95.2

2.1: Country Profiles
342 | The Human Capital Report
Rank/122 Score
Year
s (5
yea
r age
gro
ups)
Percent of total population
0–4
5–9
10–14
15–19
20–24
25–29
30–34
35–39
40–44
45–49
50–54
55–59
60–64
65–69
70–74
75–79
80–84
85–89
90–94
95–99
100+
0 1 2 3 4 5 6 7 88 7 6 5 4 3 2 1 0
MauritaniaHuman Capital Index 2013 121 –1.297
Pillar 1: Education 119 –1.744
Pillar 2: Health and wellness 105 –0.666
Pillar 3: Workforce and employment 122 –1.404
Pillar 4: Enabling environment 121 –1.373
Key Indicators
Total population (1,000s) 3,609.4
Median age of population 20
GDP per capita PPP (constant 2005, international $) 2,244
GDP growth (annual %) 7.6
Male Female Additional indicators
n Total population n Total population Aged dependency: 5.6%
n Labour force participation n Labour force participation Youth dependency: 72.0%
n Primary and secondary enrolment n Primary and secondary enrolment Male labour force participation, age 65+: n/a
Female labour force participation, age 65+: n/a
Education and workforce distribution

The Human Capital Report | 343
2.1: Country Profiles
HCI s
core
–2.5
–2.0
–1.5
–1.0
–0.5
0.0
0.5
1.0
1.5
2.0
2.5
Overall Index
Enablingenvironment
Workforce andemployment
Health andwellness
Education
MauritaniaEmployment types, educational requirements and educational attainment
Percent of population Educational in employment type attainment (%)
Tertiary requirements n/a n/a
Professionals n/a
Technicians and associate professionals n/a
Secondary requirements n/a n/a
Clerks n/a
Service workers and shop and market sales workers n/a
Skilled agricultural and fishery workers n/a
Craft and related trade workers n/a
Plant and machine operators and assemblers n/a
Primary requirements n/a n/a
Elementary occupations n/a
Various n/a
Legislators, senior officials and managers n/a
Unclassified n/a
Armed forces n/a
Spread of scores (by pillar and overall)
Mauritania
Lower-middle income economies
Middle East and North Africa
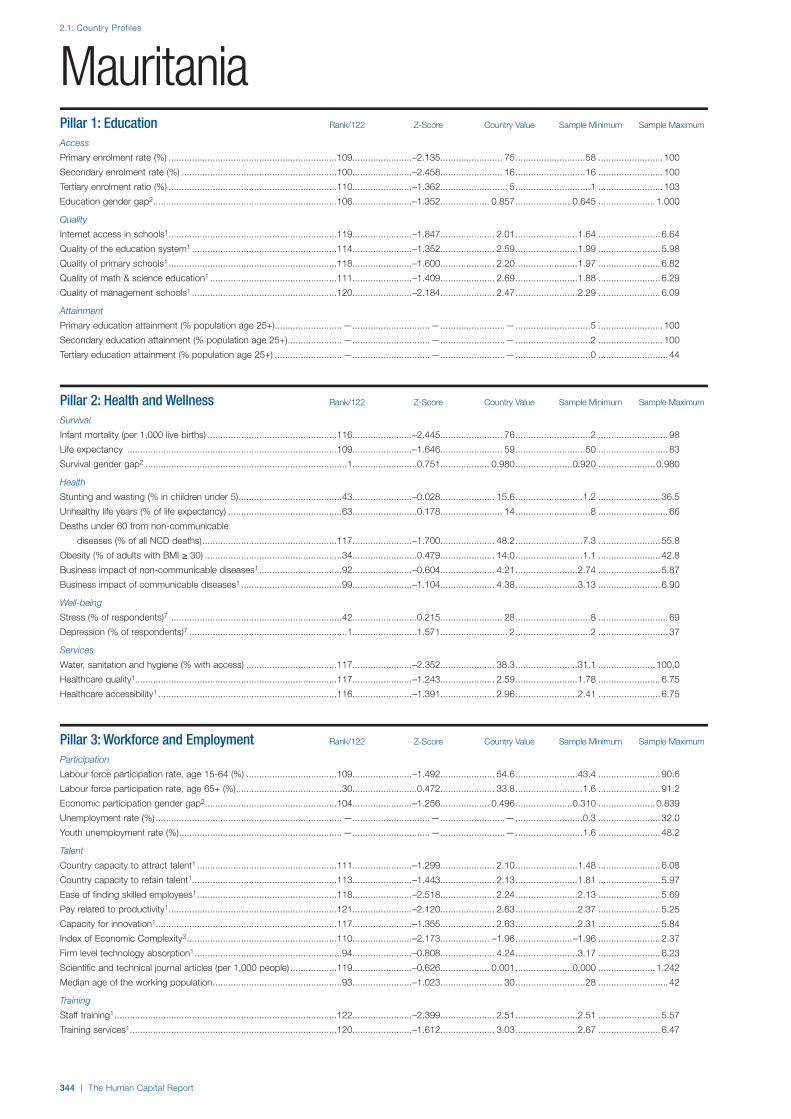
2.1: Country Profiles
344 | The Human Capital Report
Pillar 1: Education Rank/122 Z-Score Country Value Sample Minimum Sample Maximum
Access
Primary enrolment rate (%) .................................................................109.......................–2.135........................ 75...........................58 ......................... 100
Secondary enrolment rate (%) ............................................................100.......................–2.458........................ 16...........................16 ......................... 100
Tertiary enrolment ratio (%) .................................................................110.......................–1.362.......................... 5.............................1 ......................... 103
Education gender gap2 .......................................................................106.......................–1.352................... 0.857......................0.645 ...................... 1.000
Quality
Internet access in schools1 .................................................................119.......................–1.847..................... 2.01........................1.64 ........................ 6.64
Quality of the education system1 ........................................................114.......................–1.352..................... 2.59........................1.99 ........................ 5.98
Quality of primary schools1 .................................................................118.......................–1.600..................... 2.20........................1.97 ........................ 6.82
Quality of math & science education1 .................................................111.......................–1.409..................... 2.69........................1.88 ........................ 6.29
Quality of management schools1 ........................................................120.......................–2.184..................... 2.47........................2.29 ........................ 6.09
Attainment
Primary education attainment (% population age 25+) ..........................—..............................— .........................— .............................5 ......................... 100
Secondary education attainment (% population age 25+) .....................—..............................— .........................— .............................2 ......................... 100
Tertiary education attainment (% population age 25+) ..........................—..............................— .........................— .............................0 ........................... 44
Pillar 2: Health and Wellness Rank/122 Z-Score Country Value Sample Minimum Sample Maximum
Survival
Infant mortality (per 1,000 live births) ..................................................116.......................–2.445........................ 76.............................2 ........................... 98
Life expectancy .................................................................................109.......................–1.646........................ 59...........................50 ........................... 83
Survival gender gap2 ..............................................................................1.........................0.751................... 0.980......................0.920 ...................... 0.980
Health
Stunting and wasting (% in children under 5) ........................................43.......................–0.028..................... 15.6..........................1.2 ........................ 36.5
Unhealthy life years (% of life expectancy) ............................................63.........................0.178........................ 14.............................8 ........................... 66
Deaths under 60 from non-communicable
diseases (% of all NCD deaths) ....................................................117.......................–1.700 ..................... 48.2 ..........................7.3 ........................ 55.8
Obesity (% of adults with BMI ≥ 30) .....................................................34.........................0.479..................... 14.0..........................1.1 ........................ 42.8
Business impact of non-communicable diseases1 ................................92.......................–0.604..................... 4.21........................2.74 ........................ 5.87
Business impact of communicable diseases1 .......................................99.......................–1.104..................... 4.38........................3.13 ........................ 6.90
Well-being
Stress (% of respondents)7 ..................................................................42.........................0.215........................ 28.............................8 ........................... 69
Depression (% of respondents)7 .............................................................1.........................1.571.......................... 2.............................2 ........................... 37
Services
Water, sanitation and hygiene (% with access) ...................................117.......................–2.352..................... 38.3........................31.1 ...................... 100.0
Healthcare quality1..............................................................................117.......................–1.243..................... 2.59........................1.78 ........................ 6.75
Healthcare accessibility1 .....................................................................116.......................–1.391..................... 2.96........................2.41 ........................ 6.75
Pillar 3: Workforce and Employment Rank/122 Z-Score Country Value Sample Minimum Sample Maximum
Participation
Labour force participation rate, age 15-64 (%) ...................................109.......................–1.492..................... 54.6........................43.4 ........................ 90.6
Labour force participation rate, age 65+ (%) .........................................30.........................0.472..................... 33.8..........................1.6 ........................ 91.2
Economic participation gender gap2 ...................................................104.......................–1.256................... 0.496......................0.310 ...................... 0.839
Unemployment rate (%) ........................................................................—..............................— .........................— ..........................0.3 ........................ 32.0
Youth unemployment rate (%) ...............................................................—..............................— .........................— ..........................1.6 ........................ 48.2
Talent
Country capacity to attract talent1 ......................................................111.......................–1.299..................... 2.10........................1.48 ........................ 6.08
Country capacity to retain talent1........................................................113.......................–1.443..................... 2.13........................1.81 ........................ 5.97
Ease of finding skilled employees1 ......................................................118.......................–2.518..................... 2.24........................2.13 ........................ 5.69
Pay related to productivity1 .................................................................121.......................–2.120..................... 2.63........................2.37 ........................ 5.25
Capacity for innovation1......................................................................117.......................–1.355..................... 2.63........................2.31 ........................ 5.84
Index of Economic Complexity3 ..........................................................110.......................–2.173................... –1.96......................–1.96 ........................ 2.37
Firm level technology absorption1 .........................................................94.......................–0.808..................... 4.24........................3.17 ........................ 6.23
Scientific and technical journal articles (per 1,000 people) ..................119.......................–0.626................... 0.001......................0.000 ...................... 1.242
Median age of the working population ..................................................93.......................–1.023........................ 30...........................28 ........................... 42
Training
Staff training1 ......................................................................................122.......................–2.399..................... 2.51........................2.51 ........................ 5.57
Training services1 ................................................................................120.......................–1.612..................... 3.03........................2.67 ........................ 6.47
Mauritania

2.1: Country Profiles
NOTESIn the sections for Pillar 1, Pillar 2, Pillar 3 and Pillar 4, values under Country Value, Sample Minimum and Sample Maximum refer to underlying data for each variable.For further details and explanations, please refer to the section “How to Read the Country Profiles”.1 Survey data responses on a 1- to 7-scale (1 = worst score, 7 = best score)2 Data on a 0- to 1-scale (0 = worst score, 1 = best score)3 Data from -1.960 (worst score) to 2.367 (best score)4 Rank number on a list of 185 countries5 Index on a scale of 0 (perfect inequality) to 100 (perfect equality)6 International test scores7 Perception survey data. Percentage of yes responses.8 Score (1 = best, 7 = worst)9 Reported in relation to UK score (100)
The Human Capital Report | 345
MauritaniaPillar 4: Enabling Environment Rank/122 Z-Score Country Value Sample Minimum Sample Maximum
Infrastructure
Mobile users (per 100 people) ..............................................................87.......................–0.396........................ 94...........................17 ......................... 191
Internet users (per 100 people) ...........................................................111.......................–1.405.......................... 5.............................1 ........................... 95
Quality of domestic transport1 ............................................................120.......................–2.075..................... 2.66........................2.08 ........................ 6.51
Collaboration
State of cluster development1 ..............................................................97.......................–0.854..................... 3.28........................2.33 ........................ 5.49
Business and university R&D collaboration1 ........................................118.......................–1.611..................... 2.34........................2.11 ........................ 5.84
Legal framework
Doing Business Index4 .......................................................................118.......................–1.688...................... 167.............................1 ......................... 180
Social safety net protection1 ...............................................................110.......................–1.136..................... 2.55........................2.10 ........................ 6.26
Intellectual property protection and property rights1............................117.......................–1.410 ..................... 2.65 ........................1.62 ........................ 6.31
Social mobility
Social mobility1 ...................................................................................122.......................–1.778..................... 2.78........................2.78 ........................ 6.36
Additional indicatorsDemographics Value
Child dependency ratio (%)..................................................................... 72.0Aged dependency ratio (%) ...................................................................... 5.6Fertility rate (births per woman) ................................................................. 5.0Sex ratio at birth (female/male) ............................................................... 0.97Population below age 20 (%) .................................................................. 51.0Population above age 60 (%) .................................................................... 4.9
Education
Public spending on education (% of GDP) ................................................ 3.7Technical/vocational enrolment as % of total
enrolment in secondary school ............................................................. 3Adult literacy (%) ..................................................................................... 58.6Boys not in primary school (%) .................................................................. 27Girls not in primary school (%) ................................................................... 23Education poverty (% of children age 17-22
with less than 2-4 years schooling) ......................................................—Private enrolment in primary school (% of primary) ................................. 11.1Private enrolment in secondary school (% of secondary) ........................ 25.4PIRLS6 .......................................................................................................—PISA math scores6 .....................................................................................—PISA reading scores6 ..................................................................................—PISA science scores6 .................................................................................—TIMSS 4th grade math6 ..............................................................................—TIMSS 4th grade science6 ..........................................................................—TIMSS 8th grade math6 ..............................................................................—TIMSS 8th grade science6 ..........................................................................—
Health
Prevalence of visual impairment (%) .......................................................... 6.2Public spending on health (% of GDP) ...................................................... 5.4Business impact of heart disease1 .......................................................... 3.73Business impact of cancer1 .................................................................... 4.09Business impact of mental illness1 .......................................................... 3.87Business impact of diabetes1 ................................................................. 4.90Business impact of chronic respiratory disease1 ..................................... 4.46Business impact of HIV/AIDS1 ................................................................ 4.56Business impact of tuberculosis1 ............................................................ 4.19Business impact of malaria1 ................................................................... 4.40
Society Value
Freedom in the World8................................................................................. 6Democracy Index (rank/165) .................................................................... 110Population living in urban area (%) .......................................................... 41.8Gini Index (income)5................................................................................ 40.5Accessibility of digital content1 ............................................................... 3.78Extent of virtual social networks use1 ..................................................... 4.75
Workforce
Economic activity (agriculture) — % of total activity ....................................—Economic activity (industry) — % of total activity ........................................—Economic activity (services) — % of total activity ........................................—GDP per person employed (US$) ...............................................................—Cooperation in labour-employer relations1 .............................................. 3.28Emigration rate of the tertiary educated (%) .............................................. 8.6Labour force with tertiary education (%) .....................................................—Number of patent applications (per 1,000 people) ......................................—Hiring and firing practices1 ...................................................................... 3.66Retirement age, male .................................................................................—Retirement age, female ...............................................................................—Number of informal sector workers (1,000s) ...............................................—Total employed (1,000s) .............................................................................—Total unemployed (1,000s) ..........................................................................—Unemployment for 12 months or more
as a % of total unemployment .............................................................—Total youth not in education or employment (1,000s) .................................—Unemployment for 12 months or more (1,000s) .........................................—Global Innovation Index (rank/142) .............................................................—Global Talent Index (rank/60) ......................................................................—Quality of Labour Force (rank/60) ...............................................................—Talent Environment (rank/60) ......................................................................—IQ measure9 ........................................................................................... 74.1

2.1: Country Profiles
346 | The Human Capital Report
Rank/122 Score
Year
s (5
yea
r age
gro
ups)
Percent of total population
0–4
5–9
10–14
15–19
20–24
25–29
30–34
35–39
40–44
45–49
50–54
55–59
60–64
65–69
70–74
75–79
80–84
85–89
90–94
95–99
100+
0 1 2 3 4 55 4 3 2 1 0
MauritiusHuman Capital Index 2013 47 0.099
Pillar 1: Education 50 0.234
Pillar 2: Health and wellness 45 0.202
Pillar 3: Workforce and employment 64 –0.143
Pillar 4: Enabling environment 49 0.102
Key Indicators
Total population (1,000s) 1,230.7
Median age of population 33
GDP per capita PPP (constant 2005, international $) 13,487
GDP growth (annual %) 3.2
Male Female Additional indicators
n Total population n Total population Aged dependency: 10.9%
n Labour force participation n Labour force participation Youth dependency: 29.8%
n Primary and secondary enrolment n Primary and secondary enrolment Male labour force participation, age 65+: 0.5%
Female labour force participation, age 65+: 0.2%
Education and workforce distribution
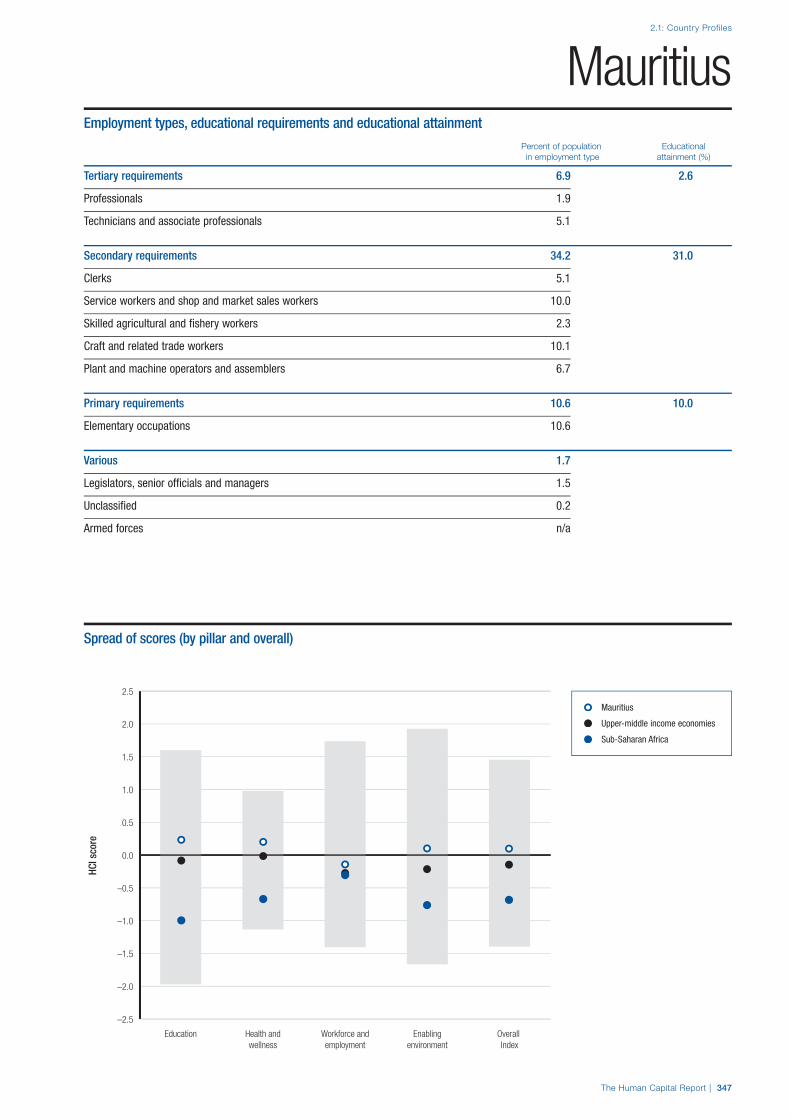
The Human Capital Report | 347
2.1: Country Profiles
HCI s
core
–2.5
–2.0
–1.5
–1.0
–0.5
0.0
0.5
1.0
1.5
2.0
2.5
Overall Index
Enablingenvironment
Workforce andemployment
Health andwellness
Education
MauritiusEmployment types, educational requirements and educational attainment
Percent of population Educational in employment type attainment (%)
Tertiary requirements 6.9 2.6
Professionals 1.9
Technicians and associate professionals 5.1
Secondary requirements 34.2 31.0
Clerks 5.1
Service workers and shop and market sales workers 10.0
Skilled agricultural and fishery workers 2.3
Craft and related trade workers 10.1
Plant and machine operators and assemblers 6.7
Primary requirements 10.6 10.0
Elementary occupations 10.6
Various 1.7
Legislators, senior officials and managers 1.5
Unclassified 0.2
Armed forces n/a
Spread of scores (by pillar and overall)
Mauritius
Upper-middle income economies
Sub-Saharan Africa

2.1: Country Profiles
348 | The Human Capital Report
Pillar 1: Education Rank/122 Z-Score Country Value Sample Minimum Sample Maximum
Access
Primary enrolment rate (%) ...................................................................—..............................— .........................— ...........................58 ......................... 100
Secondary enrolment rate (%) ..............................................................63.........................0.078........................ 74...........................16 ......................... 100
Tertiary enrolment ratio (%) ...................................................................66.......................–0.308........................ 32.............................1 ......................... 103
Education gender gap2 .........................................................................66.........................0.418................... 0.990......................0.645 ...................... 1.000
Quality
Internet access in schools1 ...................................................................61.........................0.007..................... 4.33........................1.64 ........................ 6.64
Quality of the education system1 ..........................................................31.........................0.572..................... 4.31........................1.99 ........................ 5.98
Quality of primary schools1 ...................................................................41.........................0.499..................... 4.48........................1.97 ........................ 6.82
Quality of math & science education1 ...................................................37.........................0.525..................... 4.54........................1.88 ........................ 6.29
Quality of management schools1 ..........................................................53.........................0.077..................... 4.36........................2.29 ........................ 6.09
Attainment
Primary education attainment (% population age 25+) ..........................—..............................— .........................— .............................5 ......................... 100
Secondary education attainment (% population age 25+) .....................—..............................— .........................— .............................2 ......................... 100
Tertiary education attainment (% population age 25+) ..........................—..............................— .........................— .............................0 ........................... 44
Pillar 2: Health and Wellness Rank/122 Z-Score Country Value Sample Minimum Sample Maximum
Survival
Infant mortality (per 1,000 live births) ....................................................57.........................0.383........................ 13.............................2 ........................... 98
Life expectancy ...................................................................................59.........................0.177........................ 74...........................50 ........................... 83
Survival gender gap2 ..............................................................................1.........................0.751................... 0.980......................0.920 ...................... 0.980
Health
Stunting and wasting (% in children under 5) ........................................—..............................— .........................— ..........................1.2 ........................ 36.5
Unhealthy life years (% of life expectancy) ............................................77.......................–0.039........................ 15.............................8 ........................... 66
Deaths under 60 from non-communicable
diseases (% of all NCD deaths) ......................................................76.......................–0.261 ..................... 29.9 ..........................7.3 ........................ 55.8
Obesity (% of adults with BMI ≥ 30) .....................................................52.........................0.035..................... 18.2..........................1.1 ........................ 42.8
Business impact of non-communicable diseases1 ................................76.......................–0.321..................... 4.34........................2.74 ........................ 5.87
Business impact of communicable diseases1 .......................................69.........................0.126..................... 5.60........................3.13 ........................ 6.90
Well-being
Stress (% of respondents)7 ..................................................................79.......................–0.405........................ 36.............................8 ........................... 69
Depression (% of respondents)7 ...........................................................—..............................— .........................— .............................2 ........................... 37
Services
Water, sanitation and hygiene (% with access) .....................................52.........................0.578..................... 95.4........................31.1 ...................... 100.0
Healthcare quality1................................................................................44.........................0.414..................... 4.61........................1.78 ........................ 6.75
Healthcare accessibility1 .......................................................................29.........................0.985..................... 5.87........................2.41 ........................ 6.75
Pillar 3: Workforce and Employment Rank/122 Z-Score Country Value Sample Minimum Sample Maximum
Participation
Labour force participation rate, age 15-64 (%) .....................................93.......................–0.500..................... 64.3........................43.4 ........................ 90.6
Labour force participation rate, age 65+ (%) .........................................88.......................–0.777....................... 9.6..........................1.6 ........................ 91.2
Economic participation gender gap2 .....................................................94.......................–0.764................... 0.554......................0.310 ...................... 0.839
Unemployment rate (%) ........................................................................47.........................0.294....................... 7.2..........................0.3 ........................ 32.0
Youth unemployment rate (%) ...............................................................77.......................–0.493..................... 23.4..........................1.6 ........................ 48.2
Talent
Country capacity to attract talent1 ........................................................34.........................0.433..................... 3.89........................1.48 ........................ 6.08
Country capacity to retain talent1..........................................................77.......................–0.463..................... 3.08........................1.81 ........................ 5.97
Ease of finding skilled employees1 ........................................................74.......................–0.287..................... 3.79........................2.13 ........................ 5.69
Pay related to productivity1 ...................................................................58.........................0.181..................... 4.03........................2.37 ........................ 5.25
Capacity for innovation1........................................................................62.......................–0.294..................... 3.47........................2.31 ........................ 5.84
Index of Economic Complexity3 ............................................................72.......................–0.477................... –0.35......................–1.96 ........................ 2.37
Firm level technology absorption1 .........................................................49.........................0.215..................... 4.97........................3.17 ........................ 6.23
Scientific and technical journal articles (per 1,000 people) ....................74.......................–0.573................... 0.017......................0.000 ...................... 1.242
Median age of the working population ..................................................43.........................0.657........................ 38...........................28 ........................... 42
Training
Staff training1 ........................................................................................33.........................0.505..................... 4.37........................2.51 ........................ 5.57
Training services1 ..................................................................................58.........................0.055..................... 4.35........................2.67 ........................ 6.47
Mauritius

2.1: Country Profiles
NOTESIn the sections for Pillar 1, Pillar 2, Pillar 3 and Pillar 4, values under Country Value, Sample Minimum and Sample Maximum refer to underlying data for each variable.For further details and explanations, please refer to the section “How to Read the Country Profiles”.1 Survey data responses on a 1- to 7-scale (1 = worst score, 7 = best score)2 Data on a 0- to 1-scale (0 = worst score, 1 = best score)3 Data from -1.960 (worst score) to 2.367 (best score)4 Rank number on a list of 185 countries5 Index on a scale of 0 (perfect inequality) to 100 (perfect equality)6 International test scores7 Perception survey data. Percentage of yes responses.8 Score (1 = best, 7 = worst)9 Reported in relation to UK score (100)
The Human Capital Report | 349
MauritiusPillar 4: Enabling Environment Rank/122 Z-Score Country Value Sample Minimum Sample Maximum
Infrastructure
Mobile users (per 100 people) ..............................................................78.......................–0.236........................ 99...........................17 ......................... 191
Internet users (per 100 people) .............................................................74.......................–0.318........................ 35.............................1 ........................... 95
Quality of domestic transport1 ..............................................................62.......................–0.010 ..................... 4.46 ........................2.08 ........................ 6.51
Collaboration
State of cluster development1 ..............................................................49.........................0.205..................... 4.04........................2.33 ........................ 5.49
Business and university R&D collaboration1 ..........................................82.......................–0.557 ..................... 3.28 ........................2.11 ........................ 5.84
Legal framework
Doing Business Index4 .........................................................................17.........................1.182........................ 19.............................1 ......................... 180
Social safety net protection1 .................................................................52.......................–0.030..................... 3.75........................2.10 ........................ 6.26
Intellectual property protection and property rights1..............................37.........................0.442 ..................... 4.54 ........................1.62 ........................ 6.31
Social mobility
Social mobility1 .....................................................................................42.........................0.240..................... 4.60........................2.78 ........................ 6.36
Additional indicatorsDemographics Value
Child dependency ratio (%)..................................................................... 29.8Aged dependency ratio (%) .................................................................... 10.9Fertility rate (births per woman) ................................................................. 1.6Sex ratio at birth (female/male) ............................................................... 0.95Population below age 20 (%) .................................................................. 29.4Population above age 60 (%) .................................................................. 12.2
Education
Public spending on education (% of GDP) ................................................ 3.7Technical/vocational enrolment as % of total
enrolment in secondary school ........................................................... 15Adult literacy (%) ..................................................................................... 88.8Boys not in primary school (%) ...................................................................—Girls not in primary school (%) ....................................................................—Education poverty (% of children age 17-22
with less than 2-4 years schooling) ......................................................—Private enrolment in primary school (% of primary) ................................. 28.1Private enrolment in secondary school (% of secondary) ........................ 73.3PIRLS6 .......................................................................................................—PISA math scores6 .....................................................................................—PISA reading scores6 ..................................................................................—PISA science scores6 .................................................................................—TIMSS 4th grade math6 ..............................................................................—TIMSS 4th grade science6 ..........................................................................—TIMSS 8th grade math6 ..............................................................................—TIMSS 8th grade science6 ..........................................................................—
Health
Prevalence of visual impairment (%) .......................................................... 2.4Public spending on health (% of GDP) ...................................................... 5.9Business impact of heart disease1 .......................................................... 4.08Business impact of cancer1 .................................................................... 4.35Business impact of mental illness1 .......................................................... 5.13Business impact of diabetes1 ................................................................. 3.47Business impact of chronic respiratory disease1 ..................................... 4.66Business impact of HIV/AIDS1 ................................................................ 5.31Business impact of tuberculosis1 ............................................................ 5.75Business impact of malaria1 ................................................................... 5.76
Society Value
Freedom in the World8................................................................................. 1Democracy Index (rank/165) ...................................................................... 18Population living in urban area (%) .......................................................... 41.8Gini Index (income)5....................................................................................—Accessibility of digital content1 ............................................................... 5.00Extent of virtual social networks use1 ..................................................... 5.67
Workforce
Economic activity (agriculture) — % of total activity .................................. 8.4Economic activity (industry) — % of total activity .................................... 27.6Economic activity (services) — % of total activity .................................... 64.0GDP per person employed (US$) ...............................................................—Cooperation in labour-employer relations1 .............................................. 4.76Emigration rate of the tertiary educated (%) ............................................ 56.0Labour force with tertiary education (%) ................................................. 11.2Number of patent applications (per 1,000 people) .............................. 0.0130Hiring and firing practices1 ...................................................................... 4.04Retirement age, male .................................................................................—Retirement age, female ...............................................................................—Number of informal sector workers (1,000s) ...............................................—Total employed (1,000s) .......................................................................... 536Total unemployed (1,000s) ......................................................................... 40Unemployment for 12 months or more
as a % of total unemployment .............................................................—Total youth not in education or employment (1,000s) .................................—Unemployment for 12 months or more (1,000s) .........................................—Global Innovation Index (rank/142) ............................................................ 53Global Talent Index (rank/60) ......................................................................—Quality of Labour Force (rank/60) ...............................................................—Talent Environment (rank/60) ......................................................................—IQ measure9 ........................................................................................... 86.6

2.1: Country Profiles
350 | The Human Capital Report
Rank/122 Score
Year
s (5
yea
r age
gro
ups)
Percent of total population
0–4
5–9
10–14
15–19
20–24
25–29
30–34
35–39
40–44
45–49
50–54
55–59
60–64
65–69
70–74
75–79
80–84
85–89
90–94
95–99
100+
0 1 2 3 4 55 4 3 2 1 0
MexicoHuman Capital Index 2013 58 –0.057
Pillar 1: Education 82 –0.291
Pillar 2: Health and wellness 56 0.074
Pillar 3: Workforce and employment 48 0.011
Pillar 4: Enabling environment 53 –0.022
Key Indicators
Total population (1,000s) 117,886.4
Median age of population 26
GDP per capita PPP (constant 2005, international $) 12,617
GDP growth (annual %) 3.9
Male Female Additional indicators
n Total population n Total population Aged dependency: 9.4%
n Labour force participation n Labour force participation Youth dependency: 47.0%
n Primary and secondary enrolment n Primary and secondary enrolment Male labour force participation, age 65+: 1.4%
Female labour force participation, age 65+: 0.5%
Education and workforce distribution

The Human Capital Report | 351
2.1: Country Profiles
HCI s
core
–2.5
–2.0
–1.5
–1.0
–0.5
0.0
0.5
1.0
1.5
2.0
2.5
Overall Index
Enablingenvironment
Workforce andemployment
Health andwellness
Education
MexicoEmployment types, educational requirements and educational attainment
Percent of population Educational in employment type attainment (%)
Tertiary requirements 8.8 17.6
Professionals 3.6
Technicians and associate professionals 5.2
Secondary requirements 33.2 38.5
Clerks 3.7
Service workers and shop and market sales workers 9.8
Skilled agricultural and fishery workers 6.8
Craft and related trade workers 8.4
Plant and machine operators and assemblers 4.4
Primary requirements 10.1 18.3
Elementary occupations 10.1
Various 1.1
Legislators, senior officials and managers 1.0
Unclassified 0.0
Armed forces 0.1
Spread of scores (by pillar and overall)
Mexico
Upper-middle income economies
Latin America and the Carribean

2.1: Country Profiles
352 | The Human Capital Report
Pillar 1: Education Rank/122 Z-Score Country Value Sample Minimum Sample Maximum
Access
Primary enrolment rate (%) ...................................................................13.........................0.721........................ 99...........................58 ......................... 100
Secondary enrolment rate (%) ..............................................................65.........................0.017........................ 73...........................16 ......................... 100
Tertiary enrolment ratio (%) ...................................................................70.......................–0.447........................ 29.............................1 ......................... 103
Education gender gap2 .........................................................................62.........................0.434................... 0.991......................0.645 ...................... 1.000
Quality
Internet access in schools1 ...................................................................79.......................–0.448..................... 3.76........................1.64 ........................ 6.64
Quality of the education system1 ........................................................102.......................–0.904..................... 2.99........................1.99 ........................ 5.98
Quality of primary schools1 .................................................................105.......................–1.057..................... 2.79........................1.97 ........................ 6.82
Quality of math & science education1 .................................................109.......................–1.378..................... 2.72........................1.88 ........................ 6.29
Quality of management schools1 ..........................................................57.........................0.041..................... 4.33........................2.29 ........................ 6.09
Attainment
Primary education attainment (% population age 25+) ..........................47.......................–0.096........................ 74.............................5 ......................... 100
Secondary education attainment (% population age 25+) .....................50.......................–0.263........................ 56.............................2 ......................... 100
Tertiary education attainment (% population age 25+) ..........................45.......................–0.118........................ 18.............................0 ........................... 44
Pillar 2: Health and Wellness Rank/122 Z-Score Country Value Sample Minimum Sample Maximum
Survival
Infant mortality (per 1,000 live births) ....................................................57.........................0.383........................ 13.............................2 ........................... 98
Life expectancy ...................................................................................51.........................0.299........................ 75...........................50 ........................... 83
Survival gender gap2 ..............................................................................1.........................0.751................... 0.980......................0.920 ...................... 0.980
Health
Stunting and wasting (% in children under 5) ........................................25.........................0.747....................... 8.8..........................1.2 ........................ 36.5
Unhealthy life years (% of life expectancy) ............................................21.........................0.660........................ 11.............................8 ........................... 66
Deaths under 60 from non-communicable
diseases (% of all NCD deaths) ......................................................66.......................–0.072 ..................... 27.5 ..........................7.3 ........................ 55.8
Obesity (% of adults with BMI ≥ 30) ...................................................114.......................–1.505..................... 32.8..........................1.1 ........................ 42.8
Business impact of non-communicable diseases1 ................................88.......................–0.579..................... 4.22........................2.74 ........................ 5.87
Business impact of communicable diseases1 .......................................45.........................0.604..................... 6.08........................3.13 ........................ 6.90
Well-being
Stress (% of respondents)7 ..................................................................86.......................–0.560........................ 38.............................8 ........................... 69
Depression (% of respondents)7 ...........................................................47.........................0.297........................ 10.............................2 ........................... 37
Services
Water, sanitation and hygiene (% with access) .....................................69.........................0.287..................... 89.7........................31.1 ...................... 100.0
Healthcare quality1................................................................................60.......................–0.117..................... 3.97........................1.78 ........................ 6.75
Healthcare accessibility1 .......................................................................63.......................–0.157..................... 4.47........................2.41 ........................ 6.75
Pillar 3: Workforce and Employment Rank/122 Z-Score Country Value Sample Minimum Sample Maximum
Participation
Labour force participation rate, age 15-64 (%) .....................................86.......................–0.428..................... 65.0........................43.4 ........................ 90.6
Labour force participation rate, age 65+ (%) .........................................43.........................0.188..................... 28.3..........................1.6 ........................ 91.2
Economic participation gender gap2 .....................................................99.......................–0.894................... 0.538......................0.310 ...................... 0.839
Unemployment rate (%) ........................................................................29.........................0.649....................... 5.3..........................0.3 ........................ 32.0
Youth unemployment rate (%) ...............................................................19.........................0.936....................... 9.5..........................1.6 ........................ 48.2
Talent
Country capacity to attract talent1 ........................................................64.......................–0.114..................... 3.32........................1.48 ........................ 6.08
Country capacity to retain talent1..........................................................51.........................0.055..................... 3.58........................1.81 ........................ 5.97
Ease of finding skilled employees1 ........................................................55.........................0.016..................... 4.00........................2.13 ........................ 5.69
Pay related to productivity1 ...................................................................76.......................–0.244..................... 3.77........................2.37 ........................ 5.25
Capacity for innovation1........................................................................65.......................–0.313..................... 3.45........................2.31 ........................ 5.84
Index of Economic Complexity3 ............................................................19.........................1.099..................... 1.16......................–1.96 ........................ 2.37
Firm level technology absorption1 .........................................................57.......................–0.074..................... 4.76........................3.17 ........................ 6.23
Scientific and technical journal articles (per 1,000 people) ....................59.......................–0.506................... 0.037......................0.000 ...................... 1.242
Median age of the working population ..................................................68.......................–0.291........................ 34...........................28 ........................... 42
Training
Staff training1 ........................................................................................62.......................–0.071..................... 4.00........................2.51 ........................ 5.57
Training services1 ..................................................................................46.........................0.165..................... 4.44........................2.67 ........................ 6.47
Mexico

2.1: Country Profiles
NOTESIn the sections for Pillar 1, Pillar 2, Pillar 3 and Pillar 4, values under Country Value, Sample Minimum and Sample Maximum refer to underlying data for each variable.For further details and explanations, please refer to the section “How to Read the Country Profiles”.1 Survey data responses on a 1- to 7-scale (1 = worst score, 7 = best score)2 Data on a 0- to 1-scale (0 = worst score, 1 = best score)3 Data from -1.960 (worst score) to 2.367 (best score)4 Rank number on a list of 185 countries5 Index on a scale of 0 (perfect inequality) to 100 (perfect equality)6 International test scores7 Perception survey data. Percentage of yes responses.8 Score (1 = best, 7 = worst)9 Reported in relation to UK score (100)
The Human Capital Report | 353
MexicoPillar 4: Enabling Environment Rank/122 Z-Score Country Value Sample Minimum Sample Maximum
Infrastructure
Mobile users (per 100 people) ..............................................................98.......................–0.726........................ 82...........................17 ......................... 191
Internet users (per 100 people) .............................................................71.......................–0.275........................ 36.............................1 ........................... 95
Quality of domestic transport1 ..............................................................38.........................0.412 ..................... 4.83 ........................2.08 ........................ 6.51
Collaboration
State of cluster development1 ..............................................................32.........................0.545..................... 4.28........................2.33 ........................ 5.49
Business and university R&D collaboration1 ..........................................40.........................0.337 ..................... 4.08 ........................2.11 ........................ 5.84
Legal framework
Doing Business Index4 .........................................................................44.........................0.620........................ 48.............................1 ......................... 180
Social safety net protection1 .................................................................84.......................–0.657..................... 3.07........................2.10 ........................ 6.26
Intellectual property protection and property rights1..............................64.......................–0.194 ..................... 3.89 ........................1.62 ........................ 6.31
Social mobility
Social mobility1 .....................................................................................65.......................–0.260..................... 4.15........................2.78 ........................ 6.36
Additional indicatorsDemographics Value
Child dependency ratio (%)..................................................................... 47.0Aged dependency ratio (%) ...................................................................... 9.4Fertility rate (births per woman) ................................................................. 2.4Sex ratio at birth (female/male) ............................................................... 0.95Population below age 20 (%) .................................................................. 39.7Population above age 60 (%) .................................................................... 8.6
Education
Public spending on education (% of GDP) ................................................ 5.3Technical/vocational enrolment as % of total
enrolment in secondary school ........................................................... 16Adult literacy (%) ..................................................................................... 93.5Boys not in primary school (%) .................................................................... 1Girls not in primary school (%) ....................................................................—Education poverty (% of children age 17-22
with less than 2-4 years schooling) ......................................................—Private enrolment in primary school (% of primary) ................................... 8.3Private enrolment in secondary school (% of secondary) ........................ 13.3PIRLS6 .......................................................................................................—PISA math scores6 .................................................................................. 419PISA reading scores6 ............................................................................... 425PISA science scores6 .............................................................................. 416TIMSS 4th grade math6 ..............................................................................—TIMSS 4th grade science6 ..........................................................................—TIMSS 8th grade math6 ..............................................................................—TIMSS 8th grade science6 ..........................................................................—
Health
Prevalence of visual impairment (%) .......................................................... 2.8Public spending on health (% of GDP) ...................................................... 6.2Business impact of heart disease1 .......................................................... 3.97Business impact of cancer1 .................................................................... 4.07Business impact of mental illness1 .......................................................... 5.33Business impact of diabetes1 ................................................................. 3.42Business impact of chronic respiratory disease1 ..................................... 4.31Business impact of HIV/AIDS1 ................................................................ 5.58Business impact of tuberculosis1 ............................................................ 6.18Business impact of malaria1 ................................................................... 6.47
Society Value
Freedom in the World8................................................................................. 3Democracy Index (rank/165) ...................................................................... 51Population living in urban area (%) .......................................................... 78.4Gini Index (income)5................................................................................ 47.2Accessibility of digital content1 ............................................................... 4.66Extent of virtual social networks use1 ..................................................... 5.44
Workforce
Economic activity (agriculture) — % of total activity ................................ 13.1Economic activity (industry) — % of total activity .................................... 25.5Economic activity (services) — % of total activity .................................... 60.6GDP per person employed (US$) ....................................................... 19,726Cooperation in labour-employer relations1 .............................................. 4.63Emigration rate of the tertiary educated (%) ............................................ 15.5Labour force with tertiary education (%) ................................................. 17.3Number of patent applications (per 1,000 people) .............................. 0.1192Hiring and firing practices1 ...................................................................... 3.37Retirement age, male ................................................................................ 65Retirement age, female .............................................................................. 65Number of informal sector workers (1,000s) ....................................... 20,258Total employed (1,000s) ..................................................................... 45,600Total unemployed (1,000s) .................................................................... 2,572Unemployment for 12 months or more
as a % of total unemployment ........................................................... 2.0Total youth not in education or employment (1,000s) ........................ 3,878.6Unemployment for 12 months or more (1,000s) ..................................... 52.3Global Innovation Index (rank/142) ............................................................ 63Global Talent Index (rank/60) ..................................................................... 38Quality of Labour Force (rank/60) .............................................................. 40Talent Environment (rank/60) ..................................................................... 31IQ measure9 ........................................................................................... 87.7

2.1: Country Profiles
354 | The Human Capital Report
Rank/122 Score
Year
s (5
yea
r age
gro
ups)
Percent of total population
0–4
5–9
10–14
15–19
20–24
25–29
30–34
35–39
40–44
45–49
50–54
55–59
60–64
65–69
70–74
75–79
80–84
85–89
90–94
95–99
100+
0 1 2 3 4 55 4 3 2 1 0
MoldovaHuman Capital Index 2013 83 –0.337
Pillar 1: Education 64 0.014
Pillar 2: Health and wellness 53 0.092
Pillar 3: Workforce and employment 110 –0.654
Pillar 4: Enabling environment 102 –0.801
Key Indicators
Total population (1,000s) 3,573.0
Median age of population 35
GDP per capita PPP (constant 2005, international $) 2,951
GDP growth (annual %) –0.8
Male Female Additional indicators
n Total population n Total population Aged dependency: 15.5%
n Labour force participation n Labour force participation Youth dependency: 23.1%
n Primary and secondary enrolment n Primary and secondary enrolment Male labour force participation, age 65+: 0.4%
Female labour force participation, age 65+: 0.3%
Education and workforce distribution
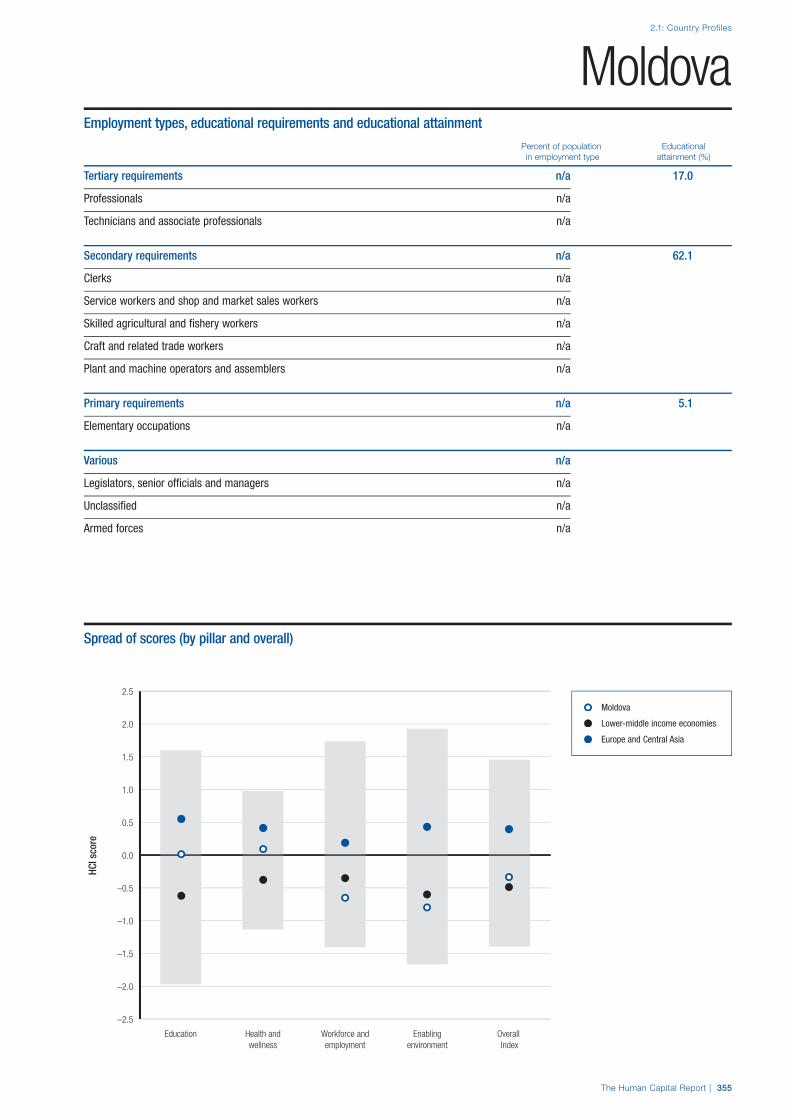
The Human Capital Report | 355
2.1: Country Profiles
HCI s
core
–2.5
–2.0
–1.5
–1.0
–0.5
0.0
0.5
1.0
1.5
2.0
2.5
Overall Index
Enablingenvironment
Workforce andemployment
Health andwellness
Education
MoldovaEmployment types, educational requirements and educational attainment
Percent of population Educational in employment type attainment (%)
Tertiary requirements n/a 17.0
Professionals n/a
Technicians and associate professionals n/a
Secondary requirements n/a 62.1
Clerks n/a
Service workers and shop and market sales workers n/a
Skilled agricultural and fishery workers n/a
Craft and related trade workers n/a
Plant and machine operators and assemblers n/a
Primary requirements n/a 5.1
Elementary occupations n/a
Various n/a
Legislators, senior officials and managers n/a
Unclassified n/a
Armed forces n/a
Spread of scores (by pillar and overall)
Moldova
Lower-middle income economies
Europe and Central Asia
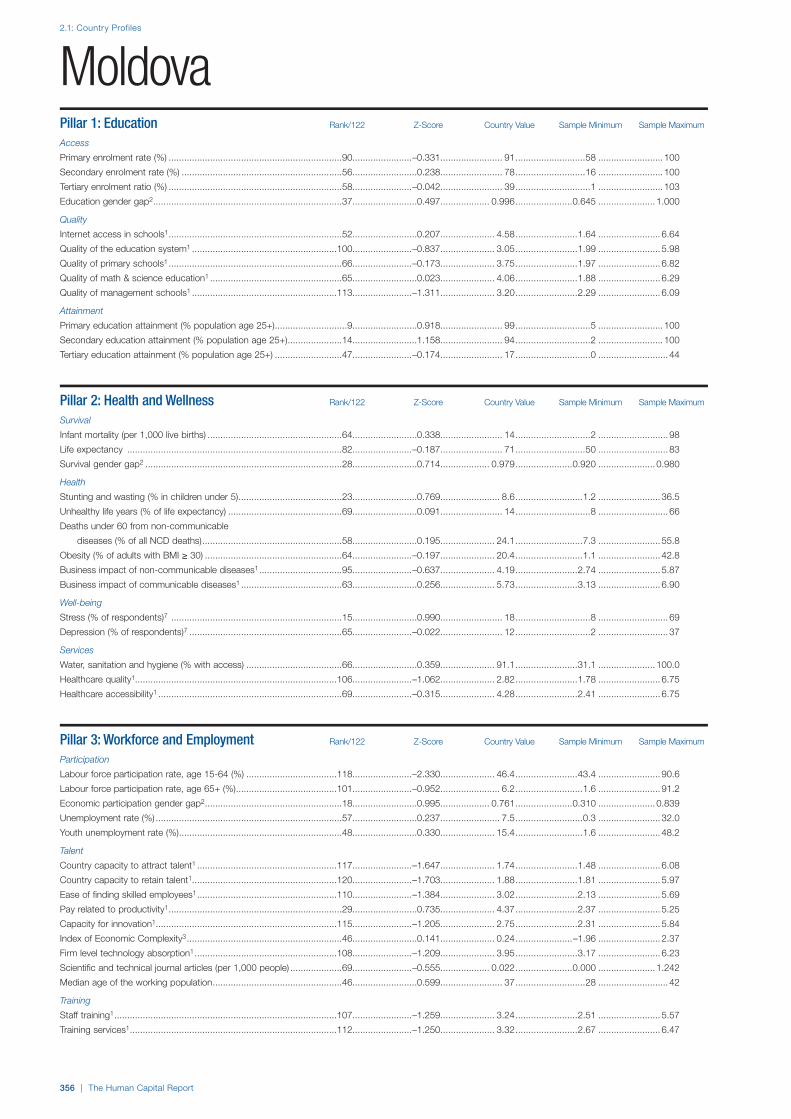
2.1: Country Profiles
356 | The Human Capital Report
Pillar 1: Education Rank/122 Z-Score Country Value Sample Minimum Sample Maximum
Access
Primary enrolment rate (%) ...................................................................90.......................–0.331........................ 91...........................58 ......................... 100
Secondary enrolment rate (%) ..............................................................56.........................0.238........................ 78...........................16 ......................... 100
Tertiary enrolment ratio (%) ...................................................................58.......................–0.042........................ 39.............................1 ......................... 103
Education gender gap2 .........................................................................37.........................0.497................... 0.996......................0.645 ...................... 1.000
Quality
Internet access in schools1 ...................................................................52.........................0.207..................... 4.58........................1.64 ........................ 6.64
Quality of the education system1 ........................................................100.......................–0.837..................... 3.05........................1.99 ........................ 5.98
Quality of primary schools1 ...................................................................66.......................–0.173..................... 3.75........................1.97 ........................ 6.82
Quality of math & science education1 ...................................................65.........................0.023..................... 4.06........................1.88 ........................ 6.29
Quality of management schools1 ........................................................113.......................–1.311..................... 3.20........................2.29 ........................ 6.09
Attainment
Primary education attainment (% population age 25+) ............................9.........................0.918........................ 99.............................5 ......................... 100
Secondary education attainment (% population age 25+) .....................14.........................1.158........................ 94.............................2 ......................... 100
Tertiary education attainment (% population age 25+) ..........................47.......................–0.174........................ 17.............................0 ........................... 44
Pillar 2: Health and Wellness Rank/122 Z-Score Country Value Sample Minimum Sample Maximum
Survival
Infant mortality (per 1,000 live births) ....................................................64.........................0.338........................ 14.............................2 ........................... 98
Life expectancy ...................................................................................82.......................–0.187........................ 71...........................50 ........................... 83
Survival gender gap2 ............................................................................28.........................0.714................... 0.979......................0.920 ...................... 0.980
Health
Stunting and wasting (% in children under 5) ........................................23.........................0.769....................... 8.6..........................1.2 ........................ 36.5
Unhealthy life years (% of life expectancy) ............................................69.........................0.091........................ 14.............................8 ........................... 66
Deaths under 60 from non-communicable
diseases (% of all NCD deaths) ......................................................58.........................0.195 ..................... 24.1 ..........................7.3 ........................ 55.8
Obesity (% of adults with BMI ≥ 30) .....................................................64.......................–0.197..................... 20.4..........................1.1 ........................ 42.8
Business impact of non-communicable diseases1 ................................95.......................–0.637..................... 4.19........................2.74 ........................ 5.87
Business impact of communicable diseases1 .......................................63.........................0.256..................... 5.73........................3.13 ........................ 6.90
Well-being
Stress (% of respondents)7 ..................................................................15.........................0.990........................ 18.............................8 ........................... 69
Depression (% of respondents)7 ...........................................................65.......................–0.022........................ 12.............................2 ........................... 37
Services
Water, sanitation and hygiene (% with access) .....................................66.........................0.359..................... 91.1........................31.1 ...................... 100.0
Healthcare quality1..............................................................................106.......................–1.062..................... 2.82........................1.78 ........................ 6.75
Healthcare accessibility1 .......................................................................69.......................–0.315..................... 4.28........................2.41 ........................ 6.75
Pillar 3: Workforce and Employment Rank/122 Z-Score Country Value Sample Minimum Sample Maximum
Participation
Labour force participation rate, age 15-64 (%) ...................................118.......................–2.330..................... 46.4........................43.4 ........................ 90.6
Labour force participation rate, age 65+ (%) .......................................101.......................–0.952....................... 6.2..........................1.6 ........................ 91.2
Economic participation gender gap2 .....................................................18.........................0.995................... 0.761......................0.310 ...................... 0.839
Unemployment rate (%) ........................................................................57.........................0.237....................... 7.5..........................0.3 ........................ 32.0
Youth unemployment rate (%) ...............................................................48.........................0.330..................... 15.4..........................1.6 ........................ 48.2
Talent
Country capacity to attract talent1 ......................................................117.......................–1.647..................... 1.74........................1.48 ........................ 6.08
Country capacity to retain talent1........................................................120.......................–1.703..................... 1.88........................1.81 ........................ 5.97
Ease of finding skilled employees1 ......................................................110.......................–1.384..................... 3.02........................2.13 ........................ 5.69
Pay related to productivity1 ...................................................................29.........................0.735..................... 4.37........................2.37 ........................ 5.25
Capacity for innovation1......................................................................115.......................–1.205..................... 2.75........................2.31 ........................ 5.84
Index of Economic Complexity3 ............................................................46.........................0.141..................... 0.24......................–1.96 ........................ 2.37
Firm level technology absorption1 .......................................................108.......................–1.209..................... 3.95........................3.17 ........................ 6.23
Scientific and technical journal articles (per 1,000 people) ....................69.......................–0.555................... 0.022......................0.000 ...................... 1.242
Median age of the working population ..................................................46.........................0.599........................ 37...........................28 ........................... 42
Training
Staff training1 ......................................................................................107.......................–1.259..................... 3.24........................2.51 ........................ 5.57
Training services1 ................................................................................112.......................–1.250..................... 3.32........................2.67 ........................ 6.47
Moldova

2.1: Country Profiles
NOTESIn the sections for Pillar 1, Pillar 2, Pillar 3 and Pillar 4, values under Country Value, Sample Minimum and Sample Maximum refer to underlying data for each variable.For further details and explanations, please refer to the section “How to Read the Country Profiles”.1 Survey data responses on a 1- to 7-scale (1 = worst score, 7 = best score)2 Data on a 0- to 1-scale (0 = worst score, 1 = best score)3 Data from -1.960 (worst score) to 2.367 (best score)4 Rank number on a list of 185 countries5 Index on a scale of 0 (perfect inequality) to 100 (perfect equality)6 International test scores7 Perception survey data. Percentage of yes responses.8 Score (1 = best, 7 = worst)9 Reported in relation to UK score (100)
The Human Capital Report | 357
MoldovaPillar 4: Enabling Environment Rank/122 Z-Score Country Value Sample Minimum Sample Maximum
Infrastructure
Mobile users (per 100 people) ..............................................................68.......................–0.067...................... 105...........................17 ......................... 191
Internet users (per 100 people) .............................................................68.......................–0.209........................ 38.............................1 ........................... 95
Quality of domestic transport1 ..............................................................69.......................–0.228 ..................... 4.27 ........................2.08 ........................ 6.51
Collaboration
State of cluster development1 ............................................................122.......................–2.184..................... 2.33........................2.33 ........................ 5.49
Business and university R&D collaboration1 ........................................111.......................–1.226 ..................... 2.68 ........................2.11 ........................ 5.84
Legal framework
Doing Business Index4 .........................................................................65.......................–0.059........................ 83.............................1 ......................... 180
Social safety net protection1 .................................................................99.......................–0.878..................... 2.83........................2.10 ........................ 6.26
Intellectual property protection and property rights1............................111.......................–1.125 ..................... 2.94 ........................1.62 ........................ 6.31
Social mobility
Social mobility1 ...................................................................................111.......................–1.236..................... 3.27........................2.78 ........................ 6.36
Additional indicatorsDemographics Value
Child dependency ratio (%)..................................................................... 23.1Aged dependency ratio (%) .................................................................... 15.5Fertility rate (births per woman) ................................................................. 1.5Sex ratio at birth (female/male) ............................................................... 0.94Population below age 20 (%) .................................................................. 24.8Population above age 60 (%) .................................................................. 16.0
Education
Public spending on education (% of GDP) ................................................ 8.6Technical/vocational enrolment as % of total
enrolment in secondary school ........................................................... 12Adult literacy (%) ..................................................................................... 99.0Boys not in primary school (%) .................................................................... 9Girls not in primary school (%) ................................................................... 10Education poverty (% of children age 17-22
with less than 2-4 years schooling) ......................................................—Private enrolment in primary school (% of primary) ................................... 0.9Private enrolment in secondary school (% of secondary) .......................... 1.3PIRLS6 .......................................................................................................—PISA math scores6 .....................................................................................—PISA reading scores6 ..................................................................................—PISA science scores6 .................................................................................—TIMSS 4th grade math6 ..............................................................................—TIMSS 4th grade science6 ..........................................................................—TIMSS 8th grade math6 ..............................................................................—TIMSS 8th grade science6 ..........................................................................—
Health
Prevalence of visual impairment (%) .......................................................... 2.0Public spending on health (% of GDP) .................................................... 11.4Business impact of heart disease1 .......................................................... 3.49Business impact of cancer1 .................................................................... 3.80Business impact of mental illness1 .......................................................... 5.08Business impact of diabetes1 ................................................................. 4.36Business impact of chronic respiratory disease1 ..................................... 4.24Business impact of HIV/AIDS1 ................................................................ 5.74Business impact of tuberculosis1 ............................................................ 4.98Business impact of malaria1 ................................................................... 6.48
Society Value
Freedom in the World8................................................................................. 3Democracy Index (rank/165) ...................................................................... 67Population living in urban area (%) .......................................................... 48.4Gini Index (income)5................................................................................ 33.0Accessibility of digital content1 ............................................................... 5.39Extent of virtual social networks use1 ..................................................... 5.50
Workforce
Economic activity (agriculture) — % of total activity ................................ 27.5Economic activity (industry) — % of total activity .................................... 18.7Economic activity (services) — % of total activity .................................... 53.7GDP per person employed (US$) ....................................................... 14,655Cooperation in labour-employer relations1 .............................................. 4.21Emigration rate of the tertiary educated (%) .............................................. 4.1Labour force with tertiary education (%) .....................................................—Number of patent applications (per 1,000 people) .............................. 0.0302Hiring and firing practices1 ...................................................................... 3.63Retirement age, male .................................................................................—Retirement age, female ...............................................................................—Number of informal sector workers (1,000s) ............................................ 136Total employed (1,000s) ....................................................................... 1,143Total unemployed (1,000s) ......................................................................... 92Unemployment for 12 months or more
as a % of total unemployment ......................................................... 30.8Total youth not in education or employment (1,000s) ........................... 184.4Unemployment for 12 months or more (1,000s) ..................................... 28.3Global Innovation Index (rank/142) ............................................................ 45Global Talent Index (rank/60) ......................................................................—Quality of Labour Force (rank/60) ...............................................................—Talent Environment (rank/60) ......................................................................—IQ measure9 ........................................................................................... 92.5
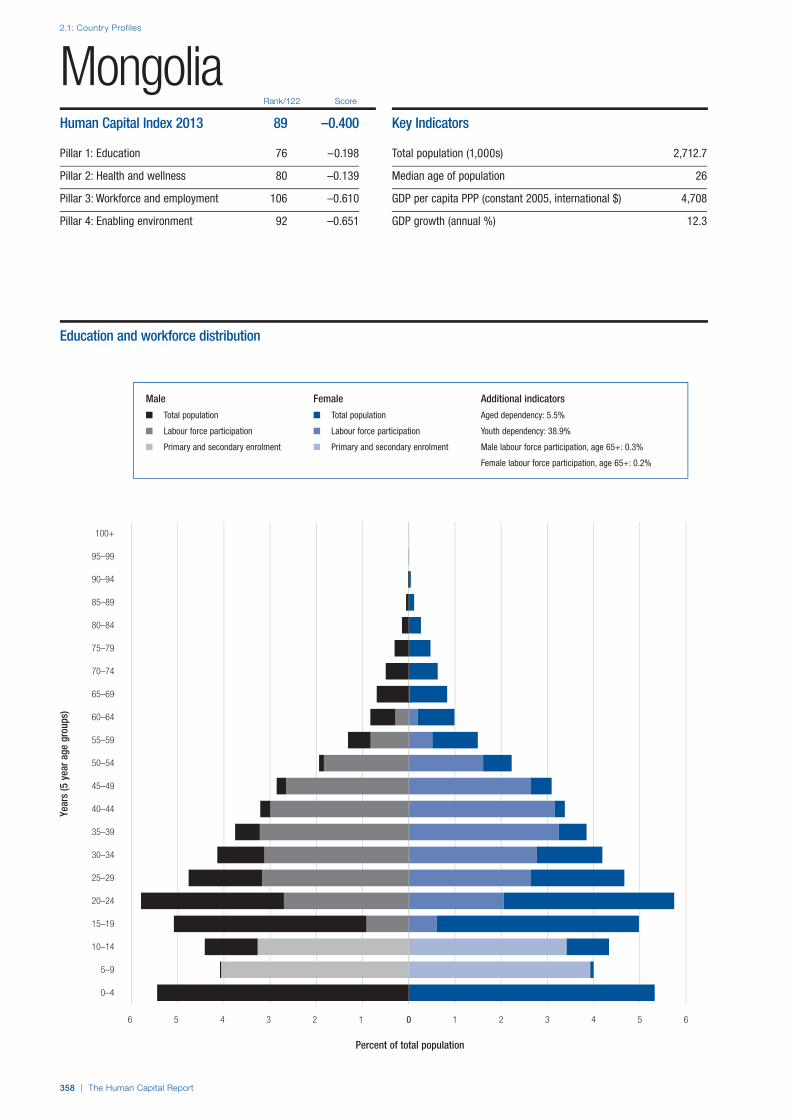
2.1: Country Profiles
358 | The Human Capital Report
Rank/122 Score
Year
s (5
yea
r age
gro
ups)
Percent of total population
0–4
5–9
10–14
15–19
20–24
25–29
30–34
35–39
40–44
45–49
50–54
55–59
60–64
65–69
70–74
75–79
80–84
85–89
90–94
95–99
100+
0 1 2 3 4 5 66 5 4 3 2 1 0
MongoliaHuman Capital Index 2013 89 –0.400
Pillar 1: Education 76 –0.198
Pillar 2: Health and wellness 80 –0.139
Pillar 3: Workforce and employment 106 –0.610
Pillar 4: Enabling environment 92 –0.651
Key Indicators
Total population (1,000s) 2,712.7
Median age of population 26
GDP per capita PPP (constant 2005, international $) 4,708
GDP growth (annual %) 12.3
Male Female Additional indicators
n Total population n Total population Aged dependency: 5.5%
n Labour force participation n Labour force participation Youth dependency: 38.9%
n Primary and secondary enrolment n Primary and secondary enrolment Male labour force participation, age 65+: 0.3%
Female labour force participation, age 65+: 0.2%
Education and workforce distribution

The Human Capital Report | 359
2.1: Country Profiles
HCI s
core
–2.5
–2.0
–1.5
–1.0
–0.5
0.0
0.5
1.0
1.5
2.0
2.5
Overall Index
Enablingenvironment
Workforce andemployment
Health andwellness
Education
MongoliaEmployment types, educational requirements and educational attainment
Percent of population Educational in employment type attainment (%)
Tertiary requirements n/a 12.2
Professionals n/a
Technicians and associate professionals n/a
Secondary requirements n/a 49.6
Clerks n/a
Service workers and shop and market sales workers n/a
Skilled agricultural and fishery workers n/a
Craft and related trade workers n/a
Plant and machine operators and assemblers n/a
Primary requirements n/a 14.3
Elementary occupations n/a
Various n/a
Legislators, senior officials and managers n/a
Unclassified n/a
Armed forces n/a
Spread of scores (by pillar and overall)
Mongolia
Lower-middle income economies
Asia and the Pacific

2.1: Country Profiles
360 | The Human Capital Report
Pillar 1: Education Rank/122 Z-Score Country Value Sample Minimum Sample Maximum
Access
Primary enrolment rate (%) ...................................................................31.........................0.641........................ 99...........................58 ......................... 100
Secondary enrolment rate (%) ..............................................................58.........................0.181........................ 76...........................16 ......................... 100
Tertiary enrolment ratio (%) ...................................................................38.........................0.631........................ 57.............................1 ......................... 103
Education gender gap2 .........................................................................45.........................0.475................... 0.994......................0.645 ...................... 1.000
Quality
Internet access in schools1 ...................................................................72.......................–0.321..................... 3.92........................1.64 ........................ 6.64
Quality of the education system1 ........................................................115.......................–1.374..................... 2.57........................1.99 ........................ 5.98
Quality of primary schools1 ...................................................................75.......................–0.394..................... 3.51........................1.97 ........................ 6.82
Quality of math & science education1 ...................................................60.........................0.097..................... 4.13........................1.88 ........................ 6.29
Quality of management schools1 ........................................................116.......................–1.718..................... 2.86........................2.29 ........................ 6.09
Attainment
Primary education attainment (% population age 25+) ..........................—..............................— .........................— .............................5 ......................... 100
Secondary education attainment (% population age 25+) .....................—..............................— .........................— .............................2 ......................... 100
Tertiary education attainment (% population age 25+) ..........................—..............................— .........................— .............................0 ........................... 44
Pillar 2: Health and Wellness Rank/122 Z-Score Country Value Sample Minimum Sample Maximum
Survival
Infant mortality (per 1,000 live births) ....................................................89.......................–0.201........................ 26.............................2 ........................... 98
Life expectancy ...................................................................................93.......................–0.552........................ 68...........................50 ........................... 83
Survival gender gap2 ..............................................................................1.........................0.751................... 0.980......................0.920 ...................... 0.980
Health
Stunting and wasting (% in children under 5) ........................................41.........................0.024..................... 15.1..........................1.2 ........................ 36.5
Unhealthy life years (% of life expectancy) ............................................76.......................–0.012........................ 15.............................8 ........................... 66
Deaths under 60 from non-communicable
diseases (% of all NCD deaths) ....................................................103.......................–1.244 ..................... 42.4 ..........................7.3 ........................ 55.8
Obesity (% of adults with BMI ≥ 30) .....................................................40.........................0.225..................... 16.4..........................1.1 ........................ 42.8
Business impact of non-communicable diseases1 ................................79.......................–0.365..................... 4.32........................2.74 ........................ 5.87
Business impact of communicable diseases1 .......................................47.........................0.506..................... 5.98........................3.13 ........................ 6.90
Well-being
Stress (% of respondents)7 ....................................................................4.........................1.532........................ 11.............................8 ........................... 69
Depression (% of respondents)7 ...........................................................47.........................0.297........................ 10.............................2 ........................... 37
Services
Water, sanitation and hygiene (% with access) .....................................94.......................–0.770..................... 69.1........................31.1 ...................... 100.0
Healthcare quality1..............................................................................116.......................–1.234..................... 2.61........................1.78 ........................ 6.75
Healthcare accessibility1 .......................................................................96.......................–0.908..................... 3.55........................2.41 ........................ 6.75
Pillar 3: Workforce and Employment Rank/122 Z-Score Country Value Sample Minimum Sample Maximum
Participation
Labour force participation rate, age 15-64 (%) ...................................100.......................–0.725..................... 62.1........................43.4 ........................ 90.6
Labour force participation rate, age 65+ (%) .........................................73.......................–0.596..................... 13.1..........................1.6 ........................ 91.2
Economic participation gender gap2 .......................................................1.........................1.656................... 0.839......................0.310 ...................... 0.839
Unemployment rate (%) ........................................................................78.......................–0.222....................... 9.9..........................0.3 ........................ 32.0
Youth unemployment rate (%) ...............................................................60.......................–0.143..................... 20.0..........................1.6 ........................ 48.2
Talent
Country capacity to attract talent1 ......................................................104.......................–1.195..................... 2.21........................1.48 ........................ 6.08
Country capacity to retain talent1........................................................100.......................–0.904..................... 2.66........................1.81 ........................ 5.97
Ease of finding skilled employees1 ......................................................119.......................–2.679..................... 2.13........................2.13 ........................ 5.69
Pay related to productivity1 ...................................................................25.........................0.807..................... 4.42........................2.37 ........................ 5.25
Capacity for innovation1........................................................................94.......................–0.705..................... 3.14........................2.31 ........................ 5.84
Index of Economic Complexity3 ..........................................................103.......................–1.399................... –1.22......................–1.96 ........................ 2.37
Firm level technology absorption1 .........................................................69.......................–0.274..................... 4.62........................3.17 ........................ 6.23
Scientific and technical journal articles (per 1,000 people) ....................77.......................–0.577................... 0.015......................0.000 ...................... 1.242
Median age of the working population ..................................................83.......................–0.663........................ 32...........................28 ........................... 42
Training
Staff training1 ........................................................................................63.......................–0.075..................... 4.00........................2.51 ........................ 5.57
Training services1 ................................................................................122.......................–2.073..................... 2.67........................2.67 ........................ 6.47
Mongolia

2.1: Country Profiles
NOTESIn the sections for Pillar 1, Pillar 2, Pillar 3 and Pillar 4, values under Country Value, Sample Minimum and Sample Maximum refer to underlying data for each variable.For further details and explanations, please refer to the section “How to Read the Country Profiles”.1 Survey data responses on a 1- to 7-scale (1 = worst score, 7 = best score)2 Data on a 0- to 1-scale (0 = worst score, 1 = best score)3 Data from -1.960 (worst score) to 2.367 (best score)4 Rank number on a list of 185 countries5 Index on a scale of 0 (perfect inequality) to 100 (perfect equality)6 International test scores7 Perception survey data. Percentage of yes responses.8 Score (1 = best, 7 = worst)9 Reported in relation to UK score (100)
The Human Capital Report | 361
MongoliaPillar 4: Enabling Environment Rank/122 Z-Score Country Value Sample Minimum Sample Maximum
Infrastructure
Mobile users (per 100 people) ..............................................................66.......................–0.059...................... 105...........................17 ......................... 191
Internet users (per 100 people) .............................................................90.......................–0.851........................ 20.............................1 ........................... 95
Quality of domestic transport1 ............................................................115.......................–1.401..................... 3.25........................2.08 ........................ 6.51
Collaboration
State of cluster development1 ............................................................118.......................–1.536..................... 2.80........................2.33 ........................ 5.49
Business and university R&D collaboration1 ..........................................99.......................–0.820..................... 3.05........................2.11 ........................ 5.84
Legal framework
Doing Business Index4 .........................................................................61.........................0.077........................ 76.............................1 ......................... 180
Social safety net protection1 .................................................................66.......................–0.223..................... 3.54........................2.10 ........................ 6.26
Intellectual property protection and property rights1............................107.......................–1.046 ..................... 3.02 ........................1.62 ........................ 6.31
Social mobility
Social mobility1 .....................................................................................57.........................0.003..................... 4.39........................2.78 ........................ 6.36
Additional indicatorsDemographics Value
Child dependency ratio (%)..................................................................... 38.9Aged dependency ratio (%) ...................................................................... 5.5Fertility rate (births per woman) ................................................................. 2.4Sex ratio at birth (female/male) ............................................................... 0.95Population below age 20 (%) .................................................................. 37.1Population above age 60 (%) .................................................................... 5.7
Education
Public spending on education (% of GDP) ................................................ 5.5Technical/vocational enrolment as % of total
enrolment in secondary school ........................................................... 12Adult literacy (%) ..................................................................................... 97.4Boys not in primary school (%) .................................................................... 1Girls not in primary school (%) ..................................................................... 2Education poverty (% of children age 17-22
with less than 2-4 years schooling) ................................................ 0.137Private enrolment in primary school (% of primary) ................................... 5.0Private enrolment in secondary school (% of secondary) .......................... 8.6PIRLS6 .......................................................................................................—PISA math scores6 .....................................................................................—PISA reading scores6 ..................................................................................—PISA science scores6 .................................................................................—TIMSS 4th grade math6 ..............................................................................—TIMSS 4th grade science6 ..........................................................................—TIMSS 8th grade math6 ..............................................................................—TIMSS 8th grade science6 ..........................................................................—
Health
Prevalence of visual impairment (%) .......................................................... 2.5Public spending on health (% of GDP) ...................................................... 5.3Business impact of heart disease1 .......................................................... 4.09Business impact of cancer1 .................................................................... 4.20Business impact of mental illness1 .......................................................... 5.30Business impact of diabetes1 ................................................................. 4.44Business impact of chronic respiratory disease1 ..................................... 3.55Business impact of HIV/AIDS1 ................................................................ 5.71Business impact of tuberculosis1 ............................................................ 5.25Business impact of malaria1 ................................................................... 6.98
Society Value
Freedom in the World8................................................................................. 1Democracy Index (rank/165) ...................................................................... 65Population living in urban area (%) .......................................................... 69.3Gini Index (income)5................................................................................ 36.5Accessibility of digital content1 ............................................................... 5.09Extent of virtual social networks use1 ..................................................... 5.57
Workforce
Economic activity (agriculture) — % of total activity ................................ 40.0Economic activity (industry) — % of total activity .................................... 14.9Economic activity (services) — % of total activity .................................... 45.0GDP per person employed (US$) ...............................................................—Cooperation in labour-employer relations1 .............................................. 3.97Emigration rate of the tertiary educated (%) .............................................. 7.4Labour force with tertiary education (%) .....................................................—Number of patent applications (per 1,000 people) .............................. 0.0660Hiring and firing practices1 ...................................................................... 4.05Retirement age, male .................................................................................—Retirement age, female ...............................................................................—Number of informal sector workers (1,000s) ...............................................—Total employed (1,000s) ....................................................................... 1,034Total unemployed (1,000s) ....................................................................... 113Unemployment for 12 months or more
as a % of total unemployment .............................................................—Total youth not in education or employment (1,000s) .................................—Unemployment for 12 months or more (1,000s) .........................................—Global Innovation Index (rank/142) ............................................................ 72Global Talent Index (rank/60) ......................................................................—Quality of Labour Force (rank/60) ...............................................................—Talent Environment (rank/60) ......................................................................—IQ measure9 ......................................................................................... 100.0

2.1: Country Profiles
362 | The Human Capital Report
Rank/122 Score
Year
s (5
yea
r age
gro
ups)
Percent of total population
0–4
5–9
10–14
15–19
20–24
25–29
30–34
35–39
40–44
45–49
50–54
55–59
60–64
65–69
70–74
75–79
80–84
85–89
90–94
95–99
100+
0 1 2 3 4 55 4 3 2 1 0
MoroccoHuman Capital Index 2013 82 –0.336
Pillar 1: Education 93 –0.590
Pillar 2: Health and wellness 59 0.061
Pillar 3: Workforce and employment 99 –0.485
Pillar 4: Enabling environment 77 –0.328
Key Indicators
Total population (1,000s) 31,642.4
Median age of population 26
GDP per capita PPP (constant 2005, international $) 4,475
GDP growth (annual %) 2.7
Male Female Additional indicators
n Total population n Total population Aged dependency: 7.5%
n Labour force participation n Labour force participation Youth dependency: 42.1%
n Primary and secondary enrolment n Primary and secondary enrolment Male labour force participation, age 65+: n/a
Female labour force participation, age 65+: n/a
Education and workforce distribution

The Human Capital Report | 363
2.1: Country Profiles
HCI s
core
–2.5
–2.0
–1.5
–1.0
–0.5
0.0
0.5
1.0
1.5
2.0
2.5
Overall Index
Enablingenvironment
Workforce andemployment
Health andwellness
Education
MoroccoEmployment types, educational requirements and educational attainment
Percent of population Educational in employment type attainment (%)
Tertiary requirements 3.0 n/a
Professionals 0.7
Technicians and associate professionals 2.2
Secondary requirements 35.6 n/a
Clerks 4.1
Service workers and shop and market sales workers 3.2
Skilled agricultural and fishery workers 18.9
Craft and related trade workers 7.9
Plant and machine operators and assemblers 1.5
Primary requirements 7.5 n/a
Elementary occupations 7.5
Various 2.3
Legislators, senior officials and managers 0.5
Unclassified 1.8
Armed forces n/a
Spread of scores (by pillar and overall)
Morocco
Lower-middle income economies
Middle East and North Africa
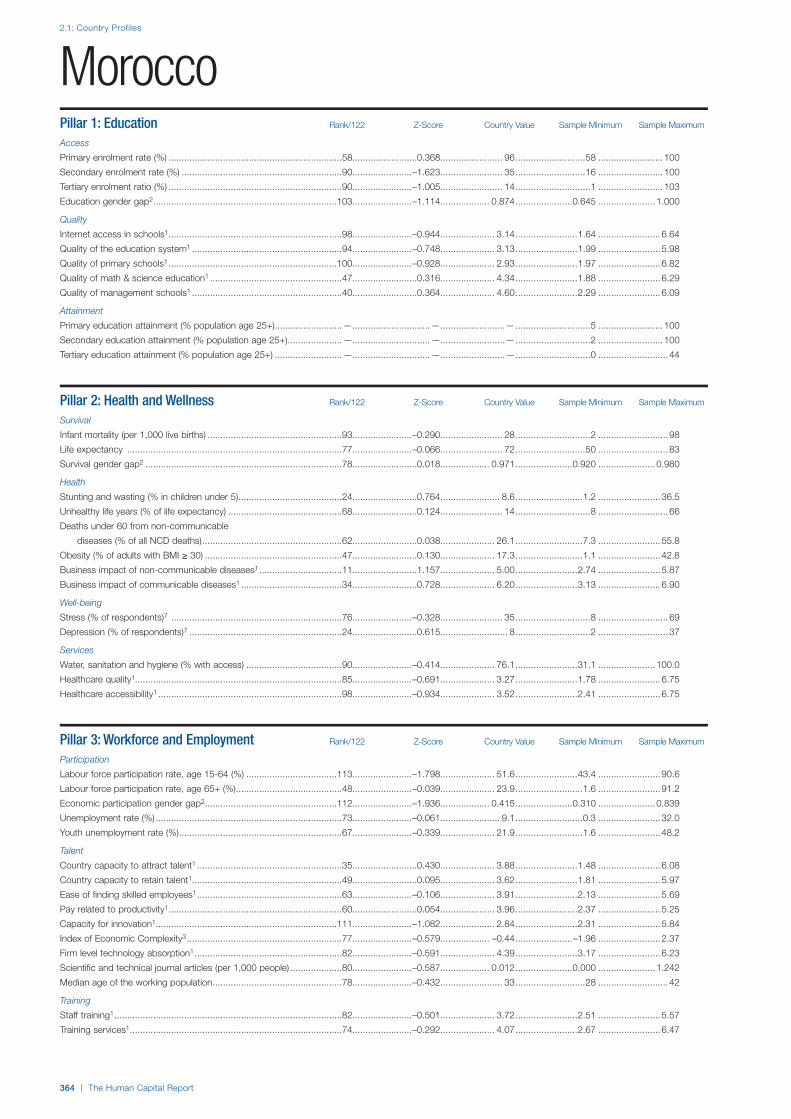
2.1: Country Profiles
364 | The Human Capital Report
Pillar 1: Education Rank/122 Z-Score Country Value Sample Minimum Sample Maximum
Access
Primary enrolment rate (%) ...................................................................58.........................0.368........................ 96...........................58 ......................... 100
Secondary enrolment rate (%) ..............................................................90.......................–1.623........................ 35...........................16 ......................... 100
Tertiary enrolment ratio (%) ...................................................................90.......................–1.005........................ 14.............................1 ......................... 103
Education gender gap2 .......................................................................103.......................–1.114................... 0.874......................0.645 ...................... 1.000
Quality
Internet access in schools1 ...................................................................98.......................–0.944..................... 3.14........................1.64 ........................ 6.64
Quality of the education system1 ..........................................................94.......................–0.748..................... 3.13........................1.99 ........................ 5.98
Quality of primary schools1 .................................................................100.......................–0.928..................... 2.93........................1.97 ........................ 6.82
Quality of math & science education1 ...................................................47.........................0.316..................... 4.34........................1.88 ........................ 6.29
Quality of management schools1 ..........................................................40.........................0.364..................... 4.60........................2.29 ........................ 6.09
Attainment
Primary education attainment (% population age 25+) ..........................—..............................— .........................— .............................5 ......................... 100
Secondary education attainment (% population age 25+) .....................—..............................— .........................— .............................2 ......................... 100
Tertiary education attainment (% population age 25+) ..........................—..............................— .........................— .............................0 ........................... 44
Pillar 2: Health and Wellness Rank/122 Z-Score Country Value Sample Minimum Sample Maximum
Survival
Infant mortality (per 1,000 live births) ....................................................93.......................–0.290........................ 28.............................2 ........................... 98
Life expectancy ...................................................................................77.......................–0.066........................ 72...........................50 ........................... 83
Survival gender gap2 ............................................................................78.........................0.018................... 0.971......................0.920 ...................... 0.980
Health
Stunting and wasting (% in children under 5) ........................................24.........................0.764....................... 8.6..........................1.2 ........................ 36.5
Unhealthy life years (% of life expectancy) ............................................68.........................0.124........................ 14.............................8 ........................... 66
Deaths under 60 from non-communicable
diseases (% of all NCD deaths) ......................................................62.........................0.038 ..................... 26.1 ..........................7.3 ........................ 55.8
Obesity (% of adults with BMI ≥ 30) .....................................................47.........................0.130..................... 17.3..........................1.1 ........................ 42.8
Business impact of non-communicable diseases1 ................................11.........................1.157..................... 5.00........................2.74 ........................ 5.87
Business impact of communicable diseases1 .......................................34.........................0.728..................... 6.20........................3.13 ........................ 6.90
Well-being
Stress (% of respondents)7 ..................................................................76.......................–0.328........................ 35.............................8 ........................... 69
Depression (% of respondents)7 ...........................................................24.........................0.615.......................... 8.............................2 ........................... 37
Services
Water, sanitation and hygiene (% with access) .....................................90.......................–0.414..................... 76.1........................31.1 ...................... 100.0
Healthcare quality1................................................................................85.......................–0.691..................... 3.27........................1.78 ........................ 6.75
Healthcare accessibility1 .......................................................................98.......................–0.934..................... 3.52........................2.41 ........................ 6.75
Pillar 3: Workforce and Employment Rank/122 Z-Score Country Value Sample Minimum Sample Maximum
Participation
Labour force participation rate, age 15-64 (%) ...................................113.......................–1.798..................... 51.6........................43.4 ........................ 90.6
Labour force participation rate, age 65+ (%) .........................................48.......................–0.039..................... 23.9..........................1.6 ........................ 91.2
Economic participation gender gap2 ...................................................112.......................–1.936................... 0.415......................0.310 ...................... 0.839
Unemployment rate (%) ........................................................................73.......................–0.061....................... 9.1..........................0.3 ........................ 32.0
Youth unemployment rate (%) ...............................................................67.......................–0.339..................... 21.9..........................1.6 ........................ 48.2
Talent
Country capacity to attract talent1 ........................................................35.........................0.430..................... 3.88........................1.48 ........................ 6.08
Country capacity to retain talent1..........................................................49.........................0.095..................... 3.62........................1.81 ........................ 5.97
Ease of finding skilled employees1 ........................................................63.......................–0.106..................... 3.91........................2.13 ........................ 5.69
Pay related to productivity1 ...................................................................60.........................0.054..................... 3.96........................2.37 ........................ 5.25
Capacity for innovation1......................................................................111.......................–1.082..................... 2.84........................2.31 ........................ 5.84
Index of Economic Complexity3 ............................................................77.......................–0.579................... –0.44......................–1.96 ........................ 2.37
Firm level technology absorption1 .........................................................82.......................–0.591..................... 4.39........................3.17 ........................ 6.23
Scientific and technical journal articles (per 1,000 people) ....................80.......................–0.587................... 0.012......................0.000 ...................... 1.242
Median age of the working population ..................................................78.......................–0.432........................ 33...........................28 ........................... 42
Training
Staff training1 ........................................................................................82.......................–0.501..................... 3.72........................2.51 ........................ 5.57
Training services1 ..................................................................................74.......................–0.292..................... 4.07........................2.67 ........................ 6.47
Morocco

2.1: Country Profiles
NOTESIn the sections for Pillar 1, Pillar 2, Pillar 3 and Pillar 4, values under Country Value, Sample Minimum and Sample Maximum refer to underlying data for each variable.For further details and explanations, please refer to the section “How to Read the Country Profiles”.1 Survey data responses on a 1- to 7-scale (1 = worst score, 7 = best score)2 Data on a 0- to 1-scale (0 = worst score, 1 = best score)3 Data from -1.960 (worst score) to 2.367 (best score)4 Rank number on a list of 185 countries5 Index on a scale of 0 (perfect inequality) to 100 (perfect equality)6 International test scores7 Perception survey data. Percentage of yes responses.8 Score (1 = best, 7 = worst)9 Reported in relation to UK score (100)
The Human Capital Report | 365
MoroccoPillar 4: Enabling Environment Rank/122 Z-Score Country Value Sample Minimum Sample Maximum
Infrastructure
Mobile users (per 100 people) ..............................................................51.........................0.182...................... 113...........................17 ......................... 191
Internet users (per 100 people) .............................................................49.........................0.255........................ 51.............................1 ........................... 95
Quality of domestic transport1 ..............................................................92.......................–0.699 ..................... 3.86 ........................2.08 ........................ 6.51
Collaboration
State of cluster development1 ..............................................................54.........................0.114..................... 3.97........................2.33 ........................ 5.49
Business and university R&D collaboration1 ........................................101.......................–0.830..................... 3.04........................2.11 ........................ 5.84
Legal framework
Doing Business Index4 .........................................................................75.......................–0.330........................ 97.............................1 ......................... 180
Social safety net protection1 ...............................................................120.......................–1.406..................... 2.26........................2.10 ........................ 6.26
Intellectual property protection and property rights1..............................55.......................–0.039 ..................... 4.05 ........................1.62 ........................ 6.31
Social mobility
Social mobility1 .....................................................................................63.......................–0.196..................... 4.21........................2.78 ........................ 6.36
Additional indicatorsDemographics Value
Child dependency ratio (%)..................................................................... 42.1Aged dependency ratio (%) ...................................................................... 7.5Fertility rate (births per woman) ................................................................. 2.4Sex ratio at birth (female/male) ............................................................... 0.95Population below age 20 (%) .................................................................. 38.3Population above age 60 (%) .................................................................... 7.3
Education
Public spending on education (% of GDP) ................................................ 5.4Technical/vocational enrolment as % of total
enrolment in secondary school ............................................................. 6Adult literacy (%) ..................................................................................... 67.1Boys not in primary school (%) .................................................................... 3Girls not in primary school (%) ..................................................................... 4Education poverty (% of children age 17-22
with less than 2-4 years schooling) ................................................ 0.670Private enrolment in primary school (% of primary) ................................. 12.9Private enrolment in secondary school (% of secondary) .......................... 4.8PIRLS6 .................................................................................................... 310PISA math scores6 .....................................................................................—PISA reading scores6 ..................................................................................—PISA science scores6 .................................................................................—TIMSS 4th grade math6 ........................................................................... 335TIMSS 4th grade science6 ....................................................................... 264TIMSS 8th grade math6 ........................................................................... 371TIMSS 8th grade science6 ....................................................................... 376
Health
Prevalence of visual impairment (%) .......................................................... 6.2Public spending on health (% of GDP) ...................................................... 6.0Business impact of heart disease1 .......................................................... 4.88Business impact of cancer1 .................................................................... 4.78Business impact of mental illness1 .......................................................... 5.70Business impact of diabetes1 ................................................................. 4.66Business impact of chronic respiratory disease1 ..................................... 4.98Business impact of HIV/AIDS1 ................................................................ 6.06Business impact of tuberculosis1 ............................................................ 6.15Business impact of malaria1 ................................................................... 6.39
Society Value
Freedom in the World8................................................................................. 5Democracy Index (rank/165) .................................................................... 115Population living in urban area (%) .......................................................... 57.4Gini Index (income)5................................................................................ 40.9Accessibility of digital content1 ............................................................... 4.55Extent of virtual social networks use1 ..................................................... 5.44
Workforce
Economic activity (agriculture) — % of total activity ................................ 39.8Economic activity (industry) — % of total activity .................................... 21.9Economic activity (services) — % of total activity .................................... 38.2GDP per person employed (US$) ....................................................... 11,223Cooperation in labour-employer relations1 .............................................. 4.10Emigration rate of the tertiary educated (%) ............................................ 18.6Labour force with tertiary education (%) ................................................... 8.9Number of patent applications (per 1,000 people) .............................. 0.0332Hiring and firing practices1 ...................................................................... 3.68Retirement age, male ................................................................................ 60Retirement age, female .............................................................................. 60Number of informal sector workers (1,000s) ...............................................—Total employed (1,000s) ..................................................................... 10,405Total unemployed (1,000s) .................................................................... 1,037Unemployment for 12 months or more
as a % of total unemployment .............................................................—Total youth not in education or employment (1,000s) .................................—Unemployment for 12 months or more (1,000s) .........................................—Global Innovation Index (rank/142) ............................................................ 92Global Talent Index (rank/60) ......................................................................—Quality of Labour Force (rank/60) ...............................................................—Talent Environment (rank/60) ......................................................................—IQ measure9 ........................................................................................... 82.4

2.1: Country Profiles
366 | The Human Capital Report
Rank/122 Score
Year
s (5
yea
r age
gro
ups)
Percent of total population
0–4
5–9
10–14
15–19
20–24
25–29
30–34
35–39
40–44
45–49
50–54
55–59
60–64
65–69
70–74
75–79
80–84
85–89
90–94
95–99
100+
0 2 4 6 8 1010 8 6 4 2 0
MozambiqueHuman Capital Index 2013 117 –0.966
Pillar 1: Education 117 –1.474
Pillar 2: Health and wellness 114 –0.916
Pillar 3: Workforce and employment 82 –0.337
Pillar 4: Enabling environment 115 –1.135
Key Indicators
Total population (1,000s) 23,967.3
Median age of population 17
GDP per capita PPP (constant 2005, international $) 882
GDP growth (annual %) 7.4
Male Female Additional indicators
n Total population n Total population Aged dependency: 6.3%
n Labour force participation n Labour force participation Youth dependency: 88.2%
n Primary and secondary enrolment n Primary and secondary enrolment Male labour force participation, age 65+: n/a
Female labour force participation, age 65+: n/a
Education and workforce distribution

The Human Capital Report | 367
2.1: Country Profiles
HCI s
core
–2.5
–2.0
–1.5
–1.0
–0.5
0.0
0.5
1.0
1.5
2.0
2.5
Overall Index
Enablingenvironment
Workforce andemployment
Health andwellness
Education
MozambiqueEmployment types, educational requirements and educational attainment
Percent of population Educational in employment type attainment (%)
Tertiary requirements n/a n/a
Professionals n/a
Technicians and associate professionals n/a
Secondary requirements n/a n/a
Clerks n/a
Service workers and shop and market sales workers n/a
Skilled agricultural and fishery workers n/a
Craft and related trade workers n/a
Plant and machine operators and assemblers n/a
Primary requirements n/a n/a
Elementary occupations n/a
Various n/a
Legislators, senior officials and managers n/a
Unclassified n/a
Armed forces n/a
Spread of scores (by pillar and overall)
Mozambique
Low-income economies
Sub-Saharan Africa

2.1: Country Profiles
368 | The Human Capital Report
Pillar 1: Education Rank/122 Z-Score Country Value Sample Minimum Sample Maximum
Access
Primary enrolment rate (%) ...................................................................89.......................–0.331........................ 91...........................58 ......................... 100
Secondary enrolment rate (%) ..............................................................99.......................–2.375........................ 18...........................16 ......................... 100
Tertiary enrolment ratio (%) .................................................................109.......................–1.356.......................... 5.............................1 ......................... 103
Education gender gap2 .......................................................................109.......................–1.746................... 0.827......................0.645 ...................... 1.000
Quality
Internet access in schools1 .................................................................111.......................–1.351..................... 2.63........................1.64 ........................ 6.64
Quality of the education system1 ........................................................110.......................–1.229..................... 2.70........................1.99 ........................ 5.98
Quality of primary schools1 .................................................................117.......................–1.591..................... 2.21........................1.97 ........................ 6.82
Quality of math & science education1 .................................................113.......................–1.555..................... 2.55........................1.88 ........................ 6.29
Quality of management schools1 ........................................................117.......................–1.730..................... 2.85........................2.29 ........................ 6.09
Attainment
Primary education attainment (% population age 25+) ..........................—..............................— .........................— .............................5 ......................... 100
Secondary education attainment (% population age 25+) .....................—..............................— .........................— .............................2 ......................... 100
Tertiary education attainment (% population age 25+) ..........................—..............................— .........................— .............................0 ........................... 44
Pillar 2: Health and Wellness Rank/122 Z-Score Country Value Sample Minimum Sample Maximum
Survival
Infant mortality (per 1,000 live births) ..................................................115.......................–2.266........................ 72.............................2 ........................... 98
Life expectancy .................................................................................118.......................–2.375........................ 53...........................50 ........................... 83
Survival gender gap2 ............................................................................98.......................–0.865................... 0.961......................0.920 ...................... 0.980
Health
Stunting and wasting (% in children under 5) ........................................63.......................–0.984..................... 24.0..........................1.2 ........................ 36.5
Unhealthy life years (% of life expectancy) ..........................................113.......................–1.019........................ 21.............................8 ........................... 66
Deaths under 60 from non-communicable
diseases (% of all NCD deaths) ....................................................113.......................–1.519 ..................... 45.9 ..........................7.3 ........................ 55.8
Obesity (% of adults with BMI ≥ 30) .....................................................17.........................1.386....................... 5.4..........................1.1 ........................ 42.8
Business impact of non-communicable diseases1 ................................52.........................0.250..................... 4.59........................2.74 ........................ 5.87
Business impact of communicable diseases1 .....................................121.......................–2.108..................... 3.38........................3.13 ........................ 6.90
Well-being
Stress (% of respondents)7 ..................................................................13.........................1.067........................ 17.............................8 ........................... 69
Depression (% of respondents)7 ...........................................................24.........................0.615.......................... 8.............................2 ........................... 37
Services
Water, sanitation and hygiene (% with access) ...................................119.......................–2.620..................... 33.1........................31.1 ...................... 100.0
Healthcare quality1..............................................................................119.......................–1.324..................... 2.50........................1.78 ........................ 6.75
Healthcare accessibility1 .....................................................................101.......................–1.066..................... 3.36........................2.41 ........................ 6.75
Pillar 3: Workforce and Employment Rank/122 Z-Score Country Value Sample Minimum Sample Maximum
Participation
Labour force participation rate, age 15-64 (%) .......................................6.........................1.606..................... 84.9........................43.4 ........................ 90.6
Labour force participation rate, age 65+ (%) ...........................................2.........................2.954..................... 81.9..........................1.6 ........................ 91.2
Economic participation gender gap2 .......................................................7.........................1.317................... 0.799......................0.310 ...................... 0.839
Unemployment rate (%) ........................................................................—..............................— .........................— ..........................0.3 ........................ 32.0
Youth unemployment rate (%) ...............................................................—..............................— .........................— ..........................1.6 ........................ 48.2
Talent
Country capacity to attract talent1 ........................................................47.........................0.229..................... 3.68........................1.48 ........................ 6.08
Country capacity to retain talent1..........................................................72.......................–0.308..................... 3.23........................1.81 ........................ 5.97
Ease of finding skilled employees1 ......................................................106.......................–1.286..................... 3.09........................2.13 ........................ 5.69
Pay related to productivity1 .................................................................114.......................–1.769..................... 2.84........................2.37 ........................ 5.25
Capacity for innovation1......................................................................113.......................–1.145..................... 2.79........................2.31 ........................ 5.84
Index of Economic Complexity3 ............................................................99.......................–1.300................... –1.13......................–1.96 ........................ 2.37
Firm level technology absorption1 .........................................................92.......................–0.787..................... 4.25........................3.17 ........................ 6.23
Scientific and technical journal articles (per 1,000 people) ..................115.......................–0.624................... 0.001......................0.000 ...................... 1.242
Median age of the working population ................................................109.......................–1.277........................ 29...........................28 ........................... 42
Training
Staff training1 ......................................................................................102.......................–1.085..................... 3.35........................2.51 ........................ 5.57
Training services1 ................................................................................111.......................–1.245..................... 3.32........................2.67 ........................ 6.47
Mozambique

2.1: Country Profiles
NOTESIn the sections for Pillar 1, Pillar 2, Pillar 3 and Pillar 4, values under Country Value, Sample Minimum and Sample Maximum refer to underlying data for each variable.For further details and explanations, please refer to the section “How to Read the Country Profiles”.1 Survey data responses on a 1- to 7-scale (1 = worst score, 7 = best score)2 Data on a 0- to 1-scale (0 = worst score, 1 = best score)3 Data from -1.960 (worst score) to 2.367 (best score)4 Rank number on a list of 185 countries5 Index on a scale of 0 (perfect inequality) to 100 (perfect equality)6 International test scores7 Perception survey data. Percentage of yes responses.8 Score (1 = best, 7 = worst)9 Reported in relation to UK score (100)
The Human Capital Report | 369
MozambiquePillar 4: Enabling Environment Rank/122 Z-Score Country Value Sample Minimum Sample Maximum
Infrastructure
Mobile users (per 100 people) ............................................................120.......................–2.183........................ 33...........................17 ......................... 191
Internet users (per 100 people) ...........................................................112.......................–1.412.......................... 4.............................1 ........................... 95
Quality of domestic transport1 ............................................................113.......................–1.347 ..................... 3.30 ........................2.08 ........................ 6.51
Collaboration
State of cluster development1 ..............................................................89.......................–0.641..................... 3.43........................2.33 ........................ 5.49
Business and university R&D collaboration1 ..........................................83.......................–0.569 ..................... 3.27 ........................2.11 ........................ 5.84
Legal framework
Doing Business Index4 .......................................................................107.......................–1.281...................... 146.............................1 ......................... 180
Social safety net protection1 .................................................................95.......................–0.823..................... 2.89........................2.10 ........................ 6.26
Intellectual property protection and property rights1............................104.......................–0.999 ..................... 3.07 ........................1.62 ........................ 6.31
Social mobility
Social mobility1 ...................................................................................103.......................–0.961..................... 3.52........................2.78 ........................ 6.36
Additional indicatorsDemographics Value
Child dependency ratio (%)..................................................................... 88.2Aged dependency ratio (%) ...................................................................... 6.3Fertility rate (births per woman) ................................................................. 5.6Sex ratio at birth (female/male) ............................................................... 0.98Population below age 20 (%) .................................................................. 55.8Population above age 60 (%) .................................................................... 5.0
Education
Public spending on education (% of GDP) ................................................ 5.0Technical/vocational enrolment as % of total
enrolment in secondary school ............................................................. 4Adult literacy (%) ..................................................................................... 50.6Boys not in primary school (%) .................................................................... 7Girls not in primary school (%) ................................................................... 12Education poverty (% of children age 17-22
with less than 2-4 years schooling) ................................................ 0.967Private enrolment in primary school (% of primary) ................................... 1.5Private enrolment in secondary school (% of secondary) ........................ 12.5PIRLS6 .......................................................................................................—PISA math scores6 .....................................................................................—PISA reading scores6 ..................................................................................—PISA science scores6 .................................................................................—TIMSS 4th grade math6 ..............................................................................—TIMSS 4th grade science6 ..........................................................................—TIMSS 8th grade math6 ..............................................................................—TIMSS 8th grade science6 ..........................................................................—
Health
Prevalence of visual impairment (%) .......................................................... 5.6Public spending on health (% of GDP) ...................................................... 6.6Business impact of heart disease1 .......................................................... 4.25Business impact of cancer1 .................................................................... 4.74Business impact of mental illness1 .......................................................... 5.16Business impact of diabetes1 ................................................................. 4.36Business impact of chronic respiratory disease1 ..................................... 4.46Business impact of HIV/AIDS1 ................................................................ 3.31Business impact of tuberculosis1 ............................................................ 3.62Business impact of malaria1 ................................................................... 3.22
Society Value
Freedom in the World8................................................................................. 4Democracy Index (rank/165) .................................................................... 102Population living in urban area (%) .......................................................... 31.5Gini Index (income)5................................................................................ 45.7Accessibility of digital content1 ............................................................... 3.81Extent of virtual social networks use1 ..................................................... 4.36
Workforce
Economic activity (agriculture) — % of total activity ....................................—Economic activity (industry) — % of total activity ........................................—Economic activity (services) — % of total activity ........................................—GDP per person employed (US$) ......................................................... 5,306Cooperation in labour-employer relations1 .............................................. 3.60Emigration rate of the tertiary educated (%) ............................................ 22.6Labour force with tertiary education (%) .....................................................—Number of patent applications (per 1,000 people) .............................. 0.0017Hiring and firing practices1 ...................................................................... 3.61Retirement age, male .................................................................................—Retirement age, female ...............................................................................—Number of informal sector workers (1,000s) ...............................................—Total employed (1,000s) .............................................................................—Total unemployed (1,000s) ..........................................................................—Unemployment for 12 months or more
as a % of total unemployment .............................................................—Total youth not in education or employment (1,000s) .................................—Unemployment for 12 months or more (1,000s) .........................................—Global Innovation Index (rank/142) .......................................................... 121Global Talent Index (rank/60) ......................................................................—Quality of Labour Force (rank/60) ...............................................................—Talent Environment (rank/60) ......................................................................—IQ measure9 ........................................................................................... 70.4

2.1: Country Profiles
370 | The Human Capital Report
Rank/122 Score
Year
s (5
yea
r age
gro
ups)
Percent of total population
0–4
5–9
10–14
15–19
20–24
25–29
30–34
35–39
40–44
45–49
50–54
55–59
60–64
65–69
70–74
75–79
80–84
85–89
90–94
95–99
100+
0 1 2 3 4 5 6 7 88 7 6 5 4 3 2 1 0
NamibiaHuman Capital Index 2013 97 –0.539
Pillar 1: Education 98 –0.817
Pillar 2: Health and wellness 100 –0.560
Pillar 3: Workforce and employment 108 –0.620
Pillar 4: Enabling environment 61 –0.160
Key Indicators
Total population (1,000s) 2,179.0
Median age of population 20
GDP per capita PPP (constant 2005, international $) 6,453
GDP growth (annual %) 5.0
Male Female Additional indicators
n Total population n Total population Aged dependency: 5.9%
n Labour force participation n Labour force participation Youth dependency: 64.0%
n Primary and secondary enrolment n Primary and secondary enrolment Male labour force participation, age 65+: 0.1%
Female labour force participation, age 65+: 0.1%
Education and workforce distribution
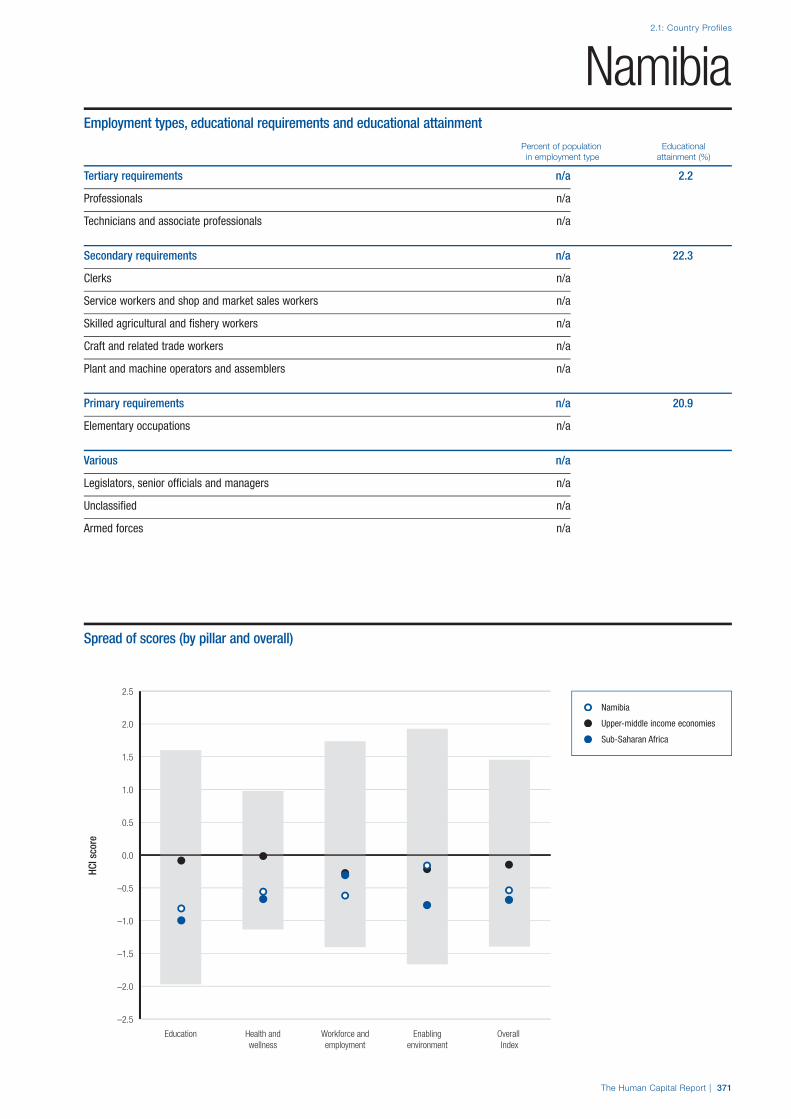
The Human Capital Report | 371
2.1: Country Profiles
HCI s
core
–2.5
–2.0
–1.5
–1.0
–0.5
0.0
0.5
1.0
1.5
2.0
2.5
Overall Index
Enablingenvironment
Workforce andemployment
Health andwellness
Education
NamibiaEmployment types, educational requirements and educational attainment
Percent of population Educational in employment type attainment (%)
Tertiary requirements n/a 2.2
Professionals n/a
Technicians and associate professionals n/a
Secondary requirements n/a 22.3
Clerks n/a
Service workers and shop and market sales workers n/a
Skilled agricultural and fishery workers n/a
Craft and related trade workers n/a
Plant and machine operators and assemblers n/a
Primary requirements n/a 20.9
Elementary occupations n/a
Various n/a
Legislators, senior officials and managers n/a
Unclassified n/a
Armed forces n/a
Spread of scores (by pillar and overall)
Namibia
Upper-middle income economies
Sub-Saharan Africa

2.1: Country Profiles
372 | The Human Capital Report
Pillar 1: Education Rank/122 Z-Score Country Value Sample Minimum Sample Maximum
Access
Primary enrolment rate (%) .................................................................100.......................–0.859........................ 86...........................58 ......................... 100
Secondary enrolment rate (%) ..............................................................80.......................–0.943........................ 51...........................16 ......................... 100
Tertiary enrolment ratio (%) .................................................................101.......................–1.201.......................... 9.............................1 ......................... 103
Education gender gap2 .........................................................................26.........................0.533................... 0.999......................0.645 ...................... 1.000
Quality
Internet access in schools1 ...................................................................97.......................–0.864..................... 3.24........................1.64 ........................ 6.64
Quality of the education system1 ........................................................102.......................–0.904..................... 2.99........................1.99 ........................ 5.98
Quality of primary schools1 ...................................................................94.......................–0.836..................... 3.03........................1.97 ........................ 6.82
Quality of math & science education1 .................................................107.......................–1.231..................... 2.86........................1.88 ........................ 6.29
Quality of management schools1 ........................................................105.......................–1.048..................... 3.42........................2.29 ........................ 6.09
Attainment
Primary education attainment (% population age 25+) ..........................—..............................— .........................— .............................5 ......................... 100
Secondary education attainment (% population age 25+) .....................—..............................— .........................— .............................2 ......................... 100
Tertiary education attainment (% population age 25+) ..........................—..............................— .........................— .............................0 ........................... 44
Pillar 2: Health and Wellness Rank/122 Z-Score Country Value Sample Minimum Sample Maximum
Survival
Infant mortality (per 1,000 live births) ....................................................94.......................–0.380........................ 30.............................2 ........................... 98
Life expectancy .................................................................................101.......................–0.917........................ 65...........................50 ........................... 83
Survival gender gap2 ............................................................................94.......................–0.347................... 0.967......................0.920 ...................... 0.980
Health
Stunting and wasting (% in children under 5) ........................................49.......................–0.369..................... 18.6..........................1.2 ........................ 36.5
Unhealthy life years (% of life expectancy) ..........................................108.......................–0.893........................ 20.............................8 ........................... 66
Deaths under 60 from non-communicable
diseases (% of all NCD deaths) ....................................................104.......................–1.275 ..................... 42.8 ..........................7.3 ........................ 55.8
Obesity (% of adults with BMI ≥ 30) .....................................................31.........................0.806..................... 10.9..........................1.1 ........................ 42.8
Business impact of non-communicable diseases1 ................................63.........................0.048..................... 4.50........................2.74 ........................ 5.87
Business impact of communicable diseases1 .....................................116.......................–1.963..................... 3.53........................3.13 ........................ 6.90
Well-being
Stress (% of respondents)7 ..................................................................—..............................— .........................— .............................8 ........................... 69
Depression (% of respondents)7 ...........................................................65.......................–0.022........................ 12.............................2 ........................... 37
Services
Water, sanitation and hygiene (% with access) ...................................102.......................–1.098..................... 62.7........................31.1 ...................... 100.0
Healthcare quality1................................................................................67.......................–0.447..................... 3.56........................1.78 ........................ 6.75
Healthcare accessibility1 .......................................................................70.......................–0.421..................... 4.15........................2.41 ........................ 6.75
Pillar 3: Workforce and Employment Rank/122 Z-Score Country Value Sample Minimum Sample Maximum
Participation
Labour force participation rate, age 15-64 (%) .....................................82.......................–0.326..................... 66.0........................43.4 ........................ 90.6
Labour force participation rate, age 65+ (%) .........................................33.........................0.384..................... 32.1..........................1.6 ........................ 91.2
Economic participation gender gap2 .....................................................38.........................0.564................... 0.710......................0.310 ...................... 0.839
Unemployment rate (%) ......................................................................106.......................–2.515..................... 21.9..........................0.3 ........................ 32.0
Youth unemployment rate (%) .............................................................101.......................–2.375..................... 41.7..........................1.6 ........................ 48.2
Talent
Country capacity to attract talent1 ........................................................57.........................0.018..................... 3.46........................1.48 ........................ 6.08
Country capacity to retain talent1..........................................................60.......................–0.074..................... 3.46........................1.81 ........................ 5.97
Ease of finding skilled employees1 ......................................................113.......................–1.495..................... 2.95........................2.13 ........................ 5.69
Pay related to productivity1 ...................................................................87.......................–0.553..................... 3.58........................2.37 ........................ 5.25
Capacity for innovation1........................................................................73.......................–0.405..................... 3.38........................2.31 ........................ 5.84
Index of Economic Complexity3 ............................................................68.......................–0.434................... –0.30......................–1.96 ........................ 2.37
Firm level technology absorption1 .........................................................54.........................0.101..................... 4.89........................3.17 ........................ 6.23
Scientific and technical journal articles (per 1,000 people) ....................87.......................–0.608................... 0.006......................0.000 ...................... 1.242
Median age of the working population ................................................100.......................–1.150........................ 30...........................28 ........................... 42
Training
Staff training1 ........................................................................................60.......................–0.043..................... 4.02........................2.51 ........................ 5.57
Training services1 ................................................................................103.......................–1.007..................... 3.51........................2.67 ........................ 6.47
Namibia

2.1: Country Profiles
NOTESIn the sections for Pillar 1, Pillar 2, Pillar 3 and Pillar 4, values under Country Value, Sample Minimum and Sample Maximum refer to underlying data for each variable.For further details and explanations, please refer to the section “How to Read the Country Profiles”.1 Survey data responses on a 1- to 7-scale (1 = worst score, 7 = best score)2 Data on a 0- to 1-scale (0 = worst score, 1 = best score)3 Data from -1.960 (worst score) to 2.367 (best score)4 Rank number on a list of 185 countries5 Index on a scale of 0 (perfect inequality) to 100 (perfect equality)6 International test scores7 Perception survey data. Percentage of yes responses.8 Score (1 = best, 7 = worst)9 Reported in relation to UK score (100)
The Human Capital Report | 373
NamibiaPillar 4: Enabling Environment Rank/122 Z-Score Country Value Sample Minimum Sample Maximum
Infrastructure
Mobile users (per 100 people) ..............................................................84.......................–0.314........................ 96...........................17 ......................... 191
Internet users (per 100 people) ...........................................................101.......................–1.137........................ 12.............................1 ........................... 95
Quality of domestic transport1 ..............................................................57.........................0.068 ..................... 4.53 ........................2.08 ........................ 6.51
Collaboration
State of cluster development1 ..............................................................71.......................–0.341..................... 3.65........................2.33 ........................ 5.49
Business and university R&D collaboration1 ..........................................63.......................–0.291 ..................... 3.52 ........................2.11 ........................ 5.84
Legal framework
Doing Business Index4 .........................................................................69.......................–0.137........................ 87.............................1 ......................... 180
Social safety net protection1 .................................................................51.........................0.007..................... 3.79........................2.10 ........................ 6.26
Intellectual property protection and property rights1..............................34.........................0.599 ..................... 4.70 ........................1.62 ........................ 6.31
Social mobility
Social mobility1 .....................................................................................53.........................0.107..................... 4.48........................2.78 ........................ 6.36
Additional indicatorsDemographics Value
Child dependency ratio (%)..................................................................... 64.0Aged dependency ratio (%) ...................................................................... 5.9Fertility rate (births per woman) ................................................................. 3.4Sex ratio at birth (female/male) ............................................................... 0.97Population below age 20 (%) .................................................................. 49.3Population above age 60 (%) .................................................................... 5.3
Education
Public spending on education (% of GDP) ................................................ 8.4Technical/vocational enrolment as % of total
enrolment in secondary school ............................................................—Adult literacy (%) ..................................................................................... 76.5Boys not in primary school (%) .................................................................. 16Girls not in primary school (%) ................................................................... 12Education poverty (% of children age 17-22
with less than 2-4 years schooling) ................................................ 0.145Private enrolment in primary school (% of primary) ................................... 4.9Private enrolment in secondary school (% of secondary) .......................... 4.9PIRLS6 .......................................................................................................—PISA math scores6 .....................................................................................—PISA reading scores6 ..................................................................................—PISA science scores6 .................................................................................—TIMSS 4th grade math6 ..............................................................................—TIMSS 4th grade science6 ..........................................................................—TIMSS 8th grade math6 ..............................................................................—TIMSS 8th grade science6 ..........................................................................—
Health
Prevalence of visual impairment (%) .......................................................... 3.3Public spending on health (% of GDP) ...................................................... 5.3Business impact of heart disease1 .......................................................... 4.40Business impact of cancer1 .................................................................... 4.30Business impact of mental illness1 .......................................................... 4.94Business impact of diabetes1 ................................................................. 4.36Business impact of chronic respiratory disease1 ..................................... 4.52Business impact of HIV/AIDS1 ................................................................ 2.88Business impact of tuberculosis1 ............................................................ 3.44Business impact of malaria1 ................................................................... 4.26
Society Value
Freedom in the World8................................................................................. 2Democracy Index (rank/165) ...................................................................... 72Population living in urban area (%) .......................................................... 39.0Gini Index (income)5................................................................................ 63.9Accessibility of digital content1 ............................................................... 4.49Extent of virtual social networks use1 ..................................................... 5.47
Workforce
Economic activity (agriculture) — % of total activity ................................ 16.3Economic activity (industry) — % of total activity .................................... 17.7Economic activity (services) — % of total activity .................................... 65.9GDP per person employed (US$) ...............................................................—Cooperation in labour-employer relations1 .............................................. 4.02Emigration rate of the tertiary educated (%) .............................................. 3.4Labour force with tertiary education (%) ................................................... 8.0Number of patent applications (per 1,000 people) ......................................—Hiring and firing practices1 ...................................................................... 2.88Retirement age, male .................................................................................—Retirement age, female ...............................................................................—Number of informal sector workers (1,000s) ............................................ 121Total employed (1,000s) .......................................................................... 385Total unemployed (1,000s) ....................................................................... 108Unemployment for 12 months or more
as a % of total unemployment .............................................................—Total youth not in education or employment (1,000s) .................................—Unemployment for 12 months or more (1,000s) .........................................—Global Innovation Index (rank/142) .......................................................... 109Global Talent Index (rank/60) ......................................................................—Quality of Labour Force (rank/60) ...............................................................—Talent Environment (rank/60) ......................................................................—IQ measure9 ........................................................................................... 70.4

2.1: Country Profiles
374 | The Human Capital Report
Rank/122 Score
Year
s (5
yea
r age
gro
ups)
Percent of total population
0–4
5–9
10–14
15–19
20–24
25–29
30–34
35–39
40–44
45–49
50–54
55–59
60–64
65–69
70–74
75–79
80–84
85–89
90–94
95–99
100+
0 1 2 3 4 55 4 3 2 1 0
NetherlandsHuman Capital Index 2013 4 1.161
Pillar 1: Education 7 1.106
Pillar 2: Health and wellness 4 0.901
Pillar 3: Workforce and employment 8 1.150
Pillar 4: Enabling environment 4 1.484
Key Indicators
Total population (1,000s) 16,615.2
Median age of population 41
GDP per capita PPP (constant 2005, international $) 36,599
GDP growth (annual %) –1.0
Male Female Additional indicators
n Total population n Total population Aged dependency: 23.0%
n Labour force participation n Labour force participation Youth dependency: 26.1%
n Primary and secondary enrolment n Primary and secondary enrolment Male labour force participation, age 65+: 0.6%
Female labour force participation, age 65+: 0.3%
Education and workforce distribution
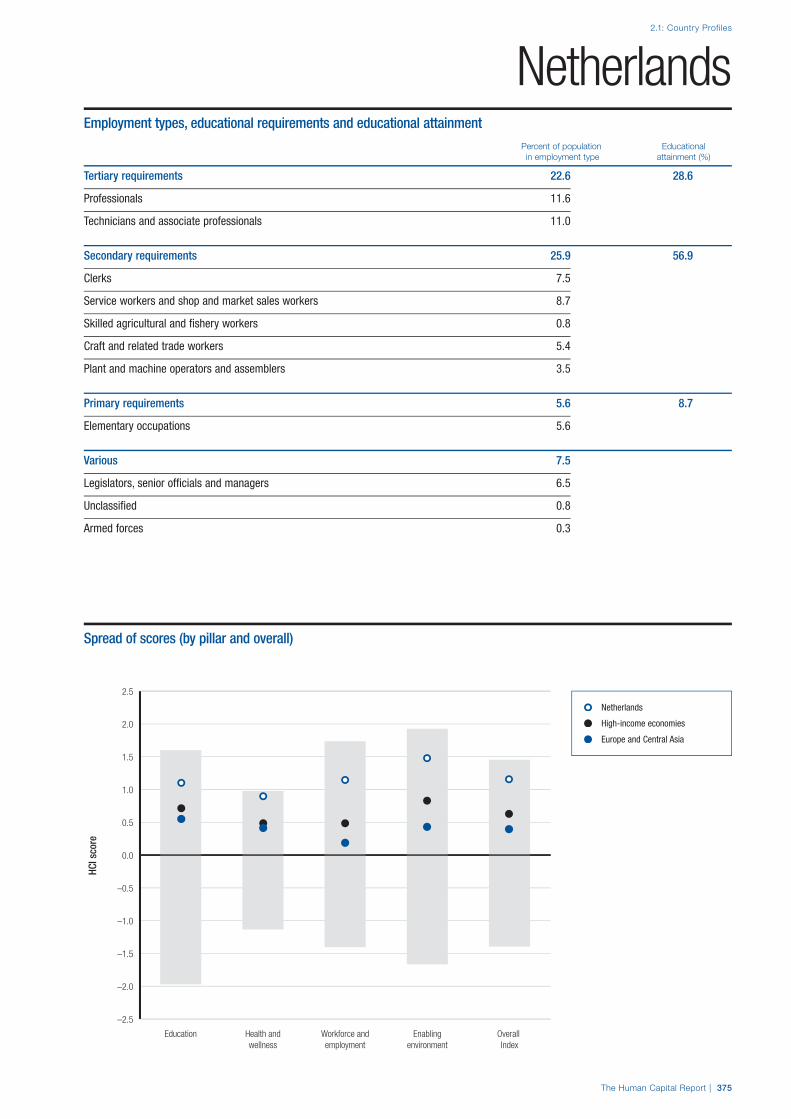
The Human Capital Report | 375
2.1: Country Profiles
HCI s
core
–2.5
–2.0
–1.5
–1.0
–0.5
0.0
0.5
1.0
1.5
2.0
2.5
Overall Index
Enablingenvironment
Workforce andemployment
Health andwellness
Education
NetherlandsEmployment types, educational requirements and educational attainment
Percent of population Educational in employment type attainment (%)
Tertiary requirements 22.6 28.6
Professionals 11.6
Technicians and associate professionals 11.0
Secondary requirements 25.9 56.9
Clerks 7.5
Service workers and shop and market sales workers 8.7
Skilled agricultural and fishery workers 0.8
Craft and related trade workers 5.4
Plant and machine operators and assemblers 3.5
Primary requirements 5.6 8.7
Elementary occupations 5.6
Various 7.5
Legislators, senior officials and managers 6.5
Unclassified 0.8
Armed forces 0.3
Spread of scores (by pillar and overall)
Netherlands
High-income economies
Europe and Central Asia

2.1: Country Profiles
376 | The Human Capital Report
Pillar 1: Education Rank/122 Z-Score Country Value Sample Minimum Sample Maximum
Access
Primary enrolment rate (%) .....................................................................2.........................0.781...................... 100...........................58 ......................... 100
Secondary enrolment rate (%) ..............................................................33.........................0.660........................ 87...........................16 ......................... 100
Tertiary enrolment ratio (%) ...................................................................24.........................0.944........................ 65.............................1 ......................... 103
Education gender gap2 ...........................................................................1.........................0.548................... 1.000......................0.645 ...................... 1.000
Quality
Internet access in schools1 .....................................................................6.........................1.541..................... 6.25........................1.64 ........................ 6.64
Quality of the education system1 ..........................................................12.........................1.534..................... 5.17........................1.99 ........................ 5.98
Quality of primary schools1 ...................................................................10.........................1.585..................... 5.66........................1.97 ........................ 6.82
Quality of math & science education1 ...................................................11.........................1.330..................... 5.31........................1.88 ........................ 6.29
Quality of management schools1 ............................................................8.........................1.632..................... 5.66........................2.29 ........................ 6.09
Attainment
Primary education attainment (% population age 25+) ..........................18.........................0.863........................ 98.............................5 ......................... 100
Secondary education attainment (% population age 25+) .....................20.........................0.972........................ 89.............................2 ......................... 100
Tertiary education attainment (% population age 25+) ..........................20.........................0.886........................ 29.............................0 ........................... 44
Pillar 2: Health and Wellness Rank/122 Z-Score Country Value Sample Minimum Sample Maximum
Survival
Infant mortality (per 1,000 live births) ......................................................8.........................0.832.......................... 3.............................2 ........................... 98
Life expectancy ...................................................................................14.........................1.028........................ 81...........................50 ........................... 83
Survival gender gap2 ............................................................................84.......................–0.117................... 0.970......................0.920 ...................... 0.980
Health
Stunting and wasting (% in children under 5) ........................................—..............................— .........................— ..........................1.2 ........................ 36.5
Unhealthy life years (% of life expectancy) ............................................10.........................0.791........................ 10.............................8 ........................... 66
Deaths under 60 from non-communicable
diseases (% of all NCD deaths) ......................................................17.........................1.147 ..................... 12.0 ..........................7.3 ........................ 55.8
Obesity (% of adults with BMI ≥ 30) .....................................................38.........................0.247..................... 16.2..........................1.1 ........................ 42.8
Business impact of non-communicable diseases1 ................................19.........................0.987..................... 4.92........................2.74 ........................ 5.87
Business impact of communicable diseases1 .........................................9.........................1.166..................... 6.64........................3.13 ........................ 6.90
Well-being
Stress (% of respondents)7 ..................................................................33.........................0.370........................ 26.............................8 ........................... 69
Depression (% of respondents)7 ...........................................................12.........................1.093.......................... 5.............................2 ........................... 37
Services
Water, sanitation and hygiene (% with access) .......................................1.........................0.815................... 100.0........................31.1 ...................... 100.0
Healthcare quality1..................................................................................6.........................1.741..................... 6.23........................1.78 ........................ 6.75
Healthcare accessibility1 .........................................................................7.........................1.618..................... 6.64........................2.41 ........................ 6.75
Pillar 3: Workforce and Employment Rank/122 Z-Score Country Value Sample Minimum Sample Maximum
Participation
Labour force participation rate, age 15-64 (%) .....................................21.........................0.931..................... 78.3........................43.4 ........................ 90.6
Labour force participation rate, age 65+ (%) .......................................102.......................–0.968....................... 5.9..........................1.6 ........................ 91.2
Economic participation gender gap2 .....................................................21.........................0.969................... 0.758......................0.310 ...................... 0.839
Unemployment rate (%) ........................................................................15.........................0.905....................... 4.0..........................0.3 ........................ 32.0
Youth unemployment rate (%) ...............................................................13.........................1.019....................... 8.7..........................1.6 ........................ 48.2
Talent
Country capacity to attract talent1 ........................................................14.........................1.252..................... 4.73........................1.48 ........................ 6.08
Country capacity to retain talent1..........................................................13.........................1.347..................... 4.84........................1.81 ........................ 5.97
Ease of finding skilled employees1 ........................................................15.........................1.263..................... 4.86........................2.13 ........................ 5.69
Pay related to productivity1 ...................................................................69.......................–0.160..................... 3.82........................2.37 ........................ 5.25
Capacity for innovation1..........................................................................9.........................1.764..................... 5.11........................2.31 ........................ 5.84
Index of Economic Complexity3 ............................................................21.........................0.986..................... 1.05......................–1.96 ........................ 2.37
Firm level technology absorption1 .........................................................20.........................1.215..................... 5.68........................3.17 ........................ 6.23
Scientific and technical journal articles (per 1,000 people) ......................6.........................2.369................... 0.898......................0.000 ...................... 1.242
Median age of the working population ....................................................3.........................1.537........................ 41...........................28 ........................... 42
Training
Staff training1 ..........................................................................................9.........................1.713..................... 5.14........................2.51 ........................ 5.57
Training services1 ....................................................................................3.........................2.262..................... 6.09........................2.67 ........................ 6.47
Netherlands
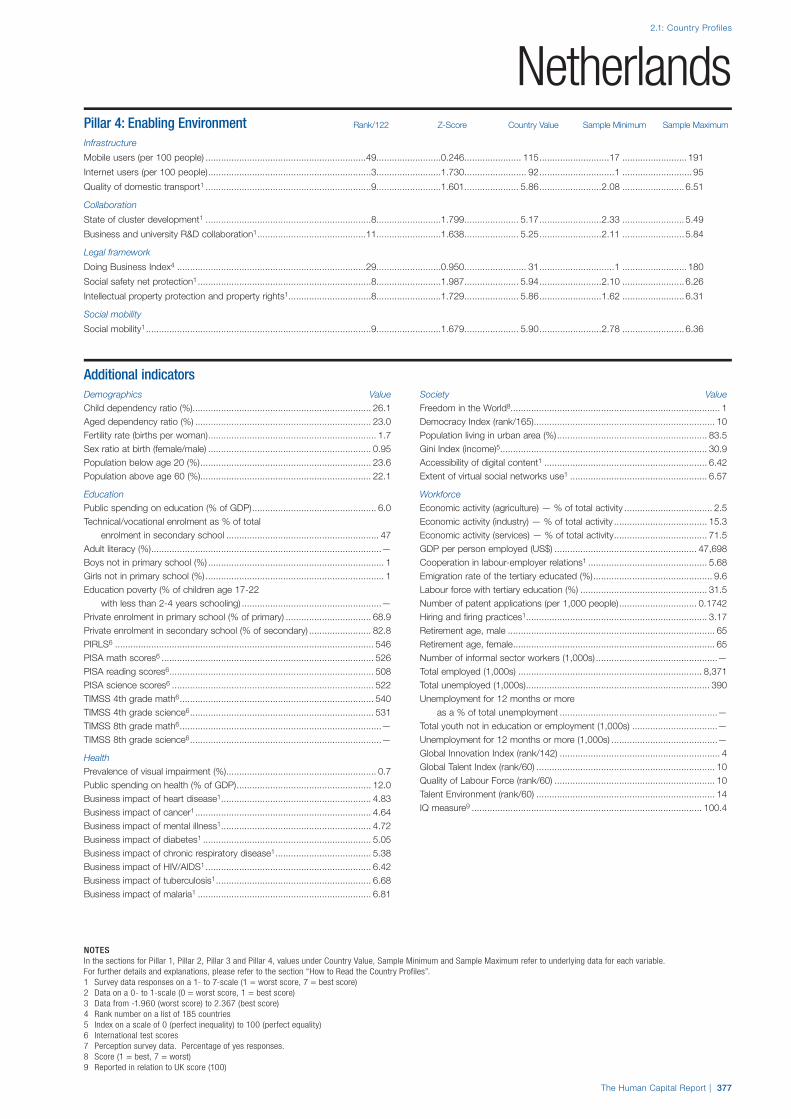
2.1: Country Profiles
NOTESIn the sections for Pillar 1, Pillar 2, Pillar 3 and Pillar 4, values under Country Value, Sample Minimum and Sample Maximum refer to underlying data for each variable.For further details and explanations, please refer to the section “How to Read the Country Profiles”.1 Survey data responses on a 1- to 7-scale (1 = worst score, 7 = best score)2 Data on a 0- to 1-scale (0 = worst score, 1 = best score)3 Data from -1.960 (worst score) to 2.367 (best score)4 Rank number on a list of 185 countries5 Index on a scale of 0 (perfect inequality) to 100 (perfect equality)6 International test scores7 Perception survey data. Percentage of yes responses.8 Score (1 = best, 7 = worst)9 Reported in relation to UK score (100)
The Human Capital Report | 377
NetherlandsPillar 4: Enabling Environment Rank/122 Z-Score Country Value Sample Minimum Sample Maximum
Infrastructure
Mobile users (per 100 people) ..............................................................49.........................0.246...................... 115...........................17 ......................... 191
Internet users (per 100 people) ...............................................................3.........................1.730........................ 92.............................1 ........................... 95
Quality of domestic transport1 ................................................................9.........................1.601..................... 5.86........................2.08 ........................ 6.51
Collaboration
State of cluster development1 ................................................................8.........................1.799..................... 5.17........................2.33 ........................ 5.49
Business and university R&D collaboration1 ..........................................11.........................1.638..................... 5.25........................2.11 ........................ 5.84
Legal framework
Doing Business Index4 .........................................................................29.........................0.950........................ 31.............................1 ......................... 180
Social safety net protection1 ...................................................................8.........................1.987..................... 5.94........................2.10 ........................ 6.26
Intellectual property protection and property rights1................................8.........................1.729 ..................... 5.86 ........................1.62 ........................ 6.31
Social mobility
Social mobility1 .......................................................................................9.........................1.679..................... 5.90........................2.78 ........................ 6.36
Additional indicatorsDemographics Value
Child dependency ratio (%)..................................................................... 26.1Aged dependency ratio (%) .................................................................... 23.0Fertility rate (births per woman) ................................................................. 1.7Sex ratio at birth (female/male) ............................................................... 0.95Population below age 20 (%) .................................................................. 23.6Population above age 60 (%) .................................................................. 22.1
Education
Public spending on education (% of GDP) ................................................ 6.0Technical/vocational enrolment as % of total
enrolment in secondary school ........................................................... 47Adult literacy (%) .........................................................................................—Boys not in primary school (%) .................................................................... 1Girls not in primary school (%) ..................................................................... 1Education poverty (% of children age 17-22
with less than 2-4 years schooling) ......................................................—Private enrolment in primary school (% of primary) ................................. 68.9Private enrolment in secondary school (% of secondary) ........................ 82.8PIRLS6 .................................................................................................... 546PISA math scores6 .................................................................................. 526PISA reading scores6 ............................................................................... 508PISA science scores6 .............................................................................. 522TIMSS 4th grade math6 ........................................................................... 540TIMSS 4th grade science6 ....................................................................... 531TIMSS 8th grade math6 ..............................................................................—TIMSS 8th grade science6 ..........................................................................—
Health
Prevalence of visual impairment (%) .......................................................... 0.7Public spending on health (% of GDP) .................................................... 12.0Business impact of heart disease1 .......................................................... 4.83Business impact of cancer1 .................................................................... 4.64Business impact of mental illness1 .......................................................... 4.72Business impact of diabetes1 ................................................................. 5.05Business impact of chronic respiratory disease1 ..................................... 5.38Business impact of HIV/AIDS1 ................................................................ 6.42Business impact of tuberculosis1 ............................................................ 6.68Business impact of malaria1 ................................................................... 6.81
Society Value
Freedom in the World8................................................................................. 1Democracy Index (rank/165) ...................................................................... 10Population living in urban area (%) .......................................................... 83.5Gini Index (income)5................................................................................ 30.9Accessibility of digital content1 ............................................................... 6.42Extent of virtual social networks use1 ..................................................... 6.57
Workforce
Economic activity (agriculture) — % of total activity .................................. 2.5Economic activity (industry) — % of total activity .................................... 15.3Economic activity (services) — % of total activity .................................... 71.5GDP per person employed (US$) ....................................................... 47,698Cooperation in labour-employer relations1 .............................................. 5.68Emigration rate of the tertiary educated (%) .............................................. 9.6Labour force with tertiary education (%) ................................................. 31.5Number of patent applications (per 1,000 people) .............................. 0.1742Hiring and firing practices1 ...................................................................... 3.17Retirement age, male ................................................................................ 65Retirement age, female .............................................................................. 65Number of informal sector workers (1,000s) ...............................................—Total employed (1,000s) ....................................................................... 8,371Total unemployed (1,000s) ....................................................................... 390Unemployment for 12 months or more
as a % of total unemployment .............................................................—Total youth not in education or employment (1,000s) .................................—Unemployment for 12 months or more (1,000s) .........................................—Global Innovation Index (rank/142) .............................................................. 4Global Talent Index (rank/60) ..................................................................... 10Quality of Labour Force (rank/60) .............................................................. 10Talent Environment (rank/60) ..................................................................... 14IQ measure9 ......................................................................................... 100.4

2.1: Country Profiles
378 | The Human Capital Report
Rank/122 Score
Year
s (5
yea
r age
gro
ups)
Percent of total population
0–4
5–9
10–14
15–19
20–24
25–29
30–34
35–39
40–44
45–49
50–54
55–59
60–64
65–69
70–74
75–79
80–84
85–89
90–94
95–99
100+
0 1 2 3 4 55 4 3 2 1 0
New ZealandHuman Capital Index 2013 12 0.978
Pillar 1: Education 5 1.204
Pillar 2: Health and wellness 15 0.743
Pillar 3: Workforce and employment 17 0.804
Pillar 4: Enabling environment 18 1.163
Key Indicators
Total population (1,000s) 4,368.1
Median age of population 37
GDP per capita PPP (constant 2005, international $) 25,689
GDP growth (annual %) 3.0
Male Female Additional indicators
n Total population n Total population Aged dependency: 19.6%
n Labour force participation n Labour force participation Youth dependency: 30.8%
n Primary and secondary enrolment n Primary and secondary enrolment Male labour force participation, age 65+: 1.3%
Female labour force participation, age 65+: 0.8%
Education and workforce distribution

The Human Capital Report | 379
2.1: Country Profiles
HCI s
core
–2.5
–2.0
–1.5
–1.0
–0.5
0.0
0.5
1.0
1.5
2.0
2.5
Overall Index
Enablingenvironment
Workforce andemployment
Health andwellness
Education
New ZealandEmployment types, educational requirements and educational attainment
Percent of population Educational in employment type attainment (%)
Tertiary requirements 18.4 34.8
Professionals 10.6
Technicians and associate professionals 7.8
Secondary requirements 32.2 n/a
Clerks 7.6
Service workers and shop and market sales workers 9.4
Skilled agricultural and fishery workers 4.2
Craft and related trade workers 5.9
Plant and machine operators and assemblers 5.1
Primary requirements 3.5 n/a
Elementary occupations 3.5
Various 8.9
Legislators, senior officials and managers 8.6
Unclassified n/a
Armed forces 0.3
Spread of scores (by pillar and overall)
New Zealand
High-income economies
Asia and the Pacific
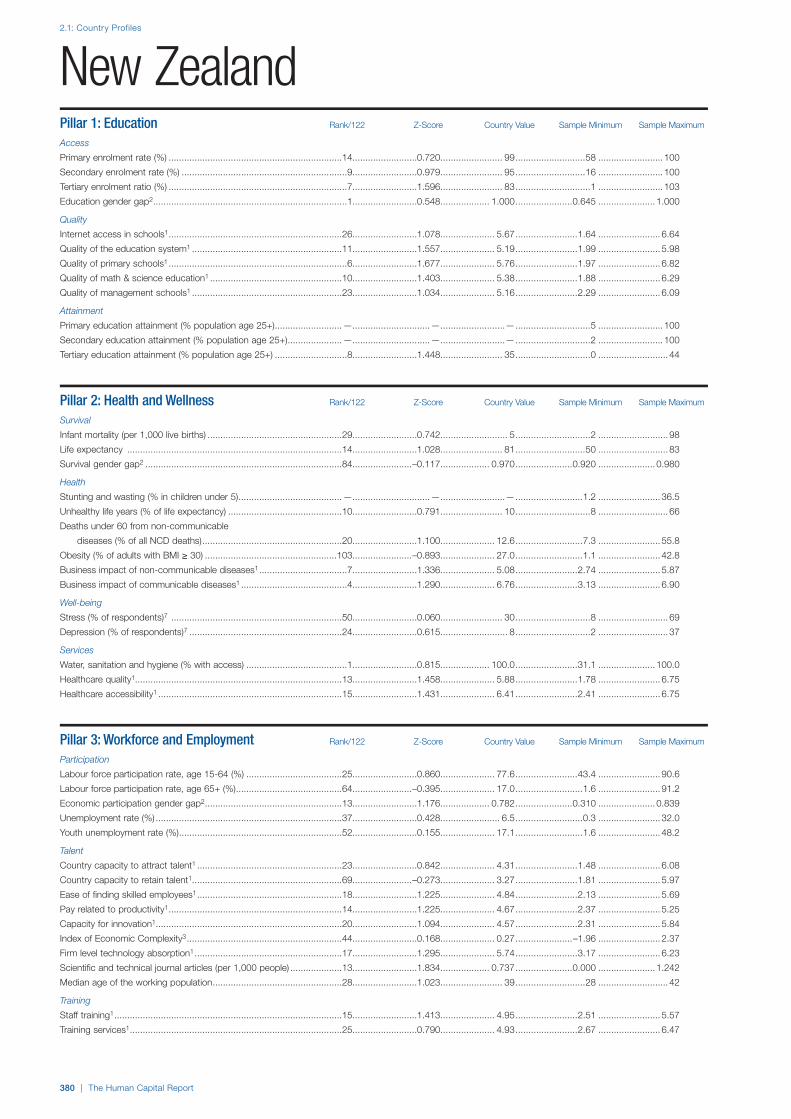
2.1: Country Profiles
380 | The Human Capital Report
Pillar 1: Education Rank/122 Z-Score Country Value Sample Minimum Sample Maximum
Access
Primary enrolment rate (%) ...................................................................14.........................0.720........................ 99...........................58 ......................... 100
Secondary enrolment rate (%) ................................................................9.........................0.979........................ 95...........................16 ......................... 100
Tertiary enrolment ratio (%) .....................................................................7.........................1.596........................ 83.............................1 ......................... 103
Education gender gap2 ...........................................................................1.........................0.548................... 1.000......................0.645 ...................... 1.000
Quality
Internet access in schools1 ...................................................................26.........................1.078..................... 5.67........................1.64 ........................ 6.64
Quality of the education system1 ..........................................................11.........................1.557..................... 5.19........................1.99 ........................ 5.98
Quality of primary schools1 .....................................................................6.........................1.677..................... 5.76........................1.97 ........................ 6.82
Quality of math & science education1 ...................................................10.........................1.403..................... 5.38........................1.88 ........................ 6.29
Quality of management schools1 ..........................................................23.........................1.034..................... 5.16........................2.29 ........................ 6.09
Attainment
Primary education attainment (% population age 25+) ..........................—..............................— .........................— .............................5 ......................... 100
Secondary education attainment (% population age 25+) .....................—..............................— .........................— .............................2 ......................... 100
Tertiary education attainment (% population age 25+) ............................8.........................1.448 ........................ 35 .............................0 ........................... 44
Pillar 2: Health and Wellness Rank/122 Z-Score Country Value Sample Minimum Sample Maximum
Survival
Infant mortality (per 1,000 live births) ....................................................29.........................0.742.......................... 5.............................2 ........................... 98
Life expectancy ...................................................................................14.........................1.028........................ 81...........................50 ........................... 83
Survival gender gap2 ............................................................................84.......................–0.117................... 0.970......................0.920 ...................... 0.980
Health
Stunting and wasting (% in children under 5) ........................................—..............................— .........................— ..........................1.2 ........................ 36.5
Unhealthy life years (% of life expectancy) ............................................10.........................0.791........................ 10.............................8 ........................... 66
Deaths under 60 from non-communicable
diseases (% of all NCD deaths) ......................................................20.........................1.100 ..................... 12.6 ..........................7.3 ........................ 55.8
Obesity (% of adults with BMI ≥ 30) ...................................................103.......................–0.893..................... 27.0..........................1.1 ........................ 42.8
Business impact of non-communicable diseases1 ..................................7.........................1.336..................... 5.08........................2.74 ........................ 5.87
Business impact of communicable diseases1 .........................................4.........................1.290..................... 6.76........................3.13 ........................ 6.90
Well-being
Stress (% of respondents)7 ..................................................................50.........................0.060........................ 30.............................8 ........................... 69
Depression (% of respondents)7 ...........................................................24.........................0.615.......................... 8.............................2 ........................... 37
Services
Water, sanitation and hygiene (% with access) .......................................1.........................0.815................... 100.0........................31.1 ...................... 100.0
Healthcare quality1................................................................................13.........................1.458..................... 5.88........................1.78 ........................ 6.75
Healthcare accessibility1 .......................................................................15.........................1.431..................... 6.41........................2.41 ........................ 6.75
Pillar 3: Workforce and Employment Rank/122 Z-Score Country Value Sample Minimum Sample Maximum
Participation
Labour force participation rate, age 15-64 (%) .....................................25.........................0.860..................... 77.6........................43.4 ........................ 90.6
Labour force participation rate, age 65+ (%) .........................................64.......................–0.395..................... 17.0..........................1.6 ........................ 91.2
Economic participation gender gap2 .....................................................13.........................1.176................... 0.782......................0.310 ...................... 0.839
Unemployment rate (%) ........................................................................37.........................0.428....................... 6.5..........................0.3 ........................ 32.0
Youth unemployment rate (%) ...............................................................52.........................0.155..................... 17.1..........................1.6 ........................ 48.2
Talent
Country capacity to attract talent1 ........................................................23.........................0.842..................... 4.31........................1.48 ........................ 6.08
Country capacity to retain talent1..........................................................69.......................–0.273..................... 3.27........................1.81 ........................ 5.97
Ease of finding skilled employees1 ........................................................18.........................1.225..................... 4.84........................2.13 ........................ 5.69
Pay related to productivity1 ...................................................................14.........................1.225..................... 4.67........................2.37 ........................ 5.25
Capacity for innovation1........................................................................20.........................1.094..................... 4.57........................2.31 ........................ 5.84
Index of Economic Complexity3 ............................................................44.........................0.168..................... 0.27......................–1.96 ........................ 2.37
Firm level technology absorption1 .........................................................17.........................1.295..................... 5.74........................3.17 ........................ 6.23
Scientific and technical journal articles (per 1,000 people) ....................13.........................1.834................... 0.737......................0.000 ...................... 1.242
Median age of the working population ..................................................28.........................1.023........................ 39...........................28 ........................... 42
Training
Staff training1 ........................................................................................15.........................1.413..................... 4.95........................2.51 ........................ 5.57
Training services1 ..................................................................................25.........................0.790..................... 4.93........................2.67 ........................ 6.47
New Zealand

2.1: Country Profiles
NOTESIn the sections for Pillar 1, Pillar 2, Pillar 3 and Pillar 4, values under Country Value, Sample Minimum and Sample Maximum refer to underlying data for each variable.For further details and explanations, please refer to the section “How to Read the Country Profiles”.1 Survey data responses on a 1- to 7-scale (1 = worst score, 7 = best score)2 Data on a 0- to 1-scale (0 = worst score, 1 = best score)3 Data from -1.960 (worst score) to 2.367 (best score)4 Rank number on a list of 185 countries5 Index on a scale of 0 (perfect inequality) to 100 (perfect equality)6 International test scores7 Perception survey data. Percentage of yes responses.8 Score (1 = best, 7 = worst)9 Reported in relation to UK score (100)
The Human Capital Report | 381
New ZealandPillar 4: Enabling Environment Rank/122 Z-Score Country Value Sample Minimum Sample Maximum
Infrastructure
Mobile users (per 100 people) ..............................................................55.........................0.062...................... 109...........................17 ......................... 191
Internet users (per 100 people) ...............................................................9.........................1.505........................ 86.............................1 ........................... 95
Quality of domestic transport1 ..............................................................37.........................0.483 ..................... 4.89 ........................2.08 ........................ 6.51
Collaboration
State of cluster development1 ..............................................................63.......................–0.121..................... 3.81........................2.33 ........................ 5.49
Business and university R&D collaboration1 ..........................................19.........................1.209 ..................... 4.87 ........................2.11 ........................ 5.84
Legal framework
Doing Business Index4 ...........................................................................2.........................1.493.......................... 3.............................1 ......................... 180
Social safety net protection1 ...................................................................9.........................1.869..................... 5.81........................2.10 ........................ 6.26
Intellectual property protection and property rights1................................5.........................1.857 ..................... 5.99 ........................1.62 ........................ 6.31
Social mobility
Social mobility1 .......................................................................................3.........................2.110..................... 6.29........................2.78 ........................ 6.36
Additional indicatorsDemographics Value
Child dependency ratio (%)..................................................................... 30.8Aged dependency ratio (%) .................................................................... 19.6Fertility rate (births per woman) ................................................................. 2.1Sex ratio at birth (female/male) ............................................................... 0.95Population below age 20 (%) .................................................................. 27.8Population above age 60 (%) .................................................................. 18.3
Education
Public spending on education (% of GDP) ................................................ 7.2Technical/vocational enrolment as % of total
enrolment in secondary school ........................................................... 15Adult literacy (%) .........................................................................................—Boys not in primary school (%) .................................................................... 1Girls not in primary school (%) ..................................................................... 1Education poverty (% of children age 17-22
with less than 2-4 years schooling) ......................................................—Private enrolment in primary school (% of primary) ................................... 2.1Private enrolment in secondary school (% of secondary) ........................ 19.5PIRLS6 .................................................................................................... 531PISA math scores6 .................................................................................. 519PISA reading scores6 ............................................................................... 521PISA science scores6 .............................................................................. 532TIMSS 4th grade math6 ........................................................................... 486TIMSS 4th grade science6 ....................................................................... 497TIMSS 8th grade math6 ........................................................................... 488TIMSS 8th grade science6 ....................................................................... 512
Health
Prevalence of visual impairment (%) .......................................................... 0.9Public spending on health (% of GDP) .................................................... 10.1Business impact of heart disease1 .......................................................... 4.95Business impact of cancer1 .................................................................... 4.86Business impact of mental illness1 .......................................................... 5.29Business impact of diabetes1 ................................................................. 4.84Business impact of chronic respiratory disease1 ..................................... 5.47Business impact of HIV/AIDS1 ................................................................ 6.57Business impact of tuberculosis1 ............................................................ 6.76Business impact of malaria1 ................................................................... 6.94
Society Value
Freedom in the World8................................................................................. 1Democracy Index (rank/165) ........................................................................ 5Population living in urban area (%) .......................................................... 86.3Gini Index (income)5................................................................................ 36.2Accessibility of digital content1 ............................................................... 5.91Extent of virtual social networks use1 ..................................................... 6.25
Workforce
Economic activity (agriculture) — % of total activity .................................. 6.6Economic activity (industry) — % of total activity .................................... 20.9Economic activity (services) — % of total activity .................................... 72.5GDP per person employed (US$) ....................................................... 36,994Cooperation in labour-employer relations1 .............................................. 5.50Emigration rate of the tertiary educated (%) ............................................ 21.8Labour force with tertiary education (%) ................................................. 36.2Number of patent applications (per 1,000 people) .............................. 1.4214Hiring and firing practices1 ...................................................................... 4.10Retirement age, male ................................................................................ 65Retirement age, female .............................................................................. 65Number of informal sector workers (1,000s) ...............................................—Total employed (1,000s) ....................................................................... 2,180Total unemployed (1,000s) ....................................................................... 152Unemployment for 12 months or more
as a % of total unemployment ........................................................... 8.1Total youth not in education or employment (1,000s) ............................. 84.4Unemployment for 12 months or more (1,000s) ..................................... 12.4Global Innovation Index (rank/142) ............................................................ 17Global Talent Index (rank/60) ..................................................................... 15Quality of Labour Force (rank/60) .............................................................. 17Talent Environment (rank/60) ..................................................................... 15IQ measure9 ........................................................................................... 99.3
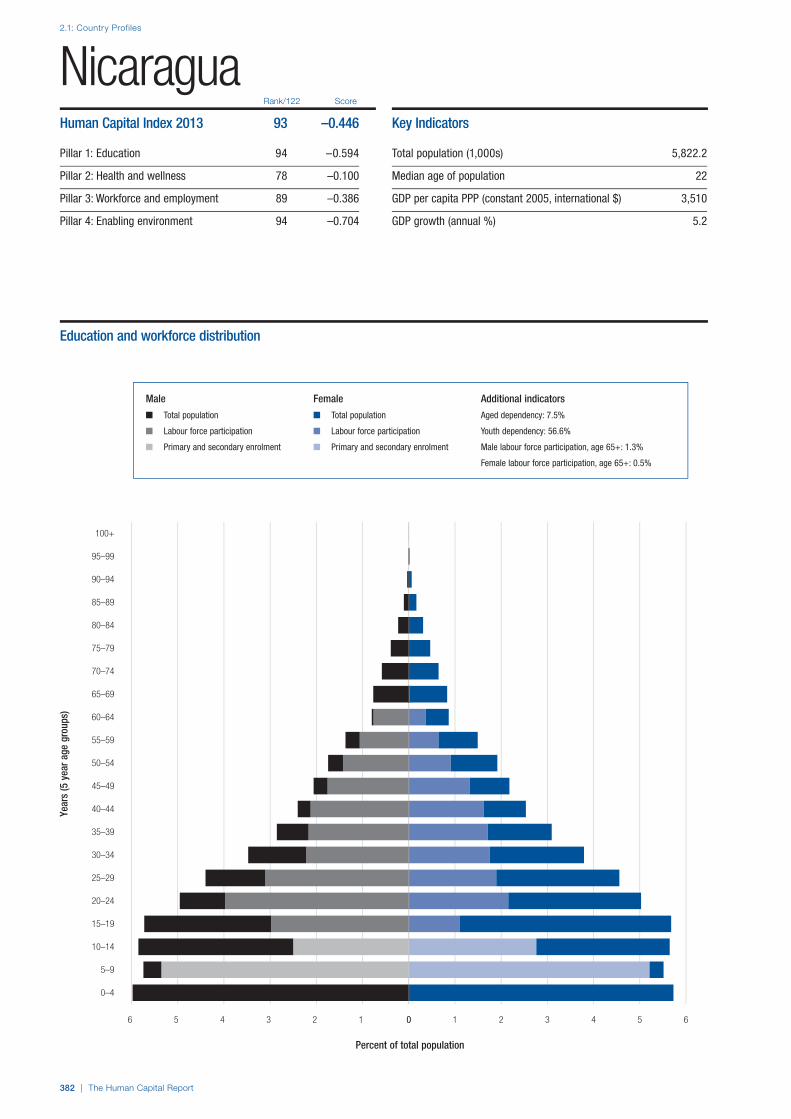
2.1: Country Profiles
382 | The Human Capital Report
Rank/122 Score
Year
s (5
yea
r age
gro
ups)
Percent of total population
0–4
5–9
10–14
15–19
20–24
25–29
30–34
35–39
40–44
45–49
50–54
55–59
60–64
65–69
70–74
75–79
80–84
85–89
90–94
95–99
100+
0 1 2 3 4 5 66 5 4 3 2 1 0
NicaraguaHuman Capital Index 2013 93 –0.446
Pillar 1: Education 94 –0.594
Pillar 2: Health and wellness 78 –0.100
Pillar 3: Workforce and employment 89 –0.386
Pillar 4: Enabling environment 94 –0.704
Key Indicators
Total population (1,000s) 5,822.2
Median age of population 22
GDP per capita PPP (constant 2005, international $) 3,510
GDP growth (annual %) 5.2
Male Female Additional indicators
n Total population n Total population Aged dependency: 7.5%
n Labour force participation n Labour force participation Youth dependency: 56.6%
n Primary and secondary enrolment n Primary and secondary enrolment Male labour force participation, age 65+: 1.3%
Female labour force participation, age 65+: 0.5%
Education and workforce distribution

The Human Capital Report | 383
2.1: Country Profiles
HCI s
core
–2.5
–2.0
–1.5
–1.0
–0.5
0.0
0.5
1.0
1.5
2.0
2.5
Overall Index
Enablingenvironment
Workforce andemployment
Health andwellness
Education
NicaraguaEmployment types, educational requirements and educational attainment
Percent of population Educational in employment type attainment (%)
Tertiary requirements 7.0 n/a
Professionals 2.0
Technicians and associate professionals 5.1
Secondary requirements 30.7 n/a
Clerks 1.4
Service workers and shop and market sales workers 12.4
Skilled agricultural and fishery workers 6.4
Craft and related trade workers 6.9
Plant and machine operators and assemblers 3.6
Primary requirements 18.0 n/a
Elementary occupations 18.0
Various 1.5
Legislators, senior officials and managers 1.4
Unclassified 0.0
Armed forces 0.1
Spread of scores (by pillar and overall)
Nicaragua
Lower-middle income economies
Latin America and the Carribean

2.1: Country Profiles
384 | The Human Capital Report
Pillar 1: Education Rank/122 Z-Score Country Value Sample Minimum Sample Maximum
Access
Primary enrolment rate (%) ...................................................................76.........................0.058........................ 94...........................58 ......................... 100
Secondary enrolment rate (%) ..............................................................85.......................–1.156........................ 46...........................16 ......................... 100
Tertiary enrolment ratio (%) ...................................................................84.......................–0.859........................ 18.............................1 ......................... 103
Education gender gap2 .........................................................................21.........................0.543................... 1.000......................0.645 ...................... 1.000
Quality
Internet access in schools1 ...................................................................90.......................–0.688..................... 3.46........................1.64 ........................ 6.64
Quality of the education system1 ..........................................................90.......................–0.725..................... 3.15........................1.99 ........................ 5.98
Quality of primary schools1 ...................................................................93.......................–0.827..................... 3.04........................1.97 ........................ 6.82
Quality of math & science education1 .................................................101.......................–1.001..................... 3.08........................1.88 ........................ 6.29
Quality of management schools1 ..........................................................90.......................–0.689..................... 3.72........................2.29 ........................ 6.09
Attainment
Primary education attainment (% population age 25+) ..........................—..............................— .........................— .............................5 ......................... 100
Secondary education attainment (% population age 25+) .....................—..............................— .........................— .............................2 ......................... 100
Tertiary education attainment (% population age 25+) ..........................—..............................— .........................— .............................0 ........................... 44
Pillar 2: Health and Wellness Rank/122 Z-Score Country Value Sample Minimum Sample Maximum
Survival
Infant mortality (per 1,000 live births) ....................................................84.......................–0.021........................ 22.............................2 ........................... 98
Life expectancy ...................................................................................72.........................0.056........................ 73...........................50 ........................... 83
Survival gender gap2 ............................................................................50.........................0.417................... 0.976......................0.920 ...................... 0.980
Health
Stunting and wasting (% in children under 5) ........................................36.........................0.348..................... 12.3..........................1.2 ........................ 36.5
Unhealthy life years (% of life expectancy) ............................................45.........................0.383........................ 12.............................8 ........................... 66
Deaths under 60 from non-communicable
diseases (% of all NCD deaths) ......................................................96.......................–1.000 ..................... 39.3 ..........................7.3 ........................ 55.8
Obesity (% of adults with BMI ≥ 30) .....................................................86.......................–0.598..................... 24.2..........................1.1 ........................ 42.8
Business impact of non-communicable diseases1 ..................................6.........................1.470..................... 5.14........................2.74 ........................ 5.87
Business impact of communicable diseases1 .......................................60.........................0.287..................... 5.76........................3.13 ........................ 6.90
Well-being
Stress (% of respondents)7 ..................................................................38.........................0.292........................ 27.............................8 ........................... 69
Depression (% of respondents)7 ...........................................................97.......................–0.978........................ 18.............................2 ........................... 37
Services
Water, sanitation and hygiene (% with access) .....................................96.......................–0.803..................... 68.5........................31.1 ...................... 100.0
Healthcare quality1................................................................................82.......................–0.662..................... 3.30........................1.78 ........................ 6.75
Healthcare accessibility1 .......................................................................80.......................–0.591..................... 3.94........................2.41 ........................ 6.75
Pillar 3: Workforce and Employment Rank/122 Z-Score Country Value Sample Minimum Sample Maximum
Participation
Labour force participation rate, age 15-64 (%) .....................................86.......................–0.428..................... 65.0........................43.4 ........................ 90.6
Labour force participation rate, age 65+ (%) .........................................34.........................0.374..................... 31.9..........................1.6 ........................ 91.2
Economic participation gender gap2 .....................................................78.......................–0.244................... 0.615......................0.310 ...................... 0.839
Unemployment rate (%) ........................................................................59.........................0.179....................... 7.8..........................0.3 ........................ 32.0
Youth unemployment rate (%) ...............................................................12.........................1.029....................... 8.6..........................1.6 ........................ 48.2
Talent
Country capacity to attract talent1 ........................................................63.......................–0.100..................... 3.34........................1.48 ........................ 6.08
Country capacity to retain talent1..........................................................71.......................–0.282..................... 3.26........................1.81 ........................ 5.97
Ease of finding skilled employees1 ........................................................92.......................–0.763..................... 3.46........................2.13 ........................ 5.69
Pay related to productivity1 ...................................................................77.......................–0.375..................... 3.69........................2.37 ........................ 5.25
Capacity for innovation1........................................................................68.......................–0.362..................... 3.42........................2.31 ........................ 5.84
Index of Economic Complexity3 ............................................................89.......................–0.861................... –0.71......................–1.96 ........................ 2.37
Firm level technology absorption1 .......................................................113.......................–1.342..................... 3.86........................3.17 ........................ 6.23
Scientific and technical journal articles (per 1,000 people) ..................106.......................–0.622................... 0.002......................0.000 ...................... 1.242
Median age of the working population ..................................................98.......................–1.096........................ 30...........................28 ........................... 42
Training
Staff training1 ........................................................................................74.......................–0.309..................... 3.85........................2.51 ........................ 5.57
Training services1 ................................................................................102.......................–0.971..................... 3.54........................2.67 ........................ 6.47
Nicaragua
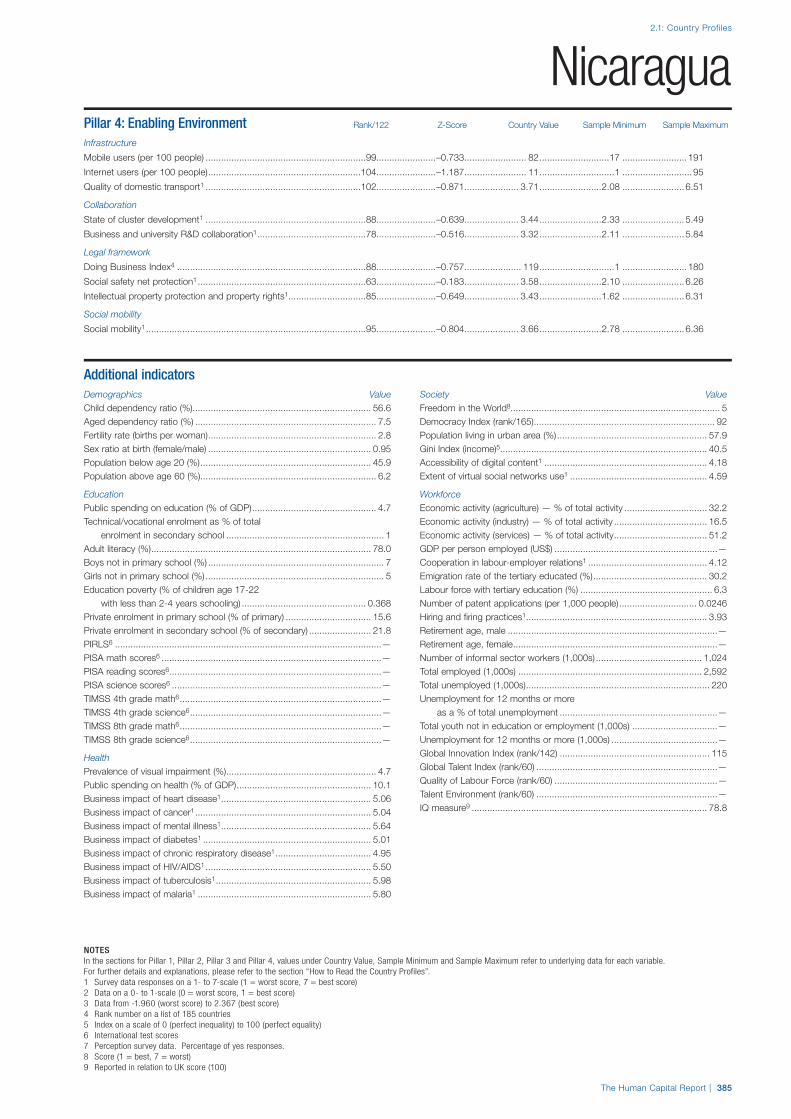


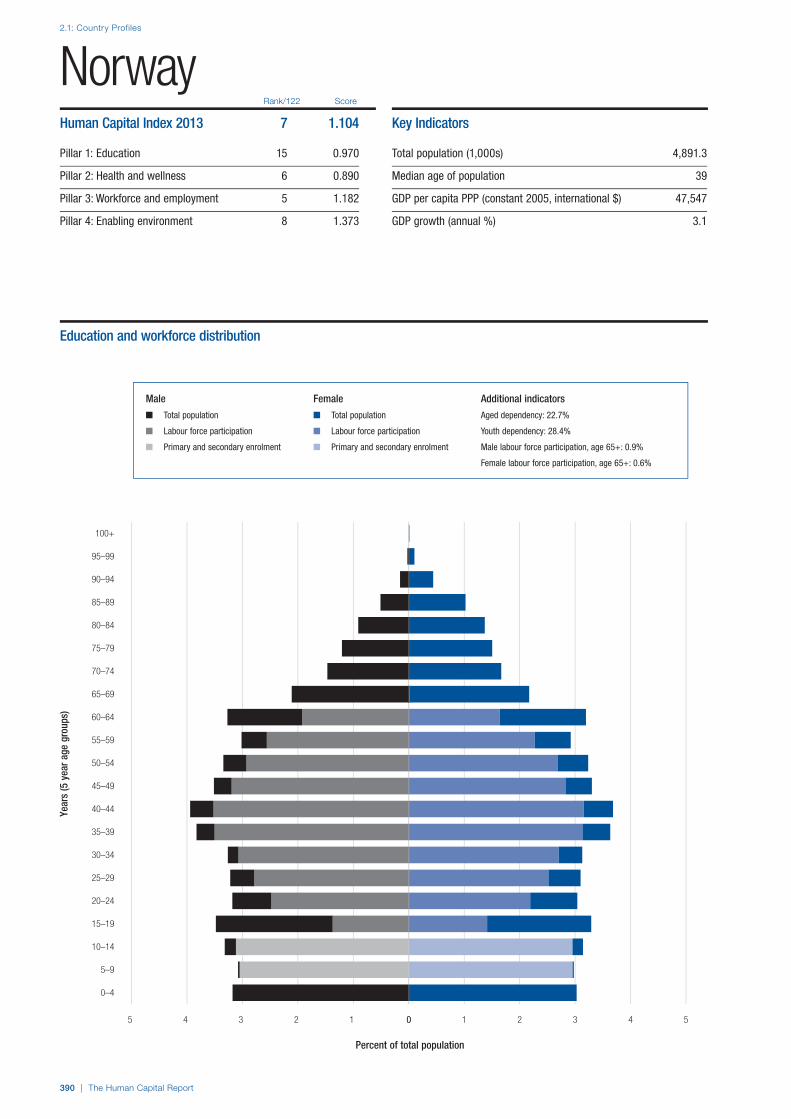


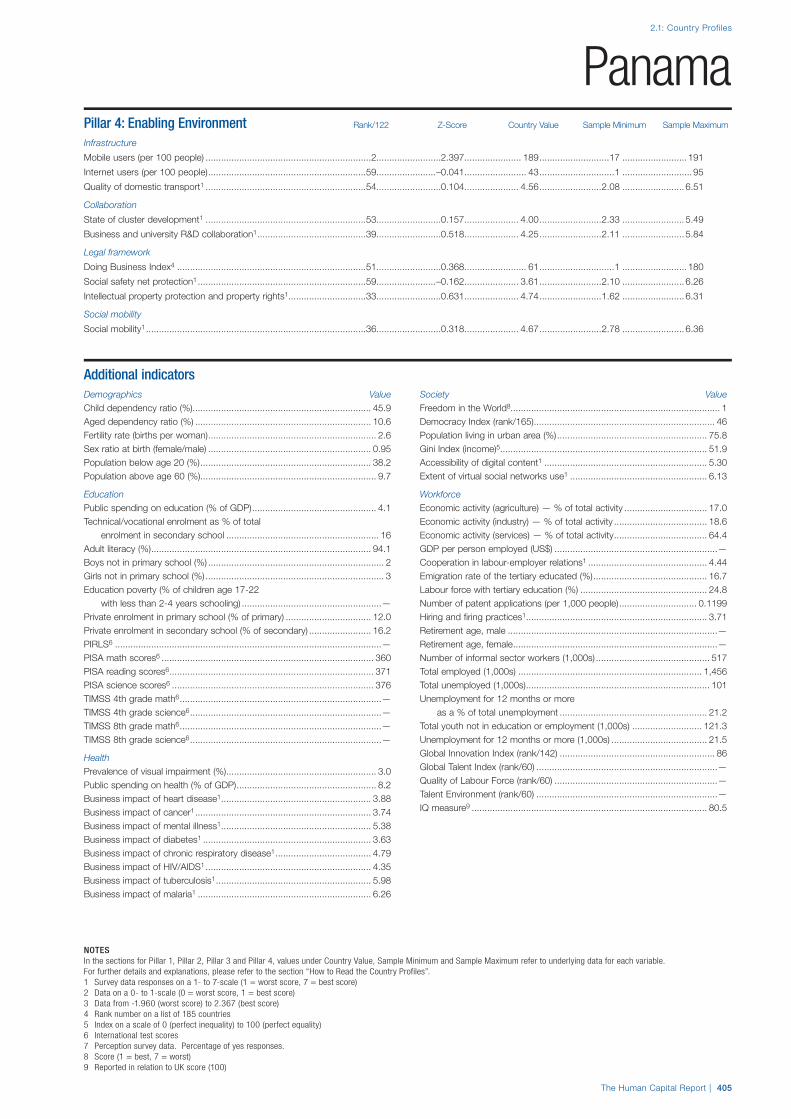


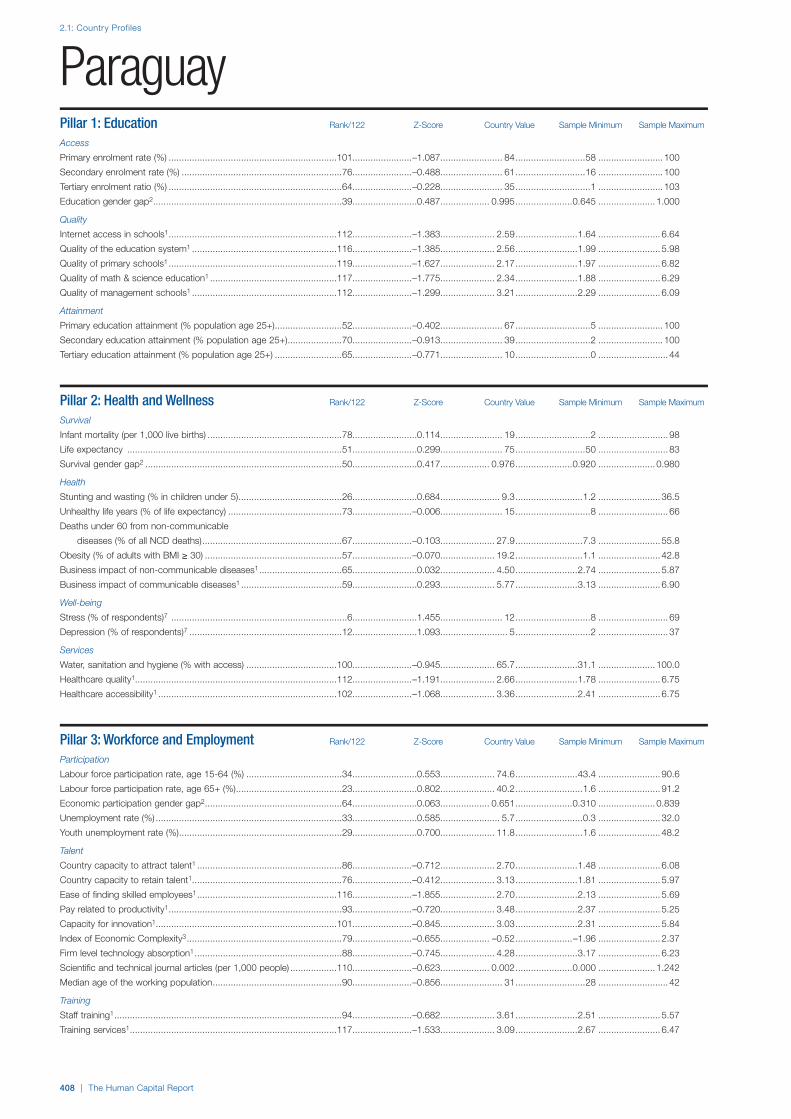

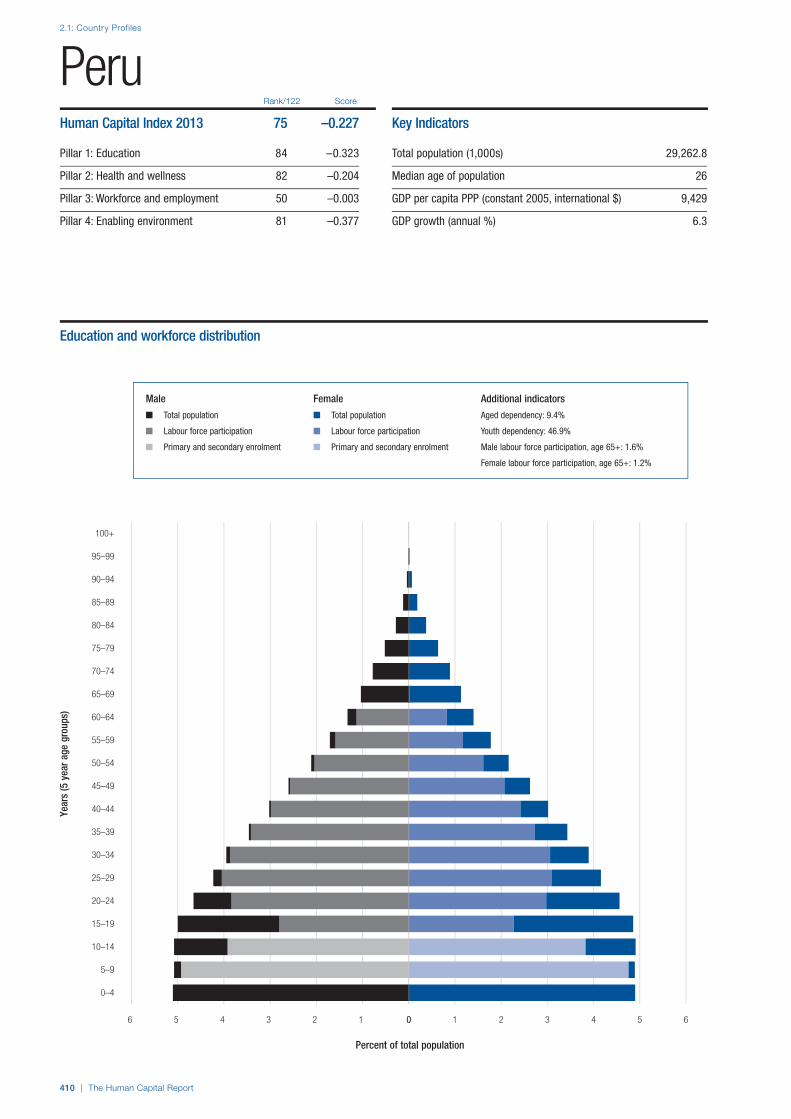

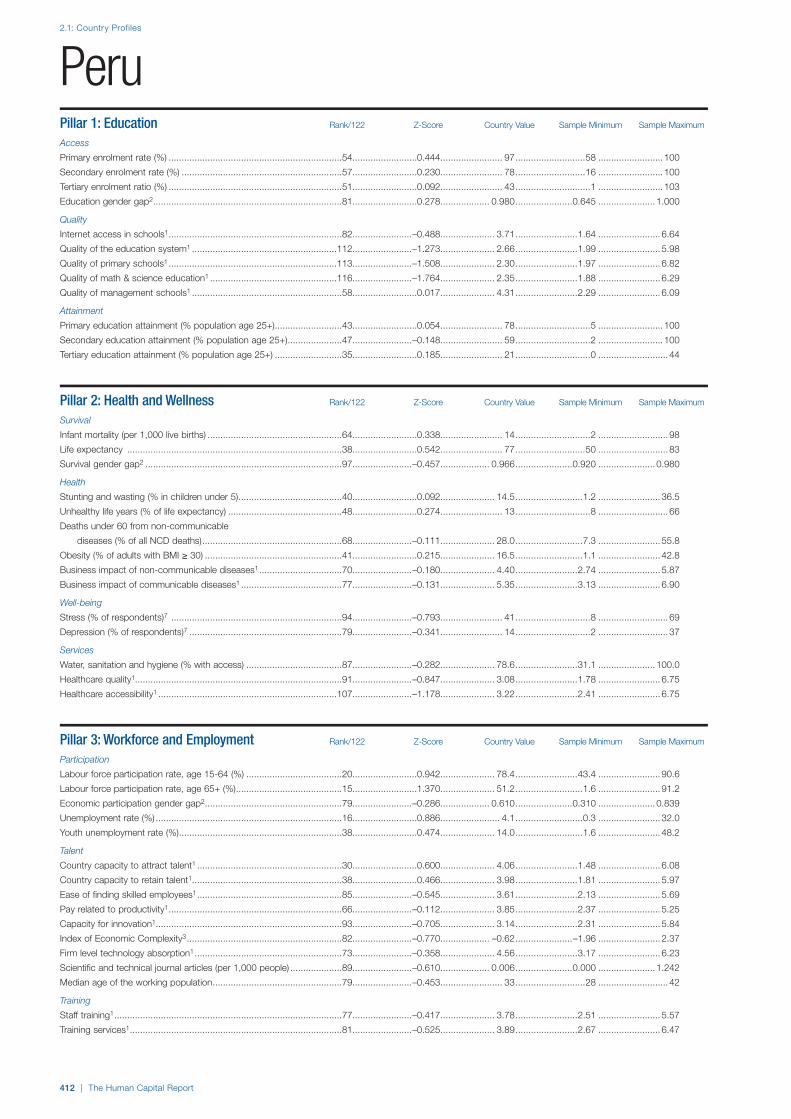
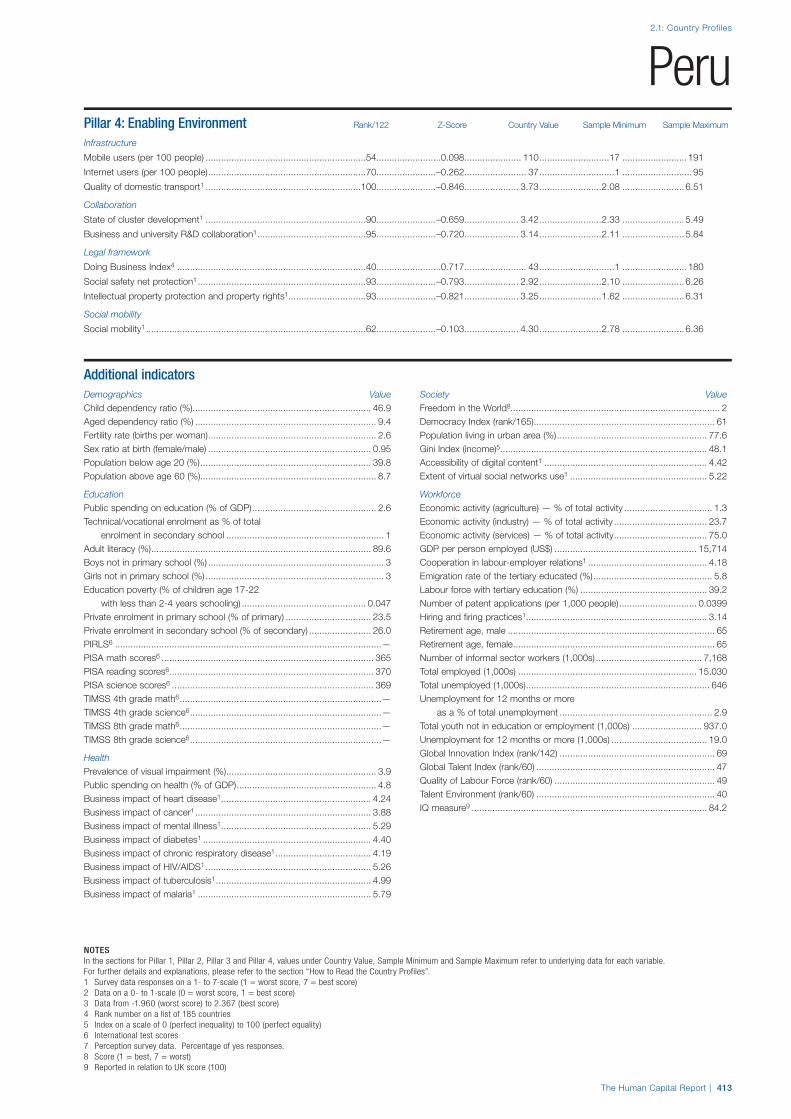
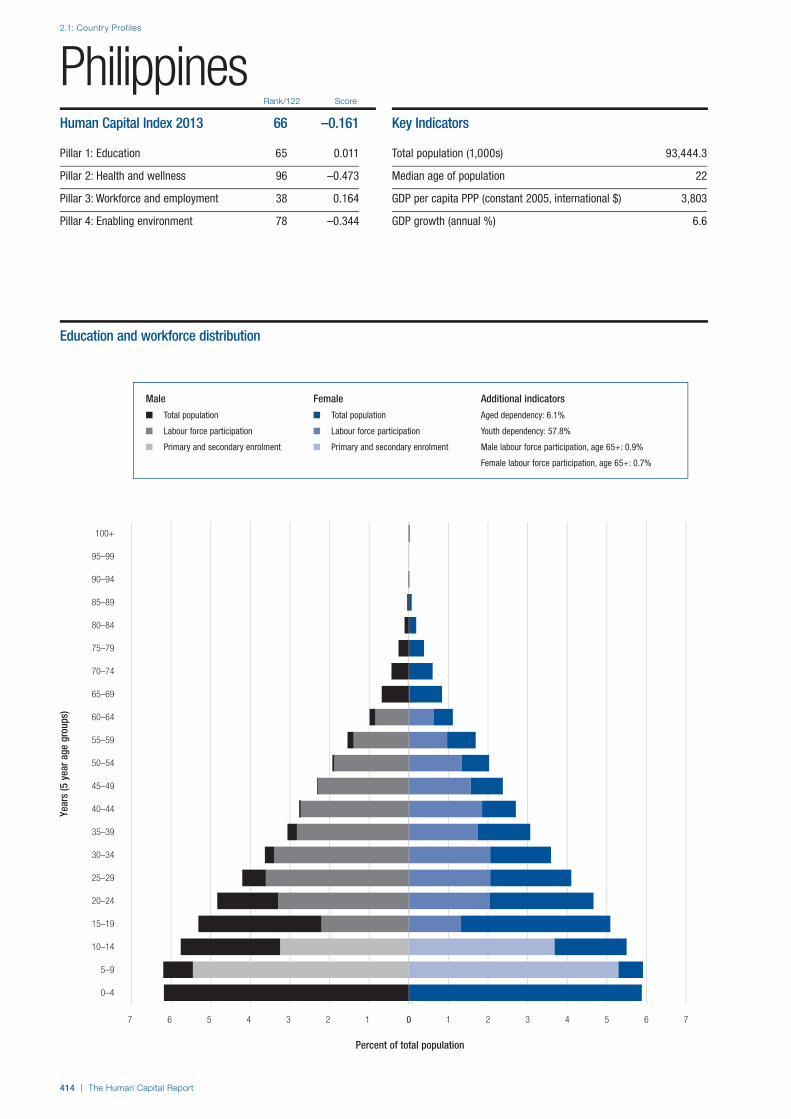


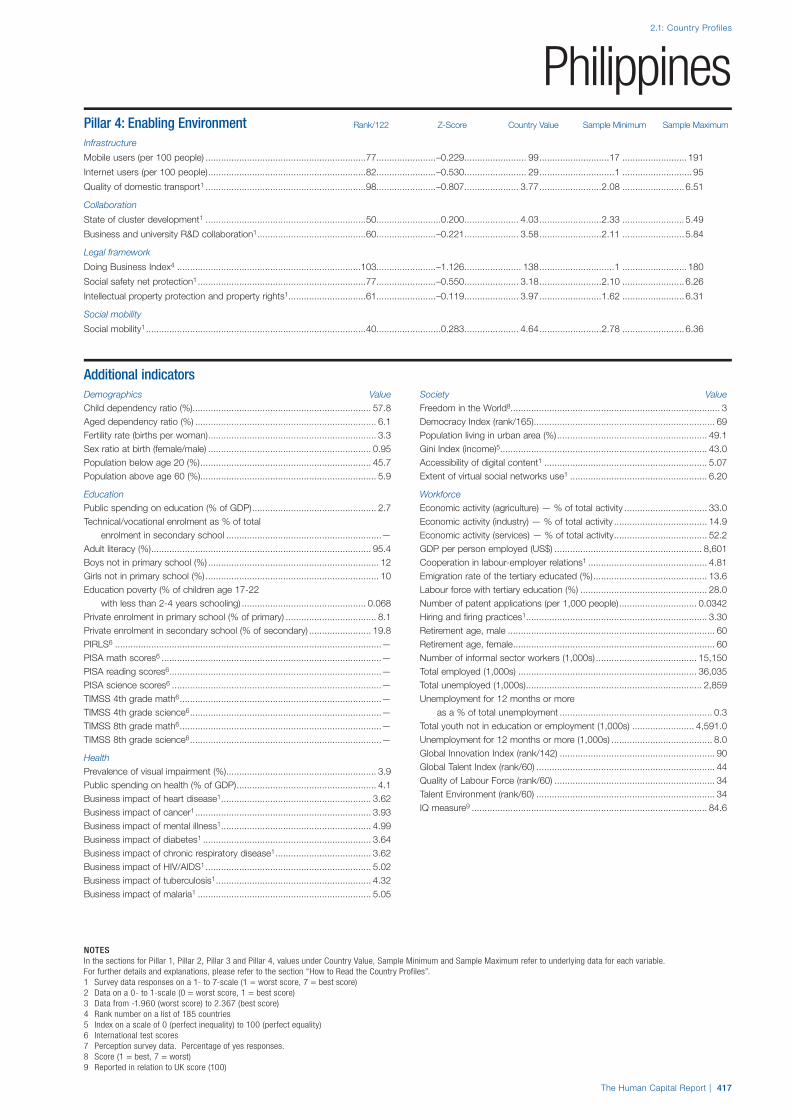


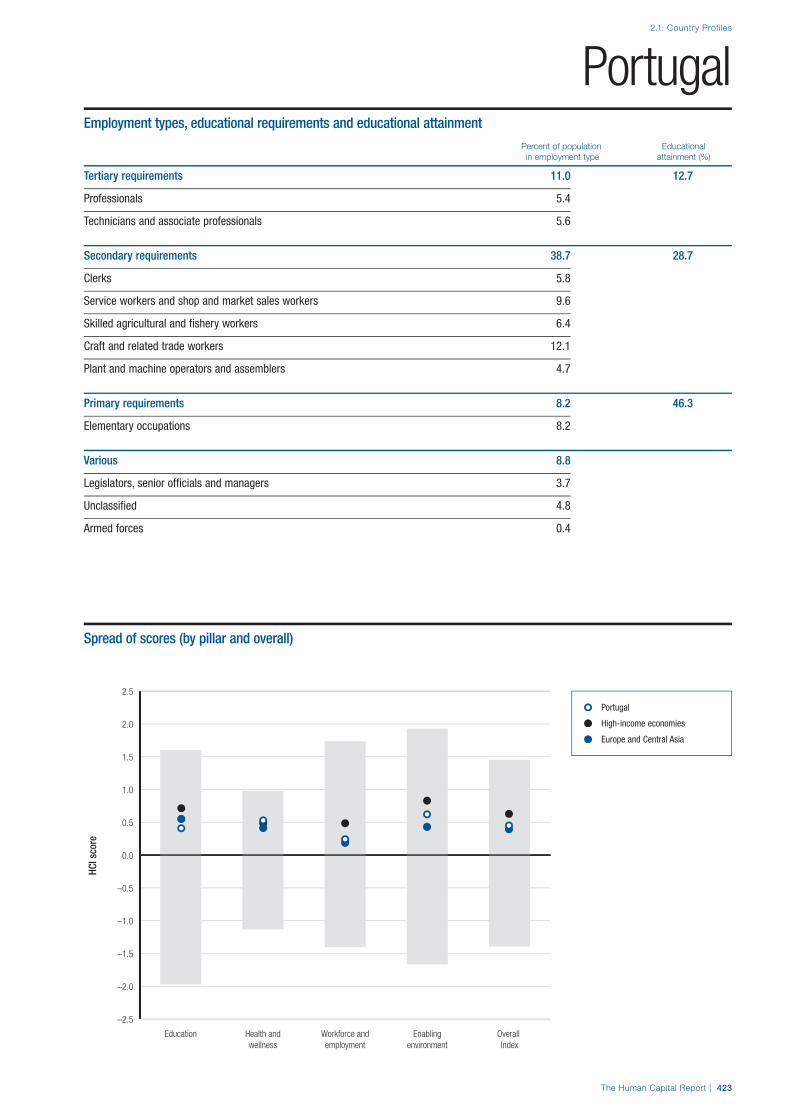


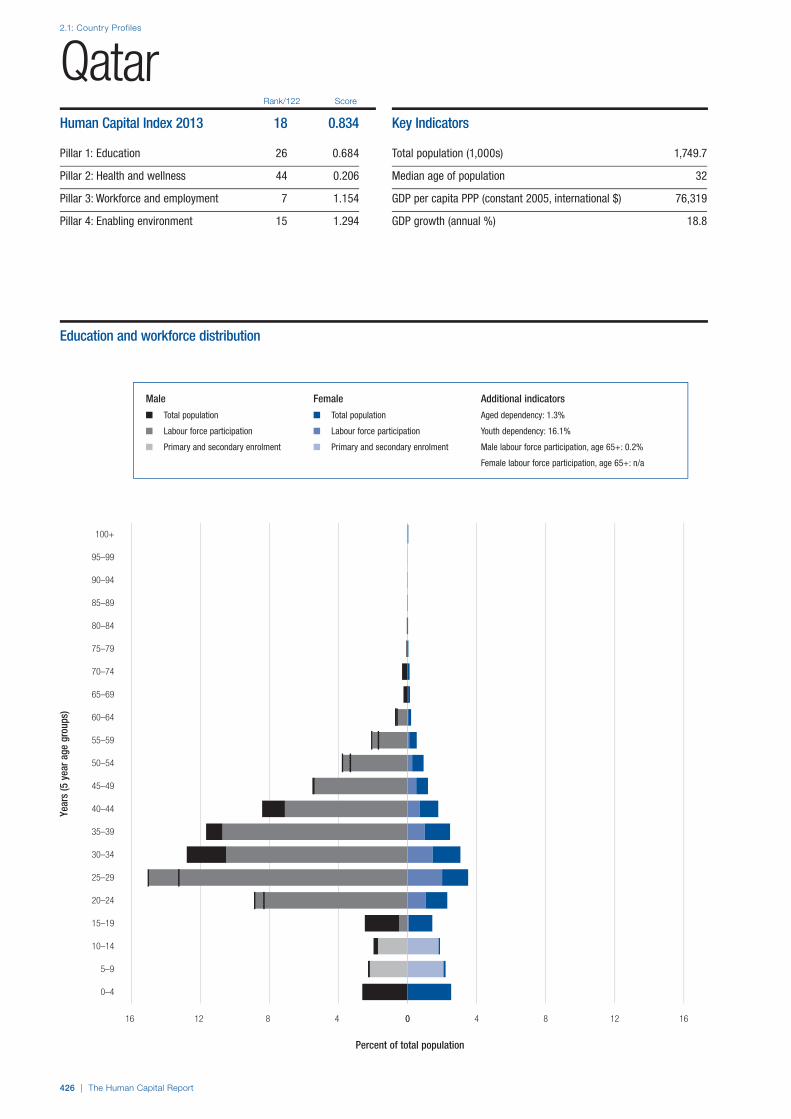


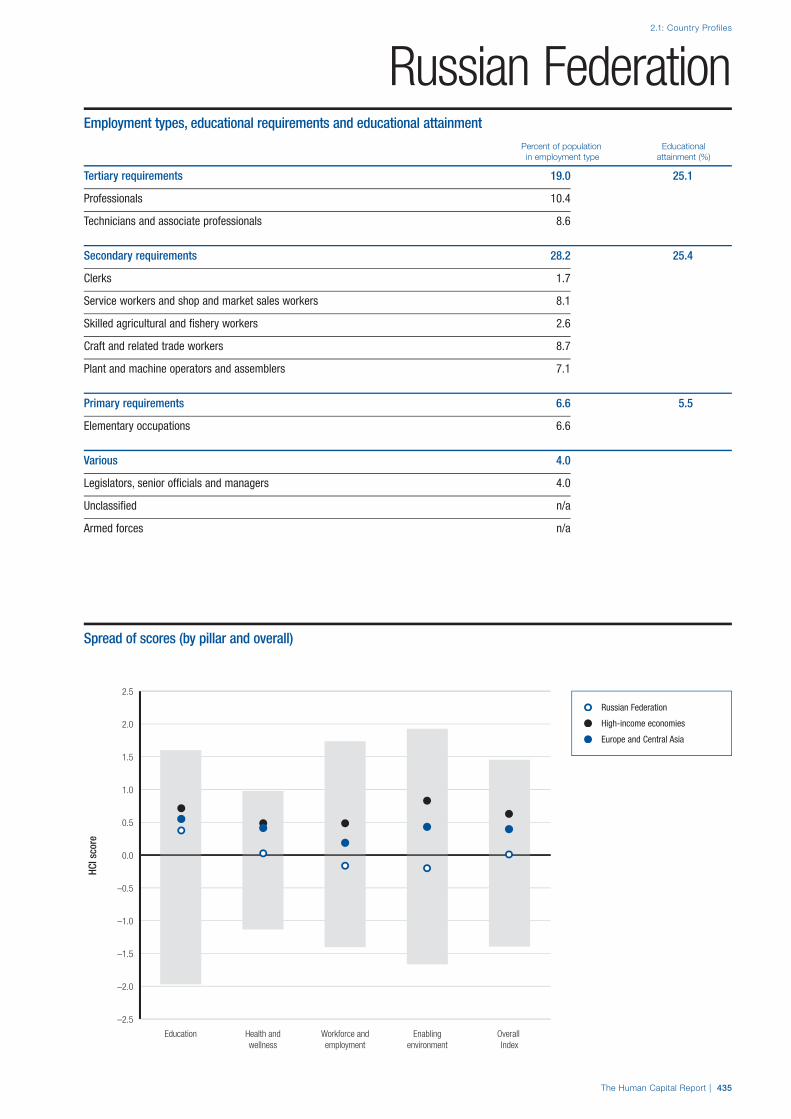

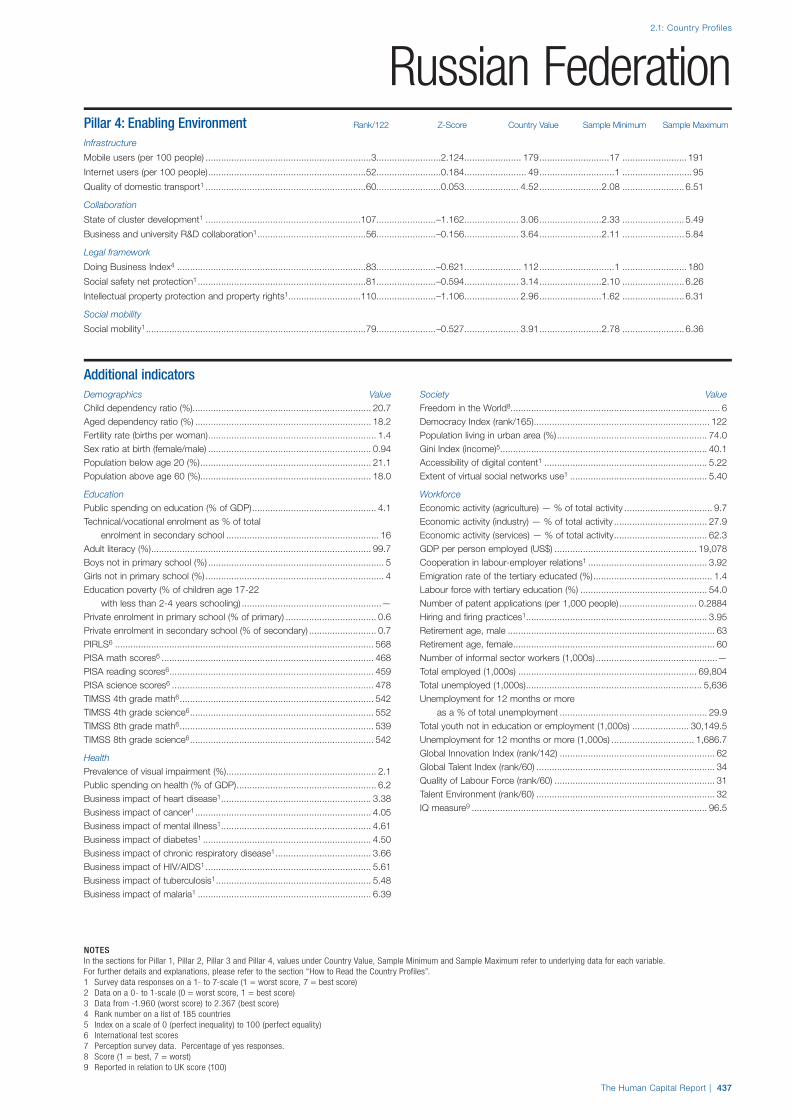
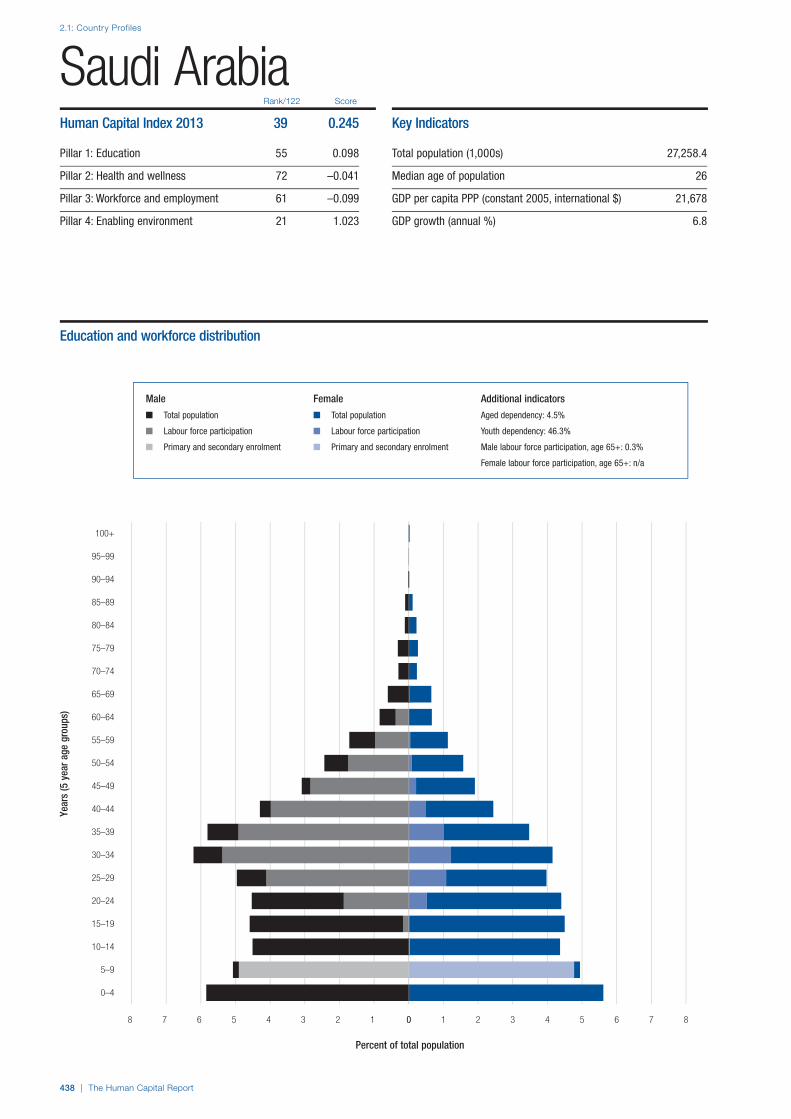

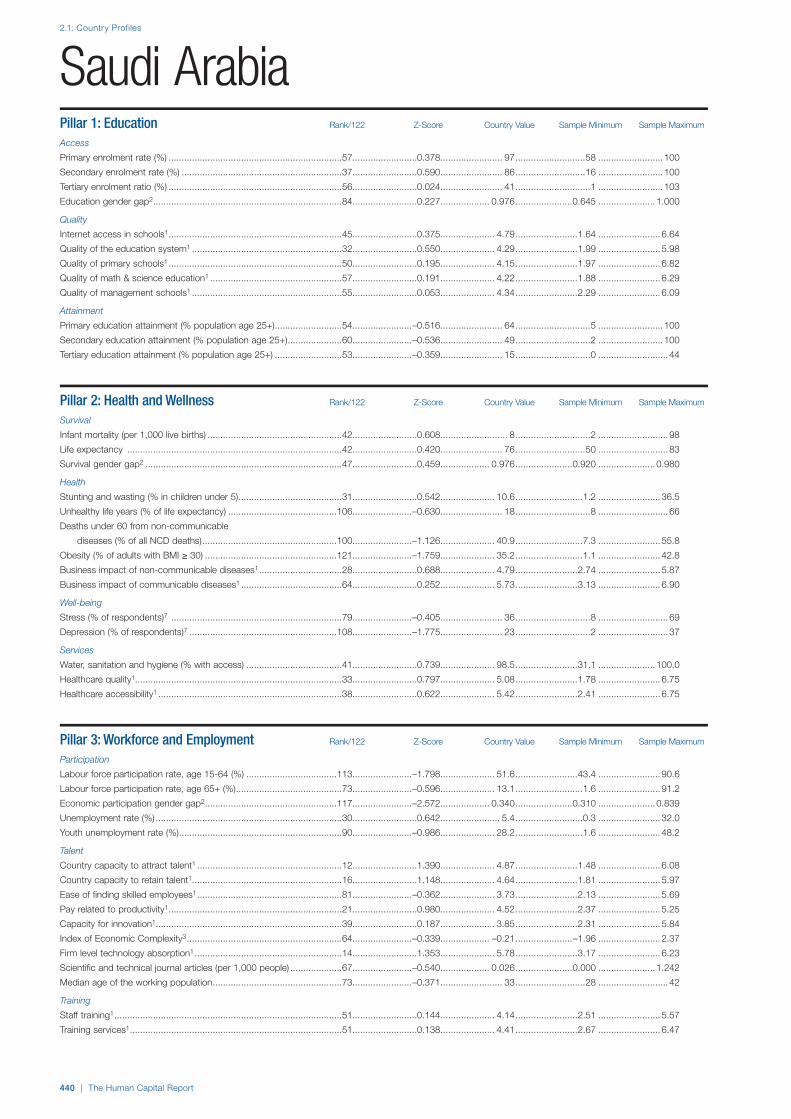


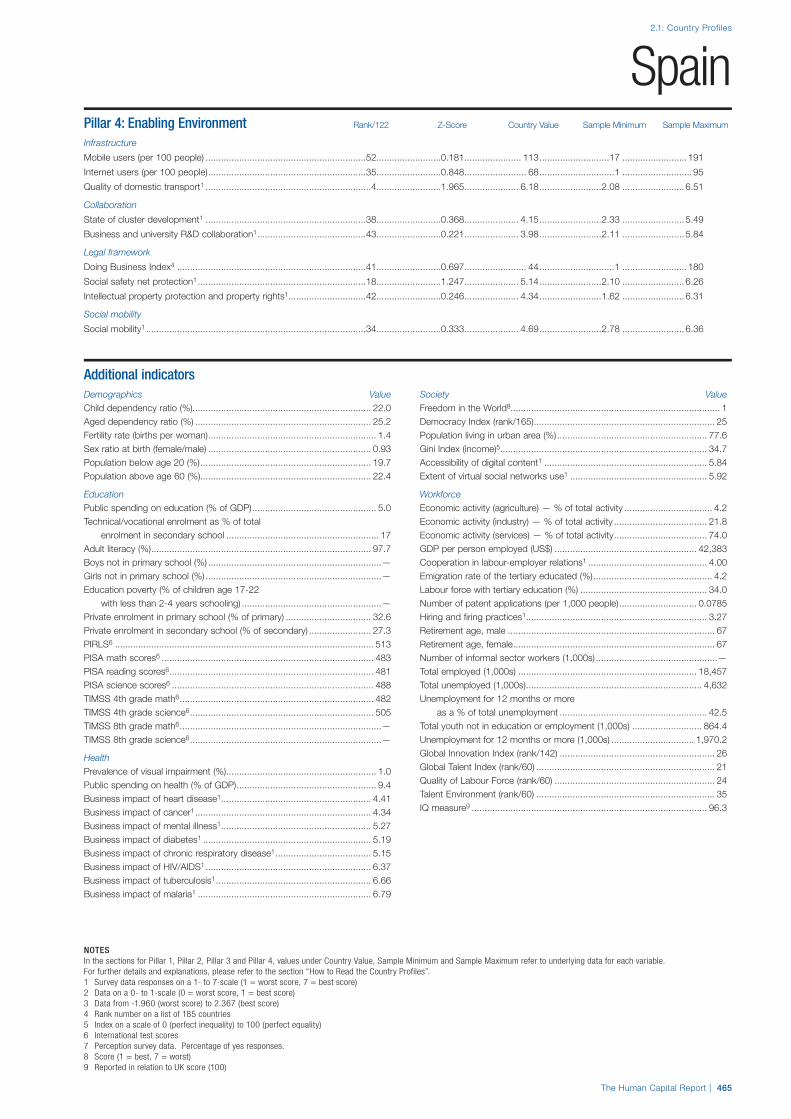


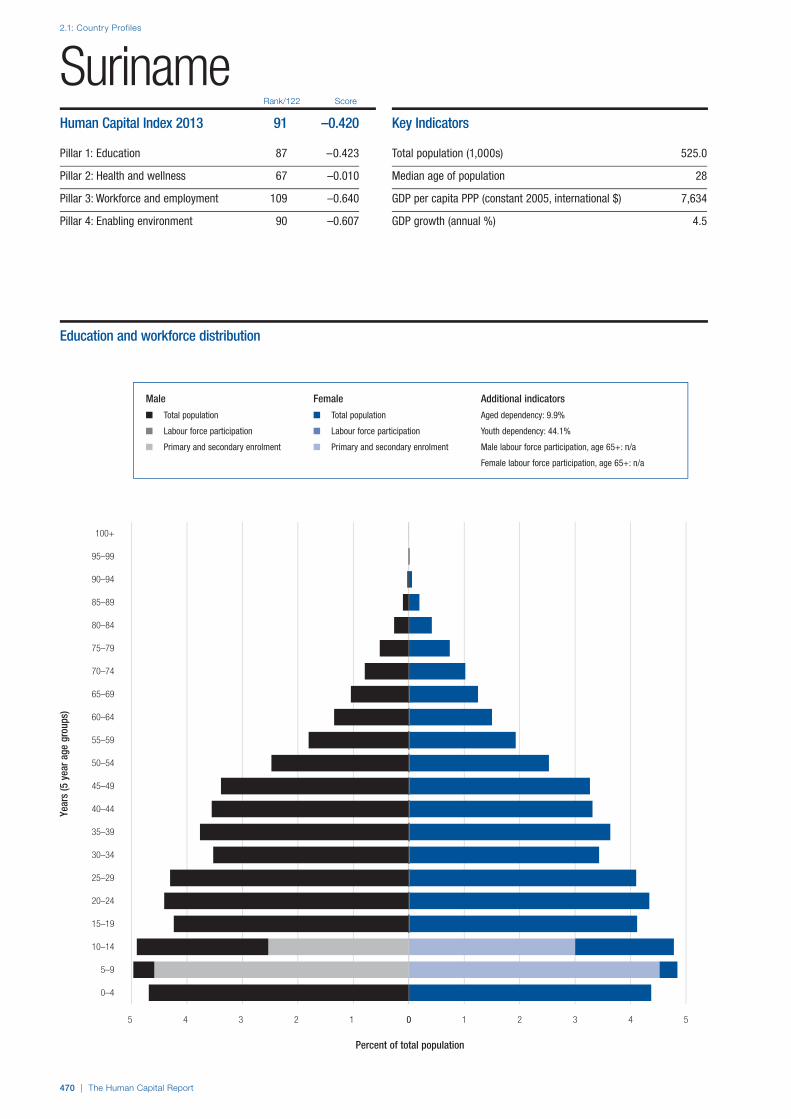

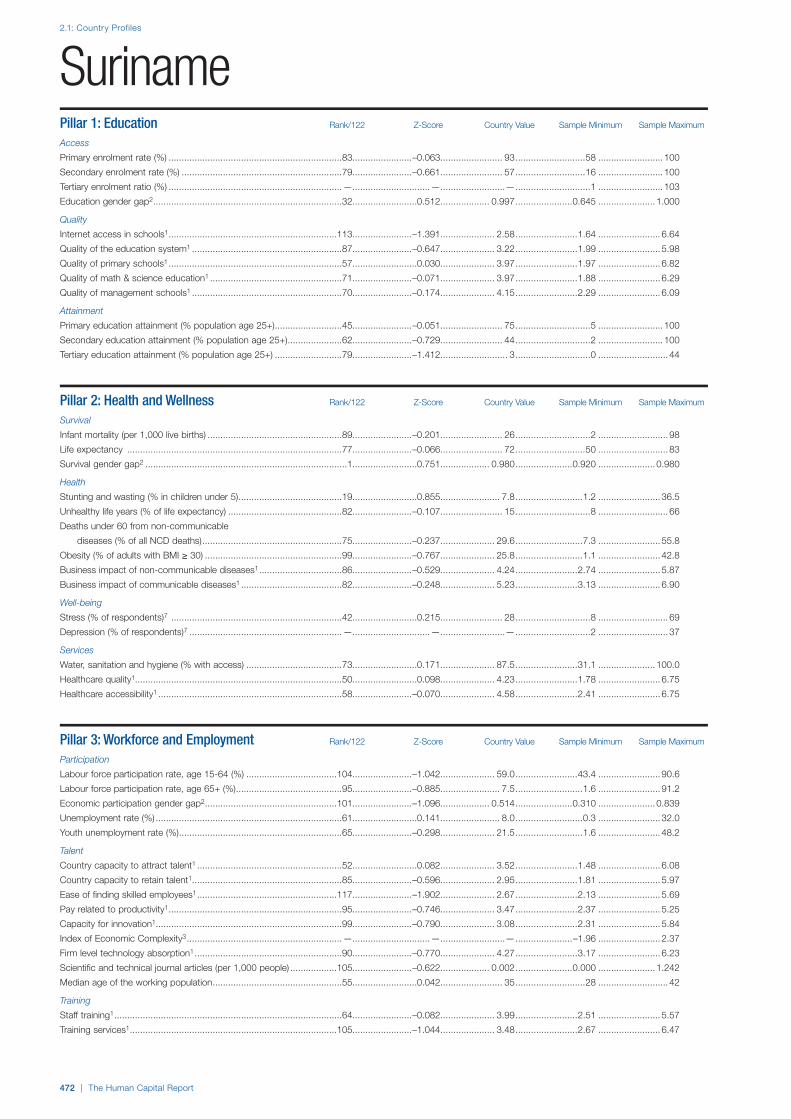

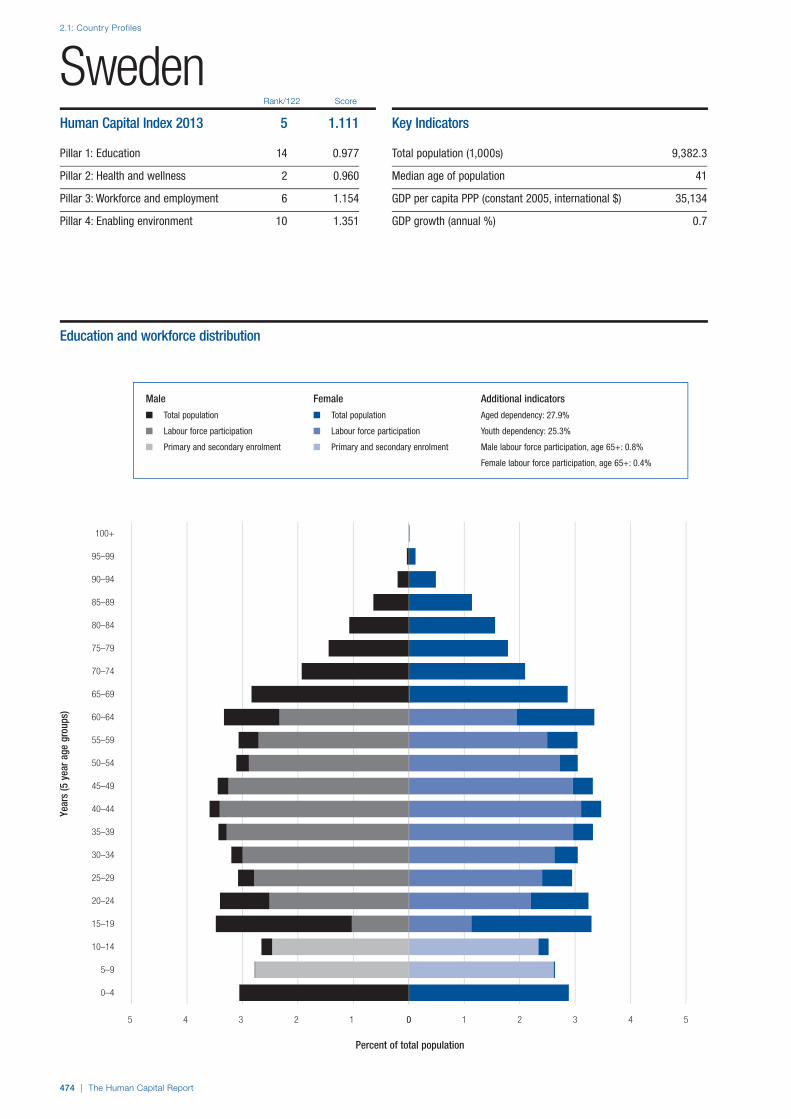
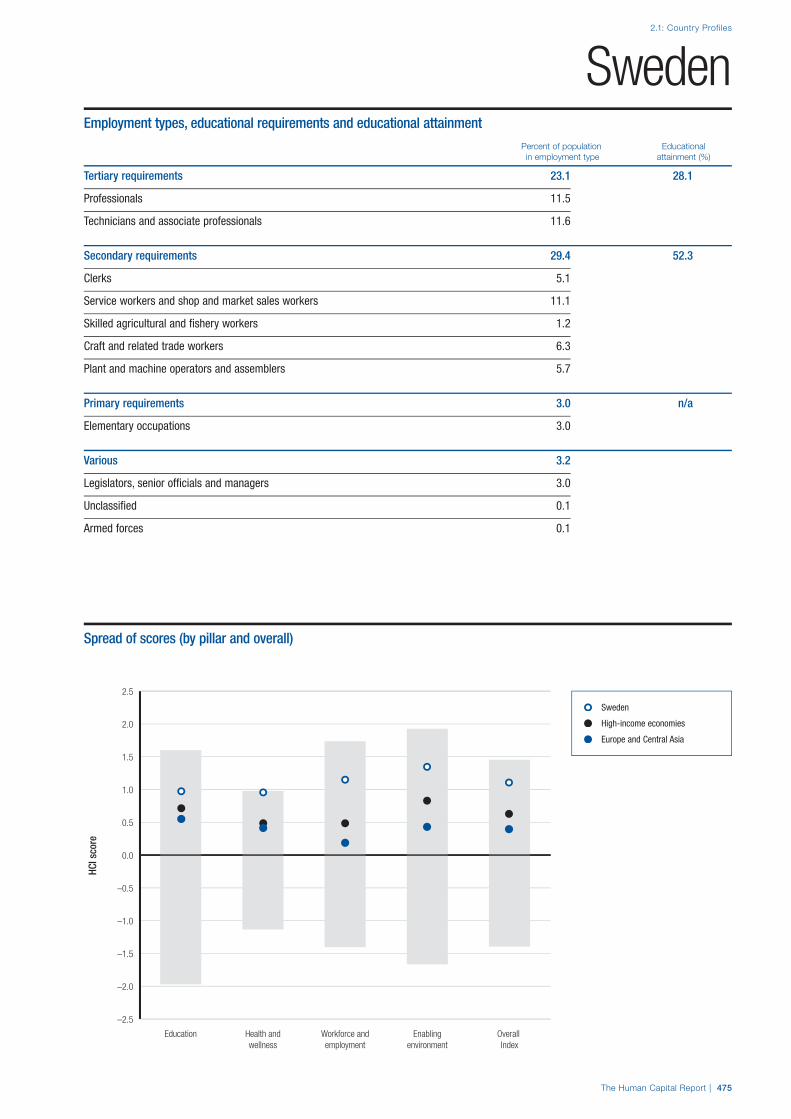


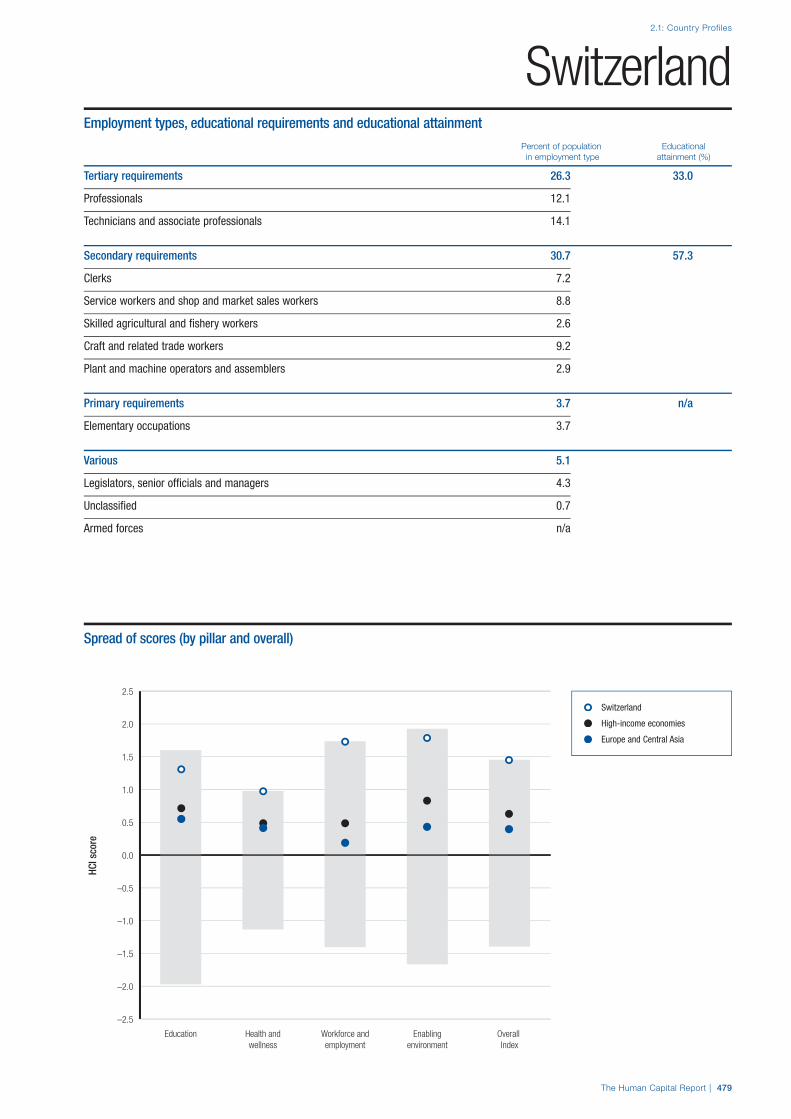
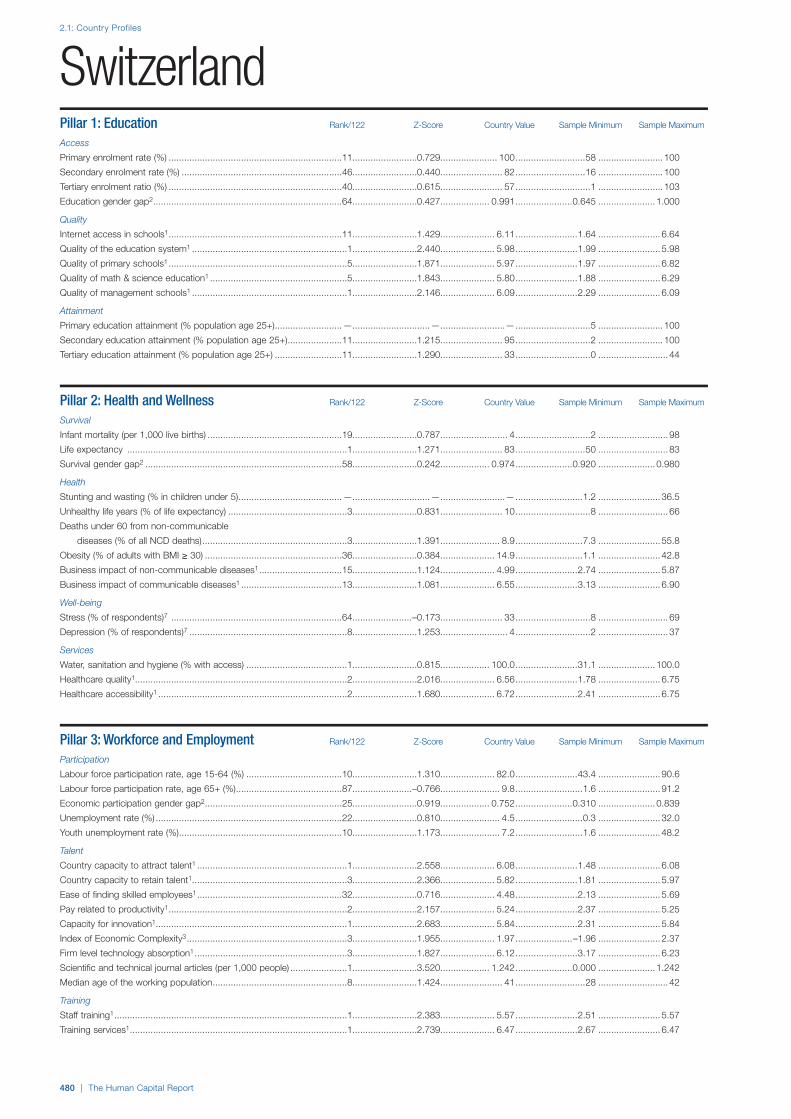

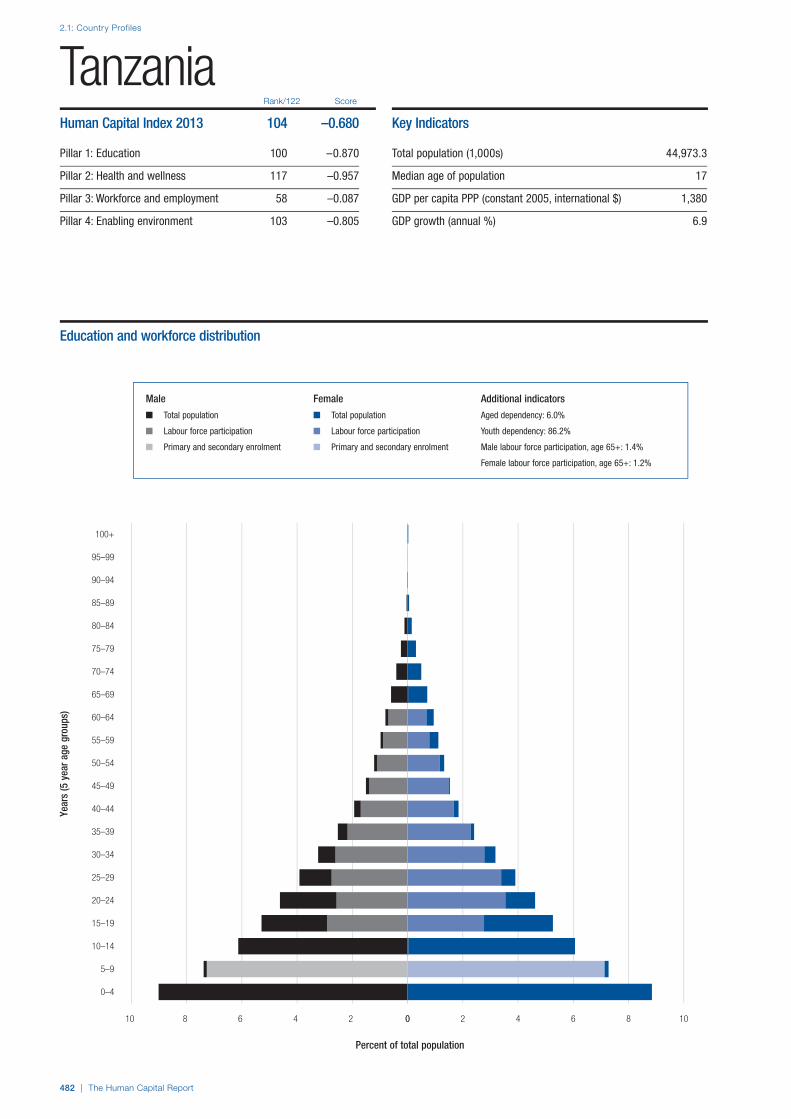

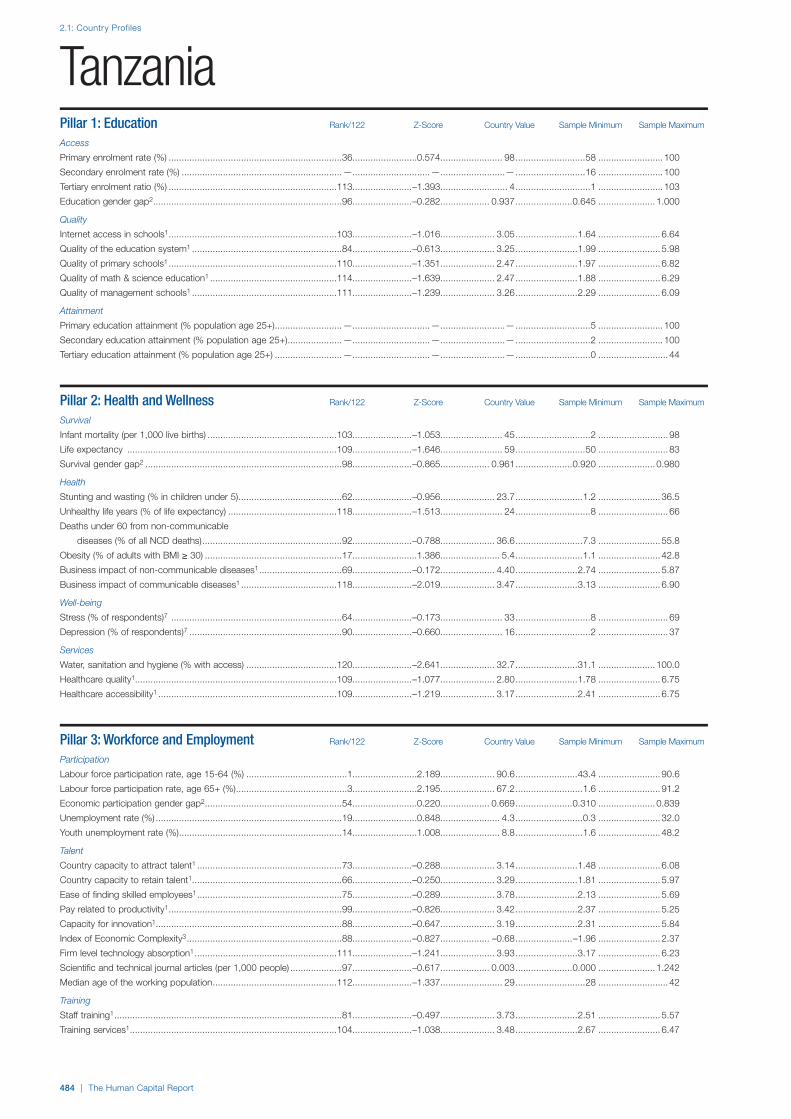


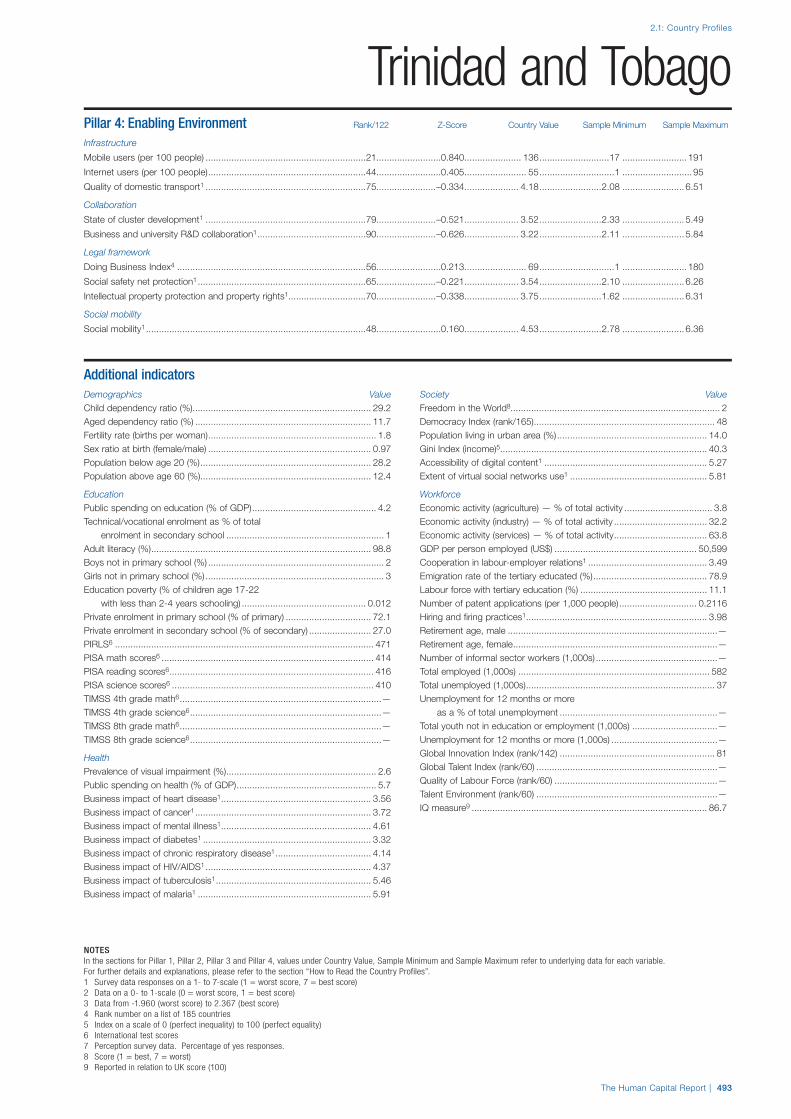


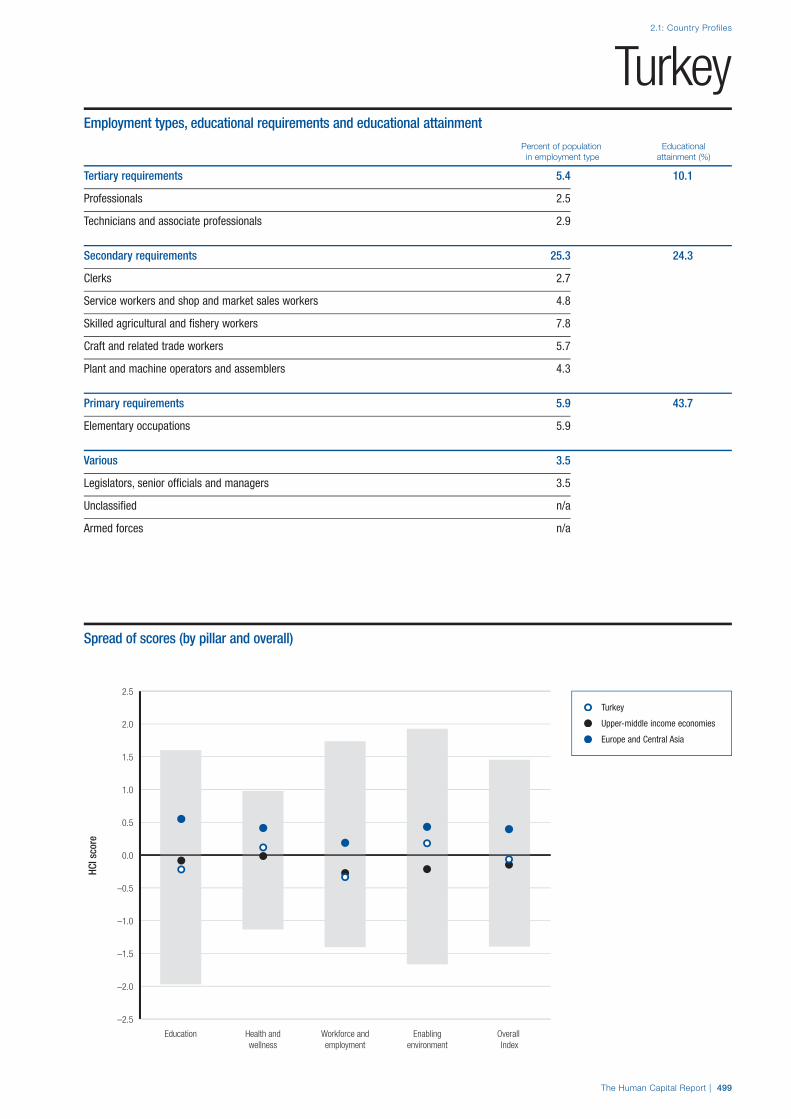


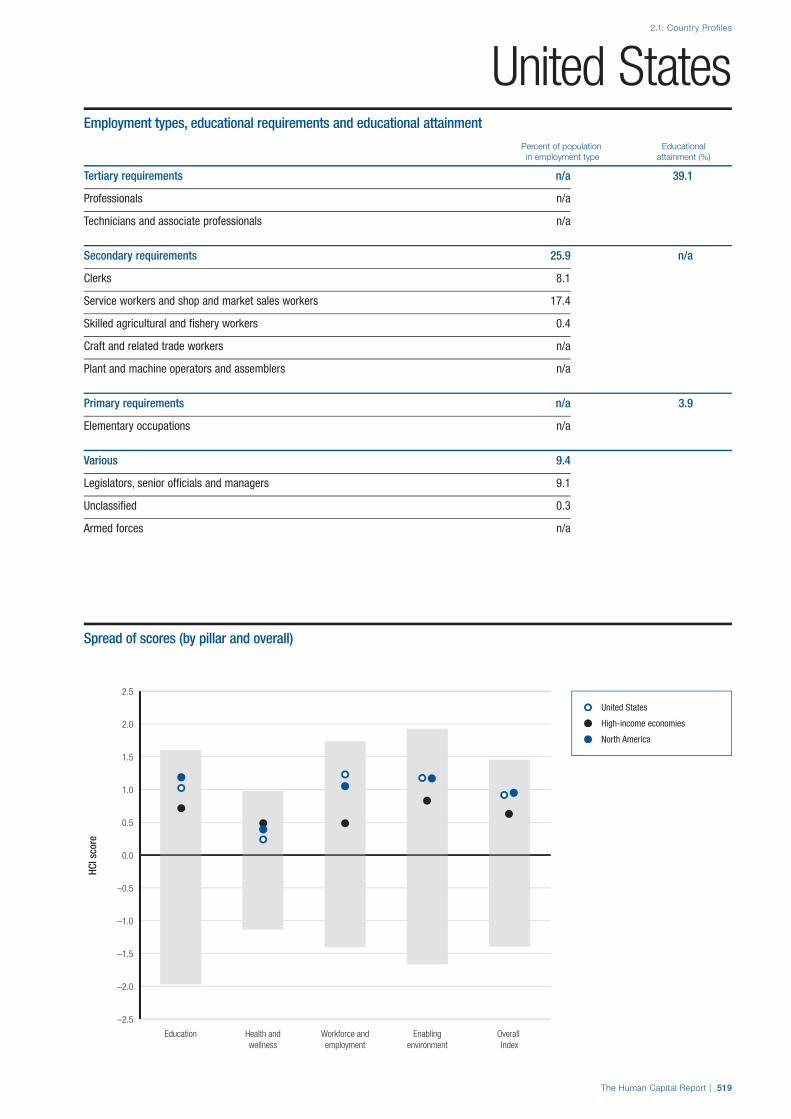
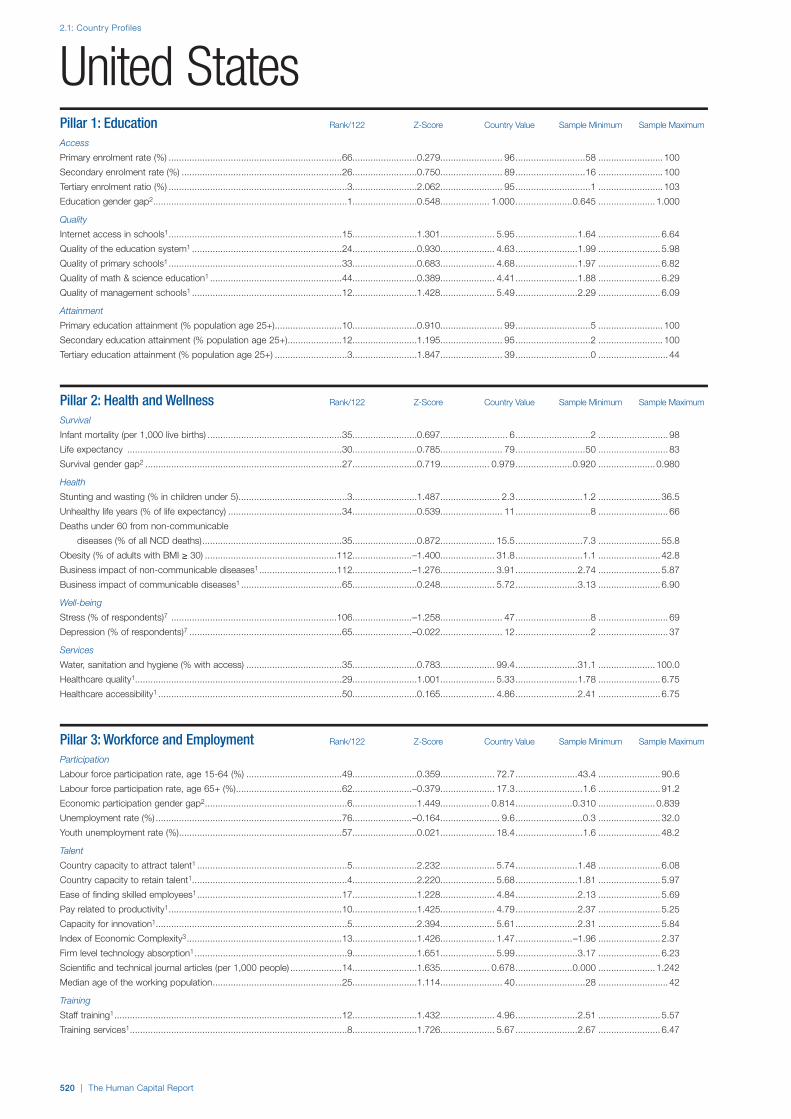

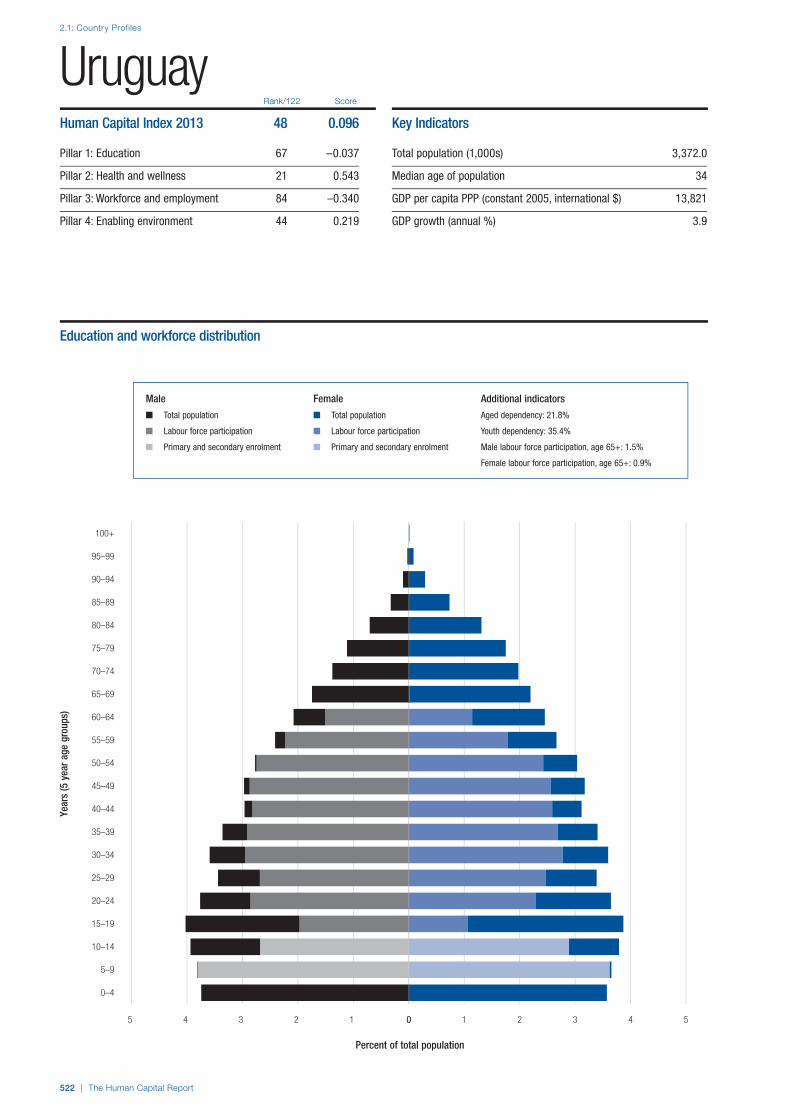


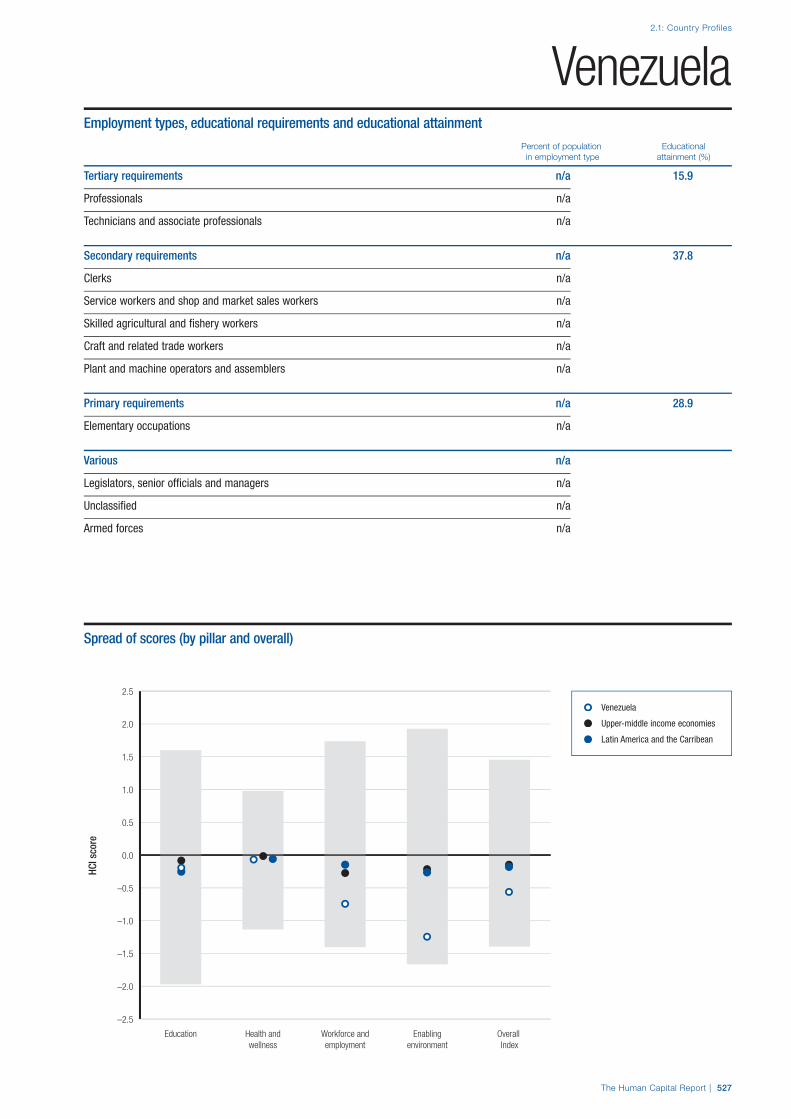


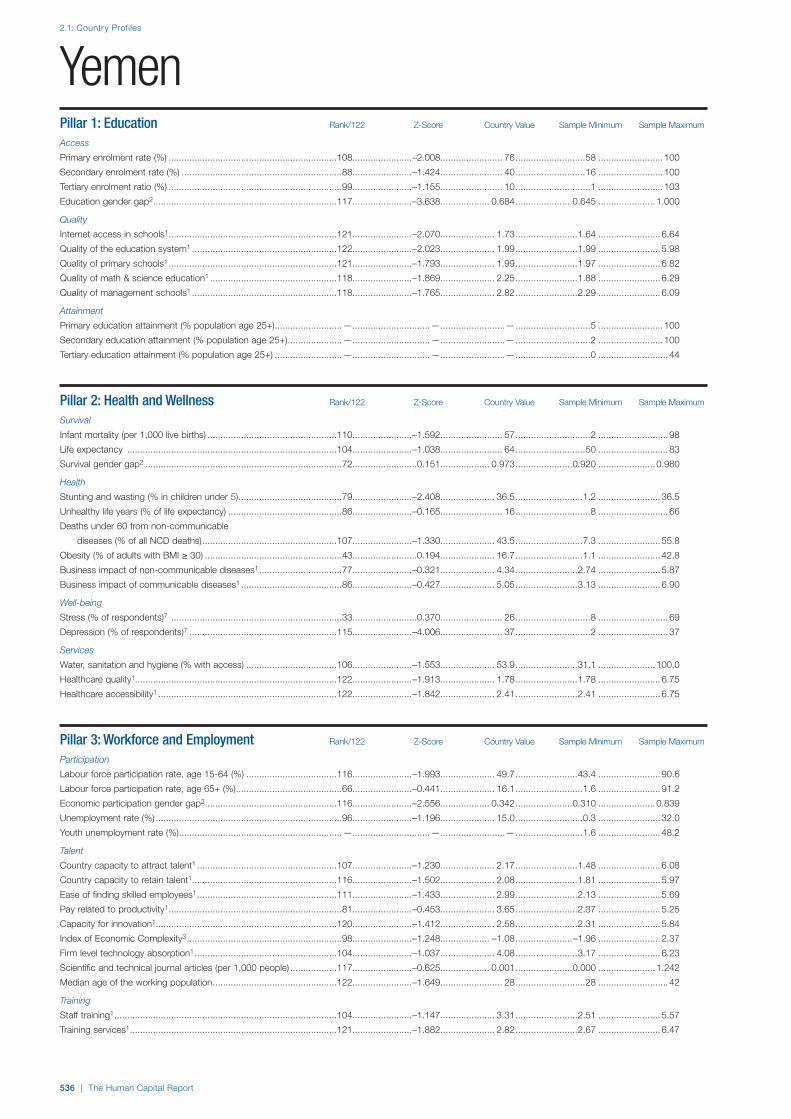


Top Related