


Languages
Pages
Legal


8/14/2019 The High Cost of Being Poor in Kentucky
http://slidepdf.com/reader/full/the-high-cost-of-being-poor-in-kentucky 1/52
T h e B r o o k i n g s I n s t i t u t i o n M e t r o p o l i t a n P o l i c y P r o g r a m
THE HIGH PRICE
of BEING POOR
in KENTUCKY H o w t o P u t t h e M a rk e t t o Wo r k f or K e n tu c k y’ s L o w e r - I n c o m e F a m i l i e s

8/14/2019 The High Cost of Being Poor in Kentucky
http://slidepdf.com/reader/full/the-high-cost-of-being-poor-in-kentucky 2/52

8/14/2019 The High Cost of Being Poor in Kentucky
http://slidepdf.com/reader/full/the-high-cost-of-being-poor-in-kentucky 3/52

8/14/2019 The High Cost of Being Poor in Kentucky
http://slidepdf.com/reader/full/the-high-cost-of-being-poor-in-kentucky 4/52

8/14/2019 The High Cost of Being Poor in Kentucky
http://slidepdf.com/reader/full/the-high-cost-of-being-poor-in-kentucky 5/52
First, we would like to thank the
Annie E. Casey Foundation, who
made this report possible. In partic-
ular, we would like to thank Bonnie
Howard, Jane Walsh, Dana Jackson, Sammy Moon, and
Carolyn Gatz, who provided critical
guidance to us during this project.
We would also like to thank Doug
Nelson and Ralph Smith. Their
work on the “high costs of being
poor” provided the intellectual
foundation for our analysis. Here,
we focus on just one cost of being
poor—the higher prices lower-
income families in Kentucky pay for basic necessities. Their work
explores numerous other types of
higher costs of being poor, includ-
ing the out-of-reach prices lower-
income families face for some
necessities, the benefits they lose
by working, and the higher burden
they manage to pay for many types
of basic necessities. The range of
these higher costs of being poor are
explored in numerous essays,
including a 2003 Kids Count essay
titled “The High Costs of Being
Poor: Another Perspective on
Helping Lower-income Families
Get By and Get Ahead.”
We would also like to thank
numerous people in Kentucky who
provided us with critical feedback
and insight, including: Bruce
Traughber, Cathy Hinko, DeVoneHolt, Julia Inman, Maria Gerwing
Hampton, Lisa Locke, Rosanne
Kruzich, Ron Jackson, Dr. Adewale
Troutman, Lauri Andress, Mary
Gwen Wheeler, Bill Shreck, Steve
Pence, James Clay Smith, Steve
Trager, Rodney Berry, Keith
Sanders, Blake Haselton, Crit
Luallen, Tom Emberton, David
Adkinson, and Ed Monahan.
We also want to thank the hun-dreds of families that took time to
talk with us about their experiences
with high-cost goods and services
and the challenges they face raising
families on low incomes. With their
input, we were better able to inter-
pret meaning from the quantitative
data at the center of this report.
Matt Fellowes is a fellow at the
Brookings Institution; Terry Brooks
is the executive director of the
Kentucky Youth Advocates; Valerie
Salley is a Kentucky-based policy analyst; and Mia Mabanta is a
senior research assistant at the
Brookings Institution. This report is
based on Fellowes’ 2006 Brookings
report From Poverty, Opportunity,
which is available at http://www.
brookings.edu/metro/pubs/2006
0718_povop.htm.
The responsibility for the con-
tents of this report is ours alone.
Acknowledgments
W e are profoundly grateful to the many people who
shared their expertise, insight, and resources with
us while we prepared this report.
Note: The views expressed here do not necessarily reflect those of the
trustees, officers, or staff members of the Brookings Institution, the boards
or staff of the Annie E. Casey Foundation, or any of the leaders in
Kentucky who we consulted during the development of this report.

8/14/2019 The High Cost of Being Poor in Kentucky
http://slidepdf.com/reader/full/the-high-cost-of-being-poor-in-kentucky 6/52
Higher prices start with themorning drive to work: Lower-
income workers in Kentucky (those
earning less than $20,000 per
year) are more likely to pay above
average rates for auto loans, pay
nearly $400 more for car insur-
ance, and pay a higher sticker
price for their car than their
higher-income counterparts. Those
who leave for work from a home
they own are twice as likely to havea high-cost mortgage as are their
higher-income neighbors, often
costing thousands of dollars more
over the life of the loan. On the
way back from work, more lower-
income workers use nontraditional
financial services, paying higher
fees for cashing a check or taking
out a short-term loan. Taken
together, these higher prices add
up to hundreds, sometimes thou-
sands, of dollars in extra costs for
already tight family budgets.
The good news is that state and
local leaders around the country
are rallying behind new, innovative,
practical, and low-cost initiatives to
lower these prices. With these and
other initiatives as models for
action, public and private leaders inKentucky can now also reduce
these higher costs of living, and do
so in ways that defy the substantial
budgetary, economic, and partisan
pressures that limit so many efforts
to grow the middle class. Through
a combination of initiatives that
lower business costs, curb
unscrupulous behavior, and boost
consumer knowledge, public and
private leaders can bring downthese prices.
This report is a roadmap for how
to reach this goal and improve the
spending power and economic
security of lower-income
Kentuckians. In short, we find:
Kentucky’s lower-income families
tend to pay higher than average
prices than other consumers for
basic necessities
Depending on where lower-income
consumers live and what combina-
tion of necessities are consumed,
lower-income families can pay up to
thousands of dollars more than
higher-income consumers every
year for basic financial services,
cars, car loans, car insurance, home
insurance, home loans, furniture,appliances, electronics, and other
basic necessities. In particular:■ Cashing Checks: According to
our survey, about 35 percent of
regular customers of high-cost
check-cashing establishments
in Kentucky earn less than
$20,000 annually, and about
62 percent earn less than
$40,000. Unlike most other
states, Kentucky places no lim-its on the fees that establish-
ments can charge for check
cashing. A random survey of
such establishments in
Kentucky found that fees to
cash a check range from 1 to
10 percent of the face value of
a check.■ Short-Term Loans: Nearly 70
percent of regular customers of
high-cost payday loan and
pawnshops in Kentucky are
lower-income residents. In
Kentucky, maximum fees for
these loans are $15 every two
weeks on a $100 loan, or a rate
38 times higher than that
charged by the average credit
card company for the same
Executive Summary
From Ashland to Paducah and every community in
between, Kentucky’s lower-income working families often
pay a premium for goods and services, making it difficult
for them to build wealth, save for their children’s futures, and
invest in their upward mobility.

8/14/2019 The High Cost of Being Poor in Kentucky
http://slidepdf.com/reader/full/the-high-cost-of-being-poor-in-kentucky 7/52
loan amount. Among Southern
and border states, such fees
range from zero (in Georgia,
Maryland, North Carolina, and
West Virginia, where this
industry is banned) to 17 per-cent of a loan’s value or higher
in Alabama and Mississippi.
The number of high-cost pay-
day lenders in Kentucky has
more than doubled since 1999,
from 353 to 779 establish-
ments, opening at a rate of one
every four days in 2006.
Kentucky pawnshop fees,
another source of high-cost
loans in lower-income markets,are limited to 22 percent per
month. Fees for pawnshops in
other Southern states range
from no limit (in Arkansas,
Maryland, and West Virginia)
to 20 percent or more (in
nearly every other state in the
region).■ Tax Services: According to our
survey of Kentucky households,
about one in three lower-income households pays a for-
profit tax preparation service to
do their taxes. These same
lower-income households are
two to six times more likely as
all others to use refund antici-
pation loans, carrying fees that
generally range between $10
and $80.1
■ Car Prices: More than 72 per-
cent of lower-income house-
holds in Kentucky own a car.
Nationwide, consumers from
lower-income neighborhoods
pay up to $500 more, on aver-
age, to buy the same car that
a consumer from a higher-
income neighborhood buys.
■ Car Loans: Nationwide, lower-
income consumers pay at least
2 percentage points more for
an auto loan than the average
among all other consumers. No
Kentucky data are currently
available to measure auto loans
prices in the state.
■ Car Insurance: In a sample of prices from three insurance
companies, drivers from lower-
income Kentucky counties and
neighborhoods pay, on average,
$384 more per year for auto
insurance than drivers in high-
income neighborhoods, holding
other factors constant. The
highest fees are charged in
lower-income neighborhoods in
Louisville and in many of
Kentucky’s rural eastern coun-
ties. Prices may be even higher
because of other factors—con-
sidered by some companies in
the calculation of insurance
prices—that are correlated with
household income, like credit
report information, educational
attainment, and occupation.■ Home Loans: In 2005, 41 per-
cent of the mortgages to lower-
income households in
Kentucky were defined by the
Federal Reserve as high-cost
mortgages, compared with just
16 percent of mortgages sold to
the highest-income householdsin the state.
■ Home Insurance: In a sample
of prices from three insurance
companies, homeowners in
Kentucky’s lower-income
neighborhoods pay, on average,
at least $363 more annually for
home insurance than home-
owners in high-income neigh-
borhoods, holding other factors
constant. Prices may be even
higher because of other fac-
tors—considered by some com-
panies in the calculation of
insurance prices—that are cor-
related with household income,
like credit report information,
educational attainment, and
occupation.

8/14/2019 The High Cost of Being Poor in Kentucky
http://slidepdf.com/reader/full/the-high-cost-of-being-poor-in-kentucky 8/52
■ Furniture, Appliances, and
Electronics: Fifty-nine percent
of rent-to-own customers earnless than $25,000 a year.
Reported prices for buying
from rent-to-own businesses
can double the price of a
product.■ Groceries: While smaller, and
often more expensive, grocery
stores are generally found in
Louisville and Lexington’s
lower-income neighborhoods,
the statewide picture inKentucky is quite different.
In fact, large grocery stores,
which typically offer lower
prices, are present in 35 per-
cent of lower-income
neighborhoods, while among
the highest-income neighbor-
hoods, only 19 percent have
large stores.
Kentucky has made substantial
investments in helping to boost
the income of lower-income
workers, but it has done little to
address problems on the other
side of a family’s ledger
Chronicled in the Governor’s
Summit on Quality of Life report,
Kentucky is already moving forward
on many fronts to reduce poverty
by increasing educational attain-
ment, creating job opportunities,and making work pay.2 State law-
makers have heavily invested in the
quality of education, both at the K-
12 and postsecondary levels. The
Kentucky Housing Trust Fund is
one of several initiatives to build
wealth among lower-income fami-
lies. Statewide outreach to increase
participation in programs such as
the federal Earned Income Tax
Credit (EITC) have ensured thatmillions of dollars are returned to
Kentucky’s families and likely spent
in the local economy. These efforts,
along with other well-established
state and federal initiatives, are
central to helping lower-income
workers move up the economic lad-
der and join the middle class.
Yet, Kentucky still stands out for
its low wages and very high poverty
rates. According to the most recent
census data, Kentucky has the sixth
lowest median income in the coun-
try, the fourth highest poverty rate,
and the eighth highest child
poverty rates. What’s more, the
Appalachian region of the state is
among the poorest areas in
country.3 Thus, although progress
has been made, much more is
needed.
Among the reasons why poverty in Kentucky has persisted despite
the state’s antipoverty investments
is that Kentucky, like most other
states, has focused almost all of its
antipoverty investments on strate-
gies to boost the income of the
poor. That emphasis makes sense to
some extent: Without rising
incomes, no one can move up the
income ladder. But, earnings and
assets represent only one side of the family budget ledger. In fact,
the spending side—the cost of liv-
ing—is also an obstacle to upward
mobility. Higher prices for basic
necessities diminish the ability of
earnings to foster economic mobil-
ity by thwarting efforts to save and
invest in their children, education,
homeownership, and retirement.
Higher costs of living also erode
the impact of investments in the
poor by making these programs
more costly than they need to be
and preventing more people from
climbing up the rungs of the eco-
nomic ladder.
In fact, some of the highest
prices for basic necessities in
Kentucky are in its poorest areas,
8/14/2019 The High Cost of Being Poor in Kentucky
http://slidepdf.com/reader/full/the-high-cost-of-being-poor-in-kentucky 9/52
including the Appalachian region,
where everything from mortgages to
insurance is comparably more
expensive than in most other areas
of the state. Faced with these
higher prices, a dollar earned by these families does less to help
them get ahead than if it were
earned by someone with a higher
income.
Kentucky can lower these higher
prices and do so in ways that defy
the traditional politics and fiscal
costs of initiatives that focus on
boosting the income of Kentucky’s
poor families. The poor do not
need to pay more.
The moment is ripe for public
and private leaders to reduce
both real and perceived higher
costs of doing business with
lower-income consumers, curb
market abuses that inflate prices,
and invest in consumer education
State and local leaders and their
private-sector partners should enact
reforms that reduce the unneces-sary cost burdens faced by these
same families. Specifically:■ Public and private leaders
should lower real and per-
ceived roadblocks to doing
business with lower-income
markets by promoting mar-
ket-based solutions.
Businesses will respond to
profitable opportunities to
engage lower-income con-
sumers and in doing so create
more options for these families
to lower their costs and get
ahead. Engaging the business
community should occur in
concert with community out-
reach to help promote main-
stream businesses among
lower-income households in
Kentucky.■ Public and private leaders
should weed out high-priced
businesses in lower-income
neighborhoods. At the locallevel, leaders can use their
licensing and zoning authority
to curb the development of
these businesses. At the state
level, leaders can enact stricter
regulations as well—as long as
there are responsible main-
stream alternatives in place.■ Public and private leaders
should help consumers navi-
gate the complex choices intoday’s market. Ultimately,
consumers must be able to
make smart bets on getting
ahead, which requires consid-
erable consumer savvy amid an
increasingly complex market.
Among the many choices con-
sumers now face are hundreds
of different mortgage products,
dozens of mortgage and insur-
ance companies, new breeds of
financial services, and the
growing importance of credit
reports and scores. To increase
consumer awareness,
Kentucky’s leaders should
expand access to the Internet
(with its wealth of consumer
information) among lower-
income families (64 percent of
Kentucky’s lower-income con-
sumers lack such access cur-
rently). Kentucky’s public and
private leaders also shouldbuild on financial education
investments by a) evaluating
the gaps in financial education
delivery in their jurisdictions;
b) using best practices to fill
those gaps; and c) establishing
a method for measuring the
impact of investments in finan-
cial education. ■
Among the reasons why poverty in Kentucky
has persisted despite the state’s antipoverty
investments is that Kentucky, like most other
states, has focused almost all of its antipoverty
investments on strategies to boost the incomeof the poor.

8/14/2019 The High Cost of Being Poor in Kentucky
http://slidepdf.com/reader/full/the-high-cost-of-being-poor-in-kentucky 10/52
8/14/2019 The High Cost of Being Poor in Kentucky
http://slidepdf.com/reader/full/the-high-cost-of-being-poor-in-kentucky 11/52
Over the past decade, sweeping
economic, market, and policy
changes in Kentucky all interactedto increase the market demand
among lower-income consumers for
basic necessities. Most importantly,
a growing economy over the last
decade, combined with major wel-
fare reform that tied benefits to
new work requirements, sent thou-
sands of lower-income families into
Kentucky’s labor force.6 In turn,
this spurred new demand for all of
the many necessities tied to work,including cars to get to a job,
houses to invest new paychecks in,
and financial services to save for,
buy, and protect assets.
As demand increased for these
necessities, the supply side of this
market too underwent significant
change. While mainstream busi-
nesses often missed this opportu-
nity to respond to surging demand,
numerous higher-priced alternative
businesses did. Over the past
decade, for instance, hundreds of
high-priced non-bank financial
services storefronts have popped up
in Kentucky to meet rising demand
among lower-income households
for check cashing, short-term loans,
tax preparation, and money wiring
services.7
At the same time, the growing
use of risk-based pricing helped
open up numerous lower-incomecredit markets once eschewed by
businesses, and greatly increased
lower-income consumers’ access to
a host of credit products, from
credit cards to mortgages.8
But, as demand for and the sup-
ply of necessities expanded in
Kentucky’s lower-income markets,
many of these new lower-income
customers were participating in a
marketplace without sound options.Bank accounts with high minimum
balance requirements and overdraft
fees, for instance, are often not
sensible for lower-income workers.
In addition, these lower-income
consumers were new (often the first
generation in their family to own a
home or have a car loan) to many of
these markets, such as mortgages
and insurance, leaving many of
them vulnerable to unscrupulous
practices. That is reflected by the
fact that Kentucky’s lower-income
consumers are comparatively less
informed when they enter into
these transactions. Only 30 percent
of lower-income families in
Kentucky, for example, have a solid
understanding of credit scores and
their importance to access and pric-
ing. Similarly, only about 15 percent
of Kentucky’s lower-income house-
holds shop and compare when they buy mortgages, and only about one-
half shop around when buying cars.
The result is that today lower-
income families in Kentucky are
often paying more for basic neces-
sities than their higher-income
neighbors, which impedes their
ability to get ahead while also hold-
ing back economic growth in the
state. This report examines the
prices charged to lower-incomefamilies in Kentucky for basic
necessities: financial services, auto-
related products, home financing
and household goods, and gro-
ceries. These products account for
approximately 70 percent of a typi-
cal household budget.9
On the basis of this analysis, our
bottom line is clear: for a wide
range of goods and services, lower-
income families pay more.
However, leaders in Kentucky have
a range of low-cost, practical,
bipartisan, and proven strategies for
lowering these higher prices, often
in ways that stimulate market
opportunities for Kentucky’s main-
stream businesses.10■
Introduction
Lower-income families in Kentucky often pay hundreds, some-
times thousands, of dollars more in higher prices for basic
necessities than their higher-income neighbors.4 Although
not a new problem, the costs today are much greater in scope.5

8/14/2019 The High Cost of Being Poor in Kentucky
http://slidepdf.com/reader/full/the-high-cost-of-being-poor-in-kentucky 12/52

8/14/2019 The High Cost of Being Poor in Kentucky
http://slidepdf.com/reader/full/the-high-cost-of-being-poor-in-kentucky 13/52
W e analyzed three basic
financial services:
check cashing, short-
term loans, and tax preparation.12
To determine how much consumers
typically pay for these services, we
used five major sources of data.
The first is the 2004 Survey of
Consumer Finances (SCF) admin-
istered by the Federal Reserve. This
survey estimates the proportion of
households in different income
groups that use mainstream bank-
ing services, such as banks and
credit unions. The survey is con-
ducted every three years and was
based in 2004 on interviews with
4,522 families.13 The second source
is a survey we commissioned,
which is described in more detail
below. The third data source is
information collected from banking
regulators in Kentucky and else-
where in the country.
Our fourth source of data is
Federal Deposit Insurance
Corporation (FDIC) records of
bank branch locations. We supple-
mented these data with information
on non-bank financial services in
Kentucky obtained from a direct
data request of the Kentucky Office
of Financial Institutions. We also
purchased data on credit unions
and other basic financial service
providers maintained by InfoUSA,
a private data vendor. In total, we
examined information on 2,963
providers of basic financial services,
from mainstream banks and credit
unions to nontraditional financial
services, such as check-cashing
establishments, payday lenders, and
pawnshops. We then used Census
2000 data to estimate the median
income in the neighborhood where
each establishment is located.
M E T H O D O L O G Y :
Measuring the
High Price of BeingPoor in Kentucky
W e use state and local consumer data from all 120 of
Kentucky’s counties, supplementing, where neces-sary, with national data (for more detail on data
sources, see below). Where data are unavailable for individual
consumers, we rely on neighborhood, county, or ZIP code data.
Unfortunately, no comparative data were available for other goods
and services than those outlined below, such as health care, enter-
tainment, apparel, and personal insurance.11
Basic Financial Services
8/14/2019 The High Cost of Being Poor in Kentucky
http://slidepdf.com/reader/full/the-high-cost-of-being-poor-in-kentucky 14/52
In Kentucky, approximately
72 percent of lower-income
households own at least one
car. We focus on three types of costs associated with automobile
ownership, including the purchase
price of the car, the cost of a loan,
and the cost of car insurance.14
To gauge purchase price differ-
ences, we rely on Scott Morton,
Zettelmeyer, and Silva-Risso’s
model that estimates the independ-
ent effect of a buyer’s income on
the price paid for a car.15 Using a
unique national database of morethan 650,000 car purchases, these
researchers developed a unique
model to control for more than two
dozen factors that might influ-
ence the price that different
customers pay for the same
automobile, including race-
ethnicity, educational attain-
ment, renter status, and
neighborhood income.16 Using
this model, we can estimatethe average mark-up fee drivers
from lower-income neighborhoods
typically pay.
To assess what different house-
holds pay to borrow the same
amount of money for an auto loan,
we again use the 2004 SCF.17 We
also analyze the price of insuring
the exact same car and driver in
different parts of state. On the
websites of three large insurers in
the state—Geico, Allstate, and
Progressive, which together
account for about 23 percent of
the national auto insurance mar-
ket—we entered a similar profile of
a car and driver and obtained auto
insurance premium quotes for the
minimum amount of legally
required insurance.18 To generate
as conservative an estimate as pos-
sible, we selected an optimal set of
characteristics for the driver: 35
years old, married, with a clean
driving record, a short (five-mile)daily commute to work, and lim-
ited annual mileage (between
10,000 and 15,000 miles). The car
was a five-year-old Ford Taurus,
which is approximately equal in
value to the median value of auto-
mobiles owned by individuals in
the lowest income quintile, accord-
ing to the 2004 SCF.
We entered this car and driver
profile for every ZIP code in thestate. With this data, we then used
the Census 2000 survey to estimate
the median income in each of these
ZIP codes.19 In this way, we were
able to analyze the relationship
between neighborhood income and
the price of auto insurance.
The analysis is not without limi-
tations. It does not, for example,
account for the credit or insurance
score of the driver and the role that
this information can play in shap-
ing auto insurance premiums.20 The
analysis also omits several factors
commonly believed to raise the
price of auto insurance for lower-
income drivers, including the dri-
ver’s occupation and educational
attainment.21 Stronger disclosure
laws in Kentucky would make such
an analysis possible.
Our analysis of housing
costs includes prices paid
for mortgages, home
insurance, and furniture and appli-ances. Although this does not
exhaust the list of important hous-
ing-related costs—such as mainte-
nance, rent, and property taxes—no
data suggest that prices for any of
these necessities are higher for
lower-income families than other
households in Kentucky.22
To examine how mortgage prices
vary by household income, we
looked at two data sets. The first isthe 2004 SCF. These data allow us
to compare how the typical amount
borrowed and the typical rate
charged for mortgages vary across
different income
categories.
We supplemented this analysis
with data from the 2006 Home
Mortgage Disclosure Act (HMDA),
which provides information on a
large share of mortgages originated
in the state. These data flag high-
priced loans, defined by the Federal
Reserve Board as those with an
annual percentage rate (APR) of 3
percentage points above compara-
ble Treasury notes for first liens,
and 5 percentage points above for
junior liens. The Federal Reserve
Board estimates that this definition
captures more than 95 percent of
the subprime market. Recent com-
Transportation Housing
In this study, we define lower-income neighborhoods
as any census tract in Kentucky whose median
income is lower than 80 percent of all other census
tracts in the country.

8/14/2019 The High Cost of Being Poor in Kentucky
http://slidepdf.com/reader/full/the-high-cost-of-being-poor-in-kentucky 15/52
parisons with private data, however,
suggest that the board’s definition
of “high cost” captures a substan-
tially smaller share of the subprime
market.24
To analyze the price of homeinsurance, we used a method simi-
lar to that described above for auto
insurance. To assess the price of
furniture and appliances, we used
two different resources. The first is
survey data collected by the Federal
Trade Commission, which analyzed
various characteristics associated
with 12,000 customers of rent-to-
own stores.25 The second resource
is the InfoUSA database describedabove. Using these data, we were
able to build a profile of rent-to-
own customers, while also illustrat-
ing where these establishments are
geographically concentrated, by
median household income, across
Kentucky.
Unfortunately, we were not
able to directly assess the
price of food at different
stores across the state.26 However,
because store size is strongly corre-
lated with the price of products, we
can make inferences about prices
based on store size.27 To do this, we
relied on a comprehensive data-
base—maintained by TDLinx—of
all grocery stores in Kentucky, from
“mom-and-pop” corner stores to
Wal-Mart—in other words, a very
diverse group of stores. This data-
base contains information about
each establishment’s location, size,
and annual revenue.
Lower-Income Families Defined
In this study, we define lower-
income neighborhoods as any cen-
sus tract in Kentucky whose
median income is lower than 80
percent of all other census tractsin the country. Lower-income
households are defined as any
household in Kentucky that earned
less than $20,000 in 2006, or
about 60 percent of the median
income in the state.
As with any measure of poverty
or lower income, there are impor-
tant limitations. First, a low
income can go farther in small
towns such as Hazard or Pikevillethan in cities such as Lexington or
Louisville, suggesting that a place-
specific measure of low income
may be more ideal. Second, not all
surveys measure the same units. A
family with children earning the
median income in the state is cer-
tainly less well off than an individ-
ual living alone with the same
income. Unfortunately, the data do
not allow us to make these distinc-tions. Similarly, ideally we would
have distinguished between indi-
viduals, households, and families,
but those distinctions were
unavailable in the datasets used in
this report. For these reasons, we
refer to “lower-income” house-
holds, consumers, and neighbor-
hoods throughout the results
section of this analysis, and con-
trast these units to either all other
households in Kentucky or specifi-
cally “higher-income” households,
consumers, and neighborhoods.
The Survey of KentuckyConsumers
The Brookings Institution commis-
sioned the University of Kentucky’s
Survey Research Center to admin-
ister a statewide survey of
Kentucky households in winter
2007.28 Households were selected
using a modified list-assisted
Waksber-Mitofsky random-digit
dialing procedure, which ensures
every residential telephone line inKentucky had an equal probability
of being called. Calls were made
from January 19 through February
24, 2007. Callers made up to 15
attempts with each number in the
sample. In addition, callers made
up to 10 scheduled return calls to
those who were reached at an
inconvenient time. Callers also
made a one-time attempt to con-
vert refusals. This procedureresults in a representative sample
of the Kentucky population of
households based on 830 com-
pleted interviews. The response
rate for the survey was 33.7 per-
cent. The margin of error is
approximately 3.4 percentage
points at a 95 percent confidence
level. A full review of the survey is
included in the appendix. ■
Groceries
Income thresholds for households and neighborhoods
Households Neighborhoods
Lower Income Below $20,000 Below $33,392
Moderate Income $20,000 – $39,999 $33,392 – $42,006
Middle Income $40,000 – $59,999 $42,007 – $51,613
Higher Middle Income $60,000 – $79,999 $51,614 – $67,301
High Income $80,000 and up $67,302 and up
Income thresholds for households and neighborhoods
8/14/2019 The High Cost of Being Poor in Kentucky
http://slidepdf.com/reader/full/the-high-cost-of-being-poor-in-kentucky 16/52
Lower-income families in
Kentucky tend to pay more
for basic financial services
than higher-income families
because of their greater reliance on
high-cost non-bank financial serv-
ice companies, including check
cashers, payday lenders, pawn-
shops, and tax preparation firms
that sell refund anticipation loans.
Depending on where lower-income
families live and the types of serv-
ices they consume, these higher
costs can range from a few dollars
to more than $2,000 annually.29
Lower-income consumers are
much more likely than higher-
income consumers to pay high
prices to cash checks and take
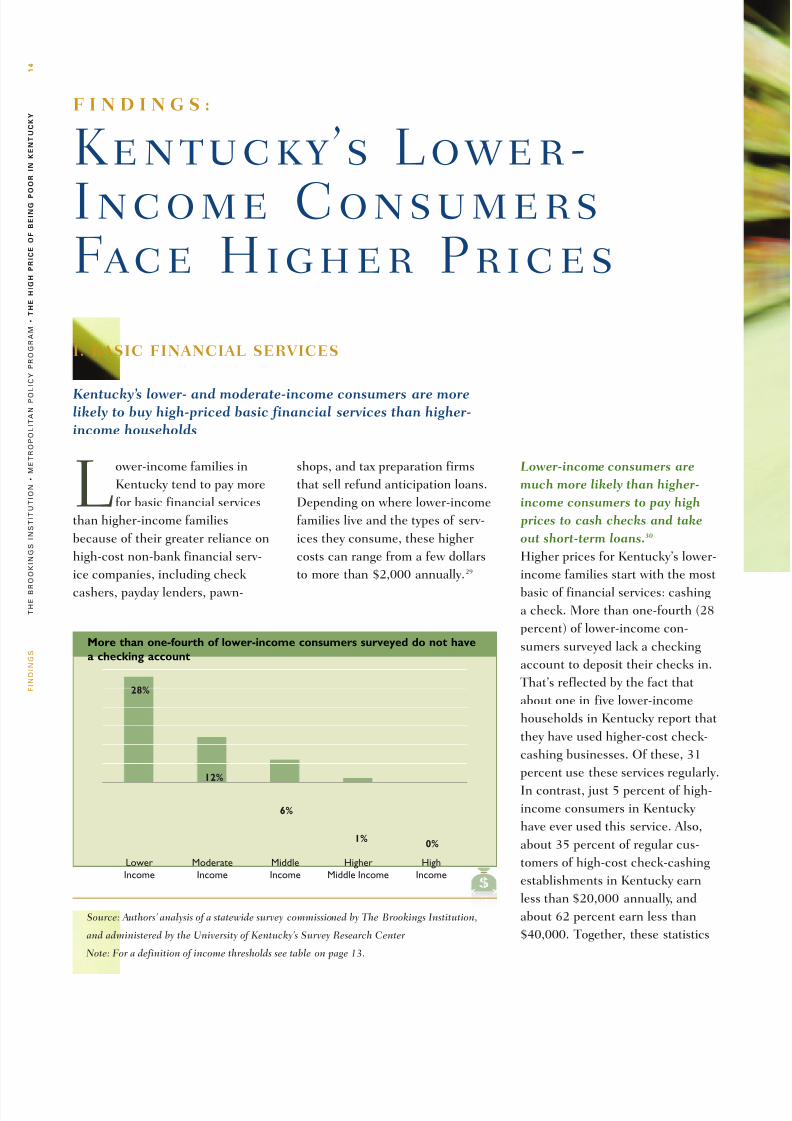
out short-term loans.30
Higher prices for Kentucky’s lower-
income families start with the most
basic of financial services: cashinga check. More than one-fourth (28
percent) of lower-income con-
sumers surveyed lack a checking
account to deposit their checks in.
That’s reflected by the fact that
about one in five lower-income
households in Kentucky report that
they have used higher-cost check-
cashing businesses. Of these, 31
percent use these services regularly.
In contrast, just 5 percent of high-
income consumers in Kentucky
have ever used this service. Also,
about 35 percent of regular cus-
tomers of high-cost check-cashing
establishments in Kentucky earn
less than $20,000 annually, and
about 62 percent earn less than
$40,000. Together, these statistics
F I N D I N G S :
Kentucky ’s Lower-
Income ConsumersFace Higher Prices
Kentucky’s lower- and moderate-income consumers are morelikely to buy high-priced basic financial services than higher-
income households
Source: Authors’ analysis of a statewide survey commissioned by The Brookings Institution,
and administered by the University of Kentucky’s Survey Research Center
Note: For a definition of income thresholds see table on page 13.
More than one-fourth of lower-income consumers surveyed do not have
a checking account
High
Income
Higher
Middle Income
Middle
Income
Moderate
Income
Lower
Income
28%
12%
6%
1%0%
I. BASIC FINANCIAL SERVICES
8/14/2019 The High Cost of Being Poor in Kentucky
http://slidepdf.com/reader/full/the-high-cost-of-being-poor-in-kentucky 17/52

8/14/2019 The High Cost of Being Poor in Kentucky
http://slidepdf.com/reader/full/the-high-cost-of-being-poor-in-kentucky 18/52
point to the broadly higher demand
for check-cashing services among
Kentucky’s lower-income house-
holds compared to those with a
higher income.
Unlike most other states,Kentucky places no limits on the
fees that can be charged for this
service. A random survey of such
establishments in Kentucky found
that fees to cash a check range
between 1 and 10 percent of the
face value of a check; and the
median fee that Kentucky’s check-
cashing customers report paying is
about 5 percent of a check’s value.
For the customer earning anafter-tax income approximately
equal to the minimum wage in the
state, or $10,500 annually, paying
to cash a check (at 5 percent of the
check’s face value) adds up to more
than $500 annually.
Certainly, check-cashing busi-
nesses provide an essential service
for some of these unbanked lower-
income families, particularly those
who lack the paperwork (e.g., adriver’s license) that most banks
require of prospective customers,
or who had trouble maintaining
bank accounts in the past. Yet, that
service comes with a steep price
because the check casher’s busi-
ness model is built around and sus-
tained by very high prices. Where
banks pay for their operating costs,
such as employees, utilities, and
brick and mortar retail branches, by
selling a suite of financial services,
most check-cashing businesses only
sell a handful of financial service
products. With fewer products to
sell and similar capital costs,
check-cashing establishments must
sell their smaller number of prod-
ucts at comparably higher prices.
Yet, there is growing market pres-
sure to lower those higher prices.
Recent industry reports suggest
that a growing number of banks
have started offering accounts with
no maintenance fees, no minimum
balance requirements, and no
check-cashing fees.31 This fits with
our finding in the statewide survey
we commissioned: Only 15 percent
of Kentuckians report paying a
monthly fee to maintain an
account, including only about 27
percent of the lower-income house-
holds that already have a checking
account. As that trend spreads,
banking accounts should look
increasingly more attractive to
lower-income consumers in the
state.
Another promising trend for
lower-income families are the grow-
OO
GS
S
U
O
O
O
O
C
OG
G
C
O
G
O
O
U
C
6
GS
Source: Authors’ analysis of a statewide survey commissioned by The Brookings Institution,
and administered by the University of Kentucky’s Survey Research Center
Note: For a definition of income thresholds see table on page 13.
Many more lower-income households use check-cashing services than
high-income households
High
Income
Higher
Middle Income
Middle
Income
Moderate
Income
Lower
Income
HighIncome
HigherMiddle Income
MiddleIncome
ModerateIncome
LowerIncome
31%
20%
10%9%
5% 5%
3%5%
15%
0%
Proportion of households that have used check-cashing businesses
Proportion of check-cashing customers who regularly use service

8/14/2019 The High Cost of Being Poor in Kentucky
http://slidepdf.com/reader/full/the-high-cost-of-being-poor-in-kentucky 19/52
ing use of stored value cards. Banks
sell these password protected debit
cards to employers. Employers in
turn deposit employees’ pay on a
debit card instead of issuing a pay-
check. Banks see these products as
a way to improve their value to cor-
porate customers, and employers
see this as an easy way to promote
savings and wealth among their
employees, while saving money on
check processing and printing.32
Unfortunately, it is difficult to
know how widespread either mar-
ket trend is in Kentucky, making it
incumbent for policy leaders to sort
out and promote appropriate bank-
ing products in the state’s lower-
income markets. In neighborhoods
where they already exist, leaders
should promote and market those
products; where they do not, lead-
ers need to use one of the various
incentives discussed at the end of
this report to foster a profitable
market for these products.
Higher prices paid by
Kentucky’s lower-income house-holds go beyond just cashing a
check. For those 72 percent sur-
veyed who already have checking
accounts, more than 20 percent
has used a high-priced payday
loan, pawnshop, or title-lending
establishment for short-term cash
advances, instead of or in addition
to lower-priced credit cards. In
contrast, just 3 percent of higher-
income consumers have usedthis product. What’s more, nearly
70 percent of regular customers of
high-cost payday loan and pawn-
shops in Kentucky have a lower
income.
The market for these high-priced
services in Kentucky is vast and
rapidly growing. Between 1999 and
2006, the number of payday lender
retail locations grew by 121 percent
in Kentucky. New establishmentsnow open in Kentucky at the rate
of one every four days, collecting
an estimated $145 million in fees
from their mostly lower- and mod-
erate-income customer base.33 This
growth was even faster at the
national level, however. In 1992,
there were about 300 such estab-
lishments in the country, but by
2006 that number had grown to
more than 20,000, issuing $40 bil-
lion annually in loans. Together
with other high-priced non-bank
lenders, they collected more than
$10 billion in fees.34
In Kentucky, fees add up so
quickly because these businesses
are allowed to charge up to 38
times more than the fee charged by
Source: Authors’ analysis of a statewide survey commissioned by The Brookings Institution,
and administered by the University of Kentucky’s Survey Research Center
Note: For a definition of income thresholds see table on page 13.
Demand for payday and other nontraditional loans are much higher in
lower-income households, and lower-income households are slightly
more likely to use these services regularly
High
Income
Higher
Middle Income
Middle
Income
Moderate
Income
Lower
Income
High
Income
Higher
Middle Income
Middle
Income
Moderate
Income
Lower
Income
18%
21%
8% 8%
1%
3%
0%
16%
0%
14%
Proportion of households that have used these businesses
Proportion of customers who regularly use service

8/14/2019 The High Cost of Being Poor in Kentucky
http://slidepdf.com/reader/full/the-high-cost-of-being-poor-in-kentucky 20/52
the average credit card for the same
loan amount. To put that number
in perspective, a family with one
salaried worker netting $30,000 a
year would pay about $270 to bor-
row $300 six times a year from a
payday lender. Several states havebarred such services, including
Georgia, Maryland, North Carolina,
and West Virginia.
Lower-income families are also
more likely than higher-income
families to use pawnshops.35 In
Kentucky, pawnshop fees range up
to 22 percent per month. Although
lower than fees charged by payday
lenders in the state, that rate is still
10 times higher than that charged
by the average credit card company.
In comparison, fees for pawnshops
in other Southern states range from
no limit (in Arkansas and West
Virginia) to 20 percent or more (in
nearly every other state in theregion).
Consumers who overdraw their
checking accounts, effectively using
them as a source of short-term
loans, can also pay high prices.36
For instance, one major bank in
Kentucky charges more than $30
per overdraft, or bounced check.
Used six times in a year, this “serv-
ice” would cost $180—still high,
but less than the $270 to borrow $1,800 from a payday lender. If
that family splits that overdraft fee
between two bounced checks,
though, these fees can quickly out-
pace charges levied by alternative
sources.
But, unlike payday loan cus-
tomers, who tend to be lower and
moderate income, higher-income
households are about as likely as
lower-income households to bouncea check. According to our survey of
Kentucky households, approxi-
mately 42 percent of lower-income
households report having bounced
a check compared with about
44 percent of the highest-income
households. Overdraft fees associ-
ated with those bounced checks will
add up to steep prices for all income
groups.
THEBROOKINGSINSTITUTION
METROPOLITAN
POLICY
PROGRAM
THE HIG
H PRICE O
F
BEIN
G
P
O
O
R IN
KEN
TU
CKY
18
FINDINGS
Source: Authors’ analysis of data from the Kentucky Office of Financial Institutions
The number of payday loan services in Kentucky has more than doubled
since 1999
20062005200420032002200120001999
352398
440470
544
641
695
779
Consumers who overdraw their checking accounts,
effectively using them as a source of short-term
loans, can also pay high prices.
8/14/2019 The High Cost of Being Poor in Kentucky
http://slidepdf.com/reader/full/the-high-cost-of-being-poor-in-kentucky 21/52
Lower-income consumers are
also more likely than higher-
income consumers to pay high
fees to get their tax returns
quickly
According to our survey of
Kentucky households, more than29 percent of lower-income con-
sumers pay to have their taxes pre-
pared compared with 52 percent of
all other households.37 Demand
may be lower among Kentucky’s
lower-income households for tax
preparers because fewer of these
households file taxes, and there are
now widespread efforts in the state
to provide free tax preparation serv-
ices for the state’s lower-income
households.
Nevertheless, demand exists
among the state’s lower-income
households for fee-based tax prepa-
ration services in part because of
their higher relative demand for
refund anticipation loans, another
short-term loan product that
advances the estimated tax refund
for a fee. In fact, our survey of
Kentucky households indicates that
about 33 percent of lower-income
households that use a paid tax pre-
parer claim the refund anticipation
loan. That compares with 17 per-cent of households in Kentucky
earning between $20,000 and
$39,999; 19 percent of households
earning between $40,000 and
$59,999; 6 percent of households
earning between $60,000 and
$79,999; and 5 percent earning
more than $80,000.38 Although no
nationwide or regional estimate of
the cost these loans exists, one
recent study suggests that fees gen-
erally range between $10 and $80.39
The higher demand among lower-
income consumers in Kentucky
for non-bank, high-priced finan-
cial services is reflected in the
dense concentration of these
businesses in Kentucky’s lower-income communities
The highest per capita concentra-
tion of alternative check-cashing
and short-term loan providers is
found in the lowest-income neigh-
borhoods statewide.40 There are
997 alternative financial services in
the state. In the lowest-income
communities, there is one of these
establishments for every 3,047 resi-
dents. In contrast, communities inKentucky with the highest income
have one establishment for every
17,580 residents.
These statewide trends are
reflected in the state’s population
centers: Louisville, Lexington, and
Owensboro. Among these areas,
Louisville shows the starkest con-
trast across its neighborhoods, with
one of these alternative financial
services for every 2,457 residents inits lower-income neighborhoods. In
contrast, there is just one of these
establishments per 56,704 resi-
dents in Louisville’s highest-income
neighborhoods
However, mainstream financial
institutions are poised to more
aggressively compete with these
alternative providers. Besides the
fact that over 72 percent of
Kentucky’s lower-income house-
holds already have a checking
account; statewide, 57 percent of
the lower-income neighborhoods
surveyed have at least one bank or
credit union. Moreover, each
county in the state has at least one
bank or credit union. In fact, a
majority of these high-cost non-
Source: Authors’ analysis of data from the Kentucky Office of Financial Institutions,
Federal Deposit Insurance Corporation, and InfoUSA
Note: For a definition of income thresholds see table on page 13.
Payday loan and check-cashing services are disproportionately located in
lower-income neighborhoods
High
Income
Higher
Middle Income
Middle
Income
Moderate
Income
Lower
Income
1,9623,047
1,910
3,5302,424
4,325
2,223
7,752
1,941
17,580
Population per check casher/non-bank short-term lender
Population per bank or credit union
8/14/2019 The High Cost of Being Poor in Kentucky
http://slidepdf.com/reader/full/the-high-cost-of-being-poor-in-kentucky 22/52
bank financial service companies
are often just down the street from
mainstream banks and credit
unions. Among Kentucky’s commu-
nities with an alternative financial
provider, 87 percent also had a
mainstream financial institution.
Why do lower-income consumers
face these higher-priced financial
services?
Three major market dynamics drive
consumers’ purchasing decisions,
each of which can be targeted by
policymakers.
Banks and credit unions face both
real and perceived higher costs of
doing business with lower-income
consumers. With smaller amounts of
money to cover the costs of living,
lower-income consumers are much
more likely to fall behind on credit
and loan bills compared to otherborrowers.41 While that propensity
can be overstated, it still exists and
helps drives up the costs of selling
basic financial services to the poor,
and deters banks and credit unions
from marketing products to lower-
income consumers.42 At a minimum,
lower-income consumers, for exam-
ple, need a checking account with
no or very low minimum balance
requirements, an affordable over-draft protection plan, and no or very
low maintenance fees.
Banks in Kentucky and else-
where are also at a disadvantage in
these markets because of regulatory
requirements that require substan-
tial paperwork and private financial
information for opening accounts,
requirements not imposed on alter-
native financial services. Traditional
banks are also at an unfair advan-tage given the high fees alternative
services can charge, as noted
above. Together, these market
dynamics mean that introducing
new products and services in lower-
income markets can be relatively
expensive for banks and credit
unions, creating both real and per-
ceived costs of selling mainstream
financial service products to
Kentucky’s lower-income con-
sumers.
Questionable business practices
also drive up prices in lower-income
markets. In some cases, this means
that regulatory protections are
insufficient. As this section has
noted, for instance, Kentucky’s
THEBROOKINGSINSTITUTION
METROPOLITAN
POLICY
PROGRAM
THE HIG
H PRICE O
F
BEIN
G
P
O
O
R IN
KEN
TU
CKY
20
FINDINGS
Source: Authors’ analysis of a statewide survey commissioned by The Brookings Institution,
and administered by the University of Kentucky’s Survey Research Center
Note: For a definition of income thresholds see table on page 13.
Lower- and moderate-income families surveyed are more likely to have
fallen behind on a mortgage payment
High
Income
Higher
Middle Income
MIddle
Income
Moderate
Income
Lower
Income
19%
17%
5%4%
0%
In Kentucky, the most often cited reason for
unbanked households to not use banks and credit
unions is that they have never really thought about
opening up a bank account.

8/14/2019 The High Cost of Being Poor in Kentucky
http://slidepdf.com/reader/full/the-high-cost-of-being-poor-in-kentucky 23/52
Consumers from lower-income
neighborhoods typically paybetween $50 and $500 more for
the same car than consumers
from higher-income neighbor-
hoods
Most lower-income households sur-
veyed in Kentucky own at least one
car. In such a rural state, cars are
often imperative to travel between
work and homes.
Most lower-income car owners
will have paid a higher price for theexact same car than higher-income
households. Although several stud-
ies have attempted to explain thisdynamic, Scott Morton and her
colleagues’ is probably the most rig-
orous (see the Methodology section
for a description).44 After control-
ling for several factors known to
influence car prices (make and
model of car, when sold, and so
forth), they find that race, educa-
tion, homeowner status, and neigh-
borhood income all help drive up
prices by a typical amount of between $50-$500 in extra charges
check-cashing businesses have no
limit on the fees they can chargefor check-cashing services, com-
pared to states like West Virginia
and New York, where fees are
capped at under 2 percent of the
face value of a check. Similarly,
Kentucky’s short-term loan
providers can charge a rate that is
35 to 40 times higher than the
average rate charged by credit card
companies. In reaction to the high
prices charged by short-term loanproviders, other Southern and bor-
der states, like Georgia, Maryland,
North Carolina, and West Virginia,
have banned payday lending alto-
gether, and Virginia has set a
maximum monthly pawn fee of
10 percent.
Finally, there is a consumer edu-
cation gap between lower- and
higher-income consumers, driving
lower-income consumers to buy financial service products that are
not in their best financial interest.
In Kentucky, the most often cited
reason for unbanked households to
not use banks and credit unions is
that they have never really thought
about opening up a bank account;
the next most cited reason is that
these consumers do not trust banks
with their money; and the next is
that there is too much paperwork.
These responses point to the very
real opportunity that Kentucky’s
leaders have to bring more
Kentuckians, particularly those
with a lower income, into the
financial mainstream. There is not
a good reason to do otherwise.
About three of every four lower-income households surveyed in
Kentucky owns a car. Although many of these cars are less expen-
sive than those owned by higher-income families, evidence suggests
that households in lower-income neighborhoods tend to pay higher prices
for cars, auto loans, and insurance.43
Lower- and moderate-income consumers are more likely than
higher-income households to pay higher prices for cars and
related products.
II. CARS

8/14/2019 The High Cost of Being Poor in Kentucky
http://slidepdf.com/reader/full/the-high-cost-of-being-poor-in-kentucky 24/52

8/14/2019 The High Cost of Being Poor in Kentucky
http://slidepdf.com/reader/full/the-high-cost-of-being-poor-in-kentucky 25/52
Surveyed drivers from lower-
income communities pay, on
average, $384 more per year
for auto insurance than high-
income drivers
Across Kentucky, the highest prices
for auto insurance in our sample of
quotes from three major insurance
companies are found in the state’s
lowest-income neighborhoods.
On average, car owners in lower-
income neighborhoods paid $384
more annually to insure the same
low-cost car versus in high-income
neighborhoods.
Residents of both urban and
rural communities pay higher
prices for auto insurance. However,
the higher prices for insurance are
concentrated in the eastern coun-
ties of the state, the most danger-
ous areas of the state in which to
drive. In Rowan and Bath counties,
for example, a married driver with a
perfect driving history and a car
worth $5,100 would pay $624 for
insurance. That same driver would
pay more than $1,600 a year to
insure the same car in the eastern
counties of Floyd or Johnson.
Couple these regional differ-
ences with differences by occupa-
tion, credit score, and education—
characteristics highly associated
with income, and also factored into
pricing decisions by some compa-
nies—and lower-income drivers
may pay even steeper prices.45 This
suggests, though it certainly does
not prove, that lower-income driv-
ers may systematically pay higher
prices for auto insurance. But,
more than any other issue we dis-
cuss in this report, the dearth of
good data impairs our understand-
ing of the relationship between
income and insurance prices.
Residents in the eastern part of the state pay the highest auto insurance rates
Jefferson County
Average sample annual premium (2006)
Low ($753 or less)
High ($1,340 or more)
Unknown
$754 – $817
$818 – $925
$926 – $1,339
Fayette County
Source: Authors’ analysis of data from major home insurance providers
Notes: Sample rates were obtained for a driver who is 35 years old, married, has a clean driving record, commutes five minutes daily, and
drives between 10,000 and 15,000 miles annually. Values are shown by ZIP code. Colors represent quintiles of average sample premiums
across Kentucky; the most darkly colored ZIP codes, for instance, have higher average sample insurance rates than those in 80 percent of all
other ZIP codes in the state.

8/14/2019 The High Cost of Being Poor in Kentucky
http://slidepdf.com/reader/full/the-high-cost-of-being-poor-in-kentucky 26/52
THEBROOKINGSINSTITUTION
METROPOLITAN
POLICY
PROGRAM
THE HIG
H PRICE O
F
BEIN
G
P
O
O
R IN
KEN
TU
CKY
24
FINDINGS
Source: Authors’ analysis of a statewide survey commissioned by The Brookings Institution,
and administered by the University of Kentucky’s Survey Research Center
Note: For a definition of income thresholds see table on page 13.
Lower-income families surveyed are less likely than others to compare
prices on cars before buying
High
Income
Higher
Middle Income
Middle
Income
Moderate
Income
Lower
Income
58%55%
39%
60%
44%41%
72%
40%40%
65%
37%41%
71%
48%
39%
Proportion who compared car insurance prices before purchase
Proportion who compared car loan prices before purchase
Proportion who compared car prices before purchase
Source: Authors’ analysis of a statewide survey commissioned by The Brookings Institution,
and administered by the University of Kentucky’s Survey Research Center
Note: For a definition of income thresholds see table on page 13.
More than 70 percent of lower-income Kentuckians surveyed have little
understanding of credit reports and the impact they have on pricing for
loans and insurance
High
Income
Higher
Middle Income
Middle
Income
Moderate
Income
Lower
Income
71% 70%
51% 54%57%
Why are these auto and auto-
related products more expensive
for lower-income households?
Three factors cause these higher
prices:
Sellers of these auto products face real and perceived risks for
of doing business in lower-income
neighborhoods. Lower-income con-
sumers in Kentucky are more likely
to miss loan payments and to live
in areas with higher insurance
rates.46 In the lower-income area of
eastern Kentucky, for example, road
conditions, the presence of coal
trucks, and the limited number of
accessible auto repair businessesmay each play a part in the higher
premiums lower-income drivers pay.
Businesses in turn pass on these
higher costs to consumers in the
form of higher prices. These real
higher costs also can foster a per-
ception of higher costs of doing
business with these consumers,
particularly when measurement of
risks is imprecise, such as with
insurance pricing.Questionable business practices
inflate the prices charged to
lower-income consumers for car-
related necessities. Evidence that
car dealers systematically charge
higher prices for black customers is
one example of unscrupulous,
price-inflating behavior.47 Also, the
much higher interest rates lower-
income drivers pay for auto loans
may, in addition to poor credit or
payment histories, also stem from
unscrupulous businesses inflating
While a modestly higher proportion of lower-income households
report that they did not shop around before buying an auto loan,
about the same proportion across income groups report that they
shopped around before buying a car and car insurance.

8/14/2019 The High Cost of Being Poor in Kentucky
http://slidepdf.com/reader/full/the-high-cost-of-being-poor-in-kentucky 27/52
Kentucky’s lower-income home-buyers are twice as likely as
higher-income households to buy
a high-cost mortgage
More than 41 percent of lower-
income households that bought a
home in 2005 have what the
Federal Reserve defines as a high-
cost mortgage, compared with just
16 percent of high-income house-
holds.49 These high-cost mortgages
add up to considerable sums of
extra money, which could have
been devoted to savings and invest-
ments. For instance, the monthly
payment on a typical high-cost
mortgage for a median-priced home
in 2005 would be approximately
$807 a month, or about $290,000over the course of a fixed-rate 30-
year loan. In contrast, homeowners
with a standard mortgage would
pay approximately $605 a month,
or $218,000 over the course of a
loan, or a savings of more than
$70,000 compared with the high-
cost mortgage.50
Although Kentucky’s lower-
income consumers are much more
likely than other consumers to pay
high prices for mortgages, they are
not the majority of the high-cost
market. In fact, of the 40,000 high-
cost mortgages originated in
Kentucky in 2005, lower-income
households bought only about
prices. One could infer from the
faster rise in car ownership rate
among lower-income families than
among higher-income families that
many of these customers may not
have the experience or knowledgeto spot and avoid unscrupulous
businesses that overcharge.48
Finally, a consumer education
gap exists between lower- and
higher-income consumers. More
than 70 percent of lower- and mod-
erate-income Kentuckians surveyed
have little understanding of credit
reports and the impact they have
on pricing for loans and insurance
compared to about 51–57 percentin higher-income groups. Without
that knowledge, unscrupulous car
dealers, lenders, and insurance
agents can easily justify high prices
by confusing the customer about
the real risks they pose to the
seller. Still, the differences between
Kentucky’s income groups in con-
sumer knowledge are less pro-
nounced when it comes to buying
auto-related necessities comparedto other necessities. While a mod-
estly higher proportion of lower-
income households report that they
did not shop around before buying
an auto loan, about the same pro-
portion across income groups
report that they shopped around
before buying a car and car insur-
ance. This doesn’t mean they bring
the same amount of information to
the bargaining table, but it cer-
tainly means they’re taking a criti-
cal step to gather that information
at about the same rates as everyone
else in the state.
Of those buying homes in 2005, more lower-income households
surveyed have a high-cost mortgage than higher-income house-
holds. Home insurance is also more expensive for lower-income
families. When furnishing their homes, more lower-income consumers use
high-priced rent-to-own stores than higher-income families surveyed. This
section explains each of these higher prices in more depth.
Lower- and moderate-income consumers are more likely than
higher-income households to pay higher prices for home-related products
III. HOMES

8/14/2019 The High Cost of Being Poor in Kentucky
http://slidepdf.com/reader/full/the-high-cost-of-being-poor-in-kentucky 28/52

8/14/2019 The High Cost of Being Poor in Kentucky
http://slidepdf.com/reader/full/the-high-cost-of-being-poor-in-kentucky 29/52
and rural areas as they are for car
insurance. Counties in the south-
ern and southeastern sections of
the state have average home insur-
ance rates of more than $1,600 a
year compared with an average rate
of less than $1,200 in the more
urban western and northern areas
of the state.
Nevertheless, these analyses of
home insurance rates are limited in
that we only examine how rates
vary across neighborhoods, rather
than across individuals. Home
insurance prices could be higher
for lower-income homeowners in
Kentucky because some of their
personal characteristics raise prices
on insurance, such as credit score,
occupation, and education, all of
which are closely correlated with
household income.51 However, the
limited disclosure laws in the insur-
ance industry limit the available
data to analyze the full impact of
these factors.
Kentucky’s lower-income con-
sumers also tend to pay more for
furniture and appliances because
they more frequently shop at
rent-to-own establishments
Lower-income consumers are much
more likely than higher-income
consumers to buy furniture and
appliances from rent-to-own stores.
A recent analysis by the Federal
Trade Commission (FTC) found
that 59 percent of rent-to-own cus-
tomers earn less than $25,000 a
year.52 Renting to own means that
Lower-income families in rural areas of the state pay the highest home insurance rates
Jefferson County
Average sample annual premium (2006)
Low ($1,170 or less)
High ($1,671 or more)
Unknown
$1,171 – $1,365
$1,366 – $1,540
$1,541 – $1,670
Fayette County
Source: Authors’ analysis of data from major home insurance providers
Notes: Values are shown by ZIP code. Colors represent quintiles of average sample premiums across Kentucky; the most darkly colored ZIP
codes, for instance, have higher average sample insurance rates than those in 80 percent of all other ZIP codes in the state.
8/14/2019 The High Cost of Being Poor in Kentucky
http://slidepdf.com/reader/full/the-high-cost-of-being-poor-in-kentucky 30/52
consumers pay more for a piece of
furniture or electronics than if they
simply bought the item outright
because of numerous fees these
stores charge.
Because Kentucky’s disclosurelaws in the rent-to-own industry are
limited, statewide estimates of the
prices charged by rent-to-own
establishments are unavailable.
However, analyses from other states
suggest that a washing machine
could cost more than $1,000 if
purchased from a rent-to-own busi-
ness.53 In contrast, a consumer who
bought that same washing machine
with a credit card charging a 24
percent interest rate would pay just
$480 over an 18-month period.54
Processing fees, delivery fees,
installation fees, in-home collection
fees, home pick-up fees, product
insurance fees, and late paymentfees all account for these higher
prices at rent-to-own establish-
ments.55
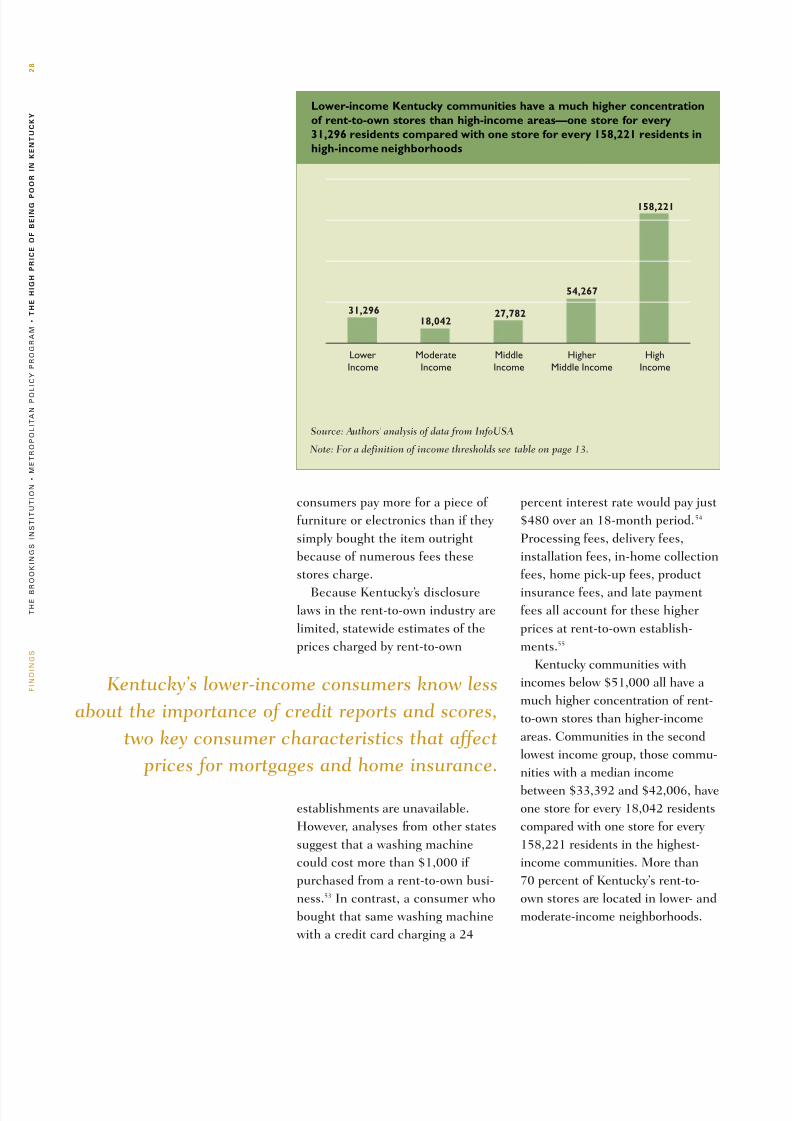
Kentucky communities with
incomes below $51,000 all have a
much higher concentration of rent-
to-own stores than higher-income
areas. Communities in the second
lowest income group, those commu-
nities with a median income
between $33,392 and $42,006, have
one store for every 18,042 residents
compared with one store for every
158,221 residents in the highest-
income communities. More than
70 percent of Kentucky’s rent-to-
own stores are located in lower- and
moderate-income neighborhoods.
THE
BROOKINGS
INSTITUTION
M
ETROPOLITAN
PO
LICY
PROGRAM
THE
HIG
H
PRICE
O
F
BEIN
G
P
O
O
R
IN
KEN
TU
CKY
28
FINDINGS
Source: Authors’ analysis of data from InfoUSA
Note: For a definition of income thresholds see table on page 13.
Lower-income Kentucky communities have a much higher concentration
of rent-to-own stores than high-income areas—one store for every
31,296 residents compared with one store for every 158,221 residents in
high-income neighborhoods
High
Income
Higher
Middle Income
Middle
Income
Moderate
Income
Lower
Income
31,29618,042
27,782
54,267
158,221
Kentucky’s lower-income consumers know less
about the importance of credit reports and scores,
two key consumer characteristics that affect
prices for mortgages and home insurance.

8/14/2019 The High Cost of Being Poor in Kentucky
http://slidepdf.com/reader/full/the-high-cost-of-being-poor-in-kentucky 31/52
Why are home-related purchases
more expensive for lower-income
consumers?
To bring down prices for lower-
income families, leaders should
address three market dynamics thatdrive up these prices:
Businesses incur some higher
costs of doing business when serv-
ing lower-income markets. As
reported in an earlier figure, lower-
income homeowners in Kentucky
are four times more likely to fall
behind on mortgage payments than
are higher-income homeowners,
and therefore lenders face higher
costs of doing business with lower-
income consumers. These costs are
rationally passed on to consumers.
Higher delinquency rates among
lower-income borrowers also lower
their credit scores, which makes
these consumers appear more
risky.56 These real higher costs also
drive perceptions of higher costs,
even when there may be limited
data to support those perceptions.
Questionable practices by some
businesses drive up housing prices
for lower-income families.
Research has indicated that asmany as 20 percent of all borrowers
who purchased a high-cost mort-
gage could have qualified for a
lower-priced mortgage, which
would have saved them hundreds,
sometimes thousands, of dollars in
interest charges every year.57
Similarly, state regulators are ask-
ing whether insurance rating terri-
tories—like ZIP codes—and other
non-house-related criteria should
be used by insurance companies to
determine prices, given that several
of these criteria vary systematically
with household income. “The bot-
tom line” according to Florida’s
General Counsel to the Office of
Insurance Regulation, “is we
believe the lowest income strata
have the worst credit scores, and
they are paying higher rates as a
result of that.”58 Here, the theory is
that by removing this variable in
the calculation of insurance prices,
leaders will be able to lower theprice of insurance for lower-income
households.
Lower-income consumers tend
to be less informed than higher-
income consumers about mort-
gages and other home-related
purchases. In Kentucky, we found
that more than 86 percent of sur-
veyed lower-income homeowners
did not compare prices before
choosing their mortgage, while 51percent of higher-income home-
owners did so. Research indicates
that consumers who comparatively
shop pay lower prices than those
who do not.59
As noted above, Kentucky’s
lower-income consumers know less
about the importance of credit
reports and scores, two key con-
sumer characteristics that affect
prices for mortgages and homeinsurance. Without that knowledge,
Kentucky’s lower-income consumers
may buy homes without first assess-
ing whether they would be better
off waiting and first improving their
credit scores, which will improve
the loan and insurance prices for
which they qualify.
Source: Authors’ analysis of a statewide survey commissioned by The Brookings Institution,
and administered by the University of Kentucky’s Survey Research Center
Note: For a definition of income thresholds see table on page 13.
Roughly one-half of middle- to high-income homebuyers compare mort-
gage prices before buying compared with only 14 percent of lower-
income homeowners surveyed
High
Income
Higher
Middle Income
Middle
Income
Moderate
Income
Lower
Income
14%
31%
49%
44%
49%

8/14/2019 The High Cost of Being Poor in Kentucky
http://slidepdf.com/reader/full/the-high-cost-of-being-poor-in-kentucky 32/52
In fact, larger grocery stores
are more highly concentrated
throughout the state in lower- and
moderate-income neighborhoods
than in higher-income neighbor-
hoods. In particular, there is one
large grocery for every 7,693 resi-
dents of the state’s lower-income
communities, compared with one
large store for every 22,603 resi-
dents of a high-income community.
The story is different in
Louisville and Lexington, however,
where larger grocery stores are
more limited in lower-income
neighborhoods. In Louisville’s low-
est-income neighborhoods, for
example, there is one large store for
every 7,495 residents compared
with one for every 14,176 residents
of a high-income neighborhood.
Residents in Louisville’s West End,
a lower-income community, must
travel through several neighbor-hoods beyond their own to access
larger, and likely lower cost, grocery
stores. For families relying on pub-
lic transportation or those with
young children, the extra distance
may make such travel difficult, and
force them to rely instead on
smaller and more expensive stores.
Why might Kentucky’s urban
lower-income neighborhoods tend
to have less access to larger,
likely lower-priced, grocery
stores?
Higher costs of doing business in
lower-income communities and,
perhaps, some questionable busi-
ness practices, may help drive
down access in Louisville’s and
Elsewhere in the country, lower-income neighborhoods tend to have
fewer per capita large grocery stores (greater than 10,000 square
feet) than higher-income neighborhoods. This is important because
larger stores tend to sell food at lower prices than small stores.60 However,
Kentucky largely bucks this trend, containing roughly equal numbers of
large grocery stores per capita in lower- and higher-income communities.
To be sure, not all communities in Kentucky have access to a large grocery store: 21 counties have no mid-sized or large grocery stores. However, fewer
than one-half of these are lower-income communities.
THEBROOKINGSINSTITUTION
METROPOLITAN
POLICY
PROGRAM
THE HIG
H PRICE O
F
BEIN
G
P
O
O
R IN
KEN
TU
CKY
30
FINDINGS
Higher costs of doing business in lower-income
communities and, perhaps, some questionable
business practices, may help drive down access in
Louisville’s and Lexington’s lower-income neigh-
borhoods to large grocery stores.
With the exception of communities in Louisville and Lexington,
Kentucky’s lower-income communities tend to have as much
access to larger, likely lower-priced, grocery stores as the state’shigher-income neighborhoods. However, data are too limited to
directly assess prices across these different stores.
IV. GROCERIES

8/14/2019 The High Cost of Being Poor in Kentucky
http://slidepdf.com/reader/full/the-high-cost-of-being-poor-in-kentucky 33/52

8/14/2019 The High Cost of Being Poor in Kentucky
http://slidepdf.com/reader/full/the-high-cost-of-being-poor-in-kentucky 34/52
THEBROOKINGSINSTITUTION
METROPOLITAN
POLICY
PROGRAM
THE HIG
H PRICE O
F
BEIN
G
P
O
O
R IN
KEN
TU
CKY
32
SOLUTIONS

8/14/2019 The High Cost of Being Poor in Kentucky
http://slidepdf.com/reader/full/the-high-cost-of-being-poor-in-kentucky 35/52

8/14/2019 The High Cost of Being Poor in Kentucky
http://slidepdf.com/reader/full/the-high-cost-of-being-poor-in-kentucky 36/52
high prices for their mortgages
and insurance products should
be a cause for concern among
Kentucky’s public leaders, and evi-
dence of a business opportunity for
Kentucky’s mainstream, responsible
businesses to move into these mar-
kets with lower-priced alternatives.Finally, this report has provided
evidence that Kentucky’s lower-
income consumers do not have as
much information as they need to
make sound financial decisions.
They are systematically less likely
to comparatively shop among com-
panies when buying goods and serv-
ices and they know less about the
importance of credit reports and
scores than their higher-incomeneighbors. Also, in our survey of
Kentucky households, the most
common reason given among
lower-income consumers for not
using a bank was that they never
really thought about opening up a
bank account; the next most cited
reason is that these consumers donot trust banks with their money;
and the next is that there is too
much paperwork. Together, this set
of evidence should be a wake up
call for leaders in Kentucky that
lower-income consumers in the
state are not making the best possi-
ble use of their scarce resources,
missing important opportunities to
get ahead through savings and
investments in wealth-buildingassets.
All three elements of this policy
agenda are discussed in more detail
below, animated by initiatives in
other areas of the country that are
striving to bring down higher costs
of doing business with lower-
income consumers, curb unscrupu-
lous behavior, and boost the
consumer knowledge of lower-
income consumers.OO
GS
S
U
O
O
O
O
C
OG
G
C
O
G
O
O
U
C
3
SO
U
O
S
Finally, this report has provided evidence that
Kentucky’s lower-income consumers do not have
as much information as they need to make sound
financial decisions.

8/14/2019 The High Cost of Being Poor in Kentucky
http://slidepdf.com/reader/full/the-high-cost-of-being-poor-in-kentucky 37/52
GOAL ONE:
Promote market-based solutions that lower the higher costs of
doing business with Kentucky’s lower-income consumers
This report has documented a range of higher costs faced by busi-
nesses in Kentucky’s lower-income markets, from higher delin-quency rates to the need for nontraditional products and customer
service, which cost money to develop and bring to market. Therefore, the
first step leaders should take to lower costs for their lower-income con-
stituents is to support mainstream businesses in lower-income markets that
offer reasonable and competitive prices for basic necessities.
In this section, we outline examples from around the country promoting
an array of mainstream products for lower-income families.
Create Employer-Based Payday Lending Alternatives:
North Carolina State Employees’ Credit Union
In 2001, the North Carolina State Employees’ Credit Union (NCSECU)
began offering a payday loan alternative to its 1.2 million members after
noticing increased use of payday loans by its members. The Salary
Advance Loan (SALO) is a revolving loan, with a maximum outstanding
balance of $500, offered at an APR of 12 percent. That compares in
Kentucky to the 390 percent APR charged by payday lenders in the state
for the same loan amount.
One of the most innovative features of the product is a forced savings
component, which requires that 5 percent of each advance be placed in a
special savings account. The account is unrestricted, but if the member
withdraws savings, he or she cannot access a SALO for six months. This
feature is designed to provide members with an incentive to let savings
accumulate until the funds are sufficient to ease reliance on borrowing.
Since the product was introduced, NCSECU has loaned $305,405,278,
generating $1,919,097 in interest income for the credit union. The manda-
tory savings component has resulted in more than $6 million in new
deposit funds. The mandatory savings feature is popular with NCSECU
members, 75 percent of whom report that this is the first time in their
lives that they have had any significant savings. It has also reduced
NCSECU’s credit risk by providing increased security for SALO loans.
For more information:
www.ncsecu.org

8/14/2019 The High Cost of Being Poor in Kentucky
http://slidepdf.com/reader/full/the-high-cost-of-being-poor-in-kentucky 38/52
Subsidize the Development of Low-Cost Bank Products:
New York’s Banking Development Districts
Because New York’s lower-income neighborhoods have limited access to
bank and credit unions, the Democrat-led statehouse worked with the
Republican governor to pass legislation that created BankingDevelopment Districts throughout the state. This legislation authorized
the state banking department to provide below-market rate deposits,
along with market-rate deposits, to bank branches that open in under-
served lower-income neighborhoods, or Banking Development Districts.
As Diana Taylor, the former superintendent of the state banking depart-
ment, says, “The state has all this money, and it has to be put some-
where. Why not put this money to work for something?”64
Kentucky does not need to subsidize the opening of branches in lower-
income neighborhoods, given that these neighborhoods have relatively
more access to banks and credit unions than New York. The state may
nevertheless want to consider passing similar legislation to jumpstart
banks and credit unions’ move into the payday lending market with more
reasonably priced short-term loan products.
The potential savings for Kentucky’s lower- and moderate-income fami-
lies is enormous because banks and credit unions can offer these prod-
ucts at lower comparable rates. Alternative basic financial service
providers like payday lenders and check cashers have to pay for their cap-
ital costs—buildings, employees, utilities, etc.—with a very narrow range
of products. Banks and credit unions, on the other hand, have already
sunk these costs, paying for them based on a much wider range of prod-
ucts. This allows banks and credit unions to sell these products at a lower
comparable rate. Credit unions are already heavily subsidized by the fed-
eral and state governments, and should already be selling a reasonably
priced alternative. To help encourage banks to enter this market,
Kentucky’s leaders should consider passing something similar to New
York’s plan.
For more information:
www.banking.state.ny.us/bdd.htm
The potential savings for Kentucky’s lower- and
moderate-income families is enormous because
banks and credit unions can offer these
products at lower comparable rates.
8/14/2019 The High Cost of Being Poor in Kentucky
http://slidepdf.com/reader/full/the-high-cost-of-being-poor-in-kentucky 39/52
Develop Refund Anticipation Loan Alternative
Bank of Oklahoma
Bank of Oklahoma has partnered with the Community Action Program of
Tulsa County and Doorways to Dreams (D2D) to split refunds in its
Refunds to Assets Program. By offering a refund anticipation check (RAC)rather than a refund anticipation loan, these partners are able to reduce
costs to lower-income tax filers and promote savings. Tax filers who par-
ticipate can receive part of their refund for immediate use while the
remainder is deposited in an account at Bank of Oklahoma or, if they are
homeowners, used to make a mortgage payment.
About one-third of the tax filers offered the option to split their refunds do
so. As a result, people deposit, on average, $583 into a savings account,
which is the equivalent to about one-half of their refunds. Before this prod-
uct was available, 75 percent of those using it had never had savings in
reserve.
For more information:
www.d2dfund.org/r2a/index.php
Create Low-Cost Insurance Pools
California’s Low-Cost Automobile
Insurance Program
Kentucky’s lower-income families
are not alone in facing relativelymore expensive insurance premi-
ums. However, other states have
taken aggressive steps to lower
the price of auto insurance for
these consumers, in part to lower
the high uninsurance rate in
lower-income markets, as well as
to promote more affordable
options for lower-income drivers
already having difficulty making
ends meet.
California offers one of the
more far-reaching programs to
lower the cost of auto insurance.
California now requires insurers
in the state to offer a low-cost
auto liability insurance policy to
qualified drivers who earn less
than 250 percent of the poverty
line in eight urban counties,
where large shares of the state’s
lower-income drivers are concen-
trated.66 Insurance under this pro-
gram costs as little as $314 in
San Francisco.
Insurance companies benefit
from this program because it
pools both the real and perceived
higher risks in lower-income
markets while also helping to
boost the insurance rate in lower-
income markets. Lower-income
consumers benefit because it
lowers the cost of insurance and
allows them to buy insurance
and protect their assets.
For more information:
www.insurance.ca.gov/0400-news/
0100-press-releases/0070-2006/
release051-06.cfm
Form Public-Private Partnerships to Bank the Unbanked
Bank of San Francisco
More than 30 percent of Kentucky’s lower-income households regularly
turn to high-priced check cashers, costing a typical a minimum wage
earner over five years nearly half his or her annual income.
San Francisco instead connected these consumers to reasonably priced
products at banks and credit unions. The office of the mayor, the office of
the treasurer, the Federal Reserve Bank of San Francisco, and 20 partici-
pating banks and credit unions formed four working groups with the goal
of converting 20 percent of the unbanked population into bank account
holders in two years. The first working group is developing appropriate
market products, the second is devising strategies to market those prod-
ucts, the third is working to bring community voices to the process, and
the fourth will track progress.65
For more information:
www.sfgov.org/site/bankonsf_index.asp?id=46628
8/14/2019 The High Cost of Being Poor in Kentucky
http://slidepdf.com/reader/full/the-high-cost-of-being-poor-in-kentucky 40/52
Promote Competition in Insurance Markets
Kentucky’s Insurance Shopping Guides
Kentucky, along with numerous other states, have started publishing auto and home insurance shopping guides,
which advertise the cost of a comparable amount of insurance sold by each of the licensed insurance companies
in the state.67 Such guides promote competition because they speed up the search time needed by consumers tocomparatively shop for insurance prices. Instead of a consumer having to call every insurance company in the yel-
low pages, for instance, consumers just need to log onto to these state webpages, find the county that they live in,
and look at the rates being offered by all of the insurance companies that sell insurance in their county. This one-
stop destination is a low cost, easy way to lower the prices that lower-income consumers tend to pay for insur-
ance.
Kentucky’s guides illustrate that annual premiums for the exact same line of insurance can vary by over $1,000,
depending on the insurance company. Some of this price variance is explained by the different mixes of risk that
insurance companies are exposed to in the market, but it also has to do with different pricing strategies across
companies.
For these efforts to continue to be effective, however, leaders should aggressively market this resource and keep
the information up to date. State and local leaders in Kentucky can work with the media, community leaders, and
insurance companies to advertise this resource.
For more information:
www.ins.state.ny.us/homeown/html/hmonguid.htm
Promote Responsible Mortgage Companies
University of Pennsylvania’s Guaranteed Mortgage Program
Buying a mortgage is complicated. In addition to choosing from dozens of
brokers and lenders, Kentucky’s consumers also must choose between dozens
of different mortgage products. Such choice allows consumers to buy mort-
gage products tailored to their financial interests, but it also leaves them vul-
nerable to unscrupulous brokers and lenders who may take advantage of
consumers who do not fully understand their options. Economists, for exam-
ple, have found that about 20 percent of those who bought a high-cost mort-
gage qualified for a prime-priced loan.68
To help mainstream lenders connect with consumers, and to help promote
homeownership, the University of Pennsylvania created a guaranteed mort-
gage program for its employees. The university entered into an agreement
with Advance Bank, GMAC Mortgage Corporation, and Citizens Bank, three
lenders in the Philadelphia market. By connecting families to preapproved
lenders, the university is ensuring that its employees are connected to respon-
sible mortgage companies that offer reasonable prices. This promotes main-
stream companies in Philadelphia’s housing markets.
For more information:
www.business-services.upenn.edu/communityhousing/mortgagePrograms.html

8/14/2019 The High Cost of Being Poor in Kentucky
http://slidepdf.com/reader/full/the-high-cost-of-being-poor-in-kentucky 41/52
Curb High-Priced Basic Financial Services
Moratoriums on and Price Caps for Check Cashers and Payday Lenders
Leaders in several states have recognized payday lenders and other alter-
native financial services drain tens of millions of dollars from the pockets
of lower-income consumers, and they have taken steps to curb their
growth (see Appendix).
Several cities and states have passed moratoriums on business licenses
for these companies. Similarly, some cities have passed strict ordinances
that specify minimum distances between these establishments. In Pima
County leaders banned such businesses from doing opening within 1,200
feet of a similar business or within 500 feet of any private residence.
Other states have banned these businesses outright, or have lowered
the prices they can charge. In 2004, Georgia capped the annual percent-
age rate for short-term loans sold in the state at 16 percent and elimi-
nated the ability of these businesses to rent the charter of banks in states
with less stringent laws.
For more information:
www.ncsl.org/programs/banking/paydaylend-intro.htm
GOAL TWO:
Curb unscrupulous business practices in lower-income markets
C
ompared to their higher-income counterparts, Kentucky’s lower-
income consumers do less shopping around when they buy credit;
live in more expensive areas of the state for some types of transac-tions; and they are more likely to fall
behind on payments. Together, these
characteristics act to curb the interest
of mainstream responsible businesses
in the state from serving lower-income
markets. In their place, unscrupulous
businesses can blossom, charging
unnecessarily high prices for everyday
goods and services. Left unaddressed,
these bad apples in the business com-
munity can erode the potential for mainstream businesses to thrive in thismarket because the high prices they charge for everyday goods and services
can erode the financial security of Kentucky’s lower-income households.
To address these issues, many states have used their regulatory power to
promote more reasonable prices in lower-income markets. This section
reviews some of the more prevalent regulatory efforts in recent years, which
Kentucky may consider as options to lower prices for the poor and promote
mainstream businesses in the state.
Kentucky’s lower-income consumers do less
shopping around when they buy credit; live in
more expensive areas of the state for some
types of transactions; and they are more likely
to fall behind on payments.

8/14/2019 The High Cost of Being Poor in Kentucky
http://slidepdf.com/reader/full/the-high-cost-of-being-poor-in-kentucky 42/52

8/14/2019 The High Cost of Being Poor in Kentucky
http://slidepdf.com/reader/full/the-high-cost-of-being-poor-in-kentucky 43/52
8/14/2019 The High Cost of Being Poor in Kentucky
http://slidepdf.com/reader/full/the-high-cost-of-being-poor-in-kentucky 44/52
GOAL THREE:
Promote financial responsibility among lower-income consumers
K
entucky’s leaders must help lower-income consumers make better
financial decisions. Given that unbanked households have seldom
even thought about opening up a bank account, or that most lower-income Kentuckians do not understand credit reports and scores and fail to
shop around for goods and services, there is clearly great opportunity to
bring more Kentuckians into the financial mainstream through better infor-
mation. This section reviews a handful of states that have are attempting to
address this problem. ■
Invest in Consumer Education,
Promote Financial Education
Kentucky has one of the most
stringent high school financial
education requirements in thenation.72 Yet it is unclear what
impact this requirement is having
because school leaders are not
held accountable for adhering to
the requirement. In fact, state
education leaders in the state
expressed pessimism that chil-
dren were receiving a financial
education of any kind. Clearly,
more accountability is needed to
ensure that every high school
junior is as familiar with the idea
of a credit score as he or she is
with an ACT or SAT score.
Kentucky’s public and private
leaders should build on these
investments by a) evaluating the
gaps in financial education deliv-
ery in their jurisdictions; b) deter-
mining the best practices that
can be used to fill those gaps;
and c) establishing a method for
tracking the impact of invest-
ments in financial education.
Together, these three steps can
provide a foundation for lower-
income consumers to make more
responsible decisions.
For more information:
www.chicagofed.org/cedric/
financial_education_research_
center.cfm
Promote Internet Access and Use
One of the best resources for consumers is the Internet. The best con-
sumer examples include:
• Lendingtree.com, which compares information on mortgages
• Einsurance.com and progressive.com, which compare prices for insur-
ance premiums
• Carbargain.com, cardirect.com, cars.com, and Edmunds.com, which
provide prices and other information on new and used cars
• Shopping.com, which compares prices for appliances and electronics
• Prosper.com, which provides high-risk borrowers relatively
low-cost loans
In addition to these shopping sites, Kentucky’s state departments pro-
vide very useful information to consumers. The state’s Department of
Insurance provides a shopping guide that compares rates for a compara-
ble amount of insurance offered by companies licensed in the state. Such
a resource, if made available to Kentucky’s lower-income consumers,
would give them a much needed leg up to find the lowest possible price
for insurance in the state.
However, nearly two-thirds (64 percent) of Kentucky’s lower-income
consumers do not have regular access to the Internet, compared with just
18 percent on average of all other consumers.71 Further, very few of those
who do have online access report using it to compare prices or do
research when buying major goods and services.
Kentucky has a number of options to boost Internet access among
lower-income consumers, from continuing to transform their libraries into
computer-based learning centers to directly subsidizing computer pur-
chases and Internet access for lower-income households. Whatever option
Kentucky chooses, it must with equal vigor ensure that consumers use the
online information. Outreach to community and business leaders can help
them make this information available to lower-income consumers.
For more information:
www.pewinternet.org

8/14/2019 The High Cost of Being Poor in Kentucky
http://slidepdf.com/reader/full/the-high-cost-of-being-poor-in-kentucky 45/52
Appendix. Survey Responses, by Household Income
Household Income
Less than $20,000 – $40,000– $60,000– $80,000
$20,000 $39,999 $59,999 $79,999 or more
Homeownership and Home Loans
Proportion of respondents who own a house 46% 55% 85% 89% 89%
Proportion of homeowners who have an outstanding mortgage 38% 49% 57% 76% 79%
Proportion of mortgage borrowers who have refinanced 33% 33% 35% 51% 46%
Proportion of mortgage borrowers who chose a loan company by…
…using the Internet to do research 9% 8% 11% 19% 26%
…using the Internet to obtain quotes from companies 5% 7% 10% 20% 18%
…getting a referral from a trusted source 59% 55% 69% 42% 68%
…using advertisements from companies 11% 13% 19% 20% 16%
…obtaining quotes from companies using means other than the Internet 14% 30% 49% 43% 49%
Proportion of mortgage borrowers who have missed a payment 19% 17% 5% 4% 0%
Car Ownership and Car Loans
Proportion of respondents who own a car 72% 88% 99% 98% 93%
Proportion of car owners who chose a dealer by…
…using the Internet to do research 11% 14% 31% 36% 47%
…getting a referral from a trusted source 55% 60% 56% 47% 50%
…using advertisements from car dealers 24% 28% 38% 20% 44%
…using the dealer located closest to them 50% 38% 49% 39% 31%
Proportion of car owners who obtained multiple quotes before purchasing 58% 60% 72% 65% 71%
Proportion of car owners with an outstanding auto loan 17% 19% 37% 49% 57%
Proportion of auto loan borrowers who chose their loan company by…
…using the Internet to do research 4% 9% 27% 25% 20%
…using the Internet to obtain quotes from companies 24% 11% 25% 19% 30%
…getting a referral from a trusted source 86% 51% 56% 37% 50%
…using advertisements from companies 29% 21% 39% 11% 22%
…just using the dealer from which car was purchased 78% 71% 93% 64% 47%
Proportion of auto loan borrowers who obtained multiple quotes 55% 44% 40% 37% 48%
before taking out a loan
Proportion of car owners who have auto insurance 93% 98% 100% 100% 100%
Proportion of insured car owners who chose their insurance company by…
…using the Internet to do research 12% 12% 19% 19% 29%
…using the Internet to obtain quotes from companies 14% 19% 25% 22% 33%
…getting a referral from a trusted source 60% 64% 61% 56% 60%
…obtaining quotes from companies using means other than the Internet 61% 59% 60% 59% 61%

8/14/2019 The High Cost of Being Poor in Kentucky
http://slidepdf.com/reader/full/the-high-cost-of-being-poor-in-kentucky 46/52

8/14/2019 The High Cost of Being Poor in Kentucky
http://slidepdf.com/reader/full/the-high-cost-of-being-poor-in-kentucky 47/52
Appendix. Survey Responses, by Household Income (continued)
Household Income
Less than $20,000 – $40,000– $60,000– $80,000
$20,000 $39,999 $59,999 $79,999 or more
Financial Literacy and Awareness
Proportion of respondents who have regular Internet access 36% 66% 83% 91% 98%
Proportion of respondents who have seen their credit report 35% 58% 75% 78% 82%
Proportion of respondents who have seen their credit report and…
…found mistakes in it 42% 30% 39% 49% 44%
…found mistakes in it and were able to get them corrected 51% 63% 74% 87% 76%
…found mistakes in it as a result of their identity being stolen 31% 20% 11% 8% 13%
Proportion of respondents who found mistakes and...
…found mistakes 100% of the time 22% 20% 7% 11% 18%
…found mistakes 50–99% of the time 27% 20% 22% 25% 10%
…found mistakes 25–49% of the time 7% 10% 7% 11% 12%
…found mistakes less than 25% of the time 44% 50% 64% 53% 61%
Proportion of respondents who think that one’s credit history can influence…
…eligibility for a loan 71% 89% 91% 94% 94%
…the interest rate charged on a loan 74% 86% 91% 94% 92%
…eligibility for Social Security benefits 13% 13% 15% 10% 13%
…insurance coverage or premiums 45% 59% 71% 69% 71%
…eligibility for employment 48% 44% 62% 67% 65%
…eligibility to obtain a driver’s license 8% 4% 3% 5% 9%
…eligibility to rent a home 60% 75% 85% 83% 84%
Proportion of respondents who know that they can view their credit 55% 69% 74% 81% 83%
report for free once annually
Proportion of respondents who know where to obtain a free copy 37% 51% 65% 69% 67%
of their credit report
Proportion of respondents who regularly use grocery store coupons 52% 48% 53% 50% 39%
Proportion of respondents who think they would benefit from a free 48% 53% 51% 34% 38%
class about price comparison for basic necessities
Average amount respondents would be willing to pay for such a class $35 $18 $33 $27 $40
Proportion of respondents who would like to see the state fund 88% 91% 93% 90% 86%
financial education classes in public schools
Source: Authors’ analysis of a statewide survey commissioned by The Brookings Institution, and administered by the University
of Kentucky’s Survey Research Center

8/14/2019 The High Cost of Being Poor in Kentucky
http://slidepdf.com/reader/full/the-high-cost-of-being-poor-in-kentucky 48/52
1. This differs from IRS reports because IRS
data is based on filers and our survey is
based on households (a different universe). Also, the IRS measure of low-income filers
includes all those who earn less than the
maximum income threshold for Earned
Income Tax Credit benefits, which is nearly
twice the income level used in our measure
of low-income. Annual information about
EITC usage around the country can be
found at:
http://webapps.brookings.edu/EITC/ .
2. Governor’s Summit on Quality of Life in the
Commonwealth, cosponsored by the gover-
nor’s office, the Kentucky Cabinet for
Families and Children, National Governors
Association, the Kentucky Community and
Technical College System, and the FordFoundation, October 17, 2002.
3. Based on an analysis of three-year averages
from the Census Bureau’s American
Community Survey.
4. This section of the report is adapted from
Matt Fellowes, From Poverty, Opportunity:
Putting the Market to Work for Lower-income
Families (Washington: Brookings Institution,
2006).
5. See, for example, David Caplovitz, The Poor
Pay More (New York: Free Press, 1967).
6. U.S. Census Bureau, Administrative and
Customer Services Division, Statistical
Compedia Branch, U.S. Department of Commerce, Bureau of Economic Analysis.
7. See Matt Fellowes, “Grounds for
Competition: The Basic Financial Service
Infrastructure in Lower-Income
Neighborhoods.” Presented at the 2006
Louis L. Redding Public Policy Forum,
University of Delaware, 2006, available at
http://www.brookings.edu/metro/speeches/
20060317_financialserv.htm(April 2006).
8. More on this time trend can be found in
Matt Fellowes. 2007. “Making Markets An
Asset for the Poor.” Harvard Law and Policy
Review. 1(2); and Brian Grow. May 11,
2007. “The New Poverty Economy.”
BusinessWeek.
9. Authors’ analysis of the 2004 Survey of
Consumer Expenditures.
10. Because of limits on data availability, we do
not examine the other parts of a typical fam-
ily’s budget, including utilities, health care,
or entertainment.
11. The remainder of this section is adapted
from Fellowes, From Poverty, Opportunity.
12. Credit cards and debit cards are two other
financial service products often thought of as
“basic,” but no data are available to compareprices for these products.
13. For more information about this survey, see
Brian K. Bucks, Arthur B. Kennickell, and
Kevin B. Moore, “Recent Changes in U.S.
Family Finances: Evidence from the 2001
and 2004 Survey of Consumer Finances,”
Federal Reserve Bulletin 92 (February 2006):
A1-A38.
14. There may be other types of higher auto-
related costs, such as the cost of gasoline
and the cost of maintaining a car. Gas may
cost more in lower-income neighborhoods
because of the higher costs of security and
because stations are more likely to be located
in urban neighborhoods. Maintaining a car
may be more expensive because lower-
income households are much more likely
to drive a used car than higher-income
households. Unfortunately, we were unable
to find data on these costs.
15. Fiona Scott Morton, Florian Zettelmeyer,
and Jorge Silva-Risso, “Consumer
Information and Price Discrimination: Does
the Internet Affect the Pricing of New Cars
to Women and Minorities?” Working Paper
8668 (Cambridge, MA: National Bureau of
Economic Research, 2001). Also see Ian
Ayers and Peter Siegelman, “Race and
Gender Discrimination in Bargaining for a
New Car,” American Economic Review 85
(1995): 304-21; David W. Harless and
George Hoffer, “Do Women Pay More for
New Vehicles? Evidence from Transportation
Price Data,” American Economic Review 92
(2002): 270–279.
16. For more information about direct, indirect,
and total effects, see Rex Kline, Principles
and Practice of Structural Equation Modeling
(New York: Guilford Press, 1998).
17. The SCF is the only resource of which we
are aware that assesses how prices for auto
loans vary by household income. However,
for a local market assessment see Anne Kim,
“Taken for a Ride: Subprime Lenders, Automobility, and the Working Poor”
(Washington: Progressive Policy Institute,
2002).
18. According to the Insurance Information
Institute, Allstate has about 10 percent
of the auto insurance market, Progressive
has about 7 percent, and Geico has about a
6 percent market share. See http://www.iii.
org/media/facts/statsbyissue/auto / (accessed
April 2006). We chose the minimum insur-
ance amount because we wanted as conser-
vative an estimate as possible. A downside,
however, is that these estimates should not
be compared across the metropolitan areas
in our analysis given that we consider a dif-
ferent amount of insurance across each of these areas. For a comparable assessment of
average prices, see publications by the
National Association of Insurance
Commissioners or data available from the
Insurance Information Institute
( www.iii.com).
19. This methodology is derived from a series of
studies that have analyzed price variance
across ZIP codes. See, for example, Scott E.
Harrington and Greg Niehaus, “Race,
Redlining, and Automobile Insurance
Prices,” Journal of Business 71(3) (1998):
439-469; R. Klein, “Urban Homeowners
Insurance Markets: Problems and Possible
Solutions.” Working Paper (Washington, DC:National Association of Insurance
Commissioners, 1995); Missouri Department
of Insurance, “Affordability and Availability
of Personal Lines Insurance in Underserved
Communities” (St. Joseph: 2004).
20. The Washington Office of the Insurance
Commissioner, Texas Department of
Insurance, the Michigan Office of Financial
and Insurance Services, and the Missouri
Department of Insurance have all under-
taken analyses to estimate the relationship
between credit scores and driver income. A
forthcoming Federal Trade Commission
analysis promises to be generalizable to other
states.
21. See, for example, Albert B. Crenshaw and
Caroline E. Mayer, “Geico’s Risk Criteria
Challenged: Insurer Denies That Education
and Occupation Are Used to Discriminate,”
Washington Post, p. D01, March 21, 2006.
22. But see evidence of systematic differences in
tax assessments: Matt Fellowes and Bruce
Katz, The Price Is Wrong: Getting the Market
Right for Philadelphia’s Working Families
(Washington: Brookings Institution, 2005).
23. Robert B. Avery, Glenn Canner, and Robert
E. Cook, “New Information Reported Under
HMDA and Its Application in Fair Lending
Enforcement,” Federal Reserve Bulletin(Summer 2005).
24. For more information about this comparison,
see Keith S. Ernst and Deborah N.
Goldstein, “Comment on Federal Reserve
Analysis of Home Mortgage Disclosure Act
Data.” CRL Comment #1 (Durham: Center
for Responsible Lending, 2005).
25. James M. Lacko, Signe-Mary McKernan, and
Monoj Hastak,”Survey of Rent-to-Own
Customers” Bureau of Economics Staff
Report (Washington: Federal Trade
Commission, 2000).
Endnotes

8/14/2019 The High Cost of Being Poor in Kentucky
http://slidepdf.com/reader/full/the-high-cost-of-being-poor-in-kentucky 49/52
26. For other examples of grocery baskets used
in this line of research see Lashawan
Richburg Hayes, “Do the Poor Pay More? An
Empirical Investigation of Price Dispersion
in Food Retailing.” Industrial Relations
Section Working Paper no. 446 (Princeton,
NJ: Princeton University, 2000); Phillip R.
Kaufman, James M. MacDonald, Steven M.
Lutz, and David M. Smallwood, “Do the
Poor Pay More for Food? Item Selection and
Price Differences Affect Lower-income
Household Food Costs.” Agriculture
Economic Report no. 759 (Washington: U.S.
Department of Agriculture, Economic
Research Service, 1997); Trinity Center for
Neighborhoods, “Food Pricing in Hartford,
Connecticut: Supplement to the Self
Sufficiency Study” (Hartford: 2002).
27. Evidence suggests that smaller stores charge
higher prices than larger stores. Because
lower-income neighborhoods generally have
much less access to larger stores than
higher-income neighborhoods, we can infer
that food is, on average, more expensive in
lower-income neighborhoods. For evidence
of the relationship between store size and
price see Phillip R. Kaufman and Charles R.
Handy, “Supermarket Prices and Price
Differences: City, Firm, and Store-Level
Determinants.” Technical Bulletin Number
1776 (Washington: U.S. Department of
Agriculture, Economic Research Service,
1989); Howard Kunreuther, “Why the Poor
Pay More for Food: Theoretical and
Empirical Evidence,” Journal of Business 46
(1973): 368–383.
28. University of Kentucky, Survey Research
Center, http://www.survey.rgs.uky.edu ,
(859)323-4684.
29. Assuming a charge of 5 percent for a payroll
check, a family in Lexington with a net
income of $30,000 a year earned from one
salaried worker can pay up to $1,500 to cash
checks from a private company. If they also
occasionally took out a payday loan or a
pawnshop loan, in addition to paying for a
tax preparation service and refund anticipa-
tion loan, this family would pay at least
$2,000 in fees.
30. We jointly analyze these companies because
an increasing number of establishments that
provide one service also sell other services.
For evidence of this market trend, seePatrick Bolton and Howard Rosenthal, edi-
tors, Credit Markets for the Poor (New York:
Russell Sage Foundation, 2005). Also see
Sheila Bair, “Low Cost Payday Loans: The
Opportunities, the Obstacles.” (New York:
Annie E. Casey Foundation, 2005).
31. Jane J. Kim, “Banks Sweeten Promotions for
New Checking Customers; Rates Creating
Profit Pressures—Bounced-Check Fees,
Other Penalties Rising” Wall Street Journal.
April 2, 2006.
32. For more information see Center for
Financial Services Innovation, www.cfsi.org
(February 2007).
33. Authors’ analysis of Kentucky Office of
Financial Institutions data. Data do not
include Internet-based short-term loan
providers that Kentucky consumers can
access in addition to those licensed in
Kentucky.
34. Katy Jacob, “Highlights from the Inaugural
Underbanked Financial Services Forum”
(Chicago: Center for Financial Service
Innovation, 2006).
35. John P. Caskey, “Fringe Banking and the
Rise of Payday Lending.” In Patrick Bolton
and Howard Rosenthal, eds., Credit Markets
for the Poor (New York: Russell Sage
Foundation, 2005).
36. Late payments on a credit card can also
exceed the APR charged by these alternative
short-term loan companies.
37. This differs from IRS reports because IRSdata is based on filers and our survey is
based on households (a different population
universe). Also, the IRS measure of low-
income filers includes all those who earn less
than the maximum income threshold for
Earned Income Tax Credit benefits, which is
nearly twice as high as our measure.
38. This is among the population of Kentucky
households that use a paid provider.
39. Alan Berube, Anne Kim, Benjamin Forman,
and Megan Burns, “The Price of Paying
Taxes: How Tax Preparation and Refund
Loan Fees Erode the Benefits of the EITC”
(Washington: Brookings Institution, 2002).
40. We jointly analyze these companies because
an increasing number of establishments that
sell one service also sell the other service.
See Bolton and Rosenthal, Credit Markets for
the Poor.
41. Matt Fellowes and Mia Mabanta. 2007.
“Borrowing to Get Ahead, and Behind: The
Credit Boom and Bust in Lower-Income
Markets.” Washington, DC: The Brookings
Institution.
42. For instance, in the appendix we report that
while lower-income homeowners in
Kentucky are much more likely than higher-
income homeowners to fall behind on mort-
gage payments, lower-income householdswith credit cards are about as likely as all
other households to miss payments. Also, we
find that the propensity to overdraw
accounts is about the same across income
groups. There is some selection bias limiting
inferences from these results—i.e., the 25
percent of unbanked lower-income house-
holds are probably systematically different,
as a group, than the 75 percent that are
banked.
43. This section of the report is largely adapted
from Fellowes, From Poverty, Opportunity.
44. Scott Morton, Zettelmeyer, and Silva-Risso,
“Consumer Information and Price
Discrimination.” See also Ayers and
Siegelman, “Race and Gender
Discrimination in Bargaining for a New Car,”
and Harless and Hoffer, “Do Women Pay
More for New Vehicles?”
45. See, for example, Crenshaw and Mayer,
“Geico’s Risk Criteria Challenged.”
46. Fellowes and Mabanta, “Borrowing to Get
Ahead, and Behind: The Credit Boom and
Bust in Lower-Income Markets.”
47. Ayers and Siegelman, “Race and Gender
Discrimination in Bargaining for a New Car.”
48. Bureau of Transportation Statistics,
Transportation Statistics Annual Report
(Washington: U.S. Department of
Transportation, Research and Innovative
Technology Administration, Bureau of
Transportation Statistics, 2005).49. These loans are defined by the Federal
Reserve Board as 3 percentage points above
comparable Treasury notes for first liens and
5 percentage points above for junior liens. In
using this definition, the board estimated
they would capture more than 95 percent of
the subprime market. For more information,
see Robert B. Avery, Glenn Canner, and
Robert E. Cook, “New Information Reported
Under HMDA and Its Application in Fair
Lending Enforcement,” Federal Reserve
Bulletin (Summer 2005). Note, however,
that recent comparisons of private-sector
data with these public data suggest that the
Federal Reserve’s definition of “high cost”mortgages misses a large proportion of this
market. For more information about this
comparison see Ernst and Goldstein,
“Comment on Federal Reserve Analysis.”
50. What is considered “typical” was assessed
using supplemental information from the
SCF.
51. See, for example, Crenshaw and Mayer,
“Geico’s Risk Criteria Challenged”; Matt
Fellowes, “Credit Scores, Reports, and
Getting Ahead in America”; Washington
Office of the Insurance Commissioner,
“Washington Insurance Underwriting and
Pricing.” Submitted to the state legislature,
December 2003.
52. Lacko, McKernan, and Hastak, “Survey of
Rent-to-Own Customers.” But see
Association of Progressive Rental
Organizations ( www.rtohq.org) for an indus-
try perspective on its customer base.
53. State of Maryland, Office of the Attorney
General, “Rent-to-Own: Worth the
Convenience?” (Baltimore: 2003), at
www.oag.state.md.us/consumer/edge109.
htm (April 2007).

8/14/2019 The High Cost of Being Poor in Kentucky
http://slidepdf.com/reader/full/the-high-cost-of-being-poor-in-kentucky 50/52
54. According to one recent survey, the average
credit card APR was 12.6 percent in 2004
across 146 different credit card products. For
more information, see San Francisco
Consumer Action. “2005 Credit Card
Survey” (San Francisco, 2005).
55. State of Wisconsin, Department of Financial
Institutions, “Rent to Own, (Madison, no
date), available at www.wdfi.org/wca/
consumer_credit/credit_guides/rent-to-
own.htm (April 2006).
56. Fellowes, “Credit Scores, Reports, and
Getting Ahead in America.”
57. Howard Lax, Michael Manti, Paul Raca, and
Peter Zorn. “Subprime Lending: An
Investigation of Economic Efficiency,”
Housing Policy Debate 15 (3) (2004):
531–571.
58. Harriet Johnson Brackey,” Insurers, State
Duel Over Role of Credit Scores in Auto and
Home Insurance Rates,” South Florida Sun-
Sentinel, July 13, 2006.
59. Austan Goolsbee and Jeffrey Brown, “Does
the Internet Make Markets More
Competitive? Evidence from the Life
Insurance Industry,” Journal of Political
Economy, 110 (2002): 3.
60. Fellowes, “From Poverty, Opportunity:
Putting the Market to Work for Lower
Income Families.”
61. To view these studies, see www.socialcom-
pact.org
62. Robert Berner, “Wal-Mart’s Urban Renewal.”
BusinessWeek , April 4, 2006.
63. LISC has a number of interesting resources
on grocery store development in urban areas,
including successful examples from around
the country at http://www.lisc.org/content/
article/detail/2857
64. Clint Riley, “New York Uses Banks to Kick-
Start Renewal,” Wall Street Journal, March
21, 2006.
65. For an excellent assessment of recent efforts
by banks and credit unions to compete with
high-priced, short-term loan providers, see
Bair, “Low Cost Payday Loans.”
66. The auto insurance quotes from California
presented in the results section of this report
were open-market quotes, and do not reflectthe substantial cost savings available through
this program.
67. New York’s Department of Insurance,
Consumer Shopping Guide for Homeowners
and Tenants Insurance (Albany: 2002).
68. Lax, Manti, Raca, and Zorn, “Subprime
Lending.”
69. See the Washington Office of the Insurance
Commissioner, “Washington Insurance
Underwriting and Pricing.”
70. For an excellent review of these bills, and the
effect that they have had on the market, see
Wei Li and Keith S. Ernst, “The Best Value
in the Subprime Market: State Predatory
Lending Reforms” (Washington: Center for
Responsible Lending, 2006).
71. Authors’ analysis of statewide survey com-
missioned for this report.
72. National Council on Economic Education,
“Survey of the States: Economic and
Personal Finance Education in Our Nation’s
Schools in 2004” (Washington: 2005).

8/14/2019 The High Cost of Being Poor in Kentucky
http://slidepdf.com/reader/full/the-high-cost-of-being-poor-in-kentucky 51/52
8/14/2019 The High Cost of Being Poor in Kentucky
http://slidepdf.com/reader/full/the-high-cost-of-being-poor-in-kentucky 52/52
The Brookings Institution1775 Massachusetts Avenue, NW • Washington D.C. 20036-2188
Tel: 202-797-6000 • Fax: 202-797-6004 www.brookings.edu
Top Related