


Languages
Pages
Legal


www.europeanpharmaceuticalreview.com Issue 6 2011
The FDA’s PATInitiative, pastand presentTerry McMahon, PAI Partners
The future of drug
discovery We talk with leaders from
Bayer, GlaxoSmithKline, Johnson & Johnson and Pfizer
Using miRNA manipulation as anantiviral therapeutic strategy
Amy H. Buck and Nouf N. Laqtom, University of Edinburgh
EPR Cover 611_EPR Cover 29/11/2011 10:46 Page 1
The use of Multivariate Data Analysis (MVDA)
in the framework of Quality by Design and
Operational Excellence initiatives to gain
increased process understanding and,
ultimately, process control is an area of growing
interest and under great expansion in the
pharma industry.
With the implementation of Process
Analytical Technology (PAT) and modern
automation infrastructures, numerous process
variables are on-line available describing physical
and chemical properties of the process, the raw /
intermediate materials and the final products.
These vast amounts of data are registered with
various sensors, either PAT (NIR, Raman and UV-
VIS) or classical probes (pH, T). To extract relevant
information out of the primary data retrieved,
multivariate statistical process control (MSPC) is
used for efficient process control, data trending
and early fault detection taking the dynamic and
multidimensional nature of these processes into
account. Furthermore, MVDA is gaining
importance, supporting and enabling real time
release by an efficient control of the variability of
the process using qualitative MSPC or even
applying predictive models for certain critical
quality attributes.
The main benefits expected to result
from the application of MVDA can be cat -
egorised in the areas of process understanding
and process control. During process
development, MVDA contributes significantly in
a structured way to evaluating and visualising
data stemming from lab and pilot scale and
therefore supports a better understanding
and interpretation of the process data.
In particular, the main benefits where MVDA can
add value to process development are:
The fundamental concepts behind the FDA PAT initiative are driving the
pharmaceutical industry to put greater emphasis on the scientific understanding of
their manufacturing processes, thus focusing its efforts both on ensuring product
quality compliance through end product testing, and on understanding the impact
of the manufacturing conditions and process variability on the quality attributes. In
this respect, multivariate data analysis (MVDA), used for statistical process control,
can be very useful and effective to ensure that a process is under control and,
consequently, that it meets the quality specifications. At the same time, MVDA is a
valid tool to improve the understanding of the process, to increase its efficiency e.g.
in terms of yield and throughput time and consequently, leads to reduce costs. As the
setting for this paper, the MVDA principles and tools, benefits and challenges are
discussed prior to the review of two examples of application of MVDA at Novartis.
Specifically, pharmaceutical and biopharmaceutical processes are discussed.
IMPLEMENTATION OF MODELLING APPROACHES IN THE QbD FRAMEWORK:
EXAMPLES FROMTHE NOVARTISEXPERIENCE
Dr. Marianna Machin, Dr. Lorenz Liesum and Dr. Antonio PeinadoNovartis Pharma AG
European Pharmaceutical Reviewwww.europeanpharmaceuticalreview.com Volume 16 | Issue 6 | 2011
39
PATSUPPLEMENT
machin_Layout 1 25/11/2011 09:56 Page 1
l identification of influential and critical
process parameters
l identification of correlation pattern among
the process parameters
l generation of process signatures
l relationship between process parameters
and quality attributes by multivariate
regression analysis
After the successful transfer of a product from
pilot plant to commercial scale, the available and
achieved process understanding needs to be
embedded and translated into an appropriate
process control strategy. The benefits of using
MVDA in this context are:
l efficient on-line tool for multivariate
statistical control (MSPC)
l analysis of process variability
l enabling on-line early fault detection
l enabler for time resolved design space
verification (real time quality assurance) –
Real Time Release (RTR)
l predicting quality attributes based on
process data
l excellent tool for root cause, trending
analysis and visualisation
This paper will give two examples from pharma -
ceutical and biopharmaceutical processes.
Case Study I: MVDA used for
multivariate statistical process control
(MSPC) in pharmaceutical unit
operation content
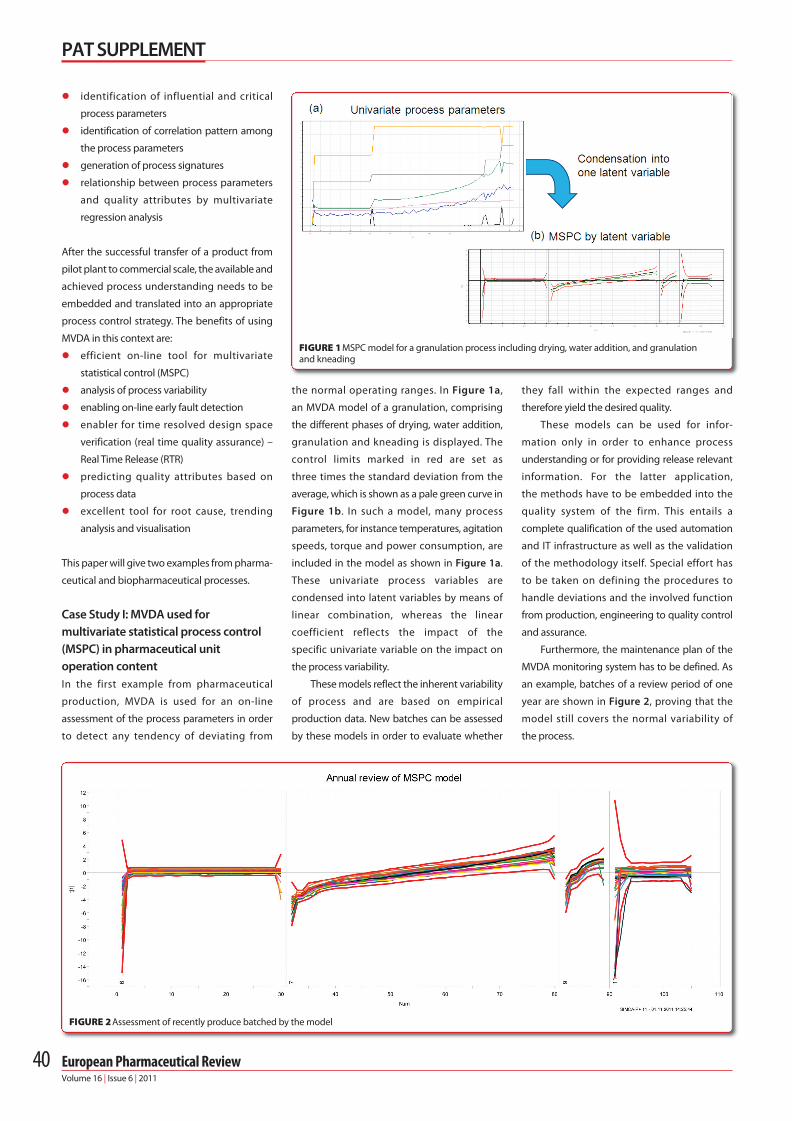
In the first example from pharmaceutical
production, MVDA is used for an on-line
assessment of the process parameters in order
to detect any tendency of deviating from
the normal operating ranges. In Figure 1a,
an MVDA model of a granulation, comprising
the different phases of drying, water addition,
granulation and kneading is displayed. The
control limits marked in red are set as
three times the standard deviation from the
average, which is shown as a pale green curve in
Figure 1b. In such a model, many process
parameters, for instance temperatures, agitation
speeds, torque and power consumption, are
included in the model as shown in Figure 1a.
These univariate process variables are
condensed into latent variables by means of
linear combination, whereas the linear
coefficient reflects the impact of the
specific univariate variable on the impact on
the process variability.
These models reflect the inherent variability
of process and are based on empirical
production data. New batches can be assessed
by these models in order to evaluate whether
they fall within the expected ranges and
therefore yield the desired quality.
These models can be used for infor-
mation only in order to enhance process
understanding or for providing release relevant
information. For the latter application,
the methods have to be embedded into the
quality system of the firm. This entails a
complete qualification of the used automation
and IT infrastructure as well as the validation
of the methodology itself. Special effort has
to be taken on defining the procedures to
handle deviations and the involved function
from production, engineering to quality control
and assurance.
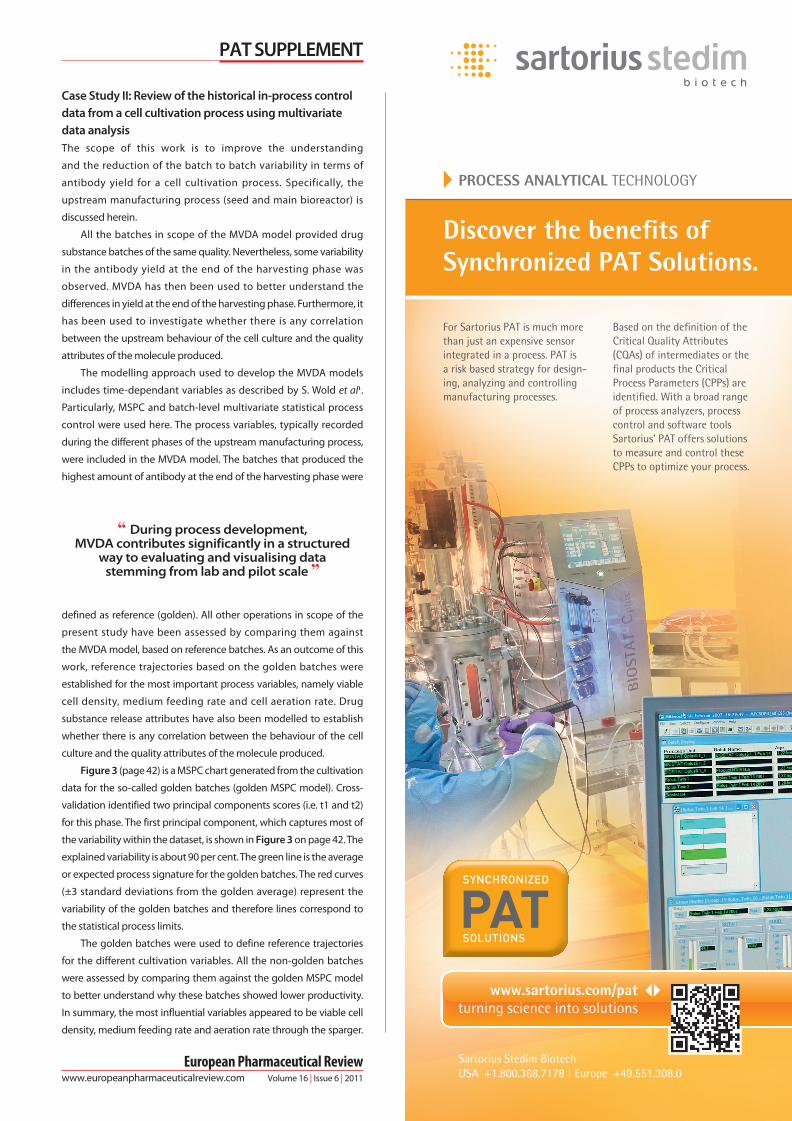
Furthermore, the maintenance plan of the
MVDA monitoring system has to be defined. As
an example, batches of a review period of one
year are shown in Figure 2, proving that the
model still covers the normal variability of
the process.
European Pharmaceutical ReviewVolume 16 | Issue 6 | 2011
40
PAT SUPPLEMENT
FIGURE 1 MSPC model for a granulation process including drying, water addition, and granulation and kneading
FIGURE 2 Assessment of recently produce batched by the model
machin_Layout 1 25/11/2011 09:56 Page 2
Case Study II: Review of the historical in-process control
data from a cell cultivation process using multivariate
data analysis
The scope of this work is to improve the understanding
and the reduction of the batch to batch variability in terms of
antibody yield for a cell cultivation process. Specifically, the
upstream manufacturing process (seed and main bioreactor) is
discussed herein.
All the batches in scope of the MVDA model provided drug
substance batches of the same quality. Nevertheless, some variability
in the antibody yield at the end of the harvesting phase was
observed. MVDA has then been used to better understand the
differences in yield at the end of the harvesting phase. Furthermore, it
has been used to investigate whether there is any correlation
between the upstream behaviour of the cell culture and the quality
attributes of the molecule produced.
The modelling approach used to develop the MVDA models
includes time-dependant variables as described by S. Wold et al1.
Particularly, MSPC and batch-level multivariate statistical process
control were used here. The process variables, typically recorded
during the different phases of the upstream manufacturing process,
were included in the MVDA model. The batches that produced the
highest amount of antibody at the end of the harvesting phase were
defined as reference (golden). All other operations in scope of the
present study have been assessed by comparing them against
the MVDA model, based on reference batches. As an outcome of this
work, reference trajectories based on the golden batches were
established for the most important process variables, namely viable
cell density, medium feeding rate and cell aeration rate. Drug
substance release attributes have also been modelled to establish
whether there is any correlation between the behaviour of the cell
culture and the quality attributes of the molecule produced.
Figure 3 (page 42) is a MSPC chart generated from the cultivation
data for the so-called golden batches (golden MSPC model). Cross-
validation identified two principal components scores (i.e. t1 and t2)
for this phase. The first principal component, which captures most of
the variability within the dataset, is shown in Figure 3 on page 42. The
explained variability is about 90 per cent. The green line is the average
or expected process signature for the golden batches. The red curves
(±3 standard deviations from the golden average) represent the
variability of the golden batches and therefore lines correspond to
the statistical process limits.
The golden batches were used to define reference trajectories
for the different cultivation variables. All the non-golden batches
were assessed by comparing them against the golden MSPC model
to better understand why these batches showed lower productivity.
In summary, the most influential variables appeared to be viable cell
density, medium feeding rate and aeration rate through the sparger.
European Pharmaceutical Reviewwww.europeanpharmaceuticalreview.com Volume 16 | Issue 6 | 2011
PAT SUPPLEMENT
SYNCHRONIZED
PATSOLUTIONS
PROCESS ANALYTICAL TECHNOLOGY
Discover the benefi ts of Synchronized PAT Solutions.
For Sartorius PAT is much more
than just an expensive sensor
integrated in a process. PAT is
a risk based strategy for design-
ing, analyzing and controlling
manu facturing processes.
Based on the defi nition of the
Critical Quality Attributes
(CQAs) of intermediates or the
fi nal products the Critical
Process Parameters (CPPs) are
identifi ed. With a broad range
of process analyzers, process
control and software tools
Sartorius’ PAT offers solutions
to measure and control these
CPPs to optimize your process.
Sartorius Stedim Biotech
USA +1.800.368.7178 | Europe +49.551.308.0
www.sartorius.com/patturning science into solutions
“ During process development, MVDA contributes significantly in a structured
way to evaluating and visualising data stemming from lab and pilot scale ”
machin_Layout 1 25/11/2011 09:56 Page 3

In addition, the inoculation density of cells to the
main bioreactor appears to be important and
the medium feeding rate should be a function
of the actual viable cell density in the main
bioreactor phase. Generally, it appears
important to maintain the aeration rate at a
lower level at the beginning of the culture.
All the batches have then been summarised
by combining all the process data (both seed
and main bioreactor) over time and the DS
quality attributes at the batch level (i.e. using a
Batch-level Statistical Process Control
modelling) in Figure 4. Two are the principal
component scores (i.e. t1 and t2), as per cross-
validation, explaining about 60 per cent of the
variability. Each batch is now represented by one
single data point of coordinates (t1, t2).
As can be seen in Figure 4, all the manu -
facturing operations fall within the
95 per cent confidence ellipsoid, no matter if
golden or not. This indicates an overall similarity
of behaviour across all the operations in
scope of the MVDA. We could therefore
conclude that the behaviour during the
upstream process does not appear to have an
impact on the final DS characteristics.
European Pharmaceutical ReviewVolume 16 | Issue 6 | 2011
42
PAT SUPPLEMENT
1. S. Wold et al. Multi- and Megavariate Data AnalysisPart 1, 2nd edition – chapters 12 and 13
REFERENCE
FIGURE 3 Golden MSPC model for the main bioreactor. The average or desired process signature is also shown (pale green trace). The red traces are indicative of the variability between reference batches(±3 standard deviations from the average)
FIGURE 4 Batch-level principal component analysis score scatter plot obtained by Batch-level StatisticalProcess Control (BSPC) modelling which summarises the cultivation data for each operation into a singledata point. Golden batches are represented by blue triangles and non-golden batches by red squares. Allthe batches lie within a 95 per cent confidence interval
Dr. Marianna Machin is currentlySenior Process Analytical TechnologyExpert at Novartis. She is responsible forMultiVariate Data Analysis and ProcessAnalytical Technology within GlobalTechnical Operations. Prior to taking hercurrent position, Dr. Machin worked at
GlaxoSmithKline as Quality by Design Champion in thePharmaceutical Development department and also worked on analysis, interpretation and representation ofPharmacoKinetics data in the Clinical PharmacokineticModelling and Simulation group. Marianna is a chemicalengineer by background and holds a PhD in bioengineeringfrom Padua University in Italy in collaboration with The ScrippsResearch Institute (La Jolla, California).
BIOGRAPHY
Antonio Peinado Amores is currentlya senior PAT expert in Global Pharma -ceutical Engineering at Novartis. Hiscurrent position involves implementingNIR and Raman solutions for monitoringpharmaceutical processes and usingMultivariate Data Analysis for Process
Understanding and Troubleshooting. Previously, Antonioworked for five years in Pharmaceutical Development atGlaxoSmithKline. Antonio obtained his PhD at the UniversityAutonomas of Barcelona in 2004. He completed a post-doc inchemometrics sponsored by Total-Fina-Elf at CNRS-Lille.
BIOGRAPHY
Lorenz Liesum is currently a senior PATexpert in Global PharmaceuticalEngineering at Novartis and is leadingPAT projects within the manufacturingdepartment. Previously he worked in chemical and pharmaceuticaldevelopment for Roche and Novartis as
an analytical scientist. Lorenz is a chemist by training andobtained his PhD at the ETH Zurich in the field of magneticresonance spectroscopy.
BIOGRAPHY
“MVDA is a valid tool to improve the understanding
of the process ”
machin_Layout 1 25/11/2011 09:56 Page 4
Top Related