


Languages
Pages
Legal


THE EFFECT OF PREDISINFECTION WITH CHLORINE DIOXIDE ON THE FORMATION OF
HALOACETIC ACIDS AND TRIHALOMETHANES IN A DRINKING WATER
SUPPLY
Charissa Larine Harris
Thesis submitted to the faculty of the Virginia Polytechnic Institute and State University in partial
fulfillment of the requirements for the degree of
Master of Science
in
Environmental Engineering
Robert Hoehn, Co-Chair
Andrea Dietrich, Co-Chair
Daniel Gallagher
July 27, 2001
Blacksburg, Virginia
Keywords: chlorine dioxide, disinfection byproducts, trihalomethanes, haloacetic acids
ii
THE EFFECT OF PREDISINFECTION WITH CHLORINE DIOXIDE ON THE
FORMATION OF HALOACETIC ACIDS AND TRIHALOMETHANES IN A
DRINKING WATER SUPPLY
Charissa Larine Harris
(ABSTRACT)
In an effort to maintain compliance with current and future United States
Environmental Protection Agency regulations governing haloacetic acids (HAAs) and
trihalomethanes (THMs), the Blacksburg, Christiansburg, VPI (BCVPI) Water Authority
in Radford, Virginia elected to eliminate prechlorination and replace it with preoxidation
using chlorine dioxide (ClO2). Prior to full-scale application at the BCVPI Water
Treatment Plant, jar testing was done to determine the effects of ClO2 on the formation of
HAAs and THMs.
Jar testing results showed a significant reduction in THM formation potential
when 2.0 mg/L ClO2 was applied to raw water and chlorination was delayed. Chlorine
dioxide doses less than 2.0 mg/L were statistically insignificant in the reduction of THM
formation potentials below samples that were prechlorinated according to the BCVPI
Water Treatment Plant�s current practice. Likewise, ClO2 did not alter HAA formation
potentials in such a way that statistical differences could be detected between ClO2
pretreatment and prechlorination, even at a dose of 2.0 mg/L ClO2.
The two inorganic byproducts of ClO2, chlorite and chlorate, were also measured
following jar tests. Chlorite concentrations increased with an increased ClO2 dose, but
remained below 1.0 mg/L. Chlorate was formed in all jar-test samples.

iii
ACKNOWLEDGEMENTS
Much appreciation is offered to CDG Technologies, Inc. for their financial
support of this project and to Gerald Higgins, P.E. and his staff at the Blacksburg,
Christiansburg, VPI Water Treatment Plant for their support and friendship. Great thanks
are also extended to the Edna Bailey Sussman Fund for their generous funding. In
addition, much gratitude is extended to my advisors, Dr. Robert Hoehn, Dr. Andrea
Dietrich, and Dr. Daniel Gallagher for their expertise, guidance, and friendship.
Furthermore, sincere gratitude is given to Jody Smiley and Julie Petruska for all their
assistance and training in the laboratory.
iv
TABLE OF CONTENTS
ABSTRACT....................................................................................... ii
ACKNOWLEDGEMENTS............................................................... iii
CHAPTER 1 INTRODUCTION ............................................................................. 1
CHAPTER 2 LITERATURE REVIEW .................................................................. 3
Chlorine Dioxide General Properties and Chemistry ........................ 3
Chlorine Dioxide Reactions............................................................... 4
Chlorine Dioxide Generation ............................................................ 5
Acid: Chlorite Solution ............................................................ 5
Chlorine Solution: Chlorite Solution ....................................... 6
Gaseous Chlorine: Liquid or Solid Chlorite Systems .............. 6
Emerging Technologies............................................................ 7
Chlorine Dioxide as a Disinfectant .................................................... 7
Chlorine Dioxide Byproducts and Regulations ................................. 8
Chlorine Dioxide Usage during Water Treatment ............................. 9
Chlorine Dioxide Reactions with Natural Organic Matter ................ 10
Trihalomethanes and Haloacetic Acids ............................................. 11
Effect of Water Quality on DBP Formation ...................................... 13
Chlorine Dioxide, Haloacetic Acids and Trihalomethanes................ 14
CHAPTER 3 METHODS AND MATERIALS....................................................... 17
Materials ............................................................................................ 17
Jar Test Procedure.............................................................................. 18
Chlorite Ion and Chlorate Ion Analyses............................................. 20
TOC Analyses .................................................................................... 21
Haloacetic Acid and Trihalomethane Simulated
Distribution System Potential Analyses............................................. 21
Total Trihalomethane Analysis Procedure......................................... 22
Haloacetic Acid Analysis Procedure.................................................. 22
Statistical Calculations....................................................................... 22
CHAPTER 4 RESULTS .......................................................................................... 24
Effects of Chlorine Dioxide on Trihalomethane Formation .............. 24

v
Effects of Chlorine Dioxide on Haloacetic Acid Formation ............. 30
Total Organic Carbon Concentrations in Treated Water ................... 33
Chlorite and Chlorate Results ............................................................ 40
CHAPTER 5 DISCUSSION .................................................................................... 42
CHAPTER 6 SUMMARY AND CONCLUSIONS ................................................ 45
Summary............................................................................................ 45
Conclusions........................................................................................ 46
REFERENCES .................................................................................. 48
APPENDIX A Trihalomethane Results from Jar Testing.......................................... 53
APPENDIX B Haloacetic Acid Results from Jar Testing ......................................... 62
APPENDIX C Chlorite Results from Jar Testing ...................................................... 70
APPENDIX D Chlorate Results from Jar Testing ..................................................... 72
APPENDIX E Total Organic Carbon Results from Jar Testing ................................ 74
APPENDIX F Raw water Quality Measurements ..................................................... 76
APPENDIX G Statistical Analyses of THMs and HAAs .......................................... 78
VITA .................................................................................................. 91
vi
LIST OF TABLES
Table 2-1 Chlorine Dioxide General Properties ................................................... 3
Table 2-2 Trihalomethanes and Haloacetic Acids................................................ 12
Table 3-1 Jar Test Conditions at the Blacksburg, Christiansburg, VPI WTP ...... 18
Table 3-2 Treatments Applied During Jar Tests................................................... 19
Table 4-1 Description of jar testing protocol and graph abbreviations ................ 26
Table 6-1 Summary of the number of times each treatment option was
below the current and proposed MCLs ................................................ 47
Table A-1 TTHM Results from August 10, 2000 ................................................. 54
Table A-2 TTHM Results from September 12, 2000............................................ 55
Table A-3 TTHM Results from September 21, 2000............................................ 56
Table A-4 TTHM Results from October 24, 2000 ................................................ 57
Table A-5 TTHM Results from November 9, 2000 .............................................. 58
Table A-6 TTHM Results from February 1, 2001................................................. 59
Table A-7 TTHM Results from February 6, 2001................................................. 60
Table A-8 TTHM Results from March 24, 2001................................................... 61
Table B-1 HAA Results from August 10, 2000 .................................................... 63
Table B-2 HAA Results from September 12, 2000............................................... 64
Table B-3 HAA Results from September 21, 2000............................................... 65
Table B-4 HAA Results from October 24, 2000................................................... 66
Table B-5 HAA Results from February 1, 2001 ................................................... 67
Table B-6 HAA Results from February 6, 2001 ................................................... 68
Table B-7 HAA Results from March 24, 2001 ..................................................... 69
Table C-1 Chlorite Results .................................................................................... 71
Table D-1 Chlorate Results ................................................................................... 73
Table E-1 TOC Results ......................................................................................... 75
Table F-1 Water Quality parameters of untreated New River water .................... 77
Table G-1 Statistical Output for TTHMs .............................................................. 79
Table G-2 Statistical Output for Fall and Winter TTHMs .................................... 81
Table G-3 Statistical Output for ClO2 dose comparisons of TTHMs.................... 83
vii
Table G-4 Statistical Output for HAA5................................................................. 85
Table G-5 Statistical Output for Fall and Winter HAA5....................................... 87
Table G-6 Statistical Output for ClO2 dose comparisons of HAA5...................... 89

viii
LIST OF FIGURES
Figure 4-1 Total trihalomethanes generated at the Blacksburg,
Christiansburg, VPI Water Treatment Plant......................................... 25
Figure 4-2 Percent reduction in TTHM concentrations as compared
to predisinfection with chlorine............................................................ 28
Figure 4-3 Fall and winter (October-March) TTHM concentrations..................... 29
Figure 4-4 Typical distribution of TTHM compounds .......................................... 31
Figure 4-5 HAA5 concentrations from jar testing at the Blacksburg,
Christiansburg, VPI Water Treatment Plant......................................... 32
Figure 4-6 Percent reduction in HAA5 concentration as compared
to predisinfection with chlorine............................................................ 34
Figure 4-7 Fall and winter (October-March) HAA5 concentrations...................... 35
Figure 4-8 HAA9 Concentrations .......................................................................... 36
Figure 4-9 Percentage of total HAA5 comprised of DCAA and TCAA ............... 37
Figure 4-10 Seasonal variations in TOC measured in each jar at the
conclusion of jar testing ....................................................................... 38
Figure 4-11 Concentration of TOC measured in each jar at the
conclusion of jar testing ....................................................................... 39
Figure 4-12a Chlorite concentrations measured at the conclusion of jar testing....... 41
Figure 4-12b Chlorate concentrations measured at the conclusion of jar testing ...... 41

1
CHAPTER 1.
INTRODUCTION
In the early 1900s, the United States drinking water industry drastically reduced
the number of fatal waterborne disease outbreaks when it began chlorinating drinking
water. Some ninety years later, the United States Environmental Protection Agency
imposed stringent regulations governing chlorination of drinking water supplies because
this same chemical, which had saved so many lives, produced suspected carcinogens in
the presence of naturally occurring organic matter (Letterman 1999).
Two groups of these potential carcinogens are trihalomethanes (THMs) and
haloacetic acids (HAAs). Both form when chlorine reacts with natural organic matter in
raw water. Chlorine dioxide (ClO2) is an alternative to chlorine because it is an oxidizing
agent rather than a chlorinating agent, and therefore, will not form chlorinated
disinfection byproudcts such as HAAs and THMs under typical water treatment
conditions (Aieta and Berg 1986). Consequently, many drinking water utilities add ClO2
to their raw water and delay chlorination until later in the treatment process in efforts to
comply with existing state and federal THM regulations. Effective January 1, 2002, the
Disinfectant/Disinfection Byproducts Rule (Federal Register 1998) will become
effective, and the THM maximum contaminant level (MCL) will be reduced from 0.10
mg/L to 0.080 mg/L. In addition, a new MCL for HAAs (0.060 mg/L) will be imposed.
The study described in this thesis was conducted at the Blacksburg,
Christiansburg, VPI (BCVPI) Water Authority�s water treatment plant (WTP), which is
located in Radford, Virginia, approximately twelve miles from the Virginia Tech campus.
The Authority provides drinking water to two towns and the university at an average rate
of 7 million gallons per day. The raw-water source is the New River, and the intake is
located several miles from the WTP. The treatment process includes prechlorination,
coagulation, flocculation, sedimentation, filtration and post chlorination.
Since 1979, THM levels in treated water at the BCVPI WTP have routinely been
below the existing MCL. The available data, however, show that some changes in the
existing treatment practices will be required to ensure that the HAA MCL is consistently
met. So, the Authority plans to evaluate the effectiveness of adding ClO2 as a preoxidant
2
instead of chlorine to the raw water, which is pumped to the treatment plant from the
New River. Chlorination will be delayed until after coagulation and flocculation have
bound much of the natural organic matter in floc.
Chlorine dioxide use in conjunction with delayed chlorination is widely
documented and accepted as an effective practice for reducing THM concentrations in
finished water, but less information is available on the success of such practices for
reducing HAAs. Because HAAs were the BCVPI Authority�s major concern and
because of the apparent gap in available research on the topic, a critical objective of this
research was to provide insight into the role ClO2 might play in reducing HAA formation.
The research project described in this thesis was a laboratory-scale study that
preceded a full-scale evaluation of ClO2 as a preoxidant. The objectives were to:
• Evaluate the extent to which ClO2 preoxidation of raw water and delayed
chlorination can reduce the HAA and THM formation potentials of New River
water under treatment conditions similar to those in the full-scale WTP.
• Determine the levels of the two inorganic ClO2 byproducts, chlorite and chlorate,
in water treated in jar tests.

3
CHAPTER 2.
LITERATURE REVIEW
Chlorine Dioxide General Properties and Chemistry
Chlorine dioxide (ClO2) is a greenish-yellow gas that exists as a free radical.
Solutions are also greenish-yellow and have an odor similar to chlorine. In air, the odor
can be detected at concentrations as low as 0.3 ppm. Other chemical characteristics are
shown in Table 2-1.
Table 2-1: Chlorine Dioxide General Properties (Material Safety Data Sheet for Chlorine Dioxide and Gordon 2001)
Chemical Formula ClO2 Molecular Weight 67.5 g/mol
Liquid Specific Gravity (0°C) 1.64 Melting Point -59°C (-75°F) Boiling Point 11°C (52°F)
Vapor Pressure (20°C) 760 mm Hg Solubility in Water (20°C) 0.8 g/100 g
Vapor Density in Air (Air = 1) 2.3 Ignition Temperature 130°C (266°F)
∆G° (25°C) 2.95 kcal/mol ∆H° (25°C) 25 kcal/mol ∆S° (25°C) 43.9 eu (aq)
Partition Coefficient (35°C) 21.5
ClO2 does not hydrolyze in water but exists as a dissolved gas at temperatures
above 11°C. Solutions are extremely volatile and must be kept in closed containers
(White 1999). When exposed to ultraviolet light, ClO2 in solution will photolytically
decompose to chlorate ion (ClO3-). Hence, solutions must also be stored in the dark to
avoid a decrease in solution strength and the undesirable formation of ClO3- (Gordon et
al. 1972).
ClO2 remains stable and does not ionize in solution between pH 2 and 10. In high
pH waters, however, ClO2 will disproportionate to chlorite ion (ClO2-) and ClO3
-
according to the following reaction (Gallagher et al. 1994 citing Rosenblatt 1978):
2ClO2 + 2OH- → ClO2- + ClO3
- + H2O [1]

4
ClO2 is explosive at 5.8 psi (40 kPa) above atmospheric pressure and therefore, it
can neither be stored nor compressed and must be generated on-site when it is used at
water treatment facilities. At concentrations greater than 10 g/L in solution, explosive
vapor pressures exist, but this feature is not a great concern to water utility personnel
because ClO2 is generally used at dosages between 0.1 to 5 mg/L (Aieta and Berg 1986).
Chlorine Dioxide Reactions
Chlorine dioxide oxidizes organic matter; it does not chlorinate it. Chlorine, on
the other hand, reacts by oxidation and electrophilic substitution (Aieta and Berg 1986).
Chlorine dioxide behaves as a selective oxidant through a one-electron transfer, as
follows (USEPA 1999):
ClO2(aq) + e- → ClO2- [2]
During oxidation reactions, with organic matter, 50 to 70 percent of the ClO2 dose will be
converted to ClO2- and the remainder will be converted to ClO3
- and chloride ion
(USEPA 1999).
Another potential source of ClO2- in drinking water treated with ClO2 is unreacted
sodium chlorite (NaClO2) that passes through the ClO2 generator. This problem is
eliminated if the solid NaClO2: gaseous chlorine system produced by CDG Technology,
Inc. is used. Chlorate can also be present in stock sodium chlorate (NaClO3) solutions
and, in fact, a certain percentage of NaClO3 impurity is allowed. Usually, the amount is
much less than one percent. Chlorate can also form during ClO2 generation. In this
reaction, an unstable, unsymmetrical intermediate (chlorine oxide) is formed, (reaction
[3]).
Cl2 + ClO2- → {Cl2O2} + Cl- [3]
When both reactants are present in high concentration, the intermediate readily forms
ClO2 by either of the two following reactions:
2{Cl2O2} → 2ClO2 + Cl2 [4]
{Cl2O2} + ClO2- → 2ClO2 + Cl- [5]
5
In generators that function with low initial reactant concentrations, or when excess
chlorine is present, the intermediate will form chlorate according to reactions [6] and [7]
(Gates 1998; Gordon 2001; USEPA 1999).
{Cl2O2} + H2O → ClO3- + Cl- + 2H+ [6]
{Cl2O2} + HOCl → ClO3- + Cl2 + H+ [7]
Chlorate ion can also be formed from the photolytic decay of ClO2. The problem
with ClO3- formation is that, unlike ClO2
-, once formed, it cannot be removed from the
water (White 1999). Plants that practice softening must also take precautions when using
ClO2 because under alkaline conditions, ClO2 will form ClO2- and ClO3
- (USEPA 1999).
Chlorine Dioxide Generation
ClO2 can be generated by several different methods, but the most common
processes utilize a 25 percent NaClO2 solution that is reacted with either an aqueous or
gaseous chlorine source (Aieta and Berg 1986). The various methods are described
below in greater detail.
Acid: Chlorite Solution
This is an older technique for generating ClO2 that involves acidifying the
NaClO2 solution by addition of either sulfuric or hydrochloric acid. The common
reactions for the use of sulfuric acid are (White 1999):
4NaClO2 + 2H2SO4 → 2Na2SO4 + 2ClO2 + HCl + HClO3 + H2O [8]
and/or
10NaClO2 + 5H2SO4 → 5Na2SO4 + 8ClO2 + 2HCl + 4H2O [9]
Hydrochloric acid is preferred over sulfuric acid because it produces a higher ClO2 yield.
The reaction is as follows (White 1999):
5NaClO2 + 4HCl → 4ClO2 + 5NaCl + H2O [10]
These methods are seldom used in water treatment, primarily because the ClO2 yields are
low. For instance, in reaction [10], only four moles of ClO2 are produced for every five
moles of NaClO2, so the maximum conversion is only 80 percent (White 1999).
6
Chlorine Solution: Chlorite Solution
This technique for the production of ClO2 utilizes aqueous chlorine (reaction [11])
(Gordon 2001).
2ClO2- + HOCl → 2ClO2 + Cl- + OH- [11]
Early ClO2 generators added 200-300 percent more aqueous chlorine than the
stoichiometric requirement so that yields would be improved. This problem was
minimized in later systems by lowering the solution pH to favor hypochlorous acid and
molecular chlorine. A problem with generators based on this technique is that ClO3- may
be produced (Aieta and Berg 1986).
An additional drawback to the use of aqueous chlorine solution for the generation
of ClO2 is that the reaction rate is slower than in generators based on most other methods,
with the exception of the acid method previously described. The production rate for this
system is approximately 1000 pounds per day (lb/day) (USEPA 1999).
Though not commonly used in the United States, another aqueous chlorine design
is the French Loop. Chlorine gas is added to a recycling loop of water until the solution
is saturated. The solution is then reacted with liquid NaClO2 to form ClO2 (USEPA
1999).
Gaseous Chlorine: Liquid or Solid Chlorite Systems
Some generators produce ClO2 by reacting liquid NaClO2 with gaseous chlorine.
These gaseous chlorine generators produce ClO2 at rates of 5�120,000 lb/day. In this
system, described by reaction [12], NaClO2 reacts under a vacuum with gaseous chlorine.
2NaClO2 + Cl2 → 2ClO2 + 2NaCl [12]
The reaction occurs rapidly and at a neutral pH. High ClO2 yields, 95�99 percent can be
achieved with less than 2 percent excess chlorine present in solution (USEPA 1999).
A recent innovation in ClO2 generation technology is a proprietary system
produced by CDG Technology, Inc. (Bethlehem, PA) that reacts humidified, diluted
chlorine gas with solid NaClO2 in cartridge form. The result is a high-purity ClO2 gas
that is added directly to the water (White 1999).

7
Emerging Technologies
One recently developed technology generates ClO2 from a 25 percent NaClO2
solution that is recycled through an electrolyte cell (USEPA 1999). Chlorine dioxide
production by electrolytic means is limited, however, and these systems at present are
suitable only for small systems.
Another generation method involves the use of NaClO3. This procedure has long
been used by the pulp and paper industry but has only recently been made available to
drinking water plants (USEPA 1999; Gordon 2001). This system uses excessive amounts
of hydrogen peroxide and sulfuric acid according to the following reaction:
2ClO3- + H2SO4 + H2O2 → 2ClO2 + O2 + SO4
2- + 2H2O [13]
Problems with this method may inhibit its eventual success in the drinking water
industry. For example, the perchlorate ion, which is a human-health hazard, can form
under acidic conditions and can also be present in the commercial NaClO3 solution
(Gordon 2001). In addition, the procedure generates a waste stream containing hydrogen
peroxide and sulfuric acid that poses a disposal problem for water utilities.
Chlorine Dioxide as a Disinfectant
Chlorine dioxide is a powerful disinfectant. In fact, most research has determined
that it is either more effective or equal to chlorine on a mass-dose basis (Rittman 1997).
In regards to bacterial inactivation, Trakhtman (1949) determined that ClO2 doses of 1
mg/L to 5 mg/L were sufficient to kill Escherichia coli and Bacillus anthracoides in
turbid waters. Bedulivich et al. (1954) showed that ClO2 was equal to or better than
chlorine in effectiveness against Salmonella typhosa and S. paratyphi. Similar studies
have shown ClO2 to be an effective disinfectant against other bacteria of concern,
including Eberthella typhosa, Shigella dysenteriae, S. paratyphi B, Pseudomonas
aeruginosa, and Staphylococcus aureus (Ridenour 1949).
As well as being an effective bactericide, ClO2 has also been shown to be
effective for inactivation of many viruses. Various researchers have proven its
effectiveness against Poliovirus 1 and Coxsackie virus A9 (USEPA 1999 citing Ridenour
and Ingols 1946, Cronier et al. 1978, and Scarpino 1979). When compared to chlorine at

8
higher than neutral pH, ClO2 is a stronger disinfectant against Echovirus 7, Coxsackie
virus B3, and Sendaivirus (Smith and McVey 1973).
Of great concern to water utilities today are the pathogenic protozoa Giardia
lamblia, Giardia muris, and Cryptosporidium parvum. Researchers have found that
Giardia cysts and Cryptosporidium oocysts are largely resistant to free chlorine, UV
irradiation, and chloramines (Korich et al. 1990; Lorenzo-Lorenzo et al. 1993; Ransome
et al. 1993). Hofmann et al. (1997) showed a 3-log Giardia inactivation after a 60-
minute contact time with ClO2 at dosages between 1.5 mg/L and 2 mg/L. Lykins et al.
(1991) showed that ClO2 is also a strong disinfectant against Cryptosporidium oocysts.
Chlorine Dioxide Byproducts and Regulations
As noted earlier, the two inorganic byproducts of ClO2 are ClO2- and ClO3
-. No
maximum contaminant level (MCL) currently exists for ClO3-, but the MCL for ClO2
- is
1.0 mg/L and the maximum contaminant level goal (MCLG) is 0.8 mg/L. Chlorite ion in
water leaving the treatment plant must be monitored daily and monthly samples must be
collected for analysis from three places in the distribution system (one near the first
customer, one at a point approximately equal to the average hydraulic residence time in
the system, and the third at a distant point in the distribution system). Compliance is
based on the average concentration (Federal Register 1998).
Certain studies have indicated that ClO2- produces hemolytic anemia (Condie
1986). Condie (1986), citing Bercz et al. (1982), described hematological effects found
in monkeys that were given both ClO2- and ClO3
- in increasing dosages. The current
ClO2- MCL was based on the results of a two-generation study of rats that was sponsored
by the Chemical Manufacturers Association (Gates 1998).
Chlorine dioxide residuals in drinking water are also regulated by the USEPA
(Federal Register 1998). The maximum residual disinfectant level (MRDL) for ClO2 in
water leaving the treatment plant is 0.8 mg/L.
Various impact studies have been performed with ClO2 and laboratory animals.
Chlorine dioxide was found to have adverse health effects, including decreased serum T4
levels, hematological anemia, increased plasma cholesterol, and decreased plasma thyroid
hormones (Condie 1986). Condie (1986) also expressed concern over the formation of

9
iodinated organics from the reaction of residual ClO2 in drinking water and iodine present
in bodily fluids, such as saliva and gastric juices. These iodinated organics may behave
as thyroid antagonists, or thyromimetic agents.
Chlorine dioxide may also form other byproducts in addition to ClO2- and ClO3
-.
In reactions with humic and fulvic acids, ClO2 can produce quinones, hydroquinones,
aldehydes, and carboxylic acids (Rav-Acha 1984). Chlorinated byproducts, however, are
formed in only part per trillion levels because ClO2 oxidizes rather than chlorinates
organic matter (Richardson 1998).
Chlorine Dioxide Usage during Water Treatment
According to the 1995 Community Water Systems Survey conducted by the
USEPA, 14.2 percent of surface water treatment systems servicing a population of
50,001-100,000 are using ClO2 as a predisinfectant compared to 47.5 percent using
chlorine, 15.5 percent using chloramines, and 5.4 percent using ozone (USEPA 1997).
No systems servicing less than 1000 reported using ClO2. Of the groundwater systems,
the only service population that reported using ClO2 as a predisinfectant was the one
servicing 50,001-100,000 and their ClO2 usage only comprised 3.1 percent compared to
other oxidant usage.
Many of the water utilities that use ClO2 have reported receiving numerous odor
complaints from customers. Customers describe the odors as kerosene-like and cat-urine-
like. The source of these odors was unknown for many years, but utilities suspected ClO2
as the cause. Complaints occurred only when the ClO2 feed was on, but no odors were
detected at the plants themselves. Hoehn et al. (1990) substantiated the utilities� claims
that the odors were associated with ClO2 use. They found that ClO2 was being
regenerated at a few tenths of a mg/L in the distribution system between the plant and the
customers� households. Ellenberger et al. (1998) found ClO2 concentrations ranging
from 0.03 mg/L to 0.17 mg/L at the homes of customers who complained of kerosene or
cat-urine odors.
Once regenerated, the ClO2 would react with organic compounds in the air to
form the kerosene- and cat-urine-like odors. A common source of the air-phase organic
compounds is new carpeting. To prevent these odors from forming, ClO2 reformation
10
must be prevented either by ClO2- removal at the treatment plant or substitution of
chloramines for free chlorine as the residual disinfectant in the distribution system
(Hoehn et al. 1990).
Ironically, many water utilities have installed ClO2 because it provides effective
control for some types of tastes and odors. Because ClO2 does not chlorinate organic
material, the formation of odorous chlorinated phenolic compounds is avoided (Gallagher
et al. 1994).
Another use for ClO2 is manganese and iron oxidation. Both are nuisances in that
they will stain laundry and plumbing fixtures. Chlorine dioxide can quickly oxidize both
manganous ion and ferrous ion in source waters (White 1972; Knocke et al. 1990).
Chlorine Dioxide Reactions with Natural Organic Matter
Chlorine forms disinfection byproducts (DBPs) by chlorination of natural organic
matter (NOM) in the source water. The NOM itself is a heterogeneous assortment of
species derived from a variety of sources, including terrestrial plants, algae, bacteria, and
macrophytes. Characterizing NOM and its propensity to form DBPs has been a challenge
for researchers. For example, humic substances derived from microbes often contain
considerable nitrogen but little aromatic carbon and phenolic groups, while humic
substances derived from higher plants have just the opposite (Croue et al. 1999).
The amount of NOM in water is normally expressed as dissolved organic carbon
(DOC) and particulate organic carbon (POC). The sum of these is the total organic
carbon (TOC) (Letterman 1999). In most natural waters, humic substances comprise the
majority of NOM and, therefore, are the most important DBP precursors (Letterman
1999; Croue et al. 1999). Disinfection byproduct concentrations increase with an
increased amount of precursor material in the water. These precursor substances are
anionic polyelectrolytes with a range of molecular weights. Their carboxyl and phenolic
groups give them their negative charge. They contain aromatic as well as aliphatic
components (Letterman 1999).
Humic substances in water are usually classified as either fulvic acids or humic
acids. Humic acids precipitate when a water sample is acidified to pH 2.0, while fulvic
acids remain soluble (Pomes et al. 1999). Several researchers have found humic acids to
11
react more readily with chlorine than fulvic acids (Reckhow et al. 1990; Oliver and
Thurman 1983). The DBP formation potential is also greater for humic acids. In
chlorination studies conducted by Reckhow et al. (1990), chlorine was reacted at neutral
pH with fulvic and humic acids. The sum of the dichloroacetic acid (DCAA) and
trichloroacetic acid (TCAA) yields was larger than the chloroform yield. Croue et al.
(1999) citing Croue (1987) conducted a similar study with water adjusted to pH 7.5 and
found, as did Reckhow et al. (1990), that the DCAA and TCAA yields surpassed the
chloroform yield. In a later study, Croue et al. (1999) found higher concentrations of
haloacetic acids (HAAs) than trihalomethanes (THMs) and attributed the difference to
the fact that hydrophobic acids (humic substances) are removed by conventional
treatment practices, leaving the hydrophilic acids (nonhumic substances) to react with
free chlorine to form DBPs. Thus, the hydrophilic acids may in fact be the main DBP
precursors at treatment plants where chlorine is added only at the end of the treatment
process. Croue et al. (1999) stated that most research has concentrated on the difference
between DBP formation with fulvic and humic acids, but more work needs to be done to
understand the differences between hydrophobic and hydrophilic acids in the formation
of DBPs.
Because there is no currently accepted parameter for identifying DBP precursors,
a parameter called specific ultraviolet absorbance (SUVA) is used to forecast DBP
formation potentials (Croue et al. 1999). This value is the ratio of UV absorbance to
DOC concentration (Letterman 1999). Croue et al. (1999) noted that some waters with
comparable SUVA values have shown very different chlorine demands and DBP
formation potentials.
Trihalomethanes and Haloacetic Acids
THMs and HAAs comprise the first and second most prevalent halogenated DBPs
found in drinking water, respectively. Both are regulated by the USEPA because of the
human health risks associated with exposure to them. Toxicology studies have found
many of these compounds to be carcinogenic in laboratory animals. Some have also
caused adverse reproductive or developmental effects. Four THMs and nine HAAs
comprise the majority of the halogenated DBPs found in chlorinated drinking water, but
12
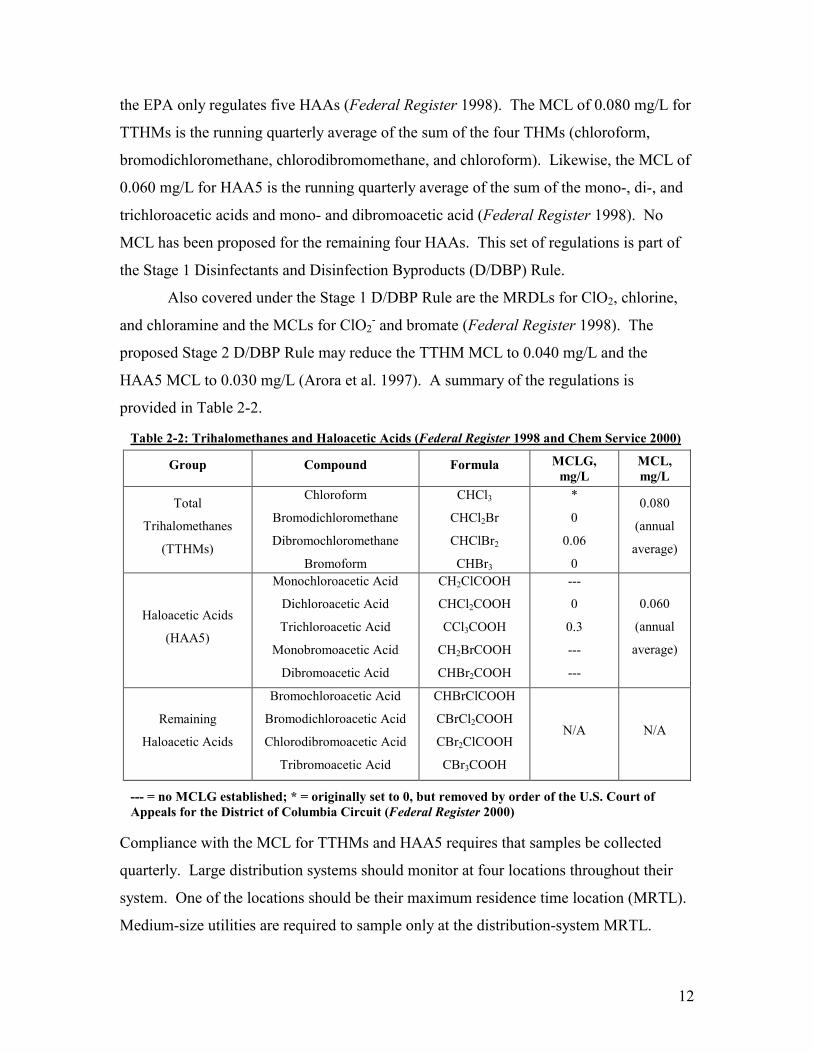
the EPA only regulates five HAAs (Federal Register 1998). The MCL of 0.080 mg/L for
TTHMs is the running quarterly average of the sum of the four THMs (chloroform,
bromodichloromethane, chlorodibromomethane, and chloroform). Likewise, the MCL of
0.060 mg/L for HAA5 is the running quarterly average of the sum of the mono-, di-, and
trichloroacetic acids and mono- and dibromoacetic acid (Federal Register 1998). No
MCL has been proposed for the remaining four HAAs. This set of regulations is part of
the Stage 1 Disinfectants and Disinfection Byproducts (D/DBP) Rule.
Also covered under the Stage 1 D/DBP Rule are the MRDLs for ClO2, chlorine,
and chloramine and the MCLs for ClO2- and bromate (Federal Register 1998). The
proposed Stage 2 D/DBP Rule may reduce the TTHM MCL to 0.040 mg/L and the
HAA5 MCL to 0.030 mg/L (Arora et al. 1997). A summary of the regulations is
provided in Table 2-2.
Compliance with the MCL for TTHMs and HAA5 requires that samples be collected
quarterly. Large distribution systems should monitor at four locations throughout their
system. One of the locations should be their maximum residence time location (MRTL).
Medium-size utilities are required to sample only at the distribution-system MRTL.
Table 2-2: Trihalomethanes and Haloacetic Acids (Federal Register 1998 and Chem Service 2000)
Group Compound Formula MCLG, mg/L
MCL, mg/L
Total
Trihalomethanes
(TTHMs)
Chloroform
Bromodichloromethane
Dibromochloromethane
Bromoform
CHCl3
CHCl2Br
CHClBr2
CHBr3
*
0
0.06
0
0.080
(annual
average)
Haloacetic Acids
(HAA5)
Monochloroacetic Acid
Dichloroacetic Acid
Trichloroacetic Acid
Monobromoacetic Acid
Dibromoacetic Acid
CH2ClCOOH
CHCl2COOH
CCl3COOH
CH2BrCOOH
CHBr2COOH
---
0
0.3
---
---
0.060
(annual
average)
Remaining
Haloacetic Acids
Bromochloroacetic Acid
Bromodichloroacetic Acid
Chlorodibromoacetic Acid
Tribromoacetic Acid
CHBrClCOOH
CBrCl2COOH
CBr2ClCOOH
CBr3COOH
N/A N/A
--- = no MCLG established; * = originally set to 0, but removed by order of the U.S. Court of Appeals for the District of Columbia Circuit (Federal Register 2000)
13
Small utilities are required to collect only one sample a year at the MRTL during the
warmest time of the year (Williams et al. 2000; Chen and Weisel 1998). The assumption
inherent in these requirements is that THM and HAA concentrations will be the greatest
at the MRTL because it represents the maximum time possible for reactions to occur.
This assumption appears to hold for THMs.
A yearlong study in England found a 40-60 percent increase in THMs with
increasing distance from the water treatment plant, even though the chlorine residual
steadily decreased with distance (Chen and Weisel 1998 citing Brett and Calverley 1979).
Others have corroborated these results (Williams et al. 2000; Letterman 1999). This
relationship, however, may not exist for HAAs. Williams et al. (2000) monitored HAA5
levels at the MRTL in the Newport News, Virginia distribution system during several
summers and found either low or undetectable levels of HAA5. Other local utilities have
experienced similar results. The researchers were able to link the degradation of DCAA
to bacteria found in the biofilm (Williams et al. 2000).
Chen and Weisel (1998) also found that DCAA concentrations decreased with
increased residence time along the distribution system. The decrease was more dramatic
in warmer seasons, possibly as a result of increased microbial activity during periods
when water temperatures were warmer. The TCAA concentrations also declined but by a
smaller amount.
Effect of Water Quality on DBP Formation
The propensity of a humic substance to form DBPs is complicated and varies not
only with the properties of the humic substance itself, but also with water quality
parameters such as pH, temperature, and bromide concentration. Chlorine residual
concentration is also a key player (Croue et al. 1999). In general, THM formation
increases with increasing pH (Letterman 1999; AWWA 1982). On the other hand, HAA
formation decreases with increasing pH (Letterman 1999).
In terms of temperature effects, both THM and HAA formation increase with
increasing temperature (Letterman 1999; AWWA 1982; Dojlido et al. 1999; Arora et al.
1997). Conversely, elevated temperatures may also speed the biological degradation of
HAAs (Letterman 1999; Williams et al. 2000).

14
Another parameter that has a positive effect on HAA and THM formation is
bromide ion. In chlorinated waters, bromide is oxidized by chlorine to hypobromous
acid, which ultimately forms brominated DBPs (Letterman 1999).
Finally, high chlorine doses will form greater concentrations of DBPs as long as
the water is not limited by the amount of precursor material. This is why shifting the
chlorination point to later in the treatment process may decrease DBP formation. There
is less precursor material for the chlorine to react with after coagulation and flocculation
have occurred (Letterman 1999). As for ClO2, increasing doses have been shown to have
the opposite effect as chlorine. Treated-water THM and HAA concentrations decrease
following treatment with ClO2 at doses above 1.5 mg/L (Griese 1991).
Chlorine Dioxide, Haloacetic Acids and Trihalomethanes
One of the most common reasons utilities switch to ClO2 is for DBP control.
Dietrich et al. (1992) found that 65 percent of 32 plants surveyed were using ClO2
precisely for that reason. As stated earlier, ClO2 disinfection differs from chlorine
disinfection in that ClO2 does not chlorinate organic material. It oxidizes it, thereby
avoiding the formation of THMs and HAAs.
Some studies have linked ClO2 to the formation of THMs and HAAs. For
instance, Chang et al. (2000) found that HAAs and THMs were formed when 15-30 mg/L
ClO2 was reacted with vanillic, p-hydroxybenzoic, and humic acids. The DBPs increased
with an increasing ClO2 dose. Gordon (2001) and Masschelein (1979) dispute research
results such as these saying the formation of DBPs from ClO2 is most likely the result of
chlorine and/or ClO2- contamination in the ClO2 solution itself. In fact, other studies
have shown that ClO2 will not react to form THMs and HAAs. For example, the Los
Angeles Department of Water and Power (LADWP) evaluated the use of ClO2 to control
algal growth in an open reservoir that provides finished water. The LADWP had been
using chlorine to control the algae problem, but THMs and HAAs were being formed.
Chlorine dioxide for the study was generated by reacting liquid NaClO2 (25 percent
solution) with chlorine gas under vacuum. The ClO2 solution was applied to the reservoir
at chosen times during select summer and fall evenings at dosages ranging between 0.8 to
1.5 mg/L as ClO2. Both THM and HAA levels decreased during treatment with ClO2,

15
and the levels rose once chlorination was resumed. Chlorite ion and ClO3- levels were
below 1 mg/L in the distribution system and did not cause concern. The trials showed
that ClO2 could effectively control the algae problem without producing THMs and
HAAs (Stolarik and Liu 2000).
The Evansville, Indiana Water and Sewer Utility evaluated the ability ClO2
addition for reducing THM formation in a 100 gpm (gallons per minute) pilot plant study.
As part of the study, ClO2 was used as a predisinfectant. Samples were collected
monthly during the one year study and following collection, were incubated at pH 8 with
a free chlorine residual for three days before analysis. The THM levels in the plant�s
effluent were 60 percent less when ClO2 was used than when pre- and post chlorination
were practiced. Neither disinfectant altered the TOC concentration (Lykins and Griese
1986). In a later study, Griese (1991) found that incrementally increasing the ClO2 dose
led to further reductions in THM and HAA concentrations. Increasing the ClO2 dose
from 2 mg/L to 5 mg/L resulted in a 48 percent reduction in THMs. The HAA
concentrations decreased when ClO2 concentrations were increased to levels greater than
3 mg/L (Griese 1991).
Li et al. (1996) also studied the formation of THMs in waters treated with ClO2.
Bromide-free water that was treated with up to 20 mg/L ClO2 and 2.0 mg/L humic acid
was free of THMs. However, bromoform was found in water containing bromide ion and
humic acids when it was treated with ClO2. The bromoform concentration increased with
increasing ClO2 dose and increased bromide ion content. The authors speculated that
bromoform formed when either ClO2 or ClO2- oxidized bromide ion to form
hydrobromous acid, which in turn, reacted with humic acid (Li et al. 1996). Experiments
were also performed with combination solutions of ClO2 and chlorine. Chloroform was
the only THM detected in bromide-free water. If the ClO2-to-chlorine ratio (w/w) was
increased to 3, chloroform formation was reduced by 90 percent.
In one final example, ClO2 was evaluated as a predisinfectant in a 30 gpm pilot
plant for possible use at a direct filtration plant (Hulsey et al. 2000). Chlorine dioxide
dosages were 0.2 mg/L, 0.5 mg/L and 1.0 mg/L. The addition point was varied to
determine the impacts on DBP formation and other parameters. Simulated distribution
system tests were set up by adjusting samples from the full scale plant and the pilot plant
16
to pH 7.8 and measuring pH, chlorine residual, THMs and HAAs at 1, 24, 48, and 168
hours after chlorination. It was necessary to add chlorine to the pilot plant samples to
produce a residual of 2.5 mg/L. Chlorine dioxide residuals and ClO2- concentrations in
samples taken from the pilot plant were also determined. The five HAAs that are
included in the MCL plus bromochloroacetic acid were analyzed. The TTHM and HAA6
concentrations were reduced 23 percent and 4 percent, respectively, when the ClO2 dose
was 0.2 mg/L, 32 percent and 43 percent, respectively, when the dose was 0.5 mg/L, and
23 percent and 33 percent, respectively, when the dose was 1.0 mg/L. Chlorite ion
concentrations in filtered water after treatment with ClO2 at 0.2, 0.5, and 1.0 mg/L were,
respectively, 0.24 mg/L, 0.55 mg/L, and 0.83 mg/L, all less than the current 1.0 mg/L
MCL. Increased ClO2 doses may have had a more beneficial effect on DBP formation,
but ClO2- formation is a concern and a constraint on the amount of ClO2 that can be used
unless some means are provided to remove it (Hulsey et al. 2000).

17
CHAPTER 3.
METHODS AND MATERIALS
Materials
All glassware was purchased from Fisher Scientific (Atlanta, GA) and cleaned by
soaking it in a chromic acid cleaning solution for eight hours, rinsing it three times with
Nanopure� water, and allowing it to air-dry. Plasticware was cleaned with water
containing a detergent, Sparkleen�, then rinsed thoroughly with Nanopure� water and
allowed to air-dry.
All chemicals were purchased from Fisher Scientific unless indicated otherwise.
The standards used for trihalomethane (THM) and haloacetic acid (HAA) calibrations
were purchased from Chem Service, Inc. (West Chester, PA). The THM standards were
a mixture of four compounds (chloroform (CASRN 67-66-3), dichlorobromomethane
(CASRN 75-27-4), chlorodibromomethane (CASRN 124-48-1), and bromoform
(CASRN 75-25-2)) and the HAA standards were a mixture of nine HAAs and a
surrogate, 2,3-dibromopropionic acid (CASRN 600-05-5). The nine HAAs in the
standard included: mono- (CASRN 79-11-8), di- (CASRN 79-43-6), and trichloroacetic
acid (CASRN 76-03-9); mono- (CASRN 79-08-3), di- (CASRN 631-64-1), and
tribromoacetic acid (CASRN 75-96-7); and three acetic acid isomers containing both
chlorine and bromine, (bromochloroacetic acid (CASRN 5589-96-8),
bromodichloroacetic acid (CASRN 71133-14-7), and chlorodibromoacetic acid (CASRN
5278-95-5)). An internal standard, 1,2,3-trichloropropane (CASRN 96-18-4), was also
purchased from Chem Service, Inc. Haloacetic acid methyl derivatives were purchased
from Fisher Scientific to check the HAA extraction and analysis procedure.
The stock chlorine solution was prepared by bubbling high purity chlorine gas
into a solution of 1.5 L of Nanopure� and 4 g NaOH. The chlorine gas feed was turned
off once the solution reached pH 7. When not in use, the stock solution was refrigerated
in the dark at 4°C.
The chlorine dioxide (ClO2) stock solution was generated by passing 4 percent
chlorine gas through a solid sodium chlorite (NaClO2) reactor cartridge according to

18
instructions provided by CDG Technology, Inc. (Bethlehem, PA), the provider of the
ClO2 generator. When not in use, the stock solution was refrigerated in an opaque, glass
container at 4°C. Prior to each use, the absorbance of the ClO2 solution was determined
with a Beckman (Fullerton, CA) spectrophotometer (DU� 640) set to 360 nm. The
absorbance was inserted into the Beer�s Law equation to obtain a concentration in
moles/L ClO2 as follows:
a=εbc
Where: a = absorbance, nm ε = ClO2 extinction coefficient, 1225 M-1cm-1
b = cuvette path length, cm c = ClO2 concentration, moles/L
Jar Test Procedure
All samples generated in this study were obtained from bench-scale jar tests
performed at the Blacksburg, Christiansburg, VPI Water Authority�s Water Treatment
Plant (WTP) in Radford, Virginia. The jar test procedure was an adaptation of a protocol
developed specifically for the Authority in a memorandum from Dr. George Budd,
Andrea Hargette, and Paul Hargette of Black & Veatch Corporation and dated June 9,
1999. The jar test procedures mimic, as best possible, the full-scale plant conditions and
are summarized in Table 3-1 below:
Table 3-1: Jar Test Conditions at the Blacksburg, Christiansburg, VPI WTP
Process Step Mixing Speed (rpm) Duration (min)
Raw Water Travel Time 10 15
Rapid Mix 100 2
Flocculation � Stage 1 20 16
Flocculation � Stage 2 10 16
Flocculation � Stage 3 5 3
Sedimentation 0 8
The travel-time step was not part of the jar test procedure developed by Black & Veatch,
but it was added to the protocol to simulate raw-water travel time from the New River
intake to the WTP. This was an important addition to the protocol because future
treatment modifications at the WTP included pretreatment of raw water with ClO2. The
19
ClO2 contact time in the transmission main to the WTP was estimated to be
approximately 15 minutes.
Initially, only three samples were treated during the jar tests, but eventually, four
additional jars were included in the protocol. Coagulant was added to all jars prior to
rapid mix. The coagulant was polyaluminum chloride (DelPAC 2500, Delta Chemical
Company; Baltimore, MD), which was the same coagulant being used at the WTP. The
applied dosages were the same as that being added at the WTP on the day jar testing was
performed. Samples that were prechlorinated were treated with chlorine along with the
coagulant immediately before rapid mixing began. Samples that were post chlorinated
were treated with chlorine after stage 2 flocculation. A description of the treatments
applied to each of the samples is show in Table 3-2.
Table 3-2: Treatments Applied During Jar Tests
Jar Number
Jar Treatment Description of Jar Treatment Process
Jar 1 Predisinfection with Chlorine �
Simulated Current WTP Conditions Jar 1
2.0 mg/L chlorine added with coagulant prior to rapid mix; no post chlorination
Jar 2 Post chlorination � Simulated
Delayed Chlorination No predisinfection; 2.0 mg/L post chlorination
Jar 3 Preoxidation with ClO2 2.0 mg/L ClO2 pretreatment; 2.0 mg/L post
chlorination
Jar 4 Preoxidation with ClO2 1.0 mg/L ClO2 pretreatment; 2.0 mg/L post
chlorination
Jar 5 Preoxidation with ClO2 0.5 mg/L ClO2 pretreatment; 2.0 mg/L post
chlorination
Jar 6 Blank 0.5-1.0 mg/L ClO2 pretreatment of Nanopure� water; 2.0 mg/L post chlorination
Jar 7 No disinfection No pre- or post treatment with either ClO2 or
chlorine
With the exception of Jar 6 (Blank), water used in the jar tests was taken from the intake
pipe immediately before the start of the test. The water in Jar 6 was Nanopure�. All jars
20
containing ClO2 were covered in aluminum foil to minimize the photolytic
decomposition of the oxidant. Water temperatures were recorded prior to the start of the
testing, and the pH of each treated sample was measured at the conclusion of the testing.
Total chlorine residuals in water samples treated with chlorine but not ClO2 were
determined according to Section 4500-Cl D in Standard Methods for the Examination of
Water and Wastewater (1998). The titration was performed at the treatment plant with a
Wallace & Tiernan A-790 titrator (Vineland, NJ). Samples that had been treated with
ClO2 during the jar tests were analyzed for residual chlorine, ClO2 and chlorite ion
(ClO2-) with a Bailey-Fischer & Porter amperometric titrator according to Method 4500-
E ClO2 in Standard Methods for the Examination of Water and Wastewater (1998). After
the titrations were completed, samples for additional analyses were collected from each
jar. The sampling protocol is described later.
Additional raw water characteristics; including turbidity, alkalinity, pH,
temperature, and hardness; were recorded from the operator logbook at the WTP. These
measurements were the most recent ones obtained by the plant�s operators.
Chlorite Ion and Chlorate Ion Analyses
Samples to be analyzed for ClO2- and chlorate ion (ClO3
-) analysis were collected
directly from the jars and purged with nitrogen gas for 10 minutes to remove any residual
ClO2. Aliquots of the purged sample were placed in amber, 40-mL glass vials with
Teflon-lined screw caps, and preserved by addition of ethylenediamine solution at a
concentration of 50 mg/L. The sampling and analysis procedures were those prescribed
in USEPA Method 300.1 (USEPA 2000). Samples were stored at 4°C for up to 14 days
before being analyzed.
Chlorite ion and ClO3- concentrations in the preserved samples were determined
with a Dionex 300 ion chromatograph equipped with a conductivity detector and AS40
Automated Sampler. The columns used for ion separation included a Dionex AG9-HC, 4
mm anion guard column and a Dionex AS9-HC, 4 mm anion separator column. The
anion suppressor, which was also purchased from Dionex, was an ASRS-I, 4 mm device.

21
TOC Analyses
Samples for total organic carbon (TOC) analysis were collected from the jars and
placed in amber, 40-mL glass vials with Teflon-lined screw caps. They were preserved
by addition of phosphoric acid to pH 2 and refrigerated at 4°C until analyzed. Prior to
analysis, the samples were purged with oxygen to remove carbon dioxide. The analyses
were performed within 30 days of collection with a Sievers (Boulder, CO) Portable TOC
Analyzer 800 with an autosampler.
Haloacetic Acid and Trihalomethane Simulated Distribution System Potential
Analyses
After chlorine analyses were completed, settled water samples were collected
from each of the jars and placed in either a 500 mL or 1000 mL volumetric flask.
Chlorine was then added to the flask to increase the concentration to a specific level. For
example, if the settled water chlorine concentration was 1.5 mg/L, as determined by
amperometric titration, 2.5 mg/L of chlorine would be needed to increase the
concentration to 4.0 mg/L. Ultimately, the goal was to ensure that the chlorine residual
after three days storage would be between 1.5 mg/L and 2.0 mg/L. Samples were also
buffered to pH 7 by addition of a 1M phosphate buffer so that the pH would remain
constant during the three-day incubation period. The buffer was prepared by adding 68.1
g KH2PO4 and 11.7 g NaOH to reagent-grade water and diluting to a 500 mL volume.
One mL of buffer was added to 1-L samples, and 0.5 mL was added to 500 mL samples.
The sample solution was then brought up to volume by addition of the settled water.
After the addition of phosphate buffer and chlorine, the sample water was added
to either 60-mL clear-glass vials wrapped in aluminum foil with Teflon-lined screw caps
for HAA analysis or 40-mL amber glass vials with Teflon-lined screw caps for THM
analysis. Other aliquots of the samples were placed in120-mL plastic containers for
chlorine residual analysis at the end of the incubation period. Vials containing the
samples to be analyzed for THM analysis were airtight and headspace-free. Samples
were returned to the Virginia Tech Environmental Engineering Laboratory and stored in
the dark for three days at ambient (21-24°C) temperature.
22
After three days, residual chlorine concentrations in the 120-mL samples were
determined by amperometric titration according to section 4500-Cl D. of Standard
Methods (1998) with a Fischer Scientific CL Titrimeter 397.
Samples containing chlorine at levels between 1.5 mg/L and 2.0 mg/L or as close
as possible to this range were selected for analysis, dechlorinated according to their
specific EPA method (552.2 for HAA samples and 502.2 for THM samples), and
refrigerated at 4°C until the analyses could be performed.
Total Trihalomethane Analysis Procedure
Total THM analyses were performed according to USEPA Method 502.2
(USEPA 1995). The method offers several capillary column choices, and Column 3,
which is a J&W Scientific DB-624 (30 m long x 0.53 mm ID, 3 µm film thickness), was
chosen. The analytical instrument was a Tremetrics (Austin, TX) 9001 gas
chromatograph (GC) with a Tracer (Austin, TX) 1000 Hall detector, Tekmar (Cincinnati,
OH) 3000 Purge and Trap Concentrator, and Tekmar 2016 Purge and Trap autosampler.
The trap purchased for the research was a Supelco (Bellefonte, PA) VOCARB 300 Purge
Trap K.
Because this method does not recommend a GC temperature program for elution
of THMs through a DB-624 column, one was established through experimentation. The
temperature program that gave the best results was an initial temperature of 45°C held for
3 minutes, ramped to 200°C at 11°C/min, and then stopped at 200°C.
Haloacetic Acid Analysis Procedure
The HAA analyses were performed according the EPA Method 552.2 (USEPA
1995) with a Hewlett Packard 5890 GC equipped with an electron capture detector and
Hewlett Packard autosampler. The capillary column was a Supelco SPB-1701 column
(30 m long x 0.25 mm ID, 0.25 µm film thickness).
Statistical Calculations
Statistical analyses were conducted using the NCSS 97 software package (Hintze
1997). The Kruskal-Wallis nonparameteric analysis of variance test was used to

23
determine if the medians of the various data sets were statistically different. If they were
statistically different, a Kruskal-Wallis multiple comparison test was performed to
elucidate the differences. An alpha value (σ) of 0.05 was selected for all the analyses.

24
CHAPTER 4.
RESULTS
Effects of Chlorine Dioxide on Trihalomethane Formation
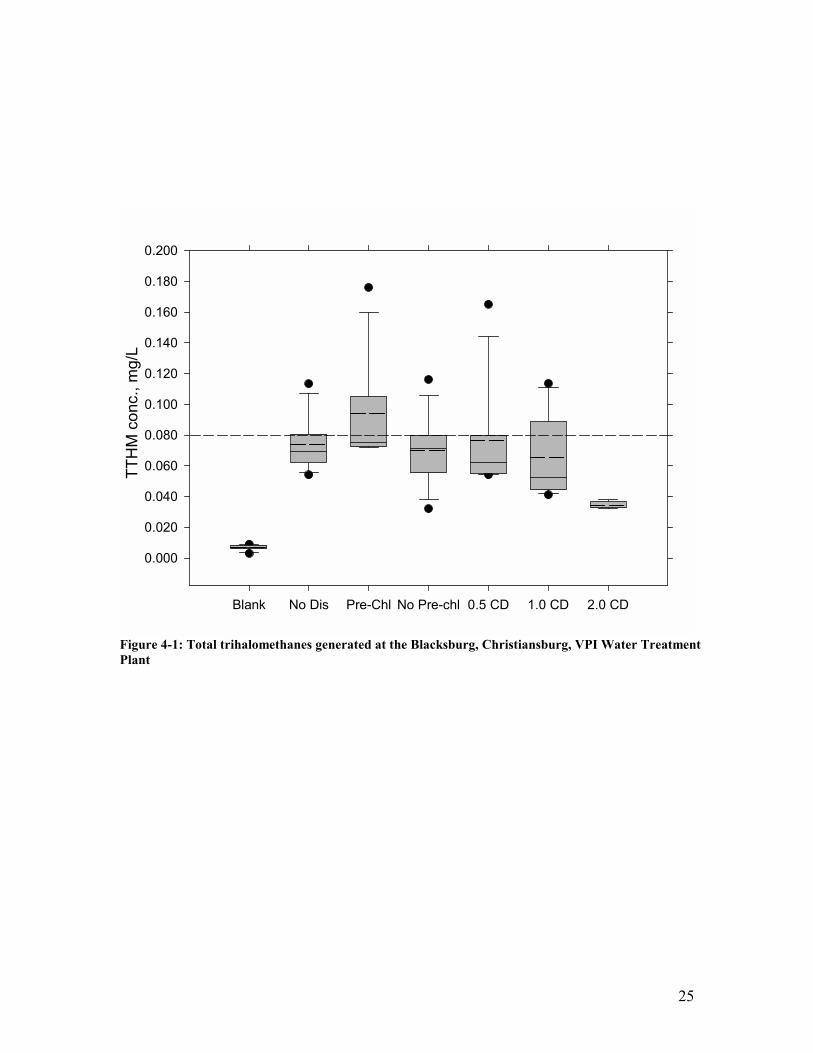
Figure 4-1 is a box plot showing total trihalomethane (TTHM) concentrations
formed during jar testing and the subsequent holding period. The solid line within each
box is the median value, the dashed line is the mean, and the upper and lower boundaries
are the 10th and 90th percentile values. The error bars above and below the boxes
represent the 5th and 95th percentiles, while solid circles indicate outliers. Treatment that
water in each jar received is abbreviated on the x-axis, and Table 4-1 provides
descriptions of each abbreviation. The dashed line on Figure 4-1 corresponds to the
maximum contaminant level (MCL) for TTHMs of 0.080 mg/L.
Kruskal-Wallis multiple comparison z-value tests showed that the THM levels
that developed in water pretreated with 2.0 mg/L ClO2 (2.0 CD) and in the blank were
significantly lower than THMs that developed in waters that were (1) pretreated with
chlorine (Pre-chl), (2) treated with neither oxidant, either pre- or post treatment (No Dis),
and (3) treated by post chlorination only (No Pre-chl). Furthermore, THM concentrations
that developed in water pretreated with 2.0 mg/L ClO2 were significantly lower when
compared to those in water pretreated with 0.5 mg/L ClO2 (0.5 CD) but not with 1.0
mg/L (1.0 CD). Finally, THM levels that developed in water pretreated with 2.0 mg/L
ClO2 were not significantly greater than those that formed in the blank, even though they
appear to be greater from examination of Figure 4-1.
An additional Kruskal-Wallis multiple comparison z-value test was performed on
the ClO2 samples to determine whether ClO2 dose affected the final TTHM levels.
Trihalomethanes that developed in water pretreated with ClO2 were compared to those
that developed in water when chlorination was delayed until after flocculation (No Pre-
chl). No prechlorination was considered the zero dose when the statistical test was
performed. It was selected as the basis of the comparison because the treatment those
samples received was most similar to treatment the samples treated with ClO2 received
(i.e., no prechlorination but with post chlorination). In this case, the median THM level
in samples pretreated with 2.0 mg/L ClO2 was statistically different from the median
25
Blank No Dis Pre-Chl No Pre-chl 0.5 CD 1.0 CD 2.0 CD
TT
HM
co
nc.
, mg/
L
0.000
0.020
0.040
0.060
0.080
0.100
0.120
0.140
0.160
0.180
0.200
Figure 4-1: Total trihalomethanes generated at the Blacksburg, Christiansburg, VPI Water Treatment Plant
26
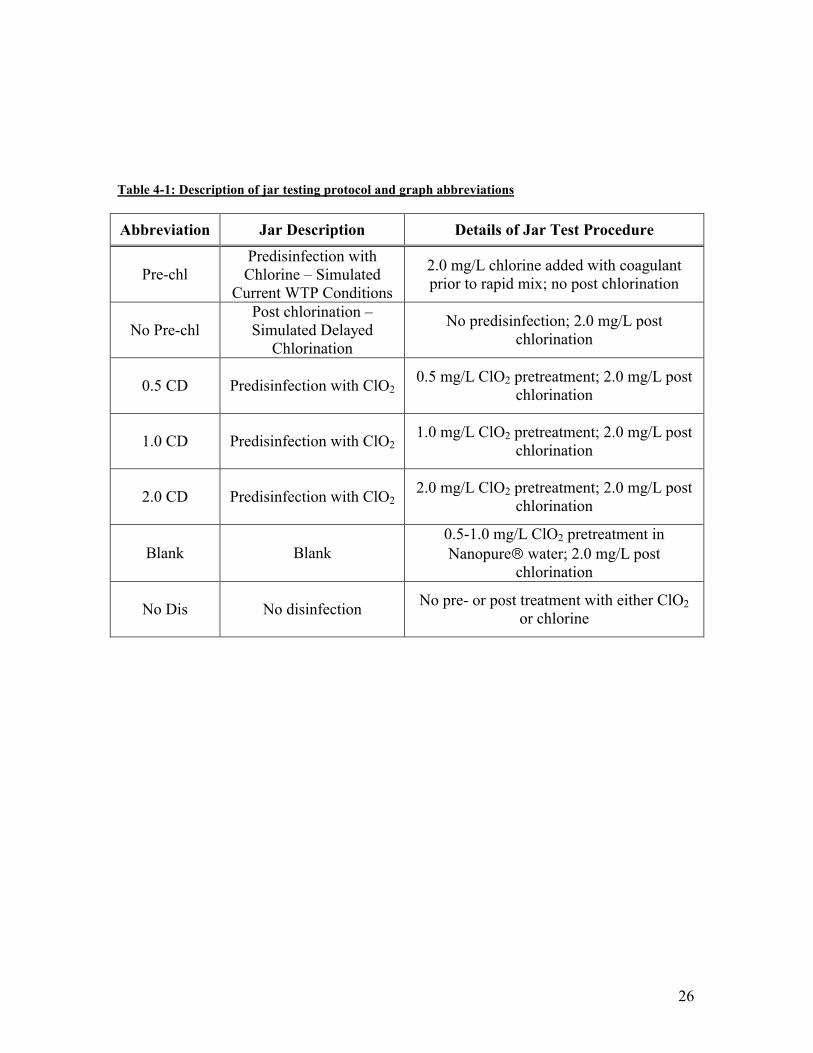
Table 4-1: Description of jar testing protocol and graph abbreviations
Abbreviation Jar Description Details of Jar Test Procedure
Pre-chl Predisinfection with Chlorine � Simulated
Current WTP Conditions
2.0 mg/L chlorine added with coagulant prior to rapid mix; no post chlorination
No Pre-chl Post chlorination � Simulated Delayed
Chlorination
No predisinfection; 2.0 mg/L post chlorination
0.5 CD Predisinfection with ClO2 0.5 mg/L ClO2 pretreatment; 2.0 mg/L post
chlorination
1.0 CD Predisinfection with ClO2 1.0 mg/L ClO2 pretreatment; 2.0 mg/L post
chlorination
2.0 CD Predisinfection with ClO2 2.0 mg/L ClO2 pretreatment; 2.0 mg/L post
chlorination
Blank Blank 0.5-1.0 mg/L ClO2 pretreatment in Nanopure� water; 2.0 mg/L post
chlorination
No Dis No disinfection No pre- or post treatment with either ClO2
or chlorine

27
THM level in samples pretreated with both 0.5 mg/L ClO2 and1.0 mg/L ClO2, and in
those that were not prechlorinated. No other differences were apparent from the
statistical analyses.
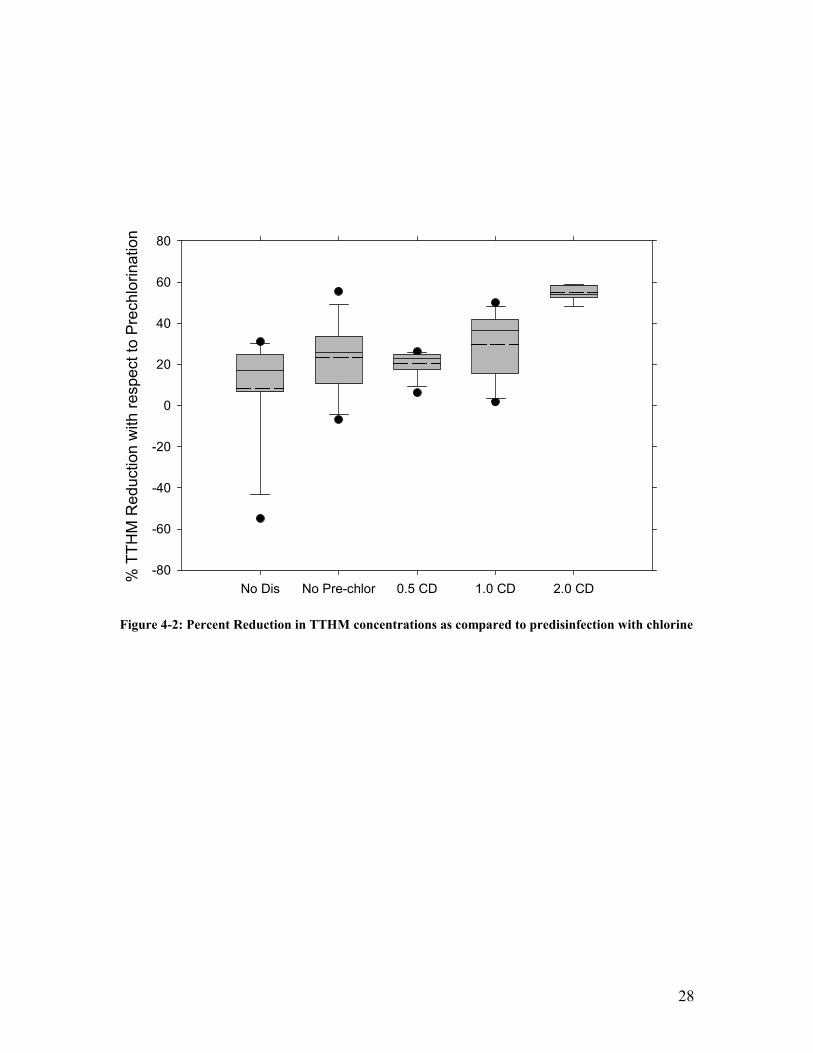
Figure 4-2 is a plot of the percent reductions in the TTHMs concentrations that
developed in five samples treated by the various treatment scenarios relative to the
TTHM concentrations in samples that were prechlorinated as part of the jar-test
procedure. A positive value indicates that the TTHM concentration in a sample treated
by a protocol that did not include prechlorination was less than the TTHM concentration
in a prechlorinated sample treated on the same day. As can be seen in Figure 4-2, TTHM
concentrations in samples not treated with either chlorine or ClO2 (No Dis) were highly
variable and at times, no differences between that treatment and prechlorination were
evident. When samples were not prechlorinated, the percent reduction in TTHMs relative
to the prechlorinated-sample TTHMs ranged from no reduction to 55 percent. The
TTHMs in samples treated with 0.5 mg/L ClO2 were from 6 to 26 percent lower than
those in the pretreated samples. Similarly, TTHMs in samples treated with 1.0 mg/L and
2.0 mg/L ClO2 were from 1 to 50 percent and 47 to 59 percent less, respectively, than in
the prechlorinated sample.
Figure 4-3 is a plot of only the fall and winter TTHM concentrations. When only
the fall and winter TTHM concentrations are plotted, the data seem to indicate a trend of
lower TTHMs with an increased ClO2 dose. However, Kruskal-Wallis multiple
comparison z-value tests performed on the data showed that none of the ClO2 treatments
were statistically different from one another. The median TTHM concentrations in water
pretreated with 0.5 mg/L ClO2 and in water that was not prechlorinated were the only
samples that differed statistically from those in the blank. The median TTHM
concentration in water pretreated with 1.0 mg/L ClO2 was statistically different from the
median TTHM concentration in the prechlorinated sample. Finally, the median TTHM
concentrations in water pretreated with 2.0 mg/L ClO2 differed statistically from the
median TTHM value in samples that were not prechlorinated and those to which no
oxidant was added during the jar tests.
28
No Dis No Pre-chlor 0.5 CD 1.0 CD 2.0 CD
% T
TH
M R
ed
uct
ion
with
re
spe
ct t
o P
rech
lorin
atio
n
-80
-60
-40
-20
0
20
40
60
80
Figure 4-2: Percent Reduction in TTHM concentrations as compared to predisinfection with chlorine

29
Blank No Dis Pre-Chl No Pre-chl 0.5 CD 1.0 CD 2.0 CD
TT
HM
co
nc.
, mg
/L
0.000
0.020
0.040
0.060
0.080
0.100
0.120
0.140
0.160
Figure 4-3: Fall and winter (October-March) TTHM concentrations
30
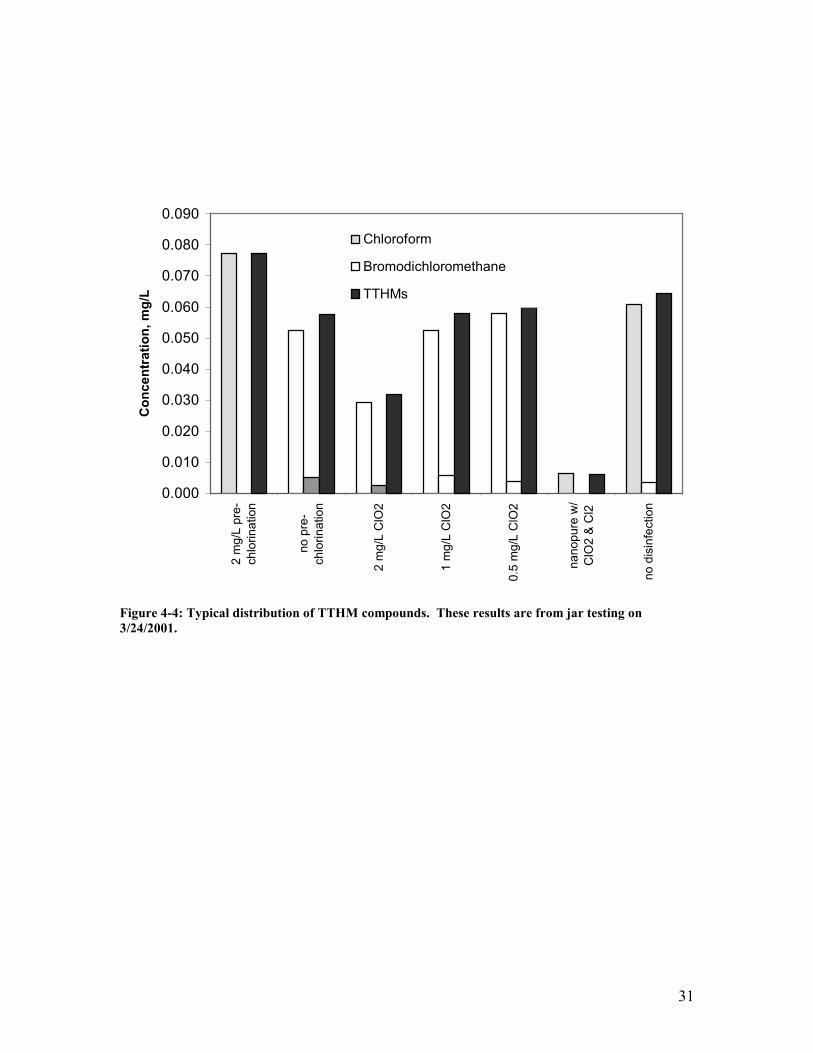
Figure 4-4 shows the relative amounts of chloroform and bromodichloromethane
comprising the TTHM concentration on March 24, 2001. The results are typical of data
obtained on other dates. Bromoform and chlorodibromomethane were not detected in
samples collected on this date, and in all others samples, they were insignificant
compared to the other THM species. The relative amounts of chloroform and
bromodichloromethane in each sample did not seem to be related in any way to the
various treatments applied during the jar tests.
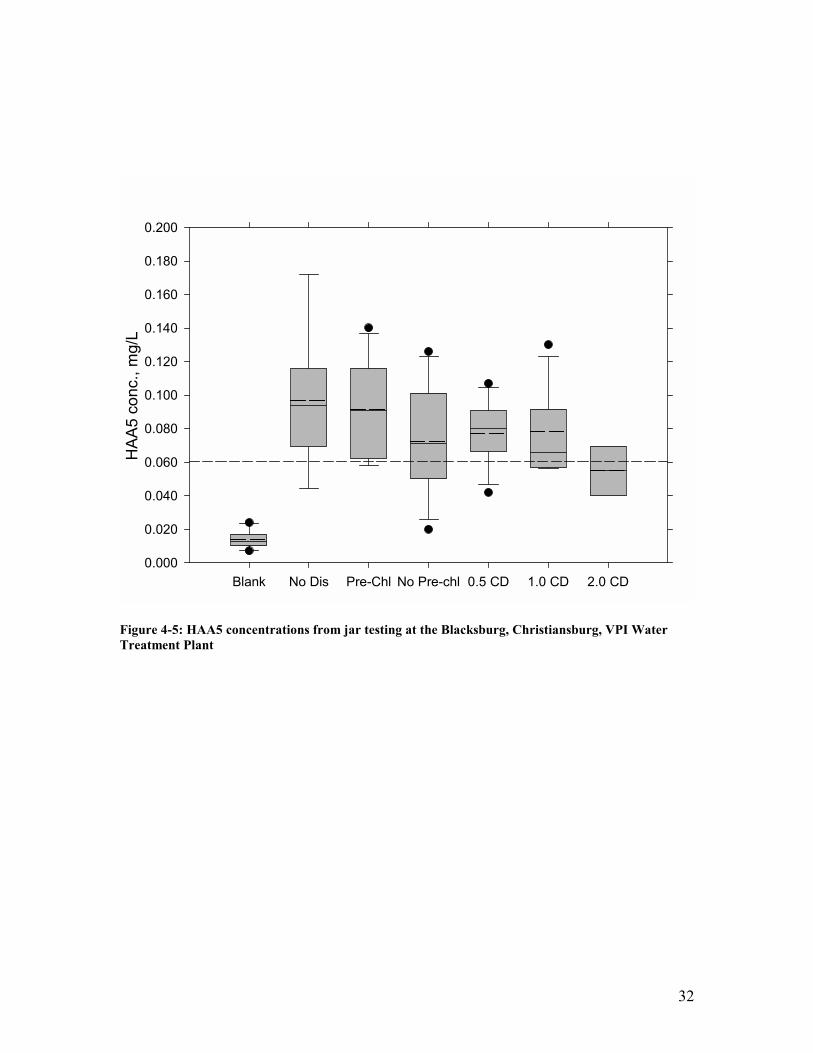
Effects of Chlorine Dioxide on Haloacetic Acid Formation
Figure 4-5 is a box plot showing the concentrations of the five haloacetic acids
(HAAs) (mono-, di-, and trichloroacetic acids and mono- and dibromoacetic acids) in
samples treated according to the same protocols as previously presented. The dashed line
indicates the MCL for HAA5, which is 0.060 mg/L. As can be seen, the results were
much more variable than the TTHM results in Figure 4-1, and none of the treatments
reduced the median HAA5 to levels below the MCL. Kruskal-Wallis multiple
comparison z-value tests showed that the only significantly different medians were
between the blank and all the other sample treatments except the 2.0 mg/L ClO2
pretreatment.
A Kruskal-Wallis multiple comparison z-value test was also performed to
examine the dependence of ClO2 dose on HAA5 formation. No prechlorination was
considered to be the zero dose when the statistical test was performed because of its
similarity in treatment processes. As was true in the analysis of the THM data, the
median of samples that were not pretreated with chlorine was selected as the basis of the
comparison because the treatment those samples received was most similar to treatment
the samples treated with ClO2 received (i.e., no prechlorination but with post
chlorination). The analysis found that all medians were statistically equal, and therefore,
there were no significant differences between any of the HAA5 concentrations regardless
of the treatment the samples received.
31
0.000
0.010
0.020
0.030
0.040
0.050
0.060
0.070
0.080
0.090
2 m
g/L
pre-
chlo
rinatio
n
no p
re-
chlo
rinatio
n
2 m
g/L
ClO
2
1 m
g/L
ClO
2
0.5
mg/L
ClO
2
nanopure
w/
ClO
2 &
Cl2
no d
isin
fect
ion
Co
nc
en
tra
tio
n,
mg
/L
Chloroform
Bromodichloromethane
TTHMs
Figure 4-4: Typical distribution of TTHM compounds. These results are from jar testing on 3/24/2001.
32
Blank No Dis Pre-Chl No Pre-chl 0.5 CD 1.0 CD 2.0 CD
HA
A5
con
c., m
g/L
0.000
0.020
0.040
0.060
0.080
0.100
0.120
0.140
0.160
0.180
0.200
Figure 4-5: HAA5 concentrations from jar testing at the Blacksburg, Christiansburg, VPI Water Treatment Plant
33
Figure 4-6 is a plot of the percent reductions in HAA5 concentration that
developed in the five samples that were treated by the various treatment scenarios relative
to the HAA concentrations in samples that were prechlorinated as part of the jar-test
procedure. When neither chlorine nor ClO2 was added, the reductions relative to the
prechlorinated sample ranged from zero to 24 percent. When samples were not
prechlorinated, the percent reduction in HAA5 concentrations relative to the
prechlorinated-sample HAA5 levels ranged from zero to 22 percent (with the exception
of the 73 percent outlier). The HAA5 concentrations in samples treated with 0.5 mg/L
ClO2, 1.0 mg/L ClO2, and 2.0 mg/L ClO2 were from zero to 34 percent, zero to 35
percent, and 9 to 42 percent less, respectively, than in the prechlorinated sample.
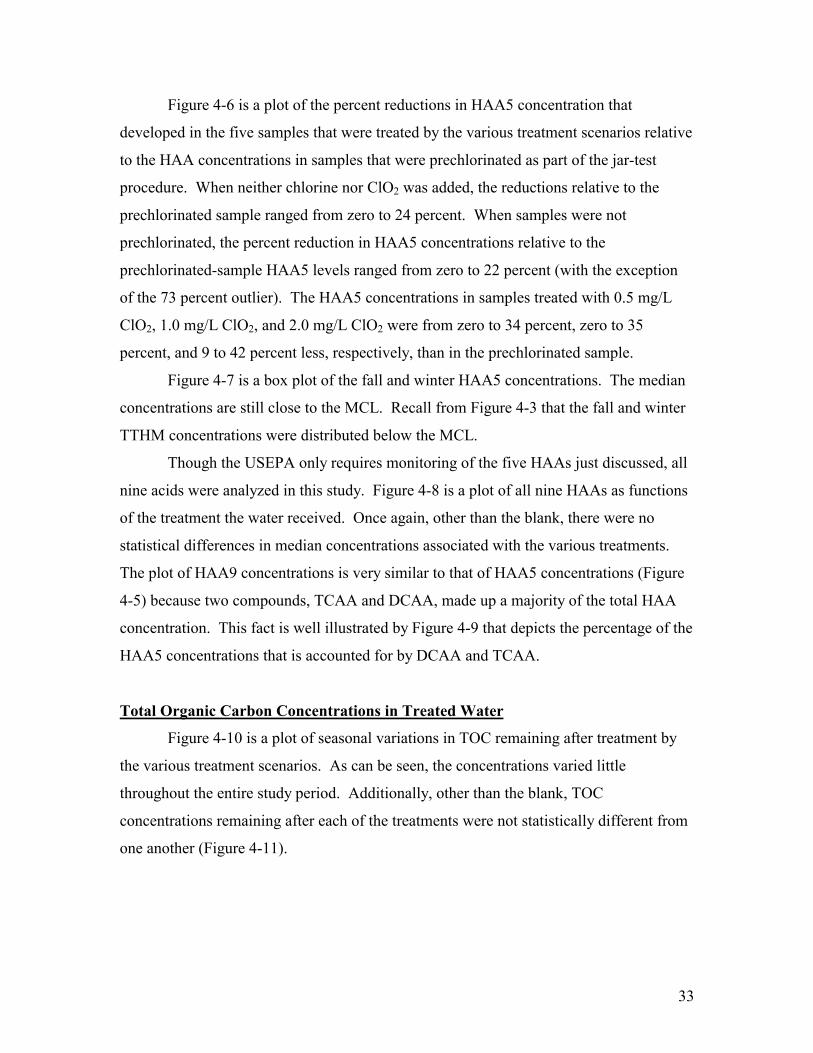
Figure 4-7 is a box plot of the fall and winter HAA5 concentrations. The median
concentrations are still close to the MCL. Recall from Figure 4-3 that the fall and winter
TTHM concentrations were distributed below the MCL.
Though the USEPA only requires monitoring of the five HAAs just discussed, all
nine acids were analyzed in this study. Figure 4-8 is a plot of all nine HAAs as functions
of the treatment the water received. Once again, other than the blank, there were no
statistical differences in median concentrations associated with the various treatments.
The plot of HAA9 concentrations is very similar to that of HAA5 concentrations (Figure
4-5) because two compounds, TCAA and DCAA, made up a majority of the total HAA
concentration. This fact is well illustrated by Figure 4-9 that depicts the percentage of the
HAA5 concentrations that is accounted for by DCAA and TCAA.
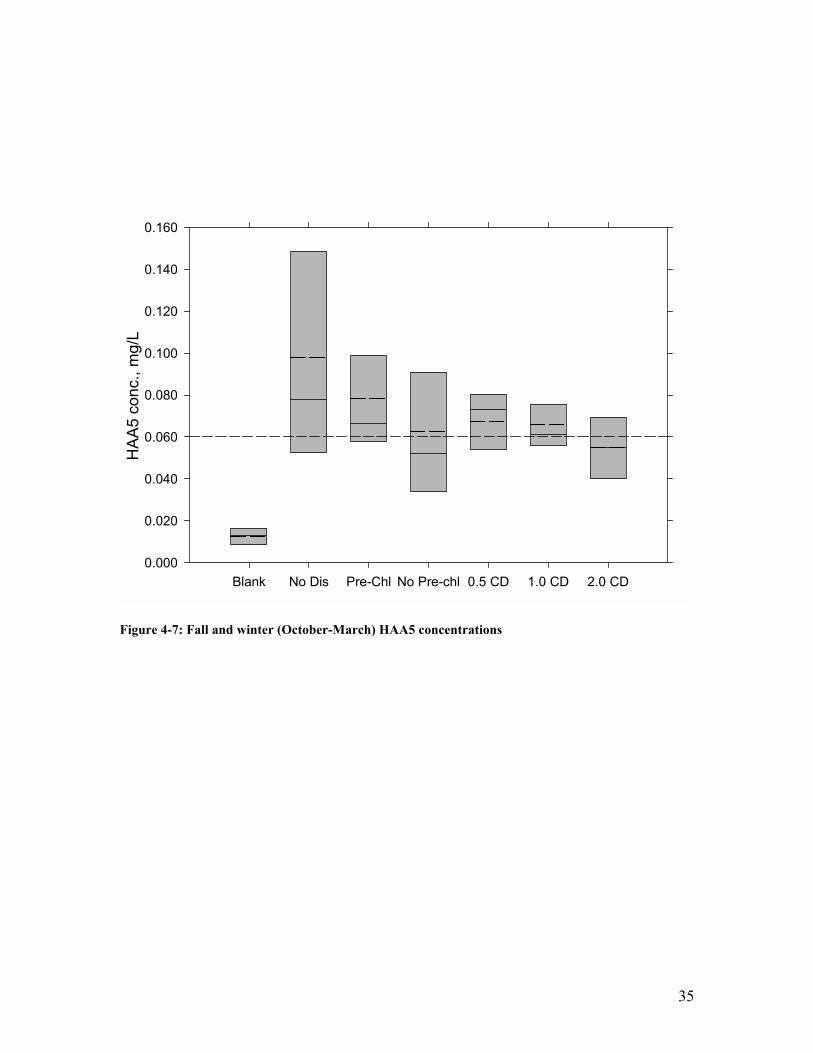
Total Organic Carbon Concentrations in Treated Water
Figure 4-10 is a plot of seasonal variations in TOC remaining after treatment by
the various treatment scenarios. As can be seen, the concentrations varied little
throughout the entire study period. Additionally, other than the blank, TOC
concentrations remaining after each of the treatments were not statistically different from
one another (Figure 4-11).

34
No Dis No Pre-chlor 0.5 CD 1.0 CD 2.0 CD
% H
AA
5 R
ed
uct
ion
with
re
spe
ct to
Pre
chlo
rina
tion
-60
-40
-20
0
20
40
60
80
Figure 4-6: Percent reduction in HAA5 concentration as compared to predisinfection with chlorine
35
Blank No Dis Pre-Chl No Pre-chl 0.5 CD 1.0 CD 2.0 CD
HA
A5
con
c., m
g/L
0.000
0.020
0.040
0.060
0.080
0.100
0.120
0.140
0.160
Figure 4-7: Fall and winter (October-March) HAA5 concentrations

36
Blank No Dis Pre-Chl No Pre-chl 0.5 CD 1.0 CD 2.0 CD
HA
A9
co
nc.
, mg
/L
0.00
0.05
0.10
0.15
0.20
0.25
Figure 4-8: HAA9 Concentrations

37
Blank No Dis Pre-Chl No Pre-chl 0.5 CD 1.0 CD 2.0 CD
Pe
rce
nt o
f To
tal t
hat
is D
CA
A
0
10
20
30
40
50
60
70
Blank No Dis Pre-Chl No Pre-chl 0.5 CD 1.0 CD 2.0 CD
Per
cen
t of T
ota
l th
at i
s T
CA
A
0
10
20
30
40
50
60
70
Figure 4-9: Percentage of total HAA5 comprised of DCAA and TCAA (percentages refer to actual concentrations shown in Figure 4-5).

38
9/1/00 10/1/00 11/1/00 12/1/00 1/1/01 2/1/01 3/1/01 4/1/01
TO
C c
onc.
, mg
/L
0.0
0.2
0.4
0.6
0.8
1.0
1.2
1.4
1.6
1.8
2.0
BlankNo Disinfection2 mg/L Pre-chlNo pre-chlorination0.5 mg/L ClO2
1.0 mg/L ClO2
2.0 mg/L ClO2
Figure 4-10: Seasonal variations in TOC measured in each jar at the conclusion of jar testing
39
Blank No Dis Pre-Chl No pre-chl 0.5 CD 1.0 CD 2.0 CD
TO
C c
onc.
, mg/
L
0.0
0.2
0.4
0.6
0.8
1.0
1.2
1.4
1.6
1.8
2.0
2.2
Figure 4-11: Concentration of TOC measured in each jar at conclusion of jar testing

40
Chlorite and Chlorate Results
Figure 4-12a shows the concentrations of ClO2- and ClO3
- measured in each jar at
the conclusion of jar testing. As expected, no ClO2- was formed in the absence of ClO2
and the ClO2- concentration increased with increasing amounts of added ClO2.
Concentrations of ClO2- in samples treated with 0.5 mg/L ClO2 ranged from 0.22 to 0.25
mg/L. Concentrations in samples treated with 1.0 mg/L ClO2 were between 0.33 and
0.50 mg/L ClO2-, while those in samples treated with 2.0 mg/L ClO2 ranged from 0.49 to
0.67 mg/L.
Figure 4-12b is a box plot of ClO3-. Chlorate formation is one of the byproducts
of ClO2 treatment and, as expected, it was present in samples at increasing concentrations
as the ClO2 dose increased. Unexpectedly, ClO3- also was found in samples that had not
been treated with ClO2.

41
Blank No Dis Pre-Chl No Pre-chl 0.5 CD 1.0 CD 2.0 CD
Ch
lori
te c
on
c.,
mg
/L
0.0
0.1
0.2
0.3
0.4
0.5
0.6
0.7
0.8
0.9
1.0
1.1
Chlorite MCL
Plot 1
Blank No Dis Pre-Chl No Pre-chl 0.5 CD 1.0 CD 2.0 CD
Ch
lora
te c
onc.
, m
g/L
0.0
0.1
0.2
0.3
0.4
0.5
0.6
0.7
0.8
0.9
1.0
Figures 4-12a (Chlorite) and 4-12b (Chlorate): Chlorite and chlorate concentrations measured at the conclusion of jar testing

42
CHAPTER 5.
DISCUSSION
An important factor influencing DBP formation is the type of water treatment
process the source water is subjected to and the type of oxidant that is used. Various
studies, including those undertaken by Stolarik and Liu (2000), Lykins and Griese
(1986), Li et al. (1996), and Hulsey et al. (2000), have shown that ClO2 will not form
THMs or HAAs. Therefore, the expectation during this project was that samples of New
River water that were treated with ClO2 would produce fewer THMs and HAAs than
samples that were prechlorinated and not treated with ClO2. The expectations were not
entirely met for THMs and were never met for HAA5. Statistical differences in TTHMs
in prechlorinated samples and those treated with ClO2 were not evident until the ClO2
dose was increased to 2.0 mg/L. Griese (1991) and Hulsey et al. (2000) found that
increased doses of ClO2 lead to increasing reductions in THM formation. Hulsey et al.
(2000) recorded THM reductions with ClO2 doses as low as 0.2 mg/L. Griese (1991) saw
approximately 60 percent reduction in THM concentrations when 1.0-1.5 mg/L of ClO2
was applied as compared to prechlorinated samples. During this project, the three-day
THM formation potentials after 2.0 mg/L ClO2 treatment were from 47 percent and 59
percent lower than in samples prechlorinated instead of being dosed with ClO2 (Figure 4-
2). While no statistical differences were found between THMs in samples treated with
0.5 mg/L and 1.0 mg/L ClO2, it should not be assumed that treatment at these dosages
provided no benefits. Statistically significant differences may have become apparent had
more jar tests been conducted.
This study also examined differences in THM and HAA formation in samples
treated with ClO2 and those in which chlorination was delayed until after flocculation and
those to which neither chlorine nor ClO2 was added during treatment. The addition of no
oxidant is not a viable water-treatment alternative, but it was considered as a basis of
comparison to HAAs and THMs that formed following the other treatments. As before,
the only treatment that produced statistically different results was the 2.0 mg/L ClO2
pretreatment (Figure 4-1). Because the THM concentrations were lower after treatment
43
with 2.0 mg/L ClO2 than they were in water treated with no preoxidant this indicates that
ClO2 effectively oxidized organic material, leaving less in the water to react with chlorine
when it was added later.
Unfortunately, ClO2 pretreatment failed to reduce HAAs to levels that were
statistically different than those produced by any of the other treatments except the blank,
which was coagulated, flocculated and settled Nanopure� water to which 0.5 mg/L to 1.0
mg/L ClO2 had been added as a preoxidant and 2.0 mg/L chlorine had been added as a
post disinfectant (Figure 4-5). Increasing the ClO2 dose incrementally from 0.5 mg/L to
1.0 mg/L to 2.0 mg/L did not reduce HAA concentrations to statistically different levels.
In fact, the only statistically significant differences were those between HAAs that
formed following the different treatments and those in the blank. Overall, the effects of
ClO2 on HAA5 results were inconclusive. In contrast, previous studies of ClO2 impacts
on HAA formation by others (Hulsey et al. 2000, Stolarik and Liu 2000, and Griese
1991) showed reductions in HAA concentrations following ClO2 application to the water.
Though, Griese (1991) only saw reductions when he increased the ClO2 dose to 3 mg/L.
Many WTP operators are reluctant to use high doses of ClO2 because of ClO2-
production (chlorate is seldom, if ever, an issue). Chlorite ion concentrations in samples
treated with ClO2 were lower than expected, and none approached the 1.0 mg/L MCL
(Figure 4-12a). The ranges of ClO2- concentrations in water following treatment with 0.5
mg/L, 1.0 mg/L, and 2.0 mg/L were, respectively, 0.22 to 0.25 mg/L, 0.33 to 0.50 mg/L,
and 0.49 to 0.67 mg/L, all of which are lower than or equal to the expected levels of from
50 percent to 70 percent of the ClO2 dose (USEPA 1999). While the presence of ClO2-
and ClO3- in samples treated with ClO2 was expected, the appearance of ClO3
- in other
samples was not expected (Figure 4-12b). Chlorate ion can also form by reactions
between ClO2- and chlorine and, therefore, that reaction may account for a fraction of the
ClO3- in ClO2-treated samples. Chlorate concentrations did increase with increasing
additions of ClO2, but it was found also in samples that had not been treated with ClO2.
Gordon (Personal communication, July 20, 2001) attributed the unexpected
appearance of ClO3- in samples that were not treated with ClO2 (Figure 4-12b) to
contamination of the stock chlorine solution that was used during this study and said that
44
it was a consequence of the preparation method. Apparently, chlorinating a 0.067 M
NaOH solution until the pH is reduced to pH 7.0 assures development of ClO3-.
45
CHAPTER 6.
SUMMARY AND CONCLUSIONS
Summary
• The 3-day THM formation potentials in water pretreated with 2.0 mg/L ClO2
were from 47 percent to 59 percent lower than those in water pretreated with
chlorine (Figure 4-2). Lower ClO2 dosages were statistically insignificant.
• The 3-day HAA5 formation potentials were not significantly reduced by ClO2
pretreatment at any level (Figure 4-5).
• Chlorite concentrations in all samples were below the MCL of 1.0 mg/L (Figure
4-12a).
• Chlorate formed in all samples (Figure 4-12b), but some ClO3-, including that
found in samples not treated with ClO2, was present possibly as a result of the
chlorine solution used in the jar tests.
Prompted by HAA and THM concentrations near the current MCLs, the
Blacksburg, Christiansburg, VPI (BCVPI) WTP approved this project to evaluate the use
of ClO2 as an alternative preoxidant to chlorine. In many cases, ClO2 is a viable
alternative because unlike chlorine, it does not react with NOM to form DBPs (Aieta and
Berg 1986). Therefore, the BCVPI Water Authority�s hope was that replacing chlorine
with ClO2 as a preoxidant would aid in meeting the upcoming HAA5 MCL.
Chlorine dioxide preoxidation would be a good alternative to prechlorination for
THM control at the WTP but only at doses higher than 1.0 mg/L. Statistically significant
reductions in the 3-day THM formation potential did not occur until 2.0 mg/L ClO2 was
applied. At 2.0 mg/L ClO2, neither the current MCL of 0.080 mg/L nor the anticipated
Stage 2 D/DBP Rule MCL of 0.040 mg/L was exceeded. The three-day THM formation
potentials of all prechlorinated samples, however, exceeded 0.040 mg/L (Table 6-1),
which is the anticipated Stage 2 D/DBP Rule MCL.
Neither the Stage 1 nor the anticipated Stage 2 HAA5 MCLs were achieved by
ClO2 pretreatment during this study and, in fact, provided no apparent advantage over the
current treatment practice (prechlorination) at the BCVPI Water Authority�s WTP (Table
46
6-1). While ClO2 pretreatment has been found to be beneficial in other locations, its
future benefits for HAA control at the BCVPI WTP is in doubt. Even at the Stage 1
MCL, HAA5 concentrations were out of compliance 50 percent of the time when jars
were treated with 2.0 mg/L ClO2. Further jar testing would be beneficial to determine if
increasing the ClO2 above 3 mg/L, as was done by Griese (1991), would provide better
results. Of course, at higher doses, ClO2- formation may present a problem, but there is
some leeway as the samples from jar testing in this study never exceeded ClO2-
concentrations of 0.67 mg/L. One additional concern when using increased ClO2 doses is
that the WTP must monitor ClO2 concentrations leaving the plant, and the concentration
cannot exceed the MRDL of 0.8 mg/L.
Conclusions
Preoxidation with ClO2 reduced THM concentrations when the ClO2 dose
approached 2 mg/L. It produced fewer THMs than the BCVPI Water Authority�s current
practice of prechlorination. However, the ClO2 doses did not alter HAA5 concentrations
in such a way that statistical differences could be detected between ClO2 pretreatment
and prechlorination. Preoxidation with ClO2 may provide other benefits, such as
improved coagulation and manganese oxidation, though these effects were not
investigated during this study. Finally, ClO2- formation is not a concern when from 0.5
mg/L to 2.0 mg/L ClO2 is added to the New River source water.

47
Tab
le 6
-1:
Su
mm
ary
of t
he
nu
mb
er o
f ti
mes
eac
h t
reat
men
t op
tion
was
bel
ow t
he
curr
ent
and
pro
pos
ed M
CL
s
N
um
ber
of
Tim
es D
BP
Co
nce
ntr
atio
n w
as B
elo
w E
PA
MC
Ls
MC
L
No
Dis
infe
ctio
n1P
rech
lorin
atio
n2N
o P
rech
lorin
atio
n30
.5 m
g/L
ClO
241
.0 m
g/L
ClO
242
.0 m
g/L
ClO
24
0.0
80
mg/
L T
TH
M
5/7
5
/8
6/8
6
/8
6/8
5
/5
0.0
60
mg/
L H
AA
5
1/5
2
/7
3/7
1
/7
3/7
2
/4
0.0
40
mg/
L T
TH
M
0/7
0
/8
1/8
0
/8
0/8
5
/5
0.0
30
mg/
L H
AA
5
0/5
0
/7
1/7
0
/7
0/7
0
/4
1: N
o p
re-
or p
ost
oxid
ant
add
ed
2: P
rech
lori
nat
ion
wit
h 2
mg/
L c
hlo
rin
e; n
o p
ost
chlo
rin
atio
n
3: P
ost
chlo
rin
atio
n o
nly
4: P
reox
idat
ion
wit
h C
lO2;
pos
t ch
lori
nat
ion

48
REFERENCES
Aieta, E.M., and J.D. Berg. 1986. A Review of Chlorine Dioxide in Drinking Water Treatment. Jour. AWWA, 78:6:62.
American Public Health Association, American Water Works Association, Water Environment
Federation (joint publishers). 1998. Standard Methods for the Examination of Water and Wastewater, 20th edition.
Arora, Harish, M.W. LeChevallier, and K.L. Dixon. 1997. DBP Occurrence Survey. Jour.
AWWA, 89:6:60. AWWA. 1982. Treatment Techniques for Controlling Trihalomethanes in Drinking Water.
Denver, CO: AWWA. Bedulivich, T.S., M.N. Svetlakova, and N.N. Trakhtman. 1954. Use of Chlorine Dioxide in
Purification of Water. Chemical Abstracts, 48:2953. Bercz, J.P. et al. 1982. Subchronic Toxicity of Chlorine Dioxide and Related Compounds in
Drinking Water in the Non-Human Primate. Envir. Health Perspectives, 45:47.
Brett, R.W. and R.A. Calverley. 1979. A One-year Survey of Trihalomethane Concentration Changes within a Distribution System. Jour. AWWA, 71:9:515.
Chang, Chen-Yu, Y.H. Hsieh, I.C. Shih, S.S. Hsu, and K.H. Wang. 2000. The Formation and
Control of Disinfection By-Products using Chlorine Dioxide. Chemosphere, 41:1181. Chem Service, Inc. 2000. Haloacetic Acids Mixture #3 � 552.2 Kit List. West Chester, PA. Chen, W.J. and C.P. Weisel. 1998. Halogenated DBP Concentrations in a Distribution System.
Jour. AWWA, 90:4:151. Condie, Lyman. 1986. Toxicological Problems Associated with Chlorine Dioxide. Jour.
AWWA, 78:6:73. Cronier, S., et al. 1978. Water Chlorination Environmental Impact and Health Effects, Vol. 2
(R. L. Jolley, et al., editors). Ann Arbor, MI: Ann Arbor Science Publishers, Inc. Croue, J-P. 1987. Contribution à l�Ètude de l�Oxydation par le Chlore et l�Ozone d�Acides
Fulviques Naturels Extraits d�Eaux de Surface. Doctorat de l�Universitè de Poitiers, France.

49
Croue, J-P, J-F Debroux, G.L. Amy, G.R. Aiken, and J.A. Leenheer. 1999. Natural Organic Matter: Structural Characteristics and Reactive Properties. Formation and Control of Disinfection By-Products in Drinking Water (P.C. Singer, editor). Denver, CO: AWWA.
Dietrich, A.M., M.P. Orr, D.L. Gallagher, and R.C. Hoehn. 1992. Tastes and Odors Associated
with Chlorine Dioxide. Jour. AWWA, 92:6:82. Dojlido, Jan, E. Zbiec, and R. Swietlik. 1999. Formation of the Haloacetic Acids During
Ozonation and Chlorination of Water in Warsaw Waterworks (Poland). Wat. Res., 33:14:3111.
Ellenberger, C.S., R.C. Hoehn, D.L. Gallagher, W.R. Knocke, E.V. Wiseman, R.W. Benninger,
and A. Rosenblatt. 1998. �Water Quality Impacts of Pure Chlorine Dioxide Pretreatment at the Roanoke County (Virginia) Water Treatment Plant.� Conference Proceedings, AWWA Annual Conference, Dallas, TX.
Federal Register. 1979. National Interim Primary Drinking Water Regulations: Control of
Trihalomethanes in Drinking Water Final Rule. 40 CFR Parts 141 and 142, Vol. 44, No. 231, 68624-6870, Nov. 29, 1974.
Federal Register. 1998. National Primary Drinking Water Regulations: Disinfectants and
Disinfection Byproducts; Final Rule. 40 CFR Parts 9, 141 and 142, Vol. 63, No. 241: 69389-69476, December 16, 1998.
Federal Register. 2000. Removal of the Maximum Contaminant Level Goal for Chloroform
From the National Primary Drinking Water Regulations. Vol. 65, No. 104. www.epa.gov/safewater/regs/chlorfr.html.
Gallagher, D.L., R.C. Hoehn, and A.M. Dietrich. 1994. Sources, Occurrence, and Control of
Chlorine Dioxide By-Product Residuals in Drinking Water. AWWA Research Foundation, Denver, CO: AWWA.
Gates, D. 1998. The Chlorine Dioxide Handbook. (B. Cobban, P. Murray, and A. Livingston,
editors). Denver, CO: AWWA. Gordon, Gilbert, R.G. Kieffer, and D.H. Rosenblatt. 1972. The Chemistry of Chlorine Dioxide.
Progress in Inorganic Chemistry, Vol. 15. New York, NY: Wiley-Interscience Publishers.
Gordon, Gilbert. 2001. Is All Chlorine Dioxide Created Equal? Jour. AWWA, 93:4:163. Gordon, Gilbert. July 20, 2001. Personal Communication. Miami University, Oxford, Ohio. Griese, Mark. 1991. �Pilot Plant Optimization of the Chlorine Dioxide Treatment Process for
Disinfection By-Product Reduction.� Conference Proceedings, AWWA Annual Conference, Philadelphia, PA.
50
Hintze, J. 1997. NCSS: Statistical System for Windows Users Guide. Kaysville, UT. Hoehn, R.C., A.M. Dietrich, W.S. Farmer, M.P. Orr, R.G. Lee, E.M. Aieta, D.W. Wood, and G.
Gordon. 1990. Household Odors Associated with the Use of Chlorine Dioxide. Jour. AWWA, 81:4:166.
Hofmann, R., R.C. Andrews, and Q. Ye. 1997. �Chlorite Formation When Disinfecting
Drinking Water to Giardia Inactivation Requirements Using Chlorine Dioxide.� Conference Proceedings, ASCE/CSCE Conference, Edmonton, Alberta.
Hulsey, R.A., J.J. Neemann, S.N. Foellmi, and R.C. Hoehn. 2000. �Chlorine Dioxide for DBP
Control and Filter Enhancement.� Conference Proceedings, AWWA Water Quality Technology Conference, Salt Lake City, Utah.
Knocke, W.R., J.E. Van Benschoten, M. Kearney, A. Soborski, and D.A. Reckhow. 1990.
Alternative Oxidants for the Removal of Soluble Iron and Manganese. AWWA Research Foundation, Denver, CO: AWWA.
Korich, D.G., J.R. Mead, M.S. Madore, N.A. Sinclair, and C.R. Sterling. 1990. Effects of
ozone, chlorine dioxide, chlorine and monochloramine on Cryptosporidium parvum oocyst viablility. Appl. Environ. Microbiol., 56:5:1423.
Letterman, Raymond, ed. 1999. Water Quality and Treatment: A Handbook of Community
Water Supplies. New York, NY: McGraw-Hill, Inc. Li, Jun Wen, Z. Yu, X. Cai, M. Gao, and F. Chao. 1996. Trihalomethanes Formation in Water
Treated with Chlorine Dioxide. Wat. Res., 30:10:2371. Lorenzo-Lorenzo, M.J., M.E. Ares-Mazas, I. Villacorta-Martinez de Maturana, and D. Duran-
Oreiro. 1993. Effect of Ultraviolet Disinfection of Drinking Water on the Viability of Cryptosporidium parvum Oocysts. J. Parasitol., 79:1:67.
Lykins, B.W. Jr. and M.H. Griese. 1986. Using Chlorine Dioxide for Trihalomethane Control.
Jour. AWWA, 78:6:88. Lykins, B.W. Jr., J.A. Goodrich, W.E. Koffskey, and M.H Griese. 1991. �Controlling
Disinfection By-Products with Alternative Disinfectants.� Conference Proceedings, AWWA Annual Conference, Denver, CO.
Masschelein, W.J. 1979. Chlorine Dioxide: Chemistry and Environmental Impact of
Oxychlorine Compounds. Ann Arbor, MI: Ann Arbor Science Publishers, Inc. Oliver, B.G. and E.M. Thurman. 1983. Influence of Aquatic Humic Substance Properties on
Trihalomethane Potential. Water Chlorination: Environmental Impact and Health Effects, Vol. 4. Ann Arbor, MI: Ann Arbor Publishers, Inc.

51
Pomes, M.L., W.R. Green, E.M. Thurman, W.H. Orem, and H.E. Lerch. 1999. DBP Formation
Potential of Aquatic Humic Substances. Jour. AWWA, 91:3:103. Ransome, M.E., T.N. Whitmore, and E.G. Carrington. 1993. Effect of Disinfectants on the
Viability of Cryptosporidium parvum Oocysts. Water Supply, 11:75. Rav-Acha, C. 1984. The Reactions of Chlorine Dioxide with Aquatic Organic Materials and
their Health Effects. Water Res., 18:11:1329. Reckhow, D.A., P.C. Singer, and R.L. Malcolm. 1990. Chlorination of Humic Materials:
Byproduct Formation and Chemical Interpretations. Environ. Sci. & Tech., 24:1655. Richardson, S.D. 1998. Identification of Drinking Water Disinfection By-Products. Encyclopedia
of Environmental Analysis and Remediation, Vol. 3 (R.A. Meyers, editor). New York: John Wiley & Sons.
Ridenour, G.M., and R.S. Ingols. 1946. Inactivation of Poliomyelitis Virus by Free Chlorine.
American Public Health, 36:639. Ridenour, G.M., R.S. Ingols, and E.H. Armbruster. 1949. Sporicidal Properties of Chlorine
Dioxide. Water & Sewage Works, 96:8:279. Rittmann, Douglas D. 1997. �Can you Have Your Cake and Eat It Too� with Chlorine Dioxide?
WATER/Engineering & Management 144:4:30. Rosenblatt, D.H. 1978. Ozone and Chlorine Dioxide Oxidation Products of Organic Materials
(R.G. Rice and J.A. Cotruvo, editors). Cleveland, OH: Ozone Press. Scarpino, P.V. et al. 1979. Effect of Particulates on Disinfection of Enteroviruses and Coliform
Bacteria in Water by Chlorine Dioxide. EPA-600/2-79-054. USEPA, Washington, D.C. Smith, J.E., and J.L. McVey. 1973. �Virus Inactivation by Chlorine Dioxide and Its Application
to Storm Water Overflow.� Conference Proceedings, ACS annual meeting, 13:2:177. Stolarik, Gary and Paul Liu. 2000. �Chlorine Dioxide for Algae and DBP Control: The Los
Angeles Experience.� Conference Proceedings, AWWA Water Quality Technology Conference, Salt Lake City, UT.
Trakhtman, N.N. 1949. Chlorine Dioxide in Water Disinfection. Chemical Abstracts, 43:1508. United States Environmental Protection Agency (USEPA). 1995. Methods for the
Determination of Organic Compounds in Drinking Water, Supplement III. EPA 600-R-95-131, PB 95-261616.

52
United States Environmental Protection Agency (USEPA). 1997. Community Water System Survey � Volumes I and II: Overview. EPA 815-R-97-001a, -001b.
United States Environmental Protection Agency (USEPA). 1999. Alternative Disinfectants and
Oxidants Guidance Manual. EPA 815-R-99-014, Office of Water (4607). United States Environmental Protection Agency (USEPA). 2000. Methods for the
Determination of Organic and Inorganic Compounds in Drinking Water, Volume I. EPA 815-R-00-014, PB 2000-106981.
White, G.C. 1972. Handbook of Chlorination. New York, NY: Van Nostrand Reinhold Co. White, George C. 1999. Handbook of Chlorination and Alternative Disinfectants, 4th edition.
New York, NY: John Wiley & Sons. Williams, S.L., R.L. Williams, and James Yuan. 2000. Enzymatic Degradation of Various
DBPs in Drinking Water. Virginia Section Newsletter � AWWA (April).
53
APPENDIX A
Trihalomethane Results from Jar Testing

54
Tab
le A
-1:
TT
HM
Res
ult
s fr
om A
ugu
st 1
0, 2
000
Co
nce
ntr
atio
n,
mg
/L
Jar
Nu
mb
er
Des
crip
tio
n
Ch
loro
form
Bro
mo
dic
hlo
rom
eth
ane
Ch
loro
dib
rom
om
eth
ane
Bro
mo
form
TT
HM
S
Jar
1
2.0
mg/L
pre
-chlo
rinatio
n0
.17
0
0.0
06
0
.00
0
0.0
00
0
.17
6Ja
r 2
no p
re-c
hlo
rinatio
n
0.1
08
0
.00
7
0.0
00
0
.00
0
0.1
16
Jar
3
1 m
g/L
ClO
2
0.0
99
0
.00
6
0.0
00
0
.00
0
0.1
05
Jar
4
0.5
mg/L
ClO
2
0.1
60
0
.00
5
0.0
00
0
.00
0
0.1
65
Ra
w W
ate
r R
aw
Wate
r
0.2
28
0
.01
0
0.0
00
0
.00
0
0.2
38

55
Tab
le A
-2:
TT
HM
Res
ult
s fr
om S
epte
mb
er 1
2, 2
000
Co
nc
en
tra
tio
n,
mg
/L
Jar
Nu
mb
er
Des
crip
tio
n
Ch
loro
form
Bro
mo
dic
hlo
rom
eth
ane
Ch
loro
dib
rom
om
eth
ane
Bro
mo
form
TT
HM
S
Jar
1*-
0.0
5
2 m
g/L
pre
-chlo
rinatio
n0
.07
8
0.0
12
0
.00
8
0.0
08
0
.09
8Ja
r 1
2 m
g/L
pre
-chlo
rinatio
n0
.06
7
0.0
06
0
.00
0
0.0
00
0
.07
3Ja
r 2
no p
re-c
hlo
rinatio
n
0.0
64
0
.00
8
0.0
01
0
.00
0
0.0
73
Jar
2 (
d)
no p
re-c
hlo
rinatio
n
0.0
60
0
.00
6
0.0
00
0
.00
0
0.0
66
Jar
3
1 m
g/L
ClO
2
0.0
63
0
.00
9
0.0
01
0
.00
0
0.0
72
Jar
4
0.5
mg/L
ClO
2
0.0
53
0
.00
9
0.0
00
0
.00
0
0.0
62
Jar
5
nanopure
w/ C
lO2 &
Cl 2
0.0
08
0
.00
0
0.0
00
0
.00
0
0.0
09
Jar
6
no d
isin
fect
ion
0.1
05
0
.00
6
0.0
02
0
.00
0
0.1
13
* =
sa
mp
le +
0.0
5 m
g/L
Sta
nd
ard
(d
) =
du
plic
ate
sa
mp
le c
olle
cte
d in
diff
ere
nt
via
l

56
Tab
le A
-3:
TT
HM
Res
ult
s fr
om S
epte
mb
er 2
1, 2
000
Co
nc
en
tra
tio
n,
mg
/L
Jar
Nu
mb
er
Des
crip
tio
n
Ch
loro
form
Bro
mo
dic
hlo
rom
eth
ane
Ch
loro
dib
rom
om
eth
ane
Bro
mo
form
TT
HM
S
Jar
1*-
0.0
5
2 m
g/L
pre
-chlo
rinatio
n
0.0
92
0
.01
2
0.0
00
0
.00
2
0.1
03
Jar
1
2 m
g/L
pre
-chlo
rinatio
n
0.1
15
0
.00
6
0.0
00
0
.00
0
0.1
22
Jar
2
no p
re-c
hlo
rinatio
n
0.0
75
0
.00
7
0.0
00
0
.00
0
0.0
82
Jar
2 (
d)
no p
re-c
hlo
rinatio
n
0.0
80
0
.00
9
0.0
00
0
.00
0
0.0
89
Jar
3
1 m
g/L
ClO
2
0.1
06
0
.00
8
0.0
00
0
.00
0
0.1
13
Jar
4
0.5
mg/L
ClO
2
0.0
87
0
.00
8
0.0
00
0
.00
0
0.0
95
Jar
5
nanopure
w/ C
lO2 &
Cl 2
0.0
07
0
.00
0
0.0
00
0
.00
0
0.0
07
Jar
5*-
0.0
5
nanopure
w/ C
lO2 &
Cl 2
0.0
10
0
.00
4
0.0
01
0
.00
5
0.0
14
Jar
6
no d
isin
fect
ion
0.0
80
0
.00
4
0.0
00
0
.00
0
0.0
84
* =
sa
mp
le +
0.0
5 m
g/L
Sta
nd
ard
(d
) =
du
plic
ate
sa
mp
le c
olle
cte
d in
diff
ere
nt
via
l

57
Tab
le A
-4:
TT
HM
Res
ult
s fr
om O
ctob
er 2
4, 2
000
Co
nc
en
tra
tio
n,
mg
/L
Jar
Nu
mb
er
Des
crip
tio
n
Ch
loro
form
Bro
mo
dic
hlo
rom
eth
ane
Ch
loro
dib
rom
om
eth
ane
Bro
mo
form
TT
HM
S
Jar
1
2 m
g/L
pre
-chlo
rinatio
n
0.0
75
0
.00
6
0.0
02
0
.00
3
0.0
88
Jar
1*
2 m
g/L
pre
-chlo
rinatio
n
0.0
69
0
.00
1
0.0
00
0
.00
0
0.0
70
Jar
2
no p
re-c
hlo
rinatio
n
0.0
63
0
.00
6
0.0
01
0
.00
0
0.0
70
Jar
3
2 m
g/L
ClO
2
0.0
31
0
.00
5
0.0
01
0
.00
0
0.0
36
Jar
4
1 m
g/L
ClO
2
0.0
38
0
.00
5
0.0
01
0
.00
0
0.0
44
Jar
4 d
. 1 m
g/L
ClO
2
0.0
38
0
.00
6
0.0
01
0
.00
0
0.0
45
Jar
5
0.5
mg/L
ClO
2
0.0
57
0
.00
7
0.0
00
0
.00
0
0.0
65
Jar
6
nanopure
w/ C
lO2 &
Cl 2
0
.00
6
0.0
00
0
.00
0
0.0
00
0
.00
6Ja
r 7
no d
isin
fect
ion
0.0
63
0
.00
7
0.0
00
0
.00
0
0.0
70
* =
sa
mp
le +
0.0
5 m
g/L
Sta
nd
ard
d =
du
plic
ate
co
llect
ed
in s
ep
ara
te v
ial

58
Tab
le A
-5:
TT
HM
Res
ult
s fr
om N
ovem
ber
9, 2
000
Co
nce
ntr
atio
n, m
g/L
Jar
Nu
mb
er
Des
crip
tio
n
Ch
loro
form
B
rom
od
ich
loro
met
han
eC
hlo
rod
ibro
mo
met
han
eB
rom
ofo
rm
TT
HM
S
Jar
1
2 m
g/L
pre
-chlo
rinatio
n
0.0
67
0
.00
6
0.0
00
0
.00
0
0.0
73
Jar
1*
2 m
g/L
pre
-chlo
rinatio
n
0.0
68
0
.00
7
0.0
00
0
.00
0
0.0
75
Jar
2
no p
re-c
hlo
rinatio
n
0.0
71
0
.00
7
0.0
00
0
.00
0
0.0
78
Jar
3
2 m
g/L
ClO
2
0.0
34
0
.00
5
0.0
00
0
.00
0
0.0
38
Jar
4
1 m
g/L
ClO
2
0.0
40
0
.00
6
0.0
00
0
.00
0
0.0
45
Jar
4 d
. 1 m
g/L
ClO
2
0.0
41
0
.00
6
0.0
00
0
.00
0
0.0
47
Jar
5
0.5
mg/L
ClO
2
0.0
49
0
.00
6
0.0
00
0
.00
0
0.0
55
Ja
r 6
nanopure
w/ C
lO2 &
Cl 2
0
.00
3
0.0
00
0
.00
0
0.0
00
0
.00
3
Jar
7
no d
isin
fect
ion
0.0
48
0
.00
6
0.0
00
0
.00
0
0.0
54
*
= s
am
ple
+ 0
.05 m
g/L
Sta
ndard
(alr
eady
subtr
act
ed o
ut)
d
= d
uplic
ate
colle
cted in
separa
te v
ial
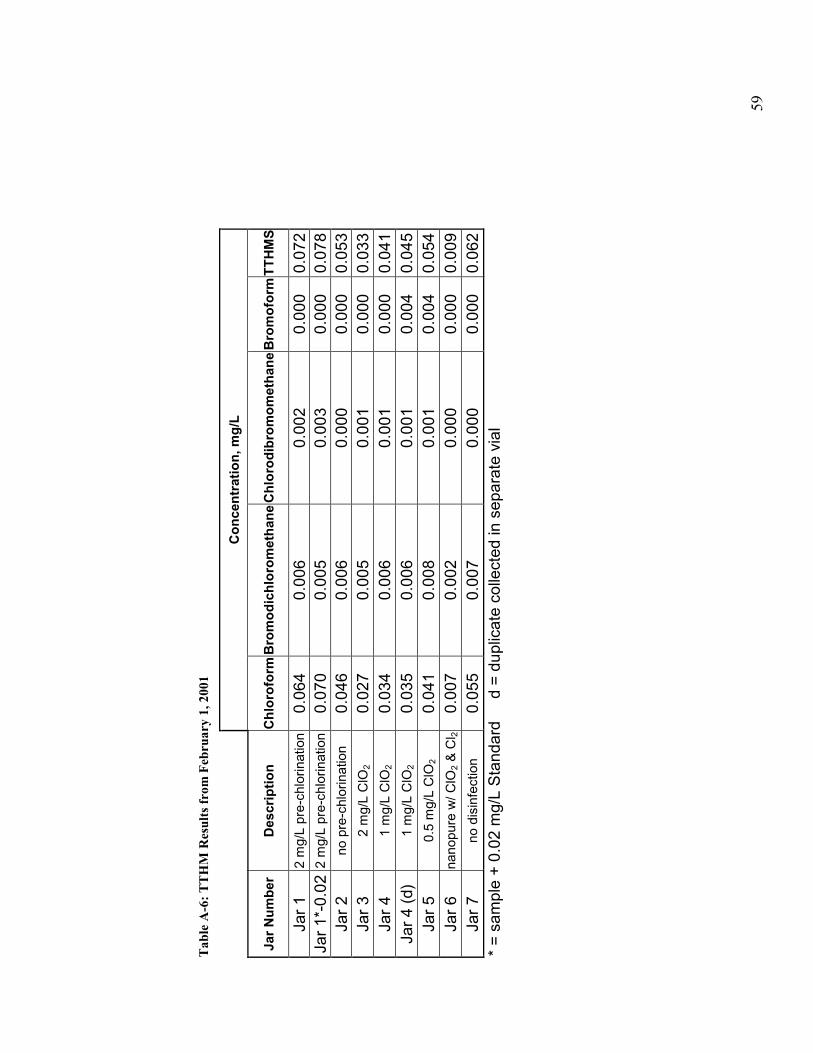
59
Tab
le A
-6:
TT
HM
Res
ult
s fr
om F
ebru
ary
1, 2
001
Co
nce
ntr
atio
n, m
g/L
Jar
Nu
mb
er
Des
crip
tio
n
Ch
loro
form
Bro
mo
dic
hlo
rom
eth
ane
Ch
loro
dib
rom
om
eth
ane
Bro
mo
form
TT
HM
S
Jar
1
2 m
g/L
pre
-chlo
rinatio
n
0.0
64
0
.00
6
0.0
02
0
.00
0
0.0
72
Jar
1*-
0.0
2 2
mg/L
pre
-chlo
rinatio
n
0.0
70
0
.00
5
0.0
03
0
.00
0
0.0
78
Jar
2
no p
re-c
hlo
rinatio
n
0.0
46
0
.00
6
0.0
00
0
.00
0
0.0
53
Jar
3
2 m
g/L
ClO
2
0.0
27
0
.00
5
0.0
01
0
.00
0
0.0
33
Jar
4
1 m
g/L
ClO
2
0.0
34
0
.00
6
0.0
01
0
.00
0
0.0
41
Jar
4 (
d)
1 m
g/L
ClO
2
0.0
35
0
.00
6
0.0
01
0
.00
4
0.0
45
Jar
5
0.5
mg/L
ClO
2
0.0
41
0
.00
8
0.0
01
0
.00
4
0.0
54
Jar
6
nanopure
w/ C
lO2 &
Cl 2
0
.00
7
0.0
02
0
.00
0
0.0
00
0
.00
9Ja
r 7
no d
isin
fect
ion
0.0
55
0
.00
7
0.0
00
0
.00
0
0.0
62
* =
sa
mp
le +
0.0
2 m
g/L
Sta
nd
ard
d =
du
plic
ate
co
llect
ed
in s
ep
ara
te v
ial

60
Tab
le A
-7:
TT
HM
Res
ult
s fr
om F
ebru
ary
6, 2
001
Co
nce
ntr
atio
n, m
g/L
Jar
Nu
mb
er
Des
crip
tio
n
Ch
loro
form
Bro
mo
dic
hlo
rom
eth
ane
Ch
loro
dib
rom
om
eth
ane
Bro
mo
form
TT
HM
S
Jar
1
2 m
g/L
pre
-chlo
rinatio
n
0.0
64
0
.00
7
0.0
00
0
.00
0
0.0
72
Jar
1*-
0.0
2 2
mg/L
pre
-chlo
rinatio
n
0.0
65
0
.00
5
0.0
00
0
.00
1
0.0
71
Jar
2
no p
re-c
hlo
rinatio
n
0.0
27
0
.00
4
0.0
00
0
.00
0
0.0
32
Jar
3
2 m
g/L
ClO
2
0.0
27
0
.00
5
0.0
01
0
.00
0
0.0
33
Jar
4
1 m
g/L
ClO
2
0.0
40
0
.00
6
0.0
01
0
.00
0
0.0
47
Jar
4 (
d)
1 m
g/L
ClO
2
0.0
40
0
.00
7
0.0
01
0
.00
0
0.0
47
Jar
5
0.5
mg/L
ClO
2
0.0
48
0
.00
7
0.0
01
0
.00
0
0.0
55
Jar
6
nanopure
w/ C
lO2 &
Cl 2
0
.00
4
0.0
02
0
.00
0
0.0
00
0
.00
7Ja
r 7
no d
isin
fect
ion
0.0
61
0
.00
7
0.0
01
0
.00
0
0.0
69
* =
sa
mp
le +
0.0
2 m
g/L
Sta
nd
ard
d =
du
plic
ate
co
llect
ed
in s
ep
ara
te v
ial
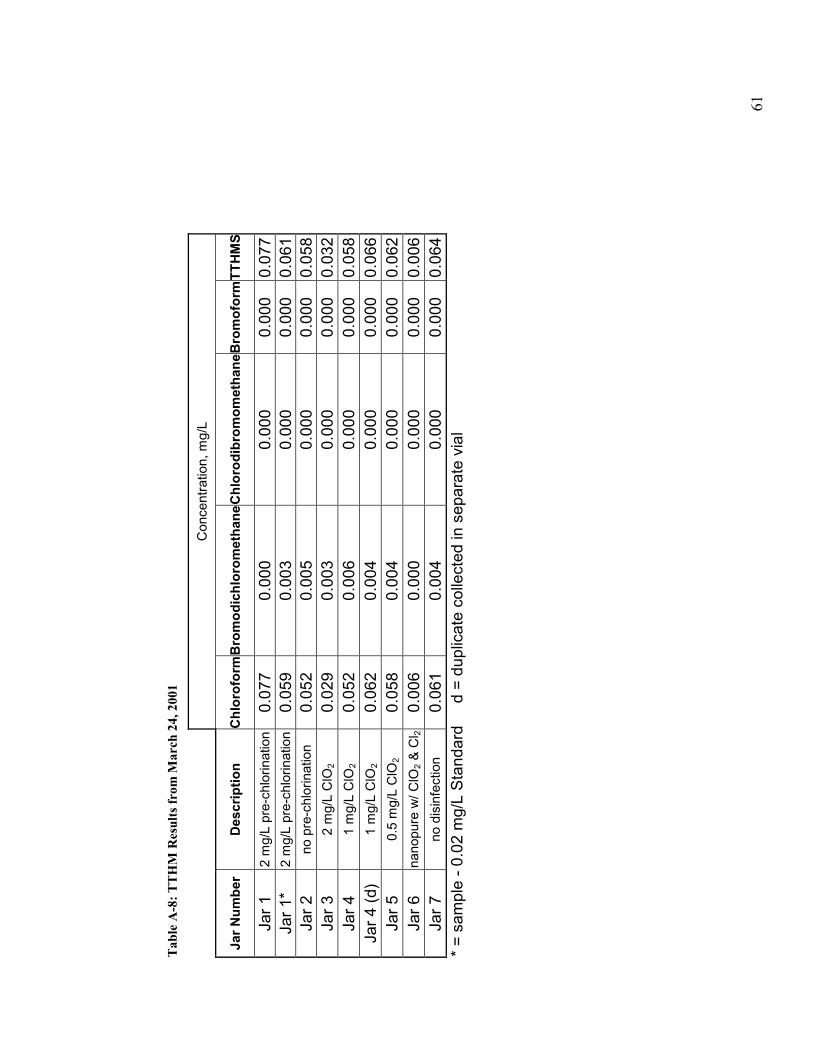
61
Tab
le A
-8:
TT
HM
Res
ult
s fr
om M
arch
24,
200
1
Conce
ntr
atio
n, m
g/L
Jar
Nu
mb
er
Des
crip
tio
n
Ch
loro
form
Bro
mo
dic
hlo
rom
eth
ane
Ch
loro
dib
rom
om
eth
ane
Bro
mo
form
TT
HM
S
Jar
1
2 m
g/L
pre
-chlo
rinatio
n
0.0
77
0
.00
0
0.0
00
0
.00
0
0.0
77
Jar
1*
2 m
g/L
pre
-chlo
rinatio
n
0.0
59
0
.00
3
0.0
00
0
.00
0
0.0
61
Jar
2
no p
re-c
hlo
rinatio
n
0.0
52
0
.00
5
0.0
00
0
.00
0
0.0
58
Jar
3
2 m
g/L
ClO
2
0.0
29
0
.00
3
0.0
00
0
.00
0
0.0
32
Jar
4
1 m
g/L
ClO
2
0.0
52
0
.00
6
0.0
00
0
.00
0
0.0
58
Jar
4 (
d)
1 m
g/L
ClO
2
0.0
62
0
.00
4
0.0
00
0
.00
0
0.0
66
Jar
5
0.5
mg/L
ClO
2
0.0
58
0
.00
4
0.0
00
0
.00
0
0.0
62
Jar
6
nanopure
w/ C
lO2 &
Cl 2
0
.00
6
0.0
00
0
.00
0
0.0
00
0
.00
6Ja
r 7
no d
isin
fect
ion
0.0
61
0
.00
4
0.0
00
0
.00
0
0.0
64
* =
sa
mp
le -
0.0
2 m
g/L
Sta
nd
ard
d =
du
plic
ate
co
llect
ed
in s
ep
ara
te v
ial

62
APPENDIX B
Haloacetic Acid Results from Jar Testing

63
Tab
le B
-1:
HA
A R
esu
lts
from
Au
gust
10,
200
0
Co
nc
en
tra
tio
n,
mg
/L
Ja
r N
um
be
r D
es
cri
pti
on
M
CA
AM
BA
AD
CA
AT
CA
AB
CA
A
BD
CA
AD
BA
AC
DB
AA
TB
AA
HA
A 5
HA
A 9
Jar
1
2.0
mg/L
pre
-chlo
rinatio
n0
.00
8
0.0
05
0
.06
10
.06
70
.00
7
0.0
13
0
.00
00
.00
0
0.0
74
0.1
40
0
.23
3
Jar
2
no p
re-c
hlo
rinatio
n
0.0
06
0
.00
1
0.0
56
0.0
48
0.0
04
0
.00
6
0.0
00
0.0
00
0
.06
30
.11
0
0.1
82
Ja
r 3
1 m
g/L
ClO
2
0.0
05
0
.00
2
0.0
50
0.0
37
0.0
07
0
.00
6
0.0
00
0.0
00
0
.04
10
.09
4
0.1
47
Ja
r 4
0.5
mg/L
ClO
2
0.0
05
0
.00
1
0.0
57
0.0
44
0.0
07
0
.00
5
0.0
00
0.0
00
0
.05
20
.10
7
0.1
71
R
aw
wa
ter*
R
aw
Wate
r
0.0
05
0
.00
0
0.0
73
0.0
72
0.0
03
0
.00
7
0.0
00
0.0
00
0
.03
00
.15
0
0.1
89
*n
o c
oa
gula
nt
ad
de
d
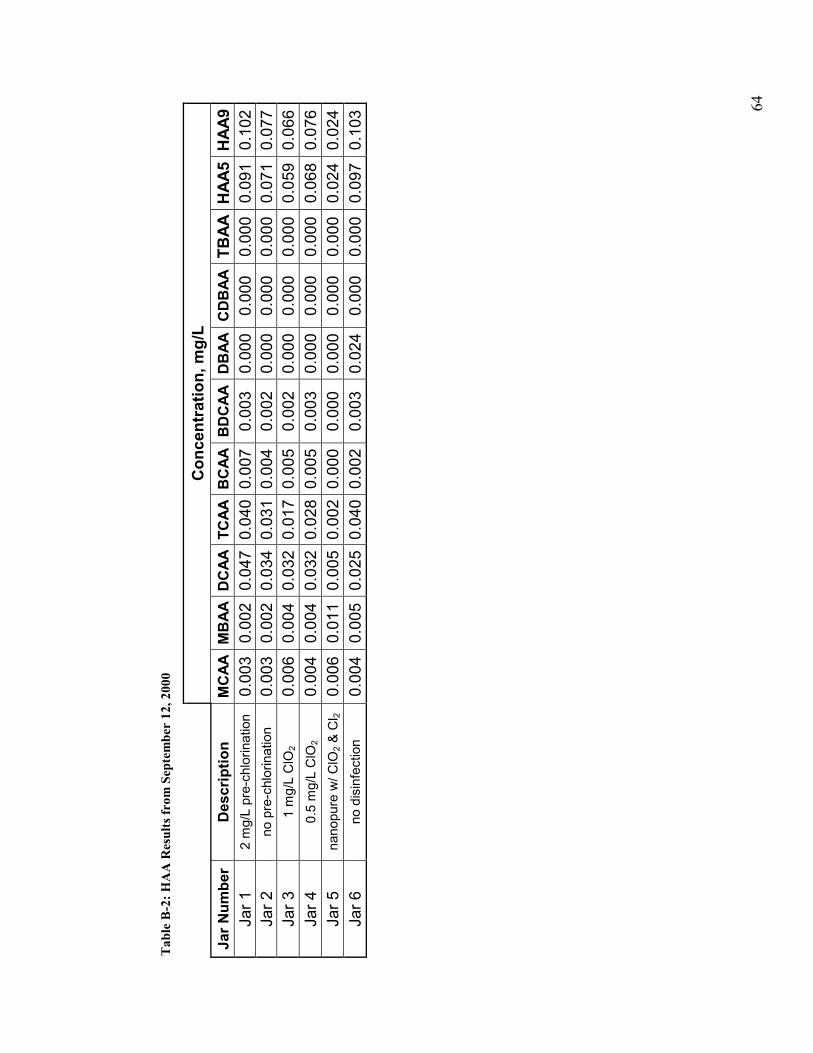
64
Tab
le B
-2:
HA
A R
esu
lts
from
Sep
tem
ber
12,
200
0
Co
nc
en
tra
tio
n,
mg
/L
Jar
Nu
mb
er
Des
crip
tio
n
MC
AA
MB
AA
DC
AA
TC
AA
BC
AA
BD
CA
AD
BA
AC
DB
AA
TB
AA
HA
A5
HA
A9
Jar
1
2 m
g/L
pre
-chlo
rinatio
n
0.0
03
0.0
02
0.0
47
0.0
40
0.0
07
0.0
03
0
.00
00
.00
0
0.0
00
0.0
91
0.1
02
Jar
2
no p
re-c
hlo
rinatio
n
0.0
03
0.0
02
0.0
34
0.0
31
0.0
04
0.0
02
0
.00
00
.00
0
0.0
00
0.0
71
0.0
77
Jar
3
1 m
g/L
ClO
2
0.0
06
0.0
04
0.0
32
0.0
17
0.0
05
0.0
02
0
.00
00
.00
0
0.0
00
0.0
59
0.0
66
Jar
4
0.5
mg/L
ClO
2
0.0
04
0.0
04
0.0
32
0.0
28
0.0
05
0.0
03
0
.00
00
.00
0
0.0
00
0.0
68
0.0
76
Jar
5
nanopure
w/ C
lO2 &
Cl 2
0
.00
60
.01
10
.00
50
.00
20
.00
00
.00
0
0.0
00
0.0
00
0
.00
00
.02
40
.02
4
Jar
6
no d
isin
fect
ion
0.0
04
0.0
05
0.0
25
0.0
40
0.0
02
0.0
03
0
.02
40
.00
0
0.0
00
0.0
97
0.1
03
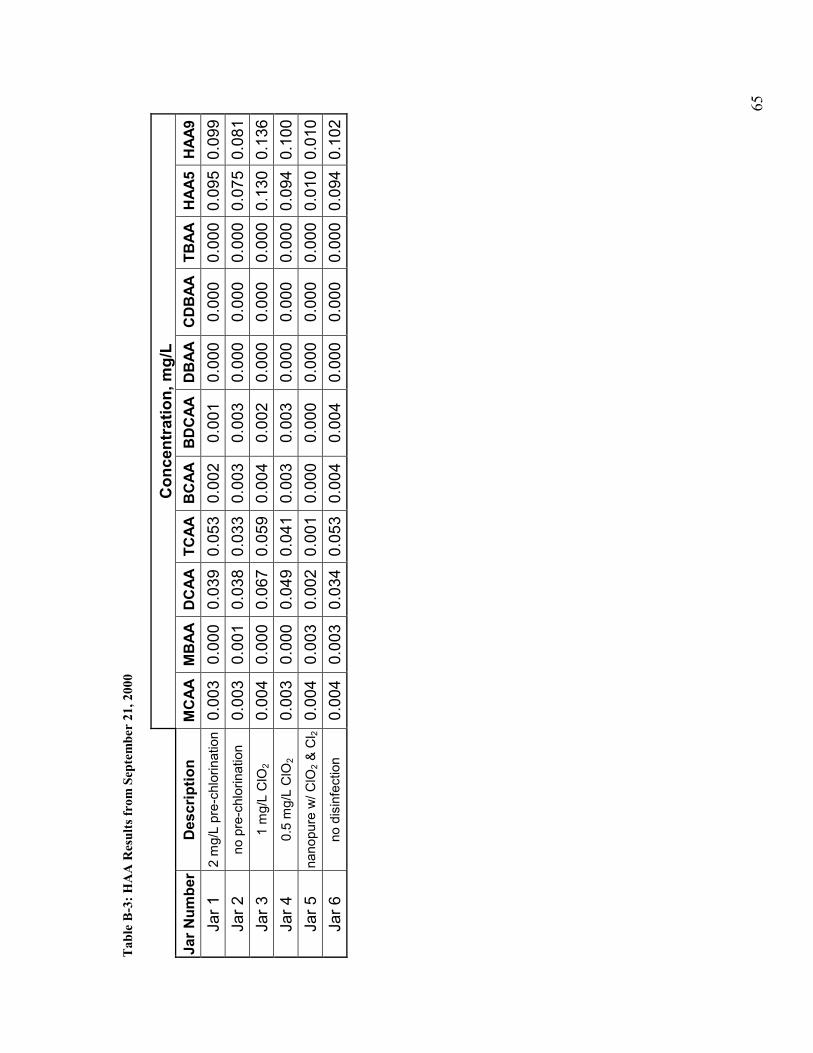
65
Tab
le B
-3:
HA
A R
esu
lts
from
Sep
tem
ber
21,
200
0
Co
nc
en
tra
tio
n,
mg
/L
Jar
Nu
mb
er
Des
crip
tio
n
MC
AA
MB
AA
DC
AA
TC
AA
BC
AA
BD
CA
AD
BA
AC
DB
AA
TB
AA
HA
A5
HA
A9
Jar
1
2 m
g/L
pre
-chlo
rinatio
n
0.0
03
0.0
00
0.0
39
0.0
53
0.0
02
0.0
01
0
.00
00
.00
0
0.0
00
0.0
95
0.0
99
Jar
2
no p
re-c
hlo
rinatio
n
0.0
03
0.0
01
0.0
38
0.0
33
0.0
03
0.0
03
0
.00
00
.00
0
0.0
00
0.0
75
0.0
81
Jar
3
1 m
g/L
ClO
2
0.0
04
0.0
00
0.0
67
0.0
59
0.0
04
0.0
02
0
.00
00
.00
0
0.0
00
0.1
30
0.1
36
Jar
4
0.5
mg/L
ClO
2
0.0
03
0.0
00
0.0
49
0.0
41
0.0
03
0.0
03
0
.00
00
.00
0
0.0
00
0.0
94
0.1
00
Jar
5
nanopure
w/ C
lO2 &
Cl 2
0
.00
40
.00
30
.00
20
.00
10
.00
00
.00
0
0.0
00
0.0
00
0
.00
00
.01
00
.01
0
Jar
6
no d
isin
fect
ion
0.0
04
0.0
03
0.0
34
0.0
53
0.0
04
0.0
04
0
.00
00
.00
0
0.0
00
0.0
94
0.1
02

66
Tab
le B
-4:
HA
A R
esu
lts
from
Oct
ober
24,
200
0
Co
nc
en
tra
tio
n,
mg
/L
Jar
Nu
mb
er
Des
crip
tio
n
MC
AA
MB
AA
DC
AA
TC
AA
BC
AA
B
DC
AA
D
BA
AC
DB
AA
T
BA
AH
AA
5H
AA
9
Jar
1
2 m
g/L
pre
-chlo
rinatio
n
0.0
00
0
.00
0
0.0
48
0.0
74
0.0
01
0
.02
6
0.0
01
0.0
26
0
.02
60
.12
3
0.2
02
Jar
2
no p
re-c
hlo
rinatio
n
0.0
06
0
.00
0
0.0
53
0.0
67
0.0
06
0
.00
6
0.0
00
0.0
00
0
.00
00
.12
6
0.1
38
Jar
3
2 m
g/L
ClO
2
0.0
07
0
.00
1
0.0
35
0.0
29
0.0
03
0
.00
4
0.0
00
0.0
00
0
.00
00
.07
1
0.0
78
Jar
4
1 m
g/L
ClO
2
0.0
09
0
.00
0
0.0
49
0.0
26
0.0
26
0
.00
6
0.0
00
0.0
00
0
.00
00
.08
5
0.1
17
Jar
4 d
. 1 m
g/L
ClO
2
0.0
07
0
.00
0
0.0
33
0.0
33
0.0
07
0
.00
4
0.0
00
0.0
00
0
.00
00
.07
3
0.0
85
Jar
5
0.5
mg/L
ClO
2
0.0
07
0
.00
0
0.0
41
0.0
33
0.0
02
0
.00
4
0.0
00
0.0
00
0
.00
00
.08
1
0.0
87
Jar
6
nanopure
w/ C
lO2 &
Cl 2
0
.00
7
0.0
00
0
.00
70
.00
20
.00
1
0.0
00
0
.00
00
.00
0
0.0
00
0.0
17
0
.01
8
Jar
7
no d
isin
fect
ion
0.0
09
0
.00
1
0.0
53
0.1
10
0.0
04
0
.00
8
0.0
00
0.0
00
0
.00
00
.17
2
0.1
84
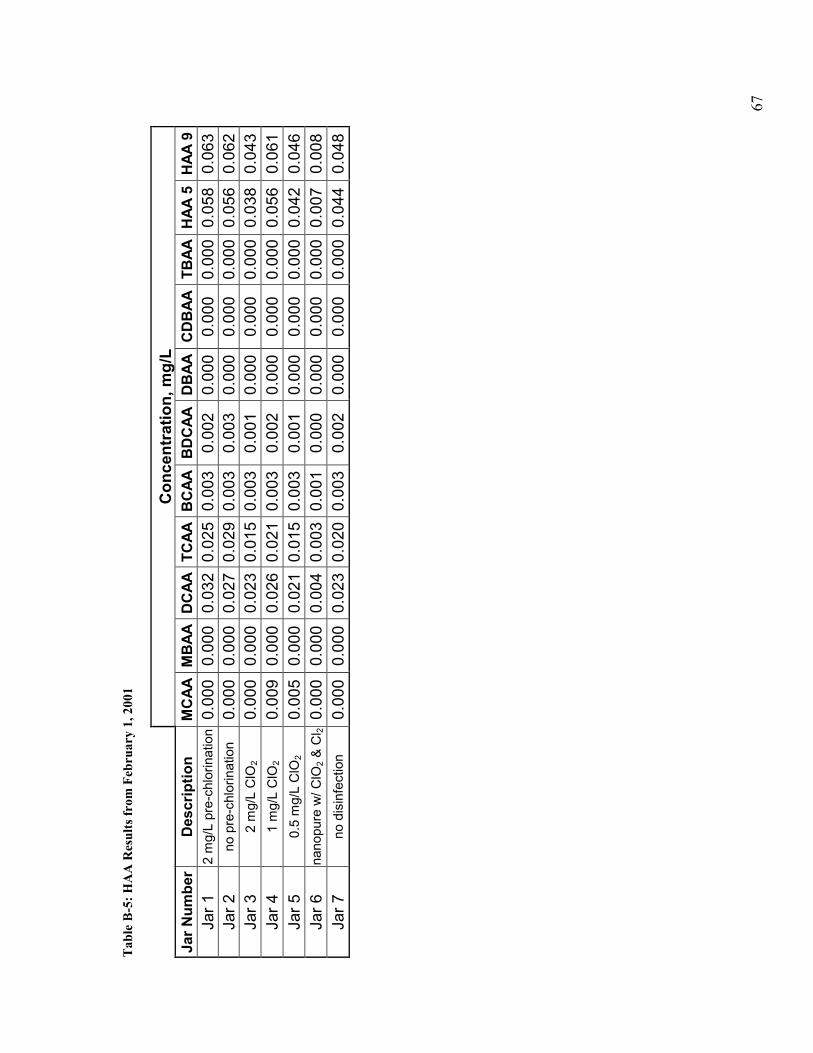
67
Tab
le B
-5:
HA
A R
esu
lts
from
Feb
ruar
y 1,
200
1
Co
nc
en
tra
tio
n,
mg
/L
Jar
Nu
mb
er
Des
crip
tio
n
MC
AA
MB
AA
DC
AA
TC
AA
BC
AA
BD
CA
A
DB
AA
CD
BA
AT
BA
AH
AA
5H
AA
9
Jar
1
2 m
g/L
pre
-chlo
rinatio
n
0.0
00
0.0
00
0.0
32
0.0
25
0.0
03
0.0
02
0
.00
00
.00
0
0.0
00
0.0
58
0.0
63
Jar
2
no p
re-c
hlo
rinatio
n
0.0
00
0.0
00
0.0
27
0.0
29
0.0
03
0.0
03
0
.00
00
.00
0
0.0
00
0.0
56
0.0
62
Jar
3
2 m
g/L
ClO
2
0.0
00
0.0
00
0.0
23
0.0
15
0.0
03
0.0
01
0
.00
00
.00
0
0.0
00
0.0
38
0.0
43
Jar
4
1 m
g/L
ClO
2
0.0
09
0.0
00
0.0
26
0.0
21
0.0
03
0.0
02
0
.00
00
.00
0
0.0
00
0.0
56
0.0
61
Jar
5
0.5
mg/L
ClO
2
0.0
05
0.0
00
0.0
21
0.0
15
0.0
03
0.0
01
0
.00
00
.00
0
0.0
00
0.0
42
0.0
46
Jar
6
nanopure
w/ C
lO2 &
Cl 2
0
.00
00
.00
00
.00
40
.00
30
.00
10
.00
0
0.0
00
0.0
00
0
.00
00
.00
70
.00
8Ja
r 7
no d
isin
fect
ion
0.0
00
0.0
00
0.0
23
0.0
20
0.0
03
0.0
02
0
.00
00
.00
0
0.0
00
0.0
44
0.0
48

68
Tab
le B
-6:
HA
A R
esu
lts
from
Feb
ruar
y 6,
200
1
Co
nc
en
tra
tio
n,
mg
/L
Jar
Nu
mb
er
Des
crip
tio
n
MC
AA
MB
AA
DC
AA
TC
AA
BC
AA
BD
CA
A
DB
AA
CD
BA
A
TB
AA
HA
A 5
HA
A 9
Jar
1
2 m
g/L
pre
-chlo
rinatio
n
0.0
15
0
.00
0
0.0
22
0.0
38
0.0
04
0.0
00
0
.00
00
.00
0
0.0
00
0.0
75
0
.07
9Ja
r 2
no p
re-c
hlo
rinatio
n
0.0
00
0
.00
0
0.0
10
0.0
11
0.0
03
0.0
01
0
.00
00
.00
0
0.0
00
0.0
20
0
.02
5Ja
r 3
2 m
g/L
ClO
2
0.0
09
0
.00
0
0.0
32
0.0
27
0.0
06
0.0
00
0
.00
00
.00
0
0.0
00
0.0
68
0
.07
4Ja
r 4
1 m
g/L
ClO
2
0.0
12
0
.00
0
0.0
25
0.0
29
0.0
06
0.0
02
0
.00
00
.00
0
0.0
00
0.0
66
0
.07
3Ja
r 5
0.5
mg/L
ClO
2
0.0
10
0
.00
0
0.0
28
0.0
42
0.0
03
0.0
02
0
.00
00
.00
0
0.0
00
0.0
80
0
.08
6Ja
r 6
nanopure
w/ C
lO2 &
Cl 2
0
.00
8
0.0
00
0
.00
40
.00
40
.00
20
.00
0
0.0
00
0.0
00
0
.00
00
.01
6
0.0
17
Jar
7
no d
isin
fect
ion
0.0
07
0
.00
0
0.0
26
0.0
45
0.0
06
0.0
02
0
.00
00
.00
0
0.0
00
0.0
78
0
.08
6

69
Tab
le B
-7:
HA
A R
esu
lts
from
Mar
ch 2
4, 2
001
Co
nc
en
tra
tio
n,
mg
/L
Jar
Nu
mb
er
Des
crip
tio
n
MC
AA
MB
AA
DC
AA
TC
AA
B
CA
A
BD
CA
A
DB
AA
C
DB
AA
TB
AA
HA
A 5
HA
A 9
Jar
1
2 m
g/L
pre
-chlo
rinatio
n 0
.00
30
.00
00
.02
40
.03
0
0.0
02
0
.00
2
0.0
00
0
.00
0
0.0
00
0.0
58
0.0
62
Jar
2
no p
re-c
hlo
rinatio
n
0.0
01
0.0
00
0.0
23
0.0
23
0
.00
5
0.0
02
0
.00
0
0.0
00
0
.00
00
.04
80
.05
4Ja
r 3
2 m
g/L
ClO
2
0.0
05
0.0
00
0.0
23
0.0
13
0
.00
3
0.0
01
0
.00
0
0.0
00
0
.00
00
.04
20
.04
7
Jar
4
1 m
g/L
ClO
2
0.0
03
0.0
00
0.0
25
0.0
27
0
.01
5
0.0
02
0
.00
0
0.0
00
0
.00
00
.05
60
.07
3
Jar
5
0.5
mg/L
ClO
2
0.0
06
0.0
00
0.0
27
0.0
33
0
.00
1
0.0
02
0
.00
0
0.0
00
0
.00
00
.06
60
.07
0
Jar
6
nanopure
w/ C
lO2 &
Cl 2
0.0
03
0.0
00
0.0
04
0.0
04
0
.00
0
0.0
00
0
.00
0
0.0
00
0
.00
00
.01
00
.01
1Ja
r 7
no d
isin
fect
ion
No
t R
ep
ort
ed
70
APPENDIX C
Chlorite Results from Jar Testing

71
Table C-1: Chlorite Results, mg/L
Jar Description
Jar Test Date
Nanopure No
Disinfection2 mg/L
Pre-chlorNo Pre-chlor
0.5 mg/L ClO2
1.0 mg/L ClO2
2.0 mg/L ClO2
8/10/2000 --- --- 0 0 0.242 0.497 ---
9/12/00 --- --- --- --- --- --- ---
9/21/2000 0.091 0 0 0 0.239 0.500 ---
10/24/2000 --- --- --- --- --- --- ---
11/9/2000 --- --- --- --- --- --- ---
2/1/2001 0 0 0 0 0.225 0.384 0.667
2/6/2001 0.059 0 0 0 0.252 0.385 0.639
3/24/2001 0 0 0 0 0.222 0.329 0.486
"---" denotes no results reported
Average 0.037 0 0 0 0.236 0.419 0.597 Median 0.029 0 0 0 0.239 0.385 0.639

72
APPENDIX D
Chlorate Results from Jar Testing

73
Table D-1: Chlorate Results, mg/L
Jar Description
Jar Test Date
Nanopure No
Disinfection2 mg/L
Pre-chlorNo Pre-chlor
0.5 mg/L ClO2
1.0 mg/L ClO2
2.0 mg/L ClO2
8/10/2000 --- --- 0 0 0.2 0.5 ---
9/12/00 --- --- --- --- --- --- ---
9/21/2000 0.386 0 0.303 0.321 0.020 0.396 ---
10/24/2000 --- --- --- --- --- --- ---
11/9/2000 --- --- --- --- --- --- ---
2/1/2001 0 0.337 0.343 0.339 0.348 0.437 0.563
2/6/2001 0.388 0 0.415 0.387 0.416 0.498 0.570
3/24/2001 0.488 0 0.367 0.159 0.545 0.417 0.471
"---" denotes no results reported
Average 0.316 0.084 0.286 0.241 0.306 0.449 0.535 Median 0.387 0 0.343 0.321 0.348 0.437 0.563
74
APPENDIX E
Total Organic Carbon Results from Jar Testing

75
Tab
le E
-1:
TO
C R
esu
lts,
mg/
L
Ja
r D
escr
ipti
on
Jar
Tes
t D
ate
Nan
op
ure
N
o
Dis
infe
ctio
n2
mg
/L P
re-
chlo
r N
o P
re-
chlo
r 0.
5 m
g/L
C
lO2
1.0
mg
/L
ClO
2 2.
0 m
g/L
C
lO2
8/1
0/2
00
0
---
---
---
---
---
---
---
9/1
2/2
00
0
---
1.4
5
1.8
1
---
1.5
6
1.9
4
---
9/2
1/2
000
0.1
9
1.5
6
1.7
0
1.7
3
1.6
5
1.5
1
---
10/2
4/2
000
---
1.6
4
1.7
2
1.4
1
1.6
8
1.4
3
1.5
7
11/9
/2000
0.2
2
1.3
4
1.7
0
1.7
5
1.2
9
1.5
4
1.5
6
2/1
/2001
3.6
4
1.3
5
1.3
4
2.8
1
1.3
2
1.1
9
1.4
3
2/6
/2001
1.4
3
2.8
9
1.3
3
1.3
0
2.0
2
1.3
8
3.1
7
3/2
4/2
001
0.2
1
1.4
3
1.4
0
1.2
0
1.5
1
1.2
8
1.4
6
"---
" d
en
ote
s n
o r
esu
lts r
ep
ort
ed
Ave
rag
e 1.1
4
1.6
7
1.5
7
1.7
0
1.5
8
1.4
7
1.8
4
Med
ian
0.2
2
1.4
5
1.7
0
1.5
7
1.5
6
1.4
3
1.5
6

76
APPENDIX F
Raw water Quality Measurements
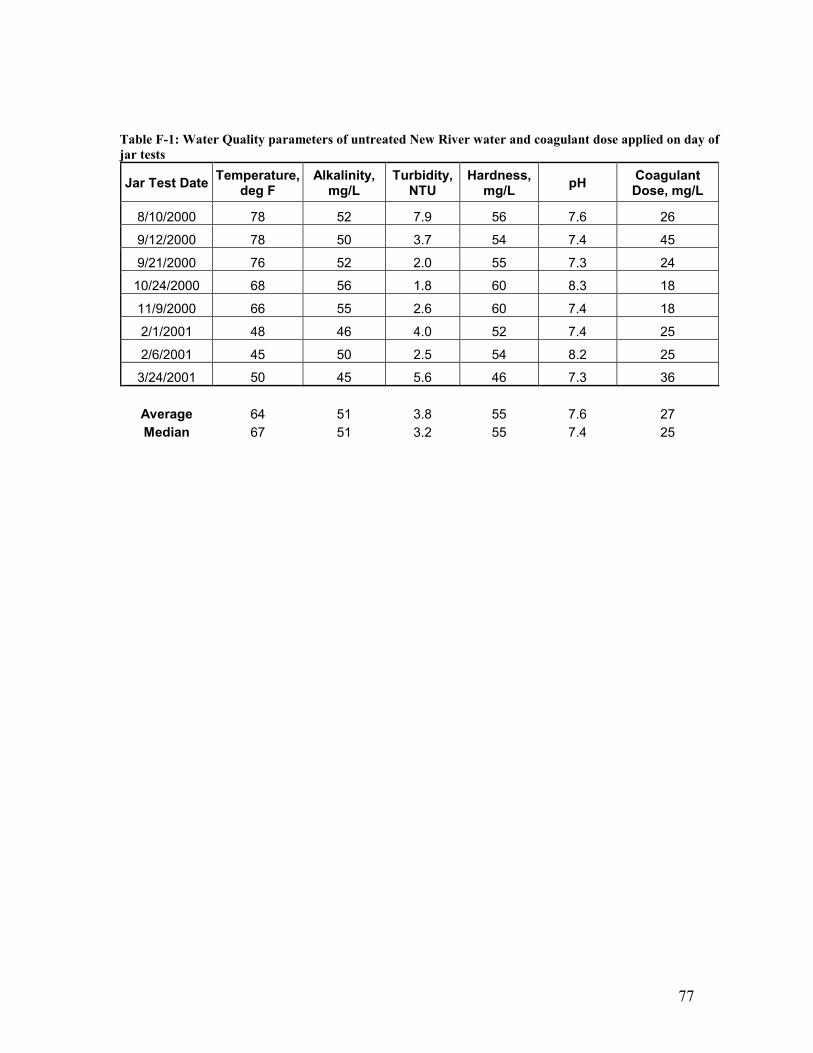
77
Table F-1: Water Quality parameters of untreated New River water and coagulant dose applied on day of jar tests
Jar Test Date Temperature,
deg F Alkalinity,
mg/L Turbidity,
NTU Hardness,
mg/L pH
Coagulant Dose, mg/L
8/10/2000 78 52 7.9 56 7.6 26
9/12/2000 78 50 3.7 54 7.4 45
9/21/2000 76 52 2.0 55 7.3 24
10/24/2000 68 56 1.8 60 8.3 18
11/9/2000 66 55 2.6 60 7.4 18
2/1/2001 48 46 4.0 52 7.4 25
2/6/2001 45 50 2.5 54 8.2 25
3/24/2001 50 45 5.6 46 7.3 36
Average 64 51 3.8 55 7.6 27 Median 67 51 3.2 55 7.4 25

78
APPENDIX G
Statistical Analyses of THMs and HAAs
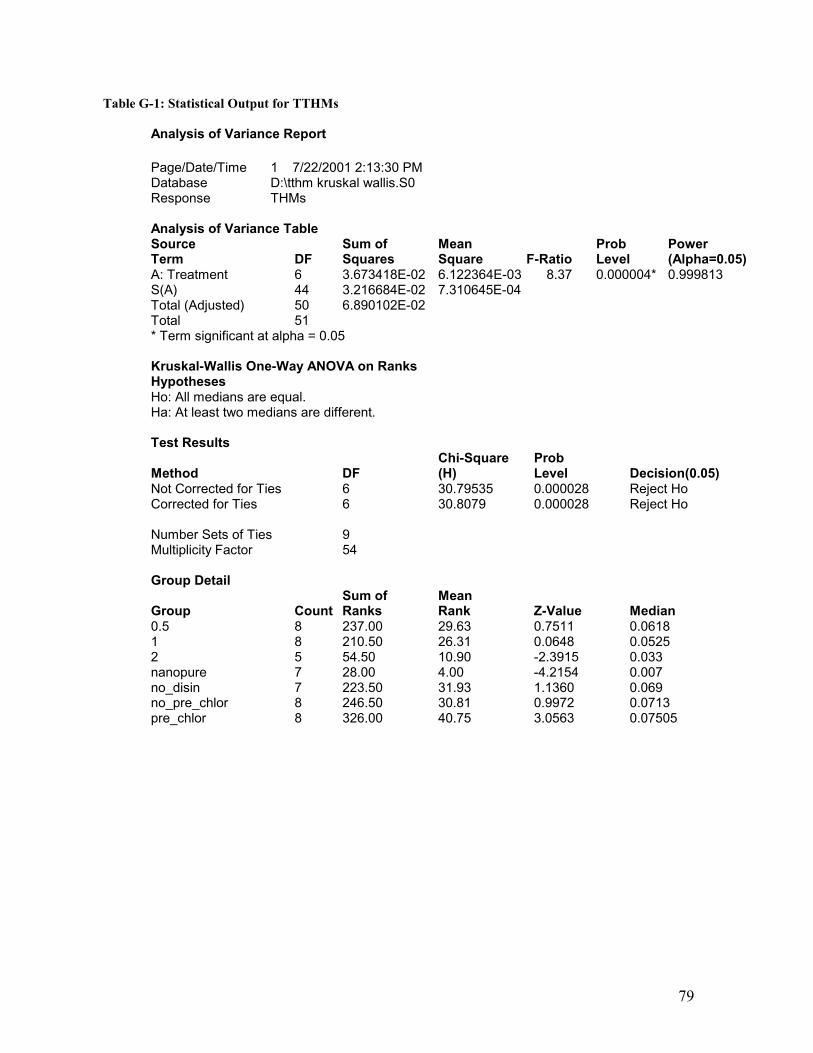
79
Table G-1: Statistical Output for TTHMs
Analysis of Variance Report Page/Date/Time 1 7/22/2001 2:13:30 PM Database D:\tthm kruskal wallis.S0 Response THMs Analysis of Variance Table Source Sum of Mean Prob Power Term DF Squares Square F-Ratio Level (Alpha=0.05) A: Treatment 6 3.673418E-02 6.122364E-03 8.37 0.000004* 0.999813 S(A) 44 3.216684E-02 7.310645E-04 Total (Adjusted) 50 6.890102E-02 Total 51 * Term significant at alpha = 0.05 Kruskal-Wallis One-Way ANOVA on Ranks Hypotheses Ho: All medians are equal. Ha: At least two medians are different. Test Results Chi-Square Prob Method DF (H) Level Decision(0.05) Not Corrected for Ties 6 30.79535 0.000028 Reject Ho Corrected for Ties 6 30.8079 0.000028 Reject Ho Number Sets of Ties 9 Multiplicity Factor 54 Group Detail Sum of Mean Group Count Ranks Rank Z-Value Median 0.5 8 237.00 29.63 0.7511 0.0618 1 8 210.50 26.31 0.0648 0.0525 2 5 54.50 10.90 -2.3915 0.033 nanopure 7 28.00 4.00 -4.2154 0.007 no_disin 7 223.50 31.93 1.1360 0.069 no_pre_chlor 8 246.50 30.81 0.9972 0.0713 pre_chlor 8 326.00 40.75 3.0563 0.07505

80
Table G-1 continued
Analysis of Variance Report Page/Date/Time 2 7/22/2001 2:13:30 PM Database D:\tthm kruskal wallis.S0 Response THMs Kruskal-Wallis Multiple-Comparison Z-Value Test THMs 0.5 1 2 nanopure no_disin 0.5 0.0000 0.4457 2.2099 3.3312 0.2995 1 0.4457 0.0000 1.8190 2.9006 0.7301 2 2.2099 1.8190 0.0000 0.7928 2.4163 nanopure 3.3312 2.9006 0.7928 0.0000 3.5154 no_disin 0.2995 0.7301 2.4163 3.5154 0.0000 no_pre_chlor 0.1598 0.6055 2.3500 3.4856 0.1451 pre_chlor 1.4970 1.9427 3.5229 4.7775 1.1468 Regular Test: Medians significantly different if z-value > 1.9600 Bonferroni Test: Medians significantly different if z-value > 3.0381 Kruskal-Wallis Multiple-Comparison Z-Value Test THMs no_pre_chlor pre_chlor 0.5 0.1598 1.4970 1 0.6055 1.9427 2 2.3500 3.5229 nanopure 3.4856 4.7775 no_disin 0.1451 1.1468 no_pre_chlor 0.0000 1.3372 pre_chlor 1.3372 0.0000 Regular Test: Medians significantly different if z-value > 1.9600 Bonferroni Test: Medians significantly different if z-value > 3.0381

81
Table G-2: Statistical Output for Fall and Winter TTHMs
Analysis of Variance Report Page/Date/Time 1 7/22/2001 5:10:42 PM Database C:\Program Files\NCSS97\Report\partialthms.S0 Response C2 Analysis of Variance Table Source Sum of Mean Prob Power Term DF Squares Square F-Ratio Level (Alpha=0.05)A: C1 6 1.593937E-02 2.656562E-03 38.99 0.000000* 1.000000 S(A) 28 0.0019076 6.812857E-05 Total (Adjusted) 34 1.784697E-02 Total 35 * Term significant at alpha = 0.05 Kruskal-Wallis One-Way ANOVA on Ranks Hypotheses Ho: All medians are equal. Ha: At least two medians are different. Test Results Chi-Square Prob Method DF (H) Level Decision(0.05) Not Corrected for Ties 6 27.55619 0.000114 Reject Ho Corrected for Ties 6 27.59097 0.000112 Reject Ho Number Sets of Ties 9 Multiplicity Factor 54 Group Detail Sum of Mean Group Count Ranks Rank Z-Value Median 0.5 CD 5 106.00 21.20 0.7542 0.055 1.0 CD 5 75.50 15.10 -0.6835 0.045 2.0 CD 5 44.50 8.90 -2.1449 0.033 No Pre-chlor 5 106.50 21.30 0.7778 0.058 nano 5 15.00 3.00 -3.5355 0.006 no dis 5 121.50 24.30 1.4849 0.064 pre chlor 5 161.00 32.20 3.3470 0.073

82
Table G-2 continued
Analysis of Variance Report Page/Date/Time 2 7/22/2001 5:10:42 PM Database C:\Program Files\NCSS97\Report\partialthms.S0 Response C2 Kruskal-Wallis Multiple-Comparison Z-Value Test C2 0.5 CD 1.0 CD 2.0 CD No Pre-chlor nano 0.5 CD 0.0000 0.9418 1.8991 0.0154 2.8101 1.0 CD 0.9418 0.0000 0.9573 0.9573 1.8682 2.0 CD 1.8991 0.9573 0.0000 1.9146 0.9110 No Pre-chlor 0.0154 0.9573 1.9146 0.0000 2.8255 nano 2.8101 1.8682 0.9110 2.8255 0.0000 no dis 0.4786 1.4205 2.3778 0.4632 3.2887 pre chlor 1.6984 2.6403 3.5975 1.6830 4.5085 Regular Test: Medians significantly different if z-value > 1.9600 Bonferroni Test: Medians significantly different if z-value > 3.0381 Kruskal-Wallis Multiple-Comparison Z-Value Test C2 no dis pre chlor 0.5 CD 0.4786 1.6984 1.0 CD 1.4205 2.6403 2.0 CD 2.3778 3.5975 No Pre-chlor 0.4632 1.6830 nano 3.2887 4.5085 no dis 0.0000 1.2198 pre chlor 1.2198 0.0000 Regular Test: Medians significantly different if z-value > 1.9600 Bonferroni Test: Medians significantly different if z-value > 3.0381

83
Table G-3: Statistical Output for ClO2 dose comparisons of TTHMs
Analysis of Variance Report Page/Date/Time 1 7/22/2001 5:26:34 PM Database C:\Program Files\NCSS97\Report\DoseTTHM.S0 Response TTHM Tests of Assumptions Section Test Prob Decision Assumption Value Level (0.05) Skewness Normality of Residuals 3.2775 0.001047 Reject Kurtosis Normality of Residuals 2.4811 0.013098 Reject Omnibus Normality of Residuals 16.8979 0.000214 Reject Modified-Levene Equal-Variance Test 0.8161 0.497141 Accept Analysis of Variance Table Source Sum of Mean Prob Power Term DF Squares Square F-Ratio Level (Alpha=0.05) A: C1 3 5.950875E-03 1.983625E-03 2.46 0.086164 0.541585 S(A) 25 2.016106E-02 8.064426E-04 Total (Adjusted) 28 2.611194E-02 Total 29 * Term significant at alpha = 0.05 Kruskal-Wallis One-Way ANOVA on Ranks Hypotheses Ho: All medians are equal. Ha: At least two medians are different. Test Results Chi-Square Prob Method DF (H) Level Decision(0.05) Not Corrected for Ties 3 10.85285 0.012549 Reject Ho Corrected for Ties 3 10.86355 0.012487 Reject Ho Number Sets of Ties 4 Multiplicity Factor 24 Group Detail Sum of Mean Group Count Ranks Rank Z-Value Median 0 8 145.00 18.13 1.2199 0.0713 0.5 8 147.00 18.38 1.3175 0.0618 1 8 123.50 15.44 0.1708 0.0525 2 5 19.50 3.90 -3.2043 0.033
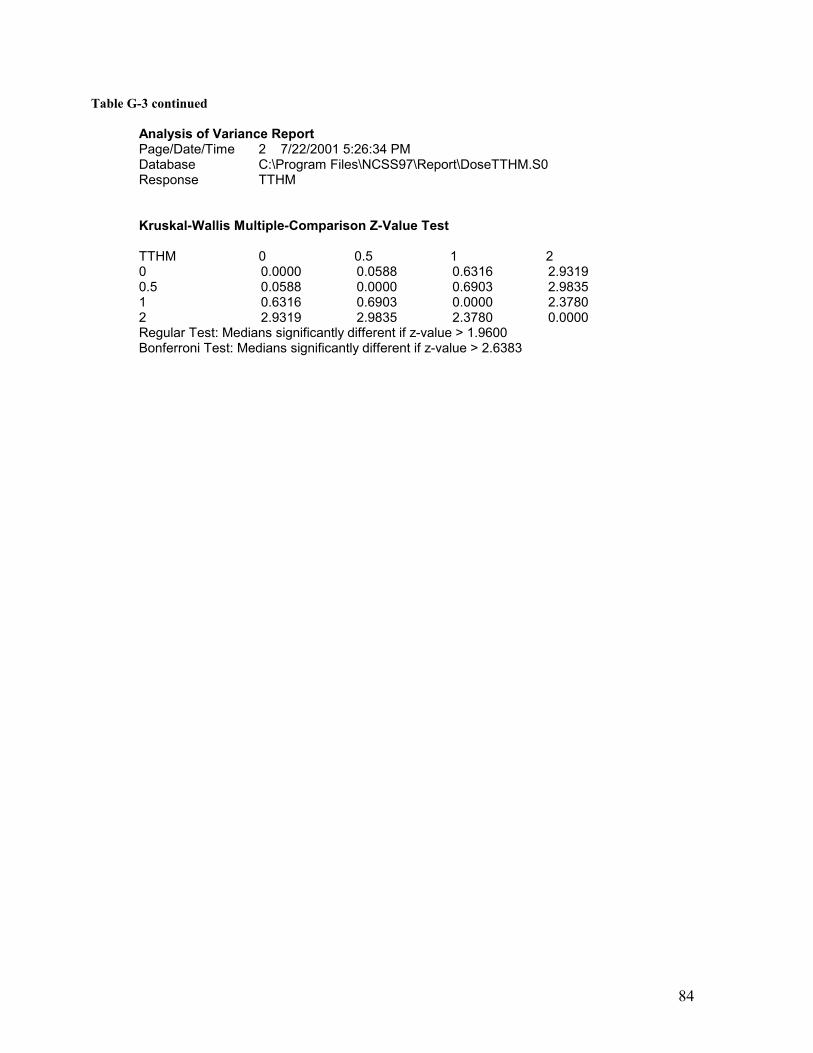
84
Table G-3 continued
Analysis of Variance Report Page/Date/Time 2 7/22/2001 5:26:34 PM Database C:\Program Files\NCSS97\Report\DoseTTHM.S0 Response TTHM Kruskal-Wallis Multiple-Comparison Z-Value Test TTHM 0 0.5 1 2 0 0.0000 0.0588 0.6316 2.9319 0.5 0.0588 0.0000 0.6903 2.9835 1 0.6316 0.6903 0.0000 2.3780 2 2.9319 2.9835 2.3780 0.0000 Regular Test: Medians significantly different if z-value > 1.9600 Bonferroni Test: Medians significantly different if z-value > 2.6383
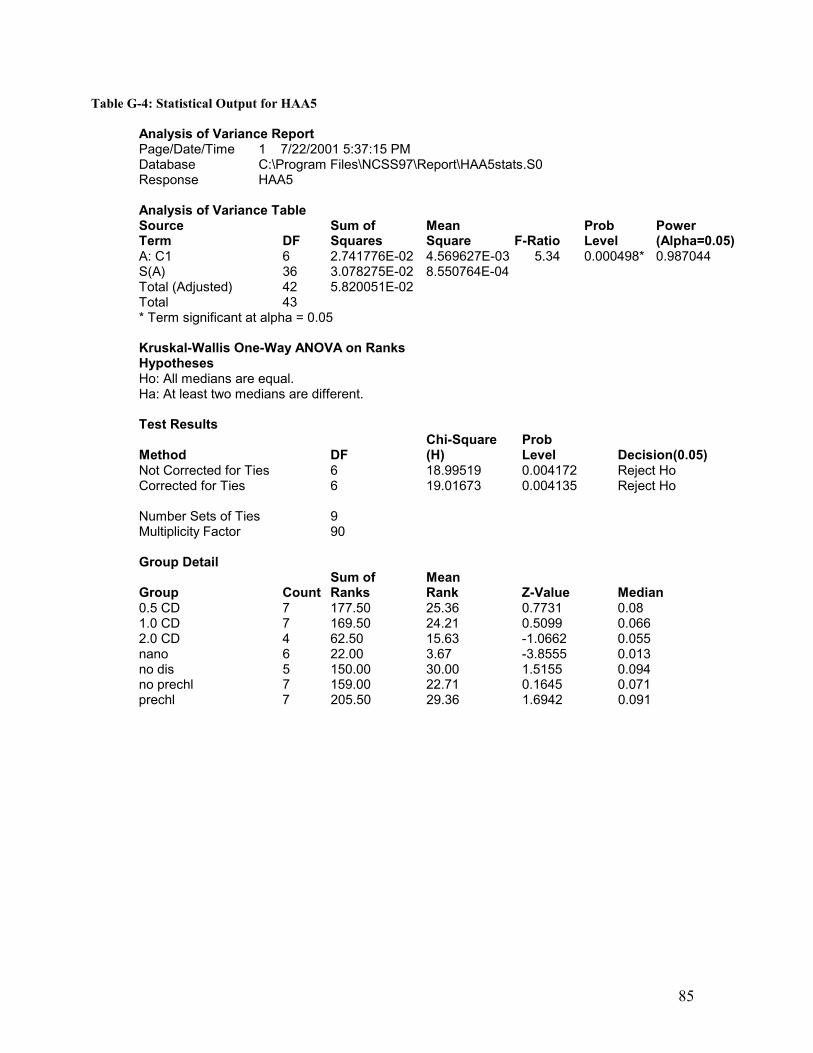
85
Table G-4: Statistical Output for HAA5
Analysis of Variance Report Page/Date/Time 1 7/22/2001 5:37:15 PM Database C:\Program Files\NCSS97\Report\HAA5stats.S0 Response HAA5 Analysis of Variance Table Source Sum of Mean Prob Power Term DF Squares Square F-Ratio Level (Alpha=0.05) A: C1 6 2.741776E-02 4.569627E-03 5.34 0.000498* 0.987044 S(A) 36 3.078275E-02 8.550764E-04 Total (Adjusted) 42 5.820051E-02 Total 43 * Term significant at alpha = 0.05 Kruskal-Wallis One-Way ANOVA on Ranks Hypotheses Ho: All medians are equal. Ha: At least two medians are different. Test Results Chi-Square Prob Method DF (H) Level Decision(0.05) Not Corrected for Ties 6 18.99519 0.004172 Reject Ho Corrected for Ties 6 19.01673 0.004135 Reject Ho Number Sets of Ties 9 Multiplicity Factor 90 Group Detail Sum of Mean Group Count Ranks Rank Z-Value Median 0.5 CD 7 177.50 25.36 0.7731 0.08 1.0 CD 7 169.50 24.21 0.5099 0.066 2.0 CD 4 62.50 15.63 -1.0662 0.055 nano 6 22.00 3.67 -3.8555 0.013 no dis 5 150.00 30.00 1.5155 0.094 no prechl 7 159.00 22.71 0.1645 0.071
prechl 7 205.50 29.36 1.6942 0.091
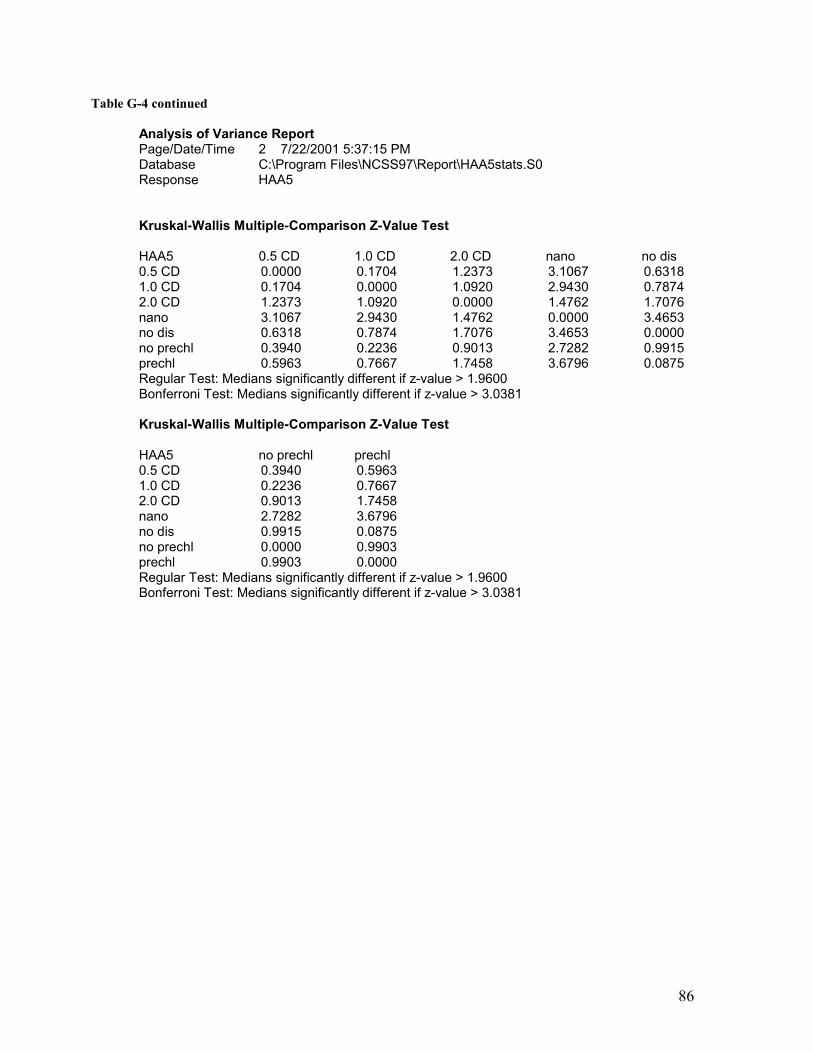
86
Table G-4 continued
Analysis of Variance Report Page/Date/Time 2 7/22/2001 5:37:15 PM Database C:\Program Files\NCSS97\Report\HAA5stats.S0 Response HAA5 Kruskal-Wallis Multiple-Comparison Z-Value Test HAA5 0.5 CD 1.0 CD 2.0 CD nano no dis 0.5 CD 0.0000 0.1704 1.2373 3.1067 0.6318 1.0 CD 0.1704 0.0000 1.0920 2.9430 0.7874 2.0 CD 1.2373 1.0920 0.0000 1.4762 1.7076 nano 3.1067 2.9430 1.4762 0.0000 3.4653 no dis 0.6318 0.7874 1.7076 3.4653 0.0000 no prechl 0.3940 0.2236 0.9013 2.7282 0.9915 prechl 0.5963 0.7667 1.7458 3.6796 0.0875 Regular Test: Medians significantly different if z-value > 1.9600 Bonferroni Test: Medians significantly different if z-value > 3.0381 Kruskal-Wallis Multiple-Comparison Z-Value Test HAA5 no prechl prechl 0.5 CD 0.3940 0.5963 1.0 CD 0.2236 0.7667 2.0 CD 0.9013 1.7458 nano 2.7282 3.6796 no dis 0.9915 0.0875 no prechl 0.0000 0.9903 prechl 0.9903 0.0000 Regular Test: Medians significantly different if z-value > 1.9600 Bonferroni Test: Medians significantly different if z-value > 3.0381

87
Table G-5: Statistical Output for Fall and Winter HAA5
Analysis of Variance Report Page/Date/Time 1 7/22/2001 5:00:38 PM Database C:\Program Files\NCSS97\Report\HAA5.S0 Response C2 Analysis of Variance Table Source Sum of Mean Prob Power Term DF Squares Square F-Ratio Level (Alpha=0.05) A: C1 6 2.741776E-02 4.569627E-03 5.34 0.000498* 0.987044 S(A) 36 3.078275E-02 8.550764E-04 Total (Adjusted) 42 5.820051E-02 Total 43 * Term significant at alpha = 0.05 Kruskal-Wallis One-Way ANOVA on Ranks Hypotheses Ho: All medians are equal. Ha: At least two medians are different. Test Results Chi-Square Prob Method DF (H) Level Decision(0.05) Not Corrected for Ties 6 18.99519 0.004172 Reject Ho Corrected for Ties 6 19.01673 0.004135 Reject Ho Number Sets of Ties 9 Multiplicity Factor 90 Group Detail Sum of Mean Group Count Ranks Rank Z-Value Median 0.5 CD 7 177.50 25.36 0.7731 0.08 1.0 CD 7 169.50 24.21 0.5099 0.066 2.0 CD 4 62.50 15.63 -1.0662 0.055 nano 6 22.00 3.67 -3.8555 0.013 no dis 5 150.00 30.00 1.5155 0.094 no pre chl 7 159.00 22.71 0.1645 0.071 pre chl 7 205.50 29.36 1.6942 0.091
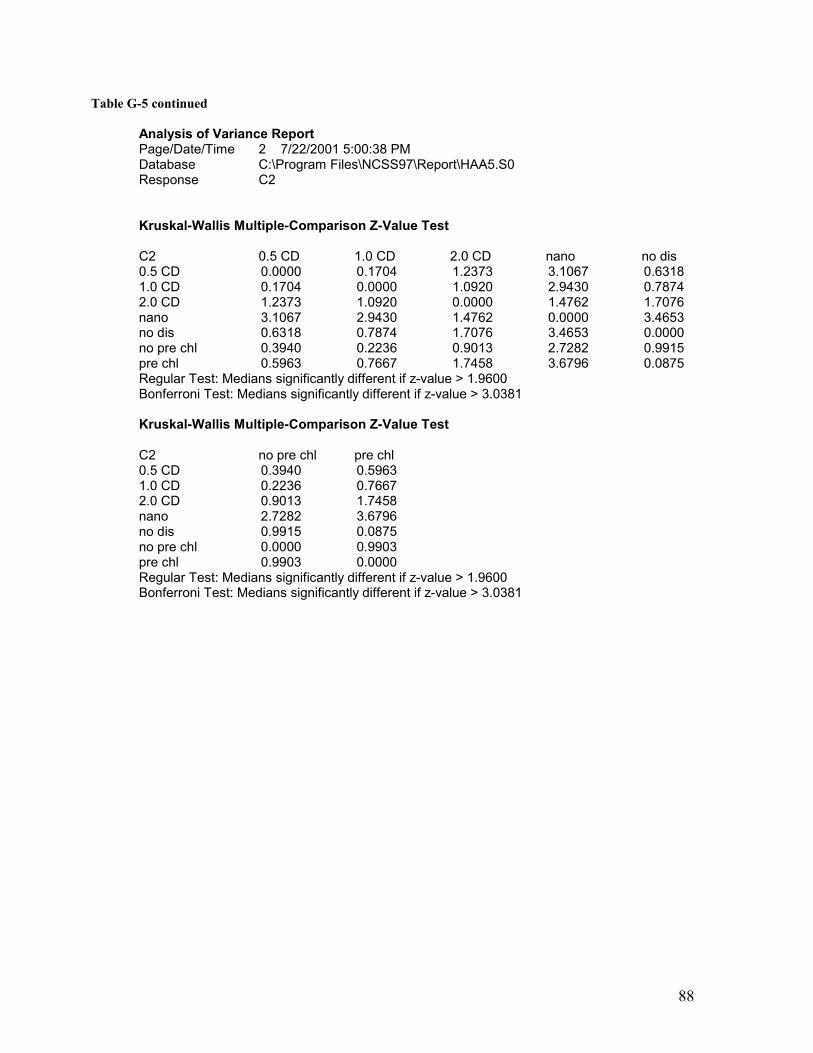
88
Table G-5 continued
Analysis of Variance Report Page/Date/Time 2 7/22/2001 5:00:38 PM Database C:\Program Files\NCSS97\Report\HAA5.S0 Response C2 Kruskal-Wallis Multiple-Comparison Z-Value Test C2 0.5 CD 1.0 CD 2.0 CD nano no dis 0.5 CD 0.0000 0.1704 1.2373 3.1067 0.6318 1.0 CD 0.1704 0.0000 1.0920 2.9430 0.7874 2.0 CD 1.2373 1.0920 0.0000 1.4762 1.7076 nano 3.1067 2.9430 1.4762 0.0000 3.4653 no dis 0.6318 0.7874 1.7076 3.4653 0.0000 no pre chl 0.3940 0.2236 0.9013 2.7282 0.9915 pre chl 0.5963 0.7667 1.7458 3.6796 0.0875 Regular Test: Medians significantly different if z-value > 1.9600 Bonferroni Test: Medians significantly different if z-value > 3.0381 Kruskal-Wallis Multiple-Comparison Z-Value Test C2 no pre chl pre chl 0.5 CD 0.3940 0.5963 1.0 CD 0.2236 0.7667 2.0 CD 0.9013 1.7458 nano 2.7282 3.6796 no dis 0.9915 0.0875 no pre chl 0.0000 0.9903 pre chl 0.9903 0.0000 Regular Test: Medians significantly different if z-value > 1.9600 Bonferroni Test: Medians significantly different if z-value > 3.0381

89
Table G-6: Statistical Output for ClO2 dose comparisons of HAA5
Analysis of Variance Report Page/Date/Time 1 7/22/2001 5:18:25 PM Database Response C2 Tests of Assumptions Section Test Prob Decision Assumption Value Level (0.05) Skewness Normality of Residuals 0.8994 0.368431 Accept Kurtosis Normality of Residuals 0.3500 0.726338 Accept Omnibus Normality of Residuals 0.9315 0.627680 Accept Modified-Levene Equal-Variance Test 0.6041 0.619619 Accept Analysis of Variance Table Source Sum of Mean Prob Power Term DF Squares Square F-Ratio Level (Alpha=0.05) A: C1 3 1.604724E-03 5.349081E-04 0.71 0.559112 0.173852 S(A) 21 1.591104E-02 7.576683E-04 Total (Adjusted) 24 1.751576E-02 Total 25 * Term significant at alpha = 0.05 Kruskal-Wallis One-Way ANOVA on Ranks Hypotheses Ho: All medians are equal. Ha: At least two medians are different. Test Results Chi-Square Prob Method DF (H) Level Decision(0.05) Not Corrected for Ties 3 2.330604 0.506683 Accept Ho Corrected for Ties 3 2.3387 0.505148 Accept Ho Number Sets of Ties 6 Multiplicity Factor 54 Group Detail Sum of Mean Group Count Ranks Rank Z-Value Median 0 7 90.50 12.93 -0.0303 0.071 0.5 7 104.00 14.86 0.7868 0.08 1 7 98.00 14.00 0.4237 0.066 2 4 32.50 8.13 -1.4454 0.055

90
Table G-6 continued
Analysis of Variance Report Page/Date/Time 2 7/22/2001 5:18:25 PM Database Response C2 Kruskal-Wallis Multiple-Comparison Z-Value Test C2 0 0.5 1 2 0 0.0000 0.4911 0.2728 1.0431 0.5 0.4911 0.0000 0.2183 1.4619 1 0.2728 0.2183 0.0000 1.2758 2 1.0431 1.4619 1.2758 0.0000 Regular Test: Medians significantly different if z-value > 1.9600 Bonferroni Test: Medians significantly different if z-value > 2.6383

91
VITA
Charissa Larine Harris was born on February 27, 1975. She received a Bachelor
of Arts in Environmental Sciences from the University of Virginia, Charlottesville,
Virginia in 1997. She then worked for two years at an engineering firm before returning
to school to begin a Master of Science in Environmental Engineering. She completed her
graduate work at Virginia Polytechnic Institute and State University, Blacksburg,
Virginia in 2001.
Top Related