


Languages
Pages
Legal


THE EFFECT OF PARTICLE SIZE ON HYDROLYSIS AND MODELING OF ANAEROBIC DIGESTION
(Spine title: The Effect of Particle Size on Hydrolysis in Anaerobic Digestion)
(Thesis format: Integrated-Article)
The thesis by
Saad Aldin
Graduate Program in
Engineering Science Department of Chemical and Biochemical Engineering
A thesis submitted in partial fulfillment of the requirements for the degree of
Doctor of Philosophy
School of Graduate and Postdoctoral Studies The University of Western Ontario
London, Ontario, Canada
© Saad Aldin 2010

ii
THE UNIVERSITY OF WESTERN ONTARIO SCHOOL OF GRADUATE AND POSTDOCTORAL STUDIES
CERTIFICATE OF EXAMINATION
Joint-Supervisor
______________________________ Dr. George Nakhla
Joint-Supervisor
______________________________ Dr. Madhumita B Ray
Examiners
______________________________ Dr. Argyrios Margaritis ______________________________ Dr. Lars Rehmann ______________________________ Dr. Gordon Southam ______________________________ Dr. Nihar Biswas
The thesis by
Saad Aldin
entitled:
THE EFFECT OF PARTICLE SIZE ON HYDROLYSIS AND THE MODELING OF ANAEROBIC DIGESTION
is accepted in partial fulfilment of the requirements for the degree of
DOCTOR OF PHILOSOPHY
Date__________________________ _______________________________ Chair of the Thesis Examination Board

iii
ABSTRACT
Batch experiments were performed to investigate the effect of particulate protein particle
size on the hydrolysis of casein in anaerobic degradation. While particle size did not affect the
ultimate protein degradation efficiency, the hydrolysis rate coefficient increased from 0.034 to
0.298 d-1 with the change in specific surface area from 0.01 to 0.192 m2/g. The maximum
methane production rate was affected by the particle size change, although the ultimate amount
of methane produced was approximately the same despite the change in specific surface area. A
mathematical relationship between the hydrolysis rate coefficient and specific surface area was
developed and a new hydrolysis equation was proposed and verified.
Ultrasound treatment of wastewater sludges prior to anaerobic digestion disrupts the flocs
and causes lysis of the bacterial cells releasing both inter and intracellular materials. Primary
(PS) and waste activated sludge (WAS) were treated with different ultrasonic intensities, varying
sonication time and amplitude at a constant frequency. Results showed that gas production,
volatile fatty acids, ratio of soluble chemical oxygen demand to total chemical oxygen demand
and soluble protein increased, while particulate protein and particle size of the sludge decreased
with sonication time. An empirical model was developed to determine the economic viability of
ultrasound based on electrical energy input and energy obtained from enhanced methane
production. Ultrasonic pretreatment is only economically viable for primary sludge at low
sonication doses. The Anaerobic Digestion Model # 1 (ADM1) was applied to the batch
anaerobic digestion for sonicated and non-sonicated sludge. The model successfully simulated
the experimental trends.
The efficiency of ultrasound as a pretreatment method for hog manure prior to anaerobic
digestion was also evaluated at specific energies of 250 to 30,000 kJ/kg total solids (TS). This

iv
study confirmed that CODsolubilisation from particulates correlated well with the more labor and
time intensive degree of disintegration test. The particle size distribution for hog manure was
bimodal (0.6 - 2500 µm), while ultrasound primarily impacting particles in the 0.6-60 µm
range. Hog manure is more amenable to ultrasound than waste activated sludge, as it took only
3000 kJ/kgTS to cause 15% more solubilization as compared to 25000 kJ/kg TS for waste
activated sludge. Bound protein degradation during sonication was 13.5% at 5000 kJ/kg TS and
remained constant thereafter for higher energy input. Biomass cell rupture occurred at specific
energy of 500 kJ/kg TS. An economic evaluation indicated that only a specific energy of 500
kJ/kg TS was economical, with a net energy output valued at $ 4.1/ton of dry solids, due to a
28% increase in methane production.
Degradation of odorous compounds in sludge during anaerobic digestion was
systematically studied and simulated using the Anaerobic Digestion Model # 1 (ADM1). The
degradation of various protein fractions (particulate, soluble and bound), VFAs, lipids and amino
acids of PS and WAS were monitored during anaerobic digestion. Degradation kinetics of the
odorous compounds namely, protein, amino acids, lipid and volatile fatty acids (VFAs) were
determined. Relationships between protein fractions and volatile suspended solid were
established. A strong relationship between bound protein, a major odors precursor, and volatile
suspended solid degradation was found, while no statistically significant difference in bound
protein reduction was observed between PS and WAS. ADM1 successfully simulated the lab
scale continuous anaerobic digestion; model results with optimized parameters showed good
agreement with the experimental data for methane production and all other sludge parameters
including odor precursors such as lipids, VFAs and proteins.

v
Keywords: Particle size, casein, anaerobic digestion, hydrolysis kinetics, specific surface area.
Pretreatment; Bound protein; Degree of disintegration; Ultrasound; hog manure, sludge
pretreatment, gas production., odors precursors, cell protein, bound protein, ADM1 model.

vi
CO-AUTHORSHIP
Chapter 3: Modeling the Influence of Particulate Protein Size on Hydrolysis in Anaerobic
Digestion, Saad Aldin, George Nakhla, and Madhumita B. Ray. Saad Aldin was the principal
author of this chapter, with 100% intellectual input, experimental conduction, data analysis,
modeling and writing process. The manuscript was reviewed by Dr. George Nakhla and Dr.
Madhumita B. Ray who provided additional recommendations for improvement. A version of
this chapter has been submitted in Bioresource Technology, 2010,
Chapter 4: Modeling the Effect of Sonication on Biosolids Anaerobic Digestion, Saad Aldin,
Elsayed Elbeshbishy, George Nakhla, and Madhumita B. Ray. Saad Aldin was the principal
author of this chapter, with 100% intellectual input, 90% experimental conduction, 100% data
analysis and modeling and 100% writing process. The manuscript was reviewed by Dr. George
Nakhla and Dr. Madhumita B. Ray who provided additional recommendations for improvement.
A version of this chapter has been published in the Energy&Fuels, 2010, 24 (9), pp 4703–4711
Chapter 5: Impact of Ultrasonication of Hog Manure on Anaerobic Digestability, Elsayed
Elbeshbishy, Saad Aldin, Hisham Hafez, George Nakhla, Madhumita Ray. Saad Aldin was the
second author of this chapter, with 80% intellectual input, 50% experimental conduction, 40%
data analysis and 30% writing process. The manuscript was reviewed by Dr. George Nakhla and
Dr. Madhumita B. Ray who provided additional recommendations for improvement. A version
of this chapter has been published in the Ultrasonics Sonochemistry. 2010, 18, pp 164-171.

vii
Chapter 6: Simulating the Degradation of Odors Precursors in Primary and Waste Activated
Sludge during Anaerobic Digestion, Saad Aldin, Fuzhou Tu, George Nakhla and Madhumita B.
Ray. Saad Aldin was the principal author of this chapter, with 90% intellectual input, 20%
experimental conduction, 90% data analysis, 100% modeling and 95% writing process. The
manuscript was reviewed by Dr. George Nakhla and Dr. Madhumita B. Ray who provided
additional recommendations for improvement. A version of this chapter has been submitted in
the Journal of Hazardous Materials. 2010,
Chapter 7: Development of Anaerobic Digestion Model Software, with 100% intellectual input,
data analysis, modeling, and programming.

viii
ACKNOWLEDGEMENTS
I would like to express my gratitude to Dr. George Nakhla and Dr. Madhumita B. Ray for
being outstanding advisors and excellent professors, for their constructive criticisms and endless
help throughout this study, for their utmost attention to my professional development and
technical writing skills, and for their continuously challenging me to achieve higher goals. Their
constant encouragement, support, and invaluable suggestions made this work possible and
successful. I am also grateful to all of my colleagues for their invaluable support and perceptive
comments.
I would like to express my appreciation to my managers at Trojan Technologies (Dr. Ted
Mao, Dr. Linda Gowman, and Dr. Bill Cairns) for giving me the opportunity, time and funding
to complete this work.
I am deeply and forever indebted to my wife Bushra and my three kids Ayman, Yousir,
and Daniah for their love, support and encouragement throughout my study and my entire life,
may God bless them all.

ix
TABLE OF CONTENT
THE EFFECT OF PARTICLE SIZE ON HYDROLYSIS AND MODELING OF ANAEROBIC DIGESTION .................................................................................................................................... i CERTIFICATE OF EXAMINATION ........................................................................................... ii ABSTRACT................................................................................................................................... iii CO-AUTHORSHIP ....................................................................................................................... vi ACKNOWLEDGEMENTS......................................................................................................... viii TABLE OF CONTENT................................................................................................................. ix LIST OF TABLES........................................................................................................................ xii LIST OF FIGURES ..................................................................................................................... xiv LIST OF ABBREVIATIONS...................................................................................................... xvi CHAPTER ONE ............................................................................................................................. 1
1.1 Background ..................................................................................................................... 1 1.2 Synopsis of Literature ..................................................................................................... 4 1.3 Research Objectives........................................................................................................ 5 1.4 Thesis Organization ........................................................................................................ 7 1.5 Contribution of Thesis .................................................................................................... 9 1.6 References..................................................................................................................... 11
CHAPTER TWO .......................................................................................................................... 15 2.1 Literature Review.......................................................................................................... 15
2.1.1 Introduction........................................................................................................... 15 2.1.2 Anaerobic Digestion Modeling............................................................................. 18 2.1.3 Hydrolysis Modeling ............................................................................................ 25 2.1.4 Particle Size .......................................................................................................... 34 2.1.5 Pre-treatment of Sludge for Anaerobic Digestion ................................................ 40
2.1.5.1 Chemical Pre-treatment (Acids and Bases): .................................................... 41 2.1.5.2 Ozone Pre-treatment ......................................................................................... 43 2.1.5.3 Mechanical Pre-treatment ................................................................................. 43 2.1.5.4 Ultrasound Pre-treatment .................................................................................. 45 2.1.5.5 Odor Precursors ................................................................................................ 50
2.2 Summary and Conclusions ........................................................................................... 54 2.3 References..................................................................................................................... 57
CHAPTER THREE ...................................................................................................................... 72 Modeling the Influence of Particulate Protein Size on Hydrolysis in Anaerobic Digestion ....... 72
3.1 Introduction:.................................................................................................................. 72 3.2 Material and methods.................................................................................................... 78
3.2.1 Culture, Substrate and Media:............................................................................... 78 3.2.2 Batch Anaerobic Digestion:.................................................................................. 78 3.2.3 Analytical Methods:.............................................................................................. 79 3.2.4 Modeling:.............................................................................................................. 80 3.2.5 Statistical Analysis:............................................................................................... 82
3.3 Results and discussion .................................................................................................. 82 3.3.1 Particulate Protein Degradation: ........................................................................... 82 3.3.2 Biogas Production:................................................................................................ 84 3.3.3 Effect of Particle Size on the Hydrolysis Coefficient:.......................................... 87 3.3.4 Hydrolysis Equations and Verification:................................................................ 91

x
3.4 Conclusions:.................................................................................................................. 94 3.5 References..................................................................................................................... 96
CHAPTER FOUR......................................................................................................................... 99 Modeling the Effect of Sonication on Biosolids Anaerobic Digestion......................................... 99
4.1 Introduction................................................................................................................... 99 4.2 Materials and method.................................................................................................. 103
4.2.1 Experimental Set-up: .......................................................................................... 103 4.2.2 Analytical Methods:............................................................................................ 103 4.2.3 Batch Anaerobic Digestion:................................................................................ 105 4.2.4 Specific Energy (SE) Input: ................................................................................ 107 4.2.5 Anaerobic Modeling: .......................................................................................... 107 4.2.6 Statistical analysis:.............................................................................................. 108
4.3 Results and discussion ................................................................................................ 108 4.3.1 Chemical Oxygen Demand (COD):.................................................................... 108 4.3.2 Biological Oxygen Demand (BOD): .................................................................. 109 4.3.3 Proteins: .............................................................................................................. 111 4.3.4 Volatile Fatty Acids (VFA): ............................................................................... 115 4.3.5 Particle Size Distribution: ................................................................................... 117 4.3.6 Methane Production:........................................................................................... 118 4.3.7 Anaerobic Modeling: .......................................................................................... 121 4.3.8 Economic Viability of Ultrasound:..................................................................... 128
4.4 Conclusions................................................................................................................. 130 4.5 References................................................................................................................... 132
CHAPTER FIVE ........................................................................................................................ 137 Impact of Ultrasonication of Hog Manure on Anaerobic Digestability ..................................... 137
5.1 Introduction................................................................................................................. 137 5.2 Material and methods.................................................................................................. 141
5.2.1 Analytical methods ............................................................................................. 141 5.2.2 Protein measurement........................................................................................... 141 5.2.3 Experimental set-up ............................................................................................ 142 5.2.4 Batch anaerobic digestion ................................................................................... 143 5.2.5 Specific energy input .......................................................................................... 143 5.2.6 Degree of disintegration (DD) ............................................................................ 144 5.2.7 COD solubilization ............................................................................................. 144 5.2.8 TKN solubilization.............................................................................................. 144
5.3 Results and Discussion ............................................................................................... 145 5.3.1 Comparison of solubilisation and degree of disintegration ................................ 145 5.3.2 Particle size distribution...................................................................................... 146 5.3.3 Solubilisation of hog manure .............................................................................. 147 5.3.4 Proteins (particulate, bound and cell) solubilisation........................................... 151 5.3.5 Methane production and economics ................................................................... 152
5.4 Conclusions................................................................................................................. 155 5.5 References................................................................................................................... 157
CHAPTER SIX........................................................................................................................... 160 Simulating the Degradation of Odors Precursors in Primary and Waste Activated Sludge during Anaerobic Digestion ................................................................................................................... 160
6.1 Introduction:................................................................................................................ 160 6.2 Materials and methods: ............................................................................................... 163

xi
6.2.1 Analytical methods: ............................................................................................ 164 6.2.2 Anaerobic digestion simulation: ......................................................................... 165 6.2.3 Statistical analysis:.............................................................................................. 165
6.3 Results and discussion: ............................................................................................... 165 6.3.1 Performance of anaerobic digesters: ................................................................... 165 6.3.2 Odorous compounds and odours precursors: ...................................................... 168
6.3.2.1 Volatile Fatty Acids (VFA): ........................................................................... 168 6.3.2.2 Proteins Fractions: .......................................................................................... 170 6.3.2.3 Lipid Degradation: .......................................................................................... 173
6.4 Simulation and kinetics for odor-causing constituent:................................................ 174 6.5 Conclusions:................................................................................................................ 180 6.6 References:.................................................................................................................. 182
CHAPTER SEVEN .................................................................................................................... 185 Anaerobic Digestion Model Software Implementation .............................................................. 185
7.1 Introduction:................................................................................................................ 185 7.2 Reaction System: ........................................................................................................ 188 7.3 The Implementation of the ADM1 and Its Extension................................................. 192
7.3.1 Dynamic State Variables: ................................................................................... 192 7.3.2 Liquid Phase Equations....................................................................................... 194 7.3.3 Gas Phase Equations: .......................................................................................... 195 7.3.4 Liquid-Gas Transfer............................................................................................ 196 7.3.5 Acid-Base Equilibria:.......................................................................................... 197 7.3.6 Determination of pH: .......................................................................................... 199 7.3.7 Inhibition:............................................................................................................ 200
7.4 Software Development: .............................................................................................. 201 7.5 Software Verification:................................................................................................. 205 7.6 References................................................................................................................... 207
CHAPTER EIGHT ..................................................................................................................... 209 Conclusions and Recommendations ........................................................................................... 209
8.1 Conclusions................................................................................................................. 209 8.1.1 Impact of particulate size on hydrolysis: ............................................................ 209 8.1.2 The effect of sonication on biosolids particle size and anaerobic digestion:...... 210 8.1.3 Impact of sonication on high solids sludge (hog manure): ................................. 211 8.1.4 Degradation of odor precursors in primary and WAS during anaerobic digestion: 212
8.2 Recommandations for Future Research:..................................................................... 213 Appendix A: Anaerobic Digestion Model No.1 ......................................................................... 215
9.1 Biochemical process rates........................................................................................... 215 9.2 Acid-base rates:........................................................................................................... 216 9.3 Gas transfer rates......................................................................................................... 216 9.4 Process inhibition........................................................................................................ 216 9.5 Water phase equations ................................................................................................ 217 9.6 Gas phase equations.................................................................................................... 221 9.7 Parameter Description:................................................................................................ 222 9.8 Stoichiometric Matrix ................................................................................................. 225 10.1 Curriculum Vitae ........................................................................................................ 226

xii
LIST OF TABLES
Table 2.1 Hydrolysis rate models (adapted from Pin-Jing et al., 2006). ..................................... 26 Table 2.2 Kinetic coefficients of the first-order rate of hydrolysis in literature. .......................... 32 Table 2.3 Size distribution of organic matter in municipal wastewater (adapted from Levine et al. [72])............................................................................................................................................... 35 Table 2.4 Size of solids in raw sludge (primary sludge)............................................................... 36 Table 2.5 Advantages and disadvantages of sludge pre-treatment for anaerobic digestion ......... 41 Table 3.1 Size distribution of organic matter in municipal wastewater (adapted from Levine et al., 1991). ...................................................................................................................................... 73 Table 3.2 Review of hydrolysis rate constants in literature.......................................................... 74 Table 3.3 Hydrolysis rate models in literature (adapted from Pin-Jing et al., 2006).................... 75 Table 3.4 Gompertz (Lay et al., 1999) model coefficients, median d(50) for the surface area, and specific surface area for different ranges of protein particle sizes................................................ 84 Table 3.5 Hydrolysis rate and the amino acids uptake coefficients for different particle size ranges of protein. .......................................................................................................................... 89 Table 4. 1 Characteristics of the primary and WAS used in the experiment.............................. 105 Table 4. 2 The median, 10%ile and 90%ile for the volume fraction of the primary and WAS. 117 Table 4. 3 Percentage of CH4 increase in primary and waste activated sludge as a function of sonication time. ........................................................................................................................... 120 Table 4. 4 Primary and WAS sludge characterization for ADM1.............................................. 122 Table 4. 5 Predicted and Measured Concentrations (average ± Stdev) of acetic, butyric, propionic acids, and VFA after anaerobic digestion ................................................................................... 125 Table 4. 6 Primary and WAS sludge model parameters at different sonication times. .............. 127 Table 4.7 Specific energy, power and methane energy per ton of COD using the empirical model...................................................................................................................................................... 130 Table 5.1 Particle size and CODsolubilization at different specific energy inputs ........................... 147 Table 5.2 TKNsolubilisation, ammonia and protein solubilisation at different specific energy inputs..................................................................................................................................................... 150 Table 5.3 Ultrasonication and Methane Energy per ton of TS ................................................... 153 Table 6.1 Performance of AD during PS and WAS runs ........................................................... 167 Table 6.2 Average concentrations, and reductions of various protein fractions in PS and WAS..................................................................................................................................................... 170 Table 6.3 Default and optimized ADM kinetic parameters for both PS and WAS sludge......... 177 Table 6.4 Experimental influent and effluent characterization with the ADM prediction for primary and WAS sludge............................................................................................................ 179 Table 7.1. Units used in the ADM1 model ................................................................................. 186 Table 7.2 Nomenclature, description of stoichiometric coefficients .......................................... 186 Table 7.3 Nomenclature, description of equilibrium coefficents and constants......................... 186 Table 7.4 Nomenclature, description of kinetic constants and rates........................................... 187 Table 7.5 Nomenclature, description of dynamic state variables, algebraic variables, and physical reactor parameters......................................................................................................... 187 Table 7.6 Suggested stoichiometric parameters and qualitative sensitivity and variability [1].. 189 Table 7.7 Suggested parameter values and qualitative sensitivity and variability for mesophilic digestion [1]. ............................................................................................................................... 190
xiii
Table 7.8 Soluble components of DAE system dynamic state variables.................................... 193 Table 7.9 particulate components of DAE system dynamic state variables ............................... 194 Table 7.10 Gas components........................................................................................................ 196 Table 7.11 Comparison between the output results of the ADM1-UWO, Batstone et al. [1] and Jeppsson at al. [9]........................................................................................................................ 206

xiv
LIST OF FIGURES
Figure 2.1 Flowchart showing the stages and pathway of anaerobic digestion [8]. ..................... 16 Figure 3.1 Interrelated TCOD flow of Proteins in the Anaerobic Digestion Model No. 1 (ADM1)....................................................................................................................................................... 81 Figure 3.2 Particulate protein degradation for different particles size versus time. ..................... 83 Figure 3.3 Methane production over digestion time using different protein particle sizes. ......... 85 Figure 3.4 First-order hydrolysis rate coefficient as function of (a) surface weighted median diameter (µm) (b) specific surface area (m2/g) ............................................................................. 90 Figure 3.5 Amino acids variation with time for different protein particle sizes........................... 94 Figure 4.1 SCOD/TCOD ratio as a function of specific energy for primary and waste activated sludge. ......................................................................................................................................... 109 Figure 4.2 SBOD/TCOD ratio as a function of specific energy for primary and waste activated sludge. ......................................................................................................................................... 110 Figure 4.3 Particulate protein/TCOD as a function of specific energy for primary and waste activated sludge........................................................................................................................... 112 Figure 4.4 Bound protein/TCOD as a function of specific energy for primary and waste activated sludge. ......................................................................................................................................... 112 Figure 4.5 Soluble protein/TCOD as a function of specific energy for primary and waste activated sludge........................................................................................................................... 112 Figure 4.6 Bound protein / mg VSS as a function of specific energy for primary sludge during anaerobic digestion. .................................................................................................................... 113 Figure 4.7 Bound protein / mg VSS as a function of specific energy for waste activated sludge during anaerobic digestion.......................................................................................................... 113 Figure 4.8 Cell proteins released as a function of specific energy for primary and waste activated sludge. ......................................................................................................................................... 115 Figure 4.9 VFA/TCOD as a function of specific energy for primary and waste activated sludge...................................................................................................................................................... 116 Figure 4.10 Specific surface area (m2/g) as a function of specific energy. ................................ 118 Figure 4.11 Methane yield of the untreated and treated primary sludge over the digestion time..................................................................................................................................................... 119 Figure 4.12 Methane yield of the untreated and treated waste activated sludge over the digestion time ............................................................................................................................................. 119 Figure 4.13 Predicted and measured methane yields for the untreated and treated primary sludge...................................................................................................................................................... 123 Figure 4.14 Predicted and measured methane yields for the untreated and treated WAS sludge...................................................................................................................................................... 124 Figure 4.15. Increase in volume of methane produced in treated primary sludge..................... 128 Figure 4.16 Increase in volume of methane produced in treated WAS. ..................................... 129 Figure 5.1 Relationship between CODsolubilisation and: (a) DDSCOD (%), .................................. 145 Figure 5.2 Particle size distribution for different specific energy inputs.................................... 146 Figure 5.3 Specific energy input for different TS at different degree of disintegrations............ 148 Figure 5.4 Cumulative methane production at different specific energy inputs......................... 153 Figure 6.1 Reduction in PS and WAS in anaerobic digestion (a) TSS (b) VSS (c) TCOD (d) SCOD.......................................................................................................................................... 166 Figure 6.2 Average VFA in PS and WAS. (a) influent concentrations (b) reduction. ............... 169 Figure 6.3 Relationship between VSS degradations and protein fractions during anaerobic digestion for PS and WAS (a) Particulate (b) Bound (c) Cell. ................................................... 172

xv
Figure 7.1 ADM1 Software interface ......................................................................................... 202 Figure 7.2 Percentage composition interface.............................................................................. 203 Figure 7.3 Stoichiometiec parameters interface.......................................................................... 203 Figure 7.4 Kinetics coefficients interface ................................................................................... 204 Figure 7.5 Initial (time = 0) state variables values...................................................................... 204

xvi
LIST OF ABBREVIATIONS
ADM1: Anaerobic Digestion Model No. 1
DD: Degree of Disintegration
AOP: Advanced Oxidation Processes
HRT: Hydraulic Retention Time
MWWT: Municipal Wastewater Treatment
N: Nitrogen
PS Particle Size
PS Primary sludge
PSD Particle Size Distribution
Q: Flow rate
SBOD: Soluble Biological Oxygen Demand
SCOD: Soluble Chemical Oxygen Demand
SS: Suspended Solids
STKN: Soluble TKN
TBOD: Total Biological Oxygen Demand
TCOD: Total Chemical Oxygen Demand
TKN: Total Kjeldahl Nitrogen
TSS: Total Suspended Solids
TS: Total Suspended
V: Volume
VFA: Volatile Fatty Acid
VSS: Volatile Suspended Solid
VS: Volatile Suspended
WAS: Waste Activated Sludge
WWT: Wastewater Treatment
WWTP: Wastewater Treatment Plant

1
CHAPTER ONE
1.1 Background
Municipal wastewater treatment is an important part of modern society as it
reduces the amount of organic matter and the number of pathogens discharged to water
streams. Unfortunately, wastewater treatment also generates large quantities of sludge.
The treatment and disposal of sludge is recognized as the most expensive part of
municipal wastewater treatment and the most complex problem facing the industry [1].
Sludge management includes pumping, grinding, screening blending, thickening,
digestion, conditioning, dewatering and disposal.
Typically large-scale wastewater treatment plants employ conventional activated
sludge (CAS) and generate two main types of sludge: primary and waste activated sludge
(WAS). Primary sludge consists of settleable organic and inorganic matter, which has a
very offensive odor and is readily biodegradable. WAS consists of the heterotrophic
bacteria settled in secondary clarifier. It is difficult to degrade due to the large amount of
energy required to rupture the bacteria cell envelope. Raw wastewater characteristics and
particle removal efficiencies vary, resulting in a wide range of particle sizes in primary
effluents [3].
Anaerobic digestion (AD) is the most popular sludge stabilization process. The
advantage of this process includes the production of methane which can be used as an
energy source, the low production of waste sludge and potentially high organic loading
rates. AD is a complex biotechnological process capable of converting almost all types
of organic materials into methane, carbon dioxide and stabilized sludge [4]. The physico-

2
chemical processes of AD are not biochemically mediated and include the ion
association, dissociation, gas-liquid transfer, and mixing pattern [5, 6, 7]. The
biochemical extracellular solubilization steps are divided into disintegration and
hydrolysis, of which the first is a largely non-biological step that converts composite
particulate substrate to individual components such as carbohydrates, proteins, lipids, and
inerts. The second step is enzymatic hydrolysis of particulate carbohydrates, proteins and
lipids to glucose, amino acids, and long chain fatty acids [7]. A separate group of
acidogenic bacteria degrade glucose, amino acids, and long chain fatty acids to mixed
organic acids, hydrogen, and carbon dioxide. The organic acids are subsequently
converted to acetate, hydrogen, and carbon dioxide by acetogenic groups that utilize
butyrate, valerate, and propionate. The hydrogen produced by these organisms is
consumed by hydrogen-utilizing methanogenic bacteria, and the acetate by aceticlastic
methanogenic bacteria.
Particle size and particle composition determine the rate and mechanism of
hydrolysis and degradation in wastewater treatment [3]. Most of the biodegradable
organic matter ranges from 10-3 to 100 µm. Microorganisms can directly take up particles
that are smaller than 10-3 µm [8, 9]. It is also important to mention that the reaction rates
vary widely based on the type of sludge or substrate used. Although the hydrolysis of
particulate organic material has been considered the rate-limiting step in anaerobic
digestion [10], some authors have emphasized that the hydrolytic process still remains as
the least defined step [11, 12].
Rapid and complete stabilization of WAS via AD has not been fully achievable
due to the rate-limiting hydrolysis of large organic molecules associated with microbial
3
cells. Recent studies have indicated that activated sludge has a more complex floc
structure than first realized. It is comprised of different groups of microorganisms,
organic and inorganic matter agglomerated together in a polymeric network formed by
microbial extracellular polymeric substances (EPS) and cations [13, 14].
Improvement of biodegradability of sludge via AD depends on enhancement of
the disintegration of the floc structure, thus increasing the accessibility to both
intracellular (within the microbial cell) and extracellular (within the polymeric network)
materials before sludge is sent to anaerobic digesters. Such pretreatment processes aim to
disrupt the bacterial cell wall and breakdown the large particles, i.e., solubilization of
particulate matter and consequentially increasing the amount of organic material
available for digestion. Examples of pretreatment options that have been shown to
enhance anaerobic digestion include chemical [15-17], mechanical [18, 19], and
ultrasound pretreatment [20–24].
Mathematical models of biological sludge treatment systems are useful tools for
simulation and design. Although simple models have been successfully applied to
conventional systems, such as the activated sludge process, simple models are not
satisfactory for describing the dynamic behavior of complex anaerobic systems [25]. It is
necessary to apply more sophisticated structured models. Structured models consider the
biomass and substrate to be divided into several components with each biomass
mediating and transferring particular substrate. Structured models are very significant in
the design and application of anaerobic treatment process. Because of the slow growth of
anaerobic bacteria, experiments require a long time. However, a correctly constructed
and calibrated structure model can rapidly predict system performance and simulate the
4
system response to operational changes. Models can be helpful in designing, explaining,
and extrapolating experimental results. Also the development of a hydrolysis model that
accounts for the impact of particle size is required to improve the understanding of the
hydrolysis rate and subsequently for developing more efficient AD designs.
1.2 Synopsis of Literature
In the past few decades there have been many studies on AD, and the parameters
that affect and enhance the process dynamics. Several approaches to mathematically
model this complex process were investigated with various advantages and
disadvantages.
Hydrolysis has been considered the rate-limiting step in AD, yet some authors have
emphasized that the hydrolytic process still remains as the least defined step. Hydrolysis
is well documented to be a function of specific surface area among other variables [26].
Studies on the effect of particle size on hydrolysis and its mathematical relationship are
sparse, as most of the studies reported the hydrolysis rate coefficient as a single value and
not a function of particle size. No study has addressed the effect of particle size
distribution (full spectra distribution) on the hydrolysis rate coefficient.
The literature on odor production from anaerobically digested biosolids has been
inadequate [27]. Although H2S is considered to be the most prevalent odorous compound,
there are typically other organic odorous compounds in AD, such as mercaptans and
amines. Prior research has implicated volatile sulfur compounds (VSCs) including
hydrogen sulfide (H2S), methanethiol or methyl mercaptan (MT), dimethyl sulfide

5
(DMS), dimethyl disulfide (DMDS) and dimethyl trisulfide (DMTS) in odors from
biosolids [28]. Laboratory tests have indicated that protein degradation and, especially
the degradation of methionine, an amino acid, is the main source for the production of
VSCs [28]. Literature on proteins during AD is both sparse and contradictory; in most
studies total protein degradation was only reported under controlled conditions. No
systematic study has been conducted on the degradation of various fractions of protein in
conventional AD of sludge.
Various mechanical disintegration methods have been applied to the pretreatment
of biosolids to enhance the rate and extent of AD. Sonication is a method for the break-up
of microbial cells to extract intracellular material [29]. While most of the studies using
ultrasound energy have focused on the dewaterability and solubilization of chemical
oxygen demand (COD), there is a definite paucity on information related to the impact of
sonication on other biosolids characteristics like odors precursors such as proteins as well
as anaerobic biodegradability.
1.3 Research Objectives
Based on the above, the primary objective of this research is to develop a process
model that integrates sonication pretreatment and anaerobic digestion incorporating the
impact of sonication on particle size and subsequently the impact of particle size on
biodegradation kinetics.
The proposed research will specifically examine the effect of particle size on the
hydrolysis of municipal primary and secondary sludges and anaerobic sludge

6
biodegradability. The aim is to develop an integrated mathematical model that describes
the effect of particle size on the anaerobic hydrolysis rate coefficient process, as well as
its overall impact on the anaerobic digestion process. Primarily this can be done by the
reduction of particle size through pretreatment which can alter the particle size
distribution of the particulate substrates. More specifically, the objectives of this study
and how they relate to the areas of further research identified above are:
1. Anaerobic modeling is complex and severely compromised with hydrolysis
modeling of single size particles: In this study, the following goals will be realized
o Assessment of particle size effect on hydrolysis rate coefficient
o Development of a mathematical/kinetic model of the hydrolysis phase of
anaerobic digestion as a function of particle size.
o Application and validation of the developed model.
2. Relatively low digestion efficiency: This study aims at investigating sonication as a
pretreatment technique in greater depth through the following;
o Assessment of sonication as a particle size reduction method for sludge.
o Evaluation of the effect of sonication on various characteristics of primary and
secondary sludge, specifically the effect on solubilization, VFA and various
fractions of proteins, and subsequent anaerobic biodegradability.

7
o Evaluation of the performance of batch anaerobic digesters using sonicated
primary and waste activated sludge.
3. Inadequate information on odor and odor precursors: The goals of this study are:
o Investigation of the degradation of various odor precursors during
conventional anaerobic digestion of primary and was activated sludge.
o Investigation of the effect of sonication on odor precursors, primarily various
fractions of proteins, both during sonication and anaerobic digestion.
1.4 Thesis Organization
This thesis comprises of eight chapters and conforms to the “integrated-article”
format as outlined in the Thesis Regulation Guide by the School of Graduate and
Postdoctoral Studies (SGPS) of the University of Western Ontario. A review of literature
including background and a thorough assessment of information on anaerobic digestion
models, hydrolysis models and pretreatment methods is presented in Chapter 2.
Chapter 3 demonstrates the effect of particulate protein particle size on anaerobic
digestion and the influence of particulate size distribution on the anaerobic hydrolysis
rate coefficients. Mathematical relationships that correlate the hydrolysis rate coefficient
as a function of surface weighted median diameter and specific surface area are
illustrated along with the development and verification of a more comprehensive
hydrolysis kinetic model that takes particle size into consideration.

8
Chapter 4 presents the impact of ultrasound pretreatment on various protein
fractions in primary sludge, waste activated sludge and hog manure and their anaerobic
biodegradability. The effect of ultrasound on particle disintegration anaerobic digestion
coefficients, and gas production was also determined and presented as well as an
empirical model was developed to assess the economical viability of ultrasound based on
electrical energy input versus energy obtained from additional methane gas produced.
Chapter 5 discusses the impact of ultrasound pretreatment on solubilisation and
anaerobic biodegradability of hog manure with a much higher solid content and wider
range of particle sizes than primary and waste activated sludge, with particular emphasis
on the effect of ultrasound on proteins solubilisation, especially bound protein.
Additionally, a correlation between standardized and easy-to-measure solubilization
parameters and the laborious and expensive method of degree of disintegration was
presented.
Chapter 6 presents the degradation of various protein fractions (particulate, soluble,
and bound) of primary and secondary municipal sludge during anaerobic digestion,
illustrate the relationship between various protein fractions and other sludge quality
parameters, simulates the odors precursors (namely, protein, amino acids and volatile
fatty acids) degradation, and estimates the anaerobic degradation kinetics,
Chapter 7 presents the development of the anaerobic digestion model software;
model and code calibration; and software application.
Chapter 8 summarizes the major conclusions of this research and provides
recommendations for future research directions based on the findings of this study.

9
1.5 Contribution of Thesis
Canada has over 700 mostly small and medium-sized water and wastewater firms
with annual sales totaling $1.4 billion, 40% of which is related to water and wastewater
treatment. Currently, most medium and large size wastewater treatment plants employ
anaerobic digestion of sludge to reduce pathogens, stabilize organic matter, and produce
biogas. Unfortunately, despite extensive work on digester design, the efficiency of
volatile solids destruction is limited to about 40-45% only.
The increasing quantity of municipal sewage sludge, the level of their treatment,
and the requirements concerning the conditions of neutralization and their ultimate
disposal are of serious concern in Canada and many parts of the world. For example,
about seven million dry tons of wastewater solids are produced annually in the United
States alone. With the implementation of stringent regulations on sludge disposal and
closure of more landfills, sludge management is becoming a difficult task. A point in
consideration is the on-going discussion over Toronto’s garbage disposal to Carleton
Farms landfill site in Port Huron, Michigan. Wastewater treatment plants are
consequently forced to develop new and more effective sludge management strategies,
and the proposed research is targeted towards this objective. The proposed work aims to
enhance the anaerobic digestion efficiency by determining the effect of particle size on
the rate-limiting step in the anaerobic digestion. In addition the study aims to reduce the
volume of anaerobic digester; produce a greater amount of useful biogas, and lower the
volume of sludge for final disposal by applying a feasible pre-treatment technique based
on advanced oxidation processes (AOP). Moreover, another objective is to

10
mathematically verify the anaerobic digestion activity by applying a user-friendly
anaerobic digestion model.

11
1.6 References
[1] Metcalf and Eddy, Wastewater Engineering: Treatment Disposal Reuse, 2003, 4th
ed. McGRAW-HILL
[2] Tchobanoglous, G.; Burton, F.L.; Stensel, H.D. Wastewater Engineering, Treatment
and Reuse, 4th Edition. McGraw-Hill, Inc., New York. 2003, 1819.
[3] Morgenroth, E.; Kommedal, R.; Harremoës, P. Processes and modeling of
hydrolysis of particulate organic matter in aerobic wastewater treatment – a review,
Water Sci. Technol., 2002, 6, 25–40
[4] Chynoweth, D.; Pullammanappallil, P. Anaerobic digestion of municipal solid
waste in microbiology of solid waste. CRC Press, Boca Raton, FL. 1996, 71-113.
[5] Vavilin, V.; Rytov, S.; Lokshina, L.; Rintala, J.; Lyberatos, G. Simplified hydrolysis
models for the optimal design of two-stage anaerobic digestion. Water Research,
2001, 35 (17), 4247-4251.
[6] Kalyuzhnyi, S. Modeling of anaerobic digestion. Water Sci. Technol. 2001, 624,
22-23.
[7] Batstone, D. J.; Keller, J.; Angelidaki, I.; Kalyuzhnyi, S. V.; Pavlostathis, S. G.;
Rozzi, A.; Sanders, W. T. M.; Siegrist, H.; Vavilin, V. A. Anaerobic Digestion
Model No. 1, IWA Task Group for Mathematical Modelling of Anaerobic
Digestion Processes, Water Sci. Technol. 2002, 10, 65–73.
[8] Ferenci, T. The recognition of maltodextrions by E.coli. Eur. J. Biochem., 1980,
108, 631–636.

12
[9] White, D. The physiology and biochemistry of prokaryotes, Second edition, Oxford
University Press Inc., New York, 2000.
[10] Pavlostathis, S.; Giraldo-Gomez, E. Kinetics of anaerobic treatment. CRC Crit.
Rev. Environ. Contr., 1991, 21, 411–490.
[11] Miron, Y.; Zeeman, G.; van Lier, J.; Lettinga, G. The role of sludge retention time
in the hydrolysis and acidification of lipids, carbohydrates and proteins during
digestion of primary sludge in CSTR systems. Water Research. 2000, 34, 1705–
1713.
[12] Gavala, H.; Angelidaki, I.; Ahring, B.; Kinetics and modelling of anaerobic
digestion process. Adv. Biochem. Eng. Biotechnol, 2003, 81, 57–93.
[13] Li, A. and DiGiano, F. The availability of sorbed substrate for microbial
degradation on granular activated carbon, paper presented at the 53rd Annual Water
Pollution Control Federation Conference, Las Vegas, Nevada, 1980.
[14] Higgins, M.; Glindemann, D.; Novak, J.; Murthy, S.; Gerwin, S.; Forbes, R.
Standardized biosolids incubation, headspace odor measurement and odor
production consumption cycles. Proceedings Water Env. Federation and AWWA
Odors and Air Emissions Conference, Bellevue, Washington, 2004.
[15] Lin J.G. and Chang C.N. Fenton process for treatment of desizing wastewater,
Water Research. 1999, 31, 2050–2056.
[16] Yasui, H.; Nakamura, K.; Sakuma, S.; Iwasaki, M.; Sakai, Y. A full scale
operation of a novel activated sludge process without excess sludge production.
Water Sci. Technol. 1996, 34, 395-40.

13
[17] Tanaka, S. Effects of thermochemical pre-treatment on the anaerobic digestion of
waste activated sludge. Water Sci. Technol. 1997, 35, 209-215.
[18] Nah, I. W. Mechanical pre-treatment of waste activated sludge for anaerobic
digestion process. Water Research. 2000, 34, 2362-2368.
[19] Flint, E.B. and Suslick, K.S. The temperature of cavitation, Water Science 1991,
253, 1397–1399.
[20] Suslick, K. Sonochemistry. The temperature of cavitations. Science. 1991, 253,
1397–1399.
[21] Kuttruff, H. Ultrasonics Fundamentals and Applications. Essex, England.1991.
[22] Wang, F.; Shan, L.; Ji, M. Components of released liquid from ultrasonic waste
activated sludge disintegration, Ultrason. Sonochem. 2006, 13, 334–338.
[23] Jeffrey, P.; Brown, P.; Hogan, F. Ultrasonic solids treatment yields better
digestion. WERF, Biosolids Technical Bulletin. 2003
[24] Gronroos, A.; Kyllonen, H.; Korpijarvi, K.; Pirkonen, P.; Paavola, T.; Jokela, J.;
Rintala, J. Ultrasound assisted method to increase soluble chemical oxygen demand
(SCOD) of sewage sludge for digestion, Ultrason. Sonochem. 2005, 12, 115–120.
[25] Lyberatos, G. and Skiadas, I.V. Modelling of anaerobic digestion – A review.
Global Nest: the Int. J. 1999, 2, 63-76
[26] Sanders, W.; Geerink, M.; Zeeman, G.; Lettinga, G. Anaerobic hydrolysis kinetics
of particulate substrates. Water Sci. Technol., 2000, 41, pp17–24.

14
[27] Higgins, M.; Adams, G.; Chen, Y.; Erdal, Z.; Forbes, R.; Glindemann, D.;
Hargreaves, J. McEwen, D.; Murthy, S.; Novak, J.; Witherspoon, J. Role of
protein, amino acids, and enzyme activity on odor production from anaerobically
digested and dewatered biosolids, Wat. Environ. Res., 2008, 80, 127.
[28] Higgins, M.; Adams, G.; Chen, Y.; Erdal, Z.; Forbes, R.; Glindemann, D.;
Hargreaves, J. McEwen, D.; Murthy, S.; Novak, J.; Witherspoon, J. Relationship
between biochemical constituents and production of odor causing compounds from
anaerobically digested biosolids, WEF and AWWA Odors and Air Emissions 2004
Conference, Washington, USA, 2004, 18-24.
[29] Harrison, S.T.L., Bacterial cell disruption: a key unit operation in the recovery of
intracellular products, Biotechnol, 1991, 9, 217–240.

15
CHAPTER TWO
2.1 Literature Review
2.1.1 Introduction
Anaerobic digestion (AD) is a complex biotechnology system capable of
converting most organic materials into methane, carbon dioxide and stabilized sludge [1],
which also reduces pollution and recovers fuel gas from municipal, industrial and
agricultural wastes [1, 2, 3]. Different groups of microorganisms are responsible for
conversion of organic carbon into its most reduced form (methane) and its most oxidized
form (carbon dioxide) [4, 5]. During this conversion a variety of microorganisms grow
and produce reduced end-products [6, 7]. AD involves series of metabolic interactions
among various groups of microorganisms undergoing different biochemical processes as
described in Figure 2.1 [8]. Biochemical processes are catalyzed by intracellular and
extracellular enzymes. Disintegration and depolymerization of the waste are extracellular
processes, and subsequent digestion of the soluble materials by the microbial consortia is
an intracellular processes resulting in the growth and decay of the organisms [8].
Biochemical extracellular processes involved in extracellular solubilization steps are
divided into disintegration and hydrolysis, of which the first is a largely non-biological
step that converts composite particulate substrate to carbohydrates, proteins, and lipids,
and inerts. The second step is enzymatic hydrolysis that hydrolyzes particulate
carbohydrates, protein, and lipids to soluble forms glucose, amino acids and long chain
fatty acids, respectively. Biochemical intracellular processes involve separate groups of
acidogenic bacteria that degrade glucose, amino acids and long chain fatty acids to mixed
organic acids, hydrogen, and carbon dioxide. The organic acids are subsequently

16
converted to acetate, hydrogen, and carbon dioxide by acetogenic bacteria groups that
utilize butyrate and valerate, and propionate. The hydrogen produced by these organisms
is consumed by hydrogen-utilizing methanogenic bacteria, and the acetate by aceticlastic
methanogenic bacteria to produce methane and carbon dioxide. The physico-chemical
processes of AD that are not biologically mediated include ion association, dissociation,
gas-liquid transfer, and mixing [8, 9, 10, 11, 12, 13, 14, 15].
Figure 2.1 Flowchart showing the stages and pathway of anaerobic digestion [8].

17
Anaerobic sludge digestibility is strictly dependent on the origin of the sludge in
the wastewater treatment plant. Waste activated sludge (WAS) is more difficult to digest
than primary sludge due to the rate-limiting cell lysis step. The cell wall and the
prokaryote membrane are composed of complex organic materials that are not readily
biodegradable [16]. Consequently, the reduction of volatile solids is more pronounced in
primary sludge digestion than in secondary sludge digestion [17]. One way of improving
WAS hydrolysis and anaerobic digestion performance is to use cell lysing pre-treatments.
Waste activated sludge disintegration can be defined as the modification of biomass
structure by external forces in order to enhance the possibility of substrate release.
Several disintegration pre-treatments such as mechanical, thermal, chemical, or biological
exist; these forces can be physical, chemical, or biological in nature. The first effect is the
disaggregation of the flocs, without disrupting the cells [17]. The separation of the sludge
flocs is characterized by an intense particle size reduction, but the release of organic
components into the sludge liquid phase is consequently poor [16]. Increasing energy
input, the microorganism’s cell walls are broken down, and the intracellular material is
released [18]. Disintegration pre-treatment has been investigated over the last decade [19,
20, 21, 22, and 23].
In the following sections a comprehensive literature review on the topics of AD
modeling, hydrolysis modeling, effect of particle size on AD, solids pre-treatment
methods, and odor precursors will be illustrated and discussed.

18
2.1.2 Anaerobic Digestion Modeling
Several approaches have been developed for AD modeling. Each of these models
has advantages and disadvantages. Their applicability is limited by time, expertise
(knowledge of the process structure), and available data. The models developed are
generally applicable for specific cases. The black box type models do not explain the
processes and lack the robustness to model the complex digestion process property. The
development of generic dynamic models based on the process dynamics and application
as well as the extension of the models for different cases, such as different reactor types,
environmental conditions, and organic waste types for AD is needed [3, 8].
The first dynamic model was developed by Andrews [24]. In this model, constant
pH was assumed. This model consisted of a single substrate (un-ionized acetic acid) and
single biomass (acetate utilizing methanogens). Nevertheless, it was the first model to
incorporate the inhibitory effect of high un-ionized volatile acid concentration on the
growth of methanogens. The general Monod type kinetic equation was used to express
the growth of methanogens and was modified by including the inhibition function.
Hill and Barth [25] enhanced Andrews’s model by adding the second bacterial
group for acid formation and incorporated hydrolysis. They also added the carbonate
equilibrium, nitrogen balance, cation exchange and inhibition of the methane formation
by ammonia and volatile fatty acids (VFA). Their model considers three substrates and
two kinds of microorganisms (acid formers and methanogens). The model includes the
inhibitory effect of high concentration of volatile acids on both acid formers and
methanogens, the inhibitory effect of high ammonia levels on the growth of
methanogens, and decay of biomass.
19
Eastman and Ferguson [26] developed a model for sludge digestion, which
considered the hydrolysis of particulate substrate rather than methanogenesis as the rate-
controlling step. The system used in their study was a continuous stirred tank reactor
(CSTR). Primary sewage sludge was the substrate used. In this model, the acidogenic
phase included both the hydrolysis and digestion stages. The substrate pathway was
described as the biodegradable solids hydrolyzed to smaller soluble molecules, then the
soluble molecules are converted to digested products by the acid-forming bacteria. The
main assumptions made in this model were: (1) cell decay contributes to the pool of
digested products; (2) nitrate, and sulfate concentrations are negligible; and (3) electron
acceptors consist solely of organics and carbon dioxide. Substrate was expressed as
chemical oxygen demand (COD) to facilitate mass balance calculations. Hydrolysis
kinetics under constant pH and temperature were expressed by the first-order equation
with respect to the particulate biodegradable COD. Eastman and Ferguson [26] found that
the hydrolysis constant to be 3 h-1, growth yield coefficient to be 0.48 gCOD of VSS/
gCOD, and decay coefficient to be 0.018 h-1.
Mosey [27] developed an AD model with four different bacterial groups and
included the hydrogen gas in the digestion of acetic, butyric and propionic acids in
addition to the conversion of propionic and butyric acids to acetic acid [13]. This model
was the first one that incorporates the dissolved hydrogen gas. Two years after the
development of this model Rozzi et al. [28] modified Mosey’s model by using hydrogen
partial pressure instead of the dissolved hydrogen gas equations introduced by Mosey.
Due to the complexity of the numerical integration problem, Rozzi et al. [28] kept pH

20
constant in the course of their simulation. Both the Morsey’s and Rozzi’s models were
applied only to glucose as a soluble substrate.
Bryers [29] developed an anaerobic model that considers only one kind of
methanogenic biomass but used two kinetic expressions for converting acetic acid and
hydrogen respectively to methane. This model did consider the role of propionic acid
utilizing bacteria by individually specifying the bacterial concentration, as the acid is an
important intermediate and has a significant effect on the stability of that system.
Pavostanthis and Gossett [30] proposed a model where sludge composition is
more detailed than the one illustrated by Eastman and Ferguson [26]. This model
assumed that the biodegradable fractions of the activated sludge are all viable organisms.
This biochemical oxygen demand (BOD) fraction is of two kinds soluble and particulate.
Upon microbial death immediate release of the intracellular soluble BOD will occur. At
the same time the dead cell particulate BOD is solubilized by extracellular hydrolysis
induced by the active biomass in the digester, resulting in an increase in the soluble BOD
for subsequent utilization by the acid-forming bacteria. The model takes into account the
classical two-stage anaerobic pathway constituted by acidogenesis and methanogenesis.
The proposed model is rather complex due to the large number of parameters to be
assessed. One other issue in this model is that the two processes of biomass death and
lysis are theoretically different in terms of final products. The authors reported
unsuccessful attempts of measuring cell lysis rates, thus leading to combine of the two
processes into a single death/lysis step and no lag phase between death and lysis on one
hand and release of all intercellular on the other hand. A first-order empirical equation

21
was used for the hydrolysis process of the biodegradable particulate BOD. Cell decay
constant was found to be 2 d-1, while the hydrolysis constant was found to be 0.15 d-1.
Shimizu et al. [31] proposed a model that considered the hydrolysis of
intracellular biopolymers as the rate limiting step in the AD process. This model assumed
that as hydrolysis of the cell walls and membrane proceeded, intracellular high
biopolymers are released in the bulk phase. These compounds are then hydrolyzed by
extracellular enzymes to volatile organic acids (acetic, propionic, butyric, valeric and
caproic acids). Higher fatty acids are converted to acetic acid by the B-oxidation process
[31]. In the final stage of the digestion process, acetic acid, hydrogen and carbon dioxide
are converted to methane. In order to reduce model complexity, the aforementioned
authors used the first-order kinetics for all reactions i.e, sludge solubilization, hydrolysis
of intracellular polymers, conversion of higher fatty acids to acetic acid and H2, and
methanogenesis.
Angelidaki et al. [32] developed a model where the substrate composition was
defined by its organic (carbohydrates, lipids, and proteins), inorganic components
(ammonium, phosphate, cations, and anions), and their degradation intermediates
(volatile fatty acids). Carbohydrates are included in the model as particulate, soluble, and
inert fractions; the particulate is hydrolyzed to soluble carbohydrates, which are then
converted to volatile fatty acids by acidogenic bacteria. Lipids were expressed as glycerol
trioleate which is converted to long chain fatty acids by acidogenic bacteria. The long
chain fatty acids are then degraded to acetate and H2 by acetogenic biomass. Proteins
were modeled as gelatin and were considered to be composed of particulate, soluble, and
inert fractions. The particulate components are hydrolyzed to amino acids that are
22
converted in the subsequent degradation step to acetate, propionate, butyrate, and
valerate. The hydrolysis step was modeled by a first-order equation; the authors have
used the first-order based on the results of previous studies [33, 34], which demonstrated
that first-order kinetic model is the best for describing the complex chemical-biological
interactions of the AD system. The first-order equation was also used to model the
biomass decay. All of the biological processes (uptake and substrate degradation) are
kinetically represented by a Monod equation, including a limiting term for ammonia
nitrogen as nutrient for biomass growth. The effects of pH and temperature are taken into
account in the process kinetics.
Vanvilin et al. [16] developed a multi-component, multi-species model called
“METHANE” that takes the processes of hydrolysis, acidogenesis, acetogenesis and
methanogenesis conducted by various groups of microorganisms as well as the gaseous
phase into account. The model uses a system of differential equations for three groups of
variables as suspended organic matter, soluble components and gaseous phase
components. It also considers the four basic stages of the AD i.e. hydrolysis,
acidogenesis, acetogenesis and methanogenesis together with lysis and hydrolysis of cell
biomass. Additionally, substrate limitation and inhibition functions are taken into account
in the model.
Siegrist et al. [9, 35] developed a model, for mesophilic and thermophilic
digestion of sewage sludge based on the reaction proposed by Gujer and Zehnder [36].
The model considers the CSTR reactor and takes into account the variation in digested
sludge and biogas composition. In addition to the biogas and hydrolysis of the particulate
COD, six substrate processes are considered: amino acid digestion, sugar digestion,

23
LCFA, intermediates (propionic), acetotrophic methanogenesis, and hydrogenotrophic
methanogenesis. The model also includes six processes of cell decay for the microbial
groups catalyzing the bioconversion processes. Chemical equilibrium for the dissociation
of bicarbonate, ammonium, acetic and propionic acids is taken into account in evaluating
pH. Siegrist et al. [35] used the first-order equations for hydrolysis kinetics of particulate
organic material and the biomass decay process. Other kinetics was expressed by a
Monod type equation modified to take the inhibition into account.
Batstone et al. [8] introduced the Anaerobic Digestion Model Number 1 (ADM1).
The aim of the model was to provide a tool that overcomes the limitation of the models
developed over the last few decades that were basically attributed to their specificity. Due
to this focus, some peculiar and specific aspects were not included in order to obtain an
easy-to-use model. This model therefore can be taken as a platform for applications to
specific processes [37]. This model classifies the complex system of the anaerobic
conversion process into two main groups: (1) Biochemical reactions are governed by
intracellular or extracellular enzymes that act on the organic substances. The
disintegration of the particulate compounds, and their hydrolysis, which produces soluble
monomers, are extracellular reactions. The degradation of the soluble substances is
instead a process that occurs inside the bacterial cells and results in biomass growth, and
(2) Chemical-physical reactions are not biologically catalyzed and include the processes
of ionic association/dissociation, and gas-liquid mass transfer. Biochemical reactions are
considered irreversible processes, while physical-chemical reactions are considered
reversible systems. Biochemical equations are the heart of the model that represents the
biological system. Physical-chemical reactions are considered to describe the effect of the
24
state variables (such as pH and gases concentration) on the anaerobic process. The
complex substances are initially disintegrated to obtain particulate carbohydrates, lipids,
proteins, and inert material. The model assumes inactive biomass derived from the
cellular decay process increases the fraction of particulate composite substances. In the
following hydrolysis stage, the particulate carbohydrates, lipids, and proteins are
converted into their soluble forms of monosaccharides, long chain fatty acids and amino
acids, respectively, which are metabolized by the acidogenic bacteria and converted to
organic acids (propionate, valerate, butyrate and acetate) and hydrogen. The acetogenic
bacteria will then metabolize the organic acids and convert them to acetic acid and
hydrogen. The latter are further transformed by methanogenic bacteria to methane and
carbon dioxide. A schematic representation of the metabolic pathways is shown earlier in
Figure 2.1. The ADM1 model assumes all extracellular processes follow the first-order
kinetics, the cellular decay processes are also described by the first-order kinetics
equations that are dependent on the microbial concentration. The substrate utilization
rates are expressed by Monod type kinetics, and they are expressed in terms of substrate
consumption and not microbial growth, with the aim of simplifying the implementation
of the inhibition functions. In addition to pH inhibition for all the bacterial groups,
hydrogen inhibition for the acetogenic bacteria and free ammonia inhibition for the
acetoclastic methanogens are also included in the model. The chemical-physical
processes are important in modeling the anaerobic systems as they express the inhibiting
factors for the biological reactions and quantify some variable parameters (gas flow rate,
alkalinity, and pH). The gas phase in this model contains carbon dioxide, methane, and
hydrogen. Henry’s law is used to describe the gas–liquid equilibrium for the diluted

25
liquid phase. Carbon dioxide and ammonia are considered as acids and bases present in
the free form. More details on the model parameters, dynamic variables, state variables,
reaction equations, gas-phase equations, liquid-phase equation, acid-base equations, pH
and inhibition equations, stoichiometric matrix and model development will be illustrated
and discussed in chapter seven and appendix A.
2.1.3 Hydrolysis Modeling
The term hydrolysis means the solubilization of a defined particulate
macromolecular substrate to its soluble monomers [8]. Hydrolysis is a slow process that
depends on the nature of the particulate matter and size. Hydrolysis governs the rate of
the whole anaerobic process and its lag time during start-up [26, 33, 36]. Although,
methanogenic bacteria are highly sensitive to environmental conditions [38], previous
studies [33, 39] on anaerobic sludge digestion found that methanogenesis is not always
the rate-limiting step. The anaerobic degradation of complex substrates requires the
viable fraction of the sludge to be first converted to suitable substrates for the anaerobic
microorganisms. The hydrolysis of complex organics to soluble substrates, which
provides the substrate for the acidogenic bacteria, also determines the availability of
substrate for methanogens, as acidogenesis kinetics is one order of magnitude higher than
methanogenesis. When a process is composed of a sequence of reactions, the overall rate
is determined by the slowest reaction, named the rate-limiting step [25]. The rate-limiting
step in anaerobic digestion with suspended organic matter is normally considered to be
the hydrolysis of solids [40].

26
Simplified models for hydrolysis kinetics have been proposed including first-
order, or saturation type kinetics [41]. Table 2.1 displays the various hydrolysis kinetic
models available in the literature. Most of these models have been developed for specific
situations with either very high or very low substrates to microorganism ratio.
Table 2.1 Hydrolysis rate models (adapted from Pin-Jing et al., 2006).
Name Expression ( dtdS− ) References
Chemical first-order Skh Eastman and Ferguson [26]
Biological first-order SBkh Valentini et al. [42]
Half-order biomass kinetics 5.0SBkh Rozzi and Verstraete [28]
A-order biomass kinetics A
hSBk Valentini et al. [42]
Michaelis–Menten equation ( )SKSBk sh + Valentini et al. [42]
Monod equation ( )[ ]SKYSB s +maxµ Hobson [43]
Haldane equation ( )[ ]is KSSKYB //1max ++µ Andrews and Graef [24]
Contois model ( )SBKSBk sh + Henze [2]
Chen–Hashimoto model ( )[ ]SSSKSBk osh +− Chen and Hashimoto [44]
Two phase model ( )( )[ ]BKSKSBk Bsh ++ Vavilin et al. [45]
Step diffusion equation ( )[ ] 5.02max SSk oh −+ν Cecchi et al. [46]
Shrinking core model BkdtdBSk hoh −=φφ ,3 2Negri et al. [47]
Flux model ρBSk surfh Terashima and Lin [26]
Surface based kinetics model surfhSk Sanders et al. [48]

27
where, A is the exponent in the A-order biomass kinetic equation;
B is the concentration of biomass or enzyme (mol/l);
KB is the saturation constant for biomass or enzyme (mol/l);
kh is the hydrolysis rate constant (h-1);
Ki is the inhibition constant for the i inhibitory agent (mol/l);
KS is the saturation constant for the substrate (mol/l);
S is the substrate concentration (mol/l);
So is the initial substrate concentration (mol/l);
Ssurf is the surface area of the organic solid (cm2);
vmax is the maximum hydrolysis rate (mol/ l h);
φ is the dimensionless particle radius, equal to the ratio of the radius of the particle at
time t to the initial radius of the particle
Y is the growth yield coefficient;
µmax is the maximum specific growth rate (h-1);
ρ is the density of the organic solid (g/cm3);
t is time (h);
It is interesting to note that while they are fundamentally different, some of these
models are sometimes equivalent to each other in terms of effectiveness [42, 45, 46]. For
example, the chemical first-order kinetics is not directly coupled to the bacterial growth,

28
while the biological first–order, half-order biomass kinetics, and A-order biomass
kinetics are models with similar structure as they contain the hydrolysis rate constant,
substrate concentration, and biomass concentration. These models are more
comprehensive than the chemical first-order kinetics model due to the consideration of
biomass concentration. The Michaelis–Menten kinetic reaction is mainly applied for the
hydrolysis of a soluble substrate.
Goel et al. [49] found that the hydrolysis of soluble starch follows the Michaelis–
Menten kinetics model where the enzyme concentration was proportional to the substrate
concentration. The Monod and Michaelis–Menten equations are considered to be similar
when µmax and Y are constant. These models use the hydrolysis rate coefficient as a
constant value which is not coupled to the physical characteristics of the particulates.
The surface-based kinetic model by Sanders et al. [48] was an attempt to correlate
the hydrolysis equation to the physical characteristics of particulates, i.e., surface area.
However this model did not take into account either the substrate or biomass
concentration. Although the Flux model developed by Terashima and Lin [26],
introduced the biomass concentration, surface area, and density of the substrate for
hydrolysis rate calculation it still used the hydrolysis rate constant as a constant value.
Myint et al. [50] developed a two-phase leach-bed reactor system for dry
digestion of cattle manure residues. The aim of their study was to optimize chemical
oxygen demand (COD) generation by enhancing hydrolysis and acidogenesis and
minimizing methanogenic activity by maintaining pH below 5.5 [26, 51] and heat
treatment of seed sludge [52]. The authors developed a two-substrate, single-biomass
model for the hydrolysis/acidogenesis phase. The developed model was based on the
29
premise that particulate hydrolysable fraction of cattle manure is composed of cellulose
and hemicellulose that are hydrolyzed at different rates according to a surface-limiting
reaction, and that the respective soluble products of hydrolysis are utilized by acidogens
at different rates, according to a two-substrate, single-biomass model. Batch experiments
were conducted and the results were used to identify the sensitive parameters and to
calibrate and validate the model. The authors reported that the results predicted by the
model agreed well with the experimentally measured data not used in the calibration
process, with correlation coefficients exceeding 0.91. These results indicate that the most
significant parameter in the hydrolysis–acidogenesis phase is the hydrolysis rate constant
for the cellulose fraction.
Lu et al. [53] studied the effects of dosed ammonia (0–16 g NH3) on hydrolysis
rates of proteins and lipids from fish residues under mesophilic anaerobic incubation. An
empirical kinetic model that describes the effects of ammonia on proteins and lipids
hydrolysis rates was developed. The results showed that carbon hydrolysis was
suppressed more by ammonium in the acidogenesis phase than in the
acidogenesis/methanogenesis phase in a single-stage anaerobic digestion. Also it has
been found that hydrolysis of compounds containing nitrogen was similarly suppressed
by ammonia during acidogenesis and acidogenesis/methanogenesis phases of a single-
stage anaerobic digestion. They also reported that the protein fraction of fish residues was
entirely biodegradable. The aforementioned hydrolysis model fitting demonstrated that
two fractions of lipid substrates exist, namely, easy and hard to biodegrade with
hydrolysis rates that were affected differently by ammonia concentration.

30
Vavilin et al [54] compiled and reviewed the information available in the
scientific literature relative to the kinetics of the hydrolysis process, highlighting the
models in which hydrolysis is coupled to the growth of hydrolytic bacteria, as well as to
substrate heterogeneity. In their study they compared the prediction of the first order,
Michaelis–Menten, Monod, surface-based kinetic and Contois models against available
experimental data. The concepts of rate-limiting step in anaerobic digestion and
inhibition of hydrolysis at high loads of particulate substrates were also discussed. They
reported that hydrolysis has mainly been modeled by first-order kinetics. For complex
substrates, the first-order kinetics should be modified in order to take into account
difficult-to-degrade material. They have shown that models in which hydrolysis are
coupled to the growth of hydrolytic bacteria work well at high or at fluctuating organic
loadings. In particular, the surface-related two-phase and the Contois models showed
good fits to experimental data from a wide range of organic wastes. Both models
converge to first-order kinetics at a high biomass to-waste ratio and, for this reason, they
can be considered as more general models. They also reported that acetogenesis or
methanogenesis might be the rate-limiting stages in complex wastes. In such cases,
stimulation of hydrolysis (mechanically, chemically or biologically) may lead to a further
inhibition of these stages, which ultimately affects hydrolysis as well. They also stated
that since the hydrolysis process is characterized by surface and transport phenomena,
new developments in spatially distributed models are considered fundamental to provide
new insights in this complex process.
The first-order model is simple to use and has been reported to fit experimental
data well [34, 36]. It has simplified the depolymerization rate of municipal solid waste

31
and solubilization rate of complex organics by first-order kinetic expressions,
Pavlostathis et al. [40], reviewed the literature published up to 1990, and indicated that
all of these works had used a first-order model to describe anaerobic hydrolysis of
particulate wastes. In a recent study by Mohmoud et al. [55], a similar model has been
adapted for anaerobic stabilization of primary sludge. Table 2.2 summarizes the typical
values of rate coefficients for different substrates that can be found in the literature. A
wide range of values of the first-order rate constant can be seen for composite and
simpler organic materials including carbohydrates, lipids and proteins. This wide range of
values can be explained by different experimental conditions, different hydrolytic
biomass-to-substrate ratios and the lumped effect of disintegration and hydrolysis.
The first-order kinetic model has failed to predict the maximum biological
activity when using a complex organics substrate [44]. Hobson [43] had confirmed that
the hydrolysis is based not only on the concentration of the substrate, but also on the
available surface area of the substrate. Sanders et al. [60] reported in their study that the
first-order kinetics can only be applied when the rate-limiting factor is the surface of the
particulate substrate, and bioavailability or biodegradability related phenomena do not
interfere. Noykova et al. [61] have used the biological first-order model to describe the
hydrolysis process in the digestion of fresh cow manure with total solid concentration
ranging from 4.5 to 12.65 %.

32
Table 2.2 Kinetic coefficients of the first-order rate of hydrolysis in literature.
Sludge Type Substrate Hydrolysis constant (d-1) References
Various types Carbohydrates 0.041 - 0.13 Gujer and Zehnder [36]
Various types Proteins 0.02 - 0.03 Gujer and Zehnder [36]
Various types Lipids 0.08 - 0.4 Gujer and Zehnder [36]
Primary Sludge Carbohydrates 0.21 - 1.94 O'Rourke et al. [56]
Primary Sludge Proteins 0.0096 - 0.1 O'Rourke et al. [56]
Primary Sludge Lipids 0.0096 - 0.17 O'Rourke et al. [56]
Sewage sludge Carbohydrates 0.025 - 0.2 Christ et al. [57]
Sewage sludge Proteins 0.015 - 0.075 Christ et al. [57]
Sewage sludge Lipids 0.005 - 0.01 Christ et al. [57]
Various types Carbohydrates 0.25 vary within (100%) Batstone et al. [8]
Various types Proteins 0.2 vary within (100%) Batstone et al. [8]
Various types Lipids 0.1 vary within (300%) Batstone et al. [8]
Various types Carbohydrates 0.5 -2.0 Garcia-Heras [58]
Various types Proteins 0.25 - 0.8 Garcia-Heras [58]
Various types Lipids 0.1 - 0.7 Garcia-Heras [58]
Gelatin Proteins 0.65 Flotats et al. [59]
Contois [62] proposed the Contois kinetic hydrolysis model that considers the
bacterial specific growth rate, µm , as a function of cell mass concentration B, and limiting
substrate.
)2.2(
)1.2(
L
L
SBKSBk
dtdS
SBKS
s
h
s
m
+⋅⋅⋅
−=
+⋅
=µµ

33
Hashimoto et al. [63] have evaluated the Contois model, and found that it fitted
well in swine waste fermentation and was acceptable for dairy manure digestion.
Negri et al. [47] proposed rates of depolymerization and solubilization of solid
waste that are proportional to the fluid-solid surface area and enzyme concentration,
assumed to be directly dependent on the concentration of acidogens. Using the Shrinking
Core Model, the waste particles were assumed to be of spherical geometry, and the
acidogens degrade the solid from the surface to the center. Hills and Nakano [65] used
the same model and demonstrated a linear relationship between the gas production rate
and the inverse of the particle diameter for tomato solid waste, with average particle
diameters from 0.13 to 2.0 cm. Similar results were obtained by Sharma et al.[66] with
agricultural and forest residues.
Vavilin et al. [67] used the A-order biomass kinetics model, assuming that the
hydrolysis rate is limited by the contact area between spherically symmetrical particles of
organic substrate and bacterial mass, and that the size of the hydrolyzed particle is much
larger than the depth of the bacterial layer. Assuming also that the total number of
particles per unit volume does not change but that the size of the particles decreases as a
result of the hydrolysis, they proposed the A-Order biomass kinetics model. Valentini et
al. [42] used the same approach and called it the power relationship between the rate
constant of cellulose hydrolysis and the average particle diameter, where A is the degree
index that equals to 2/3, 1/2 and 0 for spherical, cylinder and plate-form particles,
respectively. Saravanane et al. [68] conducted an experiment where he divided the sago
wastewater to three particle sizes with the following averages value: 400, 700, and 1100
µm. For each test, the experimental data were fitted using A-Order biomass kinetics

34
model. Results showed that the model allowed for more accurate mathematical
representation of the hydrolysis process. A series of batch tests indicated that the best fit
value of A was in the range of 0.43 to 0.62.
Sanders et al. [48] studied the influence of particle size on hydrolysis in anaerobic
digestion, using surface-based kinetics where the rate of hydrolysis was proportional to
the available surface area of the starch substrate. Assuming that the process of hydrolysis
does not break apart particles but continuously reduces the particle diameter, then the
surface area of similar size particles decreases proportionally with (soluble BOD)2/3 .
Dimock et al. [69] who studied the effect of small and large, surface area weighted mean
diameters of 60 and 390 µm, respectively, of hard-boiled egg whites as artificial particles
in activated sludge system. The hydrolysis rate constant was 0.038 - 0.24 d-1 and 0.019-
0.98 d-1 for large and small particles, respectively. In this study Dimock used the surface
based kinetic equation proposed by Sanders et al. [48].
2.1.4 Particle Size
Particulate organic matter is often removed in conventional primary clarification,
which reduces about 50%-70% of suspended solids and 25%-40% of biochemical oxygen
demands (BOD) [70]. Raw wastewater characteristics and particle removal efficiencies
vary, resulting in a large range of particle sizes in primary effluents [41]. Munch et al.
[71] reported on a primary effluent in which 28% of the particles were larger than 100
µm, while Levine et al. [72] found that only 7% of particulates in the primary effluent
were larger than 12 µm and 49% of particulates in waste activated sludge were 12 µm; an

35
overview of the particle size distribution for various waste streams is presented in Table
2.3.
Table 2.3 Size distribution of organic matter in municipal wastewater (adapted from
Levine et al. [72]).
Percent size distribution, µm Waste type
< 0.001 0.001 – 1 1 – 100 >1 00 References
Raw Influent wastewater 12 15 30 43 Munch et al., [71]
Primary effluent 9 48 15 28 Munch et al., [71]
Untreated Wastewater 38 13 19 30 Painter at el. [73]
Untreated Wastewater 29 13 31 27 Walter [74]
Untreated Wastewater 29 15 22 34 Walter [74]
(< 0.1) (0.1 - 1) (1 – 12) (> 12)
Primary effluent (51) (8) (34) (7) Levine et al., [75]
Waste activated sludge (28) (3) (20) (49) Levine et al., [75]
Particle size and particle composition determine the rate and mechanism of
hydrolysis and degradation in wastewater treatment [41]. Most of the biodegradable
organic matter is in the range of 10-3 to 100 µm. Microorganisms can directly take up
particles that are smaller than 10-3 µm [76, 77]. It is also important to mention that the
reaction rates vary widely based on the type of sludge or substrate used. The size of
particles in municipal wastewater has been generally classified into four categories
namely, settleable, supracolloidal, colloidal and dissolved.
Rudolf and Balmat [77] investigated various methods for the physical
fractionation of wastewater. In their studies, they developed a separation procedure
approximating the desired size limits. This separation procedure consists of settling and
membrane filtration. Karr and Keinath in [78] modified Roudolfs’s fractionation

36
procedure using a 100 µm fabric mesh, 1.0 µm, and 0.001 µm membrane filter. In this
experimental procedure, the sludge is first screened through 100 µm mesh and the solids
retained on the mesh are termed as rigid settleable solids. The filtrate from the 100 µm
filter is flocculated for 15 min at 10 RPM and allowed to settle for 1 hr. These solids
from the second procedure were termed fragile settleable solids. The supernatant from the
second procedure is filtered through 1.0 µm and 0.001 µm filters to remove the
supracolloidal and true colloidal solids, respectively from the dissolved solids. Their data
presented in Table 2.4 shows only a small amount of colloidal and soluble matters
present in the primary sludge. The large particulates (settleable and supracolloidal)
cannot be consumed by bacteria unless they are first hydrolyzed.
Table 2.4 Size of solids in raw sludge (primary sludge)
Solids fraction Size range (µm) % of total Solids (mg/L)
Settleable > 100 66.5 6452
Supracolloidal 1 to 100 27.5 2675
Colloidal 0.001 to 1 0.5 45
Soluble < 0.001 5.4 526
The significance of the size of particulate matter was pointed out by number of
researchers [75-81]. They concluded that the rate of hydrolysis depends on particle size.
Levine et al. [75] observed that in his work related to the particle size in
wastewater that the biological treatability could be enhanced by removing macrocolloidal
and supracolloidal particles, or by modifying particulate organics since the treatability of

37
wastewater solids depends strongly on their size distribution. Moreover, rates of
sedimentation, mass transfer, adsorption, diffusion, and biochemical reactions are all
influenced by particle size.
Futakawa et al. [79] experimented with activated sludge and compared the rate of
metabolism of suspended and soluble matter. They reported that the rate of metabolism of
suspended matter decreased as the particle size increased. A similar result for anaerobic
systems was reported by Koutsospyros [80] who used sonication as a method of particle
size reduction. In the sonication pre-treatment step, the substrate kinetic coefficients are
affected by sonication because the particles size decreases as sonication time increases.
He stated that the utilization rate coefficient increases as sonication pre-treatment
increases.
Andara et al. [81] in their work using pig manure as substrate established a
relationship between the process of anaerobic digestion and the size variation of the
different fractions of the influent, which were classified in several groups. They also
studied the efficiency of a biological treatment process corresponding with the
transformation of the organic substances and the size of the particles. They divided the
substratum in 800 mL volume aliquots and each was introduced into a 2.5 L reactor. A
batch process of anaerobic digestion was then applied using different hydraulic retention
times (HRT), which ranged from 7 to 70 days. The temperature was set at approximately
35oC. Once the HRT was completed for every sample, a portion of the residue was
classified under the Levine criterion (seltleable, supracolloidal, colloidal and dissolved
particles). The authors have reported a decrease of the soluble fraction and increase of the
colloidal and supracolloidal fractions along the digestion. They also reported that the

38
prevalence of the soluble particles was observed during the maximum biogas yield. They
stated that the described technique does not seem to be quite suitable, because the related
errors during the filtration, due to the abundance of suspended solids necessitating high
dilution.
Hu et al. [82] studied the effects of particle size on the hydrolysis and
acidogenesis of cellulose with ruminal microbes, the optimum pH range for cellulose
degradation, and the inhibitory effect of low pH to the artificial rumen degradation. The
authors conducted batch experiments to investigate the influence of cellulose particle size
and pH. They reported that at a particle size of 50 µm there was a higher hydrolysis and
acidogenesis rate, and a reduced degradation time, than for 100 µm particles. Cellulose
degradation increased with pH from 6.0 to 7.5, whereas at pH 5.5 there was no
degradation. The inhibitory effect of low pH (5.5) on ruminal microbes was not
completely remedied even when the pH of the medium was adjusted to a neutral range. In
anaerobic cellulosic waste degradation with ruminal microbes, the fermentation system
should therefore be maintained above pH 6.0. In all cases, volatile fatty acids were the
major water-soluble products of cellulose degradation; acetate and propionate accounted
for more than 90% of the total volatile fatty acids concentration.
Gea et al. [83] studied the influence of the bulking agent particle size and bulking
agent:sludge volumetric ratio on the composting process of two different types of sewage
sludge: dewatered raw sludge (RS) and dewatered anaerobically digested sludge (ADS).
The results were analyzed using a full factorial experimental design in order to determine
the optimal conditions for composting such sludges in terms of bulking agent particle size
and bulking agent:sludge volumetric ratio, two of the key parameters to ensure an optimal

39
performance of the composting process. The objective function selected was simulated
death kinetics of Salmonella, which was chosen as a model pathogen to represent the
disinfection of the material. For both types of sludge, optimal values were found at
bulking agent particle size of 5 µm and 1:1 bulking agent:sludge volumetric ratio when a
Gaussian function was fitted to the experimental data.
Dimock and Morgenroth [69] evaluated the influence of particle size on
hydrolysis rates of protein particles in batch, small and large, surface area weighted mean
of diameters 60 and 390 µm, respectively, of hard-boiled egg whites as artificial particles
in activated sludge system. It was found that the initial hydrolysis rates for large particles
(390 µm), were low but increased over time, contradicting commonly used mathematical
modeling approaches to describe hydrolysis. The hydrolysis results both in the release of
readily biodegradable substrate, at the same time, breakup of larger aggregates resulting
in an increase of the specific surface area available for hydrolysis. They reported that
hydrolysis rate was 0.038 - 0.24 d-1 and 0.019-0.98 d-1 for large and small particles,
respectively.
Mshandete at el. [84] studied the reduction of particle size as a pre-treatment
method for increasing the biogas potential from Tanzanian sisal fibre waste. The treated
sisal fibres were then tested in anaerobic batch experiments to determine the effect of the
pre-treatment. Batch anaerobic digestion of sisal fibre waste was carried out in 1-l
digesters with fibre sizes ranging from 2 to 100 µm, at an ambient temperature of 33oC.
The researchers used sediment from a stabilisation pond at a sisal production plant as
seed. Results reported that total fibre degradation increased from 31% to 70% for the 2
µm fibres, compared to untreated sisal fibres with a diameter of 100 µm. The results

40
confirmed that methane yield was inversely proportional to particle size. Methane yield
increased by 23% when the fibres were cut to 2 µm size and was 0.22 m3 CH4/kg volatile
solids, compared to 0.18m3 CH4/kg volatile solids for untreated fibres. They reported that
148,000 tonne of waste sisal fibres generated annually in Tanzania could yield 22 million
m3 of methane and an additional 5 million m3 of methane if reduced to size of 2 µm was
applied.
The methods of particle size reduction methods can be classified into three
groups; physical, chemical and biological methods. Since the biological and chemical
size reduction methods interfere with the chemical and biological nature of the sludge,
the physical size reduction methods are considered as the primary method. In the
following section the pre-treatment methods will be briefly illustrated and discussed.
2.1.5 Pre-treatment of Sludge for Anaerobic Digestion
Over the past few decades, numerous experimental pre-treatment methods have been
developed to enhance the anaerobic digestion of municipal sludge. The main goal is to
reduce the size of the particles, which results in a greater surface area per unit volume
available for degradation [85]. Another advantage is to disrupt the microorganisms in the
sludge so that cell-bound substrate and intracellular material may be released from the
cell into the bulk solution [86]. Table 2.5 displays the advantage and disadvantage of pre-
treatment of sludge for anaerobic digestion [85] in addition to what has been illustrated
above:

41
Table 2.5 Advantages and disadvantages of sludge pre-treatment for anaerobic digestion
Advantages of pre-treatment Disadvantages of pre-treatment
- Enhance VS reduction,
- Increase methane production,
- Small rector volume,
- Lower disposal costs,
- Improved disinfection in anaerobic
digesters.
- Increase polymer demand for
dewatering,
- Release of nitrogen in return
wastewater
- Increase ammonia concentration
In the following sections the numerous pre-treatment methods will be illustrated and
discussed.
2.1.5.1 Chemical Pre-treatment (Acids and Bases):
Woodard and Wukasch [87] developed a hydrolysis, thickening, and filtration
system to improve the solubilization of total suspended solids (TSS). Although this
process was not established as a pre-treatment method for anaerobic digestion, the results
of their solubilization study were interesting. Four grams of H2SO4 per g TSS were added
to one L of WAS at 25, 40, 70 and 90oC. The highest TSS solubilization was reached at a
temperature of 90oC, after 30 minutes of contact. The TSS solubilization had already
reached 67% and reached a maximum of 69% after one hour. Another experiment
investigated the effect of acid dose on WAS at room temperature for 30 seconds. With
only 1 g H2SO4 per g TSS, the TSS solubilization reached 55% and increased linearly at

42
higher acid doses up to a value of 60% at a dose of 8 g H2SO4 per g TSS. During both
studies the researcher observed that large quantities of carbon dioxide were being
generated due to the acidification of bicarbonate ions and the associated dissolution of
calcium carbonate salts [87]. The authors also reported that one serious drawback of this
pre-treatment would be the large quantities of acids and bases required. Major gains in
VS removal and methane production would be necessary to counterbalance this and to
make it a viable pre-treatment technology.
Lin et al. [20] conducted a study in which WAS at 1 and 2% TS was pre-treated
with sodium hydroxide at 20 and 40 mg/L for 24 hours at room temperature and under
anoxic conditions. The untreated and pre-treated sludge was digested in 1-L semi-
continuous anaerobic reactors at solids retention time (SRT) of 7.5, 10, 13, and 20 days.
The highest solubilization was achieved in the 1% sludge treated with 40 mg/L of NaOH.
For this sludge, the fraction of soluble to total COD was 38% as compared to 2% for the
control. For all reactors digesting pre-treated sludge, the methane production was at least
19% greater than the control and at most 286% greater than control. The authors reported
that pre-treatment with NaOH worsened the dewaterability of the digested WAS as it
increased the capillary suction time by a factor of 4 to 11 as compared to the untreated
digested WAS.
Tabaka et al. [21] compared the effect of chemical, thermal, and thermo-chemical
pre-treatment on WAS. The sludge was mixed with different doses of NaOH in flasks
and magnetically stirred for one hour. Increasing the dose of alkali from 0 to 0.6 g NaOH
per g VSS improved the solubilization of the VSS linearly and reached a plateau at 15%

43
for grater alkali doses. On the other hand, methane production improved linearly with
alkali dosage, reaching as high as 50% higher than the control at 1 g NaOH per g VSS.
2.1.5.2 Ozone Pre-treatment
Ozone in considered to be one of the strongest oxidizing agents, and has been
found capable of solubilizing a significant portion of organics and converting part of the
COD to carbon dioxide.
Weemaes et al. [22] investigated the effects of ozonation at doses of 0.05-0.2 g O3
per g COD on mixture of primary and secondary sludge (ratio not specified). At a dose of
0.2 g O3 pr g COD the total COD was reduced from 7,900 to 4,900 mg/L, soluble COD
increased from 60 to 2,300 mg/L, TSS decreased from 9,500 to 3,800 mg/L and VSS was
reduced from 5,700 to 1,800 mg/L the authors had also reported a significant drop in pH,
form 7.8 to 4.9.
Yeom et al. [88] studied a wide range of ozone doses, a 1.2 %TS sludge was
ozonated at doses of 0.02 – 5 g O3 per g TSS. The solubilization of the sludge particles
improved from 0.8% for untreated sludge to 9.1%, 19.6%, 23.9% and 32.7% at doses of
0.02, 0.05, 0.1, and 0.2 g O3 per g TSS, respectively, and decreased at higher doses, with
the optimum dose of 0.2 g O3 per g TSS, production of 165 mL CH4 per g COD
compared to 80 mL CH4 per g COD for the control.
2.1.5.3 Mechanical Pre-treatment
The mechanical methods usually result in the rupture of the cell wall and the
release of cell-bound substrate. The success of mechanical pre-treatment is typically

44
measured by comparing the soluble protein concentration before and after pre-treatment
[84].
Choi et al. [18] applied 10, 30, and 50 bars pressure on WAS. The pressure of 50
bars achieved almost 90% VSS reduction. The mean particle size was found to be 69.1,
37, 21.6 and 18.7 µm for the untreated sludge, pre-treated with pressure of 10, 30, and 50
bars, respectively. The soluble COD increased by factors of 6.5 and 8 at pressures of 30
and 50 bars, respectively. The authors have also reported that both alkalinity and pH
slightly increased as a result of pretreatment.
Nah [90] studied the effect of blending of raw sludge. Screened raw domestic
sludge was blended for 5 minutes at 10,000 RPM with the temperature maintained
between 25oC and 30oC by means of cold towels wrapped around the bowl of the blender.
Their experiment showed a 10% increase in the colloidal soluble fraction. The
comparative study of blending and sonication of primary sludge has been conducted by
Koutsospyros [80]. Primary sludge samples of 250 mL were used to study the effect of
both blending and sonication. Blending of the samples was performed by a Waring
Blender and high speed homogenizer while an ultrasonic liquid processor was employed
for sonication pre-treatment. Blending pretreatment time was 5 minutes, with ultrasonic
pre-treatment time was of 5 minutes, 50% amplitudes, and 20 kHz frequency. pH was set
to 5.5 for all samples. Solubilization is evident from the SCOD data. An increase of
more than 1000 mg/L from (7979 to 6825 mg/L) in SCOD was observed in the sonicated
samples, while the SCOD of blended samples was 200 mg/L (from 6825 to 7025 mg/L)
higher than that of the untreated sample. It is apparent that total alkalinity, volatile acids
and pH were not affected by the pre-treatment methods. On the other hand, excessive

45
foam production occurred during blending of the sample. These experiments probed that
sonication is a superior method for solubilization to blending.
2.1.5.4 Ultrasound Pre-treatment
Ultrasound is a well-known method for the break-up of microbial cells to extract
intracellular material [91]. When the ultrasound wave (>20 kHz) propagates in a medium
such as sludge, it generates a repeated pattern of compressions and rarefactions in the
medium. The rarefactions are regions of low pressure (excessively large negative
pressure) in which liquid or slurry is torn apart. Micro-bubbles or cavitation bubbles are
formed in the rarefaction regions. As the wave fronts propagate, micro-bubbles oscillate
under the influence of positive pressure, thereby growing to an unstable size before they
violently collapse. The collapsing of the bubbles often results in localized temperatures
up to 5000 K and pressures up to 180 MPa [92, 93]. The sudden and violent collapse of
huge numbers of micro-bubbles generates powerful hydro-mechanical shear forces in the
bulk liquid surrounding the bubbles [94]. The collapsing bubbles disrupt adjacent
bacterial cells by extreme shear forces, rupturing the cell wall and membranes. The
localized high temperature and pressure could also assist in sludge disintegration. At high
temperatures, lipids in the cytoplasmic membrane are decomposed, resulting in ruptures
within the cell membrane, through which intracellular materials are released to the
aqueous phase [91].
Ultrasound disintegration has been investigated at laboratory, pilot, and full-scale
levels. Clear evidence exists of cell lysis [95] floc size reduction [92], increased volatile
solids reduction [95, 96], and increased biogas production [95, 96, 97]. Batch and semi-
46
continuous digestion tests show that ultrasonically treated waste activated sludge
produces more biogas, degrading more volatile solids with respect to untreated sludge,
but the gain depends on the feed/inoculum ratio as well as on the organic loading rate
[38]. A remarkable improvement of the biocatalysis of the hydrolytic reactions can be
achieved with quite low ultrasound energy input [38, 98].
Tiehm et al. [17] observed an increase in SCOD concentration from 630 to 2,270
mg/L when a mixture of primary and waste activated sludge were irradiated for 64
seconds at a frequency of 31 kHz. This treatment also resulted in an increase of sludge
temperature from 15 to nearly 45oC. The particle size distribution of the sludge with and
without pre-treatment was also compared using laser light scanning. The median particle
size of the untreated sludge was 165 µm and decreased to 135 and 85 µm after 29.5 and
96 seconds of sonication, respectively. Five 150 L semi-continuous anaerobic digesters
were operated at HRTs of 22, 16, 12 and 8 days. In addition, a control reactor was run
with a HRT of 22 days. On average, the control reactor achieved a 45.8% reduction in VS
whereas the reactor digesting pretreated sludge at a HRT of 22 days removed 50.3% of
the VS. The reactors operating at HRTs of 16 and 12 days removed more VS than the
control reactor but the reactor operated with a HRT of 8 days could only destroy 44.3%
of the VS. This showed that the pre-treatment of sludge with ultrasound could be used to
reduce the size of anaerobic digesters and/or to increase the removal of VS.
Wang et al. [99], in their experimental work on the pre-treatment of WAS using
ultrasound showed an increase in SCOD from 20 mg/L to 1,050 mg/L after 40 minutes of
exposure to ultrasound at a frequency of 9 kHz. Digestion of a 3:1 ratio of seed sludge to
pretreated WAS at 36oC yielded 350 mL methane per g VS whereas digestion of the

47
same ratio of seed sludge to untreated WAS only produced 205 mL methane per g VS.
The concentration of VFAs in the reactor containing pretreated WAS increased sharply at
the beginning of digestion to a value of 1,700 mg/L and then decreased linearly until
completion of the batch test. The VFA profile in the reactor containing the control was
similar but only peaked to a value of 1,100 mg/L a linear relationship with an R2 of 0.994
was observed between cumulative methane generation (mL methane per g VS added) and
solubilization ratio.
A wide range of ultrasound frequencies was explored by Tiehm et al. [101] Waste
activated sludge (WAS) was sonicated at frequencies of 41, 207, 360, 616, 1068 and
3217 kHz for four hours by the use of an ultrasound reactor equipped with disk
transducers. Both the lowest median particle size (17 µm) and highest degree of COD
solubilization (81%) were reached at the lowest frequency tested. The degree of
solubilization was defined as the increase in SCOD due to ultrasound pre-treatment
divided by the increase in SCOD due to exposure to 0.5 mol/L NaOH for 22 hours. The
next phase of the study involved the AD of sonicated WAS at a frequency of 41 kHz for
7.5, 30, 60 and 150 minutes. The digestion was carried out semi-continuously at an SRT
of eight days at 37oC in 1 L reactors. The sludge sample sonicated for only 7.5 minutes
did not show an increase in SCOD and actually produced less biogas than the control.
However, the reactor holding this sample was characterized by a higher oxygen
utilization rate and greater VS reduction. The exposure time that yielded the highest
biogas production and VS degradation was 150 minutes. Despite this, after digestion, the
supernatant of the sample sonicated for 150 minutes contained the highest soluble COD
and ammonia concentrations. Thereafter, WAS samples were sonicated for 60 minutes at

48
frequencies of 41, 207, 360 and 1068 kHz. Once again, the best results were obtained at a
frequency of 41 kHz as quantified by the degree of COD solubilization and VS removal
during AD. A linear relationship could be fit to relate percent VS removal to the degree
of COD solubilization with an R2 of 0.94.
COD solubilization and oxidation-reduction potential (ORP) in WAS were
monitored during ultrasonication and alkali addition by Chiu et al. [100]. Three pre-
treatment schemes were tested on WAS: (1) exposure to sodium hydroxide for 24 hours
in 1 L plastic bottles at room temperature at a dose of 40 meq/L. (2) some exposure to
NaOH followed by 20-kHz sonication for 24 seconds per mL and (3) concurrent
exposure to NaOH and sonication (14.4 seconds per mL) for 24 hours. The third scenario
led to the fastest initial hydrolysis rate: 211.9 mg COD/L/min. The second and third
schemes both yielded a SCOD of approximately 10,500 mg/L compared to only 4,880
mg/L for the first scenario. The ORP curve during the three pre-treatment scenarios
behaved similarly during the first two hours. Indeed, the sharp decreases in ORP
observed during this period accompanied by simultaneous increases in SCOD indicate
that hydrolysis took place during the first two hours. The concentrations of VFA were
also monitored during this experiment and the WAS pretreated simultaneously with
NaOH and ultrasound yielded a TVFA/TCOD ratio of 84% after 21 hours compared with
10% for untreated sludge.
Wang et al. [95] examined the release in SCOD concentration at three different
sonication times of 5, 15 and 20 min at TS content of 3%, frequency of 20 KHz, and
ultrasonic density of 0.768 W/mL. The authors observed an increase in SCOD release
from 2,581 to 7,509 mg/L, when the sonication time was increased from 5 to 15 min.
49
However, when the ultrasonic disintegration was continued for 20 min, the SCOD release
slowed down significantly with final SCOD concentration of 8,912 mg/L.
Khanal et al. [10] studied the release of ammonia-N at different total solids (TS)
contents and specific energy inputs (kJ/gTS) during ultrasonic disintegration of WAS.
The results showed that the release of ammonia-N concentration increased with increase
in specific energy inputs and TS contents. The ammonia-N concentration reached a fairly
constant level at specific energy inputs of 20 kWs/gTS for 2.0%, 2.5%, and 3% TS
contents, and 10 kWs/gTS for 1.5% TS content. The authors also investigated the effect
of TS content and energy input on SCOD release, the study showed an increasing trend
with increase in both TS and energy input.
Moonkhum [102] used ultrasonic to treat waste activated sludge for two anaerobic
lab scale reactors, ‘part stream’ (50% sonicated and 50% nonsonicated) and ‘full stream’
(100% sonicated) reactors in addition to one control reactor, with 3% TS and 2 different
SRT of 10 and 20 days. WAS samples were sonicated for 2.5 minutes with ultrasonic
density of 1.9 W/mL, at sonication frequency of 20 kHz. Moonkhm reported that
dissolved organic carbon (DOC) removal efficiency of the part stream and full stream
reactor improved by 26% and 28% respectively, at 10 days SRT compared to the control
reactor. Similarly, at 20 days SRT the efficiency of DOC removal of part stream and full
stream reactor were enhanced by 20% and 23% respectively, compared to the control
reactor.
Bunrith et al. [103] investigated ultrasonic disintegration of WAS sludge at
frequency of 20 kHz using sonication times of 5, 10, 30, and 60 min, chemical (NaOH
10, 25, 50 and 75 mg NaOH/g TS) and the combination of chemical-ultrasonic pre-

50
treatment techniques. Results revealed that chemical–ultrasonic gave a better efficiency
of sludge disintegration compared to individual chemical and ultrasonic techniques. The
optimum condition of chemical-ultrasonic was found at 10 mg NaOH/g TS dose and 3.8
kJ/g TS specific energy input, whereas chemical dose of 50 mg NaOH/g TS and specific
energy of 3.8 kJ/g TS were the optimum operating condition of individual chemical and
ultrasonic pre-treatment, respectively.
In summary, several studies performed on WAS have confirmed that the highest
SCOD release and particle size reduction are the major goals of ultrasonic pretreatment.
Khanal et al. [10] obtained SCOD of 16.2% at an energy input of 66,800 kJ/kgTS;
whereas Bougrier et al. [17] achieved as much as twice that at an energy input of only
6,951 kJ/kg TS. In another study, SCOD of 40% was obtained at a specific energy input
of 60,000 kJ/kg TS [96]; whereas Rai et al. [104] reported SCOD of 25% at energy input
of 64,000 kJ/kg TS. Such variations might be attributed to the energy transfer efficiencies
of ultrasonic equipment. Although many pre-treatment studies have been conduced to
improve the digestion process, none of those studies presented detail cost analyses
required for large scale application of these processes.
2.1.5.5 Odor Precursors
Study of odor production from anaerobically digested biosolids was inadequate
until relatively recently [105]. Although H2S is considered to be the most prevalent odor
compound, there are typically other organic odorous compounds, such as mercaptans and
amines, present in anaerobically digested sludges. Prior research has implicated volatile
sulfur compounds (VSCs) including hydrogen sulfide (H2S), methanethiol or methyl

51
mercaptan (MT), dimethyl sulfide (DMS), dimethyl disulfide (DMDS) and dimethyl
trisulfide (DMTS) in odors from biosolids [106]. In addition to VSCs, ammonia, and
volatile fatty acids (VFA), phenols are also implicated as possible odor causing
compounds in the excretion of pigs [107].
Laboratory tests have indicated that protein degradation and, especially the
degradation of methionine, an amino acid, is the main source for the production of VSCs
[106]. Proteins are hydrolysed by extracellular enzymes (proteases) into their constituent
polypeptides and amino acids. The pathway for the production of MT from methionine is
described as [106]:
olMethanethi3
Lyase Methionine
Methionine
3284enzyme
Peptidase enzyme Protease
HSCHNSCHOHCesPolypeptidProteins → → →
Hydrogen sulfide (H2S) can be formed from the degradation of cysteine, sulfur
containing amino acid, as shown below:
Sulphide Hydrogen2
Lyase Cysteine
Cysteine
3263enzyme
Peptidase enzyme Protease
SHNSCHOHCesPolypeptidProteins → → →
While the carbohydrate, lipid, and protein content of municipal biosolids often
accounts for the majority (90%) of the organic load [8], in some industries, protein is the
predominant part of the organic load. For example, the protein component of a dairy
wastewater stream can account for more than 40%-60% of the total chemical oxygen
demand [108]. Although the presence of proteins has been confirmed in the organic
matter of treated municipal waste water and sludge [110], literature on protein
degradation during anaerobic digestion is both sparse and contradictory.

52
In a pioneering work, Breure et al. [110] studied degradation of a model protein,
gelatin, in controlled anaerobic digestion, and observed that it was converted at high rates
and to a substantial extent to volatile fatty acids. Since, proteins, carbohydrates and lipid
are almost always present simultaneously in biosolids, complete degradation of protein in
the presence of carbohydrates may not be achieved as glucose and other easily
fermentable substrates can repress the synthesis of exoproteases (a necessary enzyme) in
pure cultures of bacteria [110], and the degradation of gelatin was retarded by increasing
concentrations of carbohydrates present in the feed as a second substrate. In contrast, in a
controlled study it was found that as much as 70% of the protein was broken down in the
acidogenic reactor and inclusion of protein had no effect on the reaction pathway for
lactose degradation [110]. Proteins in wastewater and sludge are generally divided into
three fractions: soluble, bound/labile (loosely attached with the cells) and tightly bound
fractions (within the bacterial cells) [161]. Labile proteins are thought to become readily
bioavailable during dewatering giving rise to higher odor potential.
Morales et al. [111] reported the use of green fluorescent protein (GFP) as a probe
protein to investigate the performance of proteins in wastewater sludge. They tested the
suitability of the approach by monitoring GFP added to aerobic and anaerobic sludges.
Under anaerobic conditions at 35ºC, fluorescence signal due to GFP was reduced by 90%
after only 6 h.
Lu et al. [112] suggested that the metabolic pathways to producing various
acidogenic metabolites were inhibited differently by ammonia, resulting in different
schemes of products distribution. For example, carbohydrate degradation efficiency was
decreased to < 20% with increasing ammonia nitrogen loading rate; acidogenic bacteria

53
with an ability to utilize both carbohydrates and proteins grew by mainly utilizing
proteins under the toxic ammonia concentration [113].
Higgins et al. [105] evaluated the role of proteins, amino acids, and enzyme activity
on odor production from anaerobic digestion. their hypothesis on the concentration of
bioavailable protein in different samples that would be related to the amount of odor-
causing chemicals that are produced during the storage of biosolids. Also protein-
degrading enzyme activity would be an indicator of VSC production, because these
enzymes degrade protein to produce amino acids, which can be degraded to form VSCs.
A large, collaborative research project was undertaken, supported by the Water
Environment Research Foundation (Alexandria, Virginia) (WERF) and by 11 utilities
across the United States and 1 utility in Canada. The study objectives of this research
were, in part, to: (1) Determine the compounds produced by biosolids and their
relationship to odors; (2) Determine the timeline for production of odorous compounds
during storage; (3) Examine differences in odor constituents and odor-production profiles
from different plants; (4) Determine the role of biochemical constituents, proteins, amino
acids, and enzyme activity on the production of odorous compounds and the factors that
affect the bioavailability and activity of these constituents and subsequent odorous
compounds production; (5) Determine the effect of digestion parameters, such as
temperature, solids retention time (SRT), volatile solids destruction, and residual
biological activity, on odor production; (6) Determine the effect of upstream parameters,
such as influent concentrations of different constituents, primary and secondary sludge
storage time, fraction of primary sludge added to the digestion, and activated sludge SRT
on subsequent odor production; and (7) Determine the role of dewatering equipment and

54
cake conveyance systems on odor production. There results showed that: (1) Protein
concentration and, more specifically, the concentration of the sulfur-containing amino
acid, methionine, were well correlated with the production of odorous VSCs; (2) Protein
and amino acid content varied considerably for the 11 different plants; (3) Protein-
degrading enzyme activity did not correlate well with the production of odorous VSCs;
(4) The concentration of iron in the biosolids was negatively correlated with the
extractable bound protein, meaning that more iron in the biosolids resulted in decreased
extractable bound protein. As a result, iron addition could be a method to reduce odor
production from biosolids.
These results suggest that odor control strategies could be aimed at reducing the
amounts of bioavailable protein in the cake. Therefore, more complete degradation of
protein during digestion would reduce the available substrate for odor production. For
example, larger SRTs and pre-digestion enhancements, which aim to increase the
digestibility of the solids, may aid in removing protein. Research is needed to explore
these alternatives and their effect on odors from the final product.
2.2 Summary and Conclusions
In the earlier sections we have discussed the current AD modeling, illustrating the
key areas, substrate pathways and structure of those models. The information available
for anaerobic microorganisms degrading complex substrates as sewage sludge has large
gaps regarding reliable kinetic and stoichiometric parameters required for accurate
modeling [96]. More research efforts have to be made to achieve an accurate
characterization of the substrate, at least in terms of the main components (carbohydrates,

55
proteins, and lipids) and not only in terms of “gross parameters” such as COD and VSS.
For each component, specific parameters need to be determined with experiments
reproducing the real system as far as possible. Moreover, information obtained from pure
culture studies need to be supplemented with in situ characterization data directly
evaluated in the mixed culture operating in the plants. At the same time, a more accurate
monitoring and control of full-scale plants could provide valuable information of use in
updating model parameters. This would help increase process knowledge and, at the same
time, ensure greater process efficiency and stability.
Anaerobic hydrolysis is well documented to be a function of specific surface area
among other variables [26]. Studies on the effect of particle size on hydrolysis and its
mathematical relationship are sparse, as most of the studies reported the hydrolysis rate
coefficient as a single value and not a function of particle size. Studies that address the
effect of particle size distribution (full spectra distribution) on the hydrolysis rate
coefficient are needed. Another key point in the biological sludge digestion process is the
need to increase particulate hydrolysis kinetics, which represents the limiting step in the
whole reaction chain. This may be done by pre-treating the influent stream in a thermal,
ultrasonic, and/or chemical stage. (Ultrasonic pre-treatment is being widely investigated
with promising results.) Nevertheless, the mechanisms of ultrasound
disintegration/digestion are not fully understood, in spite of claimed reduction of
digestion time and improvement of digestion efficiency by ultrasonic pre-treatment.
Therefore, further investigations need to be carried out in this area, especially as far as
the hydrolysis step is concerned. Accurate anaerobic hydrolysis modeling could prove

56
useful both for a reliable simulation of particulate matter degradation and for the design
of anaerobic digesters.
In most of the above research reported degradation of total protein in controlled
conditions was studied. However, proteins are usually divided into three types (total
protein, bound protein, and soluble protein) [65]. The total protein is considered as the
tightly bound fraction from flocs and is a of bacterial cell mass, the bound protein is the
labile fraction loosely attached with solids, and the soluble protein is soluble fraction in
the solution. No study has been found on degradation of these various fractions in
conventional anaerobic sludge digesters, similarly systematic study of degradation of
other odorous compounds such as volatile fatty acids is not available in literature.

57
2.3 References
[1] Chynoweth, D.; Pullammanappallil, P. Anaerobic digestion of municipal solid waste
in microbiology of solid waste. CRC Press, Boca Raton, FL. 1996, 71-113.
[2] Henze, M. H.; Jonsen, J. C.; Arven E. Waste Water Treatment. Springer-Verlog,
Berlin, Germany. 1997.
[3] Chynoweth, D.; Owens, J. M. Anaerobic processing of piggery wastes: A review.
Paper presented at the ASAE Meeting, Orlando, FL. 1998.
[4] Lesisinger, T. Genetic and Molecular Biology of Anaerobic Bacteria. Springer-
Verlog, B New York, NY. 1993, 1-12.
[5] Ecke, H. L. Anaerobic digestion of putrescible refuse. Luela University of
Technology, Luela, Sweden, 2001
[6] Zinder, S. H. Methanogenesis. Encyclopedia of Microbiology. 1992, 3, 81-96.
[7] Miyamoto, K. Renewable Biological Systems for Alternative Sustainable Energy
Production. Food and Agriculture Organization of the UN. 1997, 128.
[8] Batstone, D. J.; Keller, J.; Angelidaki, I.; Kalyuzhnyi, S. V.; Pavlostathis, S. G.;
Rozzi, A.; Sanders, W. T. M.; Siegrist, H.; Vavilin, V. A. Anaerobic Digestion
Model No. 1, IWA Task Group for Mathematical Modelling of Anaerobic
Digestion Processes, Water Sci. Technol. 2002, 40, 65–73.
[9] Siegrist, H.; Gujer, W. Mathematical modeling of anaerobic mesophilic sewage
sludge treatmen. Water Sci. Technol. 1993, 27, 25-36.

58
[10] Khanal, S. K.; Grewell, D.; Sung, S.; Leeuwen, J.V. Ultrasound Applications in
Wastewater Sludge Pretreatment: A Review, Critical Reviews in Environmental
Science and Technology. 2007, 37, 277–313.
[11] Marek, M, and Hans, J. Comparison of different models of substrate and product
inhabitation in anaerobic digestion. Water Research .1999, 33, 2545-2554.
[12] Lokshina, L. Kinetic Analysis of the key stages of low temperature methanogenesis.
Ecological Modeling. 1999, 117, 285-303.
[13] Masse, D. I.; Droste, R.L.; Comprehensive model of anaerobic digestion of swine
manure slurry in a sequencing batch reactor. Water Research. 2000, 34, 3087-3106,
[14] Alex, J. O. Modeling of Anaerobic Digestion as an Integral Part of the WWTP-first
Experiences. San Sebastian, Spine. 2001, 624: p. 22-23.
[15] Kalyuzhnyi S.; Veeken A.; Hamelers B. Two-particle model of anaerobic solid state
fermentation. Water Sci. Technol. 2001, 41, 43-50.
[16] Vavilin, V.A.; Rytov, S. V.; Lokshina, L. Y.; Rintala, J. A.; Lyberatos, G..
Simplified hydrolysis models for the optimal design of two-stage anaerobic
digestion. Water Research, 2001, 35, 4247-4251.
[17] Tiehm, A.; Nickel, K.; Neis, U. The use of ultrasound to accelerate the anaerobic
digestion of sewage sludge. Water Sci. Technol 1997, 36, 121–128.
[18] Bougrier, C.; Carrere, H.; Delgenes, J.P.; Solubilization of waste-activated sludge by
ultrasonic treatment, Chem. Eng. Journal. 2005, 106, 163-169.

59
[19] Choi, H. B.; Hwang, K. Y.; Shin, E. B. Effects on anaerobic digestion of sewage
sludge pre-treatment. Water Sci. Technol. 1997, 35, 207-211.
[20] Lin J.G. and Chang C.N. Fenton process for treatment of desizing wastewater, Water
Research. 1999, 31, 2050–2056.
[21] Yasui, H.; Nakamura, K.; Sakuma, S.; Iwasaki, M.; Sakai, Y. A full scale operation
of a novel activated sludge process without excess sludge production. Water Sci.
Technol. 1996, 34, 395-40.
[22] Tanaka, S. Effects of thermochemical pre-treatment on the anaerobic digestion of
waste activated sludge. Water Sci. Technol. 1997, 35, 209-215.
[23] Weemaes, M.; Grootaerd, H.; Simoens, F.; Verstraete, W. Anaerobic digestion of
ozonized biosolids, Water Research 2000, 34, 2330-2336.
[24] Andrews, J. Dynamic Modeling and Simulation of the Anaerobic Digestion Process.
Anaerobic Biological Treatment Processes 1971, 104.
[25] Hill, D.T. and Barth, C.L. A dynamic model for simulation of animal waste
digestion. Journal WPCF, 1977, 10, 2129-2143.
[26] Eastman, J.A. and Ferguson, J.F. Solubilization of particulate organic carbon during
the acid phase of anaerobic digestion. Journal WPCF, 1981, 53, 352–366.
[27] Mosey, F. E. Mathematical Modeling of the Anaerobic Digestion Process:
Regulatory Mechanisms for the formation of Short-Chain Volatile Acids from
Glucose. Water Sci. Technol. 1983, 15, 209-232.
60
[28] Rozzi, A.; Merlini, S.; Passino, R. Development of a four population model of the
anaerobic degradation of carbohydrates. Environmental Technology Letters. 1985,
6, 610-619.
[29] Bryers, J. D. Structured modeling of the anaerobic digestion of biomass particulates.
Biotechnology and Bioengineering. 1985, 27, 638-649.
[30] Pavlostathis, S.G.. and Gossett, J.M. A kinetic model for anaerobic digestion of
biological sludge. Biotechnol. Bioeng. 1986, 28, 1519–1530.
[31] Shimizu, T.; Kudo, K.; and Nasu; Y. Anaerobic waste-activated sludge digestion-a
bioconversion mechanism and kinetic model. Biotechnol. Bioeng. 1993, 41, 1082–
1091.
[32] Angelidaki, I.; Ellegaard, L.; and Ahring, B.K. A comprehensive model of anaerobic
bioconversion of complex substrates to biogas. Biotech. Bioeng., 1999, 63(3), 363–
372.
[33] Noike, T.; Endo. G.; Chang, J.; and Matsumoto, J. Characteristics of carbohydrate
degradation and the rate-limiting step in anaerobic digestion. Biotechnol. Bioeng.
1985. 27, 1482–1489.
[34] Pavlostathis, S.G.; Miller, T.L.; Wolin, M.J. Kinetics of insoluble cellulose by
continuous cultures of Ruminococcus albus. Appl. Environ. Microbiol. 1988, 54,
2600–2663.
[35] Siegrist, H..; Gujer, W. Mathematical model for mesophilic thermophilic anaerobic
sewage sludge digestion. Environmental Science and Technology. 2002, 36, 1113-
1123.
61
[36] Gujer, W. and Zehnder, A. J. B. Conversion processes in anaerobic digestion. Water
Sci. Technol. 1983, 15, 127–167.
[37] Yasui, H.; Sugimoto, M.; Komatsu, K.; Goel, R.; Li, Y.Y.; Noike, T. An approach
for substrate mapping between ASM and ADM1 for sludge digestion. In: Proc. First
International Workshop on the IWA Anaerobic Digestion Model No.1. Lyngby,
Denmark, 2-4 September, 2006, 73–80.
[38] Tomei, M.C.; Braguglia, C.M.; Mininni, G. Anaerobic degradation kinetics of
particulate organic matter in untreated and sonicated sewage sludge: Role of the
inoculum. Biores. Technol. 2007, 99, 6119–6126.
[39] Gossett, J.M.; and Belser, R.L. Anaerobic digestion of waste activated sludge. J.
Environmental Eng. Division, 1982, 1101–1120.
[40] Pavlostathis, S. G. ; Giraldo-Gomez, E. Kinetics of anaerobic treatment: a critical
review. Critical Reviews in Environmental Control. 1991, 21, 411-490.
[41] Morgenroth, E.; Kommedal, R.; Harremoës, P. Processes and modeling of
hydrolysis of particulate organic matter in aerobic wastewater treatment – a review,
Water Sci. Technol., 2002, 6, 45, 25–40
[42] Valentini, A.; Garruti, G.; Rozzi, A.; Tilche, A. Anaerobic degradation kinetics of
particulate organic matter: a new approach, Water Sci. Technol., 1997, 36, 239–
246.
[43] Hobson, P.N., Wheatley, A., 1992. Anaerobic Digestion: Modern Theory and
Practice. Elsevier, Amsterdam, The Netherlands, 1992.
62
[44] Hashimoto, A.G.; Chen, Y.R.; Verel, V.H. Theoretical aspects of methane roduction:
State of the art. In: Livestock waste: A renewable resources. Proceedings of the
fourth international symposium of livestock wastes. Transaction of ASAE, USA,
1981, 86–91
[45] Vavilin, V.A.; Rytov, S.V.; Lokshina, L.Y. A description of hydrolysis kinetics in
anaerobic degradation of particulate organic matter. Bioresource Technol., 1996,
56, 229–237.
[46] Cecchi, F., Mata-Alvarez, J., Traverso, P. G., Medici, F., Fazzini, G. A, New
Approach to the Kinetic Study of Anaerobic Degradation of the Organic Fraction of
Municipal Solid Waste. Biomass. 1990, 23, 79-102
[47] Negri, E. D.; Mata-Alvarez, J.; Sans, C.; Cecchi, F. A mathematical model of
volatile fatty acids (VFA) production in a plug flow reactors treating the organic
fraction of municipal solid waste (MSW). Water Sci. Technol. 1993, 27, 201-208.
[48] Sanders, W.T.M.; Geerink, M.; Zeeman, G.; Lettinga, G. Anaerobic hydrolysis
kinetics of particulate substrates. Water Sci. Technol., 2000, 41, 17–24.
[49] Goel, R.; Mino, T.; Satoh, H.; Matsuo, T. Comparison of Hydrolytic Enzyme
Systems in Pure Culture and Activated Sludge under Different Electron Acceptor
Conditions, Water Sci. Technol. 1988, 37, 335.
[50] Myint, M. and Nirmalakhandan, N. Evaluation of first-order, second-order, and
surface-limiting reactions in anaerobic hydrolysis of cattle manure, Environ. Eng.
Sci. 2006, 23, 966–976.
63
[51] Yu, H.Q.; Fang, H. Acidogenesis of gelatine-rich wastewater in an upflow
anaerobic reactor: influence of pH and temperature. Water Research. 2003, 37, 55–
66.
[52] Oh, S.; Ginkel, S.V.; Logan, B.E. The relative effectiveness of pH control and heat
treatment for enhancing biohydrogen gas production. Environ. Sci. Technol. 2003,
37, 5186–5190.
[53] Lu, F.; He, P-J.; Shao, L.; Lee, D. Effects of ammonia on hydrolysis of proteins and
lipids from fish residues Appl Microbiol Biotechnol, 2007, 75, 1201–1208
[54] Vavilin, V.A.; Fernandez, B.; Palatsi, J.; Flotats, X. Hydrolysis kinetics in anaerobic
degradation of particulate organic material: An overview Waste Management 2008,
28, 939–951
[55] Mahmoud, N.; Zeeman, G.; Gijzen, H.; Lettinga, G.. Anaerobic stabilization and
conversation of biopolymers in primary sludge-effect of temperature and sludge
retention time. Water Research. 2004, 38, 983-991.
[56] [] O’Rourke, J.R.. Kinetics of anaerobic treatment at reduced temperatures. Ph.D.
Thesis, Stanford University, Stanford, CA, USA, 1968..
[57] Christ, O., Wilderer, P.A., Angerhofer, R., Faulstich, M.,. Mathematical modelling
of the hydrolysis of anaerobic processes. Water Sci. Technol. 2000, 41, 61–65.
[58] Garcia-Heras, J.L. Reactor sizing, process kinetics and modelling of anaerobic
digestion of complex wastes. In: Mata-Alvarez, J. (Ed.), Biomethanization of the
Organic Fraction of Municipal Solid Wastes. IWA Publishing, TJ International
Ltd., Padstow, Cornwall, UK, 2003, 21–62.

64
[59] Flotats, X., Palatsi, J., Ahring, B.K., Angelidaki, I.,. Identifiability study of the
proteins degradation model, based on ADM1, using simultaneous batch
experiments. Water Sci. Technol. 2006, 54 (4), 31– 39.
[60] Sanders, W.M.T.; Veeken, A.H.M.; Zeeman, G.; van Lier, J.B. Analysis and
optimisation of the anaerobic digestion of the organicfraction of municipal solid
waste. In: Mata-Alvarez, J. (Ed.),Biomethanization of the Organic Fraction of
Municipal Solid Wastes.IWA Publishing Press, Cornwall, UK, 2003, 67–89.
[61] Noykova, N. ; Muller, T. G.; Gyllemberg, M.; Timmer, J. Quantitative analysis of
anaerobic treatment processes: Identifiably and parameter estimation.
Biotechnology and Bioengineering, 2002, 78, 89-102.
[62] Contois, D. E. Kinetics of bacterial growth: relationship between population density
and specific growth rate of continuous cultures. Journal of General Microbiology,
1959, 21, 40-50.
[63] Hashimoto, A. G.; Chen, Y. R.; Varel, V. H. Anaerobic fermentation of beef cattle
manure: final report. Roman L. Hruska U.S. Meat Animal Research Center, U.S.
Department of Agriculture Clay Center. Nebraska. 1981.
[64] Ray, B. T.; Huang, J. C.; Dempsey, B. A. Sludge digestion by anaerobic fluidized
beds: kinetic model. Jurnal of Environmental Engineering. 1989, 115, 1156-1170.
[66] Hills, D.J., Nakano, K., Effects of particle size on anaerobic digestion of tomato
solid wastes. Agr. Wastes. 1984, 10, 285–295.

65
[66] Sharma, S.K., Mishra, I.M., Sharma, M.P., Saini, J.S. Effect of particle size on
biogas generation from biomass residues. Biomass. 1988, 17, 251–263.
[67] Vavilin, V.A.; Rytow, S.V.; Lokshina, L.Y. Modelling hydrogen partial pressure
change as a result of competition between the butyric and propionic groups of
acidogenic bacteria. Bioresour. Technol, 1995, 54, 171–177.
[68] Saravanane, R.; Murthy, D. V. S.; Krishnaiah, K. Anaerobic fluidized Bed
degradation and the development of a kinetic model for a particulate organic matter
enriched wastewater sludge Water, Air, & Soil Pollution. 2001, 127, 15-30.
[69] Dimock, R.; Morgenroth, E. The influence of particle size on microbial hydrolysis
of protein particles in activated sludge. Water Research. 2006, 40, 2064-2074.
[70] Tchobanoglous, G., Burton, F.L., Stensel, H.D. Wastewater Engineering, Treatment
and Reuse, 4th Edition. McGraw-Hill, Inc. New York. 2003.
[71] Munch, R.; Hwang, C.P.; Lackie, T. H. Wastewater fractions add to total treatment
picture. Water Swage Wks. 1980, 127, 49–54.
[72] Levine, A. D. ; Tchobanoglous, G. ; Asano, T. Size distributions of particulate
contaminants in wastewater and their impact on treatability. Water Research. 1991,
25, 911-922.
[73] Painter H. A. and Viney M. Composition of a domestic sewage. J. Biochem,
microbiol. Teclmol. 1959, 1, 143-162.
[74] Walter L. (1961b) Composition of sewage and sewage effluents--Part 2. Water
Swage Wks 108, 478-481.
66
[75] Levine, A.D.; Tchobanoglous, G..; Asano, T. (1985). Characterization of the size
distribution of contaminants in wastewater: treatment and reuse implications. J.
Wat. Pollut. Control Fed. 1985, 57, 805–816.
[76] Ferenci, T.. The recognition of maltodextrions by E. coli. Eur. J. Biochem.
1980,108, 631–636.
[77] Rudolf, W.; Balmat, J. L. Colloids in sewage: separation of sewage colloids with the
acid of the electron microscope. Sewage and Ind. Wastes, 1952, 24, 247.
[78] Karr, P. B.; Keinath, T. M.Influence of particle size on sludge dewaterability. 1965,
50, 1911.
[79] Futakawa, M.; Takahashi, H.; Inoue, G.; Fujioka, T. A review of industrial catalytic
wet air oxidation processes. Proc. IDA/WRPC World Conf. Desalin, Water Treat.
Yokohama. 1993, 1, 231.
[80] Koutsospyros, A. Effect of Particle Size Reduction on Anaerobic Sludge Digestion.
Ph.D thesis, Polytechnic Univ., Brooklyn, NY. 1990.
[81] Andara, R.; Lomas, J.M. Transition of particle size fractions in anaerobic digestion
of the solid fraction of piggery manure. Biomass and Bioenergy. 2002, 23, 229 –
235
[82] Hu, Z.; Yu, H.; Zhu, R. Influence of particle size and pH on anaerobic degradation
of cellulose by ruminal microbes. International Biodeterioration & Biodegradation.
2005, 55, 233–238
67
[83] Gea, T.; Barrena, R.; Artola, A.; Sa´nchez, A. Optimal bulking agent particle size
and usage for heat retention and disinfection in domestic wastewater sludge
composting. Waste Management. 2007, 27, 1108–1116
[84] Mshandete, A.; Bjornsson, L.; Kivaisia, A. K.; Rubindamayugi, M.S.T.;
Mattiasson, B. Effect of particle size on biogas yield from sisal fibre waste.
Renewable Energy. 2006, 31, 2385–2392.
[85] Muller, J.; Winter, A.; Strunkmann, G.. Investigation and assessment of sludge pre-
treatment processes. Water Sci. Technol 2004, 49, 97-104.
[86] Lin, C.; Chen, C. Effect of Heavy Metals on the Methanogenic Granule. Water
Research. 1999, 33, 409-416.
[87] Woodard S. E. and Wukasch R. F. A hydrolysis/thickening/filtration process for the
treatment of waste activated sludge, Water Sci. Technol. 1994, 30, 29-38.
[88] Yeom, I. T. Effects of ozone treatment on the biodegradability of sludge from
municipal wastewater treatment plants. Water Sci. Technol. 2002, 46, 421-425.
[89] Hwang, K. Y.; Shin, E. B.; Choi H. B. A mechanical pre-treatment of waste
activated sludge for improvement of anaerobic digestion system. Water Sci.
Technol. 1997, 36, 111-116.
[90] Nah, I. W. Mechanical pre-treatment of waste activated sludge for anaerobic
digestion process. Water Research. 2000, 34, 2362-2368.

68
[91] Harmand, J. M.; Pons, N.; Dagot, C. Evaluation of multiple modeling approaches
for anaerobic digestion processes. Optimal Management of Wastewater Systems.
2001, 13-14.
[92] Flint, E.B. and Suslick, K.S. The temperature of cavitation, Water Science 1991,
253, 1397–1399.
[93] Suslick, K. Sonochemistry. The temperature of cavitations. Science. 1991, 253,
1397–1399.
[94] Kuttruff, H. Ultrasonics Fundamentals and Applications. Essex, England.1991.
[95] Wang, F.; Shan, L.; Ji, M. Components of released liquid from ultrasonic waste
activated sludge disintegration, Ultrason. Sonochem. 2006, 13, 334–338.
[96] Jeffrey, P.; Brown, P.; Hogan, F. Ultrasonic Solids Treatment Yields Better
Digestion.. WERF, Biosolids Technical Bulletin. 2003
[97] Gronroos, A.; Kyllonen, H.; Korpijarvi, K.; Pirkonen, P.; Paavola, T.; Jokela, J.;
Rintala, J. Ultrasound assisted method to increase soluble chemical oxygen demand
(SCOD) of sewage sludge for digestion, Ultrason. Sonochem. 2005, 12, 115–120.
[98] Yin, X.; Han P.; Lu X.; Wang Y. A review on the dewaterability of bio-sludge and
ultrasound pretreatment, Ultrason. Sonochem. 2004, 11, 337-348.
[99] Wang, Q.; Kuninobu, M.; Kakimoto, K.; Ogawa, H., Kata, Y. Upgrading of
anaerobic digestion of waste activated sludge by ultrasonic pretreatment.
Bioresource Thecnology. 1999, 68, 309-313.
69
[100] Chiu, Y. ; Chang, C. ; Lin, J. ; Huang, S. Alkaline and ultrasonic pretreatment of
sludge before anaerobic digestion. Water Sci. Technol. 1997, 36, 62-155.
[101] Tiehm, A.; Nickel, K.; Zellhorn, M.M.; and Neis U. Ultrasound waste activated
sludge disintegration for improving anaerobic stabilization, Water Research. 2001,
35, 2003–2009.
[102] Moonkhum, M. Aerobic Digestion of Waste Activated Sludge With Ultrasonic
Pretreatment. Master of Science in Environmental Engineering and Management
Thesis. Prince of Songkla University., Surat Thani, Thailan, 2007
[103] Bunrith, S. Anaerobic Digestibility of Ultrasound And Chemically Pretreated
Waste Activated Sludge. Master of Science in Environmental Engineering and
Management Thesis. Asian Institute of Technology School of Environment,
Resources and Development, Thailand. 2008
[104] Rai, C.; Struenkmann, G..; Mueller, J.; Rao, P. Influence of Ultrasonic
Disintegration on Sludge Growth Reduction and Its Estimation by Respirometry.
Environ. Sci. Technol., 2004, 38 , 5779–5785
[105] Higgins, M.; Adams, G.; Chen, Y.; Erdal, Z.; Forbes, R.; Glindemann, D.;
Hargreaves, J. McEwen, D.; Murthy, S.; Novak, J.; Witherspoon, J. Role of
Protein, Amino Acids, and Enzyme Activity on Odor Production from
Anaerobically Digested and Dewatered Biosolids, Wat. Environ. Res., 2008, 80,
127.
[106] Higgins, M.; Adams, G.; Chen, Y.; Erdal, Z.; Forbes, R.; Glindemann, D.;
Hargreaves, J. McEwen, D.; Murthy, S.; Novak, J.; Witherspoon, J. Relationship

70
between biochemical constituents and production of odor causing compounds from
anaerobically digested biosolids, WEF and AWWA Odors and Air Emissions 2004
Conference, Washington, USA, 2004, 18-24.
[107] Rideout T. C., Fan M. Z., Cant J. P., Wagner-Riddle C., and Stonehouse P.
Excretion of major odor-causing and acidifying compounds in response to dietary
supplementation of chicory inulin in growing pigs, J. Anim. Sci. 2004, 82, 1678-
1684.
[108] Barnett, J.W.; Kerridge, G..; Russell, J. Effluent treatment systems for the dairy
industry. Aus. Biotech., 1994, 4, 26-30.
[109] Dignac, M. F.; Ginestet, M. P.; Rybacki, D.; Bruchet, A.; Urbain, V.; Scribe, P.
Fate of wastewater organic pollution during activated sludge treatment: nature of
residual organic matter, Water Research. 2000, 34, 4185-4194.
[110] Breure, A. M.; Mooijman, K. A.; Van-Andel, J. G.. Protein degradation in
anaerobic digestion: influence of volatile fatty acids and carbohydrates on
hydrolysis and acidogenic fermentation of gelatin, Appl. Microbiol. Biotechnol,
1986, 24, 426-431.
[111] Morales, B. ; Bindels, F. ; Corvini, P.; Gerin, P. Method for monitoring the fate of
green fluorescent protein added to aerobic and anaerobic wastewater sludge, Water
Research 2005, 39, 4933–4940.
[112] Lu, M.C.; Lin, C.J.; Liao, C.H.; Ting, W.P.; Huang, R.Y. Influence of pH on the
dewatering of activated sludge by Fenton’s reagent, Water Sci. Technol. 2001, 44,
327–332.

71
[113] Shigeki, F.; Takashi, M. I.; Yoshihiko, S.; Tatsuya, N. Volatile fatty acids (VFA)
are dominant products from protein's acidogenesis, Proceedings of JSCE (Japan
Society of Civil Engineers). 2001, 671, 71-78.

72
CHAPTER THREE
Modeling the Influence of Particulate Protein Size on Hydrolysis in Anaerobic
Digestion 1
3.1 Introduction:
A significant fraction of organic matter in municipal wastewater is in the form of
particulates [1] which needs to be hydrolyzed before it can be utilized for bacterial
metabolism [2]. Anaerobic digestion is the most commonly applied process for
stabilization of biosolids. Mass reduction, methane production, and improved
dewaterability of sludge are the most important advantages of anaerobic digestion.
Anaerobic degradation of complex organic material has been described as a sequential
process that involves the steps of hydrolysis, acidogenesis, acetogenesis and
methanogenesis [3]. Furthermore, particulate organic matter that is hydrolyzed and used
under anaerobic conditions is a valuable carbon source for biological nutrient removal
from wastewater; a process that is often limited by the availability of readily
biodegradable organic matter [4].
Particulate organic matter is often removed in conventional primary clarification, which
removes about 50%-70% of suspended solids and 25%-40% of biochemical oxygen
demands (BOD) [5]. Raw wastewater characteristics and particle removal efficiencies
vary, resulting in a large range of particle sizes in the primary effluents [6]. Munch et al.
[7] reported on a primary effluent in which 28% of the particles were larger than 100 µm,
1 A version of this chapter has been submitted to Bioresource Technology, 2010

73
while Levine et al. [2] found that only 7% of particulates in the primary effluent were
larger than 12 µm and 49% of particulates in waste activated sludge were > 12 µm; an
overview of the particle size distribution for various waste streams is presented in Table
3.1.
Table 3.1 Size distribution of organic matter in municipal wastewater (adapted from Levine et al., 1991).
Percent size distribution, µm Waste type
< 0.001 0.001 – 1 1 – 100 >1 00 References
Raw Influent wastewater 12 15 30 43 Munch et al., (1980)
Primary effluent 9 48 15 28 Munch et al., (1980)
Untreated Wastewater 41 16 28 15 Blamat, (1957)
Untreated Wastewater 38 13 19 30 Painter at el. (1959)
Untreated Wastewater 29 13 31 27 Walter (1961a,b)
Untreated Wastewater 29 15 22 34 Walter (1961a,b)
(< 0.1) (0.1 - 1) (1 – 12) (> 12)
Primary effluent (51) (8) (34) (7) Levine et al., (1985)
Waste activated sludge (28) (3) (20) (49) Levine et al., (1985)
Particle size and particle composition determine the rate and mechanism of hydrolysis
and degradation in a wastewater treatment system [6]. Most of the biodegradable organic
matter is in the range of 10-3 to 100 µm, microorganisms can directly take up particles
that are smaller than 10-3 µm [8, 9]. It is also important to mention that the reaction rates
vary widely based on the type of sludge or substrate used. Table 3.2 displays the first-

74
order hydrolysis reaction rate coefficients for carbohydrate, lipid and protein obtained
from the literature.
Table 3.2 Review of hydrolysis rate constants in literature.
Substrate Hydrolysis constant (d-1) Sludge Type References
Carbohydrates 0.041 - 0.13 Various types Gujer and Zehnder (1983)
Proteins 0.02 - 0.03 Various types Gujer and Zehnder (1983)
Lipids 0.08 - 0.4 Various types Gujer and Zehnder (1983)
Carbohydrates 0.21 - 1.94 Primary Sludge O'Rourke et al.(1968)
Proteins 0.0096 - 0.1 Primary Sludge O'Rourke et al.(1968)
Lipids 0.0096 - 0.17 Primary Sludge O'Rourke et al.(1968)
Carbohydrates 0.025 - 0.2 Sewage sludge Christ et al. (2000)
Proteins 0.015 - 0.075 Sewage sludge Christ et al. (2000)
Lipids 0.005 - 0.01 Sewage sludge Christ et al. (2000)
Carbohydrates 0.25 vary within (100%) Various types Batstone et al. (2002)
Proteins 0.2 vary within (100%) Various types Batstone et al. (2002)
Lipids 0.1 vary within (300%) Various types Batstone et al. (2002)
Carbohydrates 0.5 -2.0 Various types Garcia-Heras (2003)
Proteins 0.25 - 0.8 Various types Garcia-Heras (2003)
Lipids 0.1 - 0.7 Various types Garcia-Heras (2003)
Proteins 0.65 Gelatine Flotats et al. (2006)
The wide variability in reaction rate coefficients, both in individual studies, as well as
between studies is noteworthy so much so that the anaerobic digestion model # 1
(ADM1) allowed variability of 100%-300% for the kinetic parameters [3]. Although, the

75
hydrolysis of particulate organic material has been considered as the rate-limiting step in
anaerobic digestion [10], some authors have emphasized that the hydrolytic process still
remains as the least well defined step [11,12]. Simplified models for hydrolysis kinetics
have been proposed including zero order, first-order, or saturation type kinetics [6]. Table
3.3 displays the various hydrolysis kinetic models available in the literature.
Table 3.3 Hydrolysis rate models in literature (adapted from Pin-Jing et al., 2006).
Name Expression ( dtdS− ) References
Chemical first-order Skh Eastman and Ferguson (1981)
Biological first-order SBkh Valentini et al. (1997)
Half-order biomass kinetic 5.0SBkh Rozzi and Verstraete (1981)
A-order biomass kinetic AhSBk Valentini et al. (1997)
Michaelis–Menten equation ( )SKSBk sh + Valentini et al. (1997)
Monod equation ( )[ ]SKYSB s +maxµ Hobson (1983)
Haldane equation ( )[ ]is KSSKYB //1max ++µ Andrews and Graef (1971)
Contois model ( )SBKSBk sh + Henze (1995)
Chen–Hashimoto model ( )[ ]SSSKSBk osh +− Chen and Hashimoto (1980)
Two phase model ( )( )[ ]BKSKSBk Bsh ++ Vavilin et al. (1996)
Step diffusion equation ( )[ ] 5.02max SSk oh −+ν Cecchi et al. (1990)
Shrinking core model BkdtdBSk hoh −=φφ ,3 2 Negri et al. (1993)
Flux model ρBSk surfhTerashima and Lin (2000)
Surface based kinetics model surfhSk Sanders et al. (2000)

76
where, A is the exponent in the A-order biomass kinetic equation; B is the concentration
of biomass or enzyme (mol/l); KB is the saturation constant for biomass or enzyme
(mol/l); kh is the hydrolysis rate constant (1/h); Ki is the inhibition constant for the i
inhibitory agent (mol/l); KS is the saturation constant for the substrate (mol/l); S is the
substrate concentration (mol/l); So is the initial substrate concentration (mol/l); Ssurf is the
surface area of the organic solid (cm2); t is time (h); vmax is the maximal hydrolysis rate
(mol/ l- h); Y is the growth yield coefficient ; µmax is the maximum specific growth rate
(1/h); ρ is the density of the organic solid (g/cm3); Ø is the dimensionless particle radius,
equal to the ratio of the radius of the particle at time t to the initial radius of the particle
Most of these models have been developed for specific situations with either very high or
very low substrates to microorganism ratio. It is interesting to note that some of these
models are sometimes equivalent to each other in terms of effectiveness [13, 14, 15],
while they are fundamentally different. For example, the chemical first-order kinetics is
not directly coupled to the bacterial growth, while the biological first–order, half-order
biomass kinetics, and A-order biomass kinetics are models with similar structure as they
contain the hydrolysis rate constant, substrate concentration, and biomass concentration.
These models are more comprehensive than the chemical first-order kinetics model due
to the involvement of biomass concentration. The Michaelis–Menten kinetic reaction is
mainly applied for the hydrolysis of a soluble substrate. Goel et al. [16] found that the
hydrolysis of soluble starch follows the Michaelis–Menten kinetics model where the
enzyme concentration was proportional to the sludge concentration. The Monod and
Michaelis–Menten equations are considered to be similar when µmax and Y are constant.

77
These models use the hydrolysis rate coefficient as a constant value and are not coupled
with the physical characteristics of particulates. The surface based kinetics model [17]
was an attempt to correlate the hydrolysis equation to the physical characteristics of
particulates, i.e., surface area, but it did not take into account either the substrate or
biomass concentration. The Flux model, introduced the biomass concentration, surface
area, and density of the substrate for hydrolysis rate, but it still used the hydrolysis rate
constant as a constant value.
Over the last decade, significant research has been focused on various disintegration
methods to enhance anaerobic digestion (AD) such as thermal, mechanical and chemical
pre-treatments [18]. Therefore, the development of hydrolysis model that accounts for
the impact of particle size is required for developing more efficient AD designs, and to
improve our understanding of the hydrolysis rate. In a study to determine the substrate
degradation pattern during acid-phase anaerobic digestion it was found that the changes
in sludge retention time (SRT) influence protein dissimilation, whereas carbohydrate and
lipid degradation patterns were not affected [19]. Therefore, it is worthwhile to
characterize the effect of particle size on protein hydrolysis and its ultimate impact on
SRT. In this study, the effect of particulate protein particle size on anaerobic digestion
and the influence of particulate size distribution on the hydrolysis rate coefficients during
anaerobic digestion were evaluated using casein as a model protein. Mathematical
relationships that describe the hydrolysis rate constant as a function of surface weighted
median (SWd50) diameter and specific surface area (SSA) were established. In addition, a
more comprehensive hydrolysis kinetic model that takes particle size into consideration
was developed and verified.

78
3.2 Material and methods
3.2.1 Culture, Substrate and Media:
Casein protein (R25394, MP Biomedicals, LLC Ohio, US) was grinded using a cutting
mill and then sieved using lab scale sieve (GilSonic UltraSiever, Gilson Company Inc.,
Ohio, US) with 500, 300, 200, 100, and 50 µm size meshes. The casein samples were
seeded with anaerobic sludge (volatile suspended solid of 7 g/L) obtained from a full
scale anaerobic digester at St. Marys, Water Pollution Control Plant (Ontario, Canada).
The medium stock used in these experiments contained 280 g/L NH4Cl, 250 g/L of
K2HPO4, 100 g/L of MgSO4.7H2O, 10 g/L of CaCl2.2H2O, 2 g/L of FeCl2.4H2O, 0.05 g/L
of H3BO3, 0.05 g/L of ZnCl2, 0.03 g/L of CuCl2, 0.5 g/L of MnCl2.4H2O, 0.05 g/L of
(NH4)6Mo7O24, 0.05 g/L of AlCl3, 0.05 g/L of CoCl2.6H2O, and 0.05 g/L of NiCl2. The
initial pH value for the mixed solution was adjusted to 7 ± 0.2 using 1N NaOH and 2N
HCl, and sodium bicarbonate (NaHCO3) was used as buffer at concentration of 10 g/L.
3.2.2 Batch Anaerobic Digestion:
Batch anaerobic biodegradability tests were carried out in 250 mL serum bottles. The
volumes of substrate (casein) and seed (anaerobic digested sludge) were determined
based on food (as COD) to microorganism (as VSS) ratio of 4:1. The serum bottles were
filled with 180 mL of seed or anaerobic culture, 1 mL of medium described above, and 5
g of casein, distilled water was used to make up the volume to 200 mL. Because the exact
chemical formula of casein protein is unknown, the chemical oxygen demand
concentration was measured experimentally, in triplicate, using six different casein
79
concentrations (0.5, 1, 3, 7, 14 and 20 g/L). A linear relationship between the protein
concentration and COD value was observed. Six different particle sizes with surface
weighted median diameter (SWd50) of 628, 443, 229, 129, 61, 25 µm were tested. All
bottles were capped and sealed with teflon septum after purging the headspace with
nitrogen for 2 min to eliminate the presence of oxygen/air and create anaerobic
conditions. Nine bottles were used for each particle size of casein in addition to nine for
the blank (media and seed only); all samples were incubated in a rotary shaker (MaxQ
4000, Incubator and Refrigerated Shaker, Thermo Scientific, CA) at 37oC and 180 rpm.
One bottle from each particle size was sacrificed each time for parameter analysis. The
experiment was conducted two times to ensure reproducibility.
3.2.3 Analytical Methods:
Sludge parameters such as chemical oxygen demand (COD), total suspended solids
(TSS), volatile suspended solid (VSS), volatile fatty acids (VFA), and proteins fractions
(particulate and soluble) were measured with time in duplicate. All sludge parameters
were analyzed according to the Standard Methods [20]. However, particulate and soluble
proteins were analyzed using the method described by Lowry et al. [21] method. The
concentrations of VFA in the filtered sludge (through 0.45 µm filter) were measured
using a gas chromatograph (Varian 8500, Varian Inc., Toronto, Canada) with a flame
ionization detector (FID) equipped with a fused silica column (30 m × 0.32 mm) with a 1
µm film thickness. Helium was used as the carrier gas at a flow rate of 5 mL/min. The
temperatures of the column and detector were 110 and 250°C, respectively. The particle
size distribution, surface weighted median diameter (SWd50) and specific surface area

80
(SSA) were determined by Malvern Mastersizer 2000 (version 5.22) laser beam
diffraction granulometer (Malvern Instruments Ltd, England). Total gas volume was
measured by releasing the gas pressure in the bottles using appropriately sized glass
syringes (Perfektum; Popper & Sons Inc., NY, USA) in the 5–100 mL range after
equilibration with the ambient pressure as recommended by Owen et al. [22]. Biogas
composition was determined by a gas chromatograph (Model 310, SRI Instruments,
Torrance, CA) equipped with a thermal conductivity detector (TCD) and a molecular
sieve column (Molesieve 5A, mesh 80/100, 182.88 × 0.3175 cm). The temperatures of
the column and the TCD detector were 90 and 105°C, respectively. Argon was used as a
carrier gas at a flow rate of 30 mL/min.
3.2.4 Modeling:
In this study, only the hydrolysis of protein, uptake of amino acids and microbial decay
of amino acids degraders in anaerobic digestion were considered; inhibition due to pH,
NH3, and H2 were ignored for simplicity. The first-order kinetic model was used to
describe the disintegration, hydrolysis and the decay reactions, while the Monod model
was used for the biological uptake reactions [3]. Figure 3.1 shows the Total COD flow of
proteins as described in the ADM1 [3].

81
Proteins
Amino Acid
ButyratePropionate
Valerate
Acetate
Hydrogen
CH4 and CO2
Hydrolysis
Acidogenesis
Acetogenesis
Methanogenesis
Composite
Figure 3.1 Interrelated TCOD flow of Proteins in the Anaerobic Digestion Model No. 1 (ADM1)
The following simplified model, henceforth referred to as the particulate protein model
(PPrM) was used in this study:
Disintegration: cdisaaXaadecc XkXk
dtdX
−= ,
In this study the concentration of Xc (kg COD m-3) was set to zero due to the use of
particle protein as the only substrate at the beginning, hence the disintegration equation
can be expressed as follows ( )1, LaaXaadecc Xk
dtdX
=
Hydrolysis of protein: ( )2,, Lprprhydcdisxcprpr XkXkfdtdX
−=
Uptake of amino acids: ( )3,
,, LaaaaaaS
aaaamprprhyd
aa XSK
SkXk
dtdS
+−=

82
Growth of amino acids degraders:
( )4,,
, LaaXaadecaaaaaaS
aaaamaa
aa XkXSK
SkY
dtdX
−+
=
Where, km, aa is the Monod maximum specific uptake rate (d-1) for amino acids, Ks, aa is
the Monod half saturation concentration (kg COD m-3) for amino acids, kdis , khyd and kdec
are the first-order coefficient rate (d-1) for disintegration, hydrolysis, and decay,
respectively. Xc, Xpr, and Xaa, are the particulate components (kg COD m-3) for
composite, protein, and amino acids degraders, Saa is the soluble component (kg COD m-
3) for amino acids, fpr.xc is the yield of proteins from composites, Yaa is the yield of
biomass on substrate, and t is the time in day. AQUASIM 2.1 (Dübendorf, Switzerland)
was used to solve the PPrM dynamic differential equation system.
3.2.5 Statistical Analysis:
The student t-test was used to test the hypothesis of equality at the 95% confidence level.
The null hypothesis was defined as no difference between the two groups tested vs. the
alternative hypothesis that there is a statistical difference between the two groups.
3.3 Results and discussion
3.3.1 Particulate Protein Degradation:
Figure 3.2 displays the anaerobic protein degradation versus digestion time for different
particle sizes.

83
0
5
10
15
20
25
30
0 0.5 1 1.5 2 2.5 3 3.5 4 4.5 5 5.5time (d)
Con
cent
ratio
n(g
CO
D/L
)
> 500300 - 500200 - 300100 - 20050 - 100< 50
Figure 3.2 Particulate protein degradation for different particles size versus time.
Although final reduction in protein (97±1%) was achieved within 80 h for all particle
sizes, initial degradation was significantly higher for the smaller size particles as shown
in Figure 3.2. For example, for 80% particulate protein degradation, a residence time of 5
h is required for particle size ≤ 50 µm, whereas ≈55 h is required for a size ≥ 500 µm.
This suggests that the reduction of particle size is beneficial to the hydrolysis rate of
proteins during the anaerobic digestion, mainly due to the increase in specific surface
area available for the microorganisms to adhere [17, 23] with decreasing particle size.
Palmowski and Muller [24], who investigated the significance of the surface area in
anaerobic degradation of various particulate substrates such as apple, rice, sunflower
seeds, hay and maple leaves, found that the hydrolysis rate was mainly dependent on the
specific surface area as opposed to increase in dissolved compounds due to cell rupture,
alteration of the sample structure, and exposition of surface areas previously inaccessible
for microbial degradation. Since hydrolysis of particulate protein occurs at the solid-

84
liquid interphase, it is only natural that overall rate increases with increasing surface area
given enough biomass. The increase in surface area due to reduction in particle size is
shown in Table 3.4.
Table 3.4 Gompertz (Lay et al., 1999) model coefficients, median d(50) for the surface area, and specific surface area for different ranges of protein particle sizes.
PSR (µm) λ Rm P R2 SWd50 (µm) SSA (m2/g)
> 500 21.12 6.14 333.31 0.99958 628 0.00999
300 - 500 18.72 6.97 334.83 0.99960 443 0.0129
200 - 300 16.00 8.35 329.29 0.99976 229 0.0201
100 - 200 13.58 9.61 319.98 0.99989 129 0.0469
50 - 100 12.98 11.78 323.84 0.99995 61 0.0985
< 50 10.56 13.47 323.13 0.99995 25 0.192
* PSR is the particle size range
3.3.2 Biogas Production:
Figures 6.3 shows the cumulative mLCH4/gCODadded produced; the ultimate methane
produced was approximately the same for all particle sizes because of the same initial
COD concentration of 25 g/L. Overall, experimental CH4 production (1486±25 mL CH4)
was 14.7% lower than the theoretical methane production (1742 mL CH4); theoretical
methane was determined based on CH4 equivalent COD of 0.395L CH4/gCOD at 37oC
(Metcalf and Eddy, 2003). However, the maximum rate of methane production increased
from 6 to 14 mL CH4/gCODadded-d with the decrease in SWd50 from 628 µm to 25 µm.

85
0
50
100
150
200
250
300
350
400
0 0.5 1 1.5 2 2.5 3 3.5 4 4.5 5 5.5time (d)
mL
CH
4/g
CO
Dad
ded
>500300-500200-300100-20050-100< 50
Figure 3.3 Methane production over digestion time using different protein particle sizes.
Interestingly, the effect of particle size on solubilization and gas production is not exactly
the same; for example, 80% of the maximum gas production occurred at 30 h for particle
size ≤ 50 µm, whereas ≈80 h is required for a size ≥ 500 µm. Therefore the benefit of
smaller size on hydrolysis is not directly translated to the gas production. Overall, by
decreasing particle size by 25 times, digestion time has been improved by 2.5 times.
Similar trends have been observed by Hu et al. [25] who studied the effect of two
different sizes of cellulose, 50 µm and 100 µm, although the ultimate methane production
in their study was lower in case of 50 µm than 100 µm due to the accumulation of VFAs.
It is also important to note that a lag phase between 9 to 20 hours was observed in all
protein sizes (Figure 3.3). Duration of the lag phase was found to be a function of particle
size, as it increased with the increase in particle size.

86
To further elaborate on the effect of the particle size on the ultimate methane production,
maximum methane rate and lag phase, the following modified Gompertz model [26] has
been used to describe the cumulative gas production as:
( )
+−−⋅= 1expexp4 tPR
PCH m λ , where CH4 is the cumulative methane production
per unit substrate (ml/g), P is the maximum methane production per unit substrate (ml/g),
Rm is the maximum methane production rate (ml/g h), λ is the lag phase time (h), t is the
digestion time (h).
The cumulative methane production per unit substrate data were fitted with Gompertz
equation using the Newton-Raphson method for non-linear numerical estimation. The
Newton’s method was programmed using Visual Basic Application (VBA) language
available in MSExcel 2003. Table 3.4 summarizes the results of the model coefficients.
The correlation coefficient (R2) over 0.99 for all the regressions confirms the
applicability of the modified Gompertz model to fit the experimental data. Based on the
model results, it is evident that as the particle size decreased from ≥ 500 µm to ≤ 50 µm,
the lag phase decreased from 21 h to 11 h, while the maximum methane production rate
increased from 6 to 14 ml/g-h, respectively. More specifically, the lag phases for the 628,
443, 229, 129, 61, 25 µm SWd50 were 21, 19, 16, 14, 13, and 11 h, and maximum
methane production rates were 6, 7, 8, 10, 12, and 14 ml/g-h, respectively. It is also
important to note that the model was able to predict the maximum methane production
per unit substrate of 327±6 ml/g successfully. The above results emphasize the significant
impact of substrate particle size on gas production.

87
3.3.3 Effect of Particle Size on the Hydrolysis Coefficient:
Since hydrolysis is predominantly dependent on surface area rather than volume [27,28],
Table 3.4 displays the, surface weighted median diameter (µm) and the specific surface
area (m2/g) as a function of particle size of the test protein. The structure of the model
used in this study was obtained from the ADM1 model [3]. Due to the focus of this study
on the protein hydrolysis, the ADM1 model was simplified with only particulate protein
as the main substrate (Figure 3.1). The ADM1 model considers that all biochemical
extracellular solubilization steps are divided into disintegration and hydrolysis, of which
the first is a largely non-biological step that converts composite particulate substrate to
carbohydrates, proteins, lipids, and inerts. As mentioned earlier, in this study the
particulate protein was considered to be the only substrate. The second step is enzymatic
hydrolysis of particulate proteins to amino acids. Disintegration is mainly included to
describe degradation of dead biomass, while the hydrolysis steps are defined for pure
substrates such as protein. Both disintegration and hydrolysis processes are represented
by equation 1 and equation 2, respectively. The particulate protein will then be
hydrolyzed to its soluble form of amino acids. A separate group of acidogenic bacteria
degrade amino acids to mixed organic acids, hydrogen, and carbon dioxide, with the rate
of degradation following Monod kinetics equation 3. The organic acids are subsequently
converted to acetate, hydrogen, and carbon dioxide by acetogenic groups that utilize
butyrate and valerate, and propionate. The hydrogen produced by these organisms is
consumed by hydrogen-utilizing methanogenic bacteria, and the acetate by aceticlastic
methanogenic bacteria. Due to the focus of this study on protein hydrolysis only, the
acetogenic group was excluded from the model. Growth and death of biomass were

88
maintained in the anaerobic system as composite particulate material and was represented
by equation 4. Inhibition due to pH, hydrogen and free ammonia was excluded for
simplicity; pH was monitored and controlled by applying sodium bicarbonate NaHCO3 as
a buffer.
AQUASIM 2.1 (Swiss Federal Institute for Environmental, Switzerland) was used to
solve the dynamic differential system of equations presented earlier as well as estimating
the model coefficients, namely khyd, the hydrolysis rate constant (d-1), km, aa the maximum
specific uptake rate (d-1) for amino acids, and Ks, aa the Monod half saturation constant
(kgCOD/m3). First-order decay rate kdec (d-1), first-order disintegration rate kdis (d-1),
yield of proteins from composites fpr.xc, and yield of biomass on substrate Yaa were set to
0.5 d-1, 0.02 d-1, 0.2, and 0.08, respectively, based on the recommendation of the ADM1
model [3]. The amino acids components of biomass were set to 0.02 kg COD/m3
following the recommendation of Jeong et al. [29] who evaluated the sensitivities of the
kinetic and stoichiometric ADM parameters in predicting anaerobic glucose digestion and
concluded that biomass concentration was closely associated with the Monod maximum
specific uptake rate, that values could not be independently determined and verified.
Figure 3.2 shows the first-order hydrolysis kinetics fit of the experimental data for
different particle sizes, while Table 3.5 displays the hydrolysis rate coefficients and the
average percentage error (APE) of the hydrolysis model compared to the experimental
data.

89
Table 3.5 Hydrolysis rate and the amino acids uptake coefficients for different particle size ranges of protein.
Ks, aa (kg COD m-3), first-order 5.445
PSR (µm) khyd (d-1) APE (%) km, aa (d-1), SWd50KE SSAKE
> 500 0.034 5 30 4.898 5.095
300 – 500 0.049 3 30 4.947 5.053
200 – 300 0.082 1 30 5.424 5.429
100 – 200 0.160 3 30 5.644 5.399
50 – 100 0.204 2 30 5.497 5.414
< 50 0.298 10 30 6.191 6.332
It is evident that the model equations (1-4) successfully fit the experimental data with
APE between 1% and 10%, more specifically for SWd50 of 628, 443, 229, 129, 61, and
25 µm the APE were 5, 3, 1, 3, 2, and 10 %, respectively. As the particle size decreased
from ≥ 500 to ≤ 50 µm the hydrolysis rate coefficient increased from 0.034 to 0.298 d-1,
an enormous 776% increase. Similar results have been observed by Dimock et al. [30]
who studied the effect of small and large, square-weighted mean chord lengths of 60 and
390 µm, respectively, of hard-boiled egg whites as artificial particles in activated sludge
system. The hydrolysis rate was between 0.038 and 0.24 d-1 and 0.019 and 0.98 d-1 for
large and small particles, respectively. Therefore, it is essential to note that using the
first-order hydrolysis constant in the anaerobic digestion of particulate substrates without
taking particle size into consideration would be both misleading and erroneous. The
relationship between hydrolysis rate coefficients and both SWd50 and SSA were
mathematically evaluated and shown in Figures 6.4a and 6.4b, respectively.

90
y = 0.0851Ln(x) + 0.423R2 = 0.9861
0
0.05
0.1
0.15
0.2
0.25
0.3
0.35
0 0.05 0.1 0.15 0.2 0.25(b) Specific Surface Area (m2/g)
Hyd
roly
sis
Coef
ficie
nt(d
-1)
k(1/d)
y = 3.2442x-0.6833
R2 = 0.955
00.050.1
0.150.2
0.250.3
0.350.4
0 100 200 300 400 500 600 700(a) Surface Weighted Median Diameter (um)
Hyd
roly
sis
Coef
ficie
nt(d
-1) k(1/d)
Figure 3.4 First-order hydrolysis rate coefficient as function of (a) surface weighted median diameter (µm) (b) specific surface area (m2/g)
As evident from Figure 3.4, the hydrolysis rate coefficient was exponentially related to
the SWd50 with R2 of 96% while the relationship with SSA followed the power function
with R2 of 99% (as shown below in equations 5 and 6). It is clear that the developed
equations based on SWd50 and SSA has good agreement with the first-order kinetics
results with APE of 1% and 2% for SWd50 and SSA, respectively. Furthermore, the

91
spread of the data on both sides of the fitted curve confirms that the model does not
systematically over-predict or under-predict the first-order results. Palmowski and Muller
[24] have also concluded that surface area needs to be considered when describing the
degradation kinetics of substrate containing particles solids, especially when investigating
the significance of the surface area in anaerobic degradation of various particulate
substrates.
3.3.4 Hydrolysis Equations and Verification:
To demonstrate the significance of the particle size in the anaerobic process, kinetic
equations for anaerobic hydrolysis were proposed and presented below. The rationale
behind the new hydrolysis equations were to overcome the limitation of the first-order
hydrolysis model, which utilizes a constant hydrolysis rate coefficient that is independent
of both particle size and surface areas (Table 3.3). The proposed equations were based on
the relationship developed earlier (Figure 3.4) between SSA and the hydrolysis rate
coefficients denoted as SSAKE (equation 5), as well as SWd50 and the hydrolysis rate,
denoted as SWd50KE (equation 6).
( )[ ] )5(423.00851.0, Lprcdisxcprpr XSSALnXkfdtdX
⋅+⋅−=
( )[ ] )6(244.3 683.050, Lprcdisxcpr
pr XSWdXkfdtdX
⋅⋅−= −
It should be noted that the proposed equations were developed for casein and thus might
not be pertinent for other types of proteins or other particulates substrates like lipids and
carbohydrates. In order to verify the two aforementioned proposed equations, first the
92
PPrM was applied to estimate the maximum specific uptake rate (km, aa) for amino acids
and the Monod half saturation concentration (Ks, aa) using the first-order hydrolysis
kinetic equation (equation 2) with experimentally determined hydrolysis rate coefficient
0.082 d-1, correspond to the particle size 200-300 µm, the mid-range of the tested protein
size (Table 3.5). The maximum specific uptake rate (km,aa) for amino acids and the
Monod half saturation concentration (Ks,aa) were estimated using the Parameter
Estimation feature available in AQUASIM 2.1 as 30 d-1 and 5.445 kg COD m-3,
respectively. The maximum specific uptake rate obtained in this study is similar to that
reported by Ramsay [31] between 28 and 53 d-1, however the Monod half saturation
concentration observed was higher than the one reported by Ramsay, which is 1.027 -
1.198 kg COD m-3 [3]. The proposed hydrolysis kinetic equations 5 and 6 were then used
to simulate the experimental amino acid uptake, more specifically the maximum specific
uptake rate (km, aa) for amino acids and the Monod half saturation concentration (Ks, aa).
For these simulations, the hydrolysis equation (equation 2) presented in PPrM model was
replaced by the newly developed SSAKE and then by the SWd50KE (shown in Figures
6.4 a and b). Table 3.5 presents the fitted amino acids uptake coefficients for the two
proposed hydrolysis models SSAKE and SWd50KE. The result shows a slight change in
the Monod half saturation concentration (Ks,aa) at different particle size. However this
change was not statistically significant based on the t-test (null hypothesis was defined as
no difference between the average Ks, aa and 5.445) with a t-value of 0.06 and 0.05; and p-
value of 0.96 and 0.97 at the 95% confidence level for SWd50KE and SSAKE,
respectively. The difference between the Monod half saturation concentration using
SWd50KE and SSAKE equations was also tested and was found to be statistically
93
insignificant at the 95% confidence interval, which implies that both models simulated
the experimental data well. In other words, modified hydrolysis rate equations based on
surface weighted median diameter and specific surface area of particulate protein
performed equally well in predicting the experimental data. Figure 3.5 shows the
experimental data for amino acids and the predictions by the three hydrolysis models
(equations 2, 5, and 6) used in this study.
The amino acids concentration profile follows the typical consecutive reaction scheme,
i.e., it is produced by the degradation of protein and concomitantly breaks down to
volatile fatty acids. It is also interesting to note that the ‘tmax’ to produce the maximum
amino acids (soluble protein) corresponds well with the hydrolysis rates shown in Figure
3.2, and the rate of degradation (acidogenesis phase) also depends on the particle size. It
is also evident that the proposed hydrolysis models fit the experimental data better than
the original first-order model at different particle sizes. Average percentage error between
the experimental data and the models’ prediction was between 9 to 22% in the case of
SWd50KE, and 9 to 25% in the case of SSAKE. More specifically for SWd50 of 628, 443,
229, 129, 61, and 25 µm the APEs were 9, 20, 20, 20, 14, and 22 %, when applying
SWd50KE and 9, 17, 23, 25, 16, and 20 %, respectively, when applying SSAKE.

94
Particle size > 500
0
5
10
15
20
25
30
0 20 40 60 80 100 120
Am
ino
Aci
d(g
CO
D/L
)
Exper.First order SWd50KESSAKE
Particle size 300-500
0 20 40 60 80 100 120
Particle size 200-300
0
5
10
15
20
25
30
0 20 40 60 80 100 120
Am
ino
Aci
d(g
CO
D/L
)
Particle size 100-200
0 20 40 60 80 100 120
Particle size 50-100
0
5
10
15
20
25
30
0 0.5 1 1.5 2 2.5 3 3.5 4 4.5 5time (d-1)
Am
ino
Aci
d(g
CO
D/L
)
Particle size < 50
0 0.5 1 1.5 2 2.5 3 3.5 4 4.5 5time (d-1)
Figure 3. 5 Amino acids variation with time for different protein particle sizes.
3.4 Conclusions:
The effect of particle size on particulate protein degradation can be summarized as
follows:

95
o Although casein degradation efficiency was 97±1% for all protein sizes within 80 h
of digestion, the biodegradation rate increased significantly with decreasing particle
size.
o The ultimate methane production of 8259±139 mL was approximately the same for
all protein sizes. However the maximum methane production rate increased from 5
to 15 ml/g-h, while the lag phase decreased from 21 to 11 h with the decrease in
particle size from ≥500 µm to ≤50 µm.
o The hydrolysis rate coefficient increased by 786% from 0.034 to 0.298 d-1 with the
decrease in particle size from ≥500 µm to ≤50 µm corresponding to increase in
specific surface area from 0.01 to 0.19 m2/g.
o The hydrolysis rate coefficient of protein was experimentally related to median
surface diameter and specific surface area.
o The new hydrolysis models, correlating the first-order hydrolysis rate coefficient to
both median surface diameter and specific surface area were developed and verified
using the experimental data.
96
3.5 References
[1] Dimock, R.; Morgenroth, E. The influence of particle size on microbial hydrolysis of
protein particles in activated sludge. Water Research. 2006, 10, 40, 2064-2074.
[2] Levine, A. D..; Tchobanoglous, G.; Asano, T. Size distributions of particulate
contaminants in wastewater and their impact on treatability. Water Research. 1991, 8,
25, 911-922.
[3] Batstone, D. J.; Keller, J.; Angelidaki, I.; Kalyuzhnyi, S. V.; Pavlostathis, S. G.;
Rozzi, A.; Sanders, W. T. M.; Siegrist, H.; Vavilin, V. A. Anaerobic Digestion Model
No. 1, IWA Task Group for Mathematical Modelling of Anaerobic Digestion
Processes, Water Sci. Technol. 2002, 40, 65–73.
[4] Henze, M.; Mladenovski, C.; Hydrolysis of particulate substrate by activated sludge
under aerobic, anoxic and anaerobic conditions, 1991, Water Research.1991, 25, 61-
64
[5] Tchobanoglous, G.; Burton, F.L.; Stensel, H.D. Wastewater Engineering, Treatment
and Reuse, 4th Edition. McGraw-Hill, Inc., New York. 2003, 1819.
[6] Morgenroth, E.; Kommedal, R.; Harremoës, P. Processes and modeling of hydrolysis
of particulate organic matter in aerobic wastewater treatment – a review, Water Sci.
Technol., 2002, 6, 45, 25–40
[7] Munch, R., Hwang, C.P.; Lackie, T.H. Wastewater fractions add to total treatment
picture, Water Swage Wks. 1980, 12, 127, 49–54.
[8] Ferenci, T. The recognition of maltodextrions by E. coli. Eur. J. Biochem., 1980, 108,
631–636.
[9] White, D. The physiology and biochemistry of prokaryotes, Second edition, Oxford
University Press Inc., New York, 2000
[10] Pavlostathis, S.G.; Giraldo-Gomez, E. Kinetics of anaerobic treatment. CRC Crit.
Rev. Environ. Contr. 1991, 21, 411–490.
97
[11] Miron, Y.; Zeeman, G.; van Lier, J.B.; Lettinga, G. The role of sludge retention time
in the hydrolysis and acidification of lipids, carbohydrates and proteins during
digestion of primary sludge in CSTR systems. Water Research. 2000, 34, 1705–1713.
[12] Gavala, H.N.; Angelidaki, I.; Ahring, B.K.; Kinetics and modelling of anaerobic
digestion process. Adv. Biochem. Eng. Biotechnol, 2003, 81, 57–93.
[13] Vavilin, V.A.; Rytov, S.V.; Lokshina, L.Y. A description of hydrolysis kinetics in
anaerobic degradation of particulate organic matter. Bioresource Technol., 1996, 56,
229–237.
[14] Valentini, A.; Garruti, G.; Rozzi, A.; Tilche, A. Anaerobic degradation kinetics of
particulate organic matter: a new approach, Water Sci. Technol., 1997, 36, 239–246.
[15] Cecchi, F.; Mata-Alvarez, J.; Traverso, P. G.; Medici, F.; Fazzini, G. A New
Approach to the Kinetic Study of Anaerobic Degradation of the Organic Fraction of
Municipal Solid Waste, Biomass, 1990, 2, 23, 79-102.
[16] Goel, R.; Mino, T.; Satoh , H.; Matsuo, T. Comparison of Hydrolytic Enzyme
Systems in Pure Culture and Activated Sludge under Different Electron Acceptor
Conditions, Water Sci. Technol., 1988, 37, 335
[17] Sanders, W.T.M.; Geerink, M.; Zeeman, G.; Lettinga, G. Anaerobic hydrolysis
kinetics of particulate substrates. Water Sci. Technol., 2000, 41, 17–24.
[18] Thibault, G. Effect of microwave irradiation on the characteristics and mesophilic
anaerobic digestion of sequencing bath reactor sludge, MSc in Eng thesis, University
of Ottawa, Ottawa, Canada, 2005
[19] Elefsiniotis, P.; Oldham, W. K. Substrate degradation patterns in acid-phase
anaerobic digestion of municipal primary sludge, Enviro. Technol., 1994, 8, 15, 741–
751
[20] APHA. Standard Methods for the Examination of Water and Wastewater,
Washington DC, APHA. 1998.
[21] Lowry, O. H.; Rosebrough, N. J.; Fair, A. L.; Randall, R. J. Protein measurement
with the folin-phenol reagent, J. Biol. Chem, 1951, 193, 265-275.

98
[22] Owen, W.F.; Stuckey, D.C.; Healy, J.B.; Young, L.Y., McCarty, P.L. Bioassay for
monitoring biochemical methane potential and anaerobic toxicity, Water Research,
1979, 6, 13, 485-492.
[23] Mshandete, A; Bjoyrnssonb, L.; Kivaisia, A. K., Rubindamayugia, M.S.T.;
Mattiassonb, B. Effect of particle size on biogas yield from sisal fibre waste,
Renewable Energy, 2006, 13, 31, 2385–2392
[24] Palmowski, L.M.; Muller, J. Influence of the size reduction of organic waste on their
anaerobic digestion. Water Sci. Technol. 2000, 3, 41, 155–162.
[25] Hu, Z; Yu, H.; Zhu, R. Influence of particle size and pH on anaerobic degradation of
cellulose by ruminal microbes, Inter. Biodeterioration & Biodegradation, 2005, 55,
233–238
[26] Lay, JJ; Lee, YJ; Noike, T. Feasibility of biological hydrogen production from
organic fraction of municipal solid waste. Water Research. 1999, 33, 2579-25786.
[27] Miller, W. P.; Baharuddin, M. K. Particle size of interrill-eroded sediments from
highly weathered soils, Soil Sci Soc Am.1987 , 51, 1610-1615.
[28] Vavilin, V.A.; Rytow, S.V.; Lokshina, L.Y. Modelling hydrogen partial pressure
change as a result of competition between the butyric and propionic groups of
acidogenic bacteria. Bioresour. Technol, 1995, 54, 171–177.
[29] Jeong, H. S.; Chang-Won Suh; Jae-Lim Lim; Sang-Hyung Lee; Hang-Sik Shin.
Analysis and application of ADM1 for anaerobic methane production. Bioprocess
Biosyst Eng., 2005, 27, 81–89.
[30] Dimock, R.; Morgenrotha, E. The influence of particle size on microbial hydrolysis
of protein particles in activated sludge, Water Research. 2006, 40, 2064 – 2074
[31] Ramsay, I. R. Modelling and control of high-rate anaerobic wastewater treatment
system, PhD thesis, University of Queensland, Brisbane, 1997

99
CHAPTER FOUR
Modeling the Effect of Sonication on Biosolids Anaerobic Digestion2
4.1 Introduction Biosolids produced during wastewater treatment are one of the most abundant renewable
energy resources [1]. Within the agricultural sector in the European Union only, about
1500 million tons of biosolids are produced each year [2]. Consumption of biosolids for
energy production has increased significantly in recent years. Biosolids can be converted
to energy either directly by combustion, where the main energy output is heat and
electricity, or can be converted to an energy carrier that can be used as fuel for vehicles
[3].
Energy from biosolids can be produced by biological (fermentation) or non-biological
(thermo-chemical) processes [4]. Biological processes consume less energy than non-
biological processes in the production of a variety of gaseous and liquid energy carriers
[3]. Anaerobic digestion is the most commonly applied process for stabilization of
biosolids. Mass reduction, methane production, and improved dewaterability of sludges
are the most important advantages of anaerobic digestion. Due to carbon removal in the
form of methane and carbon dioxide, the end product shows a substantially better
biological stability than the unfermented material. A disadvantage of the fermentation
process is the slow degradation rate of biosolids. Conventional residence times in
anaerobic digesters are about 20-40 days, requiring large digesters. Sludge hydrolysis has
been considered as the rate-limiting step of anaerobic digestion [5]. The biodegradability
2 A version of this chapter has been published in Energy&Fuels, 2010, 24 (9), pp 4703–4711

100
of biosolids can be improved by sludge pretreatment methods that enhance solubilization
of solids.
Various mechanical disintegration methods have been applied for the pretreatment of
biosolids to enhance the rate and extent of anaerobic digestion. Sonication is a method for
the break-up of microbial cells to extract intracellular material [6]. When the ultrasound
wave (>20 kHz) propagates in an aqueous medium such as primary and waste activated
sludge, it generates a repeating pattern of compressions and rarefactions in the medium.
The rarefactions are regions of low pressure (excessively large negative pressure) in
which liquid or slurry is torn apart. Micro-bubbles are formed in the rarefaction regions.
As the wave fronts propagate, micro-bubbles oscillate under the influence of positive
pressure, thereby growing to an unstable size before they violently collapse. The
collapsing of the bubbles often results in localized temperatures up to 5000 K and
pressures up to 180 MPa [7]. The sudden and violent collapse of huge numbers of micro-
bubbles generates powerful hydro-mechanical shear forces and forms a high-speed liquid
micro-jet that impacts the surfaces of the bulk liquid constituents surrounding the bubbles
[8]. The collapsing bubbles, micro-jet of liquid, disrupt adjacent bacterial cells by
extreme shear forces, rupturing the cell wall and membranes. Several studies have
reported the benefits of ultrasound as a pretreatment method for sludge prior to anaerobic
digestion such as improved dewaterability, solubilization, rapid hydrolysis rate, and
enhanced biogas production [9, 11]. Ultrasound has also been tested for the enhancement
of full-scale digesters [12].
Mathematical anaerobic digestion models (ADM) have been extensively investigated and
developed during the last three decades [13]. As one of the most sophisticated and

101
complex ADM, the IWA Anaerobic Digestion Model No. 1 (ADM1) is the integrated
anaerobic model developed by the IWA Task Group for modeling of Anaerobic
Digestion Processes [14]. It consists of a number of processes to simulate all possible
reactions occurring in anaerobic sludge digestion including not only biological reactions,
such as disintegration and hydrolysis of suspended solids, uptake (growth) and decay of
microorganisms, but also physico-chemical reactions, including ion association/
dissociation and liquid–gas transfer. In total, 19 processes, 24 components, and 56
relative stoichiometric and kinetic parameters were assumed for biological processes, and
also, additional processes and parameters were determined for physico-chemical
processes. The steady-state Anaerobic Digestion Model #1 (ADM1) model had been used
with good success for approximately two years on a wide range of full-scale wastewater
treatment facilities [15, 17]. However, ADM1 has a critical disadvantage that many
parameters are difficult or impossible to measure [18, 19]. Batstone et al. [15] used the
ADM1 model to evaluate two industrial treatment applications. The first was the
assessment of acid addition for pH decrease and avoidance of calcium carbonate (CaCO3)
precipitation in a paper mill fed UASB. The simulation work found, with a high degree of
confidence, that acid dosing was neither economical for pH control nor had any real
effect on the CaCO3 levels present in the reactor. A specific calcium carbonate
precipitation equation was added to the ADM1 to undertake this study. The second study
was an assessment of the benefits of thermophilic (as opposed to mesophilic operation)
for reduced ammonia inhibition, improved stability, and gas production in a solids
digester at a gelatine production facility. Here, it was predicted that thermophilic
operation could not attain either goal to a satisfactory extent. In addition to demonstrating

102
the application of the ADM1 to the two systems, they assessed the predictions generated
in the case studies in terms of quality and utility. Johnson et al. [16] have reported in
their study that a number of modifications were necessary to allow it to be used in the
context of municipal wastewater treatment. It was found that the model’s use was greatly
simplified if used in conjunction with a larger plant simulator to assist in the feed
fractionation. It was also found that a better fit to actual operating data was achieved if
some of the slowly biodegradable particulate fraction was partitioned into ADM
particulate fractions other than the composite fraction Xc. Blumensaat et al. [17]
successfully implemented a process model to simulate the dynamic behaviour of a pilot-
scale process for anaerobic two-stage (thermophilic / mesophilic) digestion of combined
primary and WAS.
While most of the studies based on ultrasound energy have focused on the dewaterability
and solubilization of chemical oxygen demand (COD), there is a definite paucity of
information related to the impact of sonication on other biosolids characteristics like
odors precursors such as proteins as well as anaerobic biodegradability. Furthermore a
simplification of the complex ADM model and its application to simulate pretreated
sludges enhances both process understanding and practical application. This study
focuses on assessing the impact of sonication on various protein fractions and their
anaerobic biodegradability as well as developing simple predictive empirical models that
could be of significant practical use. The effect of ultrasound pretreatment on particle
disintegration was also evaluated. Thereafter, the effect of sonication pretreatment on the
anaerobic digestion coefficients and gas production was determined using ADM1. An

103
empirical model was developed to assess the economical viability of ultrasound based on
electrical energy input vs. energy obtained from methane gas produced.
4.2 Materials and method
4.2.1 Experimental Set-up: Lab-scale ultrasonic treatments were applied to primary sludge (PS) and waste activated
sludge (WAS). Eight hundred (800) mL sludge samples from the Adelaide wastewater
plant, London, Ontario, Canada were sonicated for 1, 5, 10, 20, 40, and 60 minutes. A 20
kHz 500 W ultrasonic generator (model VC-500 from Sonic and Materials, Connecticut,
USA) with a standard probe (Titanium alloy Ti-6Al-4V, 1 inch in diameter, 5¾ inch
length) was used for this purpose, with ¾ of the probe submerged in the sample during
sonication. Amplitude was set to 100% and sonication pulse was set to 2 seconds on and
3 seconds off, whereas cooling water bath was used to control sludge temperature, which
remained constant at 27˚C± 3˚C during the experiments. All samples were placed on a
magnetic stirrer with a speed of 350 ± 50 rpm during sonication.
4.2.2 Analytical Methods:
Sludge parameters such as chemical oxygen demand (COD), biological oxygen demand
(BOD), total suspended solids (TSS), volatile suspended solid (VSS), volatile fatty acids
(VFA), particle size distribution (PSD), lipids, ammonia and total, soluble and bound
proteins were measured in triplicates for both primary sludge and WAS after each
sonication time. All sludge parameters were analyzed according to the Standard Methods

104
(APHA, [20]). However, particulate, soluble and bound proteins were analyzed using
Lowry et al. [21] Protein was determined by micro-bicinchoninic acid protein assay
(Pierce, Rockford, USA), which was modified by Lowry et al. [21] method using a
standard solution of bovine serum albumin. Cell protein was calculated as the difference
between particulate and bound protein. 50 mL samples were centrifuged at 10,000 rpm
for 15 minutes at 5 ˚C to separate the liquid and solids in the sample. The supernatant was
filtered through a 1.5 µm glass microfiber filter (GLAS 934-AH 8.5cm, Whatman) and
the filtrate was analyzed for the soluble protein fraction. Bound protein was extracted
from the suspended solids by mild pH 8 phosphate buffers (50 µm), while particulate
protein representing both the bound protein adsorbed on biomass and the protein within
the biomass was extracted by an alkaline 1 N NaOH solution. The solids from the filter
were re-suspended to a total volume of 50 mL with pH 8 phosphate buffer (50 µm) for
measuring bound protein and 1 N NaOH for particulate protein. The solution was mixed
using a magnetic stirrer at 1500 rpm for 10 minutes, and centrifuged at 10,000 rpm for
15 minutes at 5˚C, with the centrate filtered through a 1.5 µm glass microfiber filter, prior
to protein analysis. The concentrations of VFA were measured from the filtrate after
passing the sludge through 0.45 µm filter using a gas chromatograph (Varian 8500,
Varian Inc., Toronto, Canada) with a flame ionization detector (FID) equipped with a
fused silica column (30 m × 0.32 mm) while a 1µm film thickness. Helium was used as
carrier gas at a flow rate of 5 mL/min. The temperatures of the column and detector were
110 and 250 °C, respectively.
The particle size distribution and specific surface area (SSA) were determined by
Malvern Mastersizer 2000 (version 5.22) laser beam diffraction granulometer (Malvern

105
Instruments Ltd, England). Table 4.1 displays the full characteristics of the sludges used
in this study.
Table 4. 1 Characteristics of the primary and WAS used in the experiment.
Parameter (mg/L) Primary Sludge Waste Activated Sludge
TCOD 40760 ± 2250 22060 ± 1530
SCOD 2175 ± 140 720 ± 25
TSS 31500 ± 2002 22380 ± 1967
VSS 27840 ± 1876 15740 ± 1034
Lipid 4930 ± 193 1647 ± 98
VFA 1064 ± 72 1778 ± 180
Total Protein 2694 ± 187 1478 ± 79
Bound Protein 571 ± 34 350 ± 22
Soluble Protein 242 ± 18 121 ± 11
SBOD 450 ± 30 105 ± 17
Ammonia 436 ± 28 322 ± 18
4.2.3 Batch Anaerobic Digestion:
Batch anaerobic biodegradability studies were conducted to evaluate the effect of
sonication on biodegradability and gas production. 90 mL of seed or anaerobic culture
(VSS of 12,000 mg/L) obtained from a full scale anaerobic digester at St. Marys, Water
Pollution Control Plant (Ontario, Canada) was mixed with 110 mL of primary sludge in
250 mL bottles capped with teflon septum and incubated in a rotary shaker (MaxQ 4000,

106
Incubator and Refrigerated Shaker, Thermo Scientific, CA) at 37oC and 180 rpm.
Similarly, 140 mL of WAS and 60 mL of seed were added together in 250 mL bottles
capped with teflon septum. All bottles were sealed after purging the headspace with
nitrogen to eliminate the presence of oxygen/air. Twenty three bottles were used for each
type of sludge, two bottles were set as blanks and the rest were used for sonicated and
non-sonicated samples, three for each sonication time. The volumes of substrate (primary
and waste activated sludge) and seed (anaerobic digester sludge) were determined based
on food (as COD) to microorganism (as VSS) ratio of 4. For the blank, the substrate
volume was replaced by distilled water.
The total gas volume was measured by releasing the gas pressure in the bottles using
appropriately sized glass syringes (Perfektum; Popper & Sons Inc., NY, USA) in the 5–
100 mL range and equilibrated with the ambient pressure as recommended by Owen et al.
[22]. Biogas composition was determined by a gas chromatograph (Model 310, SRI
Instruments, Torrance, CA) equipped with a thermal conductivity detector (TCD) and a
molecular sieve column (Molesieve 5A, mesh 80/100, 182.88 × 0.3175 cm). The
temperatures of the column and the TCD detector were 90 and 105 °C, respectively.
Argon was used as a carrier gas at a flow rate of 30 mL/min. The experiment continued
until the increase in methane over a period of one day was only one percent of the prior
total volume.

107
4.2.4 Specific Energy (SE) Input:
SE is defined as the energy input per unit mass of sludge (as TSS) to achieve a certain
degree of disintegration. The specific energy input is a function of ultrasonic power (P in
kW), sonication time (t in seconds), volume of sonicated sludge (V in L) and TSS
concentration (TSS in g/L), and can be calculated using the following equation [23]:
( ) ( )1.4TSSV
tPTSS kJ/g ES L×
×=
For primary sludge, sonication times of 1, 5, 10, 20, 40, and 60 minutes correspond to
specific energy of 0.5, 2.3, 4.8, 9.1, 17.6, and 24.6 kJ/g TSS, while for WAS the
sonication times of 1, 5, 10, 20, 40, and 60 minutes correspond to specific energy of 0.7,
3.2, 6.8, 12.2, 24.9, and 32.9 kJ/g TSS. Furthermore, the specific energy calculated is
based on the actual power drawn by the device and does not reflect the efficiency of
power transmission to the sludges.
4.2.5 Anaerobic Modeling:
As mentioned earlier, ADM1 is a complex model involving many input parameters which
has been discussed in chapter 2. Inhibition and gas transfer are also complex steps in the
model. In this study, inhibition due to pH, NH3, etc. was ignored for simplicity, and the
simulation results were compared with the total methane production. The ADM1
stoichiometric matrix used was the one presented by Batstone et al. [14] and Galí et al.
[25]. The stoichiometric matrix contains the components, stoichiometric coefficients and
reaction rates [14] are presented in Appendix A.

108
4.2.6 Statistical analysis:
The student t-test was used to test the hypothesis of equality at the 95% confidence level.
The null hypothesis was defined to be: no difference between the two groups tested vs.
the alternative hypothesis of there is a statistical difference between the two groups.
4.3 Results and discussion
4.3.1 Chemical Oxygen Demand (COD):
Due to sonication, average SCOD increased from 2175 mg/L to 7405 mg/L and from 720
mg/L to 5070 mg/L after 60 minutes sonication (~25 KJ/g TSS for PS and ~33 KJ/g TSS
for WAS) for primary and WAS, respectively. As expected TCOD remained constant
with less than 10% variation during sonication and averaged 42180 ± 2629 and 21350 ±
1809 for primary and WAS, respectively. Figure 4.1 shows that the maximum
SCOD/TCOD ratio for treated sludge increased from 5.3% to 18% and 3.3% to 27% after
60 minutes (~25 KJ/g TSS for PS and ~33 KJ/g TSS for WAS) of pretreatment for
primary and waste activated sludge, respectively.

109
0
5
10
15
20
25
30
0 5 10 15 20 25 30 35Specific Energy (KJ/g TSS)
SCO
D/T
CO
D(%
)
PrimaryWAS
Figure 4.1 SCOD/TCOD ratio as a function of specific energy for primary and waste
activated sludge.
It is important to mention that although the SCOD/TCOD ratios in primary and WAS
were different, after 60 minutes sonication (12.7% and 23.7% for primary and WAS,
respectively), the SCOD released were comparable at 5230 mg/L and 4350 mg/L for
primary and WAS, respectively. The increase in SCOD/TCOD ratio is due to the release
of extracellular polymeric substances (EPS), i.e., polysaccharides, proteins etc., which are
embedded in the floc matrix [26], that is disintegrated due to sonication. This shows that
sonication influences solubilization of particulate COD as the ratio increases with
sonication, however the final SCOD/TCOD ratios suggest that the majority of the
particulate matter was not solubilized.
4.3.2 Biological Oxygen Demand (BOD):
Due to sonication, soluble biological oxygen demand (SBOD) increased from 450 to
1032 mg/L and from 105 to 975 mg/L after 60 minutes sonication (~25 KJ/g TSS for PS

110
and ~33 KJ/g TSS for WAS), for primary and WAS, respectively. The initial rate of
SBOD release of 207 mg/L per kJ/g TSS for WAS was higher than the 52 mg/L per kJ/g
TSS observed for primary sludge. Figure 4.2 shows the ratio of SBOD to TCOD for both
primary and WAS as a function of specific energy; SBOD/TCOD ratio increased due to
sonication of the organic matters from 1.1% to 2.5% and 0.5% to 4.4% (582 mg
SBOD/L) and (870 mg SBOD/L) after 60 minutes for primary and WAS, respectively.
0
1
2
3
4
5
6
0 5 10 15 20 25 30 35Specific Energy (KJ/g TSS)
SBO
D/T
CO
D(%
)
PrimaryWAS
Figure 4.2 SBOD/TCOD ratio as a function of specific energy for primary and waste
activated sludge.
Furthermore, it is noticeable that the SBOD/TCOD ratio almost reached a plateau after 20
minutes sonication (4.35% and 2.47% for WAS and primary, respectively). This increase
in biodegradable organic matter is an indication of the potential enhancement of sludge
digestion [10, 27, 29].

111
4.3.3 Proteins:
Dimock and Morgenroth [30], divided proteins in wastewater and sludge into three
fractions: soluble, bound/labile (loosely attached with the cells) and tightly bound
fractions (within the bacterial cells). Labile proteins are thought to become readily
bioavailable giving rise to higher odor potential [31]. Particulate (cell + bound), soluble,
and bound protein were monitored in this study.
An increase in soluble protein from 242 to 1335 and 121 to 956 mg/L was observed for
primary and WAS, respectively, simultaneous with a decrease in particulate protein from
2694 to 884 and 1478 to 876 mg/L, and a decrease in bound protein from 571 to 452 and
350 to 163 mg/L during sonication. Particulate protein, which is the cellular and
extracellular protein loosely bound to the cell, disintegrated and was mostly converted
into soluble protein. It was observed that the overall protein (total protein + soluble
protein) remained constant at 2476 ± 331 mg/L for specific energy in the range of 0 to 25
kJ/g TSS for primary and 1802 ± 117 for specific energy in the range of 0 to 33 kJ/g TSS
for WAS. Figures 4.3, 4.4, and 4.5 show the variation of particulate, soluble, and bound
protein per TCOD with specific energy, while Figures 4.6 and 4.7 depict the variation of
bound protein per mg VSS with specific energy for primary sludge and WAS,
respectively.

112
0
2
4
6
8
0 5 10 15 20 25 30 35Specific Energy (KJ/g TSS)
P-Pr
otei
n/T
CO
D(%
)
PrimaryWAS
Figure 4.3 Particulate protein/TCOD as a function of specific energy for primary and
waste activated sludge.
0.0
0.5
1.0
1.5
2.0
0 5 10 15 20 25 30 35Specific Energy (KJ/g TSS)
B-P
rote
in/T
CO
D(%
)
PrimaryWAS
Figure 4.4 Bound protein/TCOD as a function of specific energy for primary and waste
activated sludge.
0
1
2
3
4
5
0 5 10 15 20 25 30 35Specific Energy (KJ/g TSS)
S-Pr
otei
n/TC
OD
(%)
PrimaryWAS
Figure 4.5 Soluble protein/TCOD as a function of specific energy for primary and waste
activated sludge

113
Primary Sludge
0
10
20
30
40
50
60
0 5 10 15 20 25 30Specific Energy (KJ/g TSS)
mg
Bou
ndPr
otei
n/g
VSS
B-Ptotein after Sonication
B-Protein after degradation
Figure 4.6 Bound protein / mg VSS as a function of specific energy for primary sludge
during anaerobic digestion.
Waste Activated Sludge
0
10
20
30
40
50
60
70
80
90
100
0 5 10 15 20 25 30 35Specific Energy (KJ/g TSS)
mg
Bou
ndPr
otei
n/g
VSS
B-Ptotein after Sonication
B-Protein after degradation
Figure 4.7 Bound protein / mg VSS as a function of specific energy for waste activated
sludge during anaerobic digestion.

114
After 60 minutes of sonication the bound protein/TCOD decreased from 1.4% to 1.1%
and 1.6% to 0.8%; particulate protein/TCOD decreased from 6.6% to 2.2% and 6.7% to
4%; and soluble protein/TCOD increased from 0.6% to 3.3% and 0.6% to 4.4% for
primary and WAS, respectively. While this marginal decrease in bound protein may
reflect the beneficial impact of ultrasound on the odor precursors in biosolids, there are
two major concerns, namely the cost of energy and equally important is the anaerobic
biodegradability. After anaerobic digestion, the percentage reductions in bound protein
for sludges sonicated at 0, 1, 5, 10, 20, 40, and 60 minutes were 63%, 62%, 48%, 54%,
52%, 45%, and 40% for primary and 73%, 70%, 62%, 57%, 53%, 48%, and 44% for
WAS, as depicted in Figures 4.6 and 4.7. The t-test method was conducted to compare
the digested bound protein in both primary and WAS. The null hypothesis i.e, there are
no differences between bound protein in both sludges, has been accepted based on the
calculated t-value (2.23) and P-value of 0.68 at 95% confidence level. Thus, it can be
concluded that there was no statistically significant difference in the digested bound
proteins between primary and WAS samples, with the primary being in the range of 23.2-
28.6 vs. 23.8-31.9 mg protein/ gVSS for the WAS. The results suggest that there is no
enhancement in the final degradation of bound protein after digestion in both sludges due
to sonication.
Figure 4.8 depicts the cell protein released, calculated as particulate protein less the
bound protein, as a function of specific energy for both PS and WAS. It is clear from
Figure 4.8 that low sonication times in the range of 0 to 5 minutes have no effect on the
microbial cells as reflected by the initial lag-phase on the curves.

115
0
500
1000
1500
2000
0 10 20 30 40Specific Energy (KJ/g TSS)
Cel
lPro
tein
Rel
ease
d(m
g/L)
PrimaryWAS
Figure 4.8 Cell proteins released as a function of specific energy for primary and waste
activated sludge.
After 5 minutes of sonication (~2.3 KJ/g TSS for PS and 3.2 KJ/g TSS for WAS) a slow
increase in WAS cell protein release relative to the fast increase in primary sludge was
experienced, with WAS increasing from 20 to 415 mg/L vs. 70 to 1690 mg/L in the case
of primary, clearly emphasizing that microbial cells in the WAS are harder to rupture
than the microbial cells in primary sludge. Moreover, sonication energy of less than 5
kJ/g TSS appears to have no effect on microbial cells in both types of sludges.
4.3.4 Volatile Fatty Acids (VFA):
VFA increased from 1065 mg/L to 1795 mg/L and from 1778 mg/L to 2932 mg/L after
60 minutes of sonication, for primary and WAS, respectively. Figure 4.9 depicts that the
VFA/TCOD ratio increases with increasing specific energy; the ratio distinctly increased
in the case of waste activated sludge but not as much as in the case of primary sludge.

116
02468
10121416
0 5 10 15 20 25 30 35Specific Energy (KJ/g TSS)
VFA
/TC
OD
(%)
PrimaryWAS
Figure 4.9 VFA/TCOD as a function of specific energy for primary and waste activated
sludge.
VFA/TCOD ratio for treated sludge increased from 2.6% to 4.4% and from 8.1% to
13.3% after 60 minutes of pretreatment for primary and WAS, respectively. The observed
increase in VFA is similar to the observation of Appels et al. [32], who sonicated WAS at
3.8% to 4.85 % solids (38.1 to 48.5 g dry solid/kg) at 1.25 kJ/g TS and observed an
increase in VFA from 94.4 to 565 mg/L. The ratio of VFA released (730 and 1154 mg/L)
to SCOD released (5230 and 4350 mg/L) was 14% and 27% for primary and WAS,
respectively. The increase in VFA is probably due to oxidation of larger hydrocarbons by
the hydroxyl radicals produced during the explosion of cavitation bubbles [32]. However,
the observation that VFA increased by about 1150 mg/L in WAS and only 730 mg/L in
primary sludge coupled with the much higher cell protein destruction in the primary
sludge relative to the WAS (Figure 4.8) indicates that a possible microbial role can not be
ruled out.

117
4.3.5 Particle Size Distribution:
The particle size distributions by volume fraction as a function of sonication time are
shown in Table 4.2 for primary and WAS.
Table 4. 2 The median, 10%ile and 90%ile for the volume fraction of the primary and WAS.
Spec. Energy. (KJ/g TSS) d(10) d(50) d(90) 0 17.7 59.4 126.3
0.5 8.1 26.2 79.8 2.3 5.8 19.9 56.5 4.8 5.5 20.9 79.8 9.1 4.8 23.4 76.6 17.6 1.5 18.5 - Pr
imar
ySl
udge
24.6 1.5 13.3 - 0.0 23.7 107.0 297.2 0.7 9.8 40.5 135.3 3.2 6.2 20.8 78.7 6.8 6.1 16.1 37.3 12.2 6.5 16.4 34.8 24.9 6.4 15.9 32.1
WA
S
32.9 5.1 12.2 28.9
The results clearly show the change in particle size. In the case of primary sludge, the
median (d50) of the particle size decreased by 78% from 59.4 to 18.3 µm after 60 minutes
of sonication and by 89% from 106.6 to 20.2 µm, in the case of WAS. Since hydrolysis is
predominantly dependent on surface area rather than volume [33, 34], the hydrolysis rate
decreased when the biomass concentration was high, as mass transfer limitations were
observed due to limited surface area [35], and hence the impact of sonication on specific
surface area (SSA) was examined. Figure 4.10 shows the specific surface area (m2/g) as
a function of specific energy.

118
00.20.40.60.8
11.21.41.61.8
0 5 10 15 20 25 30 35Specific Energy (KJ/g TSS)
Spec
ific
Surf
ace
Are
a(m
2/g)
ofso
lids
PrimaryWAS
Figure 4.10 Specific surface area (m2/g) as a function of specific energy.
It is interesting to note that no significant effect on SSA was experienced after 5 minutes
(3.2 KJ/g TSS) sonication in the case of WAS as it reaches a plateau of ~0.62 m2/g. This
finding suggested that with sonication pretreatment, particle size can only be reduced to a
certain level in the case of WAS. The primary sludge, however, reaches the same SSA of
0.62 m2/g between 5 and 20 minutes of sonication, an increase (from 0.62 to ~1.4 m2/g)
in SSA was experienced after 40 minutes sonication (~17 kJ/gTSS).
4.3.6 Methane Production: Figures 4.11 and 4.12 show the cumulative mL CH4 /g COD added produced from primary
and WAS, respectively.

119
Primary Sludge
0
20
40
60
80
100
120
140
160
180
0 100 200 300 400 500Time (hr)
mL
CH
4/g
CO
Dad
ded
untreated1 min sonication5 min sonication40 min sonication
Figure 4.11 Methane yield of the untreated and treated primary sludge over the digestion
time
WAS Sludge
0
20
40
60
80
100
120
140
0 50 100 150 200 250 300 350 400Time (hr)
mL
CH
4/g
CO
Dad
ded
untreated1 min sonication5 min sonication40 min sonication
Figure 4.12 Methane yield of the untreated and treated waste activated sludge over the
digestion time
The primary sludge results however exhibited an interesting pattern; the maximum rate of
methane production remained constant at 3.65 ± 0.21 mL/h for low sonication times of 0
to 10 minutes, but decreased significantly with higher sonication time to 1.99 and 1.66

120
mL/h at 40 and 60 minutes. This decrease of maximum methane production rate at
sonication times of 40 and 60 minutes corresponding to specific energies of 17.6 and 24.6
kJ/g TSS is consistent with the sharp decrease in biomass (as reflected by cell protein
release) from 338 to 1691 mg/L after 10 minutes of sonication depicted in Figure 4.8.
This pattern was not observed in the case of WAS, where the maximum rate of methane
production increased from 1.66 mL/h in the untreated sample to 2.15, 2.28, 2.18, 2.08,
and 2.12 mL/h for sonication times of 1, 5, 10, 20, 40, and 60, respectively. The results
show that there is no significant change in the maximum rate after one minute sonication,
as the average ± standard deviation was 2.17 ± 0.07. Table 4.3 displays the percentage
increase in ultimate methane (CH4) production in primary and WAS; 28% and 25%
enhancement in methane production were observed after 5 minutes of sonication for
primary and WAS, respectively.
Table 4. 3 Percentage of CH4 increase in primary and waste activated sludge as a function of sonication time.
The methane production did not increase significantly with further increases in sonication
time in the case of WAS, after 5 minutes the percentage increase in methane production
varied randomly between 24% and 26%. However, the percentage increase in methane
Percent of CH4 increase (%) Sonication time (min) Primary Sludge Waste Activated Sludge
1 16 16 5 28 25
10 29 25 20 31 25 40 36 24 60 38 26

121
production reached 38% in the case of primary at 60 minutes sonication due to higher
COD solubilization.
4.3.7 Anaerobic Modeling:
In this study, based on the ADM1 steady-state model, equations were rearranged to
simulate the anaerobic digestion in batch reactors. AQUASIM 2.1 was used to solve the
dynamic differential and algebraic system of equations. Total protein, lipid, carbohydrate
and VFAs were the model inputs with protein based on C6H14O2N2, lipid based on
C57H104O6 [36], carbohydrate (estimated from the particulate COD mass balance), acetate,
propionate, and butyrate [14]. Table 4.4 presents the ADM1 input sludge characterization
at different sonication times.
The model parameters (reaction coefficients) and degraders were set to the default values
suggested by the ADM1 technical report [14]. The various components of biomass i.e.
sugar degraders, amino acid degraders, long chain fatty acid degraders, valerate and
butyrate degraders, propionate degraders, acetate degraders, and hydrogen degraders,
were set at 200 mgCOD/L following the recommendation of Jeong et al. [37], who
evaluated the sensitivities of the kinetic and stoichiometric ADM parameters in
predicting anaerobic glucose digestion and concluded that biomass was closely associated
with the Monod maximum specific uptake rate, that values could not be independently
determined and verified.

122
Table 4. 4 Primary and WAS sludge characterization for ADM1
Sonication time
Description 0 1 5 10 20 40 60
X_pr Proteins 15858 16144 16138 14451 12557 10183 9770
X_li Lipids 14192 14200 13831 12060 11740 10852 10703
X_ch Carbohydrate 8824 9590 10800 10988 12102 12673 13170
S_ac Acetic acid 330 393 534 544 650 670 835
S_pro Propionic acid 237 272 323 340 377 382 384
Prim
ary
(mg
CO
D/L
)
S_bu Butyric acid 497 514 535 523 534 555 576
X_pr Proteins 11689 11736 11729 10406 9219 8805 8024
X_li Lipids 4743 4805 4962 4617 4354 4299 3916
X_ch Carbohydrate 5281 5084 5371 4461 4546 4341 4141
S_ac Acetic acid 719 1085 1221 1346 1701 1778 1912
S_pro Propionic acid 498 547 701 681 673 633 688 WA
S(m
gC
OD
/L)
S_bu Butyric acid 562 553 664 665 664 665 682
The typical variations of methane production with time at different sonication intensities
obtained from the batch experiments were used to optimize the model parameters,
namely, km_c4 (valerate and butyrate) and km_ac (acetate) using the automated Parameter
Estimation feature available in AQUASIM. The default value of km_c4 and km_ac were
changed based on the estimation results from 0.833 to 1.092 hr-1 and 0.333 to 1.154 hr-1,
respectively for primary sludge and from 0.333 to 0.526 hr-1 for km_ac in the case of WAS.
It must be noted that the ADM1 report has indicated that variations of 30% and 300% in
km_c4 and km_ac from the default values are acceptable. Figures 4.13 and 4.14 show
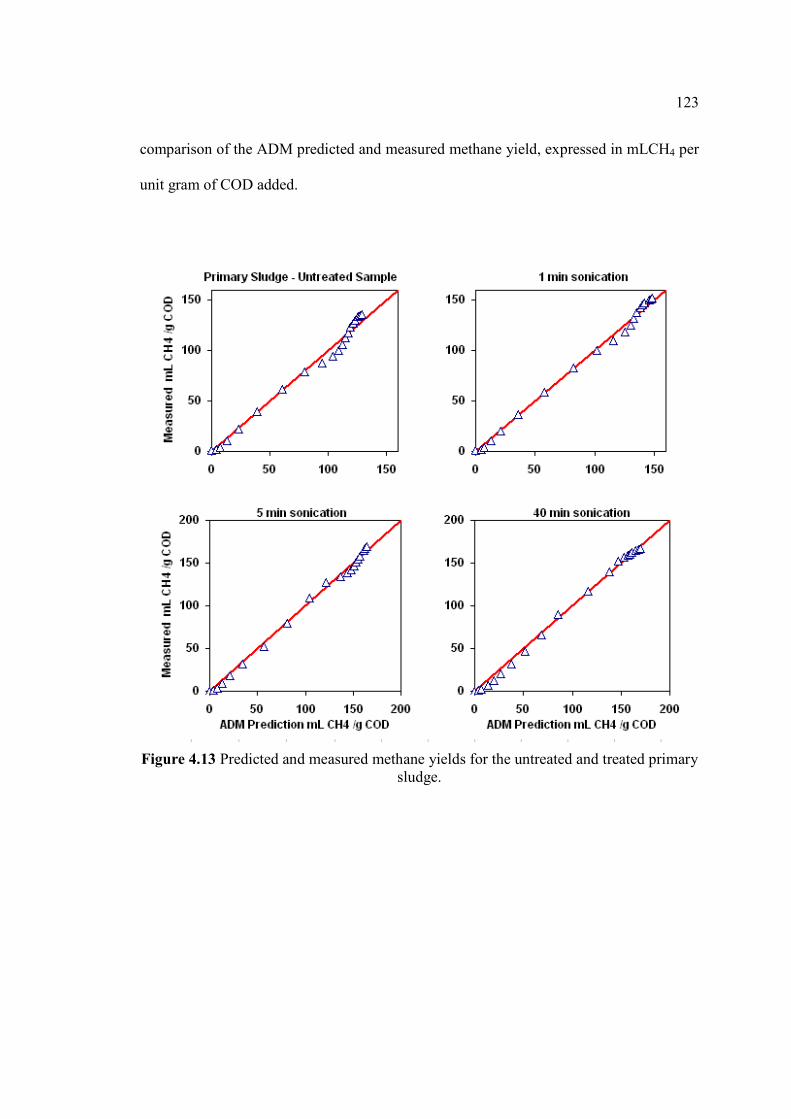
123
comparison of the ADM predicted and measured methane yield, expressed in mLCH4 per
unit gram of COD added.
Figure 4.13 Predicted and measured methane yields for the untreated and treated primary sludge.
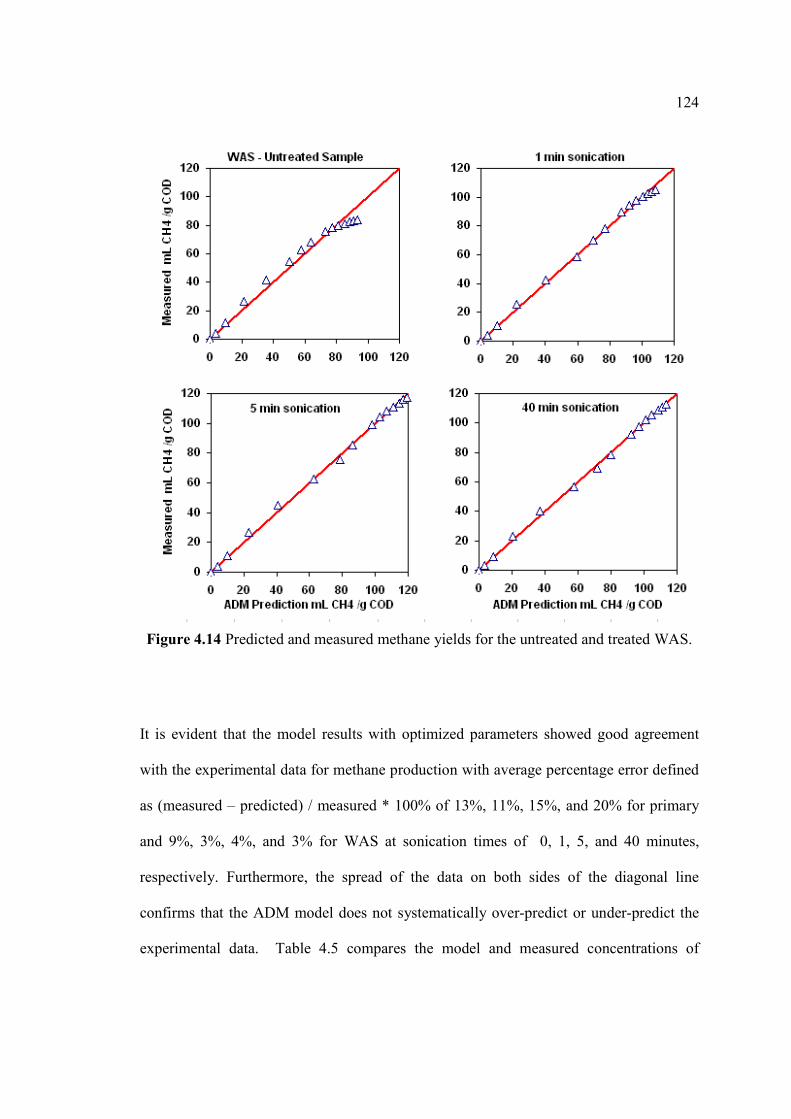
124
Figure 4.14 Predicted and measured methane yields for the untreated and treated WAS.
It is evident that the model results with optimized parameters showed good agreement
with the experimental data for methane production with average percentage error defined
as (measured – predicted) / measured * 100% of 13%, 11%, 15%, and 20% for primary
and 9%, 3%, 4%, and 3% for WAS at sonication times of 0, 1, 5, and 40 minutes,
respectively. Furthermore, the spread of the data on both sides of the diagonal line
confirms that the ADM model does not systematically over-predict or under-predict the
experimental data. Table 4.5 compares the model and measured concentrations of

125
volatile fatty acids for both primary and WAS. It is evident from Table 4.5 that in general
the ADM model predictions for the individual volatile acids and the overall VFA are well
within the range of experimental data i.e, average ± standard deviation.
Table 4. 5 Predicted and Measured Concentrations (average ± Stdev) of acetic, butyric,
propionic acids, and VFA after anaerobic digestion
Acetic acid (mg COD/L) Butyric acid (mg COD/L)
SE
(KJ/g TSS) Input
Output Exp.
Output ADM Input
Output Exp.
Output ADM
0.0 330 ± 29.7 13 ± 1.3 11 237 ± 28.5 43 ± 4.3 42
0.5 392 ± 31.4 56 ± 5.1 15 272 ± 29.9 51 ± 5.1 53
2.3 533 ± 37.3 47 ± 3.3 42 323 ± 42.0 124 ± 11.2 111
4.8 543 ± 48.9 64 ± 5.1 54 340 ± 27.2 181 ± 14.5 129
9.1 649 ± 51.8 67 ± 6.7 63 377 ± 26.4 278 ± 22.3 289
17.6 669 ± 66.6 68 ± 7.5 65 382 ± 34.4 350 ± 31.5 320
PS
24.6 835 ± 91.7 73 ± 6.5 0 384 ± 42.3 352 ± 24.7 323
0.0 719 ± 71.8 205 ± 20.5 175 562 ± 50.6 505 ± 60.6 498
0.7 1085 ± 79.7 487± 48.7 428 553 ± 44.3 488 ± 53.6 467
3.2 1221 ± 85.5 548 ± 49.3 502 664 ± 46.5 647 ± 84.1 621
6.8 1346 ± 107.7 567 ± 45.4 594 665 ± 59.8 643 ± 51.4 628
12.2 1701 ± 177.8 966 ± 77.3 987 664 ± 53.1 589 ± 41.2 577
24.9 1778 ± 195.5 987 ± 89.3 1071 665 ± 66.5 645 ± 58.0 633
WA
S
32.9 1702 ± 153.2 998 ± 69.9 1010 612 ± 67.3 544 ± 59.9 588
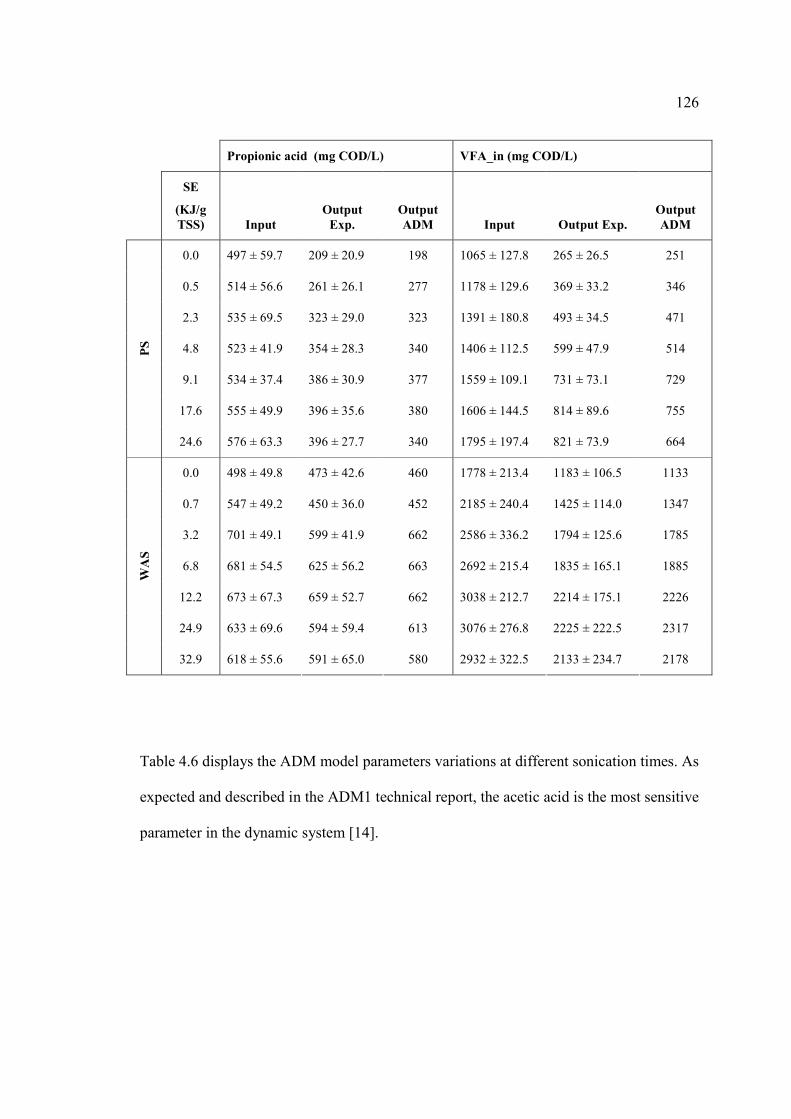
126
Propionic acid (mg COD/L) VFA_in (mg COD/L)
SE
(KJ/g TSS) Input
Output Exp.
Output ADM Input Output Exp.
Output ADM
0.0 497 ± 59.7 209 ± 20.9 198 1065 ± 127.8 265 ± 26.5 251
0.5 514 ± 56.6 261 ± 26.1 277 1178 ± 129.6 369 ± 33.2 346
2.3 535 ± 69.5 323 ± 29.0 323 1391 ± 180.8 493 ± 34.5 471
4.8 523 ± 41.9 354 ± 28.3 340 1406 ± 112.5 599 ± 47.9 514
9.1 534 ± 37.4 386 ± 30.9 377 1559 ± 109.1 731 ± 73.1 729
17.6 555 ± 49.9 396 ± 35.6 380 1606 ± 144.5 814 ± 89.6 755
PS
24.6 576 ± 63.3 396 ± 27.7 340 1795 ± 197.4 821 ± 73.9 664
0.0 498 ± 49.8 473 ± 42.6 460 1778 ± 213.4 1183 ± 106.5 1133
0.7 547 ± 49.2 450 ± 36.0 452 2185 ± 240.4 1425 ± 114.0 1347
3.2 701 ± 49.1 599 ± 41.9 662 2586 ± 336.2 1794 ± 125.6 1785
6.8 681 ± 54.5 625 ± 56.2 663 2692 ± 215.4 1835 ± 165.1 1885
12.2 673 ± 67.3 659 ± 52.7 662 3038 ± 212.7 2214 ± 175.1 2226
24.9 633 ± 69.6 594 ± 59.4 613 3076 ± 276.8 2225 ± 222.5 2317
WA
S
32.9 618 ± 55.6 591 ± 65.0 580 2932 ± 322.5 2133 ± 234.7 2178
Table 4.6 displays the ADM model parameters variations at different sonication times. As
expected and described in the ADM1 technical report, the acetic acid is the most sensitive
parameter in the dynamic system [14].

127
Table 4. 6 Primary and WAS sludge model parameters at different sonication times.
Sonication time
Parameter 0 1 5 10 20 40 60
khyd_CH Carbohydrate 0.25
khyd_PR Proteins 0.2
khyd_LI Lipids 0.1
km_su Sugar 0.03
km_aa Amino acid 0.05
km_fa LCFA 0.006
No Change
km_c4 Butyric & Valeric acid 1.092 1.001 0.914 0.885 0.842 0.769 -
km_pro Propionic acid 0.013 No Change
km_ac Acetic acid 1.154 1.157 0.992 0.996 0.830 0.803 -
Prim
ary
Slud
ge
km_h2 Hydrogen 0.035 No Change
khyd_CH Carbohydrate 0.25
khyd_PR Proteins 0.2
khyd_LI Lipids 0.1
km_su Sugar 0.03
km_aa Amino acid 0.05
km_fa LCFA 0.006
km_c4 Butyric & Valeric acid 0.833
km_pro Propionic acid 0.013
No Change
km_ac Acetic acid 0.526 0.428 0.422 0.401 0.356 0.354 0.344
WA
SSl
udge
km_h2 Hydrogen 0.035 No Change

128
As the acetic acid concentration increased with sonication time, the simulated reaction
coefficient of the acetic acid decreased. This result is not intuitive as the reaction rates of
the VFAs are influenced by both the reaction rate constant and the concentration of the
VFAs in the sludge. As can be seen in Table 4.6, the acetic acid concentration increased
with increasing sonication time for both primary sludge and WAS. However, the decrease
in the rate constant is only about 30%-34% for both sludges, which also corresponds to
the increased CH4 yield in both the cases (about 26%-38%).
4.3.8 Economic Viability of Ultrasound:
An empirical model was developed to illustrate the relationship between CH4 increase
and specific energy for primary and waste activated sludge. The model was then used to
verify the economical viability of ultrasonic pretreatment. Figures 3.15 and 3.16 show the
empirical model for primary and waste activated sludge, respectively.
Figure 4.15. Increase in volume of methane produced in treated primary sludge

129
Figure 4.16 Increase in volume of methane produced in treated WAS.
The results are presented in Table 4.7, which shows the specific energy input per ton of
TCOD, as well as the value of the methane produced based on power and natural gas
costs of $0.07/kWh and $0.28/m3, respectively. The Power ($)/ ton CODin was
conducted using the formula shown below:
Power ($)/ ton CODin = power (kW.h)/ [TCODin (ton) * volume (L)] * power cost ($)
It must be asserted that the sonication power used in the economic evaluation is the “real”
power drawn by the sonicator and not the “actual” power transmitted to the liquid sludge
since no information was available on the efficiency of the ultrasonic generator. It is
evident that ultrasonic pretreatment is not economically viable for high specific energy.
However, it is economically viable for primary sludge at low sonication doses of 0.1, 0.5,
and 1 kJ/g TSS (values in bold). The empirical model can be used to estimate the increase
in methane production for different sludges using different values of specific energy.

130
Table 4.7 Specific energy, power and methane energy per ton of COD using the
empirical model.
Per ton COD in
Primary Sludge
TCOD = 40765 mg/L
WAS
TCOD =22058 mg/L
SE (kJ/g TSS) Power ($) CH4 ($) Power ($) CH4 ($)
0.1 3.63 8.52 6.70 5.10
0.5 18.13 28.34 33.50 16.74
1 36.25 39.94 66.99 23.42
2 72.50 50.24 133.99 29.26
4 145.01 57.66 267.98 33.44
10 362.52 63.28 669.94 36.56
15 543.77 64.68 1,004.91 37.34
4.4 Conclusions
The effect of pretreatment of both primary and waste activated sludge using ultrasound
can be summarized as follows:
o After 60 minutes of sonication corresponding to specific energy of ~25 kJ/g TSS for
primary and ~33 kJ/g TSS for WAS, SCOD/TCOD ratio increased from 5.5% to 18%
and 3.3% to 27%, SBOD/TCOD ratio increased from 1.1% to 2.5% and 0.5% to
4.4%, VFA/TCOD ratio increased from 2.6% to 4.4% and from 8.1% to 13.3%,
bound protein/TCOD decreased from 1.4% to 1.1% and 1.6% to 0.8%; total
protein/TCOD decreased from 6.6% to 2.2% and 6.7% to 4%; and soluble
protein/TCOD increased from 0.6% to 3.3% and 0.6% to 4.3%, while total methane
production increased by 28% and 25% after 5 minutes of sonication for primary and
WAS, respectively.
131
o The effect of sonication on digested bound protein was not statistically significant for
both primary and WAS samples at 95% confidence.
o Although, there is an increase in sludge surface area with sonication, no significant
effect on specific surface area was found after 5 minutes of (3.2 KJ/g TSS) sonication
in the case of WAS but for the primary sludge specific surface area increased by 8
times after 40 minutes of sonication (~17 kJ/gTSS).
o The Anaerobic Digestion Model #1 (ADM1) predicted well both the methane
production and volatile fatty acids concentrations. The simulated rate constants for
acetic acid and butyric acid uptake decreased by 30%-34% with sonication time.
o Ultrasound is neither economical for biogas enhancement despite the high
solubilization of COD, nor effective in enhancing the biodegradability of bound
proteins. However, at low sonication energy of 0.1, 0.5, and 1 kJ/g TSS, the process is
economical for primary sludge only.
132
4.5 References
[1] Karakashev, D.; Thomsen, A. B.; Angelidaki, I. Anaerobic biotechnological
approaches for production of liquid energy carriers from biomass, Biotechnology
Letters, 2007, 1005-1012.
[2] Amon, B. A.; Boxberger, J.; Alt, C. Emissions of NH3, N2O and CH4 from dairy cows
housed in a farmyard manure tying stall (housing, manure storage, manure
spreading). Nutr Cycl Agroecosyst. 2001, 60, 103-113.
[3] Lens, P.; Westmann, P.; Haberbauer, M. and Moreno, A. Biofuel for Fuel Cells
Tunbridge Wells. UK, IWA Publishing. 2005.
[4] Claassen, P. A. M.; van Lier, J. B.; Lopez Contreras, A. M.; van Niel, E. W. J.;
Sijtsma, L.; Stams, A. J. M.; de Vries, S. S.; Weusthuis, R. A. Utilisation of
biomass for the supply of energy carriers. Appl. Microbiol. Biotechnol., 1999. 52,
741–755.
[5] Eastman, J. A.; Ferguson, J.F., Solubilization of particulate organic carbon during the
acid phase of anaerobic digestion. J. Water Pollut. Control Fed. 1981, 53, 352–366.
[6] Harrison, S.T.L., Bacterial cell disruption: a key unit operation in the recovery of
intracellular products, Biotechnol, 1991, 9, 217–240.
[7] Suslick, K. Sonochemistry. The temperature of cavitations. Science. 1991, 253, 1397–
1399.
[8] Kuttruff, H. Essex, England, Ultrasonics Fundamentals and Applications. Elsevier
Science 1991.

133
[9] Hwang, K. Y.U; Shin, E.B; Choi, H.B., A mechanical pretreatment of waste activated
sludge for improvement of anaerobic digestion system, Water Sci. Technol. 1997,
36 , 213-220.
[10] Tiehm, A.; Nickel, K.; Neis, U. The use of ultrasound to accelerate the anaerobic
digestion of sewage sludge. Water Sci. Technol. 1997, 36, 121–128.
[11] Cao, X. Q. Enhanced sludge decomposition by ultrasound. The R & D Centre for
Sustainable Environmental Biotechnology, Beijing Inst. of Civil Engineering, 2004.
[12] Brown, J. P., Ultrasonic solids treatment yields better digestion. WERF, Biosolids
Technical Bulletin. 2004.
[13] Gavala, H. N.; Angelidaki, I.; Ahring, B.K. Kinetics and modeling of anaerobic
digestion process. Adv. Biochem. Eng. Biotechnol. 2003, 81, 57-93.
[14] Batstone, D. J.; Keller, J.; Angelidaki, I.; Kalyuzhnyi, S.V.; Pavlostathis, S.G.;
Rozzi. A.; Sanders, W.T.M.; Siegrist, H.; Vavilin, V.A., Anaerobic Digestion
Model No. 1. IWA Task Group for Mathematical Modelling of Anaerobic
Digestion Processes 1-77. Water Sci. Technol. 2002, 45, 65–73.
[15] Batstone D.J.; Keller J., Industrial applications of the IWA anaerobic digestion
model No. 1 (ADM1), Water Sci. Technol. 2003, 47, 199-206.
[16] Johnson B.A.R.; Shang Y., Applications and limitations of ADM 1 in municipal
wastewater solids treatment, Water Sci. Technol 2006, 54, 77–82.
[17] Blumensaat, F.; Keller J.; Modelling of two-stage anaerobic digestion using the IWA
Anaerobic Digestion Model No.1 (ADM1), Water Research. 2004, 39, 171–183.
134
[18] Vanrolleghem, P.; Spanjers H, Britta P; Ginestet P, Takacs. Estimating
(combination of) activated sludge model no. 1 parameters and components by
respirometry. Water Sci. Technol. 1999, 39, 195–214.
[19] Choi, D. Modeling for optimization of activated sludge process and parameter
estimation using artificial intelligence. PhD thesis, Korea Advanced Institute of
Science and Technology, Republic of Korea. 2000.
[20] APHA. Standard Methods for the Examination of Water and Wastewater."
Washington DC, American Public Health Association, 1998.
[21] Lowry, O. H.; Rosebrough, N.J.; Farr, A.L.; Randall, R.J. Protein measurement with
the folin phenol reagent. J. Biol. Chem.1951, 193, 265–275.
[22] Owen, W.F.; Stuckey, D.C.; Healy, J.B.; Young. L.Y.; McCarty , P.L., Bioassay for
monitoring biochemical methane potential and anaerobic toxicity, Water Research.
1979, 13, 485–492.
[23] Bougrier, C.; Carrere, H.; Delgenes, J.P.; Solubilization of waste-activated sludge by
ultrasonic treatment, Chem. Eng. Journal. 2005, 106, 163-169.
[24] Gujer, W.; Henze M; Mino T; Loosdrecht M., Activated sludge model no. 3. Water
Sci. Technol. 1999, 39, 183–193.
[25] Galí, A., Benabdallah, T.; Astals S.; Mata-Alvarez, J.. Modified version of ADM1
model for agro-waste application. Bioresour. Technol. 2009,100, 2783-2790.
[26] Drews, A.; Vocksa, M.; Iversena, V.; Lesjean, B.; Kraume, M. Influence of unsteady
membrane bioreactor operation on EPS formation and filtration resistance.
Desalination, 2006, 192, 1-9.

135
[27] Tiehm, A.; Nickel, K.; Zellhorn, M.; Neis, U. Ultrasonic waste activated sludge
disintegration for improving anaerobic stabilization. Water Research. 2009, 35,
2003-2009.
[28] Neis, U.; Nikel, K.; Tiehm, A. Enhancement of anaerobic sludge disintegration by
ultrasonic disintegration. Water Sci. Technol. 2000, 42, 73-80.
[29] Hogan, F.; Mormede, S.; Clark, P.; Crane, M. Ultrasonic sludge treatment for
enhanced anaerobic digestion, Water Sci. Technol. 2004, 50, 25-32.
[30] Dimock, R.; Morgenroth, E. The influence of particle size on microbial hydrolysis of
protein particles in activated sludge. Water Research. 2006, 40, 2064-2074.
[31] Higgins, M.; Glindemann, D.; Novak, J.T.; Murthy, S.N.; Gerwin, S.; Forbes, R.
Standardized biosolids incubation, headspace odor measurement and odor
production consumption cycles. Proceedings Water Env. Federation and AWWA
Odors and Air Emissions Conference, Bellevue, Washington, 2004.
[32] Appels, L; Dewil, R; Baeyens, J; Degeve J, Ultrasonically enhanced anaerobic
digestion of waste activated sludge. Int. J. Sustainable Eng., 2008, 94 -104.
[33] Miller, W. P.; Baharuddin, M. K., Particle size of interrill-eroded sediments from
highly weathered soils, Soil Sci Soc Am.1987, 51, 1610-1615.
[34] Vavilin, V.A.; Rytow, S.V.; Lokshina, L.Y. Modelling hydrogen partial pressure
change as a result of competition between the butyric and propionic groups of
acidogenic bacteria. Bioresour. Technol, 1995, 54, 171–177.
[35] Munch, J. Keller; P. Lant; R. Newell, Mathematical modeling of prefermenters-I.
Model development and verification, Water Research. 1999, 12, 2757–2768.
136
[36] Jeppsson, Ulf. Investigation of anaerobic digestion alternatives for Henriksdal’s
WWTP” IEA, Lund University. 2007.
[37] Jeong, H.-S.; Chang-Won Suh; Jae-Lim Lim; Sang-Hyung Lee; Hang-Sik Shin.
Analysis and application of ADM1 for anaerobic methane production. Bioprocess
Biosyst Eng., 2005, 27, 81–89.

137
CHAPTER FIVE
Impact of Ultrasonication of Hog Manure on Anaerobic Digestability3
5.1 Introduction Ultrasonication has been widely tested to improve the hydrolysis rate in anaerobic
digestion of biosolids [1, 2]. Ultrasonication disrupts biosolids flocs and bacterial cells,
releasing intracellular components, subsequently improving the rate of anaerobic
degradation due to the solubilisation of the particulate matter, decreasing solid retention
time (SRT) and improving the overall performance of anaerobic digestion [3]. The use of
ultrasonication in the pretreatment of waste activated sludge (WAS) improved the
operational reliability of anaerobic digesters, decreased odor generation and clogging
problems, and enhanced sludge dewatering [4]. However, economical feasibility and
durability due to erosion of the sonotrode as well as high energy inputs are major
challenges that need to be resolved for the technology to be adopted [4]. Sludge
characteristics such as type of sludge (primary solids, waste activated sludge or animal
manure, etc.), total solids (TS) content and particle size could highly impact the
disintegration efficiency and improve the overall economy of the process. Ultrasonication
pretreatment studies found in the literature have focused mainly on WAS. While
anaerobic digestion of hog manure is widely practiced, there has been sparse research on
enhancing its hydrolysis. The main differences between hog manure and municipal
biosolids, i.e primary and waste activated sludge are: solids concentration, composition
and heterogeneity. In general, the limiting step for the anaerobic digestion is the first step,
3 A version of this chapter has been published in Ultrasonics Sonochemistry, 2010, 18, pp 164-171.
138
hydrolysis, wherein the cell wall is broken and particulate substrates are enzymatically
hydrolyzed allowing the organic matter inside the cell to be available for biodegradation.
Hydrolysis is well documented to be a function of specific surface area among other
variables [5]. Since hydrolysis is also a function of the ratio of biomass to particulate
concentration (both of which are combined as volatile suspended solids), the rate of
solubilisation depends on the nature and concentration of the particulates. Fibrous
substrates such as those found in hog manure will likely hydrolyze slower than WAS and
primary sludges due to differences in particle size and the ratio of biomass to particulate
substrates. Thus, pretreatment is required in order to achieve the release of lignocellulosic
material and thus accelerate the degradation process by means of waste solubilisation. In
the literature, there is a contradiction about the effect of TS content on disintegration
efficiency. Akin et al. [6] studied WAS disintegration efficiency at various TS contents
(2, 4 and 6%), specific energy (SE) inputs (up to 40000 kJ/kgTS) and ultrasonic densities
(from 0.44 to 3.22 W/mL), and found that at constant TS content, the soluble chemical
oxygen demand (SCOD) release showed an increasing trend with the increase in both
specific energy input and ultrasonic density at all TS contents. However, at constant
specific energy, the SCOD release decreased with the increase in initial TS content. This
finding contradicts other studies that reported significant improvement in SCOD release
with WAS for TS concentration in the 0.8 to 2.5% range [7, 8].
It is well known that sludge viscosity increases with solids concentration, with the critical
concentration around 25 g/L or 2.5% TS content [9]. Ultrasonication efficiency is
expected to decline with increasing viscosity due to resistance to energy flow, and

139
theoretically increased TS concentrations are detrimental to ultrasonication, despite the
lack of consensus on the critical solids concentrations.
Odor generation from biosolids is a significant global problem as it negatively affects
natural environments. Laboratory tests have indicated that protein degradation, especially
the bound protein, i.e, proteins that are physically adsorbed on the outer cell wall which
can detach during high speed centrifugation, a very popular sludge dewatering
technology, is the main precursor for the odor production in biosolids [10]. Proteins are
hydrolysed by extracellular enzymes (proteases) into polypeptides their constituent and
amino acids. Hydrogen sulfide (H2S) can be formed from the degradation of the sulfur
containing amino acid such as cysteine and methionine. The pathways for production of
methyl mercaptan and hydrogen sulfide from protein are described by Higgins et al. [10].
Based on an extensive literature search, it can be concluded that the effect of
ultrasonication on odor compounds precursors, especially bound protein needs more
research since the very limited studies on protein solubilization focused primarily on total
and soluble protein measurements with no information on the critical bound proteins
from an odor perspective. For instance, Wang et al. [11] examined protein release using
WAS (TS content of 3%) at different ultrasonication densities (from 0.528 to 1.44
W/mL) and different ultrasonication times (from 5 to 30 min). The aforementioned
authors investigated the protein in EPS, total protein and cell protein (difference between
total protein and protein in EPS). Akin et al. [6] studied the effect of ultrasonication on
protein release at different TS content.
The evaluation of ultrasonication efficiency in the literature is mostly based on the degree
of disintegration (DD), which is the ratio between SCOD releases by ultrasonication

140
divided by SCOD releases by chemical disintegration. It appears from the literature that
there is no unique method for determining chemical disintegration. For instance, Kunz
and Wagner [12] used 1 M NaOH in the ratio of 1:3.5 by volume at 20◦C for 22 h, while
Muller and Pelletier [13] used 1 M NaOH at a ratio of 1:2 by volume at 90◦C for 10 min,
and Bougrier et al. [14] used 1 M NaOH at room temperature for 24 h. Additionally, the
used techniques are time consuming and expensive [15].
The extensive literature reviewed above highlighted the challenges of applying
ultrasonication to hog manure vis-a-vis WAS and primary sludges due to its
characteristics such as fibrous versus excess biomass, particulate to biomass ratios, total
solids concentrations well above the 2% - 3% for WAS and primary sludge leading to
increase viscosity, and heterogeneity. Furthermore, it is apparent that despite the few
studies on protein solubilization, the bound protein fraction implicated in odor generation
has not been investigated.
Therefore, the overall objective of this study is to evaluate the impact of ultrasonication
on solubilisation and anaerobic biodegradability of hog manure with high solid content
and wide ranges of particle sizes, with particular emphasis on the effect of ultrasonication
on proteins solubilisation, especially bound protein. Additionally, in this work,
correlations between standardized and easy to measure solubilization parameters and the
laborious and expensive method of degree of disintegration will be presented.

141
5.2 Material and methods
5.2.1 Analytical methods Samples were analyzed for total solids (TS), volatile solids (VS), volatile suspended
solids (VSS), total Kjeldahl nitrogen (TKN), and soluble total Kjeldahl nitrogen (STKN)
using standard methods [16]. Total and soluble chemical oxygen demand (TCOD,
SCOD) and ammonia (NH4-N) were measured using HACH methods and test kits
(HACH Odyssey DR/2500). Soluble parameters were determined after filtering the
samples through 0.45 µm filter paper. Particle size distribution was determined by
Malvern Mastersizer 2000 (version 5.22) laser beam diffraction granulometer. The total
gas volume was measured by releasing the gas pressure in the vials using appropriately
sized glass syringes (Perfektum; Popper & Sons Inc., NY, USA) in the 5–100 mL range
to equilibrate with the ambient pressure as recommended by Owen et al. [17]. Biogas
composition was determined by a gas chromatograph (Model 310, SRI Instruments,
Torrance, CA) equipped with a thermal conductivity detector (TCD) and a molecular
sieve column (Molesieve 5A, mesh 80/100, 6 ft × 1/8 in). The temperatures of the column
and the TCD detector were 90 and 105˚C, respectively. Argon was used as carrier gas at a
flow rate of 30 mL/min.
5.2.2 Protein measurement Protein was determined by micro-bicinchoninic acid protein assay (Pierce, Rockford,
USA) which was modified from Lowry et al. [18] using a standard solution of bovine
serum albumin. Cell protein was calculated as the difference between particulate and
bound protein. In order to measure proteins, 50 mL samples were centrifuged at 10000

142
rpm for 15 minutes at 5˚C to separate the liquid and solids in the sample. The supernatant
was filtered through a 1.5 µm glass microfiber filter and the filtrate was analyzed for the
soluble protein fraction. Bound protein was extracted from the suspended solids by a mild
pH 8 phosphate buffer (50 mM), while particulate protein representing both the bound
protein adsorbed on biomass and the protein within the biomass was extracted by an
alkaline 1 N Na OH solution [18]. The solids were resuspended to a total volume of 50
mL with pH 8 phosphate buffer (50 mM) for measuring bound protein and 1 N NaOH for
particulate protein. The solution was mixed using a magnetic stirrer at 1500 rpm for
10 minutes, and centrifuged at 10000 rpm for 15 minutes at 5˚C, with the centrate filtered
through a 1.5 µm glass microfiber filter, prior to protein analysis.
5.2.3 Experimental set-up A lab scale ultrasonic probe was used to treat hog manure obtained from local hog farm
in Southwestern, Ontario, Canada. The average characteristics of the hog manure used in
this study in (mg/L); TCOD: 144900, SCOD: 55800, TS: 93180, VS: 66980, particulate
protein: 22862, bound protein: 15938, soluble protein: 9134, TKN: 16580, STKN: 96820
and ammonia: 7020. The ultrasonic probe was supplied by Sonic and Materials,
Newtown, USA (model VC-500, 500 W, and 20 kHz). 200 mL of hog manure was
sonicated for different sonication times corresponding to different specific energy inputs,
with sonication pulses set to 2 seconds on and 2 seconds off. To control the temperature
rise of the sludge, a cooling water bath was used, and the sludge temperature during the
experiments did not exceed 30˚C.

143
5.2.4 Batch anaerobic digestion Anaerobic batch reactors were used to study the anaerobic biodegradability, and
determine the ultimate methane potential and methane production rate for sonicated and
unsonicated manure. The 250 mL serum flasks sealed with rubber septa on a screw-cap
was placed on the shaker- incubator (MaxQ 4000, Incubated and Refrigerated Shaker,
Thermo Scientific, CA) at 37˚C and rpm of 180. Eighteen (18) flasks were used in this
study, two of them were used as blank and the rest were used for sonicated and non-
sonicated samples for different specific energy inputs, as described later. The volumes of
substrate (hog manure) and seed (anaerobic digester sludge from St Marys plant, St
Marys, Ontario, Canada) calculated based on food to microorganisms (F/M) ratio of 4 on
COD to VSS basis. For the blank, the substrate volume was replaced by distilled water.
5.2.5 Specific energy input The specific energy input is a function of ultrasonic power, ultrasonic duration, and
volume of sonicated sludge and TS concentration, and can be calculated using the
following equation [14]:
)1(LTSVtPSE
××=
Where SE is the specific energy input in kWs/kgTS (kJ/kgTS), P is the ultrasonic power
in kW, t is the ultrasonic duration in seconds, V is the volume of sonicated sludge in
litres, and TS is the total solids concentration in kg/L.

144
5.2.6 Degree of disintegration (DD) In this study, the degree of disintegration was determined based on the equation of Muller
and Pelletier [13]:
)2(%100 L×
−
−=
OriginalNaOH
OriginalUltrsound
CODCODCODCOD
DD
Where CODultrasound is the COD of supernatant of ultrasound treated sample (mg/L),
CODoriginal is the COD of supernatant of original (untreated) sample (mg/L), and
CODNaOH (mg/L) is the COD in the supernatant after addition of 1M NaOH for 24 h at
room temperature.
5.2.7 COD solubilization CODsolubilisation was calculated using the SCOD released, which is the difference between
SCOD at any time after ultrasonication (SCODt) and the initial SCOD (SCOD0) divided
by the initial particulate COD (TCODi – SCOD0):
)3(%100COD0
0tionsolubilisa L×
−−
=SCODTCODSCODSCOD
i
t
Where TCODi is the initial TCOD concentration.
5.2.8 TKN solubilization TKNsolubilisation was calculated using the STKN released which is the difference between
STKN at any time after ultrasonication (STKNt) and the initial STKN (STKN 0) divided
by the initial particulate TKN (TKNi-STKN0):
)4(%100TKN0
0tionsolubilisa L×
−−
=STKNTKNSTKNSTKN
i
t
Where TKNi is the initial TKN concentration.

145
5.3 Results and Discussion
5.3.1 Comparison of solubilisation and degree of disintegration Using CODsolubilisation and plotting the results with respect to DD, TKNsolubilisation, %
increase in soluble protein, and % decrease in particulate protein (Figure 5.1), a perfect
linear relationship with an R2 = 1.0 was obtained for the correlation between
CODsolubilisation and DD (Figure 5.1a). The linear relationship between CODsolubilisation and
TKNsolubilisation emphasizes that the solubilisation of nitrogenous compounds followed the
similar trend of COD solubilisation (Figure 5.1b). Figures 1c and 1d illustrating the
relationship between CODsolubilisation on one hand and % increase in soluble protein, and %
decrease in particulate protein on the other hand emphasize that CODsolubilisation is more
strongly linearly related with % decrease of particulate protein than % increase in soluble
protein. Thus, CODsolubilisation from now on can be used to evaluate the solubilisation
degree in lieu of the DD procedure, as it proved to be an accurate and easy measure.
y = 1.5627xR2 = 1
0
10
20
30
40
0 5 10 15 20 25 30
DD
(%)
(a)
y = 1.2184xR2 = 0.8617
0
10
20
30
40
0 5 10 15 20 25 30
TKN
solu
bilis
atio
n
(b)
(c) (d)
y = 0.7801xR2 = 0.8142
0
10
20
0 5 10 15 20 25 30CODsolubilisation (%)
%In
crea
sein
solu
ble
prot
ein
y = 0.6804xR2 = 0.8806
0
10
20
0 5 10 15 20 25 30CODsolubilisation (%)
%D
ecre
ase
into
talp
rote
in
Figure 5.1 Relationship between COD solubilization and: (a) DDSCOD (%),
(b) TKN solubilization, (c) % Increase in soluble protein, (d) % Decrease in total protein.

146
5.3.2 Particle size distribution Particle size distribution is widely used as a qualitative measure for sludge disintegration.
Anaerobic digestion of waste is governed by hydrolysis (solubilisation of particulates)
that is highly affected by the particle size. Smaller particle sizes and the lower
concentration of particulates, measured as VSS lead to higher degradation efficiency. As
shown in Figure 5.2, the hog manure is characterized by a wide range of particle size
ranging from 0.6 µm to 2500 µm, compared to a range of 0.4 µm to 1000 µm reported for
WAS [14, 1]. As shown in Figure 5.2, the particle size distribution for the hog manure
shows a bi-modal distribution, with two peaks, the first at 60 µm and the second at 1200
µm, respectively.
0
0.5
1
1.5
2
2.5
3
3.5
0.01 0.1 1 10 100 1000 10000Particle size (µm)
Vol
ume
(%)
SE = 0 kJ/kg TSSE = 250 kJ/kg TSSE = 500 kJ/kg TSSE = 2600 kJ/kg TSSE = 5000 kJ/kg TSSE = 10000 kJ/kg TSSE = 21000 kJ/kg TSSE = 30000 kJ/kg TS
Figure 5.2 Particle size distribution for different specific energy inputs
Interestingly, the disintegration effect was more pronounced for the particles in the range
of 0.6 µm to 60 µm; while a minor effect was observed for particles > 200 µm. The mean
particle size diameter (d50) decreased from 59 µm in the raw hog manure to 21.9 µm with

147
the specific surface area (SSA) increasing from 0.523 to 1.2 µm2/g at a specific energy of
30000 kJ/kgTS (Table 5.1).
Table 5.1 Particle size and CODsolubilization at different specific energy inputs
SE (kJ/kgTS) 0 250 500 2500 5000 10000 21000 30000
d50 (µm)* 59.0 56.0 53.9 47.3 39.7 33.3 27.4 21.9
SSA (µm2/g) 0.52 0.56 0.59 0.63 0.78 0.8 0.91 1.2
% Reduction in VS - 5 20 24 24 30 31 32
DD (%) - 11 17 25 30 37 40 43
CODsolub. (%) - 7 11 16 19 24 26 27
* d50: 50% of particles volume having a diameter lower than or equal to d50.
Using WAS, Gonze et al. [1], Bougrier et al. [14] achieved decrease in mean particle size
diameters from 320 to 18.1 µm and from 32 to 12.7µm, at TS content of 1.2 to 3.2 gDS/L
and 18.5 g/L, respectively. In another study, Akin et al. [6] achieved decrease in mean
diameters from 209 to 18.1, from 217 to 38.2 and from 225 to 33.4 µm, at TS content of
2, 4 and 6% of WAS, respectively. Thus, it is evident that the effect of ultrasonication on
particle size depends on the nature of the biomass and the TS content. For WAS the
smallest particle size (18.1 µm) was achieved at lower TS content, 2% [6]. While for
manure, the smallest particle size 21.9 µm was achieved at higher TS content, 9.3%.
5.3.3 Solubilisation of hog manure Ultrasonic pretreatment solubilises extracellular matter and extracellular polymeric
substances (EPS), increasing the SCOD. Thus, SCOD is mostly used to measure the
sludge disintegration efficiency. The specific energies for various TS contents and DD
from this study and two other studies are plotted in Figure 5.3.

148
0
10000
20000
30000
40000
50000
60000
70000
0 2 4 6 8 10TS %
SE(k
J/kg
TS)
DD 10
DD 15
DD 20
DD 25
Figure 5.3 Specific energy input for different TS at different degree of disintegrations.
*Data in this graph from this study, Tiehm et al. (2001); Rai et al. 2004
A sharp decline in the required specific energy from 65000 kJ/kgTS to 10000 kJ/kgTS
was observed when the TS increased from 0.5% to 2%. The slope of the curve then
decreased drastically and the required specific energy to achieve a certain DD was almost
constant regardless of the increase in TS. For hog manure with a TS content of 9.3%,
only 3000 kJ/kgTS was required to increase the DD by 15% (from 10% to 25%), while
for WAS, a specific energy of 20000 and 25000 kJ/kgTS is required to achieve the same
increase in DD for WAS with TS content of 2% and 0.5%, respectively. Two other
studies have been conducted on WAS with different TS content but they did not report
the SE input, and therefore can not be compared. Gronroos et al. [7] studied WAS with
dry solids (DS) content (0.8, 1.6 and 2.5%), different ultrasonic densities (50, 175 and
300 W/L), different frequencies (22 and 40 kHz) and treatment time (5, 17.5 and 30 min).
The aforementioned authors observed that the largest SCOD increase was obtained with
the highest power, highest DS and longest sonication time. Wang et al. [8], using WAS,

149
at two TS content (0.5% and 1%) studied different disintegration times (10, 20 and 30
min), different intensities (from 30 to 230 W/cm2) and different densities (0.25, 0.5, 1.0
and 1.5 W/mL), and found that the highest power, highest DS and longest treatment time
resulted in highest SCOD increase consistent with Gronroos et al., (2005). Thus, the high
solids content of hog manure of 9.3% versus the 0.5% to 2.5% for WAS in this case did
not adversely impact solubilization. Comparing the 3000 kJ/kgTS required to achieve a
15% increase in DD for hog manure with the 20000 and 25000 kJ/kgTS for WAS implies
that hog manure is about 6-8 times more amenable to ultrasonication than WAS.
The maximum solubilisation of hog manure measured as CODsolubilisation was 27.3% at
30000 kJ/kgTS, whereas Khanal et al. [19] and Bougrier et al. [14] using WAS, achieved
16.2% and 41.6% at specific energies of 66800 kJ/kgTS and 14547 kJ/kgTS, respectively.
Applying ultrasonication of hog manure at different specific energy inputs achieved an
increase of 1.35 mgSCOD/(kJ/kgTS) compared to 0.15, 0.12, 0.45 and 0.9
mgSCOD/(kJ/kgTS) calculated from data reported by Khanal et al. [19]; Gronroos et al.
[7]; Navaneethan [2]; and Bunrith [20], respectively indicating greater pretreatment
potential of hog manure by ultrasonication compared to WAS. On the other hand the
average reduction in VS for hog manure was 22.5 ± 2% for the specific energy in the
range of 500 to 5000 kJ/kgTS. While increasing the specific energy to 10000 kJ/kgTS
raised the VS reduction percentage to 29.6%. Increasing the specific energy beyond
10000 kJ/kgTS did not improve the VS reduction significantly.
The TKN remained constant throughout the experiments, and thus no nitrogen
mineralisation or volatilisation was observed. As shown in Table 5.2, ultrasonication of
hog manure increased the STKN from 9682 mg/L to 11994 mg/L corresponding to a
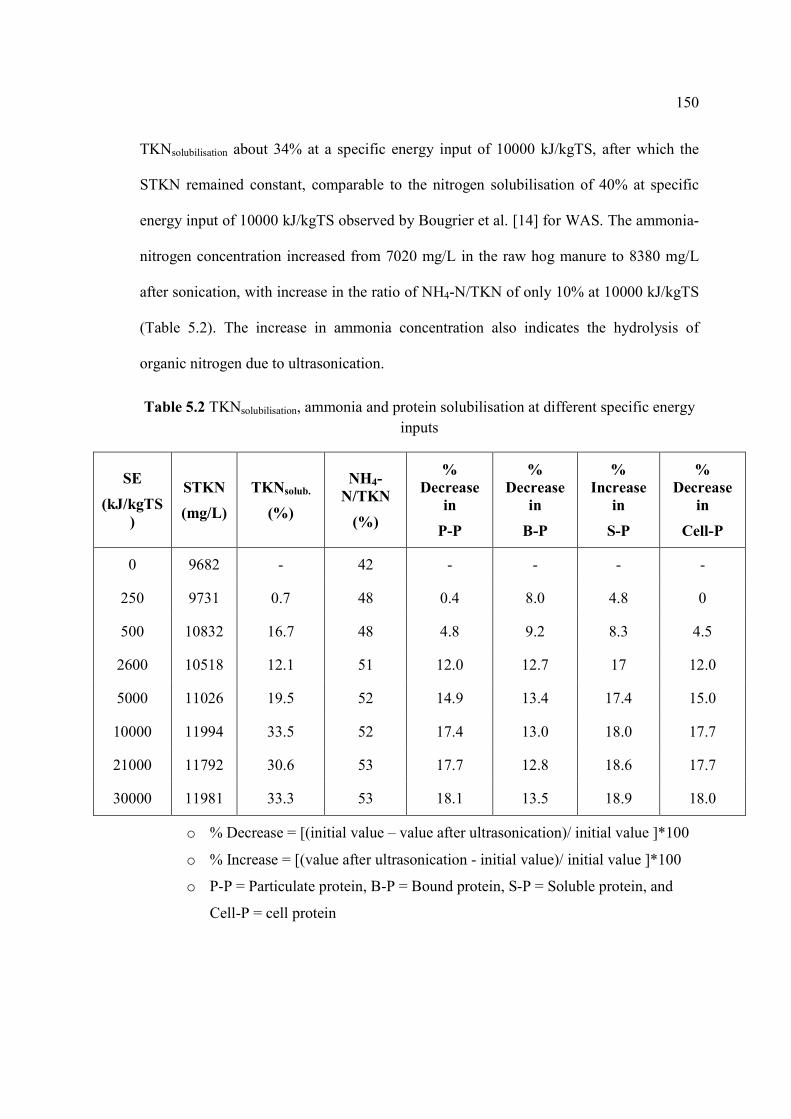
150
TKNsolubilisation about 34% at a specific energy input of 10000 kJ/kgTS, after which the
STKN remained constant, comparable to the nitrogen solubilisation of 40% at specific
energy input of 10000 kJ/kgTS observed by Bougrier et al. [14] for WAS. The ammonia-
nitrogen concentration increased from 7020 mg/L in the raw hog manure to 8380 mg/L
after sonication, with increase in the ratio of NH4-N/TKN of only 10% at 10000 kJ/kgTS
(Table 5.2). The increase in ammonia concentration also indicates the hydrolysis of
organic nitrogen due to ultrasonication.
Table 5.2 TKNsolubilisation, ammonia and protein solubilisation at different specific energy inputs
SE (kJ/kgTS
)
STKN (mg/L)
TKNsolub. (%)
NH4-N/TKN
(%)
%Decrease
in P-P
%Decrease
in B-P
%Increase
in S-P
%Decrease
in Cell-P
0 9682 - 42 - - - -
250 9731 0.7 48 0.4 8.0 4.8 0
500 10832 16.7 48 4.8 9.2 8.3 4.5
2600 10518 12.1 51 12.0 12.7 17 12.0
5000 11026 19.5 52 14.9 13.4 17.4 15.0
10000 11994 33.5 52 17.4 13.0 18.0 17.7
21000 11792 30.6 53 17.7 12.8 18.6 17.7
30000 11981 33.3 53 18.1 13.5 18.9 18.0
o % Decrease = [(initial value – value after ultrasonication)/ initial value ]*100
o % Increase = [(value after ultrasonication - initial value)/ initial value ]*100
o P-P = Particulate protein, B-P = Bound protein, S-P = Soluble protein, and
Cell-P = cell protein

151
5.3.4 Proteins (particulate, bound and cell) solubilisation Proteins are usually divided into three types; particulate protein, bound protein, and
soluble protein [21]. The particulate protein was considered as the tightly bound protein
in flocs and is composed of particles in the bacterial cell mass. Bound protein is the labile
fraction loosely attached on biomass, while the soluble protein represents protein in
solution. Bound protein is considered to be one of the main causes for odor in anaerobic
digestion; and the effect of ultrasonication on the proteins needs to be characterized. The
effect of ultrasonication on proteins is summarized in Table 5.2. While approximately a
17% decrease in the particulate proteins was achieved at a specific energy of 10000
kJ/kgTS, the soluble protein increased by 18%. It was observed that at specific energy
inputs less than 500 kJ/kgTS, the reduction in particulate protein of up to 5% was
attributed to the decrease in bound protein, while a 17.7% reduction in cell protein was
observed for specific energy of 10000 kJ/kgTS, after which the solubilisation efficiency
remained constant. In another study by Akin et al. [6] on ultrasonication of WAS, the
protein release was significantly reduced at higher TS content. The maximum protein
released was 73 mg/gTS at a TS content of 2% and SE of 10000 kJ/kgTS, but decreased
to 40 and 22 mg/gTS at SE of 5000 kJ/kgTS for TS content of 4% and 6%, respectively.
The soluble protein released in this work is about 17 mg/gTS at SE of 2600 kJ/kgTS in
fact follows the same trend of decreasing protein solubilization with the decrease of SE.
Comparing the protein per unit energy for hog manure with the WAS results of Akin et
al. [6] reveals that for hog manure, protein solubilization of 17 mg/gTS at ultrasonication
density of 234 MJ/m3 is identical to the 22 mg/gTS at ultrasonication density of 300
MJ/m3 since the 29% difference in protein released is commensurate with the 28%
difference in ultrasonication density. Upon comparing the results of this study with Akin
152
et al. [6] with respect to the impact of TS content, it is readily discerned that for WAS,
solubilization of proteins decreased with increasing TS content in the 2-6% range, while
for hog manure even a 9.3% TS content did not negatively impact protein solubilization,
reflecting the difference in the nature of hog manure.
It is interesting to note that a minimum of 500 kJ/kgTS specific energy input was
required in order to rupture the cell wall and to release the cell protein, and it is more than
an order of magnitude lower than 7700 kJ/kgTS required by Wang et al. [11] for WAS.
Data in Table 5.2 emphasizes that at low specific energy inputs (less than or equal to
2600 kJ/kgTS), up to 12.7% reduction in bound protein is achievable. The data for bound
protein in Table 5.2 emphatically shows that ultrasonication has reduced bound protein
by 8% to 13.5%, with the rate change diminishing rapidly at a specific energy higher than
2600 kJ/kgTS, at which a 12.5% reduction was achieved. Thus, it is evident that
pretreatment by ultrasonication does significantly abate the potential for odor generation
caused by bound proteins.
5.3.5 Methane production and economics The biochemical methane potential (BMP) test was used to evaluate anaerobic
biodegradability in batch reactors. Figure 5.4 shows the cumulative methane production
over time at different sonication energy inputs, with the data summarized in Table 5.3.

153
0
100
200
300
400
500
600
700
800
0 5 10 15 20 25 30 35 40 45time (d)
Cum
ulat
ive
CH4
(mL)
SE = 0 kJ/kg TSSE = 250kJ/kg TSSE = 500 kJ/kg TSSE = 2600 kJ/kg TSSE = 5000 kJ/kg TSSE = 10000 kJ/kg TSSE = 21000 kJ/kg TSSE = 30000 kJ/kg TS
Figure 5.4 Cumulative methane production at different specific energy inputs.
Table 5.3 Ultrasonication and Methane Energy per ton of TS
Methane Power input Methane out
SE (kJ/kgTS)
%Increase in
methane potential
% Increase in maximum
methane production
rate
kWh/ton TSin
Price $/ton TSin
Increase of CH4(mL)
CH4
m3/ton TSin
Price $/ton TSin
0 - - 0 - - - -
250 11.7 33.7 69 4.9 67 17.2 4.8
500 28.0 61.3 139 9.7 160 50.4 14.1
2600 10.9 43.5 722 50.6 62 201.2 5.6
5000 16.3 35.5 1389 97.2 93 29.3 8.2
10000 19.9 46.6 2778 194.4 114 37.9 10.6
21000 18.7 75.4 5833 408.3 107 36.3 10.2
30000 20.7 80.6 8333 583.3 118 40.0 11.2
As shown in Figure 5.4, no lag phase was observed due to the sufficiency of soluble
substrates. With respect to the results in Table 5.3, it is clearly observed that

154
ultrasonication of hog manure enhanced the biogas production at low energy inputs
compared to unsonicated hog manure. Methane potential increased by 28% relative to the
unsonicated hog manure for a specific energy input of 500 kJ/kgTS, while the increase at
high energy inputs (30000 kJ/kgTS) was only 20.7%. While the % increase in methane
production rate increased by increasing the energy input, maximum increase in methane
production rate was 80.6% compared to unsonicated hog manure at a specific energy
input of 30000 kJ/kgTS. The increase in methane production rate for specific energy
input of 500 kJ/kgTS (high methane potential) was about 61.3%, and decreased for SE of
500 to 10000 kJ/kgTS before increasing again. Therefore, since ultrasonic pretreatment
of hog manure with SE of 500 kJ/kgTS gave a comparable methane production
enhancement in both rate and potential with SE of 21000-30000 kJ/kgTS, the 500
kJ/kgTS can be considered to be the optimum energy input for the pretreatment of
ultrasonicated hog manure prior to anaerobic digestion. On the other hand, the reported
optimum specific energy for ultrasonic pre-treatment of WAS in the literature was
significantly higher at 11000 kJ/kgTS [11] and 12000 kJ/kgTS [2].
The COD mass balance for all the batches was computed considering the initial and final
TCOD, and the equivalent COD of methane (0.395 LCH4/gTCOD), which indicated a
closure at 90–95%, thus emphasizing data reliability.
The maximum difference between the final VSS concentration in the sonicated and
unsonicated hog manure after digestion was 14% of the unsonicated VSS at a SE of
10000 kJ/kgTS.
An economic analysis (the results are summarized in Table 5.3) was conducted based on
power and natural gas costs of $0.07/kWh and $0.28/m3, respectively. As apparent from

155
Table 5.3, the specific energy of 500 kJ/kgTS can be considered to be the optimum
energy input for anaerobic digestion of ultrasonic pretreated hog manure to be
economically viable, as the value of the energy output exceeds that of the energy input by
$ 4.1/ton of dry solids.
5.4 Conclusions Based on the finding of this study, the following conclusions can be drawn:
o The CODsolubilisation correlated very well with the DD, the TKNsolubilisation and the %
decrease in particulate protein. Thus, CODsolubilisation can be used to evaluate the
degree of solubilisation in lieu of the labor and time intensive DD procedure, as it
proved to be an accurate and easy to measure method.
o For hog manure, the disintegration of particles by ultrasonication was more
pronounced for the smaller sizes, i.e., in the 0.6 to 60 µm range, as well as the
reduction of VS by ultrasonication increased with increasing specific energy input
in the 500-5000 kJ/kgTS and reached a plateau at 10000 kJ/kgTS.
o At solids content of 2%, the specific energy input increased from 10000 to about
30000 kJ/kgTS for an additional 15% increase in degree of disintegration, whereas
at TS of about 9%, the specific energy input increased from 250 to about 3,300
kJ/kgTS to achieve the same increase in DD. Therefore, ultrasonication is more
effective pretreatment process for hog manure with higher TS content than WAS
and primary sludges.
o Upon comparing the results of this study with Akin et al. [6] with respect to the
impact of TS content, it is readily discerned that for WAS, solubilization of proteins

156
decreased with increasing TS content in the 2-6% range, while for hog manure even
a 9.3% TS content did not negatively impact protein solubilization, reflecting the
effect of difference in the nature of sludge on the efficiency of pretreatment.
o Bound proteins decreased by 13.5% at specific energy of 5000 kJ/kgTS. Thus, the
impact of ultrasonication on odor precursors such as bound proteins appears to be
significant.
o The cell wall appeared to be ruptured at a minimum specific energy input of 500
kJ/kgTS, whereas the optimum specific energy was 10000 kJ/kgTS, affecting a
17.7% reduction in cell protein.
o The optimum specific energy input for methane production was 500 kJ/kgTS, and
resulted in a 28% increase in methane production, and subsequently about $ 4.1/ton
of dry solids excess energy output.
157
5.5 References
[1] Gonze, E.; Pillot, S.; Valette, E.; Gonthier, Y.; Bernis, A.; Ultrasonic treatment of an
aerobic activated sludge in a batch reactor, Chem. Eng. Process. 2003, 42, 965–975.
[2] Navaneethan, N. Anaerobic Digestion of Waste Activated Sludge with Ultrasonic
Pretreatment, Master thesis, Asian Institute of Technology, Bangkok, Thailand,
2007.
[3] Pavlostathis, S.G.; Gossett, J.M. A kinetic model for anaerobic digestion of biological
sludge, Biotechnol. Bioeng. 1986, 27, 1519–30.
[4] Pérez-Elvira, S. I. ; Nieto Diez, P. ; Fdz-Polanco, F. Sludge minimisation
technologies, Rev. Enviro. Sci. Biotechnol. 2006, 5, 375–398.
[5] Sanders, W.T.M.; Geerink, M.; Zeeman, G.; Lettinga, G. Anaerobic hydrolysis
kinetics of particulate substrates. Water Sci. Technol., 2000, 41, 17–24.
[6] Akin, B.; Khanal, S. K.; Sung, S.; Grewell, D.; Van Leeuwen, J. Ultrasound pre-
treatment of waste activated sludge, Water Sci. Technol. Water Supply. 2006, 6, 35-
42.
[7] Gronroos, A.; Kyllonen, H.; Korpijarvi, K.; Pirkonen, P.; Paavola, T.; Jokela, J.;
Rintala, J. Ultrasound assisted method to increase soluble chemical oxygen demand
(SCOD) of sewage sludge for digestion, Ultrason. Sonochem. 2005, 12, 115–120.
[8] Wang, F.; Wang, Y.; Ji, M. Mechanisms and kinetics models for ultrasonic waste
activated sludge disintegration, J. Hazard. Mater. 2005, 145–150
[9] Pham, T.; Brar, S.; Tyagi, R.; Surampalli, R. Influence of ultrasonication and Fenton
oxidation pre-treatment on rheological characteristics of wastewater sludge,
Ultrason. Sonochem. 2010, 17, 38-45.
[10] Higgins, M.; Glindemann, D.; Novak, J.; Murthy, S.; Gerwin, S.; Forbes, R.
Standardized biosolids incubation, headspace odor measurement and odor production
consumption cycles. Proceedings Water Env. Federation and AWWA Odors and Air
Emissions Conference, Bellevue, Washington, 2004.

158
[11] Wang, F.; Lu, S.; Ji, M. Components of released liquid from ultrasonic waste
activated sludge disintegration, Ultrason. Sonochem. 2006, 13, 334-338.
[12] Kunz, P.; Wagner, S. Results and outlooks of investigations of sewage sludge
disintegration, Ergebnisse und Perspektiven aus Untersuchungen zur
KlaÈrschlammdesintegration-, awt_abwassertechnik, Heft 1, 1994. (From Schmitz,
et al. [15])
[13] Muller, J.; Pelletier, L. Désintégration mécanique des boues activées, L’eau,
l’industrie, les nuisances. 1998, 217, 61–66. (From Schmitz, et al. [15])
[14] Bougrier, C.; Carrère, H.; Delgenès, J. Solubilisation of waste-activated sludge by
ultrasonic treatment, Chem. Eng. J. 2005, 106 ,163-169.
[15] Schmitz, U.; Berger, C.R.; Orth, H. Protein analysis as a simple method for the
quantitative assessment of sewage sludge disintegration, Water Research. 2000, 34,
3682–3685.
[16] APHA, Standard Methods for the Examination of Water and Wastewater, 20th ed.:
American Public Health Association, Washington DC, USA, 1998.
[17] Owen, W.F.; Stuckey, D.C.; Healy, J.B.; Young, L.Y.; McCarty, P.L. Bioassay for
monitoring biochemical methane potential and anaerobic toxicity, Water Research.
1979, 13, 485–492.
[18] Lowry, O. H.; Rosebrough, N. J.; Fair, A. L.; Randall, R. J. Protein measurement
with the folin-phenol reagent, J. Biol. Chem, 1951, 193, 265-275.
[19] Khanal, S.K.; Isik, H.; Sung, S.; Van Leeuwen, J. Ultrasound pretreatment of waste
activated sludge: evaluation of sludge disintegration and aerobic digestion, In CD-
ROM Proceedings of IWA World Water Congress and Exhibition, Sep 10-14,
Beijing, China, 2006.
[20] Bunrith, S. Anaerobic Digestibility of Ultrasound and Chemically Pretreated Waste
Activated Sludge, Master thesis, Asian Institute of Technology, Bangkok, Thailand,
2008.

159
[21] Dimock, R.; Morgenroth,E. The influence of particle size on microbial hydrolysis of
protein particles in activated sludge. Water Research. 2006, 40, 2064-2074.

160
CHAPTER SIX
Simulating the Degradation of Odors Precursors in Primary and Waste Activated
Sludge during Anaerobic Digestion4
6.1 Introduction:
Anaerobic fermentation is the most commonly applied process for stabilization of
biosolids. A disadvantage of the fermentation technique is the slow degradation rate of
biosolids; usual residence times in anaerobic digesters are about 20-40 days, requiring
large digesters. Noxious odor production during anaerobic digestion and from the stored
biosolids is considered to be a significant disadvantage of this useful process [1]. Odor
production from anaerobically digested biosolids has recently received interest due to
increased load application of biosolids.[1]. Although H2S is considered to be the most
prevalent odor compound, there are typically other organic odorous compounds, such as
mercaptans and amines, present in anaerobic digestion. Prior research has implicated
volatile sulfur compounds (VSCs) including hydrogen sulfide (H2S), methanethiol or
methyl mercaptan (MT), dimethyl sulfide (DMS), dimethyl disulfide (DMDS) and
dimethyl trisulfide (DMTS) in odors from biosolids [2]. In addition to VSCs, ammonia
and volatile fatty acids (VFA), phenols are also implicated as possible odor causing
compounds in the excretion of pigs [3].
Laboratory tests have indicated that protein degradation and, especially the degradation
of methionine, an amino acid, is the main source for the production of VSCs [2]. Proteins
4 A version of this chapter has been submitted to Journal of Hazardous Materials, 2010

161
are hydrolysed by extracellular enzymes (proteases) into their constituent polypeptides
and amino acids. The pathway for the production of MT from methionine is described as
[2]:
olMethanethi3
Lyase Methionine
Methionine
3284enzyme
Peptidase enzyme Protease
HSCHNSCHOHCesPolypeptidProteins → → →
Hydrogen sulfide (H2S) can be formed from the degradation of cysteine, sulfur
containing amino acid, as shown below:
Sulphide Hydrogen2
Lyase Cysteine
Cysteine
3263enzyme
Peptidase enzyme Protease
SHNSCHOHCesPolypeptidProteins → → →
While the carbohydrate, lipid, and protein content of municipal biosolids often accounts
for the majority (90%) of the organic load [4], in some industries, protein is the
predominant part of the organic load. For example, the protein component of a dairy
wastewater stream can account for more than 40%-60% of the total chemical oxygen
demand [5]. Although the presence of proteins has been confirmed in the organic matter
of treated municipal waste water and sludge [6], literature on protein degradation during
anaerobic digestion is both sparse and contradictory. In a pioneering work, Breure et al.
[7] studied degradation of a model protein, gelatin, in controlled anaerobic digestion, and
observed that it was converted at high rates and to a substantial extent to volatile fatty
acids. Since, proteins, carbohydrates and lipid are almost always present simultaneously
in biosolids, complete degradation of protein in the presence of carbohydrates may not be
achieved as glucose and other easily fermentable substrates can repress the synthesis of
exoproteases (a necessary enzyme) in pure cultures of bacteria [7], and the degradation of
gelatin was retarded by increasing concentrations of carbohydrates present in the feed as

162
a second substrate. In contrast, in a controlled study it was found that as much as 70% of
the protein was broken down in the acidogenic reactor and inclusion of protein had no
effect on the reaction pathway for lactose degradation [8]. Proteins in wastewater and
sludge are generally divided into three fractions: soluble, bound/labile (loosely attached
with the cells) and tightly bound fractions (within the bacterial cells) [2]. Labile proteins
are thought to become readily bioavailable during dewatering giving rise to higher odor
potential.
Mathematical anaerobic digestion models (ADM) have been extensively investigated and
developed during the last three decades [9]. As one of the most sophisticated and
complex ADM, the IWA Anaerobic Digestion Model No. 1 (ADM1) is the integrated
anaerobic model developed by the IWA Task Group for modeling of Anaerobic
Digestion Processes [4]. It consists of a number of processes to simulate all possible
reactions occurring in anaerobic sludge digestion including not only biological reactions,
such as disintegration and hydrolysis of suspended solids, uptake (growth) and decay of
microorganisms, but also physico-chemical reactions, including ion association/
dissociation and liquid–gas transfer. In total, 19 processes, 24 components, and 56
relative stoichiometric and kinetic parameters are assumed for biological processes. One
of the significant limitations of this model is the absence of phosphorus modeling and the
fate of sulfur compounds. This includes the generation of H2S in the digester gas and the
fate of sulfur species in the digested sludge, as a predictor of odor-generating potential
[10]. Although Higgins et al. [2] studied the fate of odor precursors (such as protein) in
anaerobic digestion, systematic research on odor precursors in anaerobic digestion of
municipal biosolids is very limited [1]. The objectives of this work were to monitor the

163
degradation of various protein fractions (particulate, soluble, and bound) of primary and
secondary municipal sludge during anaerobic digestion; determine the relationship
between various protein fractions and other sludge quality parameters; simulate the odors
precursors degradation; and estimate the odors precursors reaction kinetics, namely,
protein, amino acids and volatile fatty acids (VFAs) using the state of the art anaerobic
digestion model (ADM1). Modeling of the odors precursors is beneficial as it allows
users to mathematically predict degradation of those compounds for different types of
sludges with known characteristics.
6.2 Materials and methods:
Primary sludge (PS), waste activated sludge (WAS), and anaerobic sludge (seed sludge)
were obtained from a full scale anaerobic digester at St. Marys, Water Pollution Control
Plant (Ontario, Canada) twice a week. The sludges were then stored in a cool room at
4°C. Four 4-L reactors were used as anaerobic bioreactors, with a working volume of 3.5
L and hydraulic retention time (HRT) of 14 days. The working volume in all reactors was
filled with anaerobic sludge at the beginning. Subsequently, two reactors (duplicates)
were fed with 250 mL/d of primary sludge and the other two (duplicates) were fed with
250 mL/d of waste activated sludge. The reactor contents were continuously mixed using
the WU-50007-30 Cole-Parmer® Stir-Pak® mixer. A temperature of 38°C was maintained
by using hot water recycled from a water bath, and pH was controlled in a narrow range
of 6.5-7.5 during the experiments. Both influent and effluent of the reactors were
analyzed once a week over the entire duration of experiments. The reactors’ biogas was
measured using a Wet-Tip gas meter (Gas Meters for Laboratories, Nashville, TN). All

164
four reactors were operated continuously over a period of seventy days and served to
maintain constant inoculums for the experiments described. All the experiments and
analysis were conducted in duplicates.
6.2.1 Analytical methods:
Standard methods [11] were used to determine total chemical oxygen demand (TCOD),
soluble chemical oxygen demand (SCOD), biological oxygen demand (BOD), total
suspended solids (TSS), volatile suspended solid (VSS), alkalinity, lipid, total nitrogen
(TN), total phosphorus (TP), and H2S content of the biogas (iodometric method). For
volatile fatty acids (VFA) 50 mL samples were centrifuged at 3,000 x g for 15 minutes at
5˚C to separate the liquid and solids in the sample. The centrate was filtered with a 0.45-
µm membrane and the filtrate was used to measure the VFA concentrations using a gas
chromatograph (Varian 8500, Varian Inc., Toronto, Canada) with a flame ionization
detector (FID) equipped with a fused silica column (30 m × 0.32 mm). Helium was used
as carrier gas at a flow rate of 5 mL/min. The temperatures of the column and detector
were 110 and 250 °C, respectively. Protein was determined by micro-bicinchoninic acid
protein assay (Pierce, Rockford, USA), which was modified by Lowry et al. [12]. The
biogas composition was determined by a gas chromatograph (Model 310, SRI
Instruments, Torrance, CA) equipped with a thermal conductivity detector (TCD) and a
molecular sieve column (Molesieve 5A, mesh 80/100, 182.88 × 0.3175 cm).
165
6.2.2 Anaerobic digestion simulation:
ADM1 is a complex model involving many input parameters; for example, the decay of
microorganisms and the regeneration cycle are strongly interrelated and the COD content
assumed in ADM1 is rather complex [13]. The decay processes of all microorganisms
result in the production of carbohydrates, proteins and lipids, which can be used as
substrates after disintegration and hydrolysis. The regeneration of organic matter from
biomass decay makes the model more complex [13]. Inhibition and gas transfer are also
complex steps in the model. The default stoichiometric matrix and rate of reactions
equations described by the ADM1 technical report [4] were used. MATLAB 2008 (The
MathWorks, Inc. Natick, US) ODE23S ordinary dynamic equation solver was used to
solve the dynamic differential and algebraic system of equations.
6.2.3 Statistical analysis:
The student t-test was used to test the hypothesis of equality at the 95% confidence level.
The null hypothesis was defined as no difference between the two groups tested vs. the
alternative hypothesis that there is a statistical difference between the two groups.
6.3 Results and discussion:
6.3.1 Performance of anaerobic digesters:
The biodegradability of waste components in anaerobic digestion varies widely [14]
depending on many factors, such as the concentration and components of sludge, types
and amount of anaerobic bacteria, organic loading rate, hydraulic residence time,

166
temperature, and pH. The reductions of total suspended solids (TSS), volatile suspended
solids (VSS), total chemical oxygen demand (TCOD), soluble chemical oxygen demand
(SCOD), and biological oxygen demand (BOD5) are usually used to evaluate the removal
efficiency of waste substances in anaerobic digestion. Steady-state data collection was
after 30 days of operation corresponding to two turnovers of the mean SRT, and steady
state reductions of TSS, VSS, TCOD, SCOD in both PS and WAS are shown in Figure
6.1 (a, b, c, and d), respectively. A summary of the steady-state performance data for the
digesters is also shown in Table 6.1.
(a)
0
10
20
30
40
50
0 10 20 30 40 50 60 70 80Time (d)
TSS
Red
uctio
n(%
)
PS
WAS
(b)
0
10
20
30
40
50
60
0 10 20 30 40 50 60 70 80Time (d)
VSS
Red
uctio
n(%
)
PS
WAS
(c)
0
10
20
30
40
50
60
70
0 10 20 30 40 50 60 70 80Time (d)
TCO
DR
educ
tion
(%)
PS
WAS
(d)
0
10
20
30
40
50
60
70
80
0 10 20 30 40 50 60 70 80Time (d)
SCO
DR
educ
tion
(%)
PS
WAS
Figure 6.1 Reduction in PS and WAS in anaerobic digestion (a) TSS (b) VSS (c) TCOD (d) SCOD.
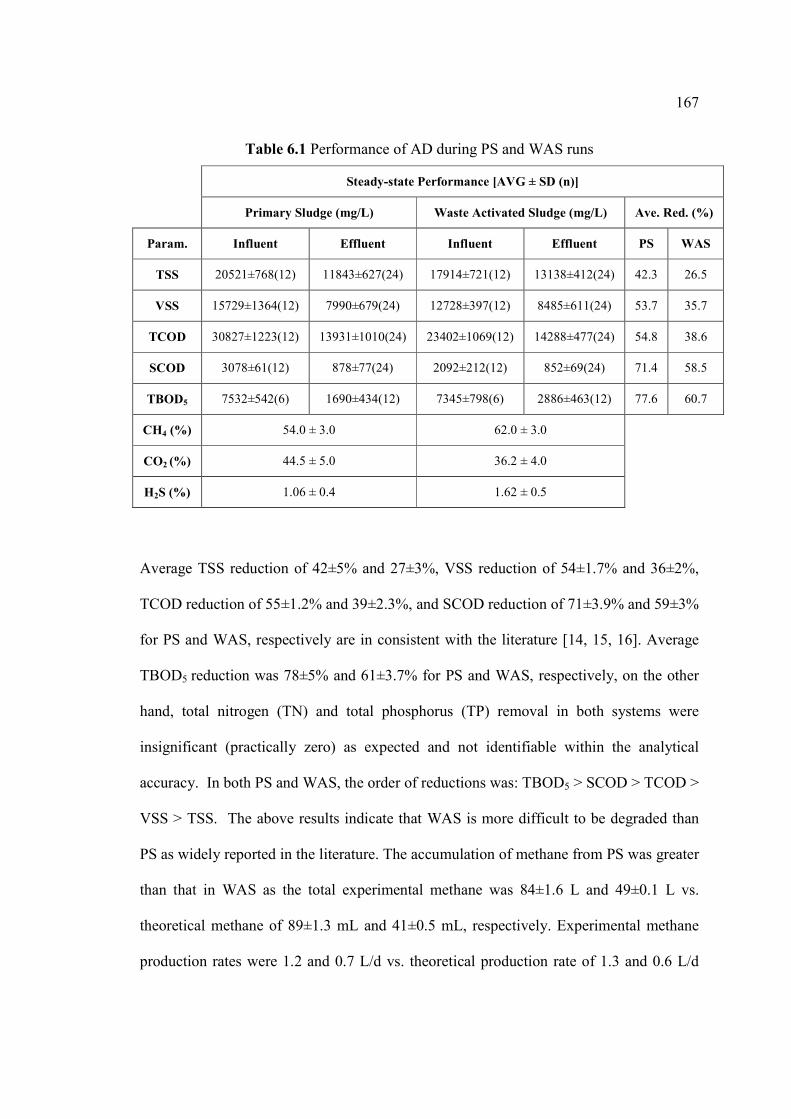
167
Table 6.1 Performance of AD during PS and WAS runs
Steady-state Performance [AVG ± SD (n)]
Primary Sludge (mg/L) Waste Activated Sludge (mg/L) Ave. Red. (%)
Param. Influent Effluent Influent Effluent PS WAS
TSS 20521±768(12) 11843±627(24) 17914±721(12) 13138±412(24) 42.3 26.5
VSS 15729±1364(12) 7990±679(24) 12728±397(12) 8485±611(24) 53.7 35.7
TCOD 30827±1223(12) 13931±1010(24) 23402±1069(12) 14288±477(24) 54.8 38.6
SCOD 3078±61(12) 878±77(24) 2092±212(12) 852±69(24) 71.4 58.5
TBOD5 7532±542(6) 1690±434(12) 7345±798(6) 2886±463(12) 77.6 60.7
CH4 (%) 54.0 ± 3.0 62.0 ± 3.0
CO2 (%) 44.5 ± 5.0 36.2 ± 4.0
H2S (%) 1.06 ± 0.4 1.62 ± 0.5
Average TSS reduction of 42±5% and 27±3%, VSS reduction of 54±1.7% and 36±2%,
TCOD reduction of 55±1.2% and 39±2.3%, and SCOD reduction of 71±3.9% and 59±3%
for PS and WAS, respectively are in consistent with the literature [14, 15, 16]. Average
TBOD5 reduction was 78±5% and 61±3.7% for PS and WAS, respectively, on the other
hand, total nitrogen (TN) and total phosphorus (TP) removal in both systems were
insignificant (practically zero) as expected and not identifiable within the analytical
accuracy. In both PS and WAS, the order of reductions was: TBOD5 > SCOD > TCOD >
VSS > TSS. The above results indicate that WAS is more difficult to be degraded than
PS as widely reported in the literature. The accumulation of methane from PS was greater
than that in WAS as the total experimental methane was 84±1.6 L and 49±0.1 L vs.
theoretical methane of 89±1.3 mL and 41±0.5 mL, respectively. Experimental methane
production rates were 1.2 and 0.7 L/d vs. theoretical production rate of 1.3 and 0.6 L/d
168
for PS and WA, respectively. Theoretical methane was determined based on CH4
equivalent COD of 0.395L CH4/gCOD at 37oC [17]. It is necessary to note that in the
case of PS the theoretical values of CH4 were 6% higher than the experimental values,
while the opposite (19% lower) was observed in the case of WAS. Nonetheless, based on
the results obtained from the t-test analysis we can conclude that there is no statistically
significant difference between experimental and theoretical methane for both PS and
WAS at the 95% confidence level. The composition of bio-gas in both systems is shown
in Table 6.1. Although the WAS digester exhibited lower VSS and COD destruction
efficiencies, higher methane content was observed at 62% versus 54% in the PS digester.
The above results indicated that both PS and WAS digestion reactors were working well
and produced expected results.
6.3.2 Odorous compounds and odours precursors:
6.3.2.1 Volatile Fatty Acids (VFA):
Figure 6.2a shows the influent concentrations of the volatile fatty acid components in PS
and WAS. The concentration of VFA in PS (1855±58 mg/L) was much higher than that
of WAS (506±17 mg/L). For PS, acetic acid (482±59 mg/L), propionic acid (481±46
mg/L), and butyric acid (540±79 mg/L) were the predominant VFA, while in WAS only
acetic and propionic acid concentrations were high at 226±26 mg/L and 171±15 mg/L,
respectively. The ratio of VFA in PS to WAS was around 3.7. The average VFA/SCOD
ratios were 2.2% and 0.6% for PS and WAS, respectively. Higher concentrations of the
organic acid in PS may indicate septicity of the sludge [18]. In addition, higher
concentrations of VFAs after anaerobic digestion in PS indicate greater odor potential for

169
this sludge. Figure 6.2b presents the average reduction of each VFA for both systems.
The removal efficiencies are very high for all volatile acids. The average VFA reduction
reached 97±1% for PS and 92±5% for WAS.
(a) 0
100
200
300
400
500
600
700
Acetic Acid Propionic Acid Butyric Acid Valeric Acid
Con
cent
ratio
n(m
g/L
CO
D)
PSWAS
0
500
1000
1500
2000
2500
Total VFA
(b)
0
20
40
60
80
100
120
Acetic Acid Propionic Acid Butyric Acid Valeric Acid
Red
uctio
n(%
)
PSWAS
Total VFA
Figure 6.2 Average VFA in PS and WAS. (a) influent concentrations (b) reduction.

170
6.3.2.2 Proteins Fractions:
Table 6.2 displays the average influent concentrations of various protein fractions in PS
and WAS. Soluble protein was 12% and 10% of the SCOD for PS and WAS,
respectively, while the particulate protein was 9% and 12% of the particulate COD.
Table 6.2 Average concentrations, and reductions of various protein fractions in PS and WAS
Primary Sludge (mg/L) Waste Activated Sludge (mg/L)
Proteins Influent Effluent Red. (%) Influent Effluent Red. (%)
Soluble protein (mg/L) 387 ± 98 230 ± 77
Particulate protein (mg/L) 2158 ± 119
2531 ± 87
Bound protein (mg/L) 380 ± 37 158 ± 16 61.4 ± 4.8 702 ± 33 294 ± 28 58.5 ± 3.2
Cell protein (mg/L) 1777 ± 92 1204 ± 82 31.2 ± 5.0 1828 ± 64 1481 ± 71 18.0 ± 5.5
Particulate Protein (g/gVSS) 0.133 0.171 0.199 0.211
Bound Protein (g/gVSS) 0.024 0.020 0.055 0.036
Cell Protein (g/gVSS) 0.110 0.151
0.143 0.174
The labile and particulate protein fractions of the PS were lower than those of WAS,
whereas higher soluble protein was observed in the PS compared to WAS. The relatively
higher labile and particulate protein concentrations in WAS relative to PS are reasonable
since labile and particulate proteins are associated with bacterial cell mass and the WAS
is primarily biomass. As seen above, average reduction of soluble protein and particulate

171
protein in PS was 67±3.4% and 40±2.5%, respectively, which is slightly higher than that
of WAS’ 61±3.2%, and 31±3%, respectively. Figure 6.3a shows that particulate protein
reduction correlated well with the VSS reduction in both PS and WAS with R2 of 85%
and 82%, respectively. Since particulate protein is composed of the cellular protein and
bound protein (loosely attached with the cell), it is also considered as a component of
VSS, and the correlation of its degradation with that of VSS is reasonable. As indicated
earlier, odor potential is directly related to the labile/bound protein content in
sludge/biosolids [2, 19] and its removal can substantively reduce the malodor of sludge.
The average reduction of bound or labile protein for both PS and WAS were 61±4.8%
and 59±3%, respectively. It is also noticeable that there is no statistically significant
difference between the bound protein reductions in both PS and WAS at the 95%
confidence level. Figure 6.3b shows the relationship between bound protein reduction
and VSS reduction; bound protein reduction increases from 45% to 68% with VSS
reduction from 28% to 37% in the case of PS. For WAS bound protein reduction
increased from 51% to 67% with VSS reduction changed from 31% to 50%; bound
protein or the labile fraction of proteins reduction are also positively correlated with VSS
reduction.
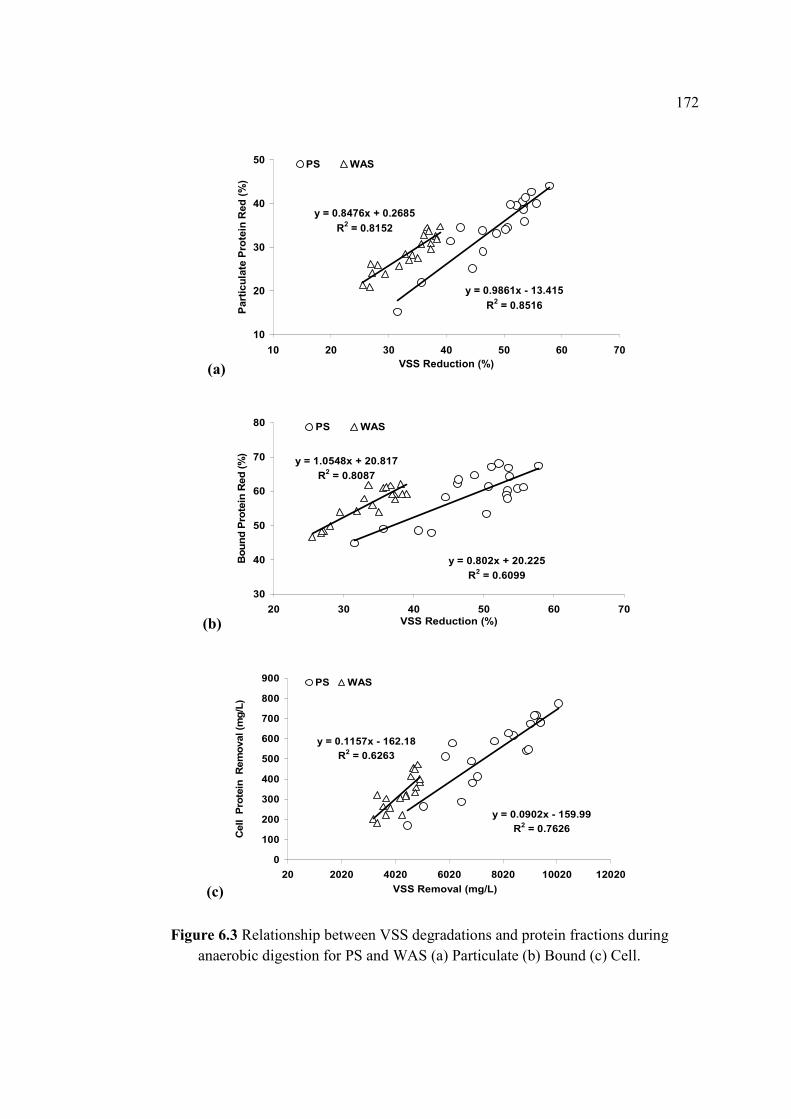
172
(a)
y = 0.9861x - 13.415R2 = 0.8516
y = 0.8476x + 0.2685R2 = 0.8152
10
20
30
40
50
10 20 30 40 50 60 70VSS Reduction (%)
Part
icul
ate
Prot
ein
Red
(%)
PS WAS
(b)
y = 0.802x + 20.225R2 = 0.6099
y = 1.0548x + 20.817R2 = 0.8087
30
40
50
60
70
80
20 30 40 50 60 70VSS Reduction (%)
Bou
ndPr
otei
nR
ed(%
)
PS WAS
(c)
y = 0.0902x - 159.99R2 = 0.7626
y = 0.1157x - 162.18R2 = 0.6263
0
100
200
300
400
500
600
700
800
900
20 2020 4020 6020 8020 10020 12020VSS Removal (mg/L)
Cel
lPr
otei
nR
emov
al(m
g/L)
PS WAS
Figure 6.3 Relationship between VSS degradations and protein fractions during anaerobic digestion for PS and WAS (a) Particulate (b) Bound (c) Cell.
173
Further analysis was conducted using the particulate protein data. The difference between
particulate and bound protein is the cellular protein of the bacterial mass, degradations of
bound and cell protein in both PS and WAS are compared in Table 6.2. Although, bound
protein removals in both sludges were comparable, the cellular protein removal was
slightly higher in PS than WAS consistent with the relatively higher VSS destruction in
PS. Cell protein removal was reasonably correlated with VSS removal (Figure 6.3c).
Bound protein removal was better than cell protein in both sludges reflecting the
biodegradability of bound protein [13]. The particulate protein content was normalized
with respect to VSS content and is presented in Table 6.2 for the raw and digested
sludges. As expected, WAS has more particulate protein than PS, due to the fact that
WAS is predominantly biomass and both bound and cell protein are parts of the biomass
in WAS. Data in Table 6.2 confirm that bound protein per unit mass of VSS in primary
sludge and WAS decreased by about 17% and 33%, respectively implying that odor
generation potential downstream of anaerobic digestion is mitigated not only as a result
of anaerobic VSS reduction, but also by a reduction in bound/labile protein per unit mass,
as bound protein is also a constituent of VSS. In this study, cell protein removal was only
about 7% - 8% of the VSS removal.
6.3.2.3 Lipid Degradation:
Lipids are also a source of odor in biosolids storage. The average concentrations of lipids
in raw PS and WAS were 1486±423 mg/L and 367±144 mg/L, respectively. Compared to
other constituents, lipid reduction for both types of sludges exhibited greater variability,
as reflected by the steady state averages of 64±6.8 % and 38±4.7 % for PS and WAS,

174
respectively. The higher lipid reduction in PS is intriguing as fats and greases, which
predominate in PS are generally less biodegradable than oils [20].
6.4 Simulation and kinetics for odor-causing constituent:
The steady-state Anaerobic Digestion Model #1 (ADM1) had been used with good
success for approximately two years on a wide range of full-scale wastewater treatment
facilities [10, 21, 22]. All biochemical extracellular solubilization steps are divided into
disintegration and hydrolysis, of which the first is a largely non-biological step and
converts composite particulate substrate to inerts, particulate carbohydrates, protein and
lipids. The second is enzymatic hydrolysis of particulate carbohydrates, proteins and
lipids to monosaccharides, amino acids and long chain fatty acids (LCFA), respectively.
Disintegration is mainly included to describe degradation of composite particulate
material with lumped characteristics (such as primary or waste-activated sludge), while
the hydrolysis steps are to describe well defined, relatively pure substrates (such as
cellulose, starch and protein feeds). All disintegration and hydrolysis processes are
represented by first order kinetics. Two separate groups of acidogens degrade
monosaccharide and amino acids to mixed organic acids, hydrogen and carbon dioxide.
The organic acids are subsequently converted to acetate, hydrogen and carbon dioxide by
acetogenic groups that utilize LCFA, butyrate and valerate (one group for the two
substrates), and propionate. The hydrogen produced by these organisms is consumed by
hydrogen-utilizing methanogenic bacteria, and the acetate by aceticlastic methanogenic
bacteria. Death of biomass is represented by first order kinetics, and dead biomass is
maintained in the system as composite particulate material. Inhibition functions include

175
pH (all groups), hydrogen (acetogenic groups) and free ammonia (aceticlastic
methanogens). pH inhibition is implemented as one of two empirical equations, while
hydrogen and free ammonia inhibition are represented by non-competitive functions. The
other uptake-regulating functions are secondary Monod kinetics for inorganic nitrogen
(ammonia and ammonium), to prevent growth when nitrogen is limited, and competitive
uptake of butyrate and valerate by the single group that utilizes these two organic acids.
Total protein, lipids, carbohydrate, inert particulates as well as soluble components that
include amino acids, long chain fatty acids, sugars and VFAs were the model inputs with
protein (measured) based on C6H14O2N2, lipid (measured) based on C57H104O6, [23], inert
particulates (measured as TS minus VS), carbohydrate (estimated from the particulate
COD mass balance), long chain fatty acids (measured), amino acids (measured as soluble
protein), sugars (estimated from the soluble COD balance), acetate (measured),
propionate (measured), and butyrate (measured). The various components of biomass, i.e,
sugar, amino acid, long chain fatty acids, valerate and butyrate, propionate, acetate, and
hydrogen degraders, all were set to zero following the recommendation of Batstone et al.
[4]. The input values of ADM parameters as percentages of PCOD (particulate chemical
oxygen demand) were 10% protein, 15% lipids, and 57% carbohydrate with sugars,
amino acids, long chain fatty and VFA’s contributing 2%, 8%, 5%, and 60% of the
SCOD respectively in the case of PS, while in the case of WAS the corresponding
contribution of protein, lipid and carbohydrate to PCOD were 6%, 5%, and 55% with
sugars, amino acids, long chain fatty and VFA’s contributing, 13%, 7%, 27% and 24% of
the SCOD. It is evident that PS contained higher percentage of lipids and VFAs than
WAS, while the sugars and long chain fatty acids were higher in WAS than PS. The

176
kinetics, stoichiometric and physico-chemical parameters used in this simulation are the
recommended/default values reported in the ADM1 technical report [4], whereas the
modified (optimized) kinetics parameters were determined after calibration of the ADM1
simulations with the experimental data of the anaerobic reactors used in this work. It is
important to mention that the reaction rates (kinetics) vary widely based on the type of
sludge or substrate used, Christ et al. reported the hydrolysis rate coefficient (k) were in
the range of 0.025-0.2d-1, 0.015-0.075d-1, and 0.005-0.01d-1 for carbohydrates, proteins
and lipids in sewage sludge, respectively [13], Gujer and Zehnder reported that the k
were in the range of 0.041-0.13d-1, 0.02-0.03d-1, and 0.08-0.4d-1 [4], O'Rourke et al.
found them to be 0.21-1.94d-1, 0.0096-0.1d-1, and 0.0096-0.17d-1 in PS [4], while
Batstone et al. reported that k was 0.25d-1 ± 100%, 0.2d-1 ± 100%, and 0.1d-1± 300% [4].
The first step was to set the initial (default) values for all model parameters. Subsequently
the simulation was undertaken to fit the model output to the experimental data. Based on
the simulation outcome the kinetics values were optimized. Initial parameter values,
percent variation, estimated parameter values for PS and WAS that better fit the
experimental data are given in Table 6.3.

177
Table 6.3 Default and optimized ADM kinetic parameters for both PS and WAS sludge
ADM* Varies within*
Estimated PS
Estimated WAS
carbohydrate K_hyd_ch d-1 0.25 100% 0.3 0.1
protein K_hyd_pr d-1 0.2 100% 0.05 0.03
Hyd
roly
sis
lipids K_hyd_li d-1 0.1 300% 0.09 0.05
sugars km_su d-1 30 100% 30 30
amino acids km_aa d-1 50 100% 4 5
long chain fatty acids km_fa d-1 6 300% 6 6
Propionic acid km_pro d-1 13 100% 15 20
Acetic acid km_ac d-1 8 100% 8 11
Max
imum
upta
kera
te
Valeric acid + Butyric acid km_c4 d-1 20 100% 20 30
sugars Ks_su kgCOD/m3 0.5 100% 0.5 0.5
amino acids Ks_aa kgCOD/m3 0.3 30% 0.3 0.3
long chain fatty acids Ks_fa kgCOD/m3 0.4 300% 0.4 0.4
Propionic acid Ks_pro kgCOD/m3 0.1 100% 0.1 0.1
Acetic acid Ks_ac kgCOD/m3 0.15 100% 0.1 0.1
Hal
fsat
urat
ion
cons
tant
Valeric acid + Butyric acid Ks_c4 kgCOD/m3 0.3 300% 0.1 0.1
* (Batstone et al., 2002)
To better describe the process, the initial values of the carbohydrate, lipid and protein
hydrolysis rate coefficients, for example, were set based on the technical report [4] khyd_ch
= 0.25 d-1, khyd_pr = 0.2 d-1, and khyd_li = 0.1 d-1 respectively, then ADM1 model was

178
applied and its outcomes were compared to experimental data, based on the comparison
the kinetics were optimized to khyd_ch = 0.3 d-1, khyd_pr = 0.05 d-1, and khyd_li = 0.09 d-1 in
the case of PS and khyd_ch = 0.1 d-1, khyd_pr = 0.03 d-1, and khyd_li = 0.05 d-1 in the case of
WAS. As expected, the hydrolysis kinetic parameters were higher in PS than WAS, since
primary sludge contains more particulate substrates such as lipids, carbohydrates and
proteins than the WAS, which is predominantly biomass with large biopolymers that are
more difficult to degrade. The relative ease of biodegradability of PS as compared to
WAS is well documented in the literature [15]. Table 6.4 displays the influent and
effluent sludge characteristics as well as the methane production along with the ADM
predictions for both PS and WAS, respectively.
It is evident that the model results with optimized parameters showed good agreement
with the experimental data for methane production with average percentage error of 3%
and 5% for primary and WAS, respectively. Similar agreement was observed in case of
odor precursors, namely, protein, VFAs, lipids and amino acid as the percentage error
were 6%, 4%, 1%, and 5% for PS and 3%, 11%, 6%, and 0.1% in the case of WAS,
respectively. Maximum deviation in the fitted parameter values from the default values
occurred for hydrolysis rate constant for protein and maximum uptake rate for amino
acids.

179
Table 6.4 Experimental influent and effluent characterization with the ADM prediction for primary and WAS sludge.
Exp. ADM
Gas (L/d) 1.2 1.24
Influent Effluent ADM Reduction Exp. Reduction ADM SCOD (mg/L) 3078 878 961 71% 69% TCOD (mg/L) 30827 13931 14627 55% 53% Lipid (mg/L) 1485.0 665 657.4 55% 56% P Protein (mg/L) 2158.0 1367 1281.5 37% 41% Amino acid (mg/L) 193.5 81.5 85.2 58% 56%
Propionate (mg/L) 481 19 20.8 96% 96% Butyrate (mg/L) 540 12 10.7 98% 98% Valerate (mg/L) 252 4 4.9 98% 98% Acetate (mg/L) 582 30 31.1 95% 95%
Prim
ary
Slud
ge
VFA (mg/L) 1855.0 65.0 67.6 96% 96%
Gas (L/d) 0.68 0.65
Influent Effluent ADM Reduction Exp Reduction ADM SCOD (mg/L) 2092 852 788 59% 62% TCOD (mg/L) 23402 14288 14993 39% 36% Lipid (mg/L) 367 215 228.3 41% 38% P Protein (mg/L) 2529 1828 1774.3 28% 30% Amino acid (mg/L) 115 56 56.4 51% 51%
Propionate (mg/L) 171 11 13.6 94% 92% Butyrate (mg/L) 80 5 6.3 94% 92% Valerate (mg/L) 29 3 2.9 90% 90% Acetate (mg/L) 226 19 19.5 92% 91%
Was
teA
ctiv
ated
Slud
ge
VFA (mg/L) 506.0 38.0 42.2 92% 92%

180
6.5 Conclusions:
Degradation of odorous compounds such as VFA, lipid and bound protein in sludge
during anaerobic digestion was systematically monitored and modeled using the ADM1.
Below are the highlights of the major findings of this study:
o In general, anaerobic digestion efficiency for all sludge primary parameters such as
TSS, VSS, TCOD, SCOD and TBOD5 for primary sludge was higher than waste
activated sludge.
o The concentration of VFA in the raw PS of 1855±58 mg/L was considerably higher
than the raw WAS of 506±17 mg/L, with average removal efficiencies during
anaerobic digestion of 97±1%, and 92±5%, respectively. The average
concentrations of lipids in the raw PS and WAS were 1486±423 mg/L and 367±144
mg/L, respectively, and the removal of lipid varied during anaerobic digestion
varied.
o Average reductions of various protein fractions were 40±2.5% and 31±3% for
particulate protein, 67±3.4% and 61±3.2% for soluble protein, and 61±4.8 % and
59±3 % for bound or labile protein for PS and WAS, respectively. Reduction of
bound protein or the labile protein, which is implicated in odor production in sludge,
was positively correlated with VSS reduction for both sludges. No statistically
significant difference was observed between the bound protein reductions in both
PS and WAS. A 17% and 37% reduction in bound protein per unit VSS, indicates a
possible reduction in odor generation potential not only associated with stabilization
of VSS, but also due to bound protein degradation.
181
o The steady-state Anaerobic Digestion Model #1 (ADM1) was used to simulate the
steady state lab scale anaerobic digester. The model predicted both the methane
production and odor precursors. The model results with optimized parameters
showed good agreement with the experimental data for methane production with
average percentage errors of 3% and 5% for primary and WAS, respectively. Good
agreement was also observed for the odor precursors, namely, protein, VFAs, lipids
and amino acids as reflected by percentage errors of 6%, 4%, 1%, and 5% in the
case of PS and 3%, 11%, 6%, and 0.1% in the case of WAS, respectively.

182
6.6 References:
[1] Higgins, M.; Adams, G.; Chen, Y.; Erdal, Z.; Forbes, R.; Glindemann, D.;
Hargreaves, J. McEwen, D.; Murthy, S.; Novak, J.; Witherspoon, J. Role of Protein,
Amino Acids, and Enzyme Activity on Odor Production from Anaerobically Digested
and Dewatered Biosolids, Wat. Environ. Res., 2008, 80, 127.
[2] Higgins, M.; Adams, G.; Chen, Y.; Erdal, Z.; Forbes, R.; Glindemann, D.;
Hargreaves, J. McEwen, D.; Murthy, S.; Novak, J.; Witherspoon, J. Relationship
between biochemical constituents and production of odor causing compounds from
anaerobically digested biosolids, WEF and AWWA Odors and Air Emissions 2004
Conference, Washington, USA, 2004, 18-24.
[3] Rideout, T. C.; Fan, M. Z.; Cant, J. P.; Wagner-Riddle, C.; Stonehouse, P. Excretion
of major odor-causing and acidifying compounds in response to dietary
supplementation of chicory inulin in growing pigs, J. Anim. Sci. 2004, 82, 1678-
1684.
[4] Batstone, D. J.; Keller, J.; Angelidaki, I.; Kalyuzhnyi, S. V.; Pavlostathis, S. G.;
Rozzi, A.; Sanders, W. T. M.; Siegrist, H.; Vavilin, V. A. Anaerobic Digestion Model
No. 1, IWA Task Group for Mathematical Modelling of Anaerobic Digestion
Processes, Water Sci. Technol. 2002, 10, 65–73.
[5] Barnett, J.W.; Kerridge, G.J.; Russell, J. M. Effluent treatment systems for the dairy
industry. Aus. Biotech. 1994, 4, 26-30.
[6] Dignac, M. F.; Ginestet, M. P.; Rybacki, D.; Bruchet, A.; Urbain, V.; Scribe, P.; Fate
of wastewater organic pollution during activated sludge treatment: nature of residual
organic matter, Water Research. 2000, 34, 4185-4194.
[7] Breure, A. M.; Mooijman, K. A.; Van-Andel, J. G. Protein degradation in anaerobic
digestion: influence of volatile fatty acids and carbohydrates on hydrolysis and
acidogenic fermentation of gelatin, Appl. Microbiol. Biotechnol, 1986, 24, 426-431.
[8] Kisaalita, W. S. ; Lo, K. V.; Pinder, K. L. Influence of whey protein on continuous
acidogenic degradation of lactose, Biotechnol. Bioeng. 1990, 36, 642-646.
183
[9] Gavala, H. N; Angelidaki, I.; Ahring, B. K. Kinetics and modeling of anaerobic
digestion process. Adv. Biochem. Eng. Biotechnol. 2003, 81, 57-93.
[9] Johnson, B. Aand Shang, Y. Applications and limitations of ADM 1 in municipal
wastewater solids treatment, Water Sci. Technol. 2006, 54, 77–82.
[10] APHA. Standard Methods for the Examination of Water and Wastewater,
Washington DC, APHA, 1998.
[11] Lowry, O. H.; Rosebrough, N. J.; Fair, A. L.; Randall, R. J. Protein measurement
with the folin-phenol reagent, J. Biol. Chem, 1951, 193, 265-275.
[12] Gujer, W.; Henze, M.; Mino, T.; Loosdrecht, M. Activated sludge model no. 3,
Water Sci. Technol.1999, 39, 183–193.
[13] Mata-Alvarez, J.; Macé, S.; Llabrés, P.; Anaerobic digestion of organic solid wastes.
an overview of research achievements and perspectives. Bioresour. Technol. 2000,
74, 3-16.
[14] Roš, M.; Zupančič, G. D. Thermophilic anaerobic digestion of waste activated
sludge. Acta Chim. Slov. 2002, 50, 59-74.
[15] Park, C.; Lee, C.; Kim, S.; Chen, Y.; Chase, H. Upgrading of anaerobic digestion by
incorporating two different hydrolysis processes J. Biosci. Bioeng. 2005, 100, 164-
167.
[16] Metcalf and Eddy, Wastewater Engineering: Treatment Disposal Reuse, 2003, 4th
ed. McGraw-Hill
[17] Richard, M. Activated sludge microbiology problems and their control. 20th Annual
USEPA National Operator Trainers Conference. Buffalo, NY, June 8, 2003.
[18] Subramanian, R.; Novak, J. T.; Murthy, S.; North, J. Investigating the role of process
conditions in wastewater sludge odor generation, WEFTEC 2005, Washington, D.C.,
USA. 2005.
[19] Cirne, D. G.; Paloumet, X.; Björnsson, L;. Alves, M.; Mattiasson, B. Anaerobic
digestion of lipid-rich waste-effects of lipid concentration. Ren. Ene. 2007, 32, 965-
975.

184
[20] D. J. Batstone and J. Keller, Industrial applications of the IWA anaerobic digestion
model No. 1 (ADM1), Water Sci. Technol. 47 (12), 2003, pp199-206.
[21] Blumensaat, F.; Keller, J. Modelling of two-stage anaerobic digestion using the
IWA
Anaerobic Digestion Model No.1 (ADM1), Wat. Res. 2004, 39, 171–183.
[22] Jeppsson, U. Investigation of anaerobic digestion alternatives for Henriksdal’s
WWTP IEA, Lund University. 2007.

185
CHAPTER SEVEN
Anaerobic Digestion Model Software Implementation
7.1 Introduction:
The Anaerobic Digestion Model No. 1 (ADM1) concept, parameters, implementation
specifics are presented and discussed in this chapter. The ADM1 is a structured
knowledge model which takes biochemical and physicochemical processes of the AD
into account. It was developed by the IWA task group for Mathematical Modeling of
Anaerobic Digestion Processes [1] and carried the following benefits:
1- Model application for full-scale plant design, operation and optimization.
2- Process optimization and control, aimed at direct implementation in full-scale
plants as a further development work.
3- Forming the common basis for further model development and validation studies
to make outcomes more comparable and compatible.
4- Technology transfer from research to industry.
The ADM1 model expresses the state variables concentration in kgCOD/m3, the molar
concentration kmole/m3 was used for components that have no COD content. The overall
units used throughout the model are given in Table 7.1. Tables 7.2 to 7.5 display the
model parameters for stoichiometric coefficients, equilibrium coefficients and constants,
kinetic reaction coefficients and rates and dynamic state variables and algebraic variables.

186
Table 7.1. Units used in the ADM1 model
Discretion Units
Concentration kgCOD/m3
Concentration (carbon non-COD) kmole C/m3
Concentration (nitrogen non-COD) kmole N/m3
Concentration (cations and anions) kmole/m3
Pressure bar
Temperature K
Volume m3
Time d
Table 7. 2 Nomenclature, description of stoichiometric coefficients
Symbol Discretion Units
Ci Carbon content of component i kmole C/kg COD
Ni Nitrogen content of component i kmole N/kg COD
vij Stoichiometiec coefficients for component i and process j kgCOD/m3
fproduct, substrate Yield of product on substrate kgCOD/kg COD
Ysubstrate Yield of biomass on substrate kgCOD/kg COD
Table 7.3 Nomenclature, description of equilibrium coefficents and constants
Symbol Discretion Units
Ka,acid Acid-base equilibrium constant M (kmole/m3)
Kh Henry’s law coefficient M bar-1
pKa -log10 [ Ka]
R Gas law constant (8.314 x 10⁻²) bar M-1.Ko-1
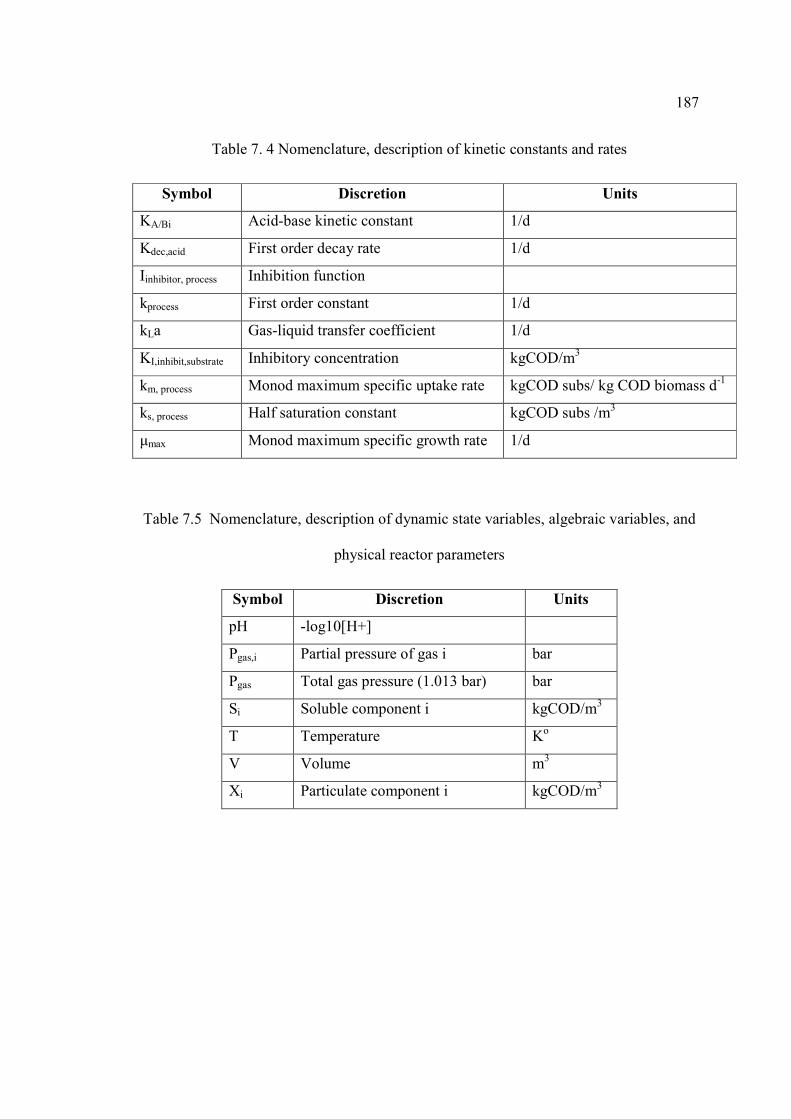
187
Table 7. 4 Nomenclature, description of kinetic constants and rates
Symbol Discretion Units
KA/Bi Acid-base kinetic constant 1/d
Kdec,acid First order decay rate 1/d
Iinhibitor, process Inhibition function
kprocess First order constant 1/d
kLa Gas-liquid transfer coefficient 1/d
KI,inhibit,substrate Inhibitory concentration kgCOD/m3
km, process Monod maximum specific uptake rate kgCOD subs/ kg COD biomass d-1
ks, process Half saturation constant kgCOD subs /m3
µmax Monod maximum specific growth rate 1/d
Table 7.5 Nomenclature, description of dynamic state variables, algebraic variables, and
physical reactor parameters
Symbol Discretion Units
pH -log10[H+]
Pgas,i Partial pressure of gas i bar
Pgas Total gas pressure (1.013 bar) bar
Si Soluble component i kgCOD/m3
T Temperature Ko
V Volume m3
Xi Particulate component i kgCOD/m3
188
7.2 Reaction System:
Two main types of reactions were considered in the ADM1 [1] and they are: biochemical
reactions and physicochemical reactions.
The model includes three overall biological intracellular steps and they are; acidogenesis,
acetogenesis and methanogenesis as well as an extracellular disintegration (non-
biological) step. In the biochemical processes, total input COD are separated since a
considerable fraction of the input COD may not be anaerobically biodegradable [1, 2].
Physicochemical conversions aside from the biochemical equations are to describe the
physico-chemical state effects, such as the effect of pH and gas concentration on
biochemical reactions.
ADM1 assumes that complex particulate waste (total input COD) will first disintegrate to
carbohydrate, protein and lipid particulate substrate, as well as particulate and soluble
inert material. The disintegration occurs before the depolymerizations, since the primary
substrate is represented by lumped kinetic and biodegradability parameters [1, 2, 3]. The
particulate waste is also used as a pre-lysis repository of decayed biomass. The
disintegration step is assumed to include lysis, non-enzymatic decay, phase separation,
and physical breakdown.
All biochemical extracellular steps were assumed to be first order, which is a
simplification based on empiricism reflecting the cumulative effect of a multi-step
process [1, 2]. The cellular processes were defined by uptake, growth, and decay
expressions. Substrate uptake is chosen as a key rate equation to decouple the growth
from uptake and to allow variable yields. The uptake is based on Monod-type kinetics.
The substrate uptake includes the biomass growth implicitly. The process rate and

189
stoichiometry matrix for biochemical reactions are given in Appendix A, together with
the physico-chemical rate equations. Suggested parameters and qualitative sensitivity and
variability are given in Table 7.6 and 7.7.
Table 7. 6 Suggested stoichiometric parameters and qualitative sensitivity and variability
[1].
Parameter
(dimensionless)
Description Value Var Notes
fsi, xc Soluble inerts from composites 0.1 2 1
fxi, xc Particulate inerts from composites 0.25 2 1
fch, xc Carbohydrates from composites 0.20 2 1
fpr, xc Proteins from composites 0.20 2 1
fli, xc Lipids from composites 0.25 2 1
Nxc, Ni Nitrogen content of composites and inerts 0.002 2 1
ffa,li Fatty acids from lipids 0.95 1 2
fh2,su Hydrogen from sugars 0.19 3 3
fbu,su Butyrate from sugars 0.13 3 3
fpro,su Propionate from sugars 0.27 3 3
fac,su Acetate from sugars 0.41 3 3
fh2,aa Hydrogen from amino acids 0.06 2 3
Naa Nitrogen in amino acids 0.007 2 3
fva,aa Valerate from amino acids 0.23 2 3
fbu,aa Butyrate from amino acids 0.26 2 3
fpro,aa Propionate from amino acids 0.05 2 3
fac,aa Acetate from amino acids 0.40 2 3
Var = Variability of parameter, 1 = varies very little between processes; 2 = varies between processes and substrates; 3 = varies dynamically within process. Notes: 1 = Varies widely 2 = Based on palmitate triglyceride 3 = Calculated from sugar and amino acid values

190
Table 7. 7 Suggested parameter values and qualitative sensitivity and variability for
mesophilic digestion [1].
Parameter Mesophilic high-rate
(nom.35oC)
Mesophilic solids
(nom, 35oC)
S Var Notes
kdis(1/d) 0.40 0.50 3 3 1
khyd_CH (1/d) 0.25 10 3 2 2
khyd_PR (1/d) 0.2 10 2 3 2
khyd_LI (1/d) 0.1 10 2 3 2
tres, x (d) 40 0 3 2 2
kdec_all (1/d) 0.02 0.02 2 2 3
kS_NH3_all (1/d) 1x10⁻⁴ 1x10⁻⁴ 1 1
pHUL acet/acid 5.5 5.5 1 2 4
pHLL acet/acid 4 4 1 2 4
km_su (CODCOD/d) 30 30 1 2
kS_su (kgCOD/d) 0.50 0.50 1 2
Ysu (COD/COD) 0.10 0.10 1 1
km_aa (CODCOD/d) 50 50 1 2
kS_aa (kgCOD/m3) 0.30 0.30 1 1
Yaa (COD/COD) 0.08 0.08 1 1
km_fa (CODCOD/d) 6 6 1 3
kS_fa (kgCOD/m3) 0.40 0.40 1 3
Yfa (COD/COD) 0.06 0.06 1 1
KI,H2_fa (kgCOD/m3) 5x10⁻⁶ 5x10⁻⁶ 1 1
km_c4+ (CODCOD/d) 20 20 1 2
kS_c4+ (kgCOD/m3) 0.30 0.30 1 3
Yc4+ (COD/COD) 0.06 0.06 1 1
KI,H2_c4+ (kgCOD/m3) 1x10⁻⁵ 1x10⁻⁵ 1 1
km_pro (CODCOD/d) 13 13 2 2
kS_pro (kgCOD/m3) 0.30 0.30 2 2
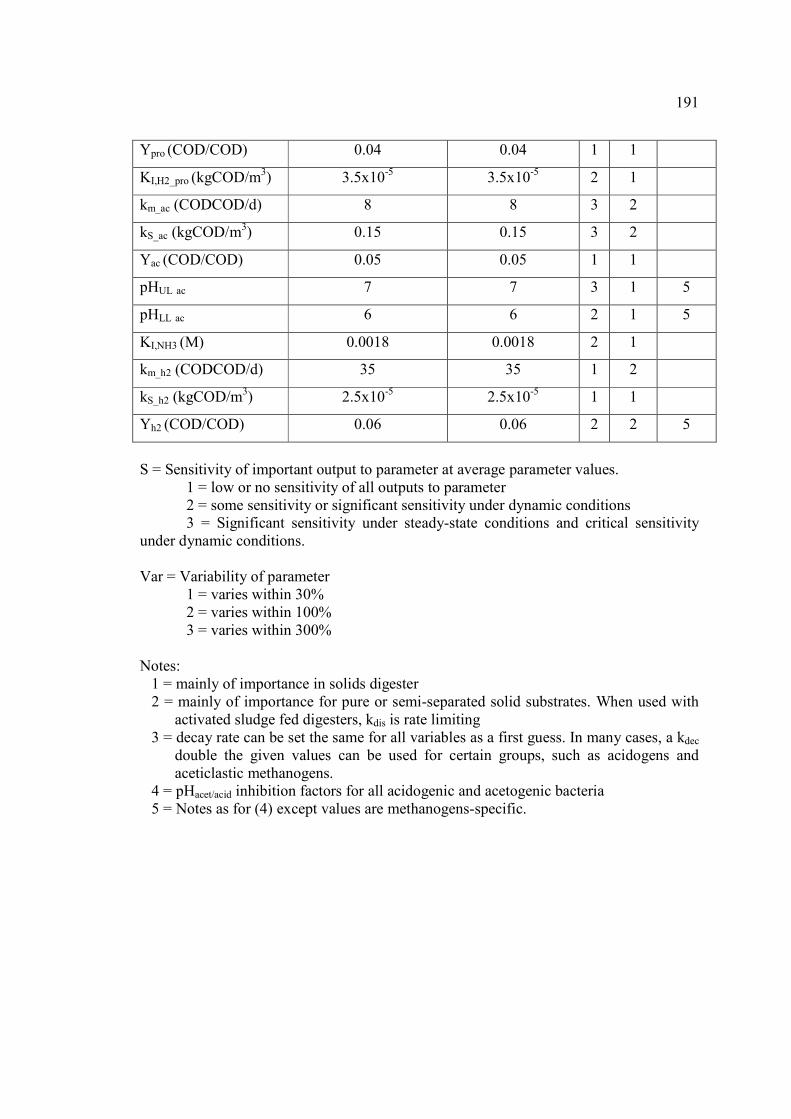
191
Ypro (COD/COD) 0.04 0.04 1 1
KI,H2_pro (kgCOD/m3) 3.5x10⁻⁵ 3.5x10⁻⁵ 2 1
km_ac (CODCOD/d) 8 8 3 2
kS_ac (kgCOD/m3) 0.15 0.15 3 2
Yac (COD/COD) 0.05 0.05 1 1
pHUL ac 7 7 3 1 5
pHLL ac 6 6 2 1 5
KI,NH3 (M) 0.0018 0.0018 2 1
km_h2 (CODCOD/d) 35 35 1 2
kS_h2 (kgCOD/m3) 2.5x10⁻⁵ 2.5x10⁻⁵ 1 1
Yh2 (COD/COD) 0.06 0.06 2 2 5
S = Sensitivity of important output to parameter at average parameter values. 1 = low or no sensitivity of all outputs to parameter 2 = some sensitivity or significant sensitivity under dynamic conditions 3 = Significant sensitivity under steady-state conditions and critical sensitivity under dynamic conditions. Var = Variability of parameter 1 = varies within 30% 2 = varies within 100% 3 = varies within 300% Notes:
1 = mainly of importance in solids digester 2 = mainly of importance for pure or semi-separated solid substrates. When used with
activated sludge fed digesters, kdis is rate limiting 3 = decay rate can be set the same for all variables as a first guess. In many cases, a kdec
double the given values can be used for certain groups, such as acidogens and aceticlastic methanogens.
4 = pHacet/acid inhibition factors for all acidogenic and acetogenic bacteria 5 = Notes as for (4) except values are methanogens-specific.

192
7.3 The Implementation of the ADM1 and Its Extension
Anaerobic digestion could be implemented as a Dynamic and Algebraic Equation (DAE)
System [1, 4]. MatLab software provides ordinary dynamic equation solver system.
Some of these solvers are explained below [4, 5]:
Ode23: This solver is an implementation of an explicit Runge-Kutta formula. It is a one-
step solver and could be more difficult to converge than Ode45 in cases of crude
tolerances and moderate stiffness.
Ode45: this solver is based on an explicit Runge-Kutta formula. It is a one-step solver
and it could be considered as the best function to apply for a “first try” for most
problems.
Ode15s: this solver is a variable order solver based on the numerical differentiation
formulas (backward deferential formation, BDF, also known as Gear’s method) that are
usually less efficient. It is a multi-step solve and can be considered as good for stiffness
problems or when solving a differential-algebraic problem.
Ode23s: this solver is based on an extended Rosen Brock formula. It is a one-step solver,
therefore, could be more efficient than Ode15s at crude tolerances and is used for the
solution of specific type of stiffness problems where Ode15s are not efficient.
7.3.1 Dynamic State Variables:
There are 32 dynamic state variables, 19 biochemical process rates, and 3 liquid-gas
transfer processes in the ADM1 dynamic system, in addition to six acid-base kinetic
processes. ADM1 takes into account 6 more dynamic state variables due to the acid-base

193
dissociation. Table 7.8 and Table 7.9 display the ADM1 variables for soluble and
particulate components, respectively.
Table 7. 8 Soluble components of DAE system dynamic state variables
State number Name Description Units
1 Ssu Sugars kgCOD/m3
2 Saa Amino acids kgCOD/m3
3 Sfa Long chain fatty acids kgCOD/m3
4 Shva Valeric acid kgCOD/m3
5 Sva- Valerate kgCOD/m3
6 Shbu Butyric acid kgCOD/m3
7 Sbu- Butyrate kgCOD/m3
8 Shpro Propionic acid kgCOD/m3
9 Spro- Propionate kgCOD/m3
10 Shac Acetic acid kgCOD/m3
11 Sac Acetate kgCOD/m3
12 Sh2 Dissolved hydrogen kgCOD/m3
13 SCH4 Dissolved methane kgCOD/m3
14 SCO2 Dissolved carbon dioxide kgCOD/m3
15 SHCO3 Dissolved bicarbonate kgCOD/m3
16 SNH4+ Ammonium kgCOD/m3
17 SNH3 Ammonia kgCOD/m3
18 SI Soluble inerts kgCOD/m3
31 Scat Cations kmol/m3
32 San Anions kmol/m3

194
Table 7. 9 Particulate components of DAE system dynamic state variables
State number Name Description Units
19 Xc Composites kgCOD/m3
20 Xch Carbohydrates kgCOD/m3
21 Xpr Proteins kgCOD/m3
22 Xli Lipids kgCOD/m3
23 Xsu Sugar degraders kgCOD/m3
24 Xaa Amino acid degraders kgCOD/m3
25 Xfa LCFA degraders kgCOD/m3
26 XC4 C4 degraders kgCOD/m3
27 Xpro Propionate degraders kgCOD/m3
28 Xac Acetate degraders kgCOD/m3
29 Xh2 Hydrogen degraders kgCOD/m3
30 XI Particulate inerts kgCOD/m3
7.3.2 Liquid Phase Equations
The general mass balance equation neglecting the diffusion terms and interfacial mass
transfer for a CSTR reactor is given below [6].
[Accumulation of mass] = [input] – [Output] + [Production]
For each state component the mass balance equation can be written as [1]:
∑−=
+−=191
,,,,
jjiiliqiliqoutiinin
iliq vrVSqSqdt
dVS … (7.1)
where iliqS , = liquid volume specific concentration variable
inq = flow in
outq = flow out

195
V = liquid volume
∑ jiivr , = summation of the specific kinetic rates for process j multiplied by rate
coefficient, vij.
Assuming constant volume, q = qin = qout, equations can be further refined to:
∑−=
+⋅
−⋅
=191
,,,,
jjii
liq
iliq
liq
iiniliq vrVSq
VSq
dtdS
… (7.2)
and for varying retention time in the case of particulate substrates:
∑−=
++
−⋅
=191
,
,
,,,
jjii
liqxres
iliq
liq
iiniliq vr
qV
t
XVXq
dtdX
… (7.3)
where: xrest , = Retention time of solids components above hydraulic retention time used
to simulate the separation solids retention.
7.3.3 Gas Phase Equations:
The model assumes constant reaction volume and integrating the gas state variables into
the system of dynamic state variables, the gas phase differential equation can be stressed
as follows:
gas
liqiT
gas
igasgasigas
VV
rVSq
dtdS
,,, +−= … (7.4)
where igasS , = Gas volume specific concentration variable
gasq = overall dry gas flow (water corrected)
gasV = Headspace volume
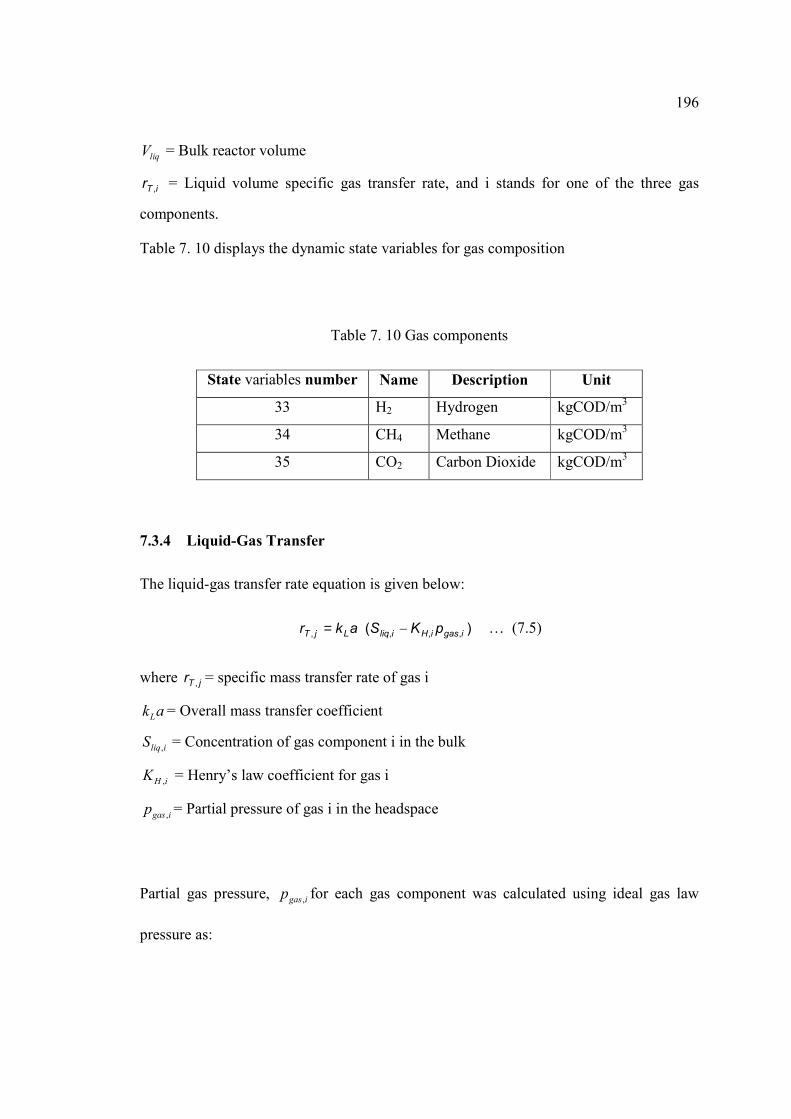
196
liqV = Bulk reactor volume
iTr , = Liquid volume specific gas transfer rate, and i stands for one of the three gas
components.
Table 7. 10 displays the dynamic state variables for gas composition
Table 7. 10 Gas components
State variables number Name Description Unit
33 H2 Hydrogen kgCOD/m3
34 CH4 Methane kgCOD/m3
35 CO2 Carbon Dioxide kgCOD/m3
7.3.4 Liquid-Gas Transfer
The liquid-gas transfer rate equation is given below:
)( ,,,, igasiHiliqLjT pKSakr −= … (7.5)
where jTr , = specific mass transfer rate of gas i
akL = Overall mass transfer coefficient
iliqS , = Concentration of gas component i in the bulk
iHK , = Henry’s law coefficient for gas i
igasp , = Partial pressure of gas i in the headspace
Partial gas pressure, igasp , for each gas component was calculated using ideal gas law
pressure as:

197
opigasigas RTSP ,, = … (7.6)
igasS , = Concentration of gas i in the head space
R = Universal gas constant (0.08134 bar/M.K)
T = Operation temperature in Kelvin Ko
igasS , was divided by 16 and 64 for hydrogen and methane, respectively, to account for
the COD equivalent of the gas.
The overall gas flow corrected for water vapor is found as:
++
−=
2
42
2
,,,
, 6416 COTCHTHT
liqOHgasgas
gas rrr
VPPRTq … (7.7)
where gasP = Total gas pressure generally could be fixed to 1.013 bar
OHgasP2, = Gas pressure of water at headspace corrected for operating temperature Top
using the following formula:
−=
opOHgas T
ExpP 1298152900313.0
2, … (7.8)
The total head pressure of 1.013 bar was assumed for the case where the gas volume is
frequently exchanged with the environment and direct connection to normal pressure
conditions in the environment is provided.
7.3.5 Acid-Base Equilibria:
Six more state variables were added to represent the acid-base equilibrium [4]. The acid-
base equilibrium equation is given below:
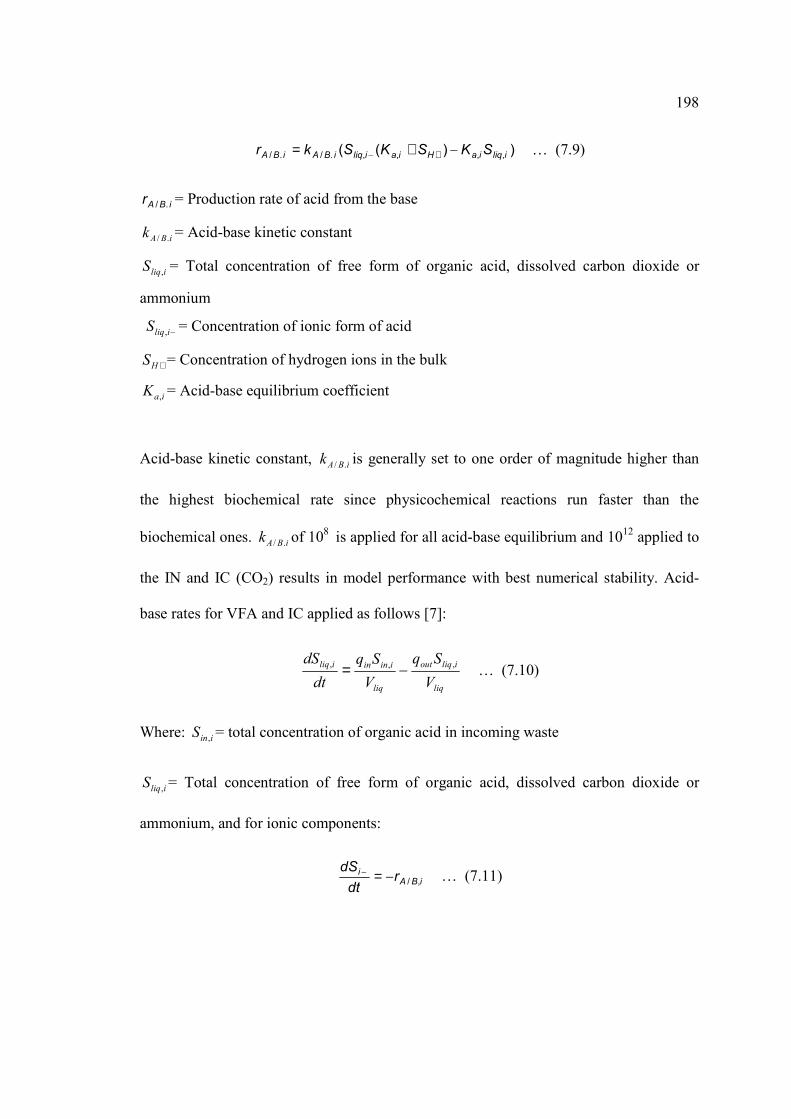
198
))(( ,,,,././ iliqiaHiailiqiBAiBA SKSKSkr −+= +− … (7.9)
iBAr ./ = Production rate of acid from the base
iBAk ./ = Acid-base kinetic constant
iliqS , = Total concentration of free form of organic acid, dissolved carbon dioxide or
ammonium
−iliqS , = Concentration of ionic form of acid
+HS = Concentration of hydrogen ions in the bulk
iaK , = Acid-base equilibrium coefficient
Acid-base kinetic constant, iBAk ./ is generally set to one order of magnitude higher than
the highest biochemical rate since physicochemical reactions run faster than the
biochemical ones. iBAk ./ of 108 is applied for all acid-base equilibrium and 1012 applied to
the IN and IC (CO2) results in model performance with best numerical stability. Acid-
base rates for VFA and IC applied as follows [7]:
liq
iliqout
liq
iininiliq
VSq
VSq
dtdS ,,, −= … (7.10)
Where: iinS , = total concentration of organic acid in incoming waste
iliqS , = Total concentration of free form of organic acid, dissolved carbon dioxide or
ammonium, and for ionic components:
iBAi rdtdS
,/−=− … (7.11)
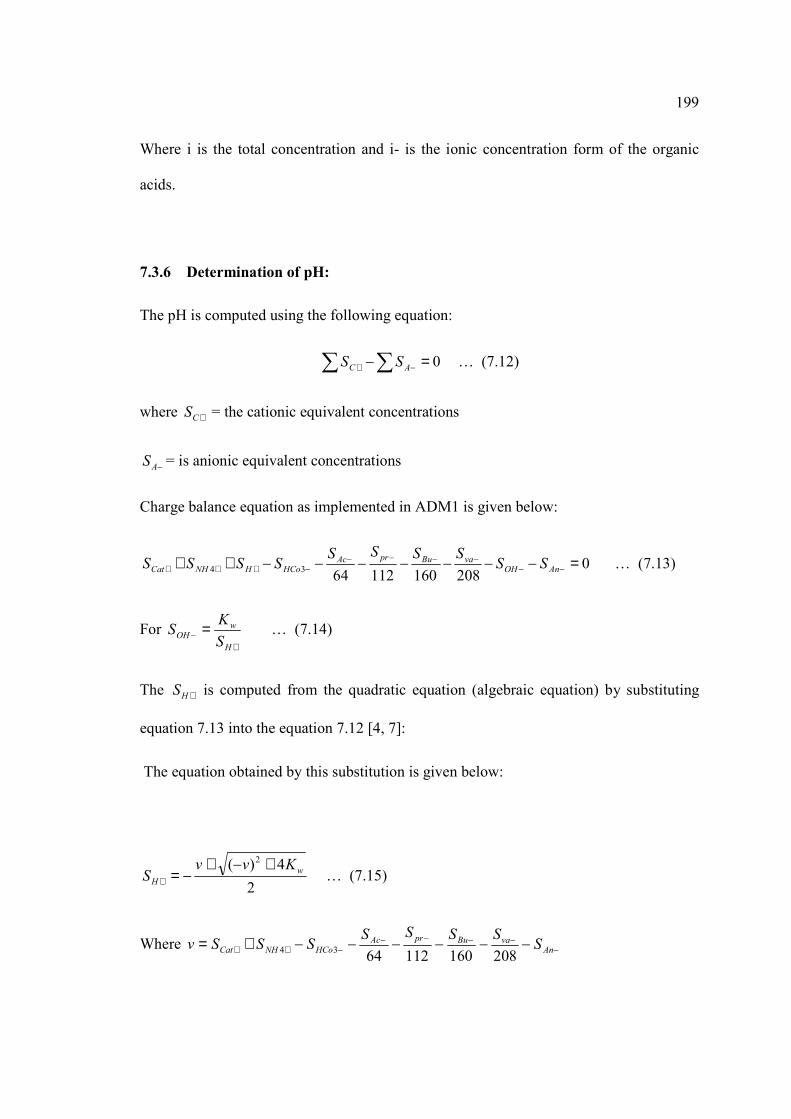
199
Where i is the total concentration and i- is the ionic concentration form of the organic
acids.
7.3.6 Determination of pH:
The pH is computed using the following equation:
∑ ∑ =− −+ 0AC SS … (7.12)
where +CS = the cationic equivalent concentrations
−AS = is anionic equivalent concentrations
Charge balance equation as implemented in ADM1 is given below:
02081601126434 =−−−−−−−++ −−
−−−−−+++ AnOH
vaBuprAcHCoHNHCat SSSSSSSSSS … (7.13)
For +
− =H
wOH S
KS … (7.14)
The +HS is computed from the quadratic equation (algebraic equation) by substituting
equation 7.13 into the equation 7.12 [4, 7]:
The equation obtained by this substitution is given below:
24)( 2
wH
KvvS
+−+−=+ … (7.15)
Where −−−−−
−++ −−−−−−+= AnvaBuprAc
HCoNHCat SSSSSSSSv2081601126434

200
Kw = ionic product of water corrected for particular operational temperature.
This equation gives only one physical solution and the pH value is obtained from the
following:
( )+−= HSpH log … (7.16)
7.3.7 Inhibition:
The following inhibition forms are assumed in the implementation:
1- Free ammonia and hydrogen inhibition: Inhibition due to the free ammonia is
applied for the group of aceticlastic methanogens. Inhibition due to the high
hydrogen level is applied to long chain fatty acids, C4 (butyrate, valerate) and
propionate degrading bacteria, the inhibition is expressed as a non-competitive
function:
I
I
KSI
+=
1
1 … (7.17)
where I = free ammonia and hydrogen inhibition, SI = inhibitor concentration, KI =
inhibitor parameter (KI, H2, pro, KI, H2, c4, KI, H2, ac, KI, NH3)
2- pH inhibition: this inhibition is applied to all degrading bacteria with specific
limits for aceticlastic methanogens and hydrogen-utilizing methanogens. No
inhibition is assumed above a pH of 7 (i.e., In= 1).
−
−⋅−=
2
3expLLUL
UL
pHpHpHpH
I … (7.18)

201
where the PHUL and PHLL are the upper and lower limits
3- Nitrogen limitation: this is included as a growth limitation due to the lack of
nitrogen, using the following term:
I
I
KSI
+=
1
1 … (7.19)
7.4 Software Development:
Batstone et al. [1], Johnson at el. [8] and Jeppsson at al. [9] have implemented and
successfully applied the ADM1 model using AQUASIM, MATLAB/Simulink, MS
EXCEL and FORTRAN, but their implementations were by no mean close to the
commercializing level or even user-friendly with enough documentation, which made the
use of the ADM1 rather complex. The objective of this work was to develop a user-
friendly software for ADM1.
Based on the work implemented by Batstone et al. [1] and Jeppsson at al. [9], the
MATLAB 2008 (The MathWorks, Inc. Natick, US) ODE23S ordinary dynamic equation
solver was used to solve the dynamic differential and algebraic system of equations, MS
Visual Basic 6.0 was used to develop the user-interface, while MS Access was use to host
the stoichiometric coefficients, equilibrium coefficients and constants, and reaction
kinetic coefficients.
Figure 7.1 displays the ADM1 software developed in this work (ADM1-UWO) and
shows the required field for input parameters.

202
The ADM1-UWO allows users to choose between two methods to load the required
information:
1- Concentration method: in the method the users have to input all the required
parameters illustrated in Figure 7.1.
2- Fraction method: users can set the percent of COD fractions based on their
experience and knowledge, this can be done by entering the percentages for each
of the component on the interface illustrated in Figure 7.2. In this method the user
is required to enter TCOD, SCOD, TSS and VSS only and then click on the “%”
button to activate the preset COD fractionation.
Figure 7. 1 ADM1 Software interface

203
Figure 7. 2 Percentage composition interface
The software also allow users to change and modify the reaction kinetic coefficients,
stoichiometric coefficients and initial (time = 0) state variables values. Figures 7.3 to 7.5
display the forms whereby the coefficients can be modified.
Figure 7. 3 Stoichiometiec parameters interface

204
Figure 7. 4 Kinetic coefficients interface
Figure 7. 5 Initial (time = 0) state variables values

205
7.5 Software Verification:
The ADM1-UWO was programmed in MATLAB 2008 and linked to a MS Visual Basic
interface to provide user-friendly interface. The MATLAB code was tested and compared
to the example provided by Batstone et al. [1] as well as the case study done by Jeppsson
at al. [9]. Table 7.11 displays the comparison between the ADM1-UWO software and the
output of the two aforementioned examples [1, 9].
The paired t-test method was conducted to compare the ADM1-UWO results to both
Batstone et al. [1] and Jeppsson at al. [9] ADM1 results. The null hypothesis i.e. there are
no differences between the ADM1-UWO results and the results obtained from both of the
studies mentioned above, have been accepted based on the calculated t-value (0.11 and
0.43) and P-value of 0.91 and 0.67 at the 95% confidence level, respectively. Thus, it can
be concluded that ADM1-UWO compares, well to the output presented by Batstone et al.
[1] and Jeppsson at al. [9].

206
Table 7. 11 Comparison between the output results of the ADM1-UWO, Batstone et al.
[1] and Jeppsson et al. [9].
Output KgCOD/m3
State Parameter Input KgCOD/m3
UWO Jeppsson at al. [9]
Batstone et al. [1]
Flow rate 1.5 1.5 1.5 1.5 temperature 35 35 35 35 V_gas 5 5 5 5 V_liq 28 28 28 28 Ssu = monosacharides 2.8 0.013 0.013 0.013 Saa = amino acids 4.2 0.006 0.006 0.006 Sfa = long chain fatty acids (LCFA) 6.3 0.110 0.110 0.110 Sva = total valerate 0 0.011 0.117 0.012 Sbu = total butyrate 0 0.015 0.015 0.015 Spro = total propionate 0 0.018 0.018 0.018 Sac = total acetate 0 0.045 0.051 0.049 Sh2 = hydrogen gas 0 0.000 0.000 0.000 Sch4 = methane gas 0 0.052 0.055 0.054 Sic = inorganic carbon 0.005 0.050 0.075 0.075 Sin = inorganic nitrogen 0.003571 0.037 0.033 0.032 Si = soluble inerts 0.7 1.618 1.671 1.671 Xc = composites 10 1.041 1.040 1.040 Xch = carbohydrates 0 0.010 0.010 0.010 Xpr = proteins 0 0.010 0.010 0.010 Xli = lipids 0 0.016 0.016 0.016 Xsu = sugar degraders 0 0.355 0.354 0.354 Xaa = amino acid degraders 0 0.367 0.357 0.357 Xfa = LCFA degraders 0 0.389 0.391 0.391 Xc4 = valerate and butyrate degraders 0 0.149 0.144 0.145 Xpro = propionate degraders 0 0.062 0.061 0.061 Xac = acetate degraders 0 0.475 0.470 0.470 Xh2 = hydrogen degraders 0 0.225 0.224 0.224 Xi = particulate inerts 18 20.171 19.941 19.941 scat+ = cations (metallic ions, strong base) 0.04 0.040 0.040 0.040 san- = anions (metallic ions, strong acid) 0.003571 0.035 0.004 0.004 Sgas,h2 = hydrogen concentration 0.000 0.000 0.000 Sgas,ch4 = methane concentration 1.580 1.708 1.670 Sgas,co2 = carbon dioxide concentration 0.013 0.011 0.011

207
7.6 References
[1] Batstone, D. J.; Keller, J.; Angelidaki, I.; Kalyuzhnyi, S. V.; Pavlostathis, S. G.;
Rozzi, A.; Sanders, W. T. M.; Siegrist, H.; Vavilin, V. A. Anaerobic Digestion
Model No. 1, IWA Task Group for Mathematical Modelling of Anaerobic
Digestion Processes, Water Sci. Technol. 2002, 40, 65–73.
[2] Masse, D.; Droste, R. I. Microbial interaction during the anaerobic treatment of swine
manure slurry in a sequencing batch reactor. Canadian Journal of Agricultural
Engineering, 1997, 39, 35-41
[3] Siegrist, H.; Gujer, W. Mathematical modeling of anaerobic mesophilic sewage
sludge treatmen. Water Sci. Technol 1993, 27, 25-36.
[4] Rosen, C.; Jeppson, U. Anaerobic COST benchmark model description (report), San
Sebastian, Spain. 2002
[5] Copp, J. B.; Alex, J.; Beteau, J-F. ; Dudley, J.; Dupont, R.; Gillot, S.; Jeppsson, U.;
Lelann, J-M,; Pons, M-N.; Vanrolleghem, P. A. the COST simulation benchmark, office
of official publication of the European communities, Luxemburg. 2002
[6] Chynoweth, D.; Pullammanappallil, P. Anaerobic digestion of municipal solid waste
in microbiology of solid waste. CRC Press, Boca Raton, FL. 1996, 71-113.
[7] Stumm, W.; Morgan, J. J. Anaerobic chemistry: chemical equilibria and rates in
natural water (3ed edition), John Wiley and Sons New York, N.Y. 1996
[8] Johnson B.A.R.; Shang Y., Applications and limitations of ADM 1 in municipal
wastewater solids treatment, Water Sci. Technol. 2006, 54, 77–82.

208
[9] Jeppsson, Ulf. Investigation of anaerobic digestion alternatives for Henriksdal’s
WWTP” IEA, Lund University. 2007.

209
CHAPTER EIGHT
Conclusions and Recommendations
8.1 Conclusions
The following findings summarize the major outcomes of this research.
8.1.1 Impact of particulate size on hydrolysis:
o Although casein degradation efficiency was 97±1% for all protein sizes within 80
h of digestion, the biodegradation rate increased significantly with decreasing
particle size.
o The ultimate methane production of 8259±139 mL was approximately the same
for all protein sizes. However the maximum methane production rate increased
from 5 to 15 ml/g-h, while the lag phase decreased from 21 to 11 h with the
decrease in particle size from ≥500 µm to ≤50 µm.
o The hydrolysis rate coefficient increased by 776% from 0.034 to 0.298 d-1 with
the decrease in particle size from ≥500 µm to ≤50 µm corresponding to an
increase in specific surface area from 0.01 to 0.19 m2/g (1800% increase).
o The hydrolysis rate coefficient of protein was experimentally related to median
surface diameter and specific surface area.
o The newly developed hydrolysis models, correlating the first-order hydrolysis rate
coefficient to both median surface diameter and specific surface area were
superior to the constant first-order rate model in fitting the experimental data.

210
8.1.2 The effect of sonication on biosolids particle size and anaerobic digestion:
o After 60 minutes of sonication corresponding to specific energy of ~25 kJ/g TSS
for primary and ~33 kJ/g TSS for WAS, SCOD/TCOD ratio increased from 5.5%
to 18% and 3.3% to 27%, SBOD/TCOD ratio increased from 1.1% to 2.5% and
0.5% to 4.4%, VFA/TCOD ratio increased from 2.6% to 4.4% and from 8.1% to
13.3%, bound protein/TCOD decreased from 1.4% to 1.1% and 1.6% to 0.8%;
total protein/TCOD decreased from 6.6% to 2.2% and 6.7% to 4%; and soluble
protein/TCOD increased from 0.6% to 3.3% and 0.6% to 4.3%, while total
methane production increased by 28% and 25% after 5 minutes of sonication for
primary and WAS, respectively.
o The effect of sonication on digested bound protein was not statistically significant
for both primary and WAS samples at the 95% confidence level.
o Although, there is an increase in sludge surface area with sonication, no
significant effect on specific surface area was found after 5 minutes of (3.2 KJ/g
TSS) sonication in the case of WAS but for the primary sludge specific surface
area increased by 8 times after 40 minutes of sonication (~17 kJ/gTSS).
o The Anaerobic Digestion Model #1 (ADM1) predicted well both the methane
production and volatile fatty acids concentrations. The simulated rate constants
for acetic acid and butyric acid uptake decreased by 30%-34% with sonication.
o Ultrasound is generally neither economical for biogas enhancement despite the
high solubilization of COD, nor effective in enhancing the biodegradability of

211
bound proteins. However, at low sonication energy of 0.1, 0.5, and 1 kJ/g TSS,
the process is economical for primary sludge only.
8.1.3 Impact of sonication on high solids sludge (hog manure):
o The CODsolubilisation correlated very well with the DD, the TKNsolubilisation and the %
decrease in particulate protein. Thus, CODsolubilisation can be used to evaluate the
degree of solubilisation in lieu of the labor and time intensive DD procedure, as it
proved to be an accurate and easy to measure method.
o For hog manure, the disintegration of particles by ultrasonication was more
pronounced for the smaller sizes, i.e., in the 0.6 to 60 µm range, as well as the
reduction of VS by ultrasonication increased with increasing specific energy input
in the 500-5000 kJ/kgTS and reached a plateau at 10000 kJ/kgTS.
o At a solids content of 2%, the specific energy input increased from 10000 to about
30000 kJ/kgTS for an additional 15% increase in degree of disintegration,
whereas at TS of about 9%, the specific energy input increased from 250 to about
3,300 kJ/kgTS to achieve the same increase in DD. Therefore, ultrasonication is
more effective pretreatment process for hog manure with higher TS content than
WAS and primary sludges.
o Bound proteins decreased by 13.5% at specific energy of 5000 kJ/kgTS. Thus, the
impact of ultrasonication on odor precursors such as bound proteins appears to be
significant.
o The cell wall appeared to be ruptured at a minimum specific energy input of 500
kJ/kgTS, whereas the optimum specific energy was 10000 kJ/kgTS, affecting a
17.7% reduction in cell protein.

212
o The optimum specific energy input for methane production was 500 kJ/kgTS, and
resulted in a 28% increase in methane production, and subsequently about $
4.1/ton of dry solids excess energy output.
8.1.4 Degradation of odor precursors in primary and WAS during anaerobic
digestion:
o In general, anaerobic digestion efficiency for all sludge primary parameters such
as TSS, VSS, TCOD, SCOD and TBOD5 for primary sludge was higher than
waste activated sludge.
o The concentration of VFA in the raw PS of 1855±58 mg/L was considerably
higher than the raw WAS of 506±17 mg/L, with average removal efficiencies
during anaerobic digestion of 97±1%, and 92±5%, respectively. The average
concentrations of lipids in the raw PS and WAS were 1486±423 mg/L and
367±144 mg/L, respectively, and the removal of lipid varied during anaerobic
digestion varied.
o Average reductions of various protein fractions were 40±2.5% and 31±3% for
particulate protein, 67±3.4% and 61±3.2% for soluble protein, and 61±4.8 % and
59±3 % for bound or labile protein for PS and WAS, respectively. Reduction of
bound protein or the labile protein, which is implicated in odor production in
sludge, was positively correlated with VSS reduction for both sludges. No
statistically significant difference was observed between the bound protein
reductions in both PS and WAS. A 17% and 37% reduction in bound protein per

213
unit VSS, indicates a possible reduction in odor generation potential not only
associated with stabilization of VSS, but also due to bound protein degradation.
o The steady-state Anaerobic Digestion Model #1 (ADM1) was used to simulate the
steady state lab scale anaerobic digester. The model predicted well both the
methane production and odor precursors. The model results with optimized
parameters showed good agreement with the experimental data for methane
production with average percentage errors of 3% and 5% for primary and WAS,
respectively. Good agreement was also observed for the odor precursors, namely,
protein, VFAs, lipids and amino acids as reflected by percentage errors of 6%,
4%, 1%, and 5% in the case of PS and 3%, 11%, 6%, and 0.1% in the case of
WAS, respectively.
8.2 Recommandations for Future Research:
Based on the work conducted and literature reviewed, the following are the list of
recommendations for future work
o The information available for anaerobic microorganisms degrading complex
substrates such as sewage sludge as well as the anaerobic degraders contains large
gaps regarding reliable kinetic and stoichiometric parameters required for
accurate modeling.
o More research efforts are needed to achieve an accurate characterization of the
substrate, at least in terms of the main components (carbohydrates, proteins, and
lipids) and not only in terms of “gross parameters” such as COD and VSS.

214
o At the same time, a more accurate monitoring and control of full-scale plants
could provide valuable information of use in updating model parameters. This
would help increase process knowledge and, at the same time, ensure greater
process efficiency and stability.
o The ADM1 model needs to capture phosphorus for all the relevant fractions, and
needs to include the handling of inorganic reactions such as struvite precipitation
and metal phosphate/metal hydroxide precipitation. Activity effects on chemical
equilibria are significant when considering phosphorus. Also of importance in
wastewater treatment is the fate of sulfur compounds. This includes the generation
of H2S in the digester gas and the fate of the sulfur species in the digested sludge
(as a predictor of odour-generating potential).
o Based upon the ADM1 model applications, it was apparent that for accurate model
simulations the influent sludge must be well characterized in terms of
biodegradable and recalcitrant COD.

215
Appendix A: Anaerobic Digestion Model No.1
9.1 Biochemical process rates
22,19
,18
,17
44,16
,15
,14
,13
12222,
22,12
11,
,11
10,
,10
944,
4,9
844,
4,8
7,
,7
6,
,6
5,
,5
,4
,3
,2
1
hXhdec
acXacdec
proXprodec
cXcdec
faXfadec
aaXaadec
suXsudec
hhhS
hhm
acacacS
acacm
proproproS
proprm
buva
bac
bacS
bacm
vabu
vac
vacS
vacm
fafafaS
fafam
aaaaaaS
aaaam
sususuS
susum
lilihyd
prprhyd
chchhyd
cdis
XkrXkrXkrXkrXkrXkrXkr
IXSK
Skr
IXSK
Skr
IXSK
Skr
ISS
SX
SKS
kr
ISS
SX
SKS
kr
IXSK
Skr
IXSK
Skr
IXSK
Skr
XkrXkrXkr
Xkr
⋅=⋅=
⋅=⋅=
⋅=⋅=⋅=
⋅⋅+
⋅=
⋅⋅+
⋅=
⋅⋅+
⋅=
⋅+
⋅⋅+
⋅=
⋅+
⋅⋅+
⋅=
⋅⋅+
⋅=
⋅⋅+
⋅=
⋅⋅+
⋅=
⋅=
⋅=
⋅=⋅=

216
9.2 Acid-base rates:
)S) - KS-(K (S kr)S) - KS-(K (S kr
)S) - KS-(K (S kr)S) - KS-(K (S kr
)S) - KS-(K (S kr)S) - KS-(K (S kr
INa,INHa,INnhA,BINA,
ICa,coHa,cohcoA,BcoA,
aca,acHa,acacA,BacA,
proa,proHa,proproA,BproA,
bua,buHa,bubuA,BbuA,
vaa,vaHa,vavaA,BvaA,
+
+
+
+
+
+
+=+=
+=
+=+=+=
311
222210
7
6
5
4
9.3 Gas transfer rates
)pK(Skr)pK(Skr
)pK(Skr
gas,coH,cocoLaT,
gas,chH,chchLaT,
gas,hH,hhLaT,
22210
4449
2228
16
46
16
⋅−=
⋅−=
⋅−=
9.4 Process inhibition
lim,2,12
3lim,,11
,2lim,,10
4,2lim,,9,8
,2lim,,7
lim,,6,5
INhpH
nhINacpH
prohINaapH
chINaapH
fahINaapH
INaapH
IIIIIIIIIIIIIII
IIIIIII
⋅=
⋅⋅=
⋅⋅=
⋅⋅=
⋅⋅=
⋅=
>
<
−−
−=
>
<
−−
−=
>
<
−−
−=
2,
2,
2
2,2,
2,
2,
,
,
2
,,
,
,
,
,
2
,,
,
,
1
3exp
1
3exp
1
3exp
hUL
hULhLLhUL
hUL
hpH
acUL
acULacLLacUL
acUL
acpH
aaUL
aaULaaLLaaUL
aaUL
aapH
pHpH
pHpHpHpH
pHpHI
pHpH
pHpHpHpH
pHpHI
pHpH
pHpHpHpH
pHpHI

217
3,
33
,2,
2,2
4,2,
24,2
,2,
2,2
,lim,
1
1
1
1
1
1
1
1
1
1
nhI
nhnh
prohI
hproh
chI
hch
fahI
hfah
IN
INSIN
KSI
KSI
KSI
KSI
SKI
+=
+=
+=
+=
+=
)log( +−= HSpH
9.5 Water phase equations
Differential equations 1-4, soluble matter
( ) ( )
( )
( )
( ) ( ) 86,,
74,,
63,
54,2,
1
1
rrfYSSVQ
dtdS
rrfSSVQ
dtdS
rrSSVQ
dtdS
rrfrSSVQ
dtdS
aavaaavainvalip
inva
lifafainfalip
infa
aainaalip
inaa
lifasuinsulip
insu
−⋅⋅−+−=
−⋅+−=
−+−=
−−++−=

218
Differential equations 5-8, soluble matter:
( ) ( ) ( )
( ) ( ) ( ) ( )
( ) ( ) ( ) ( ) ( )
( ) ( )( ) ( ) ( ) ( ) ( )
( ) ( ) 8,111094
8476,25,22,22
111094
8476,5,,
10846,5,,
96,5,,
43.012.01
15.013.0111
57.018.01
31.017.0111
54.0111
11
Tproc
cfaaahaasuhsuhinhlip
inh
proc
cfaaaacaasuacsuacinaclip
inac
caaproaasuprosuproinprolip
inpro
aabuaasubusubuinbulip
inbu
rrrYrY
rYrYrfYrfYSSVQ
dtdS
rrYrY
rYrYrfYrfYSSVQ
dtdS
rrYrfYrfYSSVQ
dtdS
rrfYrfYSSVQ
dtdS
−−⋅⋅−+⋅⋅−
+⋅⋅−+⋅⋅−+⋅⋅−+⋅⋅−+−=
−⋅⋅−+⋅⋅−
+⋅⋅−+⋅⋅−+⋅⋅−+⋅⋅−+−=
−⋅⋅−+⋅⋅−+⋅⋅−+−=
−⋅⋅−+⋅⋅−+−=
Differential equations 9-12, soluble matter:
( ) ( ) ( )
( )
( ) ( )
( )
( )( ) 1,1,
1,,1,1
19
13122111094
84765,
10,
19
1
1024
1,
9,122114,44 11
rfSSVQ
dtdS
rNfNfNfN
rNNrNYrNYrNYrNY
rNYrNYrNYNrNYSSVQ
dtdS
rrvCSSVQ
dtdS
rrYrYSSVQ
dtdS
xcsIinIlip
inI
aaxcprIxcsIxcxxc
iixcbacbachbacacbacprobacc
baccbacfabacaaaabacsuINinINlip
inIN
Tj i
jiiICinIClip
inIC
Thacchinchlip
inch
⋅+−=
⋅−−−
+−+−−−
−−−−++−=
−
−−=
−⋅−+⋅−+−=
∑
∑ ∑
=
=
∃
=

219
( )
( )( )( )( )( )( )( ) ( )( )
( )( )
( )xcbac
bachchh
bacacchacac
bacproacpropro
baccaccbu
baccaccprocva
bacfaacfafa
bacaaacaaacproaaprobuaabuvaaavaaaaa
bacsuacsuacprosuprobusubususu
falifasulifali
aapr
such
xIxcxIlixcliprxcprxcchsIxcsxc
kkk
j ijii
CCsCYCYs
CYCYCsCYCYCs
CYCYCsCYCYCYCs
CYCYCsCYCfCfCfCfYCs
CYCfCfCfYCsCfCfCs
CCsCCs
CfCfCffCfCswhere
rrrrrrrsrsrvC
+−=+−=
+−+−=
+−+−=+−+−=
+−+−+−=
+−+−=
++++−+−=
+++−+−=
+−+−=
+−=+−=
+++++−=
+++++++=
∑∑ ∑==
∃
=
13
24212
411
10
449
4448
7
,,,,6
,,,5
,,4
3
2
,,,,,11
12
11918171615141313
19
1
1024
1
154.01
57.018.01
31.0154.01
7.01
1
1
1
Differential equations 13-16, particulate matter:
( )
( )
( )
( ) 41,,
31,,
21,,
19
1311,
rrfXXVQ
dtdX
rrfXXVQ
dtdX
rrfXXVQ
dtdX
rrXXVQ
dtdX
xcliliinlilip
inli
xcprprinprlip
inpr
xcchchinchlip
inch
icinc
lip
inc
−+−=
−+−=
−+−=
+−−= ∑=
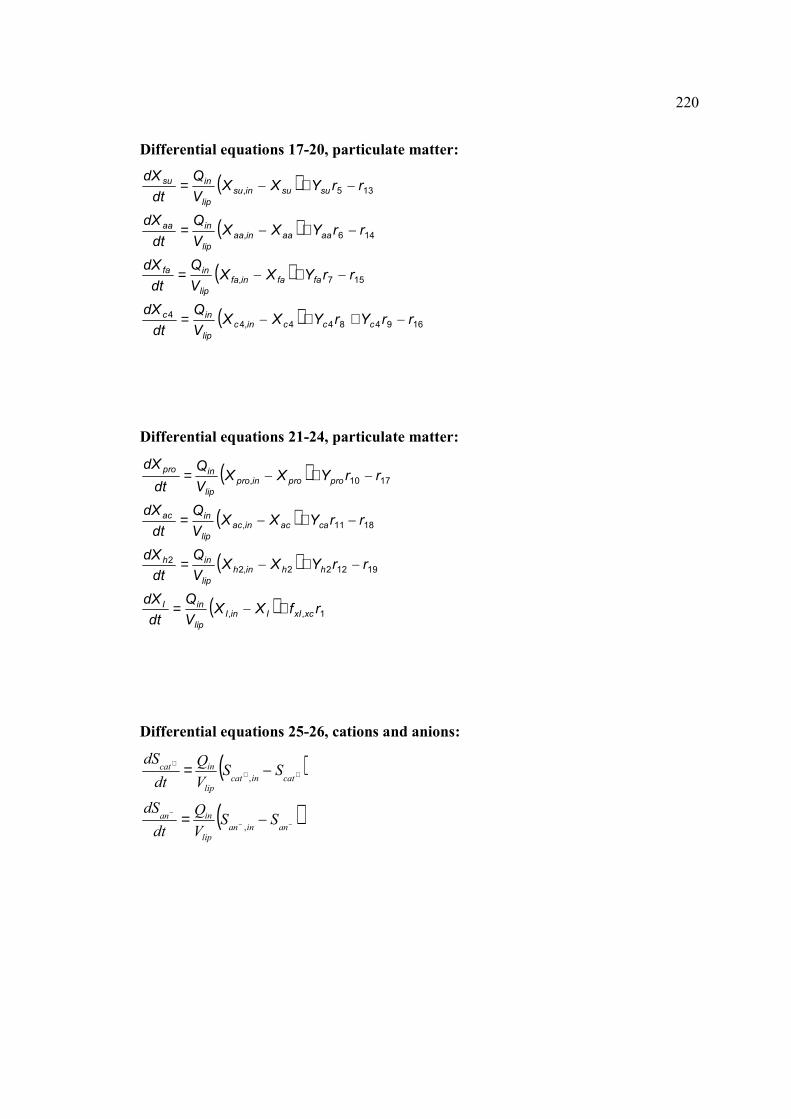
220
Differential equations 17-20, particulate matter:
( )
( )
( )
( ) 1694844,44
157,
146,
135,
rrYrYXXVQ
dtdX
rrYXXVQ
dtdX
rrYXXVQ
dtdX
rrYXXVQ
dtdX
cccinclip
inc
fafainfalip
infa
aaaainaalip
inaa
susuinsulip
insu
−++−=
−+−=
−+−=
−+−=
Differential equations 21-24, particulate matter:
( )
( )
( )
( ) 1,,
191222,22
1811,
1710,
rfXXVQ
dtdX
rrYXXVQ
dtdX
rrYXXVQ
dtdX
rrYXXVQ
dtdX
xcxIIinIlip
inI
hhinhlip
inh
caacinaclip
inac
proproinprolip
inpro
+−=
−+−=
−+−=
−+−=
Differential equations 25-26, cations and anions:
( )
( )−−
−
++
+
−=
−=
aninanlip
inan
catincatlip
incat
SSVQ
dtdS
SSVQ
dtdS
,
,

221
Differential equations 27-32, ion states:
11,3
10,3
7,
6,
5,
4,
Anh
Ahco
Aac
Apro
Abu
Ava
rdt
dS
rdt
dS
rdt
dS
rdt
dS
rdt
dS
rdt
dS
−=
−=
−=
−=
−=
−=
−
−
−
−
−
Algebraic equation:
−
+
−
−−−−
−++
+
−=
−=
−−−−−−+=
++−=
32
34
34
2
20816011264
24
2
hcoICco
nhINnh
anvabuproac
hconhcat
WH
SSSSSS
SSSSS
SSS
KS
θ
θθ
9.6 Gas phase equations
Differential equations:
gas
liqT
gas
gascogascogas
gas
liqT
gas
gaschgaschgas
gas
liqT
gas
gashgashgas
VV
rV
QSdt
dSVV
rV
QSdt
dSVV
rV
QSdt
dS
⋅+−=
⋅+−=
⋅+−=
10,2,2,
9,4,4,
8,2,2,

222
Algebraic equations:
++⋅−
=
=
=
=
10,9,8,
2,
2,2,
4,4,
2,2,
6416
64
16
TTT
liqOHgasatm
opgas
opcogascogas
opchgaschgas
ophgashgas
rrr
VpP
RTQ
RTSp
RTSp
RTSp
9.7 Parameter Description:
Parameter Description Unit Suggested value at
time zero
suS monosacharides (kg COD/m3) 0.012
aaS amino acids (kg COD/m3) 0.0053
faS long chain fatty acids (LCFA) (kg COD/m3) 0.099
vaS total valerate (kg COD/m3) 0.012
buS total butyrate (kg COD/m3) 0.013
proS total propionate (kg COD/m3) 0.016
acS total acetate (kg COD/m3) 0.20
2hS hydrogen gas (kg COD/m3) 2.3e-007
4chS methane gas (kg COD/m3) 0.055
icS inorganic carbon (kmole C/m3) 0.15
inS inorganic nitrogen (kmole N/m3) 0.13
iS soluble inerts (kg COD/m3) 0.33
cX composites (kg COD/m3) 0.31
chX carbohydrates (kg COD/m3) 0.028
prX proteins (kg COD/m3) 0.10
LiX lipids (kg COD/m3) 0.029

223
suX sugar degraders (kg COD/m3) 0.42
aaX amino acid degraders (kg COD/m3) 1.18
faX LCFA degraders (kg COD/m3) 0.24
4cX valerate and butyrate degraders (kg COD/m3) 0.43
proX propionate degraders (kg COD/m3) 0.14
acX acetate degraders (kg COD/m3) 0.76
2hX hydrogen degraders (kg COD/m3) 0.32
iX particulate inerts (kg COD/m3) 25.6
pH pH within AD system
−HS protons (kmole/m3)
−vaS valerate (kg COD/m3) 0.011
−buS butyrate (kg COD/m3) 0.013
−proS propionate (kg COD/m3) 0.016
−acS acetate (kg COD/m3) 0.2
−3hcoS bicarbonate (kmole C/m3) 0.14
2coS carbon dioxide (kmole C/m3)
3nhS ammonia (kmole C/m3) 0.0041
+4nhS ammonium (kmole C/m3)
2,hgasS hydrogen concentration in gas phase (kg COD/m3) 1.02e-005
4,chgasS methane concentration in gas phase (kg COD/m3) 1.63
2,cogasS carbon dioxide concentration in gas phase (kmole C/m3) 0.014
2,hgasp partial pressure of hydrogen gas (bar)
4,chgasp partial pressure of methane gas (bar)
2,cogasp partial pressure of carbon dioxide gas (bar)
totalgasp , total head space pressure (H2+CO2+CH4+H2O) (bar)
gasQ gas flow rate normalised to atmospheric pressure (m3/d) 170

224
Parameter Description Suggested Value
suac
supro
subu
suva
aa
aah
suac
supro
subu
suh
lifa
lxc
xcli
xcpr
xcch
xcxl
xcsl
ffffNffffff
NNfffff
,
,
,
,
,2
,
,
,
,2
,
,
,
,
,
,
,
Soluble inerts from composites
Particulate inters from composites
Carbohydrates from composites
Proteins from composites
Lipids from composites
Nitrogen content of composites and inerts
Fatty acids from lipids
Fatty acids form lipids
Hydrogen from sugars
Butyrate from sugars
Propionate from sugars
Acetate from sugars
Hydrogen in amino acids and proteins
Valerate from amino acids
Butyrate from amino acids
Propionate from amino acids
Acetate from amino acids
0.1
0.25
0.20
0.20
0.25
0.002
0.95
0.19
0.13
0.27
0.41
0.06
0.007
0.23
0.26
0.05
0.40

225
9.8 Stoichiometric Matrix
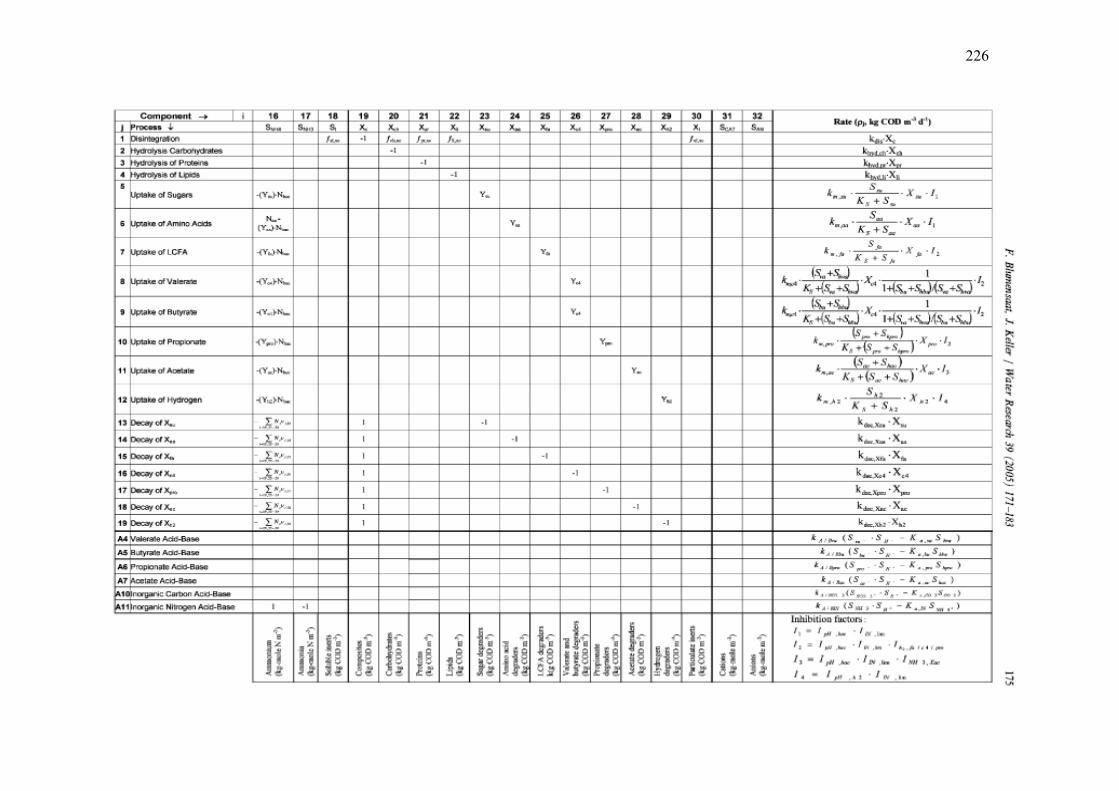
226

226
10.1 CURRICULUM VITAE
EDUCATION
Doctor of Philosophy in Chemical and Biochemical Engineering, (2010) University of Western Ontario, London, Canada Master of Mathematics Degree, (2005) University of Waterloo, Waterloo, Canada
Master of Science Degree in Statistics, University of Baghdad, Baghdad, Iraq. (1995) (Evaluated by University of Toronto and World Education Services US as comparable to a Canadian/US Master of Science Degree specializing in Statistics) Bachelor of Science Degree in Statistics, University of Baghdad, Baghdad, Iraq. (1990) (Evaluated by University of Toronto and World Education Services US as comparable to a Canadian/US four year Bachelor of Science Degree specializing in Statistics)
UNIVERSITY THESES
The Effect of Particle Size on Hydrolysis and the Modeling of Anaerobic Digestion: Submitted to the university council to fulfill the thesis requirement for the degree of Doctor of Philosophy in Chemical and Biochemical Engineering, University of Western Ontario, Canada
Models of Wastewater Disinfection by Ultraviolet Light: Submitted to the university council to fulfill the thesis requirement for the degree of Master of Mathematics, University of Waterloo, Canada Evaluation Study of Order Determination Methods of Autoregressive: Submitted to the university council to fulfill the thesis requirement for the degree of Master of Science in Statistics, University of Baghdad, Iraq
PROFESSIONAL EXPERIENCE
Business Manager, London Health Sciences Center, London, Ontario (2010)
Research Scientist, Trojan Technologies, London, Ontario (2002 – 2006)
Quality Engineer, Trojan Technologies, London, Ontario (2000 – 2002)
Assistant Professor and Researcher, University of Tripoli, Tripoli, Libya (1995 – 1999)
227
Consultant and Lecturer, International Centre for Languages, Tripoli, Libya (1995 –
1999)
Consultant and Adviser, Shams Al-Rabee, Baghdad, Iraq (1990 – 1995)
SOFTWARE
Anaerobic Digestion Model Software (ADM1-UWO) 2010 University of Western Ontario, Canada Disinfection Guarantees 2006 Trojan Technologies, Canada Ultraviolet Sizing Optimization Tool 2006 Trojan Technologies, Canada Lagrangian Dose Model (LDM) 2005 Trojan Technologies, Canada
REFEREED AND SUBMITTED JOURNAL PAPERS
Modeling the Effect of Sonication on Biosolids Anaerobic Digestion 2010 Fuel and Energy, 2010, 24 (9), pp 4703–4711 Impact of Ultrasonication of Hog Manure on Anaerobic Digestibility 2010 Ultrasonics Sonochemistry, 2010, 18, pp 164-171. Simulating the Degradation of Odors Precursors in Primary and Waste Activated Sludge during Anaerobic Digestion 2010 Journal of Hazardous Materials, Submitted Modeling the Influence of Particulate Protein Size on Hydrolysis in Anaerobic Digestion 2010 Bioresource Technology, Submitted Some Statistical Analysis with Application on Chemical Pollution 1998 College of Administration and Economics the Magazine, Iraq Simulation Study to Compare Methods of Determining the Order of Autoregressive Model 1998 College of Administration and Economics the Magazine, Iraq
228
REFEREED CONFERENCE PROCEEDINGS
Pre-treatment of Hog Manure Prior to Anaerobic Digestion 2009 American Institute of Chemical Engineers (AIChE), Annual Meeting 2009 Viability of Ultrasonication for Pre-Treatment of Biosolids 2009 Water Environment Federation Technical Exhibition and Conference (WEFTEC) The Effect of Ultrasonic on Primary and Secondary Sludge Prior to Anaerobic Digestion 2009 8th World Congress of Chemical Engineering Pre-treatment of Primary Sludge Prior to Anaerobic Digestion 2008 American Institute of Chemical Engineers (AIChE), Annual Meeting 2008 Sizing UV Reactors for Poor Quality Wastewater 2006 International Water Association (IWA), Crete, Athens Using UV to Disinfect Low Quality Wastewater 2006 Water Environment Federation Technical Exhibition and Conference (WEFTEC), Texas, USA UV Disinfection of Wastewater – The First Barrier in a Multiple Barrier Strategy for Drinking Water Protection 2005 IWUWQ, Tianjin, China UV Reactor Sizing for Advanced Treatment of Wastewater Effluent 2005 Water Environment Association of Ontario (WEAO), Canada Applying UV Disinfection for Combined Sewer Overflows 2004 The Chartered Institution of Water and Environmental Management, United Kingdom Sizing UV Reactors for Wet Weather Flows 2004 Water Environment Association of Ontario, Canada
ADDITIONAL TRAINING
Management Information System, Ministry of Health, Canada
Crystal Reports, Advanced Level, Polar Bear, Canada
Crystal Reports, Intermediate Level, Polar Bear, Canada
Tools and Techniques for Managing Small Projects, Strategic Project Management
Ltd., Canada

229
Time Management Workshop, University of Waterloo, Canada
High Performance Computing, Cornell University, USA
Microbiology for Wastewater, Water Environment Federation, USA
Writing in Scientific and Engineering Fields Course, WISEonline, Canada
The Geometry of Very Large Data Sets, University of Ottawa, Canada
Consultation Principles, University of Tripoli, Libya
PROFESSIONAL EXPERIENCE
� Condensed, optimized and streamlined models and code fundamental to the sizing and electrical control of Drinking Water systems. The systems using these algorithms are providing drinking water for millions of people
� Analyzed water microbiology lab analysis data, for samples collected from over 500 wastewater plants throughout North America producing an understanding of the water quality parameters, resulting in more efficiently and competitively product sizing
� Simplified very complex electrical controls algorithm through the development of much simpler and more robust modelling, allowing for faster implementation of real-time process control implemented on a smaller PLC (computer)- significant time and capital equipment savings resulted
� Designed and analyzed experiments to determine the fundamental nature of the variables required for input into the control algorithm mentioned above, and for regulatory compliance
� Developed applications that efficiently retrieved historical data and used it to develop performance models
� Applied statistical theory and rules to conduct data analyses including data modelling, time series analysis, regression analysis, simulation, sampling, testing and forecasting
� Derived, identified and calculated probability distribution of certain components to recommend necessary design changes and design calculation simplifications
� Developed, designed, and programmed several Quality Assurance databases such as the non-conformance report database, scrap database, special inspection database, and field part return. Analyzed the accumulated data and generated reports for the executive level to assess performances of products, vendors, and parts
� As a member of the Quality Assurance team, developed the non-conformance report flowchart and set-up corrective action procedures
� Managed and analysed the clinical trials data for one of the biggest hospitals in North Africa, as a member of the University consulting team

230
� Provided statistical consulting; analyzed projects for medical research, insurance companies, banks, factories, import and export companies
� Supervised diploma dissertations that included software preparation for medical analysis laboratories and for a student registration system using FoxPro and Visual Basic
� Taught university level courses such as: Mathematical Statistics, Quality Control, Bio-Statistics, Experimental Design, Survival Analysis, Probability, and Principles of Statistics
� Supervised more than twelve graduate projects for senior students in the Faculty of Science, University of Tripoli. Projects included conducting surveys, collecting and analyzing data, and applying various statistical methods and techniques.

226