


Languages
Pages
Legal


The effect of distressing imagery on attention to andpersuasiveness of an anti-alcohol message: a gaze-tracking
approach
Item type Article
Authors Brown, Stephen L.; Richardson, Miles
Citation The effect of distressing imagery on attention to andpersuasiveness of an anti-alcohol message: a gaze-trackingapproach 2011, 39 (1):8 Health Education & Behavior
DOI 10.1177/1090198111404411
Journal Health Education & Behavior
Rights Archived with thanks to Health Education & Behavior
Downloaded 14-Dec-2017 13:55:20
Item License http://creativecommons.org/licenses/by-nc-nd/4.0/
Link to item http://hdl.handle.net/10545/344320
brought to you by COREView metadata, citation and similar papers at core.ac.uk
provided by UDORA - University of Derby Online Research Archive
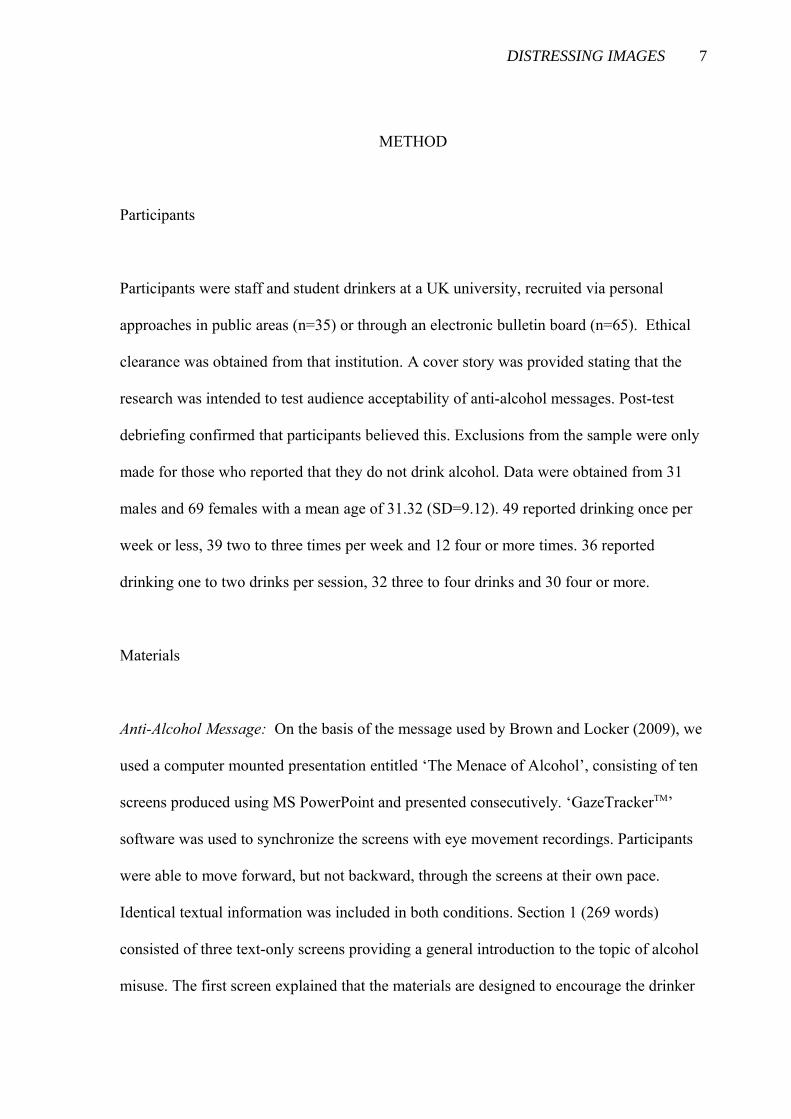
ABSTRACT
Background: Distressing imagery may inhibit health communications by inducing
audiences to avoid attention to persuasive messages. Method: We used an eye-tracking
methodology to compare gaze time allocated to a persuasive textual message, accompanied
by either distressing high resolution colour images or less distressing two-colour images
with degraded outline and detail. Results: Participants in the distressing images condition
showed lower intentions to reduce drinking in the following three months. This effect may
have been mediated by lower gaze time to the textual elements of the message. Participants
spent more time gazing at the distressing images, which was statistically unrelated to text
gaze time or persuasion, which eliminates a distraction explanation. Conclusions: These
findings provide evidence of the deleterious effects of distressing imagery on persuasion.
Implications for health message design are discussed.
Keywords: Persuasion; Defensiveness; Attention; Avoidance; Gaze-Tracking.

DISTRESSING IMAGES
In most national populations, mortality and morbidity patterns are heavily influenced by
population prevalences of risk behaviors, such as smoking, drug and alcohol misuse, unsafe
sexual practices, fat consumption and physical inactivity (Kromhout, Bloemberg, Feskens,
Menotti & Nissinen, 2000). Many national and regional public health authorities use
marketing approaches to encourage populations to reduce risk behaviors. This involves
delivering persuasive communications using print and electronic mass-media, inclusion of
messages on product packaging or community-level interventions (Emery, Szczypka,
Powell & Chaloupka, 2007). A common tactic used in these campaigns is to employ vivid
and disturbing images of the outcomes of unhealthy or unsafe behaviors, including graphic
portrayals of diseased organs, severe injuries or severe pain (Slater, 1999). This approach is
intended to both draw audience attention to messages (Baron, Logan, Lilly, Inman &
Brennan, 1994) and elicit an emotional response that contributes toward decisions to reduce
risk behavior (Hill, Chapman & Donovan, 1998).
However, the full potential of emotive message styles may not be realized because some
audience members use various perceptual and cognitive defenses to avoid negative
emotional responses (Blumberg, 2000; Ruiter, Abraham & Kok, 2001). These defenses can
reduce aversive emotion, but may do so at the cost of inhibiting persuasion (Freeman,
Hennessey & Marzullo, 2001; Gleicher & Petty, 1992; Jemmott, Ditto & Croyle, 1986).
One defense, attentional avoidance, involves the allocation of attention away from
messages that cause distress. Avoidance appears to operate with a high degree of
immediacy, and is triggered by stimuli that are both emotive and self-relevant (Mendolia,
1999). Strategies used to avoid threatening stimuli include narrowing of attention to
eliminate peripheral stimuli (Hansen, Hansen & Shantz, 1992), self-distraction (Boden &
Baumeister, 1997), selective attention toward less threatening stimuli (Bonanno, Davis,
2

DISTRESSING IMAGES
Singer & Schwartz, 1991; Fox, 1993) and stimulus termination (Fox, 1993). Use of
avoidance causes weaker and less elaborate memory representations of threatening stimuli,
which reduces their later accessibility (Hansen, Hansen & Schantz 1992) and
persuasiveness (Keller & Block, 1996).
Attentional avoidance should be a particularly effective defense against overtly emotive
stimuli. Dual processing theories (Loewenstein, Weber, Hsee & Welch, 2001; Slovic, et al,
2003) describe affective information processing routes, characterised by primary
associations between stimuli and the emotional responses that they elicit. Affective
processing requires few processing resources, is difficult to control, resistant to insight, and
is activated by vivid stimulus components (Greening, Dollinger & Pitz, 1996; Slovic, et al,
2003). Emotive imagery is designed to target affective processes, and the immediacy of
avoidance responses can provide a perceptual protection against such stimuli (Blumberg,
2000). There is some evidence for a link between emotive health stimuli and attentional
avoidance. In an event-related potential study, Kessels, Ruiter and Jansma (2010) showed
smokers to have relatively lower P300 amplitudes when viewing distressing smoking-
related images compared to less distressing images. Non-smokers did not show this pattern.
This was interpreted to suggest that smokers, who are more vulnerable to negative
outcomes, were more prepared than non-smokers to disengage attention from distressing
compared to less distressing, images.
Two studies have examined the hypothesis that attentional avoidance mediates a negative
relationship between distressing imagery and persuasion. Keller and Block (1996)
instructed participants to process self-referent health messages in either an imaginative and
visual way or an objective and detached manner. They found that participants in the
3

DISTRESSING IMAGES
imaginative condition showed less persuasion when confronted with a high- than low-threat
message. This was mediated by poorer cognitive elaborations of the message, suggesting
that participants avoided attending to it. Brown and Locker (2009) presented a textual
message with highly distressing anti-alcohol medical imagery. Compared to a control
condition, participants who were both heavier drinkers and who scored higher on a denial
coping scale read the message for less time and were consequently less persuaded that they
were at risk of alcohol-related problems.
These studies do not provide direct evidence of avoidant processes. Keller and Block
(1996) inferred avoidance through participants’ cognitive elaborations of stimulus material,
whilst Brown and Locker (2009) relied upon covert recordings of elapsed time between
opening and closing a printed information pamphlet. Eye tracking methods provide a direct
and objective assessment of attention by mapping the direction of the participant’s gaze. In
this study, we used eye-tracking to examine whether distressing imagery reduces
attentional allocation to a health message, and whether this is related to persuasion.
Current Study
Alcohol misuse causes some of the most damaging health and social problems in the UK
(Academy of Medical Sciences, 2004), and research has shown that audiences can respond
defensively to anti-alcohol messages (Brown & Locker, 2009; Leffingwell, Neumann &
Leedy, 2007). We presented two groups of participants with identical textual anti-alcohol
messages, providing information concerning the risks of hazardous drinking and the
benefits of reducing drinking. These were accompanied by either distressing medical
images, or the same images presented in a less distressing way.
4

DISTRESSING IMAGES
One criticism of previous work is that researchers (e.g., Brown & Locker, 2009; Brown &
Smith, 2007) use differing images to manipulate distress. This potentially enables
participants in each experimental condition to draw differing inferences based on their
content. This may be a particular problem in gaze-tracking studies, because differing
images will have unique physical and semantic characteristics that affect their capacity to
attract gaze, thus confounding any distress effects. A better option is to present the same
images in distressing and less-distressing formats. Vividness and clarity are key
components of the risk perception process (Greening, Dollinger & Pitz, 1996), and stimulus
avoidance appears to be activated by vivid presentations (Hansen, Hansen & Schantz,
1992). Thus, rather than use differing images, we chose to influence distress by
manipulating the vividness and clarity of images.
However, vividness affects the processing of persuasive messages in several other ways
that need to be accounted for. When vivid components are message congruent they can
enhance persuasiveness (Smith & Schaffer, 2000). Conversely, vivid content can elicit
counter-argumentation in audiences that are motivated and able to attend to it (Keller &
Block, 1997). Both effects run counter to our avoidance model because they predict either a
different outcome (greater persuasion) or process (greater attention rather than attentional
avoidance), and cannot be mistaken for avoidance effects. More concerning, a study by
Frey and Eagly (1993) demonstrates that vivid stimuli may inhibit message persuasiveness
because they distract attention from more pallid message components. Thus images could
distract attention from the text. By definition, a distractor must attract and hold attention
itself. On the face of it, this is incompatible with our avoidance view that audiences
disengage from distressing stimuli. Nonetheless, we examined correlations between
5

DISTRESSING IMAGES
attention to images and text. Negative correlations between gaze time at images and text
would suggest a distraction effect, which can be eliminated by statistically controlling
image gaze time.
Hypotheses
We predicted that distressing images would reduce gaze allocated to accompanying
persuasive textual messages, which would, in turn, inhibit persuasion, assessed by
lower perceptions of alcohol related risk (Brown & Locker, 2009), poorer evaluation
of messages (Freeman, Hennessy & Marzullo, 2001) and lower intentions to reduce
drinking. A defensiveness interpretation would be strengthened if avoidant responses
are more prominent in participants who consistently employ defensive coping
strategies (e.g., Brown & Locker, 2009). Using the dispositional mental disengagement
scale of the COPE (Carver, Scheier & Weintraub, 1989), we expected that any
avoidance effect caused by the manipulation would be greater in higher mental
disengagement scorers. Avoidance processes are stronger in participants who are
vulnerable to the threat (Brown & Locker, 2009; Kessels et al., 2010; Liberman &
Chaiken, 1992). This is generally interpreted as evidence of defensiveness. Thus, we
expected any avoidance effect would be facilitated by greater objective vulnerability
to alcohol-related problems, assessed by a version of the Audit developed for young
people (Miles, Strang & Winstock, 2001). The causal model is a moderated mediation
model (Mackinnon, Fairchild and Fritz (2007), whereby lower text gaze is determined
by either a three-way or two two-way interactions between the distressing condition
and higher mental disengagement and Audit scores, and lower text gaze then inhibits
persuasion.
6
DISTRESSING IMAGES
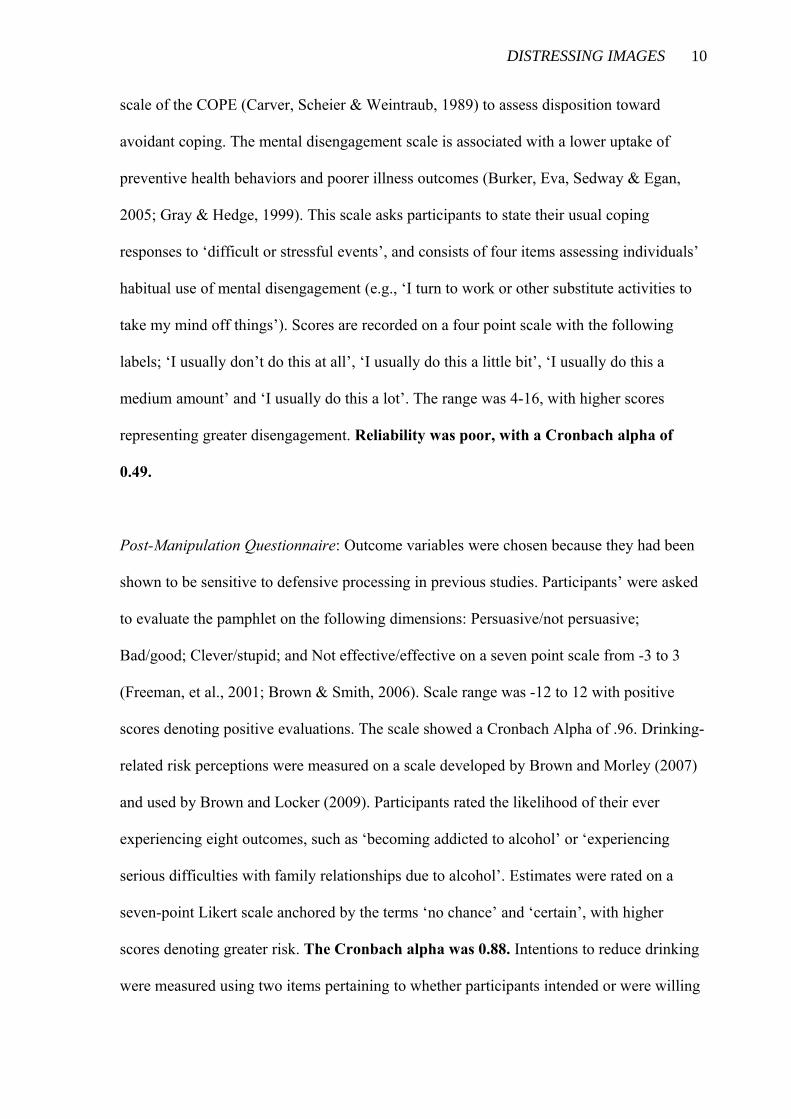
METHOD
Participants
Participants were staff and student drinkers at a UK university, recruited via personal
approaches in public areas (n=35) or through an electronic bulletin board (n=65). Ethical
clearance was obtained from that institution. A cover story was provided stating that the
research was intended to test audience acceptability of anti-alcohol messages. Post-test
debriefing confirmed that participants believed this. Exclusions from the sample were only
made for those who reported that they do not drink alcohol. Data were obtained from 31
males and 69 females with a mean age of 31.32 (SD=9.12). 49 reported drinking once per
week or less, 39 two to three times per week and 12 four or more times. 36 reported
drinking one to two drinks per session, 32 three to four drinks and 30 four or more.
Materials
Anti-Alcohol Message: On the basis of the message used by Brown and Locker (2009), we
used a computer mounted presentation entitled ‘The Menace of Alcohol’, consisting of ten
screens produced using MS PowerPoint and presented consecutively. ‘GazeTrackerTM’
software was used to synchronize the screens with eye movement recordings. Participants
were able to move forward, but not backward, through the screens at their own pace.
Identical textual information was included in both conditions. Section 1 (269 words)
consisted of three text-only screens providing a general introduction to the topic of alcohol
misuse. The first screen explained that the materials are designed to encourage the drinker
7

DISTRESSING IMAGES
to consider reducing drinking and that all statements contained within were supported by
reliable sources. The second and third screens defined alcohol misuse, government drinking
guidelines and provided general information on the consequences of misuse (e.g., ‘alcohol
affects alertness and judgment, therefore increasing the risk of falls and accidents’).
Section 2 (311 words) consisted of four screens providing information on specific health
consequences: Liver disease; Vascular disease; Cancer; Pancreatic disease; Traffic
accidents; Antisocial behavior; and Skin disease. The proportional relationship between
risk and alcohol consumption was emphasized. These were accompanied by images of a
male with a severely swollen liver visible outside the body, a male with a distended
abdomen, a female with severe burns after a drunk driving accident and a close-up image
of a drinker with severe dermatitis. High resolution color images were used to enhance
negative emotion. The distressing nature of the images was reduced by using an ordered
dither color reduction algorithm to create a two-color version with reduced clarity of detail.
An additional twenty students participated in a manipulation check. The color images
were rated as being more distressing, distress mean=3.70 (SD=1.34) non-distress
mean=1.90 (SD=1.10), t=3.29, 18 df, p<.01, and vivid, distress mean=4.10 (SD=1.29) non-
distress mean=2.20 (SD=1.23), t=3.37, 18 df, p<.01. There were no differences for novelty,
distress mean=4.30 (SD=1.34) non-distress mean=3.70 (SD=1.42), t=0.97, 18 df, p=.343,
interest, distress mean=2.60 (SD=0.84) non-distress mean=2.30 (SD=1.34), t=0.60, 18 df,
p=.556, attractiveness, distress mean=1.90 (SD=0.74) non-distress mean=2.10 (SD=0.99),
t=, 18 df, p=.511,or personal relevance, distress mean=3.10 (SD=0.99) non-distress
mean=2.70 (SD=0.68), t=1.05, 18 df, p=.307.
8

DISTRESSING IMAGES
Section 3 (309 words) encouraged drinkers to consider alcohol reduction and
provided resources that could help them to do so. Statements described the increased
risk faced by younger drinkers, and proximal and distal benefits of reducing consumption.
References and contact details for further information on alcohol and health were provided.
These did not contain any imagery.
Eye-Movement Tracking Apparatus: Eye movements were recorded using a Cambridge
Systems Video Eyetracker Toolbox, an IR reflection eye tracker that consists of a headrest
that incorporates the camera, illumination and optics, connected to a dual screen RM
2.8GHz Pentium PC running Microsoft Windows 2000 Professional SP4. Stimulus
presentation and data analysis was undertaken using the software package,
‘GazeTrackerTM’ (Eye Response Technologies, Charlottesville, VA, USA). Participants
viewed stimuli on a 15” monitor placed directly in front and 47cm away from their eye
line.
Pre-Manipulation Questionnaire. We used a five-item version of the Alcohol Use
Disorders Identification Test (AUDIT) to assess vulnerability to future alcohol-related
problems. The AUDIT is a well-used and validated instrument that predicts future
alcohol-related problems (Allen, Litten, Fertig & Babor, 1997; Connigrave, Saunders
& Reznik, 1995). The version we used was developed for younger drinkers and tested
on a British college sample (Miles, Winstock & Strang, 2001). It is based upon the
frequency of drinking days and quantities of alcohol drunk on those days, and the
presence of drinking-related problems. The range of possible scores is 0-20 and the
Cronbach alpha in this study was 0.71. We used the dispositional mental disengagement
9
DISTRESSING IMAGES
scale of the COPE (Carver, Scheier & Weintraub, 1989) to assess disposition toward
avoidant coping. The mental disengagement scale is associated with a lower uptake of
preventive health behaviors and poorer illness outcomes (Burker, Eva, Sedway & Egan,
2005; Gray & Hedge, 1999). This scale asks participants to state their usual coping
responses to ‘difficult or stressful events’, and consists of four items assessing individuals’
habitual use of mental disengagement (e.g., ‘I turn to work or other substitute activities to
take my mind off things’). Scores are recorded on a four point scale with the following
labels; ‘I usually don’t do this at all’, ‘I usually do this a little bit’, ‘I usually do this a
medium amount’ and ‘I usually do this a lot’. The range was 4-16, with higher scores
representing greater disengagement. Reliability was poor, with a Cronbach alpha of
0.49.
Post-Manipulation Questionnaire: Outcome variables were chosen because they had been
shown to be sensitive to defensive processing in previous studies. Participants’ were asked
to evaluate the pamphlet on the following dimensions: Persuasive/not persuasive;
Bad/good; Clever/stupid; and Not effective/effective on a seven point scale from -3 to 3
(Freeman, et al., 2001; Brown & Smith, 2006). Scale range was -12 to 12 with positive
scores denoting positive evaluations. The scale showed a Cronbach Alpha of .96. Drinking-
related risk perceptions were measured on a scale developed by Brown and Morley (2007)
and used by Brown and Locker (2009). Participants rated the likelihood of their ever
experiencing eight outcomes, such as ‘becoming addicted to alcohol’ or ‘experiencing
serious difficulties with family relationships due to alcohol’. Estimates were rated on a
seven-point Likert scale anchored by the terms ‘no chance’ and ‘certain’, with higher
scores denoting greater risk. The Cronbach alpha was 0.88. Intentions to reduce drinking
were measured using two items pertaining to whether participants intended or were willing
10

DISTRESSING IMAGES
to reduce drinking in the next three months (e.g., To what extent are you willing to reduce
dirnking in the next three months?). Responses were made on a seven point Likert scale
anchored by the terms ‘not at all’ and ‘completely’. Correlation between the two items was
0.51.
Procedure
Participants completed the pretest questionnaire, were introduced to the apparatus,
performed a familiarization task, were exposed to the message and completed the
post-test questionnaire. These tasks were performed consecutively, although a five to
ten minute break between the pretest and introduction to the apparatus was taken to
set up the eye-tracking equipment. Paper-based pre-test questionnaires containing
demographic information and the audit and mental disengagement scales. They were
allocated to conditions numbering 50 each by a randomizer program, then seated at the
eye-movement recording equipment, the function of which was explained and a
demonstration made. To familiarise themselves with the task and equipment, participants
were given a practice trial using non-health related illustrated material. This trial was also
used to calibrate the eye-tracker. They were told that they were not expected to attend to
any aspect that they did not wish to. The message was then presented and gaze time
recorded for each section. Participants subsequently completed questionnaires relating to
their perceptions of the message, risk estimates and intentions.
Derivation of eye-tracking data: Data processing was handled by the GazeTrackerTM
software. The raw data were the x,y position of participant gaze on each slides every 20ms.
The GazeTrackerTM software calculated the total gaze time spent examining the text or
image through the use of ‘look zones’ corresponding to text and images. The look zones are
11
DISTRESSING IMAGES
a data analysis feature of the GazeTrackerTM software and were determined by the
experimenter for each slide using the mouse to outline the desired look zone area.
Thirty-five percent of gaze time was unaccounted for, almost entirely because participants
gazed outside the text and image look zones. As attentional avoidance processes cannot be
differentiated from mere inattention, it is difficult to ascribe theoretical meaning to this
time. However, it is important to determine whether unaccounted gaze could confound the
interpretation of study results. We conducted t-tests on unaccounted time for each screen
by experimental condition, finding no bias to either condition. To establish whether
individual differences contributed to unaccounted gaze time, we computed correlations
with Mental Disengagement and Audit scores. None were significant.
RESULTS
Preliminary analyses were conducted to identify the optimal combination of variables
for causal modeling. MacKinnon, Fairchild and Fritz (2007) suggest that a
precondition of mediation is that the independent variable be associated with both the
outcome1 and putative mediator, and that the mediator is associated with the
outcome. Multivariate analyses were used to apply a single significance test. A
MANOVA showed an experimental effect on a linear combination of intentions to
reduce drinking, message evaluation and risk perceptions, F(4,95)=2.70, p<.05, r=0.30.
Table 1 shows means and effect sizes, the largest effect being higher intentions to
reduce drinking in the non-distressing image condition. We used intention to reduce
drinking as the outcome variable in the causal analysis.
1 There is some contention as to whether IV-outcome links need be statistically significant at p=.05 or indeed measured at all (e.g., Shrout & Bolger, 2002). We have decided to conduct the analysis and to present it for completeness.
12
DISTRESSING IMAGES
Another MANOVA was conducted to assess the direct effect of the experimental
manipulation on gaze times at the three sections of text2. A significant multivariate effect
was observed, F(4,95)=4.51, p<.01, r=.28. Table 1 shows that, as would be expected, the
experimental condition had no effect on section 1 text time. Greater gaze time was
allocated to section 2 text (which contained images) in the non-distressing images
condition, but no differences were detected for section 3 (which did not contain images).
To provide a more clear assessment of the effects of experimentally-induced changes in
text gaze time, we also computed a change score by subtracting the section 2 text gaze time
from section 1 gaze time. This reduces error caused by individual differences in overall
gaze time. Table 1 shows greater Section 1-2 text gaze reductions in the distressing images
condition. A final precondition of mediation is that the mediator is associated with the
outcome. Section 2 text gaze and section 1-2 gaze changes were correlated with intention
(respectively r=.26 and r=.21, df=98, p<05).
Table 1 shows that greater gaze time was allocated to the images in the distressing images
condition. This raises the possibility that the experimental effect on text gaze was caused
by the vivid images distracting attention from the text. However, there were no correlations
between image gaze time and section 2 text gaze time, r(98)=-0.10, section 3 text gaze
time, r(98)=-0.06, p=.430, section 1-2 gaze time changes r(98)=-0.08, p=.414, or intention,
r(98)=-0.03, p=.749. This suggests that allocation of attention to images did not occur at
the expense of text as would be predicted by a distraction explanation.
2 The three text sections and section 2 image gaze time scores were positively skewed, and subjected to a square root transformation before all analyses.
13
DISTRESSING IMAGES
Causal Analysis
A structural model was constructed to test the proposition that text gaze and changes
in text gaze mediate the expected effect of the experimental manipulation on
intentions to reduce drinking, and that this path is facilitated by higher vulnerability
and denial scores. Three two-way and one three-way interaction effects were created
by computing the products of condition (coded as 0=non-emotive message, 1=emotive
message) and centred Audit and mental disengagement scores. We used two
structural models, using either section 2 text gaze or section 1-2 gaze changes as
mediators (Figures 1 and 2). Separate facilitation of the mediational path by mental
disengagement or audit scores would be suggested by prediction of gaze or gaze
change by either or both of the two-way interaction terms involving condition.
Prediction by the three-way interaction suggests facilitation or moderation of
experimental effects by a combination of mental disengagement and Audit. Simple
slopes analysis (Aiken & West, 1991) was used to interpret any interactions.
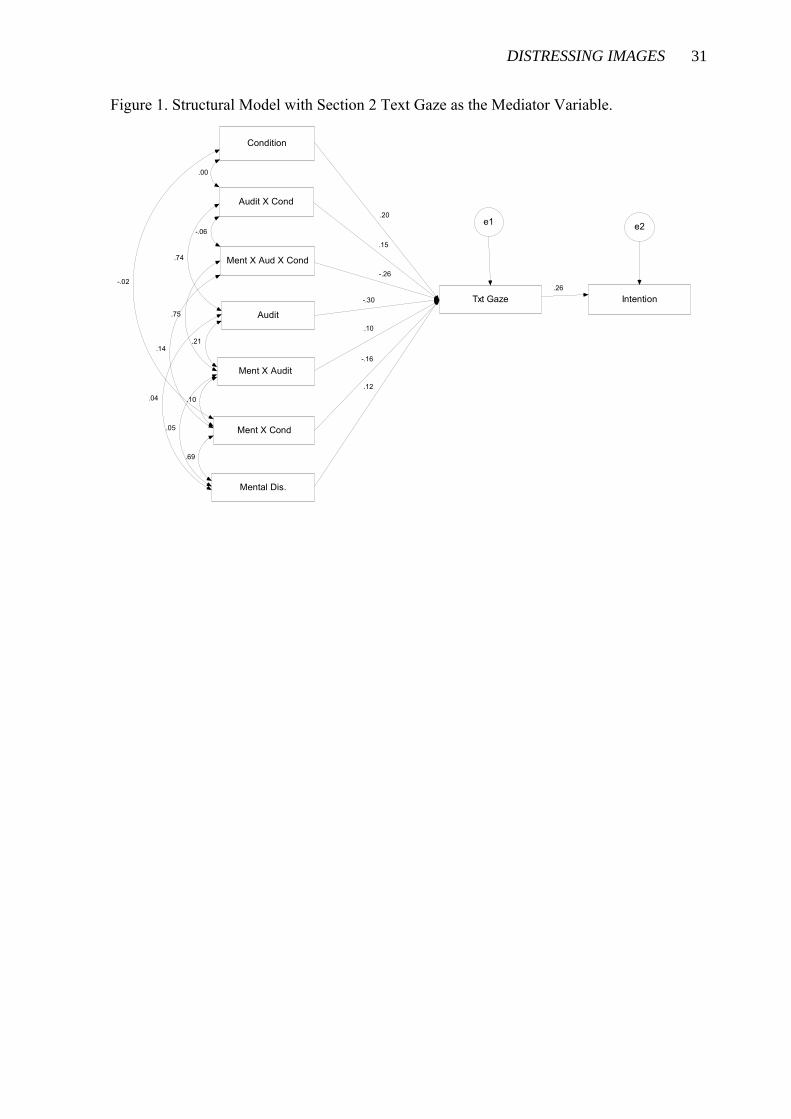
When the duration of section 2 text gaze was used as a mediator, a maximum
likelihood model showed good fit to the data, χ2=18.84, 17 df, p<.01, RMSEA=.030
(90% CL=.000,.100), CFI=.992. Parameter estimations are presented in Figure 1,
showing that text gaze was greater in the non-distressing images condition, p<.01, and
that text gaze was positively related to intentions to reduce drinking, p<.05. This is
consistent with an indirect path between the presentation of distressing images and
lower intentions, mediated by greater text gaze. Neither mental disengagement nor
Audit scores influenced the above path. Text gaze was not predicted by the three way
14
DISTRESSING IMAGES
interaction, p =.080, or any of the two-way interactions involving condition, mental
disengagement p=.199, Audit, p =.408.
The model specifying section 1-2 text gaze change as a mediator (Figure 2) also
showed good fit to the data, χ2=18.10, 17 df, p<.01, RMSEA=.025 (90% CL=.000,.960),
CFI=.996, and suggests that an indirect relationship between exposure to distressing
images and lower intention was mediated by lower section 1-2 text gaze changes. Gaze
was also predicted by the three-way interaction modeled by condition, mental
disengagement and Audit, suggesting that the above path was influenced by a
combination of both variables.
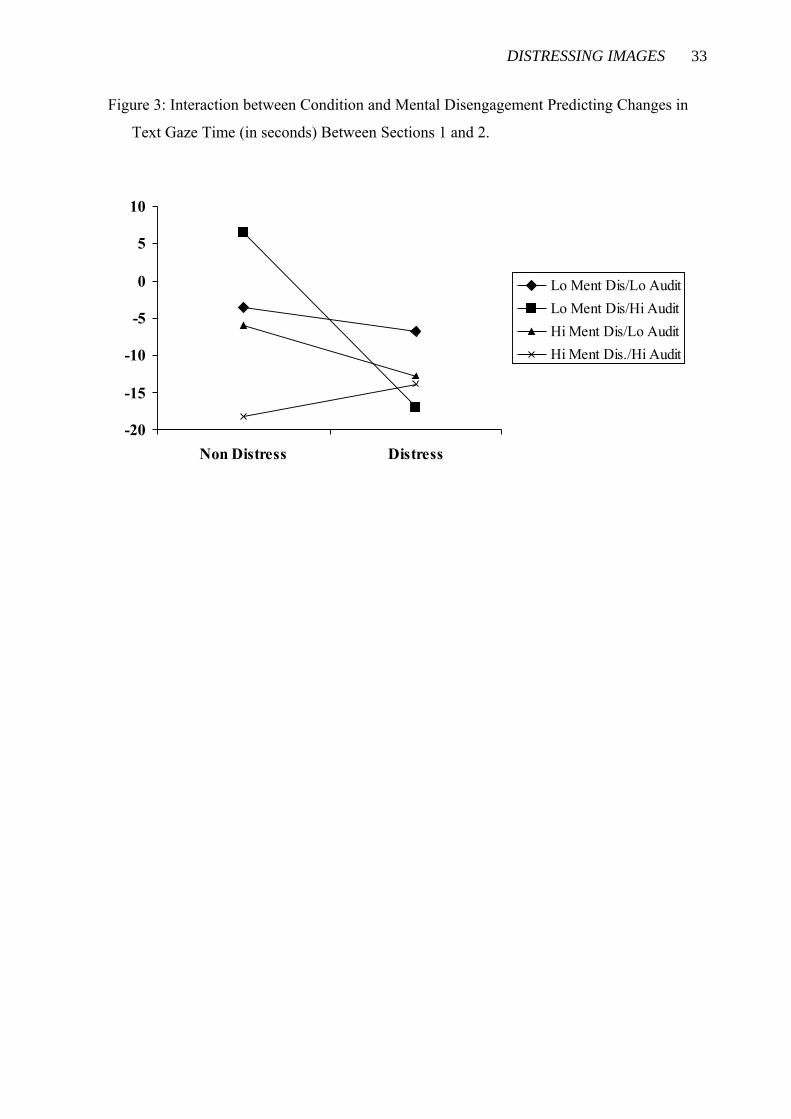
We used simple slopes analyses (Aiken & West, 1991) to probe the three-way
interaction. Four slopes were calculated, representing the regression of condition onto
section 1-2 gaze change at one standard deviation above and below the mean for
mental disengagement (±2.50) and Audit (±2.41). The slopes are presented in Figure 3,
showing that the experimental manipulation had its greatest effect on gaze times in
lower mental disengagement and higher Audit scorers. These participants showed the
least deterioration in text gaze times between sections 1-2 (with some showing a slight
increase) in the non-distressing images condition, but were among those who showed
some of the greatest decreases in the distressing images condition.
Predictors of Section 2-3 Changes in Text Gaze
The experimental effect on text gaze did not extend to section 3 text. It is relevant to
determine whether this is caused by those participants returning their attention to
15

DISTRESSING IMAGES
section 3 after reducing attention between sections 1-2 text. To test this hypothesis, we
computed a section 2-3 text gaze increase variable by subtracting section 2 text gaze
time from section 3. This was regressed onto section 1 text gaze, section 1-2 text
increase, condition, mental disengagement, audit and the two and three-way
interaction variables. The regression was significant, R2=0.66, df=9,99, p<.01.
Significant multivariate predictors were section 1 gaze, β=-0.27, p=.01, section 1-2
increase, β=-0.80, p=.01 and Audit, β=0.23, p=.05. This suggests that the effects of the
distressing imagery were only temporary, with those affected by the manipulation
returning their attention to the remainder of the message.
DISCUSSION
We examined the effect of distressing imagery on gaze allocation to text in an anti-alcohol
health message, and the resultant effect of gaze on persuasion. Consistent with predictions,
the message containing distressing images was associated with lower intentions to reduce
drinking within three months, mediated by less gaze times at the text accompanying those
images. The experimental effect on test gaze times persisted only for as long as the images
were present. Participants also allocated greater gaze times to the distressing images, but the
lack of correlation between image gaze time and text gaze time suggests that this did not
distract them from the text. The effect of the experimental manipulation on text gaze time
was greater amongst participants scoring both higher on an objective measure of
vulnerability to alcohol-related health problems and lower on a measure of mental
disengagement coping style.
These findings are consistent with those of previous studies finding that distressing imagery
16

DISTRESSING IMAGES
reduced participants’ attention to messages. Rather than using indirect measures of
attentional allocation, such message elaboration (Keller & Block, 1996) or lower reading
times (Brown & Locker, 2009), we employed a direct and objective measure of attention.
Thus, we can provide support to the idea that distressing imagery can inhibit attention to the
text that reduces the persuasiveness of health messages.
One alternative explanation to this finding may be that the non-distressing images were
not sufficiently interesting to hold attention, and participants gazed at text by default.
We are unconvinced by this for two reasons. First, this view assumes a fixed viewing
time, whereas participants were able to move between screens when they wished.
Second, similar to the distraction explanation dealt with earlier, this interpretation
would suggest a negative correlation between image and section 3 text gaze times. This
was not observed.
To test a defensiveness interpretation, we predicted that the experimental effect would
be greater in participants who commonly use a defensive coping strategy (mental
disengagement) and those with greater vulnerability to alcohol-related problems.
However, the interaction differed from our prediction. Rather than high mental
disengagement and high vulnerability facilitating higher section 1-2 gaze reductions, a
combination of low disengagement and high vulnerability was associated with the least
reduction. One interpretation is that images (or the combination of images and text)
induced attentional disengagement in all participants except those with both an interest
in the message (vulnerable participants) and those who are resistant to disengagement.
Thus, it could be argued that the effect of the distressing images in reducing text gaze
17

DISTRESSING IMAGES
time broadly supports a defensive interpretation.
However, this interpretation has several problems. First, the mental disengagement
findings must be viewed as somewhat untrustworthy due to the poor reliability of the
measure. Second, it is not clear why high disengagement/high vulnerability scorers
were not also affected by the experimental manipulation. One possible explanation for
this is that defensive responses are inherently self-limiting and do not increase beyond a
certain point. Several researchers have noted that people limit defensive responses
because their value declines as the defensive intention becomes more obvious to
themselves and others (Baumeister & Cairns, 1992; Lundgren & Prislin, 1998). Thus,
we suggest that the moderation analysis provides some support for a defensiveness
interpretation, but this evidence is weaker than what would have been provided had
the original hypothesis been fully supported and the mental disengagement measure
been more reliable.
We also found that greater gaze time was allocated to distressing than non-distressing
images. It is not clear whether this is a function of any emotive response that they
invoked, or whether participants simply preferred them to the more pallid control
images. This creates a paradox, whereby we infer that distressing images stimulate an
attentional avoidance response but they attract greater attention. Lang (2000) suggests that
emotive stimuli have survival value, which attracts attention and increases the resources that
people allocate to encoding and storing stimulus components. It may be the case that we
observed a natural tendency to fixate on distressing stimuli. This is of interest to researchers,
18

DISTRESSING IMAGES
but needs to be reconciled with studies showing attentional disengagement from distressing
stimuli (e.g., Kessels, Ruiter & Jansma, 2010). It should be noted that this is epiphenomenal
to the text avoidance effect observed in this study.
Limitations
We used a convenience sample of participants from a university population, with the
majority being self-selected. This has obvious problems in generalizing to the wider
population, and findings may be particularly distorted by self-selection in participants
with an interest in alcohol or health issues. One possible distortion caused by the self-
selection process is that our sample may consist of participants who are ready to
consider change. Another barrier to generalization, and one that affects the majority of
research on defensive responses to health messages, is that the implicit social demands
and physical environment of the laboratory and the single presentation of a message
with forewarning of persuasive intent does not provide a strong representation of the
world in which people experience health messages. Work is needed to test the
generalizability of findings.
The 35% of unaccounted time (where the apparatus cannot track gaze or gaze is
outside image and text zones) is concerning. Most will represent time spent outside the
look zones, which may suggest a lack of involvement with the experiment. Possible lack
of involvement can be confused with avoidance, meaning that avoidance cannot be
measured in an absolute sense. However, uninvolvement cannot be confused with
experimentally-induced avoidance, as it is not correlated with condition, mental
disengagement or vulnerability. Thus, possible low involvement does not confound our
19

DISTRESSING IMAGES
findings.
Using eye-tracking methodology, we were able to objectively measure gaze. However,
gaze cannot entirely be taken as direct measure of information processing. EEG (e.g.,
Kessels, et al., 2010) or neuroimaging indicators of attention would be useful. In
particular, we cannot discriminate reading from mere gaze at the text. We also did not
examine other known correlates of attentional avoidance, such as physiological and
behavioral indicators of anxiety (Derakshan, Eysenck & Myers, 2007). These could be
incorporated into future research programs. Also, much remains to be understood
about the nature of the avoidance response itself. In particular, we cannot provide
insight into the extent to which this is an automated or deliberative response (Mendolia,
1999).
Implications for Practice
These findings have implications for the use of imagery in persuasion campaigns, but
these need to be considered within the constraints of the methods used. We used a long
and detailed message, finding that distressing imagery has a short-term inhibitory effect
on attention to the text and persuasion. It is difficult to generalize this to shorter
messages, slogans or the use of imagery alone, although we note that other researchers
have shown that presentations of distressing imagery facilitate attentional
disengagement (Kessels et al., 2010).
Advertisers might be advised to be sparing with the use of material that is likely to create
negative emotional responses in those to whom the message is relevant. However, such a
20

DISTRESSING IMAGES
recommendation must heed the view that distressing imagery does not always elicit avoidant
responses (Baron, et al., 1994). Moreover, negative emotion often increases persuasion
(Witte & Allen, 2000), and emotive imagery is an effective means of eliciting this. Thus, it
can be difficult to know in advance what responses a message might engender. Given this
uncertainty, a first step in overcoming resistance processes is to explicitly search for them
when testing advertising campaigns. Most campaigns undergo formative testing in front of
audiences, who give qualitative feedback, and skilled interviewers can uncover message
components that elicit avoidance.
An obvious issue pertains to the identification of factors that determine whether emotive
imagery is or is not effective. Block and Keller (1996) found their effect to be moderated by
self-efficacy. Brown and Locker (2009) found that distressing images reduce risk perception
only amongst those with both high vulnerability and who report more regular use of denial
as a coping strategy. Klein and Harris (2009) showed that a self-affirmation treatment
moderated defensive responses to emotive imagery specifically by reducing the tendency for
attentional disengagement.
In terms of improving the effectiveness of health messages, it is probably most important to
identify moderators that can be incorporated into a message. One well-known strategy is to
provide clear and easily-implemented behavioral recommendations (Job, 1988). As
attentional avoidance processes appear to show automated characteristics (Mendolia, 1999),
this would need to precede, rather than follow, the delivery of distressing images. Gleicher
and Petty (1992) improved persuasion by reassuring participants about the efficacy of
remedial actions before presenting a fear-arousing textual threat, although they did not
specifically apply this to attentional avoidance. We found that experimental effect on text
21

DISTRESSING IMAGES
gaze time in this study persisted only whilst the images were present. Thus, another strategy
could be to separate emotive imagery from key informational components of the message
and place it at a point where it precedes or follows information upon which communicators
wish audiences to elaborate. This approach is untested, but may be worth consideration in
future research.
The possible negative implications of using emotive images for the presentation of public
health messages should be carefully considered. We found that images created attentional
avoidance effects that appear to inhibit persuasion. However, imagery can also be of critical
importance in attracting attention to messages in a competitive environment, and further
investigations are required to better understand the nature and implications of avoidance
processes and message-related factors that moderate their effects.
REFERENCES
Academy of Medical Sciences (2004). Calling Time: The Nation’s Drinking as a Major
Health Issue. Academy of Medical Sciences: London.
Aiken, L.S., & West, S.G. (1991). Multiple Regression: Testing and Interpreting
Interactions. Sage: Newbury Park, CA.
Allen, J.P., Litten, R.Z., Fertig, J.B., & Babor, T. (1997). A review of research on the
Alcohol Use Disorders Identification Test (AUDIT). Alcoholism: Clinical and
Experimental Research, 21, 613-619.
22

DISTRESSING IMAGES
Baron, R., Logan, H., Lilly, J., Inman, M., & Brennan, M. (1994). Negative emotion and
message processing. Journal of Experimental Social Psychology, 30, 181-201.
Baumeister, R.F. & Cairns, K.J. (1992). Repression and self-presentation: When audiences
interfere with self-deceptive strategies. Journal of Personality and Social Psychology, 62,
851-862.
Block, L.G., & Keller, P.A. (1997). Effects of self-efficacy and vividness on the
persuasiveness of health communications. Journal of Consumer Psychology, 6, 31-54.
Blumberg, S.J. (2000). Guarding against threatening HIV messages: An information
processing model. Health Education and Behavior, 27, 780-794.
Boden, J.M., & Baumeister, R.F. (1997). Repressive coping: Distraction using pleasant
thoughts and memories. Journal of Personality and Social Psychology, 73, 45-62.
Bonanno, G.A., Davis, P.J., Singer, J.L., & Schwartz, G.E. (1991). The repressor personality
and avoidant information processing: A dichotic listening study. Journal of Research in
Personality, 25, 386-401.
Brown, S.L., & Locker, E. (2009). Defensive responses to an emotive anti-alcohol message.
Psychology and Health, 24, 517-528.
Brown, S.L. & Morley, A. (2007). Fuzzy sets, risk perception and comparative optimism.
British Journal of Psychology, 98, 575-587.
23

DISTRESSING IMAGES
Brown, S.L., & Smith, E.Z. (2007). The effect of reducing opportunities for downward
comparison on comparative optimism. Psychology and Health, 22, 255-268.
Carver, C.S., Scheier, M.F., & Weintraub, J.K. (1989) Assessing coping strategies: A
theoretically based approach. Journal of Personality and Social Psychology, 56, 267-283.
Chapman, S., Wong, W.L., & Smith, W. (1993). Self-exempting beliefs about smoking and
health: Differences between smokers and ex-smokers. American Journal of Public
Health, 83, 215-219.
Connigrave, K.M., Saunders, J.B., & Reznik, R.B. (1995). Predictive capacity of the AUDIT
for alcohol-related harm. Addiction, 90, 1479-1485.
Coulter, R.H. & Pinto, M.B. (1995). Guilt appeals in advertising: What are their effects?
Journal of Applied Psychology, 80, 697-705.
Derakshan, N., Eysenck, M.W. & Myers, L.B. (2007). Emotional information processing in
repressors: The vigilance-avoidance theory. Cognition and Emotion, 21, 1585-1614.
Emery, S.L. ; Szczypka, G., Powell, L.M. & Chaloupka, F.J. (2007). Public health obesity-
related TV advertising: Lessons learned from tobacco. American Journal of Preventive
Medicine, 33, S257-S263.
24

DISTRESSING IMAGES
Freeman, M.A., Hennessey, E.V., & Marzullo, D.M. (2001). Defensive evaluation of
antismoking messages among college-age smokers: The role of possible selves. Health
Psychology, 20, 424-433.
Frey, K.P. & Eagly, A.H. (1993). Vividness can undermine the persuasiveness of messages.
Journal of Personality and Social Psychology, 65, 32-44.
Fox, E. (1993). Allocation of visual attention and anxiety. Cognition and Emotion, 7, 207-
215.
Gleicher, F., & Petty, R.E. (1992). Expectations of reassurance influence the nature of fear-
stimulated attitude change. Journal of Experimental Social Psychology, 28, 86-100.
Greening, L., Dollinger, S.J., & Pitz, G. (1996). Adolescents’ perceived risk and experience
with natural disasters: An evaluation of cognitive heuristics. Acta Psychologica, 91, 27-
38.
Hansen, C.H., Hansen, R.D., & Shantz, D.W. (1992). Repression at encoding: Discrete
appraisals of emotional stimuli. Journal of Personality and Social Psychology, 63, 1026-
1035.
Hill, D., Chapman, S., & Donovan, R. (1998). The return of scare tactics. Tobacco Control,
7, 5-8.
25

DISTRESSING IMAGES
Jansen, A., Nederkoorn, C. & Mulkens, S. (2005). Selective visual attention for ugly and
beautiful body parts in eating disorders. Behaviour Research and Therapy, 43, 183-196.
Jepson, C., & Chaiken, S. (1990). Chronic issue-specific fear inhibits systematic processing
of persuasive communications. Journal of Social Behavior and Personality, 5, 61-84.
Jemmott, J.B.III, Ditto, P.H. & Croyle, R.T. (1986). Judgeing health status: Effects of
perceived prevalence and personal relevance. Journal of Personality and Social
Psychology, 50, 899-905.
Job, R.F.S. (1988). Effective and ineffective use of fear in health promotion campaigns.
American Journal of Public Health, 78, 163-167.
Keller, P.A., & Block, L.G. (1996). Increasing the persuasiveness of fear appeals: The effect
of arousal and elaboration. Journal of Consumer Research, 22, 448-459.
Keller, P.A., & Block, L.G. (1996). Vividness effects: A resource-matching perspective.
Journal of Consumer Research, 23, 295-304.
Kessels, L.T.E., Ruiter, R.A.C. & Jansma, B.M. (2010). Increased attention but more
efficient disengagement: Neuroscientific evidence for defensive processing of threatening
health information. Health Psychology, 29, 346-354.
Klein, W.M.P. & Harris, P.R. (2009). Self-affirmation enhances attentional bias toward
threatening components of a persuasive message. Psychological Science, 20, 1463-1467.
26

DISTRESSING IMAGES
Knight, J.R., Wechsler, H., Kuo, M., Seibring, M., Weitzman, E.R., & Schuckit, M.A.
(2002). Alcohol Abuse and Dependence Among U.S. College Students. Journal of
Studies on Alcohol, 63, 263-270.
Kromhout, D., Bloemberg, B., Feskens, E., Menotti, A. & Nissinen, A. (2000). Saturated fat,
Vitamin C and smoking predict long-term population all-cause mortality rates in the
seven countries study. International Journal of Epidemiology, 29, 260-265.
Lang, A. (2000). The limited capacity of mediated message processing. Journal of
Communication, 50, 46-70.
Leffingwell, T.R., Neumann, C., & Leedy, M.J. (2007). Defensively biased responding to
risk information among alcohol-using college students. Addictive Behaviors, 32, 158-165.
Lench, H.C., & Levine, L.J. (2005). Effects of fear on risk and control judgments and
memory: Implications for health promotion messages. Cognition and Emotion, 19, 1049-
1069.
Loewenstein, G.F., Weber, E.U., Hsee, C.K., & Welch, N. (2001). Risk as feelings.
Psychological Bulletin, 127, 267-286.
Lundgren, S.R. & Prislin, R. (1998). Motivated cognitive processing and attitude change.
Personality and Social Psychology Bulletin, 24, 715-726.
27

DISTRESSING IMAGES
MacKinnon, D.P., Fairchild, A.J. & Fritz, M.S. (2007). Mediation analysis. Annual Review
of Psychology, 58, 595-614..
Mendolia, M. (1999). Repressors’ appraisal of emotional stimuli in threatening and non-
threatening emotional contexts. Journal of Research in Personality, 33, 1-26.
Peters, E., Slovic, P., Hibbard, J.H., & Tusler, M. (2006). Why worry? Worry, risk
perceptions, and willingness to act to reduce medical errors. Health Psychology, 25, 144-
152.
Pineles, S.L. Shipherd, J.C., Welsh, L.P. & Yovel, I. (2007). The role of attentional biases in
PTSD: Is it interference or facilitation? Behaviour Research and Therapy, 45, 1903-1913.
Raghunathan, R., & Trope, T. (2002). Walking the tightrope between feeling good and being
accurate: Mood as a resource in processing persuasive messages. Journal of Personality
and Social Psychology, 83, 510-525.
Ruiter, R.A.C., Abraham, C., & Kok, G. (2001). Scary warnings and rational precautions: A
review of the psychology of fear appeals. Psychology and Health, 16, 613-630.
Shrout, P.E. & Bolger, N. (2002). Mediation in experimental and nonexperimental studies:
New procedures and recommendations. Psychological Methods, 4, 422-445.
Slater, M.D. (1999). Drinking and driving PSAs: A content analysis of behavioral influence
strategies. Journal of Alcohol and Drug Education, 44, 68-81.
28
DISTRESSING IMAGES
Slovic, P., Finucane, M.L., Peters, E., & MacGregor, D.G. (2003). Risk as analysis and risk
as feelings: Some thoughts about affect, reason, risk and rationality. Risk Analysis, 24,
311-322.
Smith, S.M. & Shaffer, D.R. (2000). Vividness can undermine or enhance message
processing: The moderating role of vividness congruency. Personality and Social
Psychology Bulletin, 26, 769-779.
Stockburger, J., Renner, B., Weike, A.I., Hamm, A.O. & Schupp, H.T. (2009).
Vegetarianism and food perception. Selective visual attention to meat pictures. Appetite,
52, 513-516.
Witte, K., & Allen, M. (2000). A meta-analysis of fear appeals: Implications for effective
public health campaigns. Health Education and Behavior, 27, 591-615.
29

DISTRESSING IMAGES
Table: Means and SDs (in parentheses) of Outcome Variables and Gaze Time (in seconds) by
Condition.
Full Sample Non-Distressing
Images
(n=50)
Distressing
Images
(n=50)
Effect Size r
Intention to Reduce 7.67 (3.41) 8.32 (3.54) 7.02 (3.18) .20Message Evaluation 24.34 (7.31) 25.04 (8.51) 23.64(5.87) .10 Risk Perceptions 18.03 (8.50) 17.44(9.19) 18.62(7.80) .07 Image Gaze Time ф 18.38 (12.78) 14.36 (7.66) 22.41(15.44) .29 Text Gaze Section 1ф 58.74 (18.00) 58.57(17.00) 58.91(19.11) .01 Text Gaze Section 2 ф 49.79 (21.55) 53.85 (22.71) 45.74 (19.74) .19 Text Gaze Section 3 ф 43.44 (15.82) 42.79 (14.83) 44.08 (16.88) .03 Section 1-2 Gaze Change -8.94 (16.41) -4.72 (17.86) -13.18 (13.73) .26ф Untransformed means of these positively skewed variables are shown here but transformed
data were used in inferential analyses.
30
DISTRESSING IMAGES
Figure 1. Structural Model with Section 2 Text Gaze as the Mediator Variable.
Condition
Txt Gaze
e1
Intention
e2
Audit
Mental Dis.
Ment X Cond
Audit X Cond
Ment X Audit
Ment X Aud X Cond
.26
.00
-.06
.74
.21
.10
.69
.75
.14
.04
-.26
-.30
.15
.20
.10
-.16
.12
.05
-.02
31

DISTRESSING IMAGES
Figure 2. Structural Model with Section 1-2 Text Gaze Change (Increase) as the Mediator
Variable.
Condition
Txt Change
e1
Intention
e2
Audit
Mental Dis.
Ment X Cond
Audit X Cond
Ment X Audit
Ment X Aud X Cond
.22
.00
-.06
.74
.21
.10
.69
.75
.14
.04
-.49
-.23
.08
.28
.19
-.21
.12
.05
-.02
32
DISTRESSING IMAGES
Figure 3: Interaction between Condition and Mental Disengagement Predicting Changes in
Text Gaze Time (in seconds) Between Sections 1 and 2.
-20
-15
-10
-5
0
5
10
Non Distress Distress
Lo Ment Dis/Lo Audit
Lo Ment Dis/Hi Audit
Hi Ment Dis/Lo Audit
Hi Ment Dis./Hi Audit
33
Top Related