


Languages
Pages
Legal


THE COUNTY COMMISSIONERS OF CARROLL COUNTY Westminster, Maryland
STATISTICAL SECTION
145
This part of Carroll County’s Comprehensive Annual Financial Report presents detailed information as a context for understanding what the information in the financial statements, note disclosures, and required supplementary information say about the County’s overall financial health. Contents ................................................................................................................... Page(s) Financial Trends These tables contain trend information to help the reader understand how the County’s financial performance and well-being have changed over time. .......................................................................................... 146-153 Revenue Capacity These tables contain information to help the reader assess the County’s most significant local revenue sources and property tax.......................... 154-158 Debt Capacity These tables contain information to help the reader assess the affordability of the County’s current levels of outstanding debt and the County’s ability to issue additional debt in the future. ...................................... 159-162 Economic and Demographic Information These tables offer economic and demographic indicators to help the reader understand the environment within which the County’s financial activities take place. .................................................................................. 163-164 Operating Information These tables contain service and infrastructure data to help the reader understand how the information in the County’s financial report relates to the services the County provides and the activities it performs. ............................................................................................... 165-174 Sources: Unless otherwise noted, the information in these schedules is derived from the Comprehensive Annual Financial Reports for the relevant year. The County implemented GASB Statement No. 34 in 2002; tables presenting government-wide information include information beginning in that year.

Table 1 THE COUNTY COMMISSIONERS OF CARROLL COUNTY
Westminster, Maryland
Net Assets by Component Last Ten Fiscal Years
(accrual basis of accounting)
146
2012 2011 2010 2009 2008Governmental Activities
Invested in Capital Assets, Net of Related Debt 215,928,941$ 224,468,499$ 249,331,687$ 269,641,878$ 255,882,342$ Restricted 33,568,756 33,768,252 22,354,742 19,883,463 23,889,197Unrestricted (71,406,666) (77,293,628) (60,878,526) (18,700,701) 74,067,173
Total Governmental Activities Net Assets 178,091,031 180,943,123 210,807,903 270,824,640 353,838,712
Business-Type ActivitiesInvested in Capital Assets, Net of Related Debt 102,205,828 104,568,783 93,558,513 95,654,846 82,575,108Restricted 12,503,774 370,116 1,308,820 9,435,295 6,788,158Unrestricted (3,535,427) 5,063,524 4,257,842 (5,246,129) 6,594,607
Total Business-Type Activities Net Assets 111,174,175 110,002,423 99,125,175 99,844,012 95,957,873
Primary governmentInvested in Capital Assets, Net of Related Debt 318,134,769 329,037,282 342,890,200 365,296,724 338,457,450Restricted 46,072,530 34,138,368 23,663,562 29,318,758 30,677,355Unrestricted (74,942,093) (72,230,104) (56,620,684) (23,946,830) 80,661,780
Total Primary Government Net Assets 289,265,206$ 290,945,546$ 309,933,078$ 370,668,652$ 449,796,585$
Fiscal years 2003 – 2005 were reclassified to show the correct classification of net assets. Fiscal year 2005 was restated to reflect recognition of retroactive infrastructure. Source: Carroll County Department of the Comptroller.
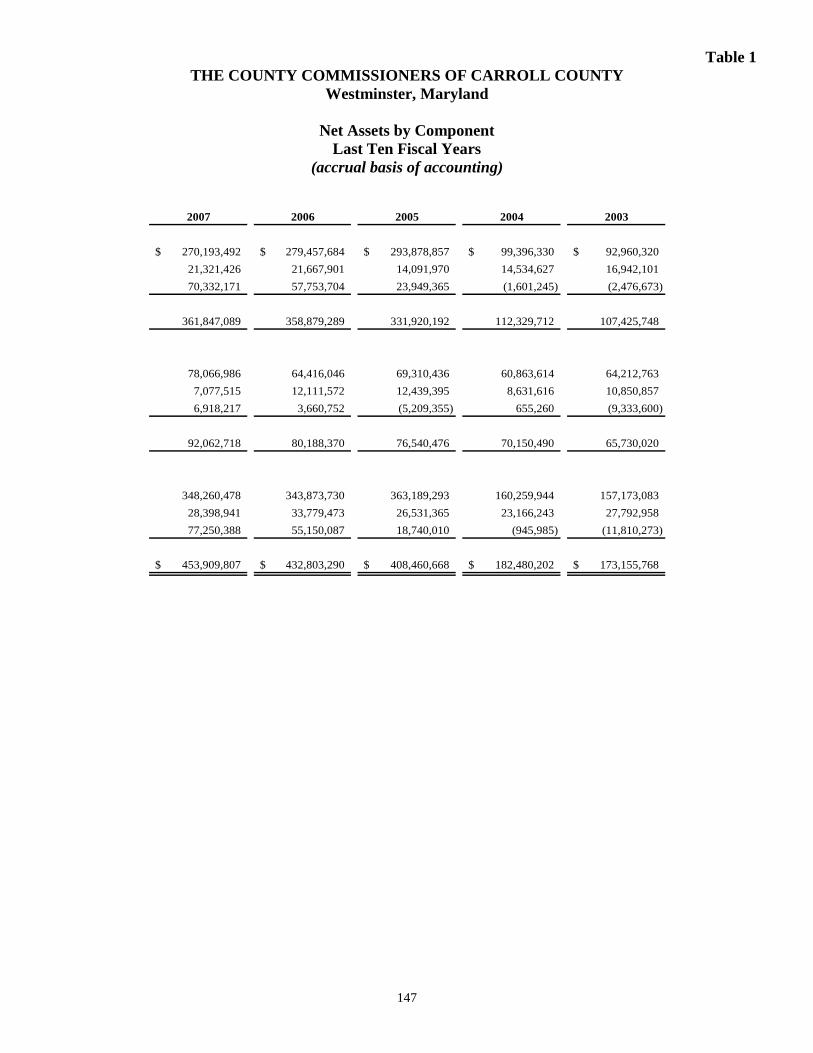
Table 1 THE COUNTY COMMISSIONERS OF CARROLL COUNTY
Westminster, Maryland
Net Assets by Component Last Ten Fiscal Years
(accrual basis of accounting)
147
2007 2006 2005 2004 2003
270,193,492$ 279,457,684$ 293,878,857$ 99,396,330$ 92,960,320$ 21,321,426 21,667,901 14,091,970 14,534,627 16,942,10170,332,171 57,753,704 23,949,365 (1,601,245) (2,476,673)
361,847,089 358,879,289 331,920,192 112,329,712 107,425,748
78,066,986 64,416,046 69,310,436 60,863,614 64,212,7637,077,515 12,111,572 12,439,395 8,631,616 10,850,8576,918,217 3,660,752 (5,209,355) 655,260 (9,333,600)
92,062,718 80,188,370 76,540,476 70,150,490 65,730,020
348,260,478 343,873,730 363,189,293 160,259,944 157,173,08328,398,941 33,779,473 26,531,365 23,166,243 27,792,95877,250,388 55,150,087 18,740,010 (945,985) (11,810,273)
453,909,807$ 432,803,290$ 408,460,668$ 182,480,202$ 173,155,768$

Tabl
e 2
2012
2011
2010
2009
2008
2007
2006
2005
2004
2003
Exp
ense
sG
over
nmen
tal A
ctiv
ities
:G
ener
al g
over
nmen
t75
,610
,266
$
88,2
80,3
17$
79
,073
,880
$
74,2
96,4
86$
70
,411
,246
$
63,4
12,6
21$
56
,180
,288
$
67,9
23,7
35$
64
,812
,090
$
51,1
65,5
41$
Pu
blic
safe
ty
37,3
56,4
6337
,244
,642
37,7
98,0
6038
,658
,117
35,5
83,9
8528
,609
,006
27,0
78,4
9924
,593
,665
23,7
82,6
0521
,482
,313
Publ
ic w
orks
28,7
64,3
5529
,582
,890
33,9
74,6
0730
,238
,005
30,4
96,1
4320
,775
,987
28,0
93,7
4413
,108
,072
17,9
45,4
9212
,791
,981
Hea
lth4,
666,
495
4,93
9,76
24,
963,
980
4,86
8,27
14,
454,
550
4,39
7,03
94,
310,
828
4,04
0,82
13,
876,
743
3,79
7,01
9So
cial
serv
ices
1,20
4,48
91,
249,
949
1,41
8,13
91,
346,
366
1,22
8,09
51,
131,
873
1,09
9,69
01,
049,
646
1,06
3,89
696
8,23
1Ed
ucat
ion
186,
244,
744
185,
038,
583
209,
838,
466
219,
824,
282
188,
609,
030
168,
198,
541
152,
201,
781
144,
886,
450
140,
695,
342
119,
340,
068
Rec
reat
ion
and
park
s3,
418,
694
3,25
7,48
34,
143,
870
2,60
6,23
02,
596,
212
2,77
2,65
42,
005,
587
2,19
5,99
62,
399,
444
1,88
3,05
6Li
brar
ies
11,5
40,2
4511
,277
,792
9,97
1,26
17,
740,
076
9,26
9,07
87,
511,
036
6,81
2,08
76,
293,
406
5,26
5,67
95,
518,
118
Con
serv
atio
n of
nat
ural
reso
urce
s4,
701,
163
20,1
63,9
6914
,288
,096
29,1
25,3
8317
,487
,058
16,7
11,7
0013
,395
,013
10,9
94,2
085,
985,
065
8,59
0,29
9Ec
onom
ic d
evel
opm
ent
2,23
9,35
25,
370,
598
6,01
8,68
75,
988,
296
4,71
5,07
53,
076,
751
2,05
8,98
82,
195,
167
886,
661
3,25
8,50
4In
tere
st o
n lo
ng-te
rm d
ebt
13,4
01,4
6512
,522
,525
12,5
53,6
8010
,282
,801
8,96
3,13
18,
984,
385
8,70
0,18
18,
498,
183
7,37
7,96
88,
785,
009
Tota
l Gov
ernm
enta
l Act
iviti
es E
xpen
ses
369,
147,
731
398,
928,
510
414,
042,
726
424,
974,
313
373,
813,
603
325,
581,
593
301,
936,
686
285,
779,
349
274,
090,
985
237,
580,
139
Busin
ess-
Type
Act
iviti
es:
Bure
au o
f Util
ities
11,0
90,4
6811
,890
,461
10,4
89,6
458,
169,
257
10,0
56,5
467,
849,
747
7,51
0,98
810
,486
,631
6,18
4,84
66,
322,
675
Solid
Was
te8,
727,
891
8,83
0,20
98,
961,
015
7,48
7,84
37,
648,
918
7,93
5,23
77,
480,
908
6,94
7,80
86,
827,
590
6,55
9,55
9A
irpor
t1,
769,
112
618,
045
829,
611
777,
692
3,09
7,61
82,
086,
621
2,23
5,04
81,
991,
862
1,08
4,86
294
0,44
0Se
ptag
e53
2,36
947
5,71
847
4,19
538
8,39
839
5,82
440
2,89
836
4,01
033
3,22
943
7,39
738
6,52
7Fi
rear
ms
92,9
3579
,627
76,2
8177
,475
74,4
9758
,238
60,2
6762
,524
50,6
7056
,259
Fibe
r Net
wor
k54
0,43
6
21
5,01
7
-
-
-
-
-
-
-
-
To
tal B
usin
ess-
Type
Act
iviti
es E
xpen
ses
22,7
53,2
1122
,109
,077
20,8
30,7
4716
,900
,665
21,2
73,4
0318
,332
,741
17,6
51,2
2119
,822
,054
14,5
85,3
6514
,265
,460
Tota
l Pri
mar
y G
over
nmen
t Exp
ense
s39
1,90
0,94
2$
42
1,03
7,58
7$
43
4,87
3,47
3$
44
1,87
4,97
8$
39
5,08
7,00
6$
34
3,91
4,33
4$
31
9,58
7,90
7$
30
5,60
1,40
3$
28
8,67
6,35
0$
25
1,84
5,59
9$
Prog
ram
Rev
enue
sG
over
nmen
tal A
ctiv
ities
:C
harg
es fo
r Ser
vice
s:G
ener
al g
over
nmen
t7,
466,
568
$
8,
361,
578
$
7,
579,
919
$
7,
483,
309
$
10
,755
,039
$
9,36
4,74
2$
6,09
9,86
8$
5,71
8,53
6$
6,01
8,32
7$
7,53
1,53
1$
Publ
ic sa
fety
2,
048,
892
2,30
5,29
42,
544,
149
2,93
8,20
33,
294,
542
3,84
0,41
02,
704,
610
2,79
7,31
92,
367,
860
2,10
1,68
1Pu
blic
wor
ks1,
588,
668
1,56
0,09
01,
530,
974
1,52
0,81
21,
672,
368
1,45
6,79
21,
341,
439
1,53
1,72
61,
134,
025
73,5
92H
ealth
124,
065
44,3
2012
,190
15,5
4112
,492
8,15
58,
111
7,98
13,
840
5,39
6So
cial
serv
ices
6,60
06,
600
284,
014
367,
238
367,
238
284,
564
334,
806
316,
333
316,
332
316,
332
Educ
atio
n48
7,46
445
7,69
839
3,95
142
5,15
040
9,26
674
9,35
35,
763,
276
5,34
4,71
56,
697,
153
6,64
6,97
9R
ecre
atio
n an
d pa
rks
1,00
8,18
787
5,20
086
0,86
577
2,20
481
8,93
190
7,46
541
9,89
333
8,92
035
1,81
330
5,89
6Ec
onom
ic d
evel
opm
ent
-
-
-
-
-
-
10,7
4149
,578
53,7
2957
,543
Ope
ratin
g G
rant
s and
Con
tribu
tions
16,3
72,5
7917
,944
,093
16,2
01,8
0914
,075
,463
13,8
24,7
3212
,841
,014
11,8
33,4
8711
,314
,222
10,6
78,4
1410
,082
,222
Cap
ital G
rant
s and
Con
tribu
tions
6,79
1,37
410
,461
,443
17,2
97,0
183,
212,
403
6,79
7,21
87,
453,
139
3,02
2,17
75,
841,
273
6,93
7,34
19,
221,
074
Tota
l Gov
ernm
enta
l Act
iviti
es P
rogr
am R
even
ues
35,8
94,3
9742
,016
,316
46,7
04,8
8930
,810
,323
37,9
51,8
2636
,905
,634
31,5
38,4
0833
,260
,603
34,5
58,8
3436
,342
,246
(Acc
rual
bas
is o
f acc
ount
ing)
TH
E C
OU
NT
Y C
OM
MIS
SIO
NE
RS
OF
CA
RR
OL
L C
OU
NT
YW
estm
inst
er, M
aryl
and
Cha
nges
in N
et A
sset
sL
ast T
en F
isca
l Yea
rs

Tabl
e 2
2012
2011
2010
2009
2008
2007
2006
2005
2004
2003
(Acc
rual
bas
is o
f acc
ount
ing)
TH
E C
OU
NT
Y C
OM
MIS
SIO
NE
RS
OF
CA
RR
OL
L C
OU
NT
YW
estm
inst
er, M
aryl
and
Cha
nges
in N
et A
sset
sL
ast T
en F
isca
l Yea
rs
Busin
ess-
Type
Act
iviti
es:
Cha
rges
for S
ervi
ces:
Bure
au o
f Util
ities
8,49
0,17
3$
8,63
0,73
0$
7,84
3,04
1$
7,51
9,55
9$
7,66
8,00
3$
7,34
4,47
0$
6,28
1,65
9$
6,58
1,91
2$
6,15
8,14
8$
5,12
1,16
9$
Solid
Was
te7,
243,
944
7,30
7,10
85,
907,
344
6,53
4,24
36,
626,
896
6,60
9,67
96,
461,
528
6,07
8,34
06,
130,
517
5,31
5,45
4A
irpor
t65
0,66
067
5,68
351
8,58
167
1,25
82,
222,
010
1,84
0,44
92,
041,
458
1,74
4,41
41,
016,
110
536,
329
Sept
age
682,
663
608,
688
603,
550
449,
263
387,
636
536,
845
482,
599
388,
871
453,
800
328,
401
Fire
arm
s14
5,69
912
6,69
611
1,98
410
4,71
355
,120
59,4
0079
,649
72,8
9450
,327
50,9
43O
pera
ting
Gra
nts a
nd C
ontri
butio
ns-
-
-
-
-
1,06
4,79
7
-
49
,256
36,5
7119
5,87
7C
apita
l Gra
nts a
nd C
ontri
butio
ns2,
012,
594
2,07
3,79
31,
908,
142
1,96
3,86
22,
520,
888
2,07
9,42
21,
562,
378
5,85
3,89
41,
572,
502
1,05
9,47
5To
tal B
usin
ess-
Type
Act
iviti
es P
rogr
am R
even
ues
19,2
25,7
3319
,422
,698
16,8
92,6
4217
,242
,898
19,4
80,5
5319
,535
,062
16,9
09,2
7120
,769
,581
15,4
17,9
7512
,607
,648
Tota
l Pri
mar
y G
over
nmen
t Pro
gram
Rev
enue
s55
,120
,130
$
61,4
39,0
14$
63
,597
,531
$
48,0
53,2
21$
57
,432
,379
$
56,4
40,6
96$
48
,447
,679
$
54,0
30,1
84$
49
,976
,809
$
48,9
49,8
94$
Net
(Exp
ense
)/Rev
enue
Gov
ernm
enta
l Act
iviti
es(3
33,2
53,3
34)
(356
,912
,194
)(3
67,3
37,8
37)
(394
,163
,990
)(3
35,8
61,7
77)
(288
,675
,959
)(2
70,3
98,2
78)
(252
,518
,746
)(2
39,5
32,1
51)
(201
,237
,893
)Bu
sines
s-Ty
pe A
ctiv
ities
(3,5
27,4
78)
(2,6
86,3
79)
(3,9
38,1
05)
342,
233
(1,7
92,8
50)
1,20
2,32
1(7
41,9
50)
947,
527
832,
610
(1,6
57,8
12)
Tota
l Pri
mar
y G
over
nmen
t Net
Exp
ense
(336
,780
,812
)$
(359
,598
,573
)$
(371
,275
,942
)$
(393
,821
,757
)$
(337
,654
,627
)$
(287
,473
,638
)$
(271
,140
,228
)$
(251
,571
,219
)$
(238
,699
,541
)$
(202
,895
,705
)$
Gen
eral
Rev
enue
s and
Oth
er C
hang
es in
Net
Ass
ets
Gov
ernm
enta
l Act
iviti
es:
Taxe
s: Prop
erty
taxe
s20
3,60
1,06
6$
20
8,29
6,51
2$
20
1,57
3,21
3$
18
9,07
9,52
9$
17
4,35
4,87
3$
15
8,11
2,93
6$
14
8,64
4,72
8$
13
4,73
2,89
6$
12
7,32
2,60
0$
11
5,41
7,11
6$
In
com
e ta
x11
8,16
8,03
812
1,92
1,97
095
,516
,527
99,9
73,9
0312
0,23
0,11
810
6,92
1,33
110
8,43
5,38
610
3,31
5,65
190
,410
,674
77,8
21,6
32R
ecor
datio
n8,
520,
674
7,61
2,90
79,
154,
578
9,22
0,24
914
,948
,705
18,9
02,0
9422
,782
,302
22,2
07,0
7219
,238
,898
11,1
52,4
53A
dmiss
ion
and
amus
emen
t tax
296,
890
379,
990
246,
184
335,
125
386,
186
405,
295
393,
659
451,
296
428,
625
477,
069
Agr
icul
tura
l tra
nsfe
r tax
159,
227
24,9
7724
,199
181,
458
439,
268
390,
420
501,
049
863,
696
693,
045
973,
496
Hot
el ta
x29
8,49
828
4,60
228
7,85
028
7,49
531
1,04
932
1,67
619
1,11
7-
-
-
Stat
e sh
ared
, unr
estri
cted
620,
224
724,
807
1,17
2,33
910
,300
,922
11,7
44,9
6112
,729
,241
12,3
13,3
629,
936,
273
7,89
0,08
59,
652,
977
Inve
stm
ent e
arni
ngs a
nd m
iscel
lane
ous,
unre
stric
ted
3,04
8,63
178
2,34
62,
107,
298
4,56
3,21
78,
753,
090
8,62
2,19
66,
988,
995
2,66
2,24
21,
277,
769
1,69
3,75
2Tr
ansf
ers
(4,3
12,0
06)
(1
2,98
0,69
7)(2
,761
,088
)(2
,791
,980
)(3
,314
,850
)(8
,497
,061
)(2
,893
,223
)(3
,807
,258
)(2
,825
,581
)(4
,226
,480
)To
tal G
over
nmen
tal A
ctiv
ities
330,
401,
242
327,
047,
414
307,
321,
100
311,
149,
918
327,
853,
400
297,
908,
128
297,
357,
375
270,
361,
868
244,
436,
115
212,
962,
015
Busin
ess-
Type
Act
iviti
es:
Inve
stm
ent e
arni
ngs a
nd m
iscel
lane
ous,
unre
stric
ted
383,
547
$
582,
930
$
422,
785
$
751,
926
$
2,27
9,73
0$
2,17
4,96
6$
1,49
6,62
1$
1,63
5,20
1$
762,
279
$
1,09
8,35
7$
Gai
n on
sale
of c
apita
l ass
et3,
677
-
35,3
95
-
93
,425
-
-
-
-
-
Tran
sfer
s4,
312,
006
12,9
80,6
972,
761,
088
2,79
1,98
03,
314,
850
8,49
7,06
12,
893,
223
3,80
7,25
82,
825,
581
4,22
6,48
0To
tal B
usin
ess-
Type
Act
iviti
es4,
699,
230
13,5
63,6
273,
219,
268
3,54
3,90
65,
688,
005
10,6
72,0
274,
389,
844
5,44
2,45
93,
587,
860
5,32
4,83
7To
tal P
rim
ary
Gov
ernm
ent
335,
100,
472
340,
611,
041
310,
540,
368
314,
693,
824
333,
541,
405
308,
580,
155
301,
747,
219
275,
804,
327
248,
023,
975
218,
286,
852
Gov
ernm
enta
l Act
iviti
es(2
,852
,092
)$
(29,
864,
780)
$
(60,
016,
737)
$
(83,
014,
072)
$
(8,0
08,3
77)
$
9,
232,
169
$
26
,959
,097
$
17,8
43,1
22$
4,
903,
964
$
11
,724
,122
$
Busin
ess-
Type
Act
iviti
es1,
171,
752
10,8
77,2
48(7
18,8
37)
3,88
6,13
93,
895,
155
11,8
74,3
483,
647,
894
6,38
9,98
64,
420,
470
3,66
7,02
5To
tal P
rim
ary
Gov
ernm
ent C
hang
e in
Net
Ass
ets
(1,6
80,3
40)
$
(1
8,98
7,53
2)$
(6
0,73
5,57
4)$
(7
9,12
7,93
3)$
(4
,113
,222
)$
21,1
06,5
17$
30
,606
,991
$
24,2
33,1
08$
9,
324,
434
$
15
,391
,147
$
Not
e: F
or c
ompa
rison
pur
pose
s, re
venu
es fo
r fisc
al y
ears
200
4 an
d 20
03 w
ere
recl
assif
ied
from
C
harg
es fo
r Ser
vice
to M
aint
enan
ce F
ee a
nd In
vest
men
t Ear
ning
sSo
urce
: C
arro
ll C
ount
y D
epar
tmen
t of t
he C
ompt
rolle
r

Tab
le 3
T
HE
CO
UN
TY
CO
MM
ISSI
ON
ER
S O
F C
AR
RO
LL
CO
UN
TY
W
estm
inst
er, M
aryl
and
Fu
nd B
alan
ces,
Gov
ernm
enta
l Fun
ds
Las
t Ten
Fis
cal Y
ears
(m
odifi
ed a
ccru
al b
asis
of a
ccou
ntin
g)
2012
2011
2010
2009
2008
2007
2006
2005
2004
2003
Gen
eral
Fu
nd
(1)
Non
spen
dabl
e27
,853
,715
$
30
,274
,746
$
R
estr
icte
d25
,272
,233
18
,998
,982
C
omm
itte
d19
,777
,263
20
,165
,000
A
ssig
ned
20,9
46,4
37
9,78
2,49
0
U
nass
igne
d14
,827
,375
16
,809
,377
T
otal
Gen
eral
Fun
d10
8,67
7,02
3
96,0
30,5
95
Non
-Maj
or G
over
nm
enta
l F
un
ds:
(1)
Cap
tial
Pro
ject
s F
und
Ass
igne
d37
,748
,479
33
,780
,969
S
peci
al R
even
ues
Fun
d
Res
tric
ted
2,22
7,03
0
4,
361,
704
Com
mit
ted
911,
792
603,
723
Una
ssig
ned
-
(21,
576)
Tot
al N
on-M
ajor
Gov
ernm
enta
l F
unds
40,8
87,3
01
38,7
24,8
20
Tot
al G
over
nmen
tal
Fun
ds14
9,56
4,32
4$
134,
755,
415
$
Una
ssig
ned
Gen
eral
Fun
d B
alan
ce
as a
Per
cent
age
of
Gen
eral
Fun
d E
xpen
ditu
res
4.8%
5.5%
Gen
eral
Fu
nd
Res
erve
d 39
,429
,507
$
34
,538
,703
$
34
,265
,738
$
36
,345
,385
$
29
,544
,723
$
22
,316
,884
$
18
,002
,122
$
15
,106
,392
$
U
nres
erve
d an
d de
sign
ated
27,8
68,2
8134
,623
,762
30,9
97,1
3831
,787
,678
31,2
17,8
8942
,231
,314
21,9
03,1
4033
,688
,855
Unr
eser
ved,
und
esig
nate
d 7,
993,
646
8,10
3,28
114
,858
,762
7,30
2,10
213
,542
,642
12,8
91,5
3312
,597
,901
3,75
1,25
7T
otal
Gen
eral
Fun
d75
,291
,434
77
,265
,746
80
,121
,638
75
,435
,165
74
,305
,254
77
,439
,731
52
,503
,163
52
,546
,504
Non
-Maj
or G
over
nm
enta
l F
un
ds:
Cap
tial
Pro
ject
s F
und
Res
erve
d fo
r E
ncum
bran
ces
14,1
73,0
39
19,9
67,9
75
39,9
12,1
91
11,0
23,5
65
12,8
57,7
09
8,80
0,33
2
8,
075,
516
13,2
59,4
60
Unr
eser
ved
and
desi
gnat
ed29
,143
,318
25
,951
,067
45
,904
,401
93
,792
,138
79
,972
,189
48
,702
,238
41
,394
,637
43
,640
,987
S
peci
al R
even
ues
Fun
d
Unr
eser
ved,
und
esig
nate
d4,
940,
003
3,33
8,52
7
2,
340,
051
9,97
3,46
0
9,
395,
177
5,20
7,34
8
4,
318,
286
10,7
26,4
59
Tot
al O
ther
Gov
ernm
enta
l F
unds
48,2
56,3
60
49,2
57,5
69
88,1
56,6
43
114,
789,
163
10
2,22
5,07
5
62,7
09,9
18
53,7
88,4
39
67,6
26,9
06
Tot
al G
over
nmen
tal
Fun
ds12
3,54
7,79
4$
126,
523,
315
$
16
8,27
8,28
1$
190,
224,
328
$
17
6,53
0,32
9$
140,
149,
649
$
10
6,29
1,60
2$
120,
173,
410
$
Unr
eser
ved
Gen
eral
Fun
d B
alan
ce
as a
Per
cent
age
of
Gen
eral
Fun
d E
xpen
ditu
res
10.5
%12
.9%
14.9
%13
.7%
17.0
%21
.4%
14.9
%17
.0%
So
urce
: C
arro
ll C
ount
y D
epar
tmen
t of t
he C
ompt
rolle
r. (1
) In
FY 2
011
GA
SB 5
4 w
as im
plem
ente
d.
150
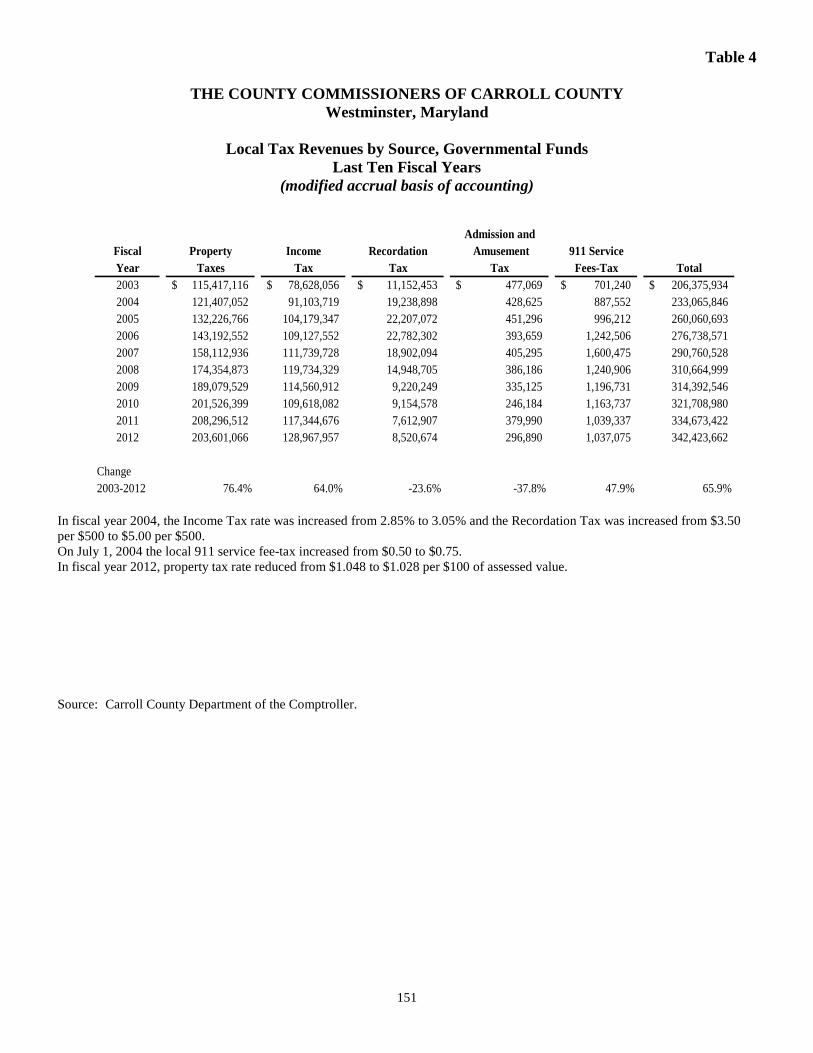
Table 4
THE COUNTY COMMISSIONERS OF CARROLL COUNTY Westminster, Maryland
Local Tax Revenues by Source, Governmental Funds
Last Ten Fiscal Years (modified accrual basis of accounting)
151
Admission andFiscal Property Income Recordation Amusement 911 ServiceYear Taxes Tax Tax Tax Fees-Tax Total2003 115,417,116$ 78,628,056$ 11,152,453$ 477,069$ 701,240$ 206,375,934$ 2004 121,407,052 91,103,719 19,238,898 428,625 887,552 233,065,8462005 132,226,766 104,179,347 22,207,072 451,296 996,212 260,060,6932006 143,192,552 109,127,552 22,782,302 393,659 1,242,506 276,738,5712007 158,112,936 111,739,728 18,902,094 405,295 1,600,475 290,760,5282008 174,354,873 119,734,329 14,948,705 386,186 1,240,906 310,664,9992009 189,079,529 114,560,912 9,220,249 335,125 1,196,731 314,392,5462010 201,526,399 109,618,082 9,154,578 246,184 1,163,737 321,708,9802011 208,296,512 117,344,676 7,612,907 379,990 1,039,337 334,673,4222012 203,601,066 128,967,957 8,520,674 296,890 1,037,075 342,423,662
Change2003-2012 76.4% 64.0% -23.6% -37.8% 47.9% 65.9%
In fiscal year 2004, the Income Tax rate was increased from 2.85% to 3.05% and the Recordation Tax was increased from $3.50 per $500 to $5.00 per $500. On July 1, 2004 the local 911 service fee-tax increased from $0.50 to $0.75. In fiscal year 2012, property tax rate reduced from $1.048 to $1.028 per $100 of assessed value. Source: Carroll County Department of the Comptroller.

Table 5
152
2012 2011 2010 2009 2008REVENUES
Taxes-Local (see Table 4) $342,423,662 $334,673,422 $321,708,980 $314,392,546 $310,664,999Taxes-State Shared 1,236,284 1,447,227 1,219,154 10,800,922 12,244,961Impact fees 1,575,933 1,148,592 1,304,575 869,347 1,350,460Licenses and permits 1,382,219 1,364,820 1,310,176 1,288,525 1,666,970Intergovernmental revenues 15,316,915 26,455,936 30,841,686 15,042,612 16,773,453Charges for services 4,810,478 4,981,149 5,008,757 5,239,049 5,788,013Fines and forfeits 92,355 101,128 86,168 90,840 100,509Interest and gain on investments 6,800,763 1,244,055 2,989,913 5,463,426 10,537,502Miscellaneous revenues 4,372,030 3,249,099 4,396,040 3,349,723 4,101,008
Total revenues 378,010,639 374,665,428 368,865,449 356,536,990 363,227,875 EXPENDITURESCurrent:
General government 69,611,957 69,373,934 72,086,446 69,035,233 65,771,932Public safety 35,914,325 35,396,452 34,748,084 35,256,843 34,222,625Public works 8,831,776 10,649,104 12,586,032 11,325,405 10,861,774Health 4,494,155 4,707,292 4,712,680 4,731,958 4,368,725Social services 1,185,304 1,226,927 1,391,110 1,319,630 1,200,206Education 173,557,501 174,935,761 177,855,179 172,156,658 155,480,987Library 8,497,632 8,645,019 8,413,733 8,170,171 7,717,198Recreation and parks 2,569,590 2,639,789 1,877,029 1,665,731 1,648,268Conservation of natural resources 839,957 822,510 792,207 800,054 821,409Economic development 1,970,523 5,089,136 5,640,224 5,690,821 4,351,843
Capital outlay 30,304,655 44,842,000 77,047,071 127,778,575 86,014,727Debt service:
Principal 27,087,742 23,431,934 22,889,828 24,029,542 23,487,007Interest 14,154,056 13,914,992 12,802,086 10,470,693 9,543,326
Total expenditures 379,019,173 395,674,850 432,841,709 472,431,314 405,490,027Excess (deficiency) of revenuesover (under) expenditures (1,008,534) (21,009,422) (63,976,260) (115,894,324) (42,262,152)
OTHER FINANCING SOURCES (USES)Transfers in 21,745,757 13,778,283 12,035,023 16,037,191 26,594,904Transfers out (26,057,763) (16,018,252) (14,780,223) (18,829,171) (29,909,754)Refunding bonds issued 9,873,957 14,690,327 (7,936,995) - - Payments to escrow agent (11,299,208) (14,593,220) - - (6,786,798) Bonds issued 18,750,000 21,192,091 64,508,850 72,088,000 27,100,000Bonds premium (discount) 2,756,696 2,894 2,371,214 1,874,448 672,349Issuance of debt-long term notes - 13,115,500 4,662,430 2,956,796 2,495,343
Total other financing sources 15,769,439 32,167,623 60,860,299 74,127,264 20,166,044Net change in fund balances 14,760,905$ 11,158,201$ (3,115,961)$ (41,767,060)$ (22,096,108)$
Debt Service as a percentage ofNoncapital Expenditures 12.2% 10.4% 9.0% 7.9% 8.9%
Note: For comparison purposes, transfers out to the Pension Fund for fiscal years 2004, 2005 and 2006 were reclassified as expenditures by function.The initial year for the Pension Fund was fiscal year 2004.Implementation of GASB 43 & 45 was fiscal year 2008.
Source: Carroll County Department of the Comptroller.
(modified accrual basis of accounting)
THE COUNTY COMMISSIONERS OF CARROLL COUNTY Westminster, Maryland Changes in Fund Balances, Governmental Funds Last Ten Fiscal Years
Table 5
153
2007 2006 2005 2004 2003
$290,760,528 $276,738,571 $260,060,693 233,065,846$ 206,375,934$ 12,729,242 12,313,362 9,936,273 7,890,085 9,652,9771,669,793 3,924,721 3,936,986 4,864,707 5,394,2631,781,585 3,349,234 2,999,086 3,175,909 3,368,917
14,253,803 12,627,892 15,319,436 16,448,322 18,806,8495,732,717 4,559,557 4,850,580 4,237,420 4,410,686
86,754 88,942 123,622 107,577 132,34911,112,070 6,753,742 3,395,552 2,071,122 2,657,7925,953,948 3,763,843 3,862,252 3,862,329 3,359,057
344,080,440 324,119,864 304,484,480 275,723,317 254,158,824
60,783,464 60,412,713 66,446,506 53,805,088 46,886,32028,595,412 26,875,030 24,466,006 22,682,161 20,585,1179,425,523 8,495,030 7,851,771 7,386,474 8,034,7004,339,691 4,204,001 3,924,884 3,814,693 3,734,9691,131,873 1,096,568 1,042,802 1,057,052 961,387
151,674,483 142,253,487 132,393,561 124,378,658 117,076,0076,782,100 6,220,220 5,725,660 5,232,270 5,098,4952,106,832 1,221,026 1,113,773 1,098,367 1,109,263
718,552 698,716 675,481 642,661 616,4033,067,166 1,819,561 2,728,971 3,282,035 3,257,189
55,671,218 45,177,873 38,032,734 43,078,838 23,727,048
20,336,962 18,421,084 14,670,026 15,997,408 13,907,7469,237,763 8,987,587 8,145,529 7,451,178 8,722,292
353,871,039 325,882,896 307,217,704 289,906,883 253,716,936
(9,790,599) (1,763,032) (2,733,224) (14,183,566) 441,888
14,957,047 12,024,485 17,376,594 22,913,593 23,208,305(17,812,601) (14,890,815) (20,004,967) (32,739,174) (27,434,785)
- - - - - (24,849,347) - - (71,096,825) - 44,092,000 34,699,318 36,860,000 81,104,603 16,289,0511,180,352 171,249 157,786 (3,335) - 5,994,265 5,923,118 2,179,934 100,000 530,930
23,561,716 37,927,355 36,569,347 278,862 12,593,50113,771,117$ 36,164,323$ 33,836,123$ (13,904,704)$ 13,035,389$
9.1% 9.2% 8.0% 8.8% 9.8%

Tab
le 6
T
HE
CO
UN
TY
CO
MM
ISSI
ON
ER
S O
F C
AR
RO
LL
CO
UN
TY
W
estm
inst
er, M
aryl
and
A
sses
sed
Val
uatio
n an
d E
stim
ated
Act
ual V
alue
of T
axab
le P
rope
rty
Las
t Ten
Fis
cal Y
ears
Estim
ated
Gra
nd T
otal
Fisc
alAs
sess
edEs
timat
edDi
rect
Publ
ic M
arke
tDi
rect
Es
timat
edYe
arVa
lue
Mar
ket V
alue
Tax
Rate
Unin
corp
orat
edIn
corp
orat
edUt
ilitie
sTo
tal
Valu
eTa
x Ra
teM
arke
t Val
ue
2003
9,82
1,66
5,20
2$
9,82
1,66
5,20
2$
1.04
8$
14,2
38,1
00$
241,
341,
930
$
26
3,62
1,78
0$
519,
201,
810
$
51
9,20
1,81
0$
2.
62$
10
,340
,867
,012
$
20
0410
,449
,917
,089
10,4
49,9
17,0
891.
048
14,8
36,2
4022
8,92
0,02
025
5,08
1,61
049
8,83
7,87
049
8,83
7,87
02.
6210
,948
,754
,959
2005
11,5
24,6
15,7
0011
,524
,615
,700
1.04
812
,241
,920
233,
698,
170
263,
902,
400
509,
842,
490
509,
842,
490
2.62
12,0
34,4
58,1
9020
0612
,973
,853
,789
12,9
73,8
53,7
891.
048
11,2
12,7
9023
7,29
0,84
024
7,78
5,66
049
6,28
9,29
049
6,28
9,29
02.
6213
,470
,143
,079
2007
14,9
10,9
76,0
9114
,910
,976
,091
1.04
812
,180
,910
259,
445,
570
258,
703,
530
530,
330,
010
530,
330,
010
2.62
15,4
41,3
06,1
0120
0817
,346
,223
,578
17,3
46,2
23,5
781.
048
11,2
66,3
4026
7,23
8,63
027
7,84
0,35
055
6,34
5,32
055
6,34
5,32
02.
6217
,902
,568
,898
2009
19,8
51,9
53,9
8019
,851
,953
,980
1.04
811
,958
,790
273,
972,
690
271,
526,
820
557,
458,
300
557,
458,
300
2.62
20,4
09,4
12,2
8020
1021
,512
,336
,815
21,5
12,3
36,8
151.
048
11,2
85,6
5027
6,47
5,34
026
6,07
0,82
055
3,83
1,81
055
3,83
1,81
02.
6222
,066
,168
,625
2011
20,3
50,5
38,4
5120
,350
,538
,451
1.04
810
,631
,520
258,
758,
007
275,
237,
500
544,
627,
027
544,
627,
027
2.62
20,8
95,1
65,4
7820
1219
,148
,080
,099
19,1
48,0
80,0
991.
028
10,2
01,3
0038
8,87
9,33
026
6,41
5,29
066
5,49
5,92
066
5,49
5,92
02.
5719
,813
,576
,019
Real
Pro
pert
yPe
rson
al P
rope
rty
Asse
ssed
Val
ue
R
eal p
rope
rty is
reas
sess
ed e
very
thre
e ye
ars.
Rea
l pro
perty
is a
sses
sed
at m
arke
t val
ue.
The
tota
l per
sona
l pro
perty
ass
esse
d va
lue
is e
qual
to th
e es
timat
ed m
arke
t val
ue.
S
ourc
e:
Car
roll
Cou
nty
Dep
artm
ent o
f the
Com
ptro
ller.
154

Tab
le 7
TH
E C
OU
NT
Y C
OM
MIS
SIO
NE
RS
OF
CA
RR
OL
L C
OU
NT
Y
Wes
tmin
ster
, Mar
ylan
d
Rea
l Pro
pert
y T
ax R
ates
- D
irec
t and
Ove
rlap
ping
Gov
ernm
ents
(P
er $
100
of A
sses
sed
Val
ue)
Las
t Ten
Fis
cal Y
ears
D
irec
t Rat
eFi
scal
Car
roll
Stat
e of
New
Uni
onM
t.Y
ear
Cou
nty
Mar
ylan
dTa
neyt
own
Syke
svill
eM
anch
este
rW
estm
inst
er
Ham
pste
adW
inds
orB
ridge
Airy
2003
$1.0
48$0
.08
$0.3
2$0
.304
$0.1
84$0
.40
$0.2
0$0
.16
$0.3
0$0
.206
2004
1.04
80.
132
0.32
0.30
40.
184
0.40
0.20
0.16
0.30
0.20
220
051.
048
0.13
20.
320.
330.
184
0.40
0.20
0.16
0.30
0.19
320
061.
048
0.13
20.
320.
330.
184
0.40
0.20
0.16
0.30
0.18
820
071.
048
0.11
20.
320.
330.
184
0.44
0.20
0.16
0.30
0.18
320
081.
048
0.11
20.
320.
330.
184
0.44
0.20
0.20
0.30
0.17
420
091.
048
0.11
20.
320.
330.
184
0.44
0.20
0.20
0.30
0.16
520
101.
048
0.11
20.
320.
330.
184
0.44
0.20
0.20
0.30
0.16
520
111.
048
0.11
20.
320.
330.
204
0.58
0.20
0.20
0.30
0.16
9520
121.
028
0.11
20.
320.
330.
216
0.58
0.20
0.20
0.30
0.16
95
Ove
rlap
ping
Rat
es
Th
e pr
oper
ty ta
x ra
tes i
ndic
ated
for t
he in
corp
orat
ed to
wns
onl
y ap
ply
with
in to
wn
limits
and
are
in a
dditi
on to
the
coun
ty a
nd st
ate
taxe
s.
So
urce
s: C
arro
ll C
ount
y D
epar
tmen
t of t
he C
ompt
rolle
r.
Mar
ylan
d St
ate
Dep
artm
ent o
f Ass
essm
ents
and
Tax
atio
n.
155

Table 8 THE COUNTY COMMISSIONERS OF CARROLL COUNTY
Westminster, Maryland
Principal Taxpayers Current Fiscal Year and Nine Years Ago
156
Property is reassessed every three years. Source: Carroll County Department of the Comptroller.
Assessed Tax Amount % of TotalTaxpayer Type of Business Valuation Paid Assessed Value
Baltimore Gas & Electric Utilities 175,648,440$ 4,514,165$ 0.89%Verizon-Maryland Communications 43,569,290 1,119,731 0.22%Carroll Lutheran Village Retirement Village 91,987,360 1,061,771 0.46%Random House Warehouse Distribution 45,344,810 664,722 0.23%Colonial Pipeline Co. Pipeline trans.-refined petroleum 19,930,610 512,217 0.10%Cranberry Mall Properties Mall 22,900,090 511,511 0.12%Wal-Mart Real Estate Commercial Stores 29,335,630 479,820 0.15%Fairhaven Inc Assisted Living 35,232,867 403,550 0.18%Cranberry Retail Inc. Power Tools 21,808,980 372,878 0.11%Hampstead 2004 LLC Retail 32,843,100 372,266 0.17%
518,601,177$ 10,012,631$ 2.62%
Total Assessed Valuation 19,813,576,019$
Assessed Tax Amount % of TotalTaxpayer Type of Business Valuation Paid Assessed Value
Baltimore Gas & Electric Utilities 123,604,900$ 3,238,448$ 1.20%Verizon-Maryland Communications 71,542,040 1,874,401 0.69%Random House Inc. Warehouse Distribution Center 47,381,360 1,241,392 0.46%D&L Development Power Tools 27,983,240 733,161 0.27%Carroll Lutheran Village Retirement Village 24,886,560 652,028 0.24%Wal-Mart Store, Inc. Commercial Stores 24,425,522 639,949 0.24%AT&T Communications Communications 24,228,200 634,779 0.23%Cranberry Mall Properties LLC Mall 22,192,260 581,437 0.21%Londontown Corp Clothing/Outerwear 20,747,110 543,574 0.20%Potomac Edison Electric Utility 20,086,828 526,275 0.19%
407,078,020$ 10,665,444 3.94%
Total Assessed Valuation 10,340,867,012$
2012
2003

Table 9
THE COUNTY COMMISSIONERS OF CARROLL COUNTY Westminster, Maryland
Property Tax Levies and Collections
Last Ten Fiscal Years
157
Fiscal Percent ofYear Total Collected in Outstanding Deliquent
Ended Tax Levy for Percent Subsequent Percent Deliquent Taxes toJune 30, Fiscal Year Amount of Levy Years Amount of Levy Taxes Tax Levy
2003 116,374,225$ 114,676,102$ 98.54% 1,691,524$ 116,367,626$ 99.99% 6,599$ 0.01%2004 122,127,710 121,181,554 99.23% 930,719 122,112,273 99.99% 15,437 0.01%2005 133,912,351 132,713,125 99.10% 1,178,064 133,891,189 99.98% 21,162 0.02%2006 148,614,976 147,744,969 99.41% 837,637 148,582,606 99.98% 32,370 0.02%2007 170,124,838 169,106,817 99.40% 978,469 170,085,286 99.98% 39,552 0.02%2008 195,793,490 194,780,453 99.48% 926,543 195,706,996 99.96% 86,494 0.04%2009 222,146,165 221,514,565 99.72% 500,950 222,015,515 99.94% 130,650 0.06%2010 239,656,240 238,543,223 99.54% 948,289 239,491,512 99.93% 164,728 0.07%2011 227,219,284 226,056,851 99.49% 842,901 226,899,752 99.86% 319,532 0.14%2012 210,189,963 209,114,927 99.49% - 209,114,927 99.49% 1,075,037 0.51%
Collected withinFiscal Year of the Levy to Date
Total Collections
Source: Carroll County Department of the Comptroller.

Tab
le 1
0 T
HE
CO
UN
TY
CO
MM
ISSI
ON
ER
S O
F C
AR
RO
LL
CO
UN
TY
W
estm
inst
er, M
aryl
and
B
urea
u of
Util
ities
W
ater
and
Sew
er R
ates
L
ast T
en F
isca
l Yea
rs
Fisc
alQ
uart
erly
Qua
rter
lyYe
arBa
se R
ate
Tier
1*
Tier
2*
Tier
3*
Base
Rat
eTi
er 1
*Ti
er 2
*Ti
er 3
*
2003
$7.6
8$2
.14
$2.9
7$2
.30
11.5
2$
3.
17$
3.40
$
3.
31$
2004
8.45
2.43
3.02
3.39
12.1
83.
844.
755.
3220
056.
463.
073.
483.
749.
183.
994.
825.
3620
066.
692.
943.
593.
869.
364.
365.
335.
6320
077.
643.
294.
024.
4710
.06
5.14
6.38
7.18
2008
8.23
3.35
4.18
4.69
11.6
15.
706.
716.
6020
098.
903.
634.
545.
1112
.58
5.19
6.83
7.85
2010
8.41
4.02
4.67
5.07
11.9
55.
917.
067.
8220
116.
974.
625.
005.
289.
977.
278.
138.
7720
126.
974.
625.
005.
289.
977.
278.
138.
77
Wat
erSe
wer
Ti
ers a
re b
ased
on
the
follo
win
g us
ages
Ti
er 1
0-
10,0
00 g
als.
Tier
2
10,0
01-3
0,00
0 ga
ls.
Tier
3
30,0
01 g
als.
and
up
*Per
1,0
00 g
allo
ns
The
stan
dard
hou
seho
ld m
eter
size
is 5
/8”
and
the
aver
age
hous
ehol
d us
age
for f
isca
l yea
r 201
2 w
as 1
4,00
0 ga
ls. p
er q
uarte
r. So
urce
: C
arro
ll C
ount
y D
epar
tmen
t of t
he C
ompt
rolle
r.
158

Tab
le 1
1 T
HE
CO
UN
TY
CO
MM
ISSI
ON
ER
S O
F C
AR
RO
LL
CO
UN
TY
W
estm
inst
er, M
aryl
and
R
atio
s of O
utst
andi
ng D
ebt b
y T
ype
Las
t Ten
Fis
cal Y
ears
Spec
ial
Gen
eral
Gen
eral
G
ener
alAs
sess
men
t Deb
tTo
tal
% o
f%
of M
arke
tFi
scal
Obl
igat
ion
Obl
igat
ion
Oth
erPu
rcha
seO
blig
atio
nw
ith G
over
nmen
tPr
imar
yPe
rson
alPr
oper
tyPe
rYe
arBo
nds(1
)De
btNo
tes
Agre
emen
tsBo
nds (
1)Co
mm
itmen
tG
over
nmen
tIn
com
e (3)
Valu
e (2)
Capi
ta (3
)
2003
179,
403,
473
$
92
6,93
0$
3,55
6,08
0$
2,
430,
100
$
15,3
55,2
99$
7,
244,
634
$
20
8,91
6,51
6$
2.
75%
2.02
%1,
279
$
2004
175,
577,
086
1,02
6,93
02,
243,
951
1,49
2,70
614
,992
,401
6,60
9,66
320
1,94
2,73
72.
85%
1.84
%1,
215
2005
199,
860,
394
3,20
6,86
483
4,16
750
9,48
816
,870
,281
5,94
3,58
422
7,22
4,77
82.
66%
1.89
%1,
348
2006
217,
812,
296
4,55
2,86
41,
749,
669
2,64
9,07
914
,860
,641
5,24
4,86
024
6,86
9,40
92.
52%
1.83
%1,
437
2007
218,
904,
371
7,13
6,86
44,
107,
759
2,72
5,44
313
,781
,251
4,51
1,88
025
1,16
7,56
82.
59%
1.63
%1,
450
2008
219,
672,
038
7,13
6,86
43,
473,
927
2,58
3,00
422
,345
,826
3,74
2,95
225
8,95
4,61
12.
68%
1.45
%1,
486
2009
271,
851,
752
9,35
1,99
01,
969,
903
2,43
2,32
328
,139
,243
2,93
6,29
731
6,68
1,50
82.
27%
1.55
%1,
811
2010
308,
741,
636
14,0
14,4
2093
7,96
52,
268,
571
27,8
78,6
042,
090,
052
355,
931,
248
2.02
%1.
61%
2,02
720
1130
7,15
5,88
827
,129
,920
200,
000
2,09
7,83
526
,190
,843
1,20
2,25
936
3,97
6,74
52.
08%
1.74
%2,
167
2012
300,
214,
844
27,1
29,9
19-
1,
919,
820
23,7
58,1
2927
1,86
535
3,29
4,57
7N/
A1.
78%
2,09
5
Gov
ernm
enta
l Act
iviti
esBu
sines
s-Typ
e Act
iviti
es
N
otes
: N
/A n
ot a
vaila
ble.
D
etai
ls re
gard
ing
the
Cou
nty’
s out
stan
ding
deb
t can
be
foun
d in
the
note
s to
the
finan
cial
sta
tem
ents
. (1
) B
ond
prem
ium
/dis
coun
ts a
nd o
ther
una
mor
tized
cha
rges
are
incl
uded
. (2
) See
Tab
le 6
, Ass
esse
d V
alua
tion
and
Estim
ated
Mar
ket V
alue
of T
axab
le P
rope
rty, f
or E
stim
ated
Mar
ket V
alue
s of T
axab
le P
rope
rty.
(3) S
ee T
able
15,
Dem
ogra
phic
Sta
tistic
s, fo
r per
sona
l inc
ome
and
popu
latio
n da
ta.
Sour
ce:
Car
roll
Cou
nty
Dep
artm
ent o
f the
Com
ptro
ller.
159
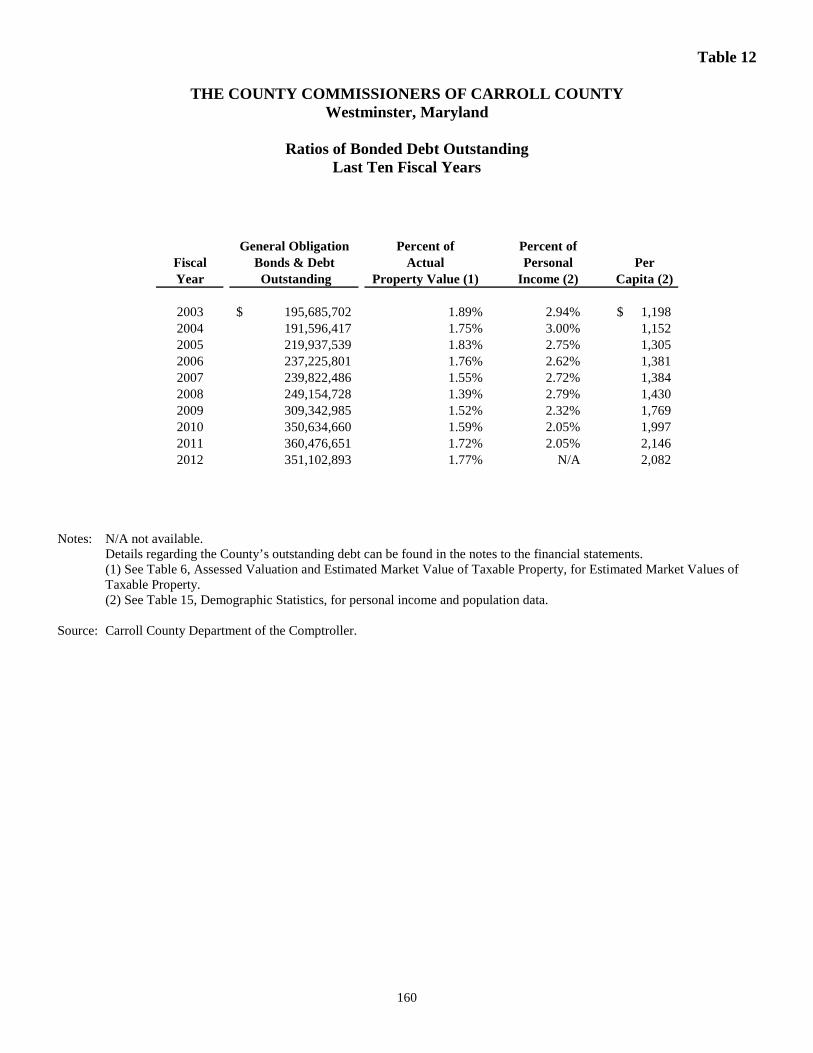
Table 12
THE COUNTY COMMISSIONERS OF CARROLL COUNTY Westminster, Maryland
Ratios of Bonded Debt Outstanding
Last Ten Fiscal Years
160
General Obligation Percent of Percent ofFiscal Bonds & Debt Actual Personal PerYear Outstanding Property Value (1) Income (2) Capita (2)
2003 195,685,702$ 1.89% 2.94% 1,198$ 2004 191,596,417 1.75% 3.00% 1,1522005 219,937,539 1.83% 2.75% 1,3052006 237,225,801 1.76% 2.62% 1,3812007 239,822,486 1.55% 2.72% 1,3842008 249,154,728 1.39% 2.79% 1,4302009 309,342,985 1.52% 2.32% 1,7692010 350,634,660 1.59% 2.05% 1,9972011 360,476,651 1.72% 2.05% 2,1462012 351,102,893 1.77% N/A 2,082
Notes: N/A not available.
Details regarding the County’s outstanding debt can be found in the notes to the financial statements. (1) See Table 6, Assessed Valuation and Estimated Market Value of Taxable Property, for Estimated Market Values of Taxable Property. (2) See Table 15, Demographic Statistics, for personal income and population data.
Source: Carroll County Department of the Comptroller.

Table 13
THE COUNTY COMMISSIONERS OF CARROLL COUNTY Westminster, Maryland
Computation of Legal Debt Margin
June 30, 2012
161
Net assessed value- Real Property 19,148,080,099$
Debt limit - 6% of net total assessed value (1) 1,148,884,806$
Assessed Value-Personal Property 665,495,920
Debt limit- 15% of Net Assessed Value (1) 99,824,388
Total Debt Limit (6%/15%) 1,248,709,194
Amount of debt applicable to debt limit:Total Bonded Debt 348,257,263$
Less- Agricultural Preservation Program Self Supporting Debt 27,129,920Less- Fire Company Loans- Self Supporting Debt 9,645,666Less - Bureau of Utilities bonds 18,422,077Less - Septage bonds 121,886
Total amount of debt applicable to debt limit 292,937,714
Legal debt margin 955,771,480$
Note: (1) Recommended limit - Carroll County does not have a legal debt limit.Source: Carroll County Department of the Comptroller.
Ratio of DebtSubject to Limitation
Legal Legal Debt Legal To LegalFiscal Assessed Debt Borrowing Subject to Debt BorrowingYear Value Limitation Limitation Limitation Margin Limitation
2003 10,340,867,012$ 6.0% 620,452,021$ 179,403,473$ 441,048,548$ 28.91%2004 10,948,754,959 6.0% 656,925,298 186,294,353 470,630,945 28.36%2005 12,034,458,190 6.0% 722,067,491 213,655,613 508,411,878 29.59%2006 13,470,143,079 6.0% 852,874,621 226,319,103 626,555,518 26.54%2007 15,441,306,101 6%/15% 974,208,067 211,725,319 762,482,748 21.73%2008 17,902,568,898 6%/15% 1,124,225,213 214,237,099 909,988,114 19.06%2009 20,409,412,280 6%/15% 1,274,735,984 268,496,244 1,006,239,740 21.06%2010 22,066,168,625 6%/15% 1,373,814,980 303,156,906 1,070,658,074 22.07%2011 20,895,165,478 6%/15% 1,302,726,361 301,960,750 1,000,765,611 23.18%2012 19,813,576,019 6%/15% 1,248,709,194 292,937,714 955,771,480 23.46%
Schedule of Legal Debt Margin2003-2012

Table 14 THE COUNTY COMMISSIONERS OF CARROLL COUNTY
Westminster, Maryland
Computation of Direct And Overlapping Debt June 30, 2012
162
Percent ofReal Assessed Pro rata Share Total
Property Valuation to of Direct Direct and Assessed Overlapping Debt to Overlapping Overlapping
Jurisdiction Valuation (1) Jurisdictions Jurisdicitons(2) Debt Debt
Hampstead 550,005,859$ 2.87% 8,407,312$ 1,818,194$ 10,225,506$ Manchester 440,582,855 2.30% 6,737,567 240,142 6,977,709Mt. Airy 813,745,814 4.25% 12,449,853 3,086,255 15,536,108New Windsor 135,842,218 0.71% 2,079,858 - 2,079,858Sykesville 365,148,624 1.91% 5,595,110 1,185,617 6,780,727Taneytown 620,842,196 3.24% 9,491,182 16,719,935 26,211,117Union Bridge 79,774,250 0.42% 1,230,338 1,498,055 2,728,393Westminster 1,839,844,568 9.61% 28,151,314 18,182,966 46,334,280Unincorporated areas 14,302,293,715 74.69% 218,795,181 - 218,795,181County-wide Totals 19,148,080,099$ 100.00% 292,937,715$ 42,731,164$ 335,668,879$
Note: (1) Assessed valuations of real property for each town are from the TASS 153 County report.
(2) See Table 13, Computation of Legal Debt Margin.
Source: Carroll County Department of the Comptroller. Incorporated Municipalities.

Table 15 THE COUNTY COMMISSIONERS OF CARROLL COUNTY
Westminster, Maryland
Demographic Statistics Last Ten Fiscal Years
163
PersonalIncome Per Capita School Unemployment
Fiscal Population ($ in thous.) Personal Income Enrollment RateYear (1) (2) (2) (3) (4)
2003 163,400 5,434,074$ 35,259$ 28,630 3.16%2004 166,234 5,754,673 36,318 29,044 3.20%2005 168,521 6,046,616 36,318 28,774 3.50%2006 171,742 6,209,401 36,874 28,219 3.00%2007 173,208 6,516,268 38,694 28,575 3.70%2008 174,249 6,944,986 41,147 28,261 3.80%2009 174,909 7,176,136 42,264 27,745 6.60%2010 167,134 7,192,191 44,247 27,524 6.50%2011 167,929 7,400,133 N/A 27,201 6.80%2012 168,570 N/A N/A 26,937 6.60%
Source: (1) Carroll County Department of Land Use, Planning and Development, June 2012. FY 2010 reflects the 2010 Census data. Fiscal years prior to FY 2010 are estimates. (2) Maryland Department of Planning, Planning Data Services, from U.S. Bureau of Economic Analysis, April 2012. (3) Carroll County Board of Education Approved Operating Budget Fiscal Year 2011-2012. (4) Maryland Department of Labor, Licensing and Regulation, Office of Labor Market Analysis and Information. .

Table 16 THE COUNTY COMMISSIONERS OF CARROLL COUNTY
Westminster, Maryland
Major Employers Current Fiscal Year and Nine Years Ago
164
PercentageTotal of Total County
Firm Product/Service Employment * EmploymentBoard of Education of Carroll County ** Elementary and secondary school systems 3,757 6.95%Carroll Hospital Center General hospital 1,696 3.14%Springfield Hospital Center Mental health services 833 1.54%Random House Book Warehousing & Distribution 800 1.48%Fairhaven (Episcopal Ministries) Life care retirement community 700 1.30%McDaniel College Higher education 641 1.19%Jos. A. Bank Clothiers Corporate HQ/ Distribution 612 1.13%Carroll County Government*** Local government 593 1.10%Carroll Communinty College Higher education 509 0.94%Carroll Lutheran Village Retirement/Assisted Living 437 0.81%
Total 10,578 19.58%
Annual Average Employment in Carroll County**** 54,037
PercentageTotal of Total County
Firm Product/Service Employment EmploymentBoard of Education of Carroll County ** Elementary and secondary school systems 3,062 6.08%Carroll County General Hospital General hospital 1,344 2.67%Random House, Inc. Book warehouseing and distribution 1,080 2.15%Carroll County Government *** Local government central office 850 1.69%Springfield Hospital center Mental health services 790 1.57%McDaniel College Higher Education 576 1.14%Fairhaven (Episcopal Ministries) Life care retirement community 550 1.09%English American Tailoring Men & women's made-to-measure clothing 450 0.89%Northrop Grumman Electronic testing 435 0.86%Charles J. Miller, Inc. Asphalt excavation & paving contractor 314 0.62%
Total 9,451 18.78%
Annual Average Employment in Carroll County 50,330
2012
2003
Notes: * As of September 2010.
** Does not include hourly employees such as substitutes, aides, etc. *** Central offices only. Excludes Sheriff’s Department, Courts, etc. **** As of June 2011.
Source: Carroll County Department of Economic Development. The County’s Annual Average Employment is from the Maryland Department of Labor, Licensing and Regulation Annual Employment and Payroll Reports.
Carroll County Department of the Comptroller. Carroll County Department of Land Use, Planning and Development

Table 17
THE COUNTY COMMISSIONERS OF CARROLL COUNTY Westminster, Maryland
Full-Time County Employees by Function/Program Last Ten Fiscal Years
165
* Denotes departments affected by reorganizations. Source: Department of the Comptroller
Function/program 2012 2011 2010 2009 2008 2007 2006 2005 2004 2003General Government
County CommissionersLegislative 5 9 9 8 9 11 10 12 8 11
* Licenses/Zoning Appeals Board - - - - - - 4 5 5 4 Public Information - - 2 2 2 2 3 2 - -
* Farm Museum - - 7 9 10 10 10 9 9 9 * Airport Management - - 2 2 3 2 2 2 1 1
Judicial 68 69 73 75 73 72 65 56 56 60County Attorney 10 10 10 10 10 10 10 10 10 10Comptroller 34 34 35 36 37 37 36 35 37 36Administrative Services
Administrative Serives- Admin - 1 - - - - - - - - Human Resources and Personnel Svcs 12 13 13 16 17 17 17 18 18 18Management Analysis - 1 1 2 2 2 3 3 3 3TV Production 2 2 2 1 1 1 - - - - Production & Distribution Svcs 3 3 3 3 3 3 3 3 3 3 Dept of Technology Services 25 25 25 25 27 25 24 25 25 25
Management and Budget 15 14 16 18 16 18 17 16 17 16Land Use, Planning and Development 46 43 43 43 45 42 45 44 44 43
* General Services - - 103 118 127 122 114 112 112 112Citizen Services 48 48 45 54 56 51 51 44 45 47
* Recreation and Parks 31 31 22 27 27 27 27 16 16 15Public Safety
Sheriff Services 230 211 204 209 197 196 186 171 166 158Emergency Services 37 30 31 32 36 35 34 31 30 28
Public Works* Supervision & Administration 3 2 2 4 4 4 6 5 - 6* Building Construction 2 2 - - - - - - - - * Facilities 47 48 - - - - - - - - * Fleet 23 24 - - - - - - - - * Permits 22 22 - - - - - - - - * Airport 1 1 - - - - - - - -
Roads 100 99 97 105 112 108 103 107 116 111* Engineering 18 19 20 22 23 21 22 22 23 22* Bureau of Utilities-Operations 33 33 32 33 34 30 29 28 28 27 * Solid Waste-Operations 20 20 19 20 20 20 21 20 20 17
Social Services 17 17 16 16 15 15 15 14 14 13Education 1 1 1 1 1 1 1 11 12 9Conservation of Natural Resources
Soil Conservation Service 6 6 5 5 6 6 6 6 6 6Economic Development
Economic Development 6 6 6 7 7 7 7 7 7 7BERC 9 9 10 8 8 10 10 10 10 10Tourism 1 1 1 2 2 2 2 2 2 2
Total Full Time Employee Totals 875 854 855 913 930 907 883 846 843 829Part Time Employees 5 5 8 12 14 15 17 24 27 26
Total Employees 880 859 863 925 944 922 900 870 870 855

Tab
le 1
8 T
HE
CO
UN
TY
CO
MM
ISSI
ON
ER
S O
F C
AR
RO
LL
CO
UN
TY
W
estm
inst
er, M
aryl
and
Ope
ratin
g In
dica
tors
by
Func
tion/
Prog
ram
2012
2011
2010
2009
2008
2007
2006
2005
2004
2003
Gen
eral
Info
rmat
ion
Popu
latio
n16
8,57
016
7,92
916
7,13
417
4,90
917
4,24
917
3,20
817
1,74
216
8,52
116
6,23
416
3,40
0R
egis
tere
d V
oter
s11
2,93
111
2,68
811
0,33
610
9,42
810
6,82
810
6,85
310
4,31
810
2,50
595
,056
90,7
56G
ener
al G
over
nmen
tB
uild
ing
Perm
its Is
sued
for R
esid
entia
l24
618
720
115
925
533
566
164
073
11,
177
Est
imat
ed V
alue
($ in
thou
sand
s) R
esid
entia
l40
,741
$
31
,803
$
32
,699
$
26
,308
$
44
,316
$
57
,126
$
11
8,03
7$
11
5,25
2$
13
1,53
8$
189,
913
$
B
uild
ing
Perm
its Is
sued
for o
ther
pur
pose
s1,
826
1,82
81,
745
1,90
82,
534
2,72
73,
244
3,17
33,
615
3,02
1E
stim
ated
Val
ue ($
in th
ousa
nds)
Oth
er71
,994
$
66
,314
$
52
,397
$
10
8,86
1$
17
7,72
9$
10
2,78
1$
13
8,17
1$
12
6,44
8$
12
4,70
3$
102,
082
$
Fi
re a
nd E
mer
genc
y Se
rvic
ePa
id F
irem
en12
012
011
511
511
292
8592
4242
Act
ive
Vol
unte
ers
(est
imat
ed)
714
714
704
663
675
675
750
800
800
1,10
0D
ispa
tche
d In
cide
nce
18,4
8818
,216
18,0
8117
,848
17,5
8416
,357
15,9
6915
,104
15,4
7014
,507
911
Cal
ls R
ecei
ved
60,0
3760
,752
59,5
6561
,140
59,1
8657
,761
55,9
2355
,375
55,8
2957
,381
Polic
e Pr
otec
tion
Res
iden
t Tro
oper
s30
4646
4646
4645
4546
46Sh
erif
f's D
epar
tmen
t87
6464
6466
6464
5654
46C
itatio
ns/W
arni
ngs
16,9
4016
,551
15,8
4517
,805
14,8
0216
,551
16,2
8013
,451
8,45
27,
506
911
Cal
ls fo
r Ser
vice
18,2
9318
,293
18,2
9317
,721
12,7
796,
083
6,15
88,
109
5,66
53,
712
Det
entio
n C
ente
rD
eten
tion
Cen
ter O
ffic
ers
9292
9295
9393
9090
8886
Tot
al P
riso
ner D
ays
84,7
3993
,252
92,1
4410
0,43
098
,155
107,
711
104,
874
103,
285
105,
415
110,
047
Wat
er Dai
ly A
vera
ge U
sage
(mgd
)2.
282.
072.
052.
082.
182.
162.
342.
172.
402.
19Pl
ants
Dai
ly C
apac
ity (m
gd)
7.39
7.39
7.39
7.39
3.39
3.39
3.39
3.39
3.39
N/A
Was
tew
ater
Dai
ly A
vera
ge U
sage
(mgd
)2.
862.
832.
712.
592.
952.
892.
743.
343.
12N
/APl
ants
Dai
ly C
apac
ity (m
gd)
4.45
4.45
4.45
4.45
4.45
4.45
4.45
4.45
4.45
N/A
Solid
Was
teT
ons
In10
1,61
610
5,68
385
,942
81,4
4710
0,19
510
8,60
811
6,26
711
0,17
811
8,72
610
7,70
7T
ons
Rec
ycle
d30
,587
30,1
5420
,155
20,3
2220
,652
21,0
8021
,533
21,6
2513
,023
12,8
11T
ons
into
Lan
dfill
12,8
0913
,588
11,5
7612
,370
14,0
518,
969
13,4
6615
,276
16,4
4516
,127
Ton
s T
rans
ferr
ed87
,153
91,3
0674
,364
69,0
7886
,144
100,
028
105,
660
97,0
0910
4,15
691
,580
Edu
catio
nN
umbe
r of T
each
ers
2,16
32,
198
2,20
92,
251
2,20
92,
375
2,11
62,
021
1,96
31,
957
Num
ber o
f Stu
dent
s26
,937
27,2
0127
,524
27,7
4528
,261
28,5
7528
,219
28,7
7429
,044
28,6
30C
omm
unity
Col
lege
Full
Tim
e E
quiv
alen
t Stu
dent
s (F
TE
's)3,
173
3,34
73,
138
2,92
02,
867
2,51
72,
519
2,49
32,
430
2,26
6Fa
culty
-Ful
l Tim
e79
7773
7563
6365
5255
50Fa
culty
-Par
t Tim
e29
658
052
754
514
341
724
934
928
827
7A
irpo
rt Fuel
Sal
es (g
als)
279,
664
304,
837
255,
099
280,
319
471,
700
503,
574
574,
155
618,
180
408,
866
208,
790
Tie
Dow
ns O
ccup
ied
1525
2525
2525
2525
2525
Cor
pora
te H
anga
rs O
ccup
ied
77
66
67
77
64
T H
anga
rs O
ccup
ied
8282
8282
8282
8282
8282
Lib
rari
esN
umbe
r of v
olum
es (e
stim
ated
)54
8,74
957
0,74
255
2,89
255
1,37
651
7,23
951
1,02
655
3,82
458
4,16
755
2,78
656
7,63
1C
ircu
latio
n4,
402,
122
4,29
5,26
44,
214,
073
3,88
5,58
43,
606,
169
3,42
1,82
83,
579,
244
3,50
6,22
93,
583,
119
3,46
5,52
6Se
nior
Cen
ters
Out
side
Gro
ups
usin
g fa
cilit
ies
2,00
7
3,
213
2,51
6
2,
922
3,15
6
3,
133
2,97
63,
009
2,82
22,
025
Vol
unte
er H
ours
per
form
ed a
t Cen
ters
49,5
18
44,6
89
41,4
93
39,3
11
39,3
52
42,9
5743
,051
39,1
3636
,331
36,2
07M
eals
Ser
ved
30,4
46
33,2
97
29,1
71
26,0
20
25,1
88
27,2
4229
,145
30,4
7031
,346
31,3
83Se
nior
s A
ttend
ing
Act
iviti
es27
1,71
6
24
1,74
9
24
3,22
6
15
9,51
8
12
9,63
5
17
3,70
716
0,41
615
7,62
314
9,89
211
7,99
3
N/A
:
Info
rmat
ion
is n
ot a
vaila
ble
for t
he y
ears
indi
cate
d.
166

Tab
le 1
9 T
HE
CO
UN
TY
CO
MM
ISSI
ON
ER
S O
F C
AR
RO
LL
CO
UN
TY
W
estm
inst
er, M
aryl
and
Cap
ital A
sset
Sta
tistic
s by
Func
tion/
Prog
ram
2012
2011
2010
2009
2008
2007
2006
2005
2004
2003
Gen
eral
Inf
orm
atio
nA
rea
in S
quar
e M
iles
455.
5245
5.52
455.
5245
5.52
455.
5245
5.52
455.
5245
5.52
455.
5245
5.52
Mil
es o
f R
oads
Pav
ed89
989
689
689
389
188
888
688
088
087
4M
iles
of
Roa
ds U
npav
ed80
8383
8486
8789
9292
92N
umbe
r of
Bri
dges
145
139
147
147
147
147
147
146
146
146
Acr
es in
Agr
icul
tura
l Lan
d
P
rese
rvat
ion
62,0
7860
,002
57,6
2754
,858
50,7
1146
,998
46,7
3741
,927
41,9
2739
,766
Fir
e an
d E
mer
genc
y S
ervi
ceS
tati
ons
1414
1414
1414
1414
1414
Wat
er Wat
er M
ains
(m
iles
)13
913
913
913
513
513
413
413
313
213
0T
reat
men
t Pla
nts
44
44
44
44
44
Wat
er T
anks
66
66
66
66
66
Num
ber
of C
usto
mer
Acc
ount
s8,
382
8,32
38,
268
8,25
68,
247
8,23
08,
163
8,11
78,
036
7,89
8W
aste
wat
erS
ewer
Mai
ns (
mil
es)
125
125
125
125
122
121
121
120
119
119
Tre
atm
ent P
lant
s4
44
44
44
44
4P
umpi
ng S
tati
ons
1818
1818
1818
1818
1817
Num
ber
of C
usto
mer
Acc
ount
s8,
953
8,89
18,
844
8,81
68,
793
8,76
68,
745
8,70
28,
620
8,33
6S
olid
Was
teA
ctiv
e L
andf
ills
11
11
11
11
11
Rec
reat
ion
and
Cul
ture
Par
ks (
1)32
3129
2827
2727
2619
19A
crea
ge4,
773
4,62
94,
652
4,47
84,
478
4,47
84,
478
4,47
54,
311
4,31
1E
duca
tion
Ele
men
tary
2323
2323
2322
2222
2121
Mid
dle
99
99
99
99
99
Hig
h8
88
87
77
77
7V
ocat
iona
l tec
hnic
al2
22
22
22
22
2S
peci
al/A
lter
nati
ve E
duca
tion
22
22
22
22
22
Col
lege
11
11
11
11
11
Air
port Run
way
(fe
et)
5,10
05,
100
5,10
05,
100
5,10
05,
100
5,10
05,
100
5,10
05,
100
T H
anga
rs A
vail
able
8282
8282
8282
8282
8282
Cor
pora
te H
anga
rs A
vail
able
77
77
77
77
77
Tie
Dow
ns A
vail
able
5252
5252
5252
5252
3232
Apr
on A
rea
(acr
es)
14.6
14.6
14.6
14.6
14.6
14.6
14.6
14.6
12.6
12.6
Fir
earm
s F
acil
ity
11
11
11
11
11
Lib
rari
es6
66
65
55
55
5S
enio
r C
ente
rs5
55
55
55
55
5
Not
e: (
1) In
clud
es tw
o pr
opos
ed re
serv
oirs
. So
urce
: C
arro
ll C
ount
y G
over
nmen
t.
167

Tab
le 2
0 T
HE
CO
UN
TY
CO
MM
ISSI
ON
ER
S O
F C
AR
RO
LL
CO
UN
TY
W
estm
inst
er, M
aryl
and
B
urea
u of
Util
ities
- R
even
ue a
nd E
xpen
ses
L
ast T
en F
isca
l Yea
rs
20
1220
1120
1020
0920
0820
0720
0620
0520
0420
03
Rev
enue
Usa
ge c
harg
es8,
312,
844
$
8,
446,
852
$
7,
620,
404
$
7,
328,
198
$
7,
305,
990
$
7,
119,
000
$
6,
076,
750
$
5,
573,
113
$
5,
465,
151
$
4,
323,
926
$
Serv
ice
char
ges
798
11,8
384,
680
421
54,9
9164
,593
56,6
6619
,790
26,7
4516
,959
Pena
lties
and
inte
rest
179,
147
382,
493
209,
239
442,
379
1,81
5,89
11,
526,
835
1,05
0,68
21,
257,
886
697,
697
1,02
3,82
2O
pera
ting
trans
fer -
Cou
nty
199,
511
(305
,031
)20
0,20
020
6,98
062
9,85
021
2,00
013
8,31
0(6
0,68
0)12
2,40
51,
439,
075
Cap
ital c
ontri
butio
ns
(1
)33
5,17
452
3,77
642
6,56
375
,395
855,
655
291,
282
389,
700
5,74
4,16
81,
038,
337
743,
641
Mai
nten
ance
fee
1,44
3,77
41,
438,
797
1,43
2,61
01,
428,
013
1,42
7,78
21,
421,
568
850,
713
836,
795
447,
729
621,
151
Oth
er17
6,53
017
2,04
021
7,95
719
0,94
030
7,02
216
0,87
714
8,24
315
2,21
421
8,52
315
9,13
3To
tal r
even
ue10
,647
,778
10,6
70,7
6510
,111
,653
9,67
2,32
612
,397
,181
10,7
96,1
558,
711,
064
13,5
23,2
868,
016,
587
8,32
7,70
7
Expe
nses
Sala
ries
2,35
8,99
42,
341,
948
2,39
4,03
32,
499,
181
2,24
1,16
22,
027,
979
1,99
6,37
21,
828,
934
1,75
9,62
51,
660,
311
Ope
ratin
g ex
pens
es5,
605,
458
6,28
0,38
95,
129,
427
3,15
7,88
35,
652,
991
3,86
1,16
03,
506,
230
6,72
2,88
22,
583,
989
2,73
2,12
6D
epre
ciat
ion
2,26
6,86
32,
275,
618
1,91
4,76
81,
579,
651
1,53
4,08
81,
515,
493
1,51
0,27
61,
340,
581
1,19
7,16
11,
223,
787
Inte
rest
859,
153
992,
506
1,05
1,41
793
2,54
262
8,30
540
6,98
049
8,11
059
4,23
464
4,07
170
6,45
1To
tal e
xpen
se11
,090
,468
11,8
90,4
6110
,489
,645
8,16
9,25
710
,056
,546
7,81
1,61
27,
510,
988
10,4
86,6
316,
184,
846
6,32
2,67
5
Exce
ss (d
efic
ienc
y) o
fre
venu
e ov
er (u
nder
) exp
ense
:(4
42,6
90)
$
(1,2
19,6
96)
$
(3
77,9
92)
$
1,50
3,06
9$
2,34
0,63
5$
2,98
4,54
3$
1,20
0,07
6$
3,03
6,65
5$
1,83
1,74
1$
2,00
5,03
2$
N
ote:
(1
) Ado
ptio
n of
GA
SB 3
3 re
quire
s all
capi
tal c
ontri
butio
ns b
e
treat
ed a
s rev
enue
and
pre
sent
ed se
para
tely
with
in th
e fin
anci
al st
atem
ents
. So
urce
: C
arro
ll C
ount
y D
epar
tmen
t of t
he C
ompt
rolle
r.
168
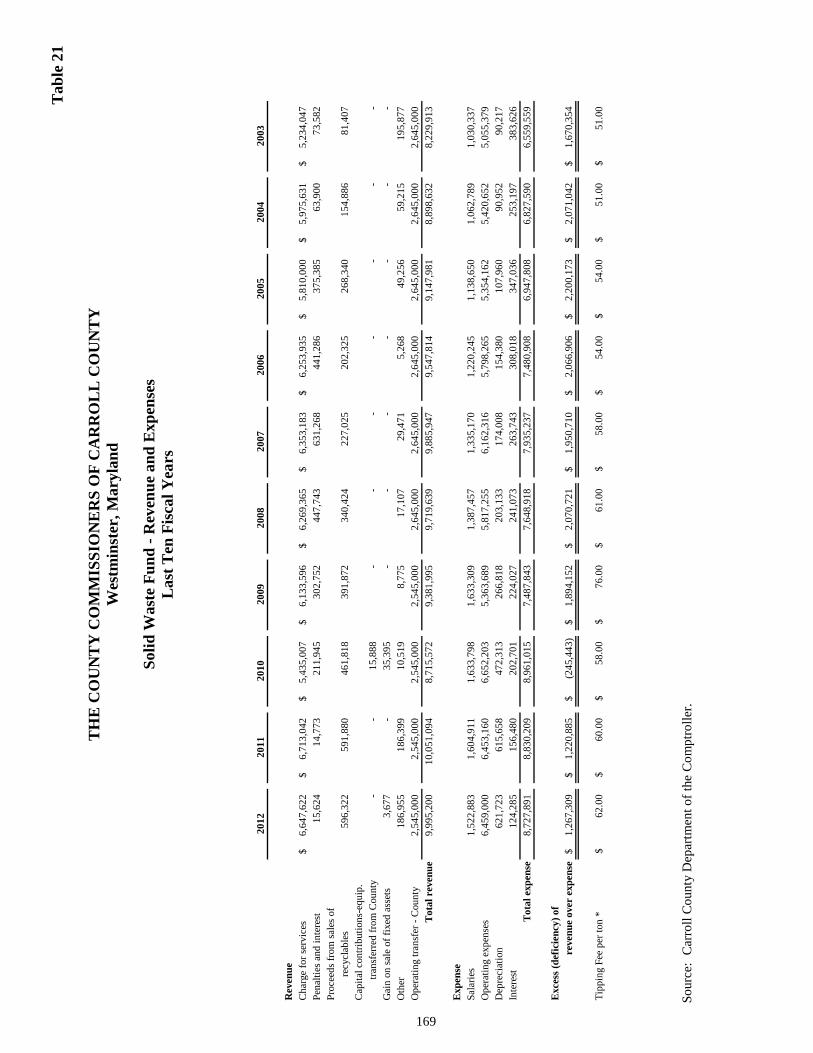
Tab
le 2
1 T
HE
CO
UN
TY
CO
MM
ISSI
ON
ER
S O
F C
AR
RO
LL
CO
UN
TY
W
estm
inst
er, M
aryl
and
So
lid W
aste
Fun
d - R
even
ue a
nd E
xpen
ses
Las
t Ten
Fis
cal Y
ears
2012
2011
2010
2009
2008
2007
2006
2005
2004
2003
Rev
enue
Cha
rge
for s
ervi
ces
6,64
7,62
2$
6,71
3,04
2$
5,43
5,00
7$
6,13
3,59
6$
6,26
9,36
5$
6,35
3,18
3$
6,25
3,93
5$
5,81
0,00
0$
5,97
5,63
1$
5,23
4,04
7$
Pena
lties
and
inte
rest
15,6
2414
,773
211,
945
302,
752
447,
743
631,
268
441,
286
375,
385
63,9
0073
,582
Proc
eeds
from
sale
s of
re
cycl
able
s59
6,32
259
1,88
046
1,81
839
1,87
234
0,42
422
7,02
520
2,32
526
8,34
015
4,88
681
,407
Cap
ital c
ontri
butio
ns-e
quip
.
t
rans
ferre
d fro
m C
ount
y-
-
15
,888
-
-
-
-
-
-
-
G
ain
on sa
le o
f fix
ed a
sset
s3,
677
-
35,3
95-
-
-
-
-
-
-
Oth
er18
6,95
5
18
6,39
9
10
,519
8,77
517
,107
29,4
715,
268
49,2
5659
,215
195,
877
Ope
ratin
g tra
nsfe
r - C
ount
y2,
545,
000
2,54
5,00
02,
545,
000
2,54
5,00
02,
645,
000
2,64
5,00
02,
645,
000
2,64
5,00
02,
645,
000
2,64
5,00
0T
otal
rev
enue
9,99
5,20
010
,051
,094
8,71
5,57
29,
381,
995
9,71
9,63
99,
885,
947
9,54
7,81
49,
147,
981
8,89
8,63
28,
229,
913
Exp
ense
Sala
ries
1,52
2,88
31,
604,
911
1,63
3,79
81,
633,
309
1,38
7,45
71,
335,
170
1,22
0,24
51,
138,
650
1,06
2,78
91,
030,
337
Ope
ratin
g ex
pens
es6,
459,
000
6,45
3,16
06,
652,
203
5,36
3,68
95,
817,
255
6,16
2,31
65,
798,
265
5,35
4,16
25,
420,
652
5,05
5,37
9D
epre
ciat
ion
621,
723
615,
658
472,
313
266,
818
203,
133
174,
008
154,
380
107,
960
90,9
5290
,217
Inte
rest
124,
285
156,
480
202,
701
224,
027
241,
073
263,
743
308,
018
347,
036
253,
197
383,
626
Tot
al e
xpen
se8,
727,
891
8,83
0,20
98,
961,
015
7,48
7,84
37,
648,
918
7,93
5,23
77,
480,
908
6,94
7,80
86,
827,
590
6,55
9,55
9
Exc
ess (
defic
ienc
y) o
fre
venu
e ov
er e
xpen
se1,
267,
309
$
1,
220,
885
$
(2
45,4
43)
$
1,
894,
152
$
2,
070,
721
$
1,
950,
710
$
2,
066,
906
$
2,
200,
173
$
2,
071,
042
$
1,
670,
354
$
Tipp
ing
Fee
per t
on *
62.0
0$
60.0
0$
58.0
0$
76.0
0$
61.0
0$
58.0
0$
54.0
0$
54.0
0$
51.0
0$
51.0
0$
So
urce
: C
arro
ll C
ount
y D
epar
tmen
t of t
he C
ompt
rolle
r.
169

Tab
le 2
2 T
HE
CO
UN
TY
CO
MM
ISSI
ON
ER
S O
F C
AR
RO
LL
CO
UN
TY
W
estm
inst
er, M
aryl
and
A
irpo
rt F
und
- Rev
enue
and
Exp
ense
s
Las
t Ten
Fis
cal Y
ears
2012
2011
2010
2009
2008
2007
2006
2005
2004
2003
Rev
enue
Ren
t58
8,93
2$
61
1,16
7$
46
2,98
1$
47
0,01
1$
49
5,27
8$
45
0,74
9$
51
7,73
2$
47
2,53
9$
35
3,76
3$
15
6,53
3$
Fuel
sale
s61
,685
64,0
1653
,570
197,
646
1,71
5,51
01,
378,
850
1,52
3,72
61,
268,
475
662,
347
354,
796
Cap
ital c
ontri
butio
ns
(1
)23
3,64
611
1,22
048
,969
460,
454
91,5
9836
6,57
234
8,85
81,
288,
611
511,
521
315,
834
Cap
ital c
ontri
butio
ns-C
ount
y-
-
-
-
-
5,60
3,37
2-
-
-
-
Land
sale
-
-
-
-
-
1,
064,
797
-
-
-
25
,000
Ope
ratin
g tra
nsfe
r-Cou
nty
-
-
-
40
,000
40,0
0040
,000
83,0
2044
,053
58,1
7614
2,40
5O
ther
4369
12,
030
3,60
111
,222
10,8
50-
3,79
6-
-
Tota
l rev
enue
884,
306
787,
094
567,
550
1,17
1,71
22,
353,
608
8,91
5,19
02,
473,
336
3,07
7,47
41,
585,
807
994,
568
Expe
nses
Sala
ries
188,
612
212,
539
247,
203
256,
173
236,
788
184,
513
182,
310
159,
740
96,7
2582
,472
Ope
ratin
g ex
pens
es1,
312,
582
124,
103
308,
329
267,
209
2,35
9,95
81,
612,
527
1,56
2,77
41,
431,
899
832,
208
333,
430
Ope
ratin
g ex
pens
es-c
apita
l (2)
-
15
,892
-
-
25
5,40
036
,061
227,
795
137,
850
-
36
7,33
0In
tere
st84
,437
93,9
6010
4,35
011
3,32
712
2,04
413
0,09
213
8,74
114
4,32
313
2,13
713
3,17
9D
epre
ciat
ion
183,
140
171,
551
169,
729
140,
983
123,
428
123,
428
123,
428
118,
050
23,7
9224
,029
Ope
ratin
g tra
nsfe
r-Cou
nty
-
-
-
-
-
41
,446
-
-
-
-
To
tal e
xpen
se1,
768,
771
618,
045
829,
611
777,
692
3,09
7,61
82,
128,
067
2,23
5,04
81,
991,
862
1,08
4,86
294
0,44
0
Exce
ss (d
efic
ienc
y) o
f
rev
enue
ove
r ex
pens
e:(8
84,4
65)
$
16
9,04
9$
(2
62,0
61)
$
39
4,02
0$
(7
44,0
10)
$
6,
787,
123
$
23
8,28
8$
1,
085,
612
$
50
0,94
5$
54
,128
$
(1)
Cap
ital c
ontri
butio
ns in
clud
e re
imbu
rsem
ents
from
the
Fede
ral A
viat
ion
Adm
inis
tratio
n
a
nd th
e M
aryl
and
Avi
atio
n A
dmin
istra
tion.
(2)
Ope
ratin
g ex
pens
e re
imbu
rsed
by
the
Fede
ral A
viat
ion
Adm
inst
ratio
n an
d th
e M
aryl
and
Avi
atio
n A
dmin
stra
tion.
N
ote:
(1
) Ado
ptio
n of
GA
SB 3
3 re
quire
s all
capi
tal c
ontri
butio
ns b
e tre
ated
as r
even
ue a
nd p
rese
nted
sepa
rate
ly w
ithin
the
finan
cial
stat
emen
ts.
Sour
ce:
Car
roll
Cou
nty
Dep
artm
ent o
f the
Com
ptro
ller.

Tab
le 2
3 T
HE
CO
UN
TY
CO
MM
ISSI
ON
ER
S O
F C
AR
RO
LL
CO
UN
TY
W
estm
inst
er, M
aryl
and
Ret
ired
Mem
bers
of t
he C
arro
ll C
ount
y Pe
nsio
n Pl
an b
y T
ype
of B
enef
it A
s of J
une
30, 2
012
Am
ount
of
# of
Ret
ired
M
onth
ly B
enef
itM
embe
rs1
23
4U
nmod
AB
CD
ED
efer
red
168
$ 1
- $2
5045
414
166
1110
2 2
51 -
500
5951
62
206
718
17
501
- 75
022
175
34
75
12
751
- 1
000
86
22
21
12
Ove
r 1
,000
11
1
Typ
e of
Ret
irem
ent
Opt
ion
Sele
cted
1 -
Nor
mal
Ret
irem
ent f
or a
ge a
nd/o
r se
rvic
eU
nmod
ifie
d L
ife
Ann
uity
, mem
ber
only
2 -
Ear
ly R
etir
emen
tA
- B
enef
icia
ry r
ecei
ves
lum
p su
m o
f un
used
con
trib
utio
ns3
- B
enef
icia
ry P
aym
ent,
norm
al o
r ea
rly
retir
emen
tB
- L
ife
Ann
uity
of
mem
ber,
with
ten
year
s ce
rtai
n an
d co
ntin
uous
4 -
Ben
efic
iary
Pay
men
t, de
ath
in s
ervi
ce
C -
Ben
efic
iary
rec
eive
s 10
0 pe
rcen
t of
mem
ber's
red
uced
mon
thly
ben
efit
D -
Ben
efic
iary
rec
eive
s 75
per
cent
of
mem
ber's
red
uced
mon
thly
ben
efit
E -
Ben
efic
iary
rec
eive
s 50
per
cent
of
mem
ber's
red
cued
mon
thly
ben
efit
Typ
e of
Ret
irem
ent
Opt
ion
Sele
cted
So
urce
: D
epar
tmen
t of H
uman
Res
ourc
es.
171

Table 24
THE COUNTY COMMISSIONERS OF CARROLL COUNTY Westminster, Maryland
Carroll County Employee Pension Plan
Average Benefit Payments Last Nine Fiscal Years
172
Retirement Effective Date 0 - 5 5 - 10 10 - 15 15 - 20 20 - 25 25 - 30
Period 7/1/03 to 6/30/04Average Monthly Benefit -$ -$ 215$ 228$ -$ -$ Average Final Monthly Salary -$ -$ 2,576$ 2,093$ -$ -$ Number of Retired Members - - 3 1 - -
Period 7/1/04 to 6/30/05Average Monthly Benefit 51$ 99$ 182$ 312$ -$ -$ Average Final Monthly Salary 2,102$ 2,090$ 2,238$ 2,809$ -$ -$ Number of Retired Members 1 3 5 2 - -
Period 7/1/05 to 6/30/06Average Monthly Benefit 51$ 333$ 1,685$ 2,199$ 1,225$ -$ Average Final Monthly Salary 2,102$ 1,872$ 2,373$ 3,151$ 2,839$ -$ Number of Retired Members 1 4 9 9 6 -
Period 7/1/06 to 6/30/07Average Monthly Benefit 70$ 370$ 1,773$ 4,959$ 2,407$ -$ Average Final Monthly Salary 1,675$ 1,872$ 2,373$ 3,553$ 2,858$ -$ Number of Retired Members 2 4 9 15 8 -
Period 7/1/07 to 6/30/08Average Monthly Benefit 137$ 447$ 2,125$ 6,625$ 4,404$ -$ Average Final Monthly Salary 2,065$ 1,939$ 2,572$ 3,498$ 3,385$ -$ Number of Retired Members 4 5 12 18 13 -
Period 7/1/08 to 6/30/09Average Monthly Benefit 198$ 934$ 3,207$ 9,320$ 6,777$ -$ Average Final Monthly Salary 2,065$ 2,605$ 2,705$ 3,457$ 3,365$ -$ Number of Retired Members 4 7 14 25 17 -
Period 7/1/09 to 6/30/10Average Monthly Benefit 206$ 1,276$ 4,144$ 11,327$ 10,647$ 609$ Average Final Monthly Salary 1,879$ 3,030$ 2,706$ 3,631$ 3,574$ 3,544$ Number of Retired Members 5 11 19 30 30 1
Period 7/1/10 to 6/30/11Average Monthly Benefit 518$ 1,736$ 5,999$ 13,356$ 17,581$ 622$ Average Final Monthly Salary 2,314$ 2,909$ 2,849$ 3,886$ 3,649$ 3,544$ Number of Retired Members 9 15 26 32 36 1
Period 7/1/11 to 6/30/12Average Monthly Benefit 822$ 2,499$ 8,352$ 15,819$ 19,982$ 762$ Average Final Monthly Salary 2,512$ 2,992$ 2,963$ 3,856$ 3,685$ 3,620$ Number of Retired Members 11 19 31 34 38 2
Years of Credited Service
Carroll County Employee Pension Plan was established during fiscal year 2004. Source: Department of Human Resources.

Tab
le 2
5 T
HE
CO
UN
TY
CO
MM
ISSI
ON
ER
S O
F C
AR
RO
LL
CO
UN
TY
W
estm
inst
er, M
aryl
and
Ret
ired
Mem
bers
of t
he C
arro
ll C
ount
y C
ertif
ied
Law
Off
icer
s Pen
sion
Pla
n by
Typ
e of
Ben
efit
As o
f Jun
e 30
, 201
2
Am
ount
of
# of
Ret
ired
M
onth
ly B
enef
itM
embe
rs1
23
4U
nmod
AB
CD
ED
efer
red
1$
1 -
$250
0 2
51 -
500
0 5
01-
750
11
1 7
51 -
100
00
Ove
r 1
,000
11
1
Typ
e of
Ret
irem
ent
Opt
ion
Sele
cted
1 -
Nor
mal
Ret
irem
ent f
or a
ge a
nd/o
r se
rvic
eU
nmod
ifie
d L
ife
Ann
uity
, mem
ber
only
2 -
Ear
ly R
etir
emen
tA
- B
enef
icia
ry r
ecei
ves
lum
p su
m o
f un
used
con
trib
utio
ns3
- B
enef
icia
ry P
aym
ent,
norm
al o
r ea
rly
retir
emen
tB
- L
ife
Ann
uity
of
mem
ber,
with
ten
year
s ce
rtai
n an
d co
ntin
uous
4 -
Ben
efic
iary
Pay
men
t, de
ath
in s
ervi
ce
C -
Ben
efic
iary
rec
eive
s 10
0 pe
rcen
t of
mem
ber's
red
uced
mon
thly
ben
efit
D -
Ben
efic
iary
rec
eive
s 75
per
cent
of
mem
ber's
red
uced
mon
thly
ben
efit
E -
Ben
efic
iary
rec
eive
s 50
per
cent
of
mem
ber's
red
cued
mon
thly
ben
efit
Typ
e of
Ret
irem
ent
Opt
ion
Sele
cted
So
urce
: D
epar
tmen
t of H
uman
Res
ourc
es.
173

Table 26
THE COUNTY COMMISSIONERS OF CARROLL COUNTY Westminster, Maryland
Carroll County Certified Law Officer’s Pension
Average Benefit Payments As of June 30, 2012
174
Retirement Effective Date 0 - 5 5 - 10 10 - 15 15 - 20 20 - 25 25 - 30
Period 7/1/09 to 6/30/10Average Monthly Benefit -$ -$ 354$ -$ -$ 911$ Average Final Monthly Salary -$ -$ 5,059$ -$ -$ 4,488$ Number of Retired Members - - 1 - - 1
Period 7/1/10 to 6/30/11Average Monthly Benefit -$ -$ 709$ -$ -$ 1,366$ Average Final Monthly Salary -$ -$ 5,059$ -$ -$ 4,488$ Number of Retired Members - - 1 - - 1
Period 7/1/11 to 6/30/12Average Monthly Benefit -$ -$ 723$ -$ -$ 1,393$ Average Final Monthly Salary -$ -$ 5,059$ -$ -$ 4,488$ Number of Retired Members - - 1 - - 1
Years of Credited Service
Carroll County Certified Law Officer’s Pension was established during fiscal year 2010. Source: Department of Human Resources.
Top Related