


Languages
Pages
Legal


Policy Options for the Small Pacific Island Economies in the event of Global Economic Crisis
Sunil Kumar
School of Economics, USP, Suva
and
Shalendra Singh
School of Language and Literature, USP, Suva
ABSTRACT As the recent financial crisis wrecked havoc on the global economy, Pacific Island countries (PICs)
hoped that their remoteness would spare them the worst of the calamities. An uncertain faith
prevailed amongst the Pacific Island economists and policymakers that the PICs would be
cushioned from the global crisis due to their isolation from the global financial system. These
assumptions proved to be far from the truth. In this age of global trade, information, financial and
labour mobility, no country is an island, regardless of size or geographical location. The global
economy affected every country in the Pacific region in one way or another. How and why a global
crisis that began far away in the United States reached the door steps of impoverished PICs is
examined in this paper. The analysis focuses on the linkages that exist between the global economy
and the small Pacific Island economies. A comparative analysis of Fiji, Samoa, Solomon Islands,
Vanuatu and Kiribati is undertaken to explain the economic linkages that help in the development of
poor island economies. Pacific Island policymakers need to understand these links clearly so that
they can devise corrective policy measures to mitigate the effects of global downturns. This paper
pays particular attention to tourism and primary exports since these industries are the mainstay of
the small Pacific Island economies that are being analysed.

INTRODUCTION
In the last five decades, several financial crises have rocked the global economy. The latest
one has been termed by many analysts as a systemic failure of the American capitalist order.
Though the causes of the major crises over the last hundred years have been varied, the frequency
of the crises arising from stock market and financial instability has increased dramatically in the
recent times. The increasing instability of the financial market is directly related to the financial
market deregulation in the past two decades (UNCTAD 2009). Allen and Gale (2008) in their
introductory chapter state that “Crises have been the feature of the financial landscape for hundreds
of years”. In a radical wording, the UNCTAD secretariat report of 2009 states that the laissez-faire
system of the last 20 years has dramatically failed. The task force report in its key message adds that
its longstanding call for stronger international monetary and financial governance was underscored
by the manner in which the crisis of 2007 unfolded. It pointed out that the dynamics of the crisis
reflected failures in national and international financial deregulation trends of the past decade,
which often persistently led to global imbalances in various regions. The South East Asian financial
crisis of 1997 and the Mexican crisis of 1994 are two clear cases in point. Despite these well-known
cases, the recent trend in the global financial sector reflects lack of international supervision, with
clear signs of deep inconsistencies among global trading, financial and monetary policies
(UNCTAD 2009). It is argued that the lack of proper financial regulations have led to increasingly
volatile speculative operations in commodity and currency markets, which has resulted in severe
global imbalances.
The US government and the Treasury have been rightly criticized for the failure to foresee
the crisis. Similarly, economist and policymakers have been criticized for failing to predict such a
mega crisis in time to take corrective measures (Colander et al. 2009). The criticisms are
particularly intense since the warning signs were ignored by those in control (McDonald and
Robinson 2009). The fundamental problems lingering in the system due to the bad practices of the
big financial companies in the United States were allowed to carry on without proper system check.
This crisis not only weakened the financial system in the United States, but also damaged the
economic systems of developing countries like China as stated by Chou (2009) and UNCTAD
(2009) among many others. However, not all economies were equally affected by this crisis. The
Indian economy, for instance, was far less affected then the Chinese or the Korean economies since
the Chinese and the Korean economies are far more integrated with the US commodity markets than
the Indian economy (see IMF 2009).
2

As the financial crisis spread its tentacles to the rest of the world in September/October
2008, it became increasingly obvious that millions of poverty-stricken people in the developing
countries would not be spared, even though they were far removed from the decisions and events
that triggered the economic catastrophe. The citizens of these small and poor countries came into
harms way due to no fault of their. Though the trade and other linkages of many of these countries
with the United States and Europe are weak, most of them suffered depressed growth due to decline
in exports and tourism.
There are several transmission channels through which the financial crisis spread around the
world since 2007 to 2008 (Frenkel and Rapetti 2009). With liquidity drying up, financial institutions
around the world came under stress and resorted to financial tightening. Financial institutions in
developing countries came under extreme pressure to withdraw funds from external sources to
maintain reasonable levels of domestic liquidity. The inflow of capital into developing countries
turned into a trickle due to the downturn in the US and European markets putting pressure on
exchange rates and causing unprecedented increases in costs of credit.
The slowdown of the global economy also affected energy and commodity prices, which
hurt energy and commodity exporting countries in South America and Africa extremely hard. While
oil importing countries had some relief from declining oil prices, it hardly helped in rejuvenating
the domestic economic slowdown. Due to declining incomes in the US, Europe and Australia, the
flow of remittances to the Pacific Island communities also slowed down (Frenkel and Rapetti 2009).
Fiji, Samoa, Tonga and Kiribati took a direct hit since a large proportion of their GDPs are made up
of consumption from remittances. For a large proportion of households in the Pacific, remittance is
an important source of livelihood (World Bank 2006).
Many thousands of Pacific island families would have drifted into dire poverty due to the
decline in remittance. For countries like Fiji, Vanuatu and Samoa, a decline in tourism and exports
were other channels for the transmission of the crisis. Figure 1 shows declining tourism in Asia,
which is a direct result of falling incomes and diminishing savings of households and businesses in
the source countries like the US, Europe and Australia. Tourism data for Fiji shows declined of 23%
in early 2009, although the visitor arrivals to Fiji in 2008 had increased substantially due to
marketing impact, discount offers and the strategic location that Fiji enjoys.
Small Pacific Island economies with very weak or no links at all with the American financial
system have still been affected because of their strong trade links to Australia and New Zealand.
The downturn for the PICs, therefore has possibly occurred through the global goods market,
tourism and remittances. The Pacific Economic Survey (2009) states that Pacific island economies
3

were affected negatively due to the decline in consumption in the United States and the consequent
decline in Australia and New Zealand. However, the report argues that the PICs experienced growth
in 2008 fiscal but the growth was confined to only a few sectors and countries, such as Timor-Leste
and Papua New Guinea that have remained depressed in the immediate past. The Report argues that
for 2008, small PICs including Timor-Leste grew by about 5.1%, which was about double the
growth rate in 2007. However, the impact of the global slow down was felt severely by the PICs in
the later part of 2008 and throughout fiscal 2009.
Figure 1: Visitor Arrivals in Asia (% change)
Source: Adapted from ADB (2009a), Key Indicator for Asia and the Pacific
The paper examines the effects of the global downturn on the various economic sectors of
some Pacific Island countries (PICs) in the next section. The tourism sector, remittance inflows and
some agricultural sector exports are examined. The import bills of the PICs are examined to
determine how the crisis impacted on the trends in consumption in relation to the trends in
Australia, New Zealand and the United States. The policy responses of some of the PICs are also
studied in the following section and some conclusions are drawn in the final section. The conclusion
focuses on the appropriateness and efficacy of the PICs’ policy measures if any.
4
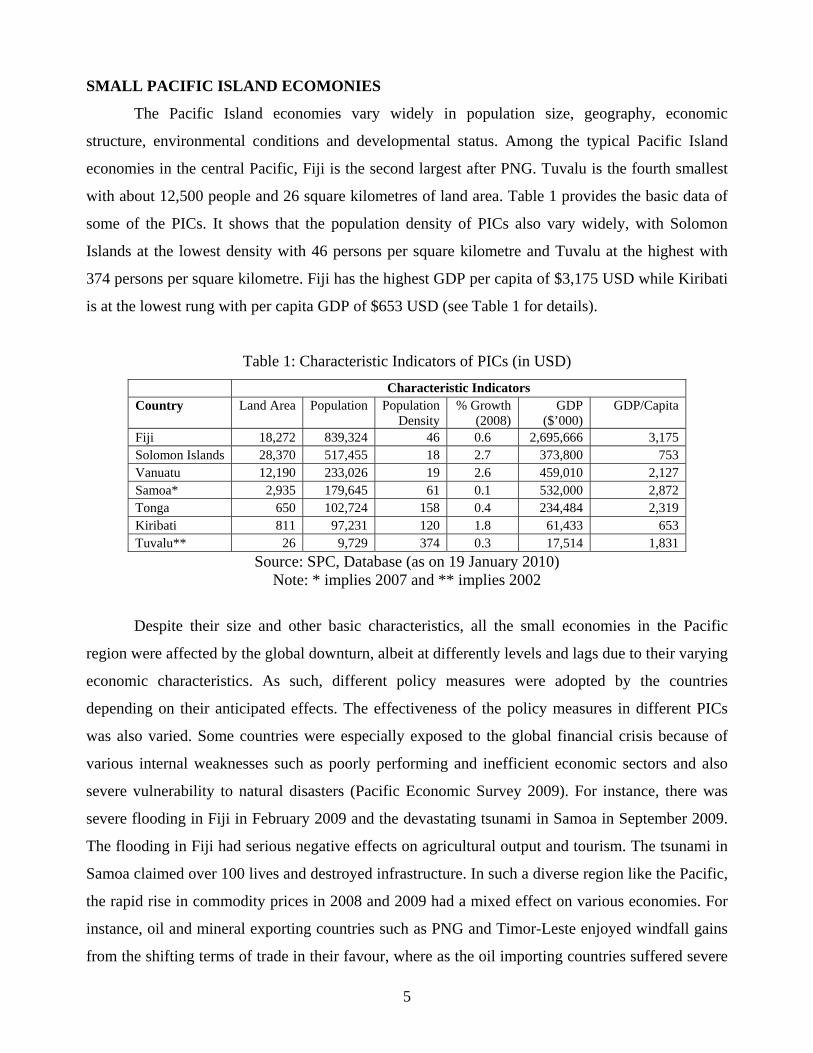
SMALL PACIFIC ISLAND ECOMONIES
The Pacific Island economies vary widely in population size, geography, economic
structure, environmental conditions and developmental status. Among the typical Pacific Island
economies in the central Pacific, Fiji is the second largest after PNG. Tuvalu is the fourth smallest
with about 12,500 people and 26 square kilometres of land area. Table 1 provides the basic data of
some of the PICs. It shows that the population density of PICs also vary widely, with Solomon
Islands at the lowest density with 46 persons per square kilometre and Tuvalu at the highest with
374 persons per square kilometre. Fiji has the highest GDP per capita of $3,175 USD while Kiribati
is at the lowest rung with per capita GDP of $653 USD (see Table 1 for details).
Table 1: Characteristic Indicators of PICs (in USD)
Characteristic Indicators Country Land Area Population Population
Density % Growth
(2008) GDP
($’000) GDP/Capita
Fiji 18,272 839,324 46 0.6 2,695,666 3,175 Solomon Islands 28,370 517,455 18 2.7 373,800 753 Vanuatu 12,190 233,026 19 2.6 459,010 2,127 Samoa* 2,935 179,645 61 0.1 532,000 2,872 Tonga 650 102,724 158 0.4 234,484 2,319 Kiribati 811 97,231 120 1.8 61,433 653 Tuvalu** 26 9,729 374 0.3 17,514 1,831
Source: SPC, Database (as on 19 January 2010) Note: * implies 2007 and ** implies 2002
Despite their size and other basic characteristics, all the small economies in the Pacific
region were affected by the global downturn, albeit at differently levels and lags due to their varying
economic characteristics. As such, different policy measures were adopted by the countries
depending on their anticipated effects. The effectiveness of the policy measures in different PICs
was also varied. Some countries were especially exposed to the global financial crisis because of
various internal weaknesses such as poorly performing and inefficient economic sectors and also
severe vulnerability to natural disasters (Pacific Economic Survey 2009). For instance, there was
severe flooding in Fiji in February 2009 and the devastating tsunami in Samoa in September 2009.
The flooding in Fiji had serious negative effects on agricultural output and tourism. The tsunami in
Samoa claimed over 100 lives and destroyed infrastructure. In such a diverse region like the Pacific,
the rapid rise in commodity prices in 2008 and 2009 had a mixed effect on various economies. For
instance, oil and mineral exporting countries such as PNG and Timor-Leste enjoyed windfall gains
from the shifting terms of trade in their favour, where as the oil importing countries suffered severe
5

adverse effects. In 2008 the increases in prices of agricultural commodities commonly exported
from Pacific island countries such as palm oil, coconut oil, copra, hardwood, cocoa beans, coffee
and gold was a boon for the economies of these countries. However, the price increases in these
commodities were more than offset by large price hikes in imported oil and food. Tonga, Samoa,
Fiji and Kiribati that import lots of food products were affected seriously due to the price hike.
The Fijian economy is among those in the region that is quite open to international shocks.
Fiji’s total imports and exports make up a substantial proportion of the GDP. Recently, the ratio of
imports to GPD has grown significantly from 57% in 2002 to 70% in 2008. The sum of imports and
exports reached 99% in 2008 and merchandise trade deficit was at 37% of GDP. As a result of this
increasing imbalance in trade the Fijian currency was devalued by 20% in April 2009.
Fiji’s import bill is wide-ranging since the domestic economy is narrowly-based in terms of
production of commodities. Thirty three percent of total imports comprise of fossil fuel and over
15% comprise of food products. The rest of the imports are chemicals, transport, machinery, and
assorted manufactured items for consumption and for inputs of production. The commodities export
base includes sugar, gold, garments, fish, lumber, molasses and coconut oil. Apart from these, there
are many other agricultural products and manufactured goods that are exported in small quantities.
Table 2 shows the decline in earnings from Fiji’s exports as the global downturn took hold in 2009.
Table 2: Exports from Fiji Islands (in ‘000 FJD)
Quarter Period 2007 2008 % Change 2009 % Change
Q1 231.7 293.7 0.2676 255.4 -0.1304
Q2 276.0 331.8 0.2022 250.3 -0.2456
Q3 357.0 432.9 0.2126 365.6 -0.1555
Q4 345.1 412.6 0.1956 NA NA
Total 1209.80 1471.00 - - -
Source: RBF (2009b).
There are three main ways in which a continued global downturn could affect Fiji’s
economy. First, Fiji’s exports could dwindle further if external demand declines, as was the case in
the first three quarters of 2009, which occurred despite the 20% devaluation of the Fijian currency
in April 2009. Interestingly, exports in all four quarters of 2008 show significant increases (see
Table 4 for details). This increase in 2008 could be due to a combination of factors. It could be due
to internal adjustments and policy measures taken by the Fiji government to boost primary industry
production in 2008 combined with the increase in sugar prices on the global market.
6

Secondly, Fiji’s tourism sector is expected to be affected by the global downturn. But the
effects of the global crisis may not necessarily be negative since there are a number of factors and
dynamics regarding Fiji’s tourism industry that remain favourable. For one, Fiji’s location in the
central Pacific is of essence. Australia and New Zealand are Fiji’s strongest markets and tourists
from these destinations intending to travel to Europe or the US would normally turn to Fiji as the
second best option if they were to be faced with a cash crisis or travel risk. Likewise, if travel risks
in Middle East or South East Asia increases, tourists from Australia and New Zealand look to Fiji as
a safer, cheaper and often a closer option. This distinct advantage seems to have helped Fiji during
the crisis in 2008.
Figure 2 shows that the number of Australian tourist travelling to Fiji increased after 9/11
incident in 2001. There seems to be a structural break in the travelling pattern of Australian tourists
since 2001. The series in Figure 2 shows that Australian tourists to Fiji have more than doubled in
this period. This increase has been consistent except for a slight break in 2006 where it hovered
around 200,000 and then increased to 250,000 in 2008 A similar trend is evident for the tourists
from New Zealand.
Figure 2: Autralian Tourists to Fiji
0
50000
100000
150000
200000
250000
300000
1990 1995 2000 2005 2010
Year
Num
ber
of T
ouri
sts
Source: RBF (2009b)
The Tables 3 and 4 show that Fiji’s downturn in tourism started in late 2008 and continued
into early 2009. However, this downturn and a subsequent upturn occurred very swiftly, evidently
due to the policy response put in place by Fiji. The data shows that the trend growth in tourist
arrivals from Australia declined to 7.1% in the fourth quarter of 2008 from a high of 39.2% in
7

quarter 1. In quarter 1 of 2009 Australian tourist declined by 26.4% and again started on a growth
path in quarter 3 of 2009. This reversal of the dramatic decline in late 2008 and early 2009 seems to
be due to the Fijian currency devaluation of 20% in April 2009, which gave Fiji tourism a
substantial competitive advantage. In addition to the devaluation, the Department of Tourism in Fiji
moved into overdrive in its global campaign to attract visitors.
Table 3: Tourist Arrivals during Global Crisis
Period 2007 2008 2009
Aus. NZ US Total Aus. NZ US Total Aus. NZ US Total
Q1 38236 14098 14307 108733 53241 13588 17759 130762 39186 9175 11377 100331
Q2 47538 28142 16520 130002 58235 26669 14897 140084 52378 22050 12569 124077
Q3 59288 36768 17477 159540 69820 38364 15893 170394 73652 37955 14139 168201
Q4 61939 20736 16383 141606 66312 21397 15118 143791 NA NA NA NA
Total 207001 99744 64687 539881 247608 100018 63667 585031 NA NA NA NA
Source: RBF (2009b)
Table 4: Tourist Arrivals during Global Crisis (% Change)
Period 2007 2008 2009
Aus. NZ US Total Aus. NZ US Total Aus. NZ US Total
Q1 38236 14098 14307 108733 39.2% -3.6% 24.1% 20.3% -26.4% -32.5% -35.9% -23.3%
Q2 47538 28142 16520 130002 22.5% -5.2% -9.8% 7.8% -10.1% -17.3% -15.6% -11.4%
Q3 59288 36768 17477 159540 17.8% 4.3% -9.1% 6.8% 5.5% -1.1% -11.0% -1.3%
Q4 61939 20736 16383 141606 7.1% 3.2% -7.7% 1.5% NA NA NA NA Total 207001 99744 64687 539881 19.6% 0.3% -1.6% 8.4% NA NA NA NA
Source: RBF (2009b)
Table 5: Total Imports for Fiji Islands (in ‘000 FJD)
Quarter Period 2007 2008 % Change 2009 % Change
Q1 655.0 711.3 0.0860 709.8 -0.21
Q2 663.3 880.6 0.3276 666.1 -24.36
Q3 744.9 1049.2 0.4085 723.0 -31.09
Q4 826.9 960.2 0.1612 NA NA
Total 2890.1 3601.3 - - -
Source: RBF (2009b)
As a result of declining GDP in the last quarter of 2008 and the first quarter of 2009,
consumption declined significantly and thus imports declined by approximately 24.4% in the
second quarter and 31.1% in the third (see Table 5). The import consumption declined mainly due
8
to price signal arising from the 20% devaluation of the Fijian currency. Apart from the 20%
devaluation, the government also implemented some fiscal policy measures to increase domestic
production of primary food products, which included tax holiday for certain category of investors..
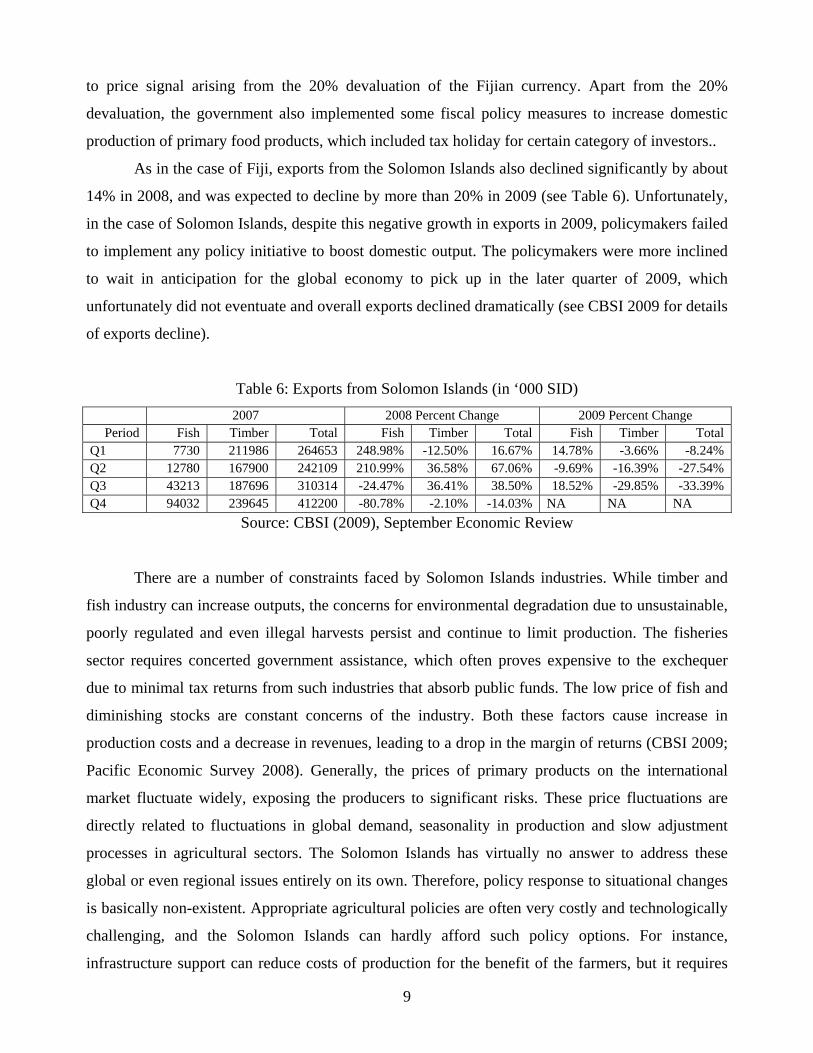
As in the case of Fiji, exports from the Solomon Islands also declined significantly by about
14% in 2008, and was expected to decline by more than 20% in 2009 (see Table 6). Unfortunately,
in the case of Solomon Islands, despite this negative growth in exports in 2009, policymakers failed
to implement any policy initiative to boost domestic output. The policymakers were more inclined
to wait in anticipation for the global economy to pick up in the later quarter of 2009, which
unfortunately did not eventuate and overall exports declined dramatically (see CBSI 2009 for details
of exports decline).
Table 6: Exports from Solomon Islands (in ‘000 SID)
2007 2008 Percent Change 2009 Percent Change Period Fish Timber Total Fish Timber Total Fish Timber Total
Q1 7730 211986 264653 248.98% -12.50% 16.67% 14.78% -3.66% -8.24% Q2 12780 167900 242109 210.99% 36.58% 67.06% -9.69% -16.39% -27.54% Q3 43213 187696 310314 -24.47% 36.41% 38.50% 18.52% -29.85% -33.39% Q4 94032 239645 412200 -80.78% -2.10% -14.03% NA NA NA
Source: CBSI (2009), September Economic Review
There are a number of constraints faced by Solomon Islands industries. While timber and
fish industry can increase outputs, the concerns for environmental degradation due to unsustainable,
poorly regulated and even illegal harvests persist and continue to limit production. The fisheries
sector requires concerted government assistance, which often proves expensive to the exchequer
due to minimal tax returns from such industries that absorb public funds. The low price of fish and
diminishing stocks are constant concerns of the industry. Both these factors cause increase in
production costs and a decrease in revenues, leading to a drop in the margin of returns (CBSI 2009;
Pacific Economic Survey 2008). Generally, the prices of primary products on the international
market fluctuate widely, exposing the producers to significant risks. These price fluctuations are
directly related to fluctuations in global demand, seasonality in production and slow adjustment
processes in agricultural sectors. The Solomon Islands has virtually no answer to address these
global or even regional issues entirely on its own. Therefore, policy response to situational changes
is basically non-existent. Appropriate agricultural policies are often very costly and technologically
challenging, and the Solomon Islands can hardly afford such policy options. For instance,
infrastructure support can reduce costs of production for the benefit of the farmers, but it requires
9
lots of resources to facilitate such infrastructure. New techniques and extension services often result
in better production efficiency but may entail change in techniques of production and demand
personnel that are non-existent in the island states. In addition to the lack of such resources, the
Solomon Islands is faced with serious political problems and inhibitive internal conflicts, and
largely inadequate physical infrastructure (UNDP 2009; Pacific Economic Survey 2009).
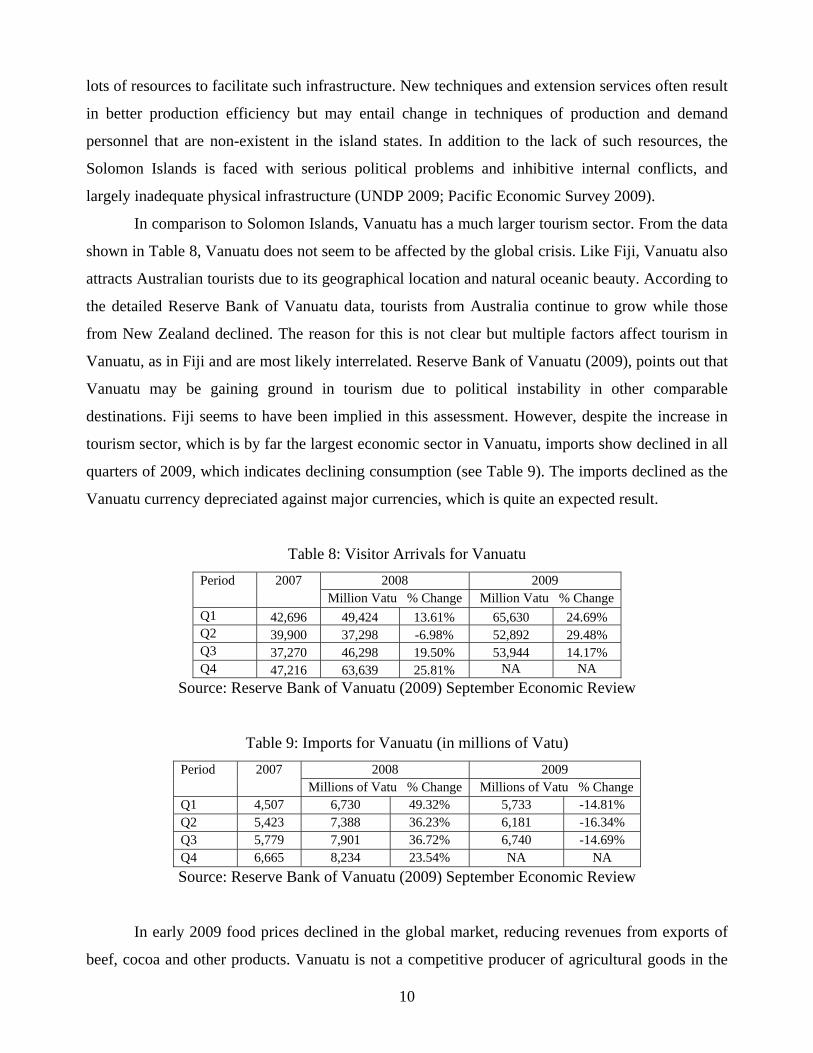
In comparison to Solomon Islands, Vanuatu has a much larger tourism sector. From the data
shown in Table 8, Vanuatu does not seem to be affected by the global crisis. Like Fiji, Vanuatu also
attracts Australian tourists due to its geographical location and natural oceanic beauty. According to
the detailed Reserve Bank of Vanuatu data, tourists from Australia continue to grow while those
from New Zealand declined. The reason for this is not clear but multiple factors affect tourism in
Vanuatu, as in Fiji and are most likely interrelated. Reserve Bank of Vanuatu (2009), points out that
Vanuatu may be gaining ground in tourism due to political instability in other comparable
destinations. Fiji seems to have been implied in this assessment. However, despite the increase in
tourism sector, which is by far the largest economic sector in Vanuatu, imports show declined in all
quarters of 2009, which indicates declining consumption (see Table 9). The imports declined as the
Vanuatu currency depreciated against major currencies, which is quite an expected result.
Table 8: Visitor Arrivals for Vanuatu
2008 2009 Period 2007 Million Vatu % Change Million Vatu % Change
Q1 42,696 49,424 13.61% 65,630 24.69% Q2 39,900 37,298 -6.98% 52,892 29.48% Q3 37,270 46,298 19.50% 53,944 14.17% Q4 47,216 63,639 25.81% NA NA
Source: Reserve Bank of Vanuatu (2009) September Economic Review
Table 9: Imports for Vanuatu (in millions of Vatu)
2008 2009 Period 2007 Millions of Vatu % Change Millions of Vatu % Change
Q1 4,507 6,730 49.32% 5,733 -14.81% Q2 5,423 7,388 36.23% 6,181 -16.34% Q3 5,779 7,901 36.72% 6,740 -14.69% Q4 6,665 8,234 23.54% NA NA
Source: Reserve Bank of Vanuatu (2009) September Economic Review
In early 2009 food prices declined in the global market, reducing revenues from exports of
beef, cocoa and other products. Vanuatu is not a competitive producer of agricultural goods in the
10
global market. However, Vanuatu beef, which is renowned for its excellent quality, has a distinct
advantage in the domestic market, and also in Australian and Japanese markets. Vanuatu had the
option of currency devaluation to attract tourists and also to become more competitive globally in
agricultural products (see Pacific Economic Survey 2009). The Reserve Bank of Vanuatu did not
consider this drastic action as Fiji did but allowed the currency to depreciate slightly against the
Australian currency, which helped Vanuatu exports to regain some level of competitiveness.
However, the Vatu appreciated against the US Dollar in the last two quarters of 2009 mainly due to
the depreciation of the US Dollar.
Unlike the Vanuatu economy, the Samoan economy is strongly dependent on remittances,
which has been increasing in the last decade due to the increasing number of Samoans living abroad
who sent monies back home to support their relatives (World Bank 2006). While the global Samoan
population is estimated at 450,000, only 188,000 lived in Samoan as per 2006 estimates. The
majority of ethnic Samoans now reside in other countries, primarily in New Zealand, United States
and Australia with estimated populations of 115,000, 70,000 and 39,992 respectively.
In fact, in Samoa, remittance flows are considered more significant than the tourism sector
due to the direct impact of remittances on poor households (see World Bank 2006). Remittances to
Samoa make around 25% of the total GDP, which is normally spent on consumption goods.
However, like tourism, remittances also dwindle when economic downturn occurs in the source
countries, and Samoa and Tonga have been affected in this way due to downturns in Australia and
New Zealand. A sizable number of Samoan migrants also live in the United States, and a continued
downturn in the US could also cause remittances to decline (Pacific Economic Survey 2009).
However, there are no clear signs that remittances to Samoa have declined in 2008 or 2009 since the
import data in Table 10 does not show any specific trend to suggest that anything like that would
have happened. Export for 2008 however, shows decline for all the four quarters whereas the first
quarter of 2009 shows an increase (Table 11 shows details). All monetary indicators remain positive
for the entire period of 2009 and liquidity condition in the system remained normal with no sign of
decline (Central Bank of Samoa 2009).
The tourism sector faced significant decline which was underpinned by decreased travelers
from all the targeted tourist markets such as USA, Australia, Europe, Western Samoa and New
Zealand that declined by 26%, 24%, 22%, 19% and 14% respectively for September 2009. When
categorized by purpose, the lower tourist arrivals reflected a reduction in those arriving for
‘holiday’, ‘visit friends and relatives’ and for ‘business’ (Central Bank of Samoa 2009). However,
11

tourism and associated revenues increased in October 2009, due mainly to Tsunami related travel
and donations.
Table 10: Imports for Samoa (in ‘000 of Tala)
2008 2009 Period 2007 Millions of Tala % Change Millions of Tala % Change
Q1 133,443 141,827 6.3% 117,294 -17.3% Q2 148,321 139,768 -5.8% NA NA Q3 173,445 198,202 14.3% NA NA Q4 138,430 179,384 29.6% NA NA
Source: Central Bank of Samoa (2009), Economic Review
Table 11: Exports for Samoa (in ‘000 of Tala)
2008 2009 Period 2007 Millions of Tala % Change Millions of Tala % Change
Q1 5,225 4,209 -19.4% 5,847 38.9% Q2 10,390 7,193 -30.8% NA NA Q3 11,188 7,802 -30.3% NA NA Q4 9,384 6,694 -28.7% NA NA
Source: Central Bank of Samoa (2009), Economic Review
Samoa was devastated by an earthquake and a killer tsunami in September 2009. Apart from
129 deaths, total cost of damage was US$36 million. As a result of the damage to infrastructure,
including seaside tourism accommodation, the economy has been seriously affected. Prior to the
tragedy, Samoan economy was doing reasonably well, with tourism numbers increasing slightly.
Export of commodities had been increasing, particularly in marine products and beer. However,
these two sectors have remained volatile in the short term and currently they are not doing as well
as expected (Central Bank of Samoa 2009). Tourism has been increasing steadily since 2002 but
there is no clear sign that the global downturn has affected Samoa significantly. The data gives
mixed results. However, it is known that Samoa is a high cost destination, and upward swing would
only be possible if the traditional markets (Australia and New Zealand) pick up. Additionally,
Samoa needs to develop niche market strategies to build its economic infrastructure, including
primary production.
The Tongan economy has been in bad shape for a long time now. Its weak growth prospects
are related to the political instability and incoherent economic policies. The economic structure is
based on only a few primary products such as vanilla, squash, taro and fish. However, there has
been very little or no sign of a growth trend in the economy since early last decade. While the
global crisis does not seem to have had any clear negative effect on the Tongan economy, there
12

appears to be some decline in the first two quarters of the 2009. Tourism in 2008 showed signs of
increase in the first 3 quarters but declined in the last quarter. The data for 2009 does not show any
definite sign of decline but prospects for growth remains minimal (Table 12 gives details). This may
be due to the continued inflow of remittances, which is a strong determinant of domestic
consumption. According to the imports data, consumption declined in quarter 1 and 2 of 2009 but
2008 had shown a strong increase in the middle two quarters, which eased off in quarter 4 (see
Table 13 for details). There is no definite policy option for Tonga in response to the global crisis but
long term planning towards the primary sector is likely to give favourable results. Tourism
development and appropriate land policies would be helpful in boosting output. Restrictions on the
foreign exchange market seem to persist for obvious reasons but more investor friendly policies
would be appropriate. The flow of remittances into Tonga is expected to be affected by external
crisis in source countries, which however does not seem to be obvious from the data. Domestic
liquidity and foreign reserves have remained stable for the period 2007 to 2009 (see NRBT 2009).
In fact the data shows that foreign reserves improved for this period on a month-to-month basis.
Table 12: Tourist Arrivals for Tonga (in ‘000 of Tala)
Period 2007 2008 Number % Change
2009 Number % Change
Q1 7,228 8,474 14.7% 8,973 5.9% Q2 10,881 11,290 3.6% 10,792 -4.4% Q3 12,177 14,865 18.1% 14,906 0.3% Q4 15,709 14,776 -6.3% NA NA
Source: NRBT (2009), Economic Review, September 2009.
Table 13: Imports for Tonga (in millions of Tala)
Period 2007 2008 Number % Change
2009 Number % Change
Q1 63.1 67.0 6.2% 65.1 -2.8% Q2 61.6 83.8 36.0% 70.6 -15.8% Q3 76.6 93.4 21.9% NA NA Q4 79.7 80.3 0.8% NA NA
Source: NRBT (2009), Economic Review, September 2009
Another Pacific economy that is of interest is Kiribati. However, recent economic data for
this country is not available. The export economy is based on coconut oil, copra, fish, seaweed and
beach-de-mer and handicraft. Unfortunately, even fish export that could easily be Kiribati’s niche
sector has not performed well since long (WCPFC-SCI 2005).
13

14
The next section of this article contains a policy analysis of these countries in order to
examine whether the policy options they adopted and implemented could yield favourable results
since it has often been asserted that small Pacific Island economies are ill-equipped to deal with
economic calamities such as the 2008/2009 global crisis.
POLICY OPTIONS FOR SMALL PACIFIC ISLAND ECOMONIES
From the discussions above it is clear that small Pacific island countries have been affected
by the global economic crisis but with different ways and intensities. The reasons for these
variations are related to the nature of linkages that exist between the island countries and the global
market and secondly, the nature of policy options the island countries took to tackle the crisis,
which in most cases were absent. Small island country policymakers often feel helpless and without
any policy options when global crisis occur. The island countries have often been thought not to
have the capacity to respond to such crisis with policy instruments as larger countries such as
Malaysia, Thailand or China may have (UNDP 2009). The case of Fiji stands out quite clearly
where monetary policy measure in early 2009 worked favourably to rebuild reserves (RBF 2009a;
2010). This policy produced desirable macroeconomic results albeit overall negative welfare
outcomes due to increasing food and fuel prices (UNDP 2009). However, policy measures such as
rural development and rural investment did not yield immediate results due to the nature of the
problems that exist. In Fiji, lack of investments and outflow of skilled labour are related to political
instability and cannot be resolved in the short run. Despite this, it is expected that good policy
measures yield desirable outcomes. Table 14 provides some details for the other Pacific Island
countries.
Like Fiji, it is expected that countries such as Solomon Islands, Vanuatu, Samoa and Tonga
can also use policy options to change economic outcomes. However, these economies need to
further develop the infrastructure to be able to respond to global crisis. For instance, if the tourism
infrastructure in Solomon Islands was better than what existed today, policies to attract more
tourists would help rejuvenate the economy even when primary exports declined. In the case of
Vanuatu, devaluation of the currency could have helped the tourism sector but was not considered
by the Vanuatu Reserve Bank due the comfortable foreign reserve position (Reserve Bank of
Vanuatu 2009b). Similarly, Samoa could have opted for long term policy to attract more
remittances and additionally it could opt for investment policies to attract foreign investors towards
capacity building in industrial sector such as food processing.

Table 14: Policy Options for Small Pacific Island Economies
Country Main Economic Issues for 2007-2009
Required policies or Reforms Action taken (or not taken) Effectiveness & Outcomes
Declining Investments
Tax incentives for investors Infrastructure development Tax exemption for creation of
new business ventures Tax holiday for creation of new
business ventures Policies to retain skilled
workers Lowering of interest rates on
long term loans Policies to promote political
stability and investor confidence
Facilitate better business registration processes
Ease foreign investment regulations on domestic borrowing
Reform land legislation
Government announced rural investment policies in 2008 and 2009 National Budget (see Government of Fiji 2008; 2009)
Government invested in rural development, e.g. road upgrade projects but came in drips and drapes, which is often felt to be too little too late.
Rural banking policies were implemented in 2008.
Reserve Bank of Fiji (RBF) is regulating commercial bank interest rates to keep them at competitive levels.
Fiji Trade and Investment Bureau (FTIB) and RBF adopted a fast track investment process to facilitate foreign investment initiatives (RBF 2009a).
There does not seem to be any political resolution of the current crisis
Any resolution on land legislation soon is least like
Rural development policy - not so effective (although commercial activities in some areas have increased)
Fiji’s fourth coup in 20 years cemented its reputation as a politically unstable country. Now Election is expected in 2014
Investment levels continue to be low due to political instability.
Land legislation continues to be an entrenched, unsolvable issue
Fiji
Declining Rural Economy
Upgrade of rural infrastructure and facilitation of marketing agencies for agricultural
Upgrade of rural infrastructure and facilitation of marketing agencies for agricultural products
Partial success in terms of rural development
Some farm access roads

products Financing agricultural ventures Better technology and
knowledge for farmers Better protection of property
rights (land rights)
Financing agricultural ventures Better technology and knowledge for
farmers Better protection of property rights
(land rights)
have been improved, which is helping build confidence among farmers
Extension services not up to standard
Migration of skilled Labour
Employment creation Citizenship Rights Better healthcare facilities Better education facilities Better race relations Crime reduction policies Non-discriminatory Civil
service
Early retirement policies recently implemented (60-55 years)
Dual citizenship now permitted Race/religious discrimination in
police force affecting crime fighting ability
Improvements to Healthcare services (not much in sight but nurses’ issues of pay and work conditions are now being addressed)
Government seems unclear about the right policies for race relations
Crime remains a major public concern
No specific action taken to reduce discrimination in civil service
More military personnel appointed to senior civil service positions seems to discourage existing civil servants
Early retirement policy caused loss of experienced /qualified personnel in the civil service (contrary to employment creation).
Lowly-paid and unmotivated healthcare personnel
Existing health facilities depreciating
Quality of primary healthcare in declining
Quality of Education declining. Urgent overhaul and review of the curriculum needed
Race relations could get worse.
Employment of military personnel in the civil system not helping
Declining exports
Devaluation of Fijian currency for export competitiveness/tourism
Better regional/ bilateral trade agreements
Economic Partnership Agreement (EPA)
Rural investment policies put in place (RBF 2009a)
Fiji Development Bank loans for investments
Rural road upgrade projects put in place.
Partial success in terms of rural development
Some farm access roads have been improved, which is helping build confidence among farmers
Extension services not up
16

New trading partners Infrastructure improvement Better quarantine agreements
with trading partners
Declining foreign reserves
Devaluation of currency Boost exports Lower imports Boost tourism
Currency devalued in April 2009 Bilateral/regional agreements at low
ebb due to international discord with military –appointed Government
EPA seems to be functioning as Fiji continues to sell sugar to EU at a preferential price. However, with world sugar prices rising, this agreement is losing significance.
China is emerging as a reliable donor but export to China would remain limited unless Fiji is able to open new areas such as natural forest or mineral exports. Fiji has very strong diplomatic ties with Beijing.
Chinese aid is helping build road infrastructure and some other vital transport and communication sectors.
Low commodity exports for years. No sign of significant improvement
Devaluation has helped lower imports and improve foreign reserves
Fiji has clear prospect of selling more sugar but the industry is not performing well due to various internal conflicts
No new areas opening up to boost exports. So economic and diplomatic relations with China may not be of help
Fiji currency devaluedNo new sectors established, although room for investment in renewable energy sector (ethanol and other bio-fuels) but limited initiatives taken Food production can be encouraged as substitute for imported food and produce.
Potential for processed food exports such as breadfruit, duruka and Pacific Chestnut is being tapped by foods Pacific Ltd
Foreign reserve has improved, mainly due to decline in imports
Increase in exports has not occurred. Generally no success is visible in terms of enabling new sectors to emerge
17

Low Exports Niche market development strategies needed
More favourable bilateral agreements needed with Australia and New Zealand
Flexible foreign investment policies needed
Training programs for new, emerging entrepreneurs
Need to tap into large Samoan diaspora in US West Coast cities, Honolulu, New Zealand, and Australia.
Devaluation of Tala may boost exports
No specific policy implemented A WTO bilateral agreement was
signed with Australia on 3 April 2009
FIAS, the Investment Climate Advisory Service reviewed the Foreign Investment Act in 2007.
Business Toolkits Phase II meeting and PIPSO Pacific Regional Small, Medium and Micro-Enterprises Forum in October 2008.
The 225,000 diaspora remains largely untargeted as an export market
Tala has in fact appreciated, which could be the cause of decline in fish and beer exports
It may also be declining demand for the Samoan beer for various reasons
Some specific policy measures are urgently needed to boost local production capacity
Some effort is needed to create demand of Samoan commodities in Australia and New Zealand as is the case for Samoan Taro
Currently, there is no clear option to increase agricultural products
Research capacity in agriculture is there but some specific steps need to be taken to start new industries or expand the existing ones
Samoa
Increasing Imports and merchandise trade deficit
Policy needed to produce processed local food products for export to Samoan diaspora and for tourism
Creating opportunities to invest remittances
Devaluation of the Tala may be a broad strategy to reduce consumption imports
No significant new policy initiatives No targeted initiatives to promote
investment of remittances No devaluation has been attempted
Processed food production remains insignificant despite potential markets. Facilitating export markets could be an excellent long term strategy to reduce imports and thus trade deficit
Significant proportion of remittances is used for daily consumption. Some goes into educational needs and some into expenditures such as rentals and health expenses.
18

Devaluation too unpopular and would probably be ineffective since import consumption is linked to remittances from abroad
Decreasing Tourism
Need Investment in Tourism infrastructure
Incentives for private investments in tourism
Encourage training in hospitality
Tax relief policies to attract more tourism investments
No new tourism specific policies Investment environment, particularly
registration process, seems favourable
No specific to manpower training in hospitality sector
Some investments have occurred recently
Trained labour force in tourism sector remains weak
No tax or other government incentives in response to devaluation of national currency by competitor countries like Fiji
Currency appreciation
Devaluation could be an option to boost exports and create employment
Devaluation seems a viable option because of the high remittance from abroad. Devaluation would also help some of the niche market exports such as beer and fish to grow
No policy has been taken but currency devaluation would give more buying power to the foreign dollar in the domestic market
Tonga Low Exports Further development of niche market sectors such as vanilla and squash
Flexible foreign investment policies needed
More support for exporters, including fish export sector
Training programs and financial incentives for new, emerging entrepreneurs
No new specific policies to increase production and boost exports of vanilla and squash, the traditional export commodities.
Legislation simplifying foreign investment and streamlining business registration procedures came into effect April 1, 2007. New customs and excise regulations grant exemptions from import duty on capital goods effective from July 1, 2008.
NZAID and Tongan government establish a new scheme to encourage
Exports of vanilla and squash have been successful in the past so they can be further developed
It remains somewhat challenging to establish business in Tonga.
Recent government reforms aim to make the procedures and processes easier and quicker but success has been limited. The World Bank lists Tonga as the
19

New initiatives to attract foreign investments in the export and fisheries sector is encouraging
Low Tourism Arrivals
New policies to attract investments in tourism sector
Land acquisition policies need to be revised to attract investors in the tourism sector and generally for industrial development
No new specific policies in place but the Business Opportunity Support Scheme that provides entrepreneurs up to T$30,000 to carry out feasibility studies covers the tourism sector.
No major efforts at land reforms have taken place for many years
Tourism arrivals by air rose 20% in the first nine months of 2007 and cruise ship visitors increased by 50%
More investment needed in tourism, which is considered to be performing below its potential.
The private sector is constrained by existing land framework that makes it very difficult for investors, especially small ones, to identify land available for leasing.
Industrial Development
Land acquisition policies for foreign investors
Government support for infrastructure development
Foreign exchange rules to be relaxed to facilitate
No specific policy initiatives taken by Tongan government
USD60 million construction of Nuku’alofa central business district commenced in 2007. $USD45 million concessionary loan from
New policy initiative would work in the long run if such policies remain consistent
Land acquisition remains the main huddle—
20

Government need to expedite viable bilateral and regional trade agreements
Government approves fiscal stimulus package aimed at accelerating investment in infrastructure, and promoting income and employment generating programs in 2009.
Once land is identified makes it difficult for investors to secure leases within a reasonable period of time.
Declining Exports
Devaluation of the vatu Further development of niche
export sectors through foreign investment
Build infrastructure to boost agricultural production, including beef
Develop new export sectors such as mineral mining
Educational sector and overall human resource development needs attention to attract foreign investor
Vatu exchange rate has remained quite stable but a devaluation could have boosted primary exports and tourism
Fiscal expenditure on Infrastructure needs to increase substantially
New sectors have not been considered through policy instruments
Government investments in the education sector remains minimal
Policies would generally be rewarding but no fresh initiative taken
In the long run policies would prove effective but the initial steps need to be taken.
Vanuatu
Stagnation of niche sectors such as beef, cocoa and copra
Infrastructure development policies are needed to boost these existing sectors
Reliable extension support for farmers is needed to deal with problems such as disease and drought
Assistance from external agencies such World Bank and ADB is needed (ADB 2009b)
Basic agricultural knowledge and techniques are lacking
Policies are very weak and the support is inconsistent
Manpower and expertise in various field is lacking
Lack of resources ADB, under the Country Partnership
Strategy, provides Vanuatu Government $32 million in lending support and $5 million in technical assistance for reducing poverty and promoting private-sector led sustainable growth over the period
Infrastructure policies would be effective in the long run
21

Lack of Tourism Infrastructure
Tourism development, marketing, and investment policies offering concessions are needed to expand and capitalise on the promising and expanding tourism sector
Some marketing is done but the strategy is not aggressive enough
Government needs to be more proactive and take advantage of the boom
Land rights are not transparent enough to provide confidence to investors
Policies are needed to attract investors in domestic aviation to boost inter island service
Vanuatu is an exotic and safe tourist destination. It can be easily developed further with the right policies and incentives for investors
Decline in Agricultural production; unsustainable exploitation of timber resources
Long-term growth policies are needed to grapple with supply constraints
Timber export need to be based on firm bilateral or regional trade agreement that adhere to sound and sustainable forestry practices
Policies to promote greater efficiency in Fish, Palm Oil and coconut oil production
Policies are in place but the government lacks resources to be proactive and intervene in essential areas of concern
Government is not active in monitoring unsustainable forestry practice and taking corrective measures.
Basic infrastructure is not in place to boost Fish, Palm Oil and coconut oil production.
The government is not actively involved in taking corrective measures
Basic infrastructure is lacking so any progress at first will be slow
Skilled human resources are needed to make effective policies and strategies.
Solomon Islands
Tourism sector underdeveloped
Long term planning is needed to establish basic infrastructure
Investment policies are needed in tourism sector
Basic training in hospitality on a large scale would be needed to accompany any developments in hotels, resorts and other types of accommodation
Appropriate policies specifically targeting tourism development are lacking
Training facilities for the hospitality sector is needed
Political instability has been a strong negating factor
The opportunities are available, with the Solomon Islands possessing some of the most pristine and beautiful beaches in the Pacific, but any
Tourism sector has seen no substantial growth in years
Government needs to focus on tourism development.
Australian and New Zealand assistance towards this could be a very helpful
22

Basic Infrastructure Lacking
Long term development plans need to be in place and funds secured and committed towards this end
Road building, would give farmers access to markets and should be a priority
Training programs and other forms of technical assistance for farmers are needed
Financing of projects should also be part of the plan
Strategies are not well executed Develop new export sectors such as
mineral mining and value adding in timber exports
Banking facilities and funds are needed
So far development is very slow
Mega plans with bottom up strategy is needed
Human resource development lacking
Right policies and facilities for training personnel needs to be put in place in place for niche sectors such as forestry and fisheries
Vocational training established at high school level may be cost-effective and most appropriate
At the moment only very rudimentary concepts of technical training is functional in the country and that too in areas close to the capital only. Multiple replications of the success stories are needed for a national level impact.
Better facilities for primary and secondary level education are necessary
Education sector is very weak; needs more government funds and development effort
Numerous problems need to be solved simultaneously
Kiribati An inherently depressed economy
Strategic planning needed to start primary sector production
Need to develop bilateral relationship with Australia and New Zealand for the development of fisheries and other oceanic products where more value –adding can be done domestically (see WCPFC-SCI 2005).
Some policies are there but actual government involvement is minimal due to scarcity of resources.
Local expertise in developmental issues are very limited, however the signs seem to be positive (AUSAID 2009)
This country needs constant support from Australia and New Zealand
The developmental situation in Kiribati is generally in bad shape
Even the most basic government services is not available
There is a need for international attention
Australia and New Zealand need to step in and offer
23

24
Negotiate better shipping services and air links
Construction of better sanitation facilities and supply of safe drinking water could lead to better economic development

Kiribati is an extreme example of lack of capacity among Pacific island countries.
It has a population of 100,000 and lacks even the basic infrastructure. Solomon Island lies
in a similar category, where basic infrastructure is lacking and often has no tangible
option to deal with global crisis.
CONCLUSION
Policy options in the Pacific island countries to tackle global economic crisis have
been weak and uncommitted. During the crisis policymakers in the PICs were
anticipating no drastic effect. For instance, the Reserve Bank of Fiji anticipated complete
insulation of Fiji’s financial sector from the global financial system (see Reddy 2008).
However, this was only partly true. Firstly, the financial crisis in the United States did not
last long enough to have a direct effect on Fiji’s financial flows, and even if it did, it is
not clearly known yet. Fiji however did feel the economic pinch through reduced tourist
demand and exports. Similar economies such as Samoa, Vanuatu, Solomon Islands and
Tonga, felt the downturn in the similar way. However, only those countries that have a
reasonable infrastructure could devise some policy options to tackle the problems.
Reference:
ADB (2009a) Key Indicators for the Asia and the Pacific, Highlights, 40th Edition,
Asian Development Bank, Manilla, Philippines.
ADB (2009b) Asian Development Bank and Vanuatu Five-Year Strategic Development
Partnership agreement (http://www.adb.org/media/Articles/2009/12984-vanuatu-
partnerships-strategies/)
Allen, F. and Gale, D. (2008) Financial Crises, The International Library of Critical
Writings in Economics 218, in Mark Blaug (ed.), Edward Elgar Publishing.
CBSI (2009) Quarterly Review, Volume 22, No 3, September, 2009, Central Bank of
Solomon Islands, Government Building, Honiara.
Central Bank of Samoa (2009) Foreign Trade and Tourism Report (October, 2009)
Research and Statistics Department, Government Building, Apia, Samoa.
25

Chou, X. (2009) “Revelations of US Financial Crisis for the Financial Development of
China” International Journal of Economics and Finance, Volume 2, No. 1,
pp144-146.
Colander, D., Föllmer, H., Haas, A., Goldberg, M., Juselius, K. Kirman, A, Lux, T. and
Sloth, B. (2009) “The Financial Crisis and the Systemic Failure of Academic
Economics”, Discussion Paper No. 09-01, Department of Economics,
Middlebury College, Middlebury, Vermont 05753.
Frenkel, R. and Rapetti, M. (2009) “A Developing Country View of the Current Global
Crisis: What should not be forgotten and what should be done”, Cambridge
Journal of Economics, Vol. 33, pp.685–702.
Government of Fiji (2008) National Budget Supplement – 2009, National Planning
Office, Government Building Suva.
Government of Fiji (2009) National Budget Supplement – 2010, National Planning
Office, Government Building Suva.
IMF (2009) World Economic Outlook – April 2009, World Economic and Financial
Survey, International Monetary Fund, Washington DC.
McDonald, L. and Robinson, P. (2009) “A Colossal Failure of Common Sense: The
Incredible inside story of the Lehman Brothers”, London: Ebury Publishing.
NRBT (2009) Quarterly Bulletin, Volume 20, No. 3, September, 2009, National Reserve
Bank of Tonga, Nukualofa, Tonga.
Pacific Economic Survey (2008) “Pacific Economic Survey: Engaging with the World”,
Commonwealth of Australia (2008), Canberra, Australia.
Pacific Economic Survey (2009) “Pacific Economic Survey: Engaging with the World”,
Commonwealth of Australia (2009), Canberra, Australia.
RBF (2009a) Economic Review, Vol. 26, No. 12, (December, 2009), Reserve Bank of
Fiji, Government Building, Suva.
RBF (2009b) Reserve Bank Quarterly, (September) Reserve Bank of Fiji, Government
Building, Suva: (http://www.reservebank.gov.fj/docs/Statistical%20Annex%20
(Dec09).pdf).
RBF (2010) Economic Review, Vol. 27, No. 1, (January, 2010), Reserve Bank of Fiji,
Government Building, Suva.
26
27
Reddy, S. (2008) “Impact of the global crisis on Fiji’s economy”, a presentation by Mr
Sada Reddy, Deputy Governor of the Reserve Bank of Fiji at the Fiji Employers
Federation, Suva (12 November 2008): http://www.bis.org/review/r081117e.pdf.
Reserve Bank of Vanuatu (2009) Financial and Economic News, Issue 143 (December,
2009) Reserve Bank Building, Port Villa, Vanuatu.
Reserve Bank of Vanuatu (2009b) “Half-Yearly Monetary Policy Statement”, Reserve
Bank Building, Port Villa, Vanuatu:http://www.rbv.gov.vu/Publications/
Monetary%20Policy%20Statements/Monetary%20Policy%20Statement%20-%20
March%202009.pdf
Sevele, F. V. (2009) “Weathering the Global Storm - The Case of Tonga”, An Address
by the Prime Minister of Tonga at the Lowy Institute Conference, Monday 3rd
August 2009.
SPC (2010) Database, Prism Statistics for Pacific Island Countries, South Pacific
Commission, Noumea, New Caledonia.
UNCTAD (2009) “The Global Economic Crisis: Systemic Failures and Multilateral
Remedies”, A Report by the UNCTAD Secretariat, Task Force on Systemic
Issues and Economic Cooperation, United Nations Conference on Trade and
Development, United Nations, New York.
UNDP (2009) “The Global Economic Crisis and the Pacific Island Countries: The
Human and Social Dimensions”, by Ajay Chhibber, at The Lowy Institute
Conference for International Policy “Pacific Islands and the World: The Global
Economic Crisis”, Brisbane, 3 August 2009: http://www.undppc.org.fj/userfiles/
file/SpeechAjayChhibberLowyInst.pdf.
WCPFC-SCI (2005) Kiribati Fisheries Report, Ministry of Fisheries and Marine
Resources Development, Kiribati, (August 2005) - http://www.wcpfc.int/doc/fr-
wp%C3%A2%E2%82%AC%E2%80%9C23/kiribati-kiribati-fisheries-report (as
per 16th February 2010).
World Bank (2006) “Expanding Job Opportunities for the Pacific Islanders through
labour Mobility at Home & Away”, The World Bank, Washington DC.
Top Related