


Languages
Pages
Legal


Microgram Journal, Volume 9, Number 1 33
This laboratory recently received a request to synthesize
α-pyrrolidinopentiophenone; 1-phenyl-2-(1-pyrrolidinyl)-1-
pentanone (Figure 1) as a primary standard for identification of
this compound in a number of drug exhibits. Although there
are two literature citations for this compound [1,2], insufficient
analytical data is available for forensic identification.
α-Pyrrolidinopentiophenone is not currently scheduled under
the U.S. Controlled Substances Act; however, it may be
considered a controlled substance analogue of 3,4-methylene-
dioxypyrovalerone (MDPV, placed in Schedule I on October
21, 2011) [3]. Herein, we report its synthesis and analytical
profile (nuclear magnetic resonance, mass spectrometry, and
infrared spectroscopy), to assist forensic chemists who may
encounter this substance in casework.
Experimental
Chemicals, Reagents, and Materials
All solvents were distilled-in-glass products of Burdick and
Jackson Labs (Muskegon, MI). All other chemicals and NMR
solvents were of reagent-grade quality and products of Aldrich
Chemical (Milwaukee, WI).
Gas Chromatography/Mass Spectrometry (GC/MS)
Mass spectra were obtained on an Agilent Model 5975C
quadrupole mass-selective detector (MSD) that was interfaced
with an Agilent Model 7890A gas chromatograph. The MSD
was operated in the electron ionization (EI) mode with an
ionization potential of 70 eV, a scan range of 34-600 amu, and a
scan rate of 2.59 scans/s. The GC was fitted with a 30 m x
0.25 mm ID fused-silica capillary column coated with 0.25 µm
100% dimethylpolysiloxane, DB-1 (J & W Scientific, Rancho
Cordova, CA). The oven temperature was programmed as
follows: Initial temperature, 100oC; initial hold, 0.0 min;
program rate, 6oC/min; final temperature, 300oC; final hold,
5.67 min. The injector was operated in the split mode (21.5:1)
at 280oC. The MSD source was operated at 230oC.
Infrared Spectroscopy (FTIR)
Infrared spectra were obtained on a Thermo-Nicolet Nexus
670 FTIR equipped with a single bounce attenuated total
reflectance (ATR) accessory. Instrument parameters were:
Resolution = 4 cm-1; gain = 8; optical velocity = 0.4747;
aperture = 150; and scans/sample = 16.
Nuclear Magnetic Resonance Spectroscopy (NMR)
NMR spectra were obtained on an Agilent 400MR NMR with
a 400 MHz magnet, a 5 mm Protune indirect detection, variable
temperature, pulse field gradient probe (Agilent, Palo
Alto, CA). The sample temperature was maintained at 26oC.
Standard Agilent pulse sequences were used to collect the
following spectra: Proton, carbon (proton decoupled), and
gradient versions of the 2-dimensional experiments HSQC, and
HMBC. Data processing and structure elucidation were
performed using Structure Elucidator software from Applied
Chemistry Development (ACD/Labs, Toronto, Canada).
Synthesis of α-Pyrrolidinopentiophenone
In accordance with Journal policy, exact experimental details
are not provided, but are outlined in Figure 2. Briefly, 1-phenyl-
1-pentanone was formed from the reaction of valeronitrile with
phenylmagnesium bromide, with subsequent acidic workup.
The pentanone was then brominated to form the alpha-bromo
ketone, which was then reacted with pyrrolidine to give the title
compound, which was finally converted to the HCl ion pair.
The Characterization of α-Pyrrolidinopentiophenone
John F. Casale* and Patrick A. Hays
U.S. Department of Justice
Drug Enforcement Administration
Special Testing and Research Laboratory
22624 Dulles Summit Court
Dulles, VA 20166-9509
[email address withheld at authors’ request]
ABSTRACT: The synthesis, analysis, and characterization of α-pyrrolidinopentiophenone (commonly referred to as “alpha-PVP,”
“α-PVP,” or “O-2387”) are briefly discussed. Analytical data (mass spectrometry, nuclear magnetic resonance spectroscopy, and
infrared spectroscopy) are presented.
KEYWORDS: α-pyrrolidinopentiophenone, alpha-PVP, 1-phenyl-2-(1-pyrrolidinyl)-1-pentanone, designer drug, synthesis,
characterization, forensic chemistry.
Figure 1 - Structural formula of α-pyrrolidinopentiophenone.
34 Microgram Journal, Volume 9, Number 1
Results and Discussion
Structural Elucidation/Confirmation of α-Pyrrolidinopentio-
phenone HCl
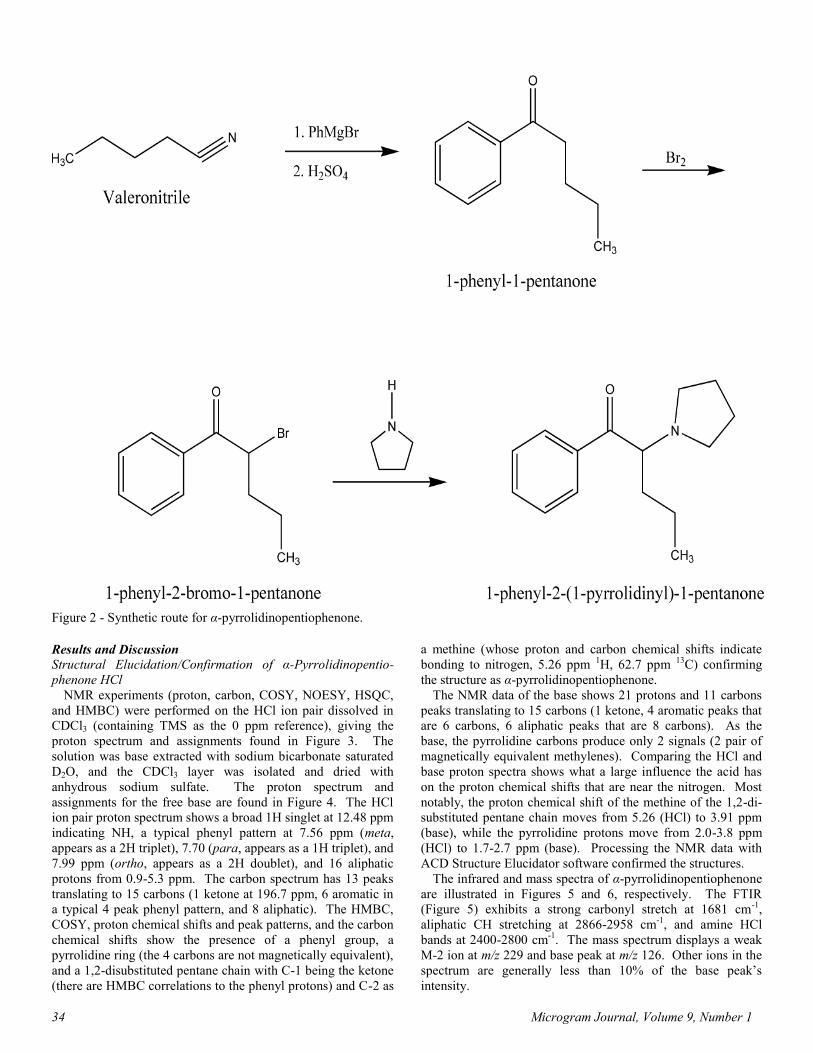
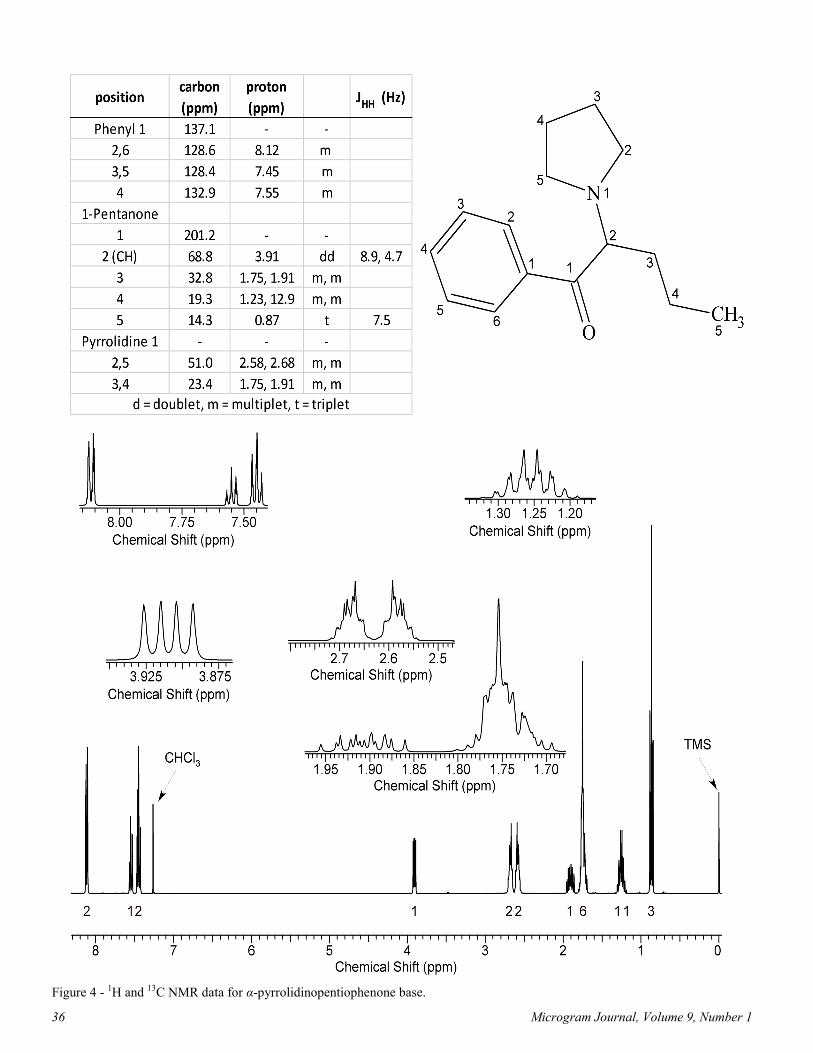
NMR experiments (proton, carbon, COSY, NOESY, HSQC,
and HMBC) were performed on the HCl ion pair dissolved in
CDCl3 (containing TMS as the 0 ppm reference), giving the
proton spectrum and assignments found in Figure 3. The
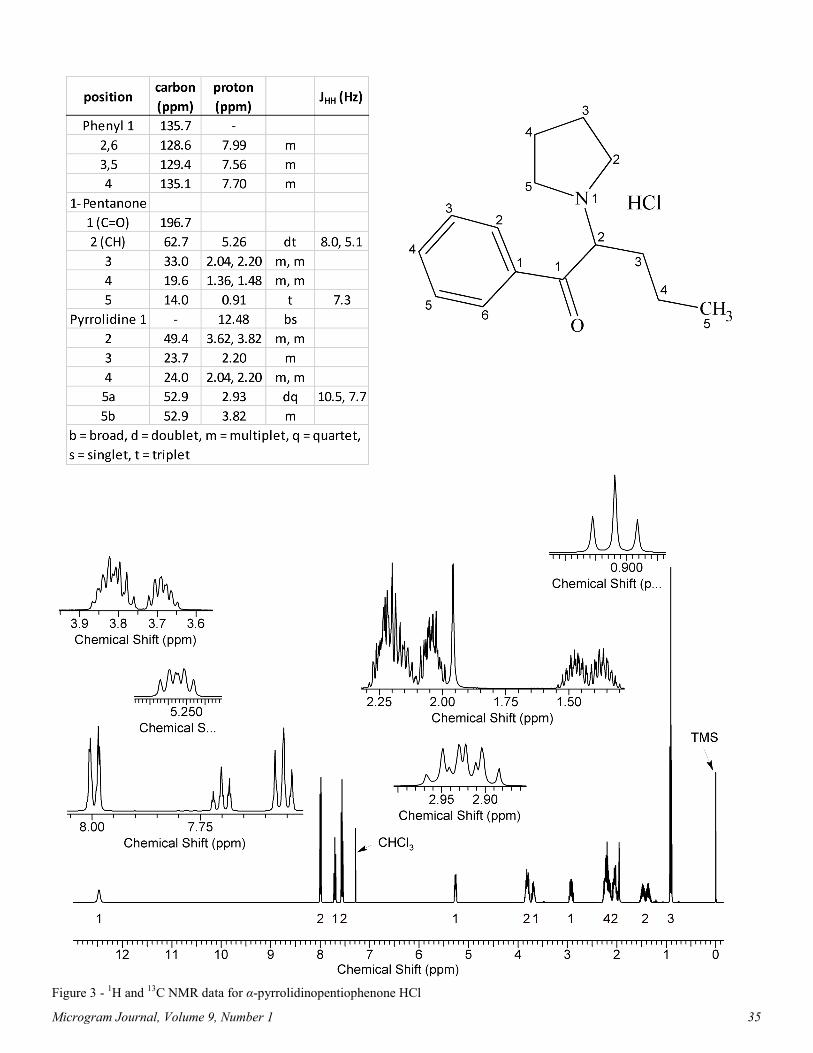
solution was base extracted with sodium bicarbonate saturated
D2O, and the CDCl3 layer was isolated and dried with
anhydrous sodium sulfate. The proton spectrum and
assignments for the free base are found in Figure 4. The HCl
ion pair proton spectrum shows a broad 1H singlet at 12.48 ppm
indicating NH, a typical phenyl pattern at 7.56 ppm (meta,
appears as a 2H triplet), 7.70 (para, appears as a 1H triplet), and
7.99 ppm (ortho, appears as a 2H doublet), and 16 aliphatic
protons from 0.9-5.3 ppm. The carbon spectrum has 13 peaks
translating to 15 carbons (1 ketone at 196.7 ppm, 6 aromatic in
a typical 4 peak phenyl pattern, and 8 aliphatic). The HMBC,
COSY, proton chemical shifts and peak patterns, and the carbon
chemical shifts show the presence of a phenyl group, a
pyrrolidine ring (the 4 carbons are not magnetically equivalent),
and a 1,2-disubstituted pentane chain with C-1 being the ketone
(there are HMBC correlations to the phenyl protons) and C-2 as
a methine (whose proton and carbon chemical shifts indicate
bonding to nitrogen, 5.26 ppm 1H, 62.7 ppm 13C) confirming
the structure as α-pyrrolidinopentiophenone.
The NMR data of the base shows 21 protons and 11 carbons
peaks translating to 15 carbons (1 ketone, 4 aromatic peaks that
are 6 carbons, 6 aliphatic peaks that are 8 carbons). As the
base, the pyrrolidine carbons produce only 2 signals (2 pair of
magnetically equivalent methylenes). Comparing the HCl and
base proton spectra shows what a large influence the acid has
on the proton chemical shifts that are near the nitrogen. Most
notably, the proton chemical shift of the methine of the 1,2-di-
substituted pentane chain moves from 5.26 (HCl) to 3.91 ppm
(base), while the pyrrolidine protons move from 2.0-3.8 ppm
(HCl) to 1.7-2.7 ppm (base). Processing the NMR data with
ACD Structure Elucidator software confirmed the structures.
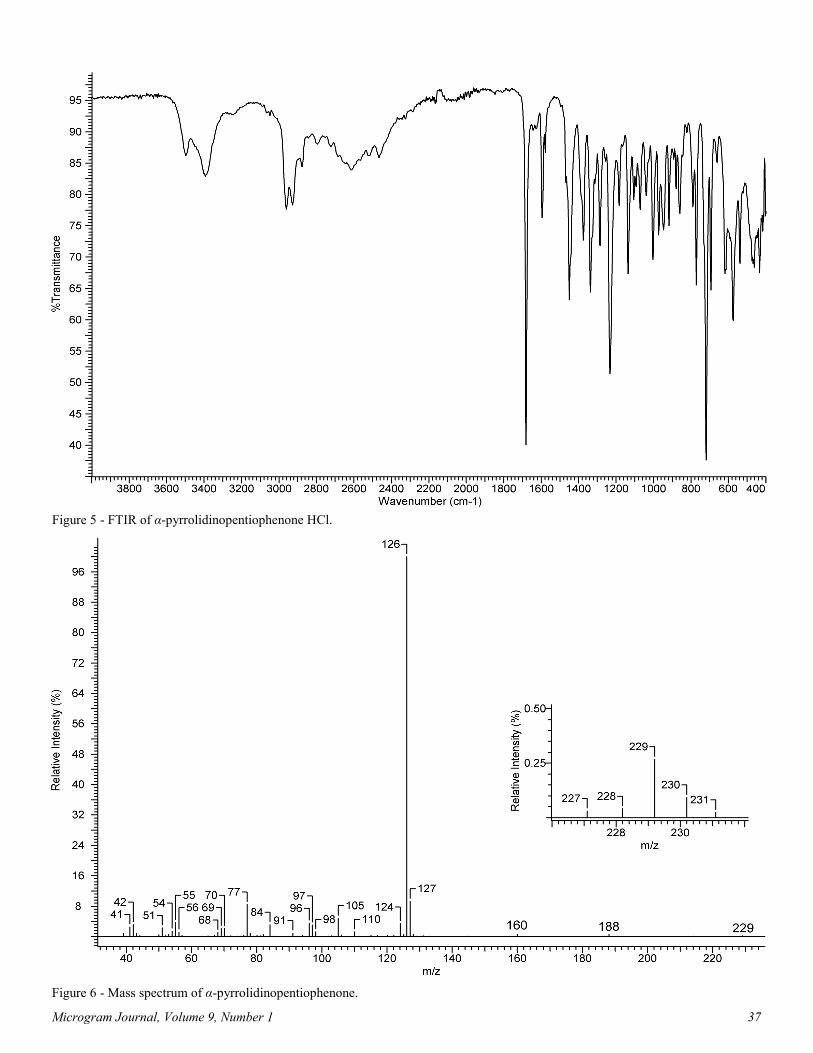
The infrared and mass spectra of α-pyrrolidinopentiophenone
are illustrated in Figures 5 and 6, respectively. The FTIR
(Figure 5) exhibits a strong carbonyl stretch at 1681 cm-1,
aliphatic CH stretching at 2866-2958 cm-1, and amine HCl
bands at 2400-2800 cm-1. The mass spectrum displays a weak
M-2 ion at m/z 229 and base peak at m/z 126. Other ions in the
spectrum are generally less than 10% of the base peak’s
intensity.
Figure 2 - Synthetic route for α-pyrrolidinopentiophenone.
Microgram Journal, Volume 9, Number 1 35
Figure 3 - 1H and 13C NMR data for α-pyrrolidinopentiophenone HCl
36 Microgram Journal, Volume 9, Number 1
Figure 4 - 1H and 13C NMR data for α-pyrrolidinopentiophenone base.
Microgram Journal, Volume 9, Number 1 37
Figure 6 - Mass spectrum of α-pyrrolidinopentiophenone.
Figure 5 - FTIR of α-pyrrolidinopentiophenone HCl.
38 Microgram Journal, Volume 9, Number 1
Conclusions Analytical data are presented to assist forensic laboratories
that encounter α-pyrrolidinopentiophenone in casework.
References
1. Sauer C, Peters FT, Haas C, Meyer MR, Fritschi G, Maurer
HH. New designer drug α-pyrrolidionvalerophenone
(PVP): Studies on its metabolism and toxicological
detection in rat urine using gas chromatographic/mass
spectrometric techniques. J. Mass Spectrom. 2009;
44(6):952-964.
2. Meltzer PC, Butler D, Deschamps JR, Madras BK. 1-(4-
Meth ylp he n yl ) -2 -p yr ro l id in -1 -y l -p e n ta n -1 -o n e
(pyrovalerone) analogs. A promising class of monoamine
uptake inhibitors. J. Med. Chem. 2006;49(4):1420-1432.
3. Code of Federal Regulations. 21 U.S.C. § 802(32)(A).
Top Related