


Languages
Pages
Legal

The Affordable Care Act At 5
David Blumenthal, MD, MPP
President, The Commonwealth Fund
Health Journalism 2015
Silicon Valley, CA
April 25, 2015

2
What’s Happened So Far?

3
Insurance Market Reforms,
Consumer Protections
All new health plans
required to provide
free preventive care
• 71 million received at least one free
preventive care service
• 47 million estimated to be covered for
women’s preventive services with no
cost-sharing
Prohibition on
preexisting condition
exclusions for children
• 17.6 million children projected to
benefit
Bans on annual and
lifetime benefit limits
• 105 million estimated to have had
lifetime benefit limits
• 18 million had annual limits
Source: Centers for Medicare & Medicaid Services.

4
Insurance Market Reforms,
Refunds to Consumers
Limits on nonmedical
spending by health
plans
• Consumer rebates and reduced
overhead exceeded $5 billion in
between 2011 and 2013
Premium rate review• Consumer savings of $1 billion
in 2013
Source: McCue, Hall; Centers for Medicare & Medicaid Services.

5
Insurance Market Reforms, Young Adults
• 2.9 million more young
adults ages 19-25
covered by parent’s
policy between 2010-
2014.
Source: Centers for Medicare & Medicaid Services.
6
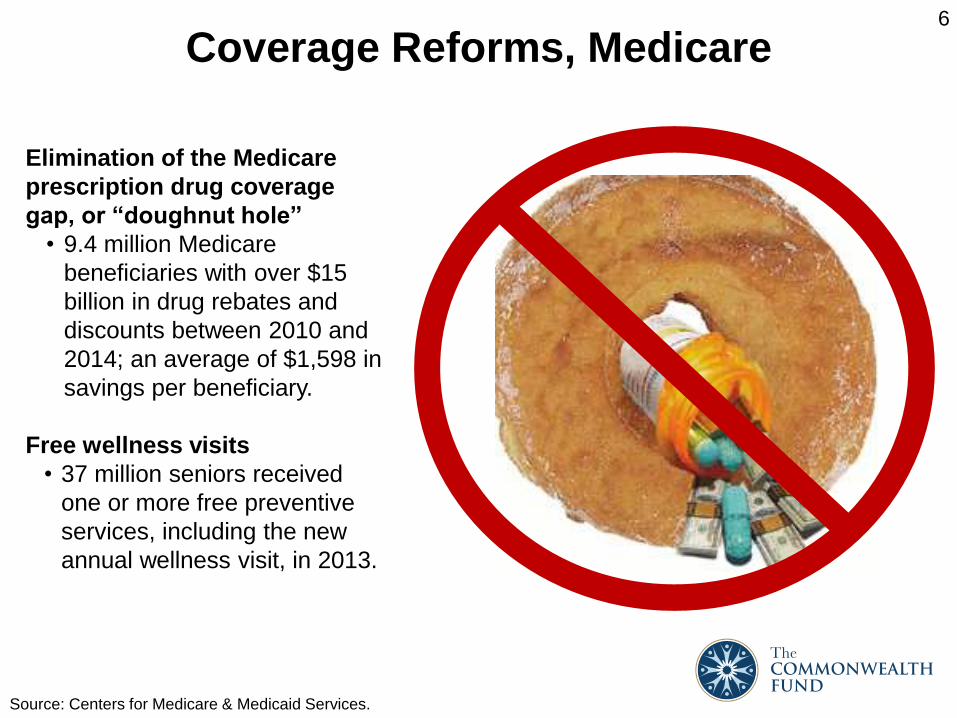
Coverage Reforms, Medicare
Elimination of the Medicare
prescription drug coverage
gap, or “doughnut hole”
• 9.4 million Medicare
beneficiaries with over $15
billion in drug rebates and
discounts between 2010 and
2014; an average of $1,598 in
savings per beneficiary.
Free wellness visits
• 37 million seniors received
one or more free preventive
services, including the new
annual wellness visit, in 2013.
Source: Centers for Medicare & Medicaid Services.
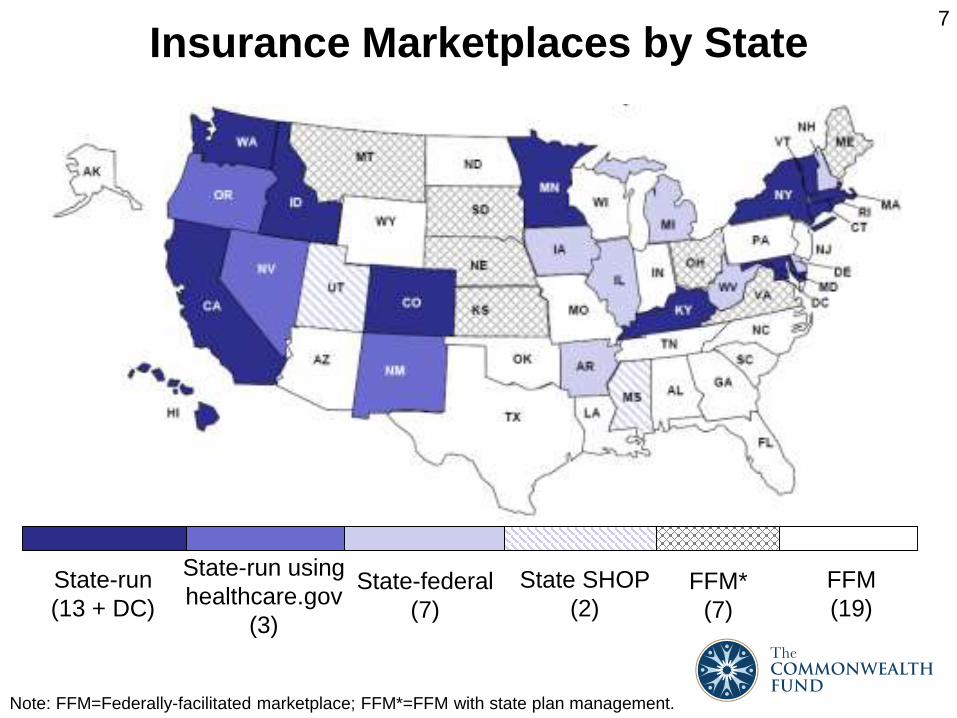
7
Insurance Marketplaces by State
State-run
(13 + DC)State-federal
(7)
State SHOP
(2)FFM*
(7)
FFM
(19)
Note: FFM=Federally-facilitated marketplace; FFM*=FFM with state plan management.
State-run using
healthcare.gov
(3)

8
Medicaid Expansion by State
Expanding
(22 + DC)
Customized
(6)
Under Discussion
(6)
Not Expanding
(16)

9Over 25 Million People Estimated to Have Insurance Under
the Provisions of the Affordable Care Act, as of March 2015
2.9
11.7 10.8
25.4
0
5
10
15
20
25
30
Change in the number of young adults ages 19-25 covered under a parent's policy*
Enrolled in a marketplace plan**
Enrolled in Medicaid/CHIP***
Total covered under provisions of the
ACA
Millions of people who have gained coverage or enrolled in a new plan under the Affordable Care Act
*Change in number of young adults ages 19-25 covered under a parent’s policy from 2010-2014.
**Number of Americans that have selected or been automatically reenrolled into a 2015 health
insurance plan through the Health Insurance Marketplace (11/15/14 – 2/15/15), including Special
Enrollment Period activity reported through Feb. 22,2015
***Increase in Medicaid and CHIP enrollment between October 2013 and December 2014.
Sources: CMWF Biennial Health Insurance Surveys (2010 and 2014) , HHS-ASPE, and CMS

10Multiple Sources Confirm Decline in Uninsured
Note: Most survey estimates are for adults ages 18-64. The Commonwealth Fund surveys’ estimates
are for adults ages 19-64.
Source: The Commonwealth Fund, Centers for Disease Control, RAND, Urban Institute.
Millions of non-elderly adults* who are uninsured
36
29
40.3
33.137
28
40.7
31.435.2
20.2
0
10
20
30
40
50
CM
WF
Bie
nn
ial
Su
rve
y, 2
01
2
CM
WF
Bie
nn
ial
Su
rve
y, 2
01
4
NH
IS,
20
12
NH
IS, J
an
-Ju
ne
2014
CM
WF
AC
A S
urv
ey,
J
uly
-Se
pt.
20
13
CM
WF
AC
A S
urv
ey,
Ap
ril-
Ju
ne
20
14
RA
ND
, S
ep
t. 2
01
3
RA
ND
, M
arc
h 2
014
Urb
an
HP
M S
urv
ey,
Q
3 2
01
3
Urb
an
, Q
1 2
01
5

11People with Incomes Under $48,000 for a Family of Four
Experienced the Largest Declines in Uninsured Rates
Note: FPL refers to federal poverty level. Income levels are for a family of four in 2013.
Source: The Commonwealth Fund Biennial Health Insurance Surveys (2001, 2003, 2005, 2010, 2012, and
2014).
Percent of adults ages 19–64
15
30
6
17
34
7
18
39
9
20
36
7
19
32
9
16
24
7
0
10
20
30
40
50
Total <200% FPL 200% FPL or more
2001 2003 2005 2010 2012 2014
<$47,100 $47,100+
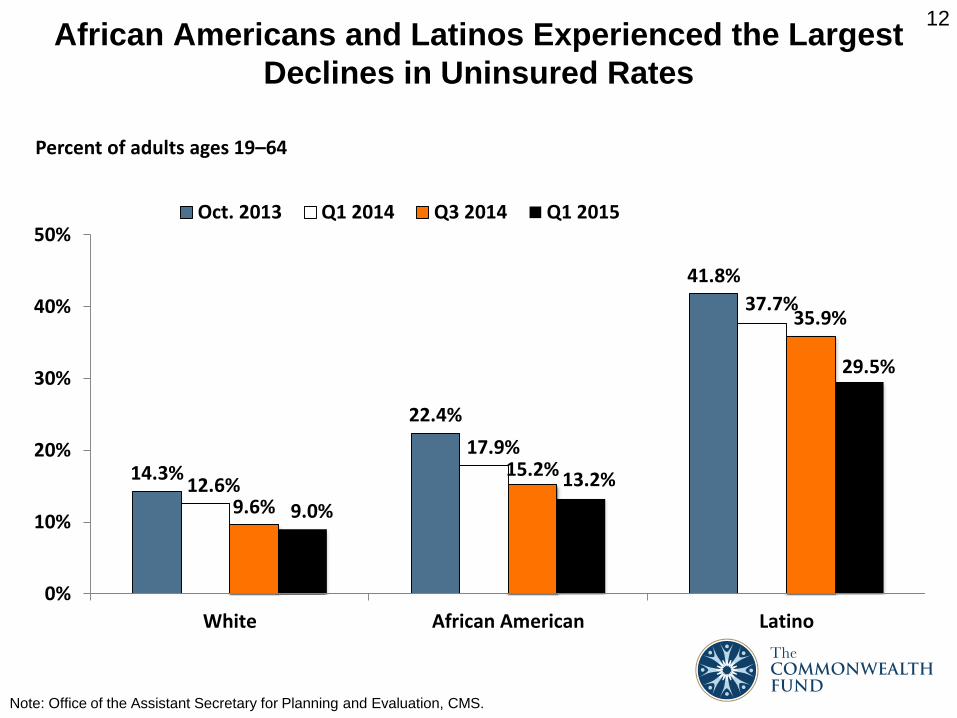
12African Americans and Latinos Experienced the Largest
Declines in Uninsured Rates
Note: Office of the Assistant Secretary for Planning and Evaluation, CMS.
Percent of adults ages 19–64
14.3%
22.4%
41.8%
12.6%
17.9%
37.7%
9.6%
15.2%
35.9%
9.0%
13.2%
29.5%
0%
10%
20%
30%
40%
50%
White African American Latino
Oct. 2013 Q1 2014 Q3 2014 Q1 2015

13
Source: The Commonwealth Fund Affordable Care Act Tracking Survey, April–June 2014.
Overall, how satisfied are you with this new health insurance?
Most Adults Newly Enrolled in Marketplace or
Medicaid Coverage are Satisfied with their Plan
Adults ages 19–64 who selected a private plan or enrolled in Medicaid through marketplace
or have had Medicaid for less than 1 year
43%
35%
6%
8%
8%Very satisfied
Not very satisfied
Somewhat satisfied
Not at all satisfied
Don’t know/refused
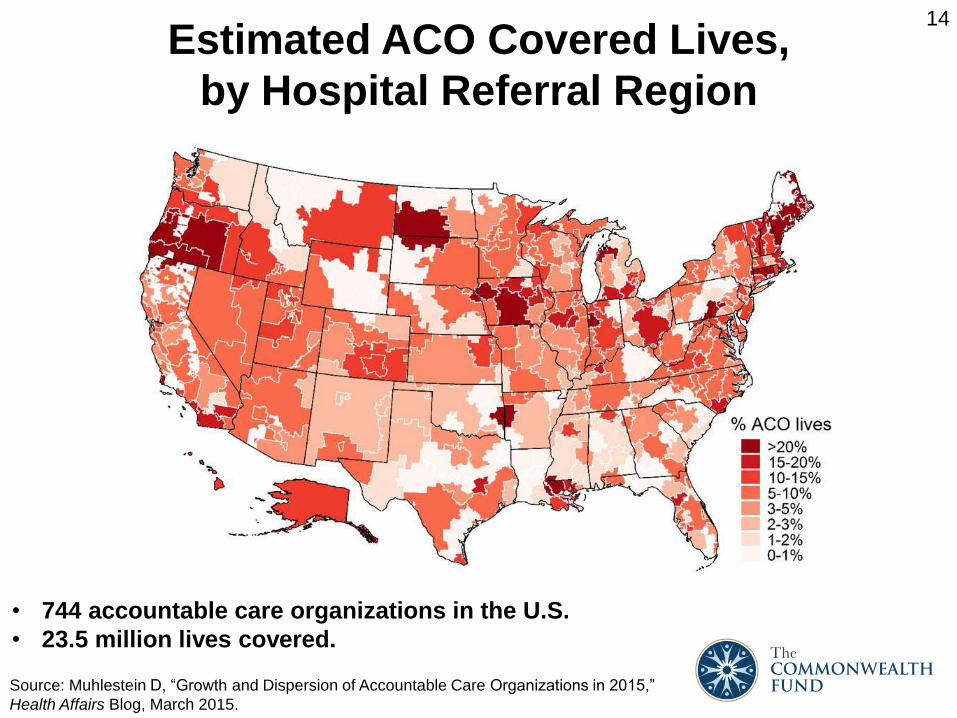
14
Estimated ACO Covered Lives,
by Hospital Referral Region
• 744 accountable care organizations in the U.S.
• 23.5 million lives covered.
Source: Muhlestein D, “Growth and Dispersion of Accountable Care Organizations in 2015,”
Health Affairs Blog, March 2015.

15
Medicare Hospital Readmissions Declining
Source: Furman J, “The Economic Benefits of the Affordable Care Act,” Presented at Center
for American Progress, April 2, 2015.
Percent, 12-month moving average

16
Decline in Hospital-Acquired Conditions Between
2010 and 2013 Prevents 50,000 Deaths
11,540
4,427
1,998
2,75020,272
1,297
1,150520 6,387
Adverse drug events
Catheter-associated UTIs
CLABIs
Falls
Pressure ulcers
Surgical site infections
Ventilator-associated pneumonia
Post-op venous thromboembolisms
Other
Number of prevented deaths by condition
Source: “Interim Update on 2013 Annual Hospital-Acquired Condition Rate and Estimates of
Cost Savings and Deaths Averted From 2010 to 2013,” December 2, 2014, CMS.

17
Spending Growth Rate Has Slowed in Recent Years
Source: Hartman M, Martin AB, Lassman D, Catlin A; the National Health Expenditure Accounts
Team. “National Health Spending In 2013: Growth Slows, Remains In Step With The Overall
Economy.” Health Affairs. 2014 Dec 3.
0%
1%
2%
3%
4%
5%
6%
7%
8%
9%
10%
2001 2003 2005 2007 2009 2011 2013
PercentNHE per capita spending growth

18
Problems: Forced and Unforced
• Unanticipated policy cancellations for non-compliant plans.
• Major failures during rollout of healthcare.gov and some
state exchanges.
• Coverage gap in states not expanding Medicaid.
• The famous 4 words.

19
What’s Next?
20
ACA: What’s Next?
• Coverage
– Two years of trench warfare between legislative and executive
branches.
– Congress will try to:
• Repeal mandates.
• Cut subsidies for purchase of private insurance in
marketplaces.
• Reduce generosity of Medicaid expansions.
– President will wield the veto pen.
– Compromises will reduce but not repeal or replace.

21
ACA: What’s Next?
• King v. Burwell
– Challenges the legality of subsidies granted to people
purchasing insurance in the 34 federally run marketplaces.
– Ruling for the plaintiffs would have significant consequences.
• 9.6 million fewer people insured through individual market.
• Premiums increase 47% in 2016.
– Decision expected June or July.

22
ACA: What’s Next?
• King v. Burwell: Possible responses to ruling for the plaintiffs.
– Congress:
• Pass a simple fix.
• Negotiate deal with the President.
• Do nothing.
– States.
• “Establish” an exchange.
– Lack of federal funding.
– Political barriers.
– Could take 12-18 months.
– Supreme Court.
• Grant a temporary stay.

23
ACA: What’s Next?
• Health Delivery System Reform
– General bipartisan support for many elements in the ACA.
– Continued implementation of:
• ACOs.
• Pay for value programs.
• SGR reforms.
• Rationalization of quality metrics.
– Attacks on spending for:
• CMMI.
• PCORI.
• Public health demonstration programs.

24
Question and Answer
Top Related