


Languages
Pages
Legal


FACTA UNIVERSITATIS Series: Economics and Organization Vol. 18, No 1, 2021, pp. 1 - 16
https://doi.org/10.22190/FUEO201102002Z
© 2021 by University of Niš, Serbia | Creative Commons Licence: CC BY-NC-ND
Original Scientific Paper
TESTING HECKSCHER-OHLIN-VANEK THEOREM
BY USING NORMALIZED TRADE BALANCE APPROACH1
UDC 332.053
Berislav Žmuk, Hrvoje Jošić
University of Zagreb, Faculty of Economics and Business, Croatia
Abstract. The study described here introduces new approach for testing the Heckscher-
Ohlin-Vanek (HOV) theorem based on the normalized trade balance concept. The
intention was to include in the analysis all countries worldwide but due to the lack of
data a certain number of countries had to be excluded. Overall 111 countries were
observed according to region and income level for the year 2014. The HOV model was
estimated using the sign test. It compared the expected sign of the normalized trade
balance or net exports, according to the SITC 2 product classification, with the relative
endowment of production factors intensively used in the production of a specific product.
Production factors were divided into groups such as produced capital, labour force and
natural resources further divided into forests, metals and minerals, oil, coal and gas,
pastureland and cropland. Researchers in R&D per million people variable represented
the impact of technological differences across countries. The results of the sign test have
shown that the HOV theorem held in 55% of cases. The percentage of matched signs was
highest for the non-OECD high income countries (75%) and lowest for the lower middle
income and low income countries (below 50%).
Key words: Heckscher-Ohlin-Vanek model, sign test, normalized trade balance
approach, the World
JEL Classification: F1, F2
1. INTRODUCTION
Classical theories of international trade observed price determination and trade pattern
only from the supply side. At that time labour was the only factor of production. Adam
Smith’s theory of absolute advantages determined the pattern of trade and specialization from
Received November 02, 2020 / Revised December 07, 2020 / Accepted December 09, 2020
Corresponding author: Berislav Žmuk Faculty of Economics and Business, University of Zagreb, Trg J. F. Kennedyja 6, HR-10000 Zagreb, Croatia
E-mail: [email protected]
2 B. ŽMUK, H. JOŠIĆ
the different labour productivity in countries, while David Ricardo’s theory of comparative
advantages was based on different relative labour productivity. After the Industrial
Revolution the capital was recognized as a factor of production as well. The neoclassical
theory of international trade, established in 1920s and 1930s, was based on the Heckscher-
Ohlin theory or also called the Factor Proportions Model (Heckscher, 1919 and Ohlin, 1924).
In the Heckscher-Ohlin theory there are two factors of production, labour and capital.
Comparative advantages are determined from the relative abundance of production factors.
A country which is relatively abundant in a certain factor of production should export a
commodity which intensively uses that factor of production. Leontief (1953) confronted the
Heckscher-Ohlin theory with data for the United States using 1947 input-output tables. He
came to the conclusion that the United States exported labour-intensive products and
imported capital-intensive products, which was in contrast with the Heckscher-Ohlin theory,
the result later named the Leontief paradox. The Heckscher-Ohlin theory has been subject of
rigorous empirical investigation by many scientists but with little success. The results
achieved on the sign test were often no better than flipping a coin. Vanek (1968) expanded
the standard Heckscher-Ohlin model on a multi-country, multi-factor and multi-commodity
framework and explained if a country’s endowment in a certain factor of production exceeds
that country’s share in total World’s GDP than that factor of production should be considered
abundant. The so called Heckscher-Ohlin-Vanek (HOV) model or factor content model
predicted that the content of relatively abundant factor embodied in export commodities
should be larger than the content embodied in import commodities. The HOV theorem,
however, did poorly in empirical research, primarily because of restrictive assumptions of the
very theorem. According to Davis et al. (1997), the HOV theorem is a central theorem in
international economics theory but empirically it is a flop. The empirical failure is owed
extensively to examining the theory in its least realistic form.
The goal of this paper is to introduce a new approach for testing the Heckscher-Ohlin-
Vanek theorem based on the normalized trade balance concept and its application by using
sign test. The novelty of our approach is implementation of normalized trade balance
concept alongside with the use of sign test instead of calculating the factor content of trade.
Therefore, the main advantage of this approach is simplification of the overall model by
replacing the complex and complicated input-output matrix calculation process with the
normalized trade balance. In addition, this simplified approach allows the larger sample of
countries to be included in the analysis. There are five chapters in the paper. After the
introduction, the second chapter provides literature review about empirical findings on the
HOV model. Data and methodology are presented in chapter three. In the fourth chapter
the results of the HOV model analysis are presented and elaborated while the last chapter
offers concluding remarks.
2. LITERATURE REVIEW
In this chapter, literature review of empirical studies on the HOV model after Vanek’s (1968) seminal paper are to be presented and elaborated. Bowen, Leamer and Sveikauskas (1987) examined the factor content of trade in a multi-factor and multi-country framework. The HOV theorem was tested using sign and rank test on twelve factors of production for 27 countries for the year 1967 by using the 1966 United States technology matrix. The number of correctly matched sign on the sign test was greater than 50% for eleven out of twelve factors
Testing Heckscher-Ohlin-Vanek theorem by Using Normalized Trade Balance Approach 3
and but greater than 70% for only four factors of production. The authors found that the main reasons why the HOV theorem has no strong support in data are disproportionate consumption, technological differences across countries and measurement errors. Kim (1991) used the factor content model to evaluate the trade patterns of Korea in trade with the United States and Japan using 1978 Korea’s and the United States’ total input requirements. He observed whether the factor abundance determines the sign of net exports. It was shown that the HOV theorem does not perform well in predicting trade patterns when differences in technological capabilities are ignored. Trefler (1995) investigated the features of data that led to the poor performance of the HOV theorem identifying pronounced patterns in the deviations from the HOV model. Important facts such as the case of missing trade and the endowments paradox have often gone unnoticed. Davis et al. (1997) used Japanese regional data to test the HOV model. The strict HOV theorem performed poorly. The authors made two modifications regarding the general model; they abandoned the notion of identical technologies across countries and focused on production and absorption instead of using trade data. Furthermore, when the assumption of universal factor price equalization was relaxed, the HOV model performed remarkably well. Maskus and Webster (1999) developed a version of the HOV theorem with parametric technological differences. The econometric model on factor contents of trade data, output and consumption for the United States and the United Kingdom allowed for factor-specific and industry-specific productivity differences. Davis and Weinsten (2001) emphasized the importance of intermediates, aggregation bias and differences in patterns of absorption. Choi (2004) relaxed the assumption of ideal factor price equalization deriving a modified HOV theorem to predict the factor content of trade. The modified HOV theorem used input-output coefficients of the source country for each traded good which resulted in approval of theorem validity. Romalis (2004) derived and examined the factor proportions model in commodity markets. He made modifications in the standard Heckscher-Ohlin model by introducing transport costs and monopolistic competition. There was support in data for the Rybczynski effect for fast-growing economies. Chakrabarti (2005) demonstrated the importance of accounting for the absorption of inputs in a factor augmenting model of international productivity differences. The absence of such accounting can lead to biases in calculation of productivity parameters and could raise concerns about the decision about the HOV theorem acceptance or rejection. Requena et al. (2005) studied the HOV model empirically using Spanish regional data. After relaxing the strict assumptions of the HOV theorem such as factor price equalization, identical homothetic preferences and Hicks neutral technological differences, the model performed poorly.
Nishioka (2005) explored the international trade within the HOV model for the developed OECD countries. The knowledge factor was introduced into the HOV framework. It played an important role in determining comparative advantages for technologically advanced OECD countries. The strict HOV model with the inclusion of knowledge capital held on its own. Maskus and Nishioka (2006) estimated factor productivities from individual technology data for 15 OECD countries. The HOV theorem showed ability to explain North-South factor trade depending on factor abundance and productivity gaps. Factor-augmenting productivity differences were found as appropriate modification of the HOV theorem. Artal-Tur et al. (2008) built an assemble dataset for 17 Spanish regions for the years 1995, 2001 and 2004 by employing regional specific input-output tables. The inclusion of intermediate inputs in the computation of technology matrix slightly improved the number of correct matches on the sign test. Lu, Milner and Yu (2009) applied factor content tests using data for 58 countries and six factors of production. The results in general showed weak support for the HOV model with minor improvements achieved after adjusting for technology differences across countries.
4 B. ŽMUK, H. JOŠIĆ
Srivastava (2012) tackled the HOV theorem with the help of the excess supply approach by examining trade performances of ten manufacturing industries in 46 countries for the year 2009. The major source of comparative advantages were capital stock and secondary and higher educated labour. The HOV theorem proved to be valid in more than 60% of cases. Srivastava and Mathur (2014) performed partial and complete tests to investigate the validity of the HOV theorem using India’s industry level data from 1989 to 2008 and five factors of production (primary educated labour force, secondary and tertiary level of educated labour force, capital and arable land). Measured signs were correct in more than 50% of cases. Zimring (2015) observed a large and rapid expansion of labour force in West Bank due to near-elimination of commuting into Israel. Production shifted to more labour-intensive industries (the Rybczynski effect). Allowing for district specific deviations the changes in production were consistent with the HOV model of trade. Jošić (2016) tested the factor proportions model in the case of Croatia based on the bilateral merchandise trade data between Croatia and the countries of the European Union and worldwide using the sign test. The results of the sign test have shown that Croatia does not use its comparative advantages effectively, leading to the rejection of the factor proportions model. Wu et al. (2017) investigated the greenhouse gas emissions intensities in Canadian agriculture and processed food industry. Natural resources were found to be the determining factor of Canadian agricultural structure whereby Canadian exports were more capital-intensive than imports.
3. DATA AND METHODOLOGY
The intention was to include in the analysis all countries worldwide. Unfortunately, due to the lack of data a certain number of countries had to be excluded from the analysis. Despite that, 111 countries were observed overall. Table 1 reveals that all parts of the World are well represented regionally. Table 2 shows the distribution of observed countries according to their income. The full list of observed countries is displayed in Table 7.
Table 1 Distribution of observed countries according to their geographic region
Region Number of countries
East Asia & Pacific 13 Europe & Central Asia 37 Latin America & Caribbean 16 Middle East & North Africa 12 North America 2 South Asia 4
Sub-Saharan Africa 27 Total 111
Source: authors according to World Bank (2018, 2019a-d) and Trade Map (2019).
Table 2 Distribution of observed countries according to their income
Income level Number of countries
Low income 17 Lower middle income 27 Upper middle income 24 High income: non-OECD 14 High income: OECD 29 Total 111
Source: authors according to World Bank (2018, 2019a-d) and Trade Map (2019).

Testing Heckscher-Ohlin-Vanek theorem by Using Normalized Trade Balance Approach 5
In order to perform the factor endowment analysis, the data have been collected for 10
different variables representing factors of production, GDP and technology differences.
The starting point for the variable selection were the previous findings in this field of
research with papers presented in the literature review. The final decision upon the list of
variables which were included in the analysis, was made based on data availability. World
Bank (2018, 2019a-d) and Trade Map (2019) databases were used as data sources. The
complete list of observed variables is displayed in Table 3.
Table 3 List of observed variables
Variable group Variable code Variable
Income GDP Gross domestic product (GDP) (in USD)
Production factors PCAP Produced capital (in USD)
LABF Labour force (number of persons)
Natural resources
FOR Forests (in USD)
MMIN Metals and minerals (in USD)
OCNG Oil, coal and natural gas (in USD)
PAST Pastureland (in USD)
CROP Cropland (in USD)
FISH Fishing (in metric tons)
Technology R&D Number of researchers in R&D per million people
Source: authors according to World Bank (2018, 2019a-d) and Trade Map (2019).
Furthermore, the data availability determined the observed period as well. It has been
decided that data which are available for the most recent period will be collected.
According to the observed databases it turned out that the data for the year 2014 are the
most recent one for the most of observed variables. Unfortunately, the R&D variable had
missing data for 46 countries (41.44%). In these cases, the data for the period closest to the
year 2014 were used as an approximation for 2014 data. The fact that the missing values
were imputed by using data from different periods should be taken as a limitation of the
research. Therefore, the results where R&D variable was included in the analysis should
be observed and discussed with special attention. According to Erlat and Erlat (2003) products
can be grouped into five groups with a different product factor intensity level. The goods have
been classified into five product groups according to their product intensity. Those are raw
material intensive goods (RMIG), labour-intensive goods (LIG), capital-intensive goods
(CIG), easy-to-imitate research-intensive goods (EIRIG) and difficult-to-imitate research-
intensive goods (DIRIG). The HOV model is defined as follows (Feenstra, 2003):
𝐹𝑖 = 𝑉𝑖 − 𝑠𝑖𝑉𝑤 (1)
where 𝐹𝑖 is the factor content of trade of country 𝑖, 𝑉𝑖 is the factor abundance of the country
𝑖, 𝑠𝑖 is the share of 𝑖 -th country’s GDP in the World GDP and 𝑉𝑤 is the World factor
abundance. In the traditional HOV model the signs on the left and right side of the Equation
1 are compared. Standard sign tests of the HOV theorem go roughly as follows: (1)
calculate the imports and exports of a country in terms of factors embodied in the goods
that are traded, (2) compare the country's share of World’s GDP to a country's share of
each factor of endowment in the total World’s endowment of that factor and (3) a country
should be a net exporter of products that intensively uses abundant factor of production.
6 B. ŽMUK, H. JOŠIĆ
This paper implements new approach to explore the validity of the Heckscher-Ohlin-Vanek
theorem by using normalized trade balance concept on the left side of the Equation 1.
Therefore, instead of calculating net factor content of trade from input-output tables, the
normalized trade balance was calculated. The normalized trade balance is calculated using
the following equation:
𝑇𝐵𝑖𝑗 =𝐸𝑖𝑗−𝐼𝑖𝑗
𝐸𝑖𝑗+𝐼𝑖𝑗 (2)
where 𝑇𝐵𝑖𝑗 is trade balance of country 𝑖 for the product group 𝑗, 𝐸𝑖𝑗 is export of country 𝑖
for product group 𝑗 and 𝐼𝑖𝑗 is the import of country 𝑖 for the product group 𝑗. According to
the Equation 2, if the export of products in a country 𝑖 is larger than the import of the same
product groups, the resulting sign is positive and vice versa. The Equation 2 assumes
identical technology and factor content of imports and exports, which can be observed as
a disadvantage of new the approach. The normalized trade balance alone, however, does
not measure the factor content of trade. It has been used as a concept in the literature for
decades as an alternative measure for the revealed comparative advantage. Therefore, in
the paper the sign test is conducted by comparing the expected sign of the net exports of
SITC 2 product classification with the relative endowment of production factors intensively
used in the production of a specific product, as given here:
𝑆𝑖𝑔𝑛(𝑇𝐵) = 𝑆𝑖𝑔𝑛(𝑉𝑖𝑘 − 𝑠𝑖𝑉𝑤
𝑘) (3)
This paper takes a different approach, testing the HOV theorem good-by-good. That is,
instead of testing whether country's total trade in a factor is as we would expect from the
country's factor abundance, it tests, for each good the country trades, whether it is traded
(on net) in the right direction. For example, if a country is labour abundant, it tests whether
each good that is produced with the labour intensive technology is (on net) exported. The
whole analysis procedure can be briefly described as follows. Firstly, the standardized trade
balances for each of 96 product groups (there are no groups of products with codes 00, 77
and 98 whereas the product group 99 includes everything that was not classified before and
because of that it is omitted from the analysis) of all 111 countries are calculated separately.
Afterwards, the values of variables for each observed country are compared to the World
value and the corresponding share (proportion) is calculated. Due to the specific
characteristics of the R&D variable, for this variable the countries values are compared to
the World average value. The resulting shares or proportions are then compared to the GDP
share of the observed country in the overall World GDP value. If the calculated share is
higher than the GDP share, it is assumed that the observed country is abundant in that factor
of production. Consequently, the conclusion is that the country should export product
which intensively uses the abundant factor of production and in that case the positive sign
will be achieved on the sign test. Finally, two estimated signs are compared and it is
checked whether they match or not. It is assumed that the sign test will result in a match in
at least 50% of cases.

Testing Heckscher-Ohlin-Vanek theorem by Using Normalized Trade Balance Approach 7
4. RESULTS AND DISCUSSION
The sign test will be conducted by using the total of 10 variables observed in the data
and methodology section. In order to get the insight about the distributions of the observed
variables in Table 4, the basic descriptive statistics of results is provided.
Table 4 Descriptive statistics results of the observed variables, n=111 selected countries,
data for 2014
Variable Unit Statistics
Average St. Dev. Coeff. var. Min 1st quart. Median 3rd quart. Max
GDP bil. USD 669 2,038 304 1 20 66 405 17,428
PCAP bil. USD 2,688 8,164 304 3 66 236 1,425 68,943
LABF mill. per. 27 89 332 0 2 6 19 787
MMIN bil. USD 87 315 362 0 0 3 21 2,101
FOR bil. USD 21 52 251 0 1 5 16 353
OCNG bil. USD 275 765 279 0 0 4 80 4,952
PAST bil. USD 119 350 295 0 10 29 75 2,848
CROP bil. USD 225 963 427 0 10 43 123 9,676
FISH mill. MT 2 8 479 0 0 0 1 76
R&D no. per mill. 1,566 2,024 129 7 70 565 2,640 7,311
Source: authors’ calculation.
According to the descriptive statistics results from the Table 4 it can be easily concluded
that there are huge differences between 111 observed countries for each of the selected
variables. The lowest variation in data, according to the coefficient of variation, seems to
be for the R&D variable (129%) whereas the largest is for the FISH variable (479%). The
comparison of differences between the minimum and the maximum values shows that data
ranges are very wide. If the values of quartiles are observed, it can be concluded that all
variables are highly positively skewed.
The main descriptive statistics results of calculated shares for the observed countries in
the whole World value are shown in Table 5. As expected, according to the results from
Table 4, huge differences in shares (proportions) are present here as well.
Table 5 Descriptive statistics of calculated shares for the observed countries in the whole
World value, n=111 selected countries, data for 2014
Statistics Variable
GDP PCAP LABF MMIN FOR OCNG PAST CROP FISH R&D
Average 0.0085 0.0089 0.0081 0.0086 0.0087 0.0070 0.0085 0.0087 0.0081 1.0628
St.Dev. 0.0258 0.0269 0.0268 0.0310 0.0218 0.0196 0.0250 0.0372 0.0390 1.3742
Coeff.Var. 304 304 332 362 251 279 295 427 479 129
Min 0.0000 0.0000 0.0001 0.0000 0.0000 0.0000 0.0000 0.0000 0.0000 0.0049
1st quar. 0.0002 0.0002 0.0007 0.0000 0.0004 0.0000 0.0007 0.0004 0.0001 0.0476
Median 0.0008 0.0008 0.0019 0.0003 0.0019 0.0001 0.0021 0.0016 0.0009 0.3832
3rd quar. 0.0051 0.0047 0.0058 0.0021 0.0067 0.0020 0.0054 0.0048 0.0032 1.7920
Max 0.2202 0.2271 0.2360 0.2069 0.1471 0.1267 0.2036 0.3736 0.3934 4.9628
Source: authors’ calculation.

8 B. ŽMUK, H. JOŠIĆ
Fig. 1 Factor endowment shares, top five countries according to the GDP share in the
World value and the rest of the World, data from 2014
In Figure 1 the top five countries according to the share of GDP value in the total World
GDP value are emphasized. According to the Figure 1, those five countries (the United
States of America, China, Japan, Germany and the United Kingdom) together encompass
the half of the World’s total GDP. What’s more intriguing, they together dispose with more
than half of the World’s total produced capital. In other observed variables, the main
contributor to the share of those five countries in the total World’s values is China meaning
that China is abundant in these factors of production. Whereas in Figure 1 five countries
with the largest GDP share in the World value were pointed out, in Table 6 countries with
the lowest shares of each variable in the whole World value were displayed.
Table 6 The last five observed countries according to observed variables values compared
to the World level, data for 2014
Variable Statistics Rank 111 Rank 110 Rank 109 Rank 108 Rank 107
GDP Country Gambia Swaziland Togo Malawi Moldova
Value 1.5911E-05 5.5317E-05 5.7738E-05 7.6427E-05 1.0089E-04
PCAP Country Gambia Togo Malawi Rwanda Madagascar Value 9.8129E-06 4.6023E-05 5.1648E-05 5.7452E-05 7.1365E-05
LABF Country Iceland Malta Luxembourg Swaziland Mauritius
Value 5.9652E-05 5.9865E-05 8.2163E-05 1.2904E-04 1.7930E-04
MMIN Country
Bahrain, Belgium, Cambodia, Denmark, El Salvador, Estonia, Gambia, Iceland, Italy, Kuwait, Latvia,
Lithuania, Malta, Mauritius, Moldova, Nepal, Netherlands, Paraguay, Qatar, Singapore, Slovenia, Swaziland,
United Arab Emirates, West Bank and Gaza Value 0
FOR Country Malta, West Bank and Gaza Bahrain Iceland Oman
Value 0 2.1372E-07 5.3979E-07 8.9456E-07
OCNG Country
Belgium, Burkina Faso, Cambodia, Costa Rica, El Salvador, Finland, Gambia, Honduras, Iceland, Kenya,
Latvia, Luxembourg, Madagascar, Mali, Malta, Mauritius, Namibia, Nicaragua, Panama, Paraguay, Portugal,
Rwanda, Singapore, Sri Lanka, Sweden, Switzerland, Togo, Uganda, Uruguay, West Bank and Gaza Value 0
PAST Country Singapore Malta Bahrain Mauritius Qatar
Value 1.4069E-07 1.4813E-05 3.4674E-05 3.5316E-05 6.5091E-05
CROP Country Iceland Singapore Bahrain Malta Luxembourg
Value 2.4472E-06 6.9917E-06 1.0849E-05 1.7096E-05 1.7712E-05
FISH Country Luxembourg Swaziland Botswana Macedonia, FYR Jordan Value 0 8.5295E-07 6.0379E-06 7.7334E-06 9.0878E-06
R&D Country Congo, Dem. Rep. Niger Rwanda Lao PDR Tanzania
Value 4.9069E-03 5.0343E-03 8.3818E-03 1.0743E-02 1.2448E-02
Source: authors’ calculation.

Testing Heckscher-Ohlin-Vanek theorem by Using Normalized Trade Balance Approach 9
Table 7 Results of the sign tests according to the observed countries, data for 2014
Country Sign matching Share of
matched signs
Country
Sign matching Share of
matched signs Yes No Yes No
Albania 27 68 28% Madagascar 52 44 54%
Argentina 75 21 78% Malawi 47 49 49%
Australia 57 39 59% Malaysia 47 49 49%
Austria 58 38 60% Mali 39 57 41%
Bahrain 84 12 88% Malta 71 25 74%
Belgium 47 49 49% Mauritius 59 37 61%
Bolivia 49 47 51% Mexico 60 36 63%
Bosnia and Herzegovina 37 59 39% Moldova 41 54 43%
Botswana 50 46 52% Morocco 35 61 36%
Brazil 65 31 68% Mozambique 40 56 42%
Bulgaria 35 61 36% Namibia 54 42 56%
Burkina Faso 46 48 49% Nepal 48 48 50%
Cambodia 50 45 53% Netherlands 62 34 65%
Canada 54 42 56% Nicaragua 39 57 41%
Chad 42 53 44% Niger 23 70 25%
Chile 74 22 77% Nigeria 36 60 38%
China 61 35 64% Norway 65 31 68%
Colombia 48 48 50% Oman 87 8 92%
Congo, Dem. Rep. 30 66 31% Pakistan 57 39 59%
Congo, Rep. 23 72 24% Panama 79 17 82%
Costa Rica 49 47 51% Papua New Guinea 43 53 45%
Cote d'Ivoire 48 48 50% Paraguay 49 47 51%
Croatia 63 33 66% Philippines 52 44 54%
Denmark 49 47 51% Poland 47 49 49%
Ecuador 44 52 46% Portugal 44 52 46%
Egypt, Arab rep. 49 47 51% Qatar 88 8 92%
El Salvador 45 51 47% Romania 34 59 37%
Estonia 57 39 59% Russian Federation 63 33 66%
Ethiopia 48 47 51% Rwanda 43 53 45%
Finland 64 32 67% Senegal 45 51 47%
France 59 37 61% Singapore 67 29 70%
Gambia, The 41 53 44% Slovak Republic 59 37 61%
Georgia 35 61 36% Slovenia 58 38 60%
Germany 51 45 53% South Africa 36 59 38%
Ghana 41 55 43% Spain 45 51 47%
Greece 54 42 56% Sri Lanka 60 36 63%
Guatemala 43 53 45% Swaziland 35 61 36%
Honduras 39 57 41% Sweden 63 33 66%
Hungary 45 51 47% Switzerland 63 33 66%
Iceland 57 39 59% Tanzania 50 46 52%
India 62 34 65% Thailand 63 33 66%
Indonesia 59 37 61% Togo 41 51 45%
Iraq 87 3 97% Tunisia 43 53 45%
Ireland 66 30 69% Turkey 64 32 67%
Italy 44 52 46% Uganda 50 46 52%
Japan 68 28 71% Ukraine 39 56 41%
Jordan 54 41 57% United Arab Emirates 70 26 73%
Kazakhstan 72 23 76% United Kingdom 68 28 71%
Kenya 50 46 52% United States 59 37 61%
Korea, Rep. 64 32 67% Uruguay 63 33 66%
Kuwait 89 7 93% Venezuela, RB 75 21 78%
Lao PDR 45 51 47% Vietnam 53 42 56%
Latvia 54 42 56% West Bank and Gaza 30 62 33%
Lithuania 58 38 60% Zambia 32 64 33%
Luxembourg 61 35 64% Zimbabwe 43 53 45%
Macedonia, FYR 41 54 43%
Source: authors’ calculation.
The calculated shares for the observed countries in the whole World value are paired
with a certain product groups and are compared with the GDP share. In the case when the
calculated share for a certain product group in a country is larger than the share of GDP in
10 B. ŽMUK, H. JOŠIĆ
total World’s GDP value, a positive sign is attached to that product group. Namely, in that
case, it is expected that the country should have a positive net exports in that product. The
Equation 2 is used to calculate the normalized trade balances for each product groups and
for each country. If the normalized trade balance results in a positive score, a positive sign
should also be obtained for country’s factor endowment. The sign test is conducted by
checking whether the two estimated signs match or not. The assumption is that the factor
endowment signs and normalized trade balance signs would match in at least 50% of cases.
In Table 7 the results of the sign tests for each of the observed countries are shown.
Overall sign matching rate turned out to be 55% (5,845 matched signs and 4,774 unmatched
signs) which is similar to what has been found out within the standard signs test in previous
studies leading to the conclusion that HOV theorem does not offer a very good description
of reality. The countries with the highest sign matching rates, which are above 90%, are
Iraq (97%), Kuwait (93%), Qatar (92%) and Oman (92%). On the other hand, countries
with the lowest sign matching rates, which are below 30%, are the Republic of the Congo
(24%), Niger (25%) and Albania (28%).
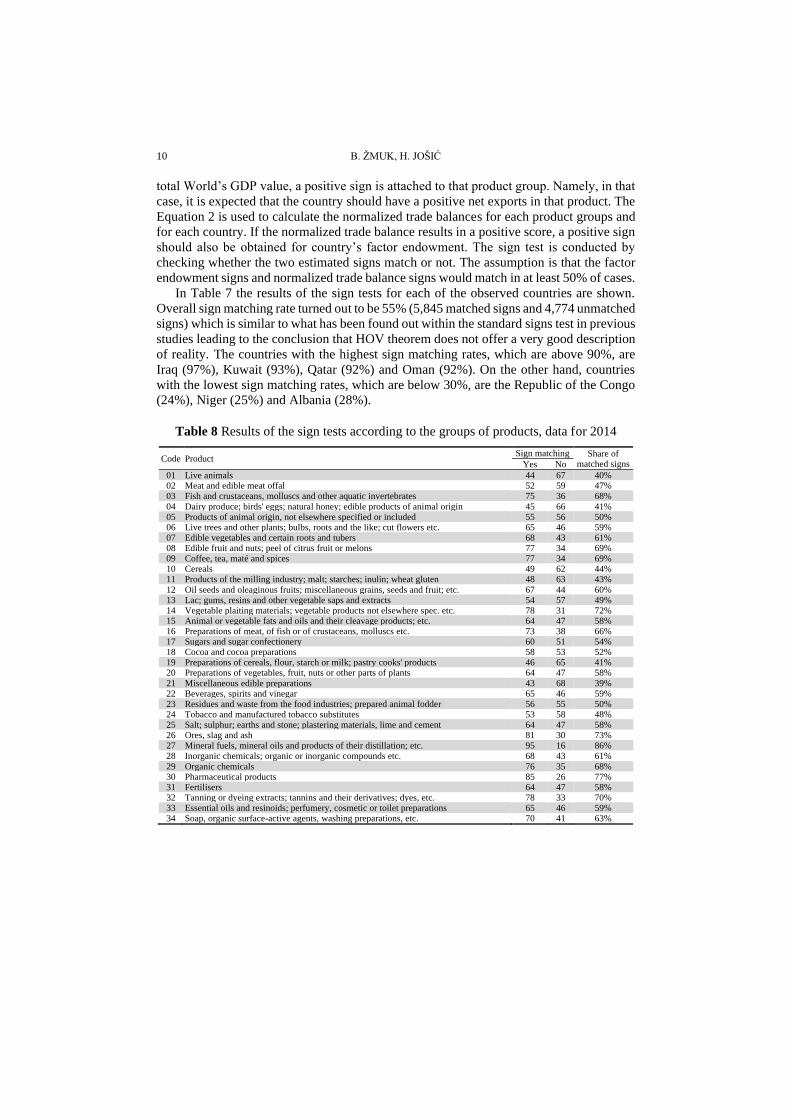
Table 8 Results of the sign tests according to the groups of products, data for 2014
Code Product Sign matching Share of
matched signs Yes No
01 Live animals 44 67 40% 02 Meat and edible meat offal 52 59 47% 03 Fish and crustaceans, molluscs and other aquatic invertebrates 75 36 68%
04 Dairy produce; birds' eggs; natural honey; edible products of animal origin 45 66 41% 05 Products of animal origin, not elsewhere specified or included 55 56 50% 06 Live trees and other plants; bulbs, roots and the like; cut flowers etc. 65 46 59% 07 Edible vegetables and certain roots and tubers 68 43 61% 08 Edible fruit and nuts; peel of citrus fruit or melons 77 34 69% 09 Coffee, tea, maté and spices 77 34 69% 10 Cereals 49 62 44% 11 Products of the milling industry; malt; starches; inulin; wheat gluten 48 63 43%
12 Oil seeds and oleaginous fruits; miscellaneous grains, seeds and fruit; etc. 67 44 60% 13 Lac; gums, resins and other vegetable saps and extracts 54 57 49% 14 Vegetable plaiting materials; vegetable products not elsewhere spec. etc. 78 31 72% 15 Animal or vegetable fats and oils and their cleavage products; etc. 64 47 58% 16 Preparations of meat, of fish or of crustaceans, molluscs etc. 73 38 66% 17 Sugars and sugar confectionery 60 51 54% 18 Cocoa and cocoa preparations 58 53 52% 19 Preparations of cereals, flour, starch or milk; pastry cooks' products 46 65 41% 20 Preparations of vegetables, fruit, nuts or other parts of plants 64 47 58%
21 Miscellaneous edible preparations 43 68 39% 22 Beverages, spirits and vinegar 65 46 59% 23 Residues and waste from the food industries; prepared animal fodder 56 55 50% 24 Tobacco and manufactured tobacco substitutes 53 58 48% 25 Salt; sulphur; earths and stone; plastering materials, lime and cement 64 47 58% 26 Ores, slag and ash 81 30 73% 27 Mineral fuels, mineral oils and products of their distillation; etc. 95 16 86% 28 Inorganic chemicals; organic or inorganic compounds etc. 68 43 61%
29 Organic chemicals 76 35 68% 30 Pharmaceutical products 85 26 77% 31 Fertilisers 64 47 58% 32 Tanning or dyeing extracts; tannins and their derivatives; dyes, etc. 78 33 70% 33 Essential oils and resinoids; perfumery, cosmetic or toilet preparations 65 46 59% 34 Soap, organic surface-active agents, washing preparations, etc. 70 41 63%

Testing Heckscher-Ohlin-Vanek theorem by Using Normalized Trade Balance Approach 11
Code Product Sign matching Share of
matched signs Yes No
35 Albuminoidal substances; modified starches; glues; enzymes 85 26 77% 36 Explosives; pyrotechnic products; matches; pyrophoric alloys; etc. 74 37 67% 37 Photographic or cinematographic goods 81 30 73% 38 Miscellaneous chemical products 82 29 74% 39 Plastics and articles thereof 85 26 77%
40 Rubber and articles thereof 35 76 32% 41 Raw hides and skins (other than fur skins) and leather 62 49 56% 42 Articles of leather; saddlery and harness; travel goods, handbags etc. 55 56 50% 43 Fur skins and artificial fur; manufactures thereof 45 60 43% 44 Wood and articles of wood; wood charcoal 78 33 70% 45 Cork and articles of cork 49 62 44% 46 Manufactures of straw, of esparto or of other plaiting materials; etc. 70 41 63% 47 Pulp of wood or of other fibrous cellulosic material; recovered etc. 60 50 55%
48 Paper and paperboard; articles of paper pulp, of paper or of paperboard 39 72 35% 49 Printed books, newspapers, pictures and other products of the printing etc. 37 74 33% 50 Silk 51 58 47% 51 Wool, fine or coarse animal hair; horsehair yarn and woven fabric 38 73 34% 52 Cotton 55 56 50% 53 Other vegetable textile fibres; paper yarn and woven fabrics of paper yarn 54 57 49% 54 Man-made filaments; strip and the like of man-made textile materials 44 67 40% 55 Man-made staple fibres 46 65 41%
56 Wadding, felt and nonwovens; special yarns; twine, cordage, ropes etc. 43 68 39% 57 Carpets and other textile floor coverings 50 61 45% 58 Special woven fabrics; tufted textile fabrics; lace; tapestries; etc. 42 69 38% 59 Impregnated, coated, covered or laminated textile fabrics; etc. 36 75 32% 60 Knitted or crocheted fabrics 36 74 33% 61 Articles of apparel and clothing accessories, knitted or crocheted 71 40 64% 62 Articles of apparel and clothing accessories, not knitted or crocheted 70 41 63% 63 Other made-up textile articles; sets; worn clothing, etc. 59 52 53% 64 Footwear, gaiters and the like; parts of such articles 61 50 55%
65 Headgear and parts thereof 57 54 51% 66 Umbrellas, sun umbrellas, walking sticks, seat-sticks, whips, etc. 49 61 45% 67 Prepared feathers and down and articles made of feathers or of down; etc. 60 51 54% 68 Articles of stone, plaster, cement, asbestos, mica or similar materials 42 69 38% 69 Ceramic products 47 64 42% 70 Glass and glassware 42 69 38% 71 Natural or cultured pearls, precious or semi-precious stones, etc. 65 45 59% 72 Iron and steel 70 41 63%
73 Articles of iron or steel 72 39 65% 74 Copper and articles thereof 72 39 65% 75 Nickel and articles thereof 66 45 59% 76 Aluminium and articles thereof 68 43 61% 78 Lead and articles thereof 55 55 50% 79 Zinc and articles thereof 72 38 65% 80 Tin and articles thereof 59 50 54% 81 Other base metals; cermets; articles thereof 59 49 55%
82 Tools, implements, cutlery, spoons and forks, of base metal; etc. 41 70 37% 83 Miscellaneous articles of base metal 42 69 38% 84 Machinery, mechanical appliances, nuclear reactors, boilers; parts thereof 87 24 78% 85 Electrical machinery and equipment and parts thereof; etc. 84 27 76% 86 Railway or tramway locomotives, rolling stock and parts thereof; etc. 81 30 73% 87 Vehicles other than railway or tramway rolling stock, and parts etc. 78 33 70% 88 Aircraft, spacecraft, and parts thereof 75 35 68% 89 Ships, boats and floating structures 76 34 69% 90 Optical, photographic, cinematographic, measuring, checking, etc. 91 20 82%
91 Clocks and watches and parts thereof 74 37 67% 92 Musical instruments; parts and accessories of such articles 54 57 49% 93 Arms and ammunition; parts and accessories thereof 32 66 33% 94 Furniture; bedding, mattresses, mattress supports, cushions etc. 50 61 45% 95 Toys, games and sports requisites; parts and accessories thereof 52 59 47% 96 Miscellaneous manufactured articles 43 68 39% 97 Works of art, collectors' pieces and antiques 55 55 50%
Total 5,845 4,774 55%
Note: due to the limited space, the titles of product groups have been cut.
Source: authors’ calculation.

12 B. ŽMUK, H. JOŠIĆ
Table 8 shows the results of the sign tests according to the product groups. The product
groups with the highest sign matching rates, which are above 80%, are Mineral fuels,
mineral oils and products of their distillation; bituminous substances; etc. – code 27 (86%)
and Optical, photographic, cinematographic, measuring, checking, precision, medical or
surgical etc. – code 90 (82%). On the other hand, the product groups with the lowest sign
matching rates, which are below 35%, are Rubber and articles thereof – code 40 (32%),
Impregnated, coated, covered or laminated textile fabrics; textile articles of a kind suitable
etc. – code 59 (32%), Arms and ammunition; parts and accessories thereof – code 93 (33%),
Knitted or crocheted fabrics – code 60 (33%), Printed books, newspapers, pictures and
other products of the printing industry; manuscripts – code 49 (33%) and Wool, fine or
coarse animal hair; horsehair yarn and woven fabric – code 51 (34%).
In Figure 2 the percentages of matched signs according to geographical region of a country
are shown. The most successful matched signs rate was achieved in countries from the Middle
East and North Africa (69%). The key finding is that HOV mainly holds in oil-rich economies.
One of the reasons for this could be a focus on exports of only one essential product, oil, but a
more detailed analysis should be conducted to validate this result. On the other hand, only
countries from Sub-Saharan Africa achieved the percentage of matched signs below 50%.
Fig. 2 Percentage of matched signs according to geographical region of a country, n=111
observed countries, data for 2014
Fig. 3 Percentage of matched signs according to income level of countries, n=111 observed
countries, data for 2014

Testing Heckscher-Ohlin-Vanek theorem by Using Normalized Trade Balance Approach 13
The successfulness of signs matching was observed according to the country income
level as well. Figure 3 shows that the highest percentage of matched signs is achieved for
countries having high income and which are not members of the Organisation for
Economic Cooperation and Development (OECD). Countries with lower middle income
(46%) and low income (45%) achieved lower percentage of matched signs in comparison
to the benchmark value of 50%. It could be asked: why do rich countries have higher
matching rates than poor countries? The reason could be more efficient use of country's
comparative advantages and the specialization in production and export.
Fig. 4 Histogram of distribution of matched signs, n=111 observed countries, data for 2014
Finally, in Figure 4 the histogram of distribution of matched signs across countries is
shown. It turned out that most countries (32) have a percentage of matched signs between
40% and 50%. It has to be emphasized that three countries, out of thirty-two, have a
percentage of matched signs that equals 50%. However, 68 countries or 61% of observed
countries have a percentage of matched signs above the benchmark value of 50%.
Previous empirical tests mainly failed to prove HOV theorem, or did so only in a certain
extent, which provides ground for further (amended) tests. We should keep in mind that
completely random pattern of signs, such as obtained by flipping a coin, would still
generate correct signs 50% of the time in a large sample. Overall result of the sign test
conducted in this paper is only 55% of matched signs, which is not enough to present it as
a proof of HOV theorem validity. Therefore, the sign test must do considerably better in
order to be concluded that the HOV theorem is empirically sound. The advantage of this
approach is that it allows for the larger sample of countries to be included in the analysis.
Disadvantage of this approach is that it assumes the identical technology in countries
despite the inclusion of the R&D variable. Also gross value of trade flows does not reveal
country's value added comprised in these flows. For example, China's huge exports of hi-
14 B. ŽMUK, H. JOŠIĆ
tech electronics do not represent its net exports of capital intensive and R&D intensive
products, because its value added in this sector is different from value added upward in the
global value chain.
5. CONCLUSIONS
This paper introduces new approach for testing the Heckscher-Ohlin-Vanek theorem.
The HOV theorem was tested in the case of 111 countries worldwide. Instead of calculating
the factor content requirements based on the input-output tables, the normalized trade
balance was calculated. The products or goods are divided into five groups according to
their production intensity (labour-intensive goods, capital intensive goods, natural-resources
intensive goods, easy-to-imitate technology intensive goods and hard-to-imitate technology
intensive goods). Furthermore, the countries’ factors of production are divided into produced
capital, labour force and natural resources further divided into six factors. The sign test
inspected correct matching signs between normalized trade balance indices and factor
endowments for each country and product according to the SITC 2 classification of
products. Overall sign matching rate turned out to be 55% (5,845 matched signs and 4,774
unmatched signs). Countries with the highest sign matching rates of above 90% were Iraq
(97%), Kuwait (93%), Qatar (92%) and Oman (92%). Countries with the lowest sign matching
rates, of below 30% were the Republic of the Congo (24%), Niger (25%) and Albania
(28%). It seems that countries with a higher income level have higher percentage of
matched signs (high-income non-OECD and high-income OECD countries with 75% and
60% of sign matches respectively). On the other hand, lower-middle income and low-
income countries had a percentage of matched signs below 50%. The fact that the missing
values were imputed by using data from other periods should be taken as a limitation of
research so the results where the R&D variable was included in the analysis should be
carefully discussed. Further research should be made by using this new approach.
Improvement could be made by including productivity differences among countries by
calculating the effective factor endowments.
REFERENCES
Artal-Tur, A., Castillo‐Giménez, J., Requena‐Silvente, R., & Llano‐Verduras, C. (2008). Extending the
Heckscher‐Ohlin‐Vanek model in a regional setting: the role of intermediates, technological differences and space. http://www.etsg.org/ETSG2009/papers/artal.pdf
Bowen, H. P., Leamer, E. E., & Svikauskas, L. (1987). Multi-country, Multi-factor Tests of the Factor Abundance Theory. The American Economic Review, 77(5), 791-809.
Chakrabarti, A. (2005). The Heckscher-Ohlin-Vanek Theorem and International Factor Price Differences. Open
economies review, 16, 407–412. Choi, E. K. (2004). The Hescher-Ohlin-Vanek Theorem without Factor Price Equalization. Draft (April 19, 2004).
https://pdfs.semanticscholar.org/325c/ad4db297024a046b5b22bd2d93f1e9db4658.pdf
Davis, D. R., Weinstein, D. E., Bradford, S. C., & Shimpo, K. (1997). Using International and Japanese Regional Data to Determine When the Factor Abundance Theory of Trade Works. The American Economic Review,
87, 421-446.
Davis, D., & Weinsten, D. (2001). The factor content of trade, Working Paper 8637. http://www.columbia.edu/ ~dew35/PDF/Hdbk_Empir.pdf
Erlat, G., & Erlat, H. (2003). Measuring Intra-Industry and Marginal Intra-Industry Trade: The Case for Turkey.
Emerging Markets Finance and Trade, 39(6), 5-38. Feenstra, R. C. (2003). Advanced international trade: Theory and Evidence. Princeton, NJ: Princeton University Press.
Testing Heckscher-Ohlin-Vanek theorem by Using Normalized Trade Balance Approach 15
Heckscher, E. F. (1919). The effect of foreign trade on the distribution of income. Ekonomisk Tidskrift, 21, 497-512. Reprinted in Ellis, H.S. & L.A. Metzler, (eds.), Readings in the Theory of International Trade. London:
Allen and Undwin.
Jošić, H. (2016). Testing the factor proportions model for Croatia. Ekonomski vjesnik/EconViews, 2017(2), 353-370. Kim, U. Y. (1991). Heckscher-Ohlin-Vanek theory and empirical study. The Korean Economic Review, 7(2), 173-189.
Leontief, W. (1953). Domestic Production and Foreign Trade: The American Capital Position Re-Examined.
Proceedings of the American Philosophical Society, 97, 332-349. Lu, M., Milner, C., & Yu, Z. (2009). Testing the H-O-V Model in Bilateral Trade with Allowance for Technology
Differences. European Trade Study Group (ETSG) Annual Conference at the University of Rome “Tor
Vergata” (September 10-12, 2009).
Maskus, K. E., & Nishioka, S. (2006). Development-Related Biases in Factor Productivities and the HOV Model
of Trade. Discussion papers in economics, Working Paper No. 06-08.
Maskus, K., E., & Webster, A. (1999). Estimating the HOV Model with Technology Differences Using Disaggregated Labor Skills for the United States and the United Kingdom. Review of International
Economics, 7(1), 8-19.
Nishioka, S. (2005). An Explanation of OECD Factor Trade with Knowledge Capital and the HOV Model. Discussion papers in economics, Working Paper No. 05-06. https://www.colorado.edu/economics/sites/default/files/attached-
files/wp05-06.pdf
Ohlin, B. (1924). The Theory of Trade. Translated and reprinted in Flam, H., & Flanders, M. J. (editors and translators), Heckscher-Ohlin Trade Theory. Cambridge: MIT Press.
Requena, F., Castillo, J., & Artal, A. (2005). Multiregion, multifactor tests of the Heckscher-Ohlin-Vanek using
Spanish regional data. XXX Simposio Análisis Económico. Murcia: Servicio de Publicaciones de la Universidad de Murcia, 15-17 Septembre 2005.
Romalis, J. (2004). Factor proportions and the structure of commodity trade. American Economic Review, 94, 67-97.
Srivastava, A. (2012). Heckscher Ohlin Vanek Theorem: an excess supply approach, Munich Personal RePEc Archive. https://ideas.repec.org/p/pra/mprapa/38279.html
Srivastava, A., & Mathur, S. K. (2014). Validity of Heckscher-Ohlin-Vanek Hypothesis - A Complete and Partial
Test Approach. Korea and the World Economy, 15(3), 355-393. Trade Map (2019). List of products imported and exported by certain country. https://www.trademap.org/Product_
SelCountry_TS.aspx
Trefler, D. (1995). The Case of the Missing Trade and Other Mysteries. American Economic Review, 1029-1046. Vanek, J. (1968). The factor proportions theory: The N-factor case. Kyklos, 2, 749-754.
World Bank (2018). The Changing Wealth of Nations 2018: Country Tool. https://development-data-hub-s3-
official.s3.amazonaws.com/ddhfiles/94641/cwon2018-country-tool-v1.0_0.xlsx World Bank (2019a). Capture fisheries production (metric tons). https://data.worldbank.org/indicator/ER.FSH.
CAPT.MT
World Bank (2019b). GDP (current US$). https://data.worldbank.org/indicator/NY.GDP.MKTP.CD World Bank (2019c). Labor force, total. https://data.worldbank.org/indicator/SL.TLF.TOTL.IN
World Bank (2019d). Researchers in R&D (per million people). https://data.worldbank.org/indicator/ SP.POP.SCIE.RD.P6
Wu, T., Tomassin, P. J., & Mukhopadhyay, K. (2017). Using H-O-V Theorem to Predict the Factor Intensities in
Canadian Agricultural Trade. International Journal of Applied Economics, 14(1), 45-64. Zimring, A. (2015). Testing the Heckscher-Ohlin-Vanek Theory with a Natural Experiment. Canadian Journal
of Economics, 52(1), 58-92.
TESTIRANJE HECKSCHER-OHLIN-VANEKOVOG TEOREMA
KORIŠĆENJEM PRISTUPA NORMALIZOVANOG
TRGOVINSKOG BILANSA
Studija opisana ovde uvodi pristup normalizovanog trgovinskog bilansa za testiranje Heckscher-
Ohlin-Vanekovog (HOV) teorema. Namera je bila da se sve zemlje širom sveta uključe u analizu, ali je
zbog nedostatka podataka određeni broj zemalja morao da bude isključen iz analize. Zbog toga je
ukupno 111 zemalja primećeno prema regionu i nivou prihoda u 2014. Pri proceni HOV modela koristio
se test predznaka. Test je uporedio očekivani znak normalizovanog trgovinskog bilansa ili neto izvoza
prema klasifikaciji proizvoda SITC 2 sa relativnom zadužbinom proizvodnih faktora koji se intenzivno

16 B. ŽMUK, H. JOŠIĆ
koriste u proizvodnji određenog proizvoda. Proizvodni faktori su podeljeni na grupe kao što su
proizvedeni kapital, radna snaga i prirodni resursi koji su dodatno podeljeni na šume, metale i minerale,
naftu, ugalj i gas, pašnjake i useve. Varijabla istraživači u R&D na milion ljudi predstavlja uticaj
tehnoloških razlika širom zemalja. Rezultat testa predznaka je pokazao da HOV teorem drži u 55 odsto
slučajeva. Procenat podudarnih predznakova je najveći za zemlje sa visokim prihodima koje nisu
članice OECD-a (75%) i najniži za zemlje sa nižim srednjim prihodima i niskim prihodima (ispod 50%).
Ključne reči: Heckscher-Ohlin-Vanekov model, test predznaka, pristup normalizovanog trgovinskog
bilansa, svet
Top Related