


Languages
Pages
Legal


Team 4: 18-749: Fault-Tolerant Distributed Systems
Bryan MurawskiMeg Hyland
Jon GrayJoseph Trapasso
Prameet ShahMichael Mishkin

‹#›
Team Members
http://www.ece.cmu.edu/~ece749/teams-06/team4/
BrYan [email protected]
Prameet [email protected]
Michael [email protected]
Jonathan [email protected]

‹#›
Baseline Application System Description
– EJBay is a distributed auctioning system that allows users to buy and sell items in an auction plaza Baseline Applications
– A user can create, login, update, logout, view other users’ account information.– A user can post, view, search, post a bid, view bid history of auctions.– Application Exceptions: DuplicateAccount, InvalidAuction, InvalidBid, InvalidUserInfo,
InvalidUserPass, UserNotLoggedIn Why is it Interesting?
– A service used by many commercial vendors. Configuration
– Operating System• Server & Client: Linux
– Language• Java SDK 1.4.2
– Middleware• Enterprise Java Beans
– Third-party Software• Database: MySQL• Application Server: JBoss• IDE: XEmacs, Netbeans
‹#›
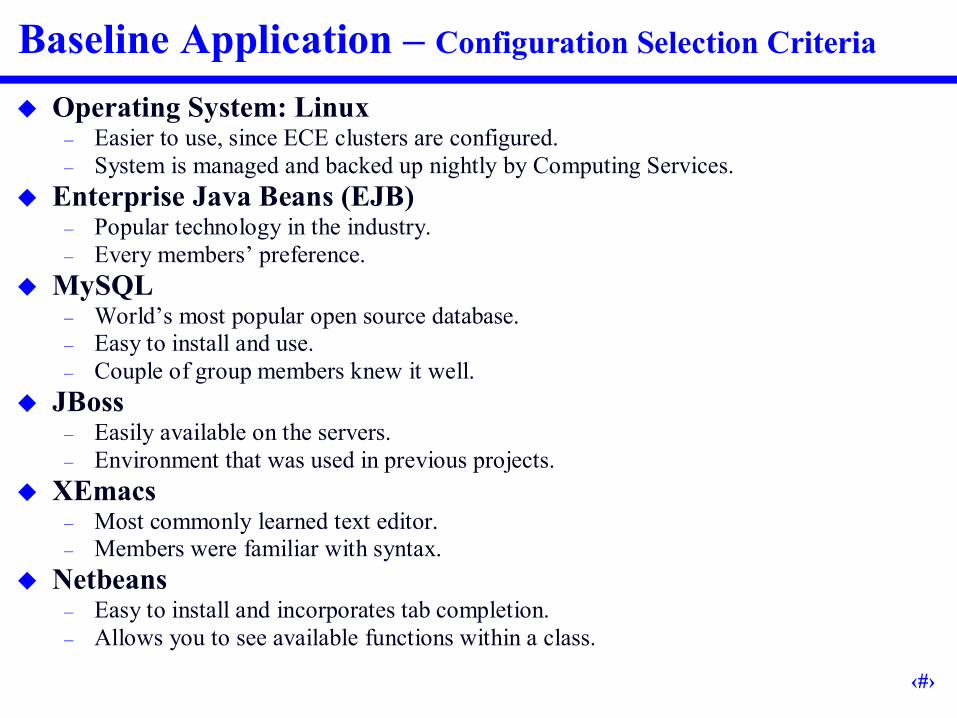
Baseline Application –Configuration Selection Criteria
Operating System: Linux– Easier to use, since ECE clusters are configured.– System is managed and backed up nightly by Computing Services.
Enterprise Java Beans (EJB)– Popular technology in the industry.– Every members’ preference.
MySQL– World’s most popular open source database.– Easy to install and use.– Couple of group members knew it well.
JBoss– Easily available on the servers.– Environment that was used in previous projects.
XEmacs– Most commonly learned text editor.– Members were familiar with syntax.
Netbeans– Easy to install and incorporates tab completion.– Allows you to see available functions within a class.
‹#›
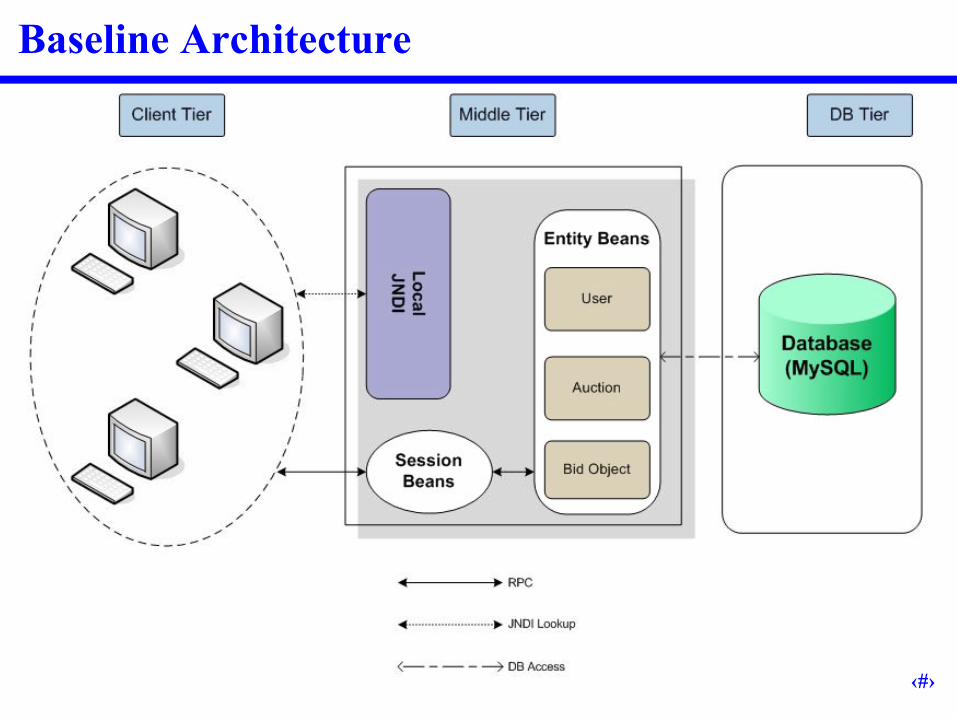
Baseline Architecture

‹#›
Experimental Evaluation –Architecture Unmodified Server Application New Automated Client
– Experimental variables taken as command-line inputs– Performs specified number of invocations and dies
Central Library of MATLAB scripts– One script to read in data from all probes– Others scripts each responsible for a specific graph

‹#›
Experimental Evaluation –Results Expected results
– Increasing clients yield increasing latency– Most time spent in Middleware– “Magical 1%”– Slightly longer latencies in non-standard reply size cases
Actual results– Memory / Heap problems– Java optimizations changing behavior of code•Shorter latency in non-standard reply size cases
– Database INSERTs take much longer than SELECTs– Only exhibited “Magical 1%” to some extent– Very high variability and some unusual/unexpected results•During test runs close to deadline; very high server/database loads
‹#›
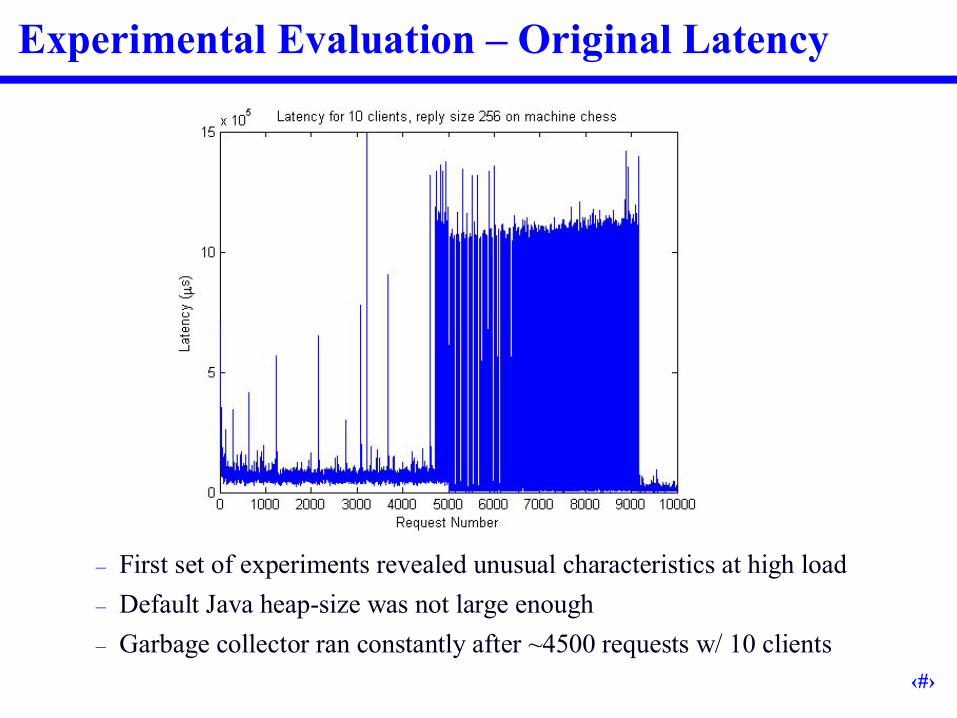
Experimental Evaluation –Original Latency
–First set of experiments revealed unusual characteristics at high load–Default Java heap-size was not large enough–Garbage collector ran constantly after ~4500 requests w/ 10 clients

‹#›
Experimental Evaluation –Improved Latency
– Increased heap from default to 300MB

‹#›
Experimental Evaluation –Improved Latency
–Mean and 99% Latency area graph only loosely exhibited the“Magic 1%”behavior

‹#›
Fault-Tolerance Framework Replicate servers
– Passive replication– Stateless servers– Allow for up to 14 replicas
•One for each machine in the Games cluster (minus ASL and Mahjongg)
Sacred Machines– Clients– Replication Manager– Naming Service– Fault Injector– Database
Elements of Fault-tolerance Framework– Replication Manager
•Heartbeat•Fault detector•Automatic recovery (maintenance of number of replicas)
– Fault Injector

‹#›
FT-Baseline Architecture

‹#›
Replication Manager Responsible for launching and maintaining servers Heartbeats replicas periodically
– 500ms period Differentiates between crash faults and process faults
– Crash fault: Server is removed from the active list– Process fault: Process is killed and restarted
Catches port binding exceptions– A server is already running on the current machine remove from active list
Maintains global JNDI– Updating server references for clients– Indicates which server is primary/secondary– Keeps a count of the number of times any primary has failed
Advanced Features– Allows the user to see the current status of all replicas– Allows the user to see the bindings in the JNDI

‹#›
Fault Injector 2 Modes Manual Fault Injection
– Runs a “kill -9” on a user specified server Periodic Fault Injection
– Prompts user to set up a kill timer•Base period•Max jitter about the base period•Option to only kill primary replica, or a random replica
‹#›
Mechanisms for Fail-Over Replication Manager detected fail-over
– Detects that a heartbeat thread failed– Kills the associated server– Checks cause of death– Launches new replica– If no active servers are free, the replication manager will print a message, kill
all servers and exit Client detected fail-over
– Receives a RemoteException– Queries naming service for a new primary•Previously accessed JNDI directly
– Required a pause for JNDI to be corrected•Sometimes this resulted in multiple failover attempts
– When JNDI was not ready after predetermined wait time

‹#›
Round Trip Client Latency w/Faults
Average Latency for all Invocations –12.922 ms
‹#›
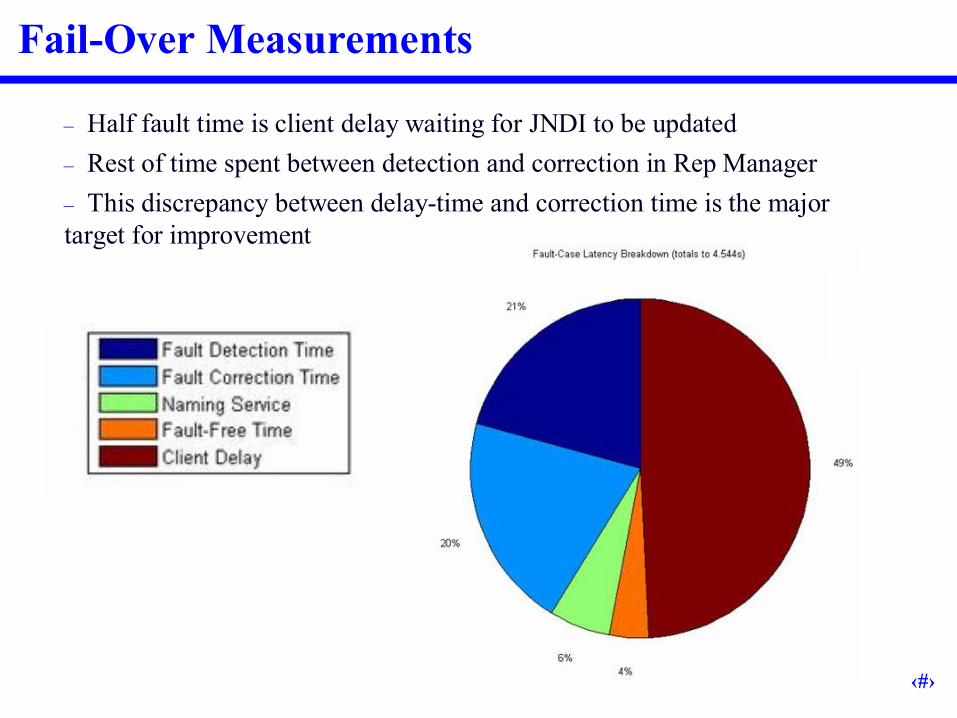
Fail-Over Measurements
–Half fault time is client delay waiting for JNDI to be updated–Rest of time spent between detection and correction in Rep Manager–This discrepancy between delay-time and correction time is the major target for improvement

‹#›
RT-FT-Baseline Architecture Improvements Target fault-detection and correction time in Replication Manager
– Tweaking heartbeat frequency and heartbeat monitor frequency– Improvements in interactions with JNDI•Additional parameters to specify primary server•Update JNDI by modifying entries rather than rebuilding each time
Target fail-over time in client– Client pre-establishes connections to all active servers– Background thread queries JNDI and maintains updated list– On fail-over, client immediately fails-over to next active server•No delay waiting for Replication Manager to update JNDI•Background thread will synchronize client’s server list once it has been updated by
the Replication Manager

‹#›
RT-FT-Baseline Architecture

‹#›
RT-FT- Post-Improvement Performance
Old 1 Client Measurements
Avg. Latency for all Invocations: 12.922ms
Avg. Latency during a Fault: 4544ms
New 1 Client Measurements
Avg. Latency for all Invocations: 16.421ms
Avg. Latency during a Fault: 806.96ms (82.2% Improvement)
‹#›
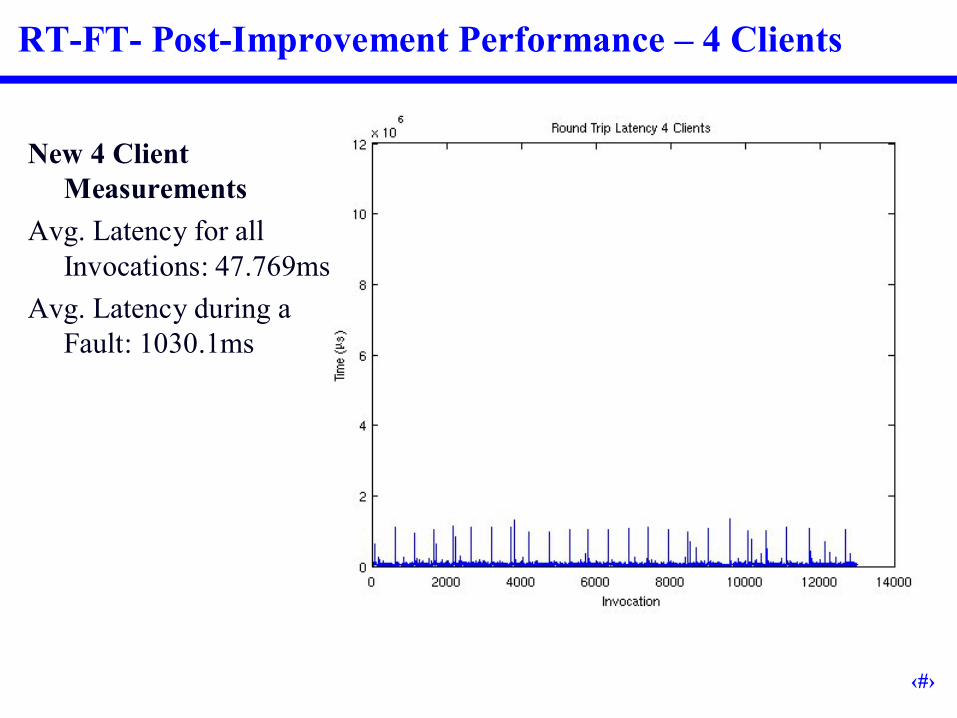
RT-FT- Post-Improvement Performance –4 Clients
New 4 Client Measurements
Avg. Latency for all Invocations: 47.769ms
Avg. Latency during a Fault: 1030.1ms

‹#›
RT-FT- Post-Improvement Performance
More even distribution of time Client reconnect time still dominates, but is a much smaller number
‹#›
Special Features Experimental Evaluation
– Utilized JNI for microsecond precision timers– Maintained a central library of MATLAB processing scripts– Perl and shell scripts to automate entire process
Fault-Tolerant Baseline– Powerful Replication Manager that starts, restarts, and kills servers– Integrated command-line interface for additional automation– Fault-Injector with dual-modes
Fault-Case Performance– New client functionality to pre-establish all connections– Contents of JNDI directly correlated to actual status of servers•Online, offline, booting

‹#›
Open Issues Problems launching multiple servers concurrently from Rep Manager
– Many attempts to address/debug this issue with only some success– If multiple faults occur within short period of time, some servers may die
unexpectedly
Improved Client Interface– GUI or Web-Based
Additional Application Features– Allow deletion of accounts, auctions, and bids– Security!– Improved search functionality

‹#›
Conclusions What we have learned
– Stateless middle tier requires less overhead– XML has poor documentation. XDoclet would have been a good tool to use.– Running experiments takes an extremely long time. Automating test scripts
increases throughput.
What we accomplished– A robust fault-tolerant system with a fully automated Replication Manager– Fully automated testing and evaluation platform
What we would do differently– Spending more time with XDoclet to reduce debugging– Use one session bean instead of separating functionality into two
Top Related